Embed Size (px)
Citation preview
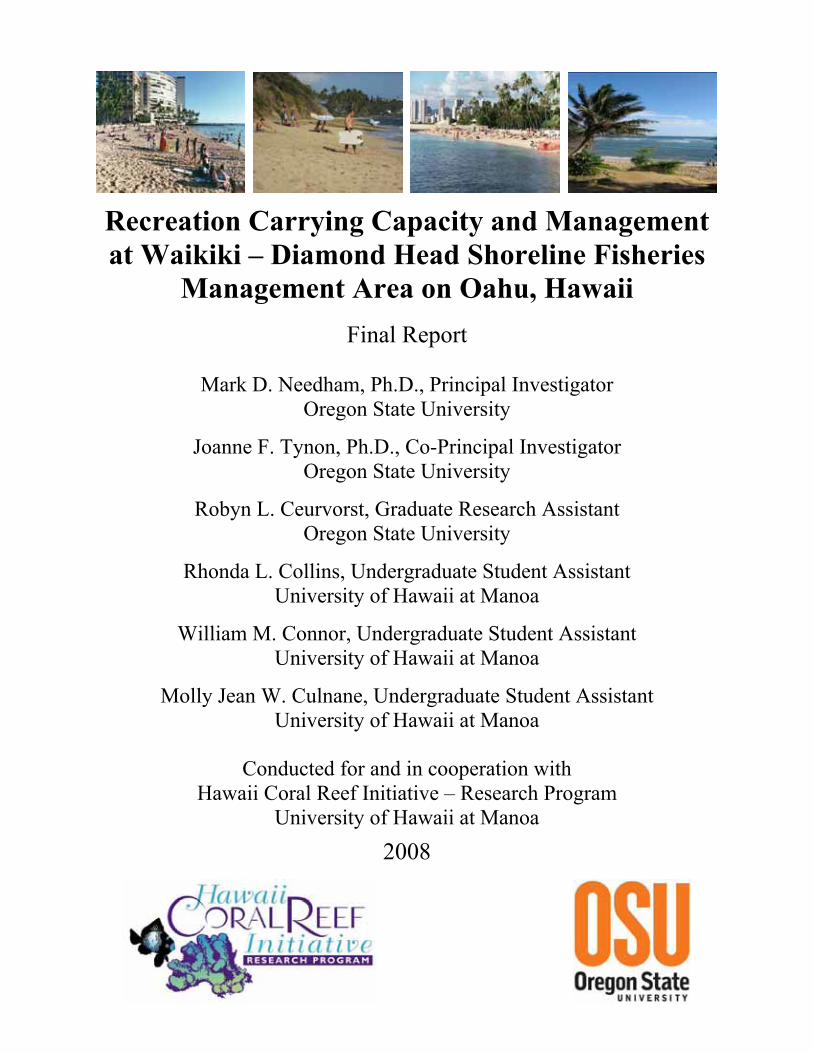
Recreation Carrying Capacity and Management at Waikiki – Diamond Head Shoreline Fisheries
Management Area on Oahu, Hawaii Final Report
Mark D. Needham, Ph.D., Principal Investigator Oregon State University
Joanne F. Tynon, Ph.D., Co-Principal Investigator Oregon State University
Robyn L. Ceurvorst, Graduate Research Assistant Oregon State University
Rhonda L. Collins, Undergraduate Student Assistant University of Hawaii at Manoa
William M. Connor, Undergraduate Student Assistant University of Hawaii at Manoa
Molly Jean W. Culnane, Undergraduate Student Assistant University of Hawaii at Manoa
Conducted for and in cooperation with Hawaii Coral Reef Initiative – Research Program
University of Hawaii at Manoa
2008
Recreation Carrying Capacity and Management at Waikiki – Diamond Head Shoreline FMA
i
ACKNOWLEDGEMENTS
The authors would like to thank Michael Hamnett, Kristine Davidson, Risa Minato, and Pamela Fujii at Hawaii Coral Reef Initiative; and Athline Clark, Carlie Wiener, Emma Anders, and Petra MacGowan at Hawaii Division of Aquatic Resources for their unwavering assistance, input, and support during this project. Members of the Hawaii Coral Reef Initiative Management Committee and the Hawaii Recreation Impacts to Reefs Local Action Strategy Committee (RIR-LAS) are also thanked for their support of this project. Sherwood Maynard, Jeff Kuwabara, and Shawn Date at the University of Hawaii Marine Option Program are thanked for their assistance with project facilitation and data collection. Holly Needham at Oregon State University is also thanked for assistance with data collection. A special thank you is extended to all of the recreationists who took time to complete surveys.
Funding for this project was provided by Hawaii Coral Reef Initiative – Research Project and Hawaii Division of Aquatic Resources. This project was approved by the Institutional Review Board (IRB), Office of Sponsored Programs and Research Compliance, Oregon State University (protocol: #3562) and complied with regulations on research involving human subjects.
Although several people assisted with this project, any errors, omissions, or typographical inconsistencies in this final project report are the sole responsibility of the first author. All text, tables, figures, results, conclusions, and recommendations in this final project report were written by the first author and represent views of the first author based on the data and do not necessarily represent views of the funding agencies, other coauthors, or others who assisted with this project.
SUGGESTED CITATION
Needham, M. D., Tynon, J. F., Ceurvorst, R. L., Collins, R. L., Connor, W. M., & Culnane, M. J. W. (2008). Recreation carrying capacity and management at Waikiki – Diamond Head Shoreline Fisheries Management Area on Oahu, Hawaii. Final project report for Hawaii Coral Reef Initiative – Research Program. Corvallis: Oregon State University, Department of Forest Ecosystems and Society. 95pp.
Recreation Carrying Capacity and Management at Waikiki – Diamond Head Shoreline FMA
ii
ABSTRACT
As popularity of Hawaii’s beaches and reefs increases, there is a need to measure and monitor recreation carrying capacity indicators to ensure that coastal resources and user experiences do not deteriorate. Objectives of this project were to measure: (a) social and facility indicators of recreation carrying capacity (e.g., crowding, encounters) to reveal thresholds when impacts become unacceptable; (b) support and opposition of management strategies for minimizing impacts (e.g., educate, limit use) and how situational factors (e.g., reef damage, use levels) differentially influence support; and (c) the extent of conflict among activity groups. Other concepts examined included recreationists' satisfaction with conditions, value orientations toward reefs, future use pattern changes (e.g., displacement), and demographic characteristics. Data were obtained from surveys of users (n = 925) at two sites in Waikiki-Diamond Head Shoreline FMA (Sans Souci / Kaimana Beach, Diamond Head / Kuilei Cliffs Beaches). Results showed that user demographics and activities differed between sites, but most users at each site had protectionist (i.e., biocentric, nature-centered) value orientations toward reefs. Overall satisfaction was extremely high at each site and despite moderate encounters and crowding at each site, most users encountered fewer people than their maximum tolerance, which was approximately 217 people at one time at Sans Souci / Kaimana and 118 people at one time at Diamond Head / Kuilei Cliffs. At some sites, there were not enough of some facilities (e.g., bathrooms at Diamond Head / Kuilei Cliffs) to accommodate current use and demand, suggesting that some facility capacity indicators had reached their thresholds. More education and interpretation was the most strongly supported management strategy at each site. When rating acceptance of user education, the most important factor was recreation damage to reefs. In rating acceptance of limiting use, the most important factor was use level. When rating acceptance of improving site maintenance and providing more facilities, the most important factor was condition of facilities. There was minimal conflict at Sans Souci / Kaimana Beach, but there was moderate conflict with surfers, windsurfers, and kitesurfers at Diamond Head / Kuilei Cliffs. Most users also observed people handling or standing on coral and believed that this behavior was a problem at each site. Recommendations for management are discussed.
Recreation Carrying Capacity and Management at Waikiki – Diamond Head Shoreline FMA
iii
EXECUTIVE SUMMARY
Objectives
Hawaii hosts approximately seven million visitors each year who spend more than US $11 billion in the state, and in the last 20 years tourism has increased over 65%. More than 80% of Hawaii’s visitors engage in recreation activities in the state’s coastal and marine areas with the majority of these individuals participating in snorkeling or diving. Other popular coastal recreation activities include ocean kayaking, swimming, sunbathing, beach walking, and surfing. Beaches and reefs are also important resources for local residents. For example, approximately 30% of households in Hawaii have at least one person who fishes for recreation.
As popularity of Hawaii’s coastal areas continues to increase, demand for access and use can disrupt coastal processes, damage ecological integrity of sensitive environments, reduce the quality of user experiences, and generate conflict among stakeholders regarding appropriate management responses. As a result, agencies are faced with challenges that include estimating use thresholds (i.e., carrying capacities) and how to manage and monitor use levels to ensure that thresholds are not violated and user experiences are not compromised by such things as crowding and conflict. The purpose of this project, therefore, was to examine carrying capacity, conflict, and management related to recreation use at Waikiki-Diamond Head Shoreline Fisheries Management Area (FMA) on the south coast of Oahu, Hawaii. Project objectives were to:
• Use social science approaches to measure, determine, and inform social and facility indicators of recreation carrying capacities, and determine thresholds when perceived impacts for these indicators reach unacceptable levels.
• Estimate the extent to which indicators of recreation carrying capacities are currently being exceeded and if this is impacting user experiences.
• Measure support and opposition toward management strategies for minimizing coastal recreation impacts (e.g., educate, limit use) and how situational factors (e.g., reef damage, use levels, litter) differentially influence support of these strategies.
• Determine the extent to which user conflicts exist both within and among various recreation activity groups.
• Compare the extent to which evaluations of coastal recreation impacts differ among groups (e.g., visitors versus locals, various tourism / recreation activity groups) and sites.
Other concepts examined in this project included recreationists' satisfaction with current conditions, perceptions of crowding, value orientations toward coastal environments, likelihood of future use and changes in use patterns (e.g., temporal and spatial displacement), and sociodemographic characteristics.
Data Collection
Data were obtained from surveys administered onsite to recreationists at two sites in Waikiki-Diamond Head Shoreline FMA: (a) Sans Souci / Kaimana Beach, and (b) Diamond Head / Kuilei Cliffs Beaches. Individuals at these sites during July and August 2007 were approached in
Recreation Carrying Capacity and Management at Waikiki – Diamond Head Shoreline FMA
iv
parking areas and on the beach / shore, and asked to complete a survey onsite. To increase the probability of achieving a representative sample of summer users, sampling at the sites was alternated so that surveys were administered at each site at least once for each day of the week and at least once for each of three time periods each day (8:00 to 10:30 a.m., 11:30 a.m. to 2:00 p.m., 3:00 to 5:30 p.m.). Individuals were selected through a systematic random sampling procedure (i.e., one random person selected from every nth selected group). In total, 925 surveys were completed by users (response rate = 84%; Sans Souci / Kaimana n = 585, Diamond Head / Kuilei Cliffs n = 340). This sample size allows generalizations about the population of summer users at the 95% confidence level with a margin of error of ± 3.2%.
Results Summary
Personal and Trip Characteristics
• The most popular summer activity groups at Waikiki – Diamond Head Shoreline FMA were swimmers / waders and sunbathers (33%). Surfers were the third most popular activity group (21%). Swimmers / waders and sunbathers were the most common summer activity groups at Sans Souci / Kaimana Beach (48% and 40%, respectively), whereas surfers were the most common at Diamond Head / Kuilei Cliffs Beaches (51%).
• Almost all (95%) respondents were visiting on their own without being a member of an organized or guided tour (e.g., surfing lessons / tour).
• In total, 87% of respondents had previously visited Waikiki – Diamond Head Shoreline FMA before; the remaining 13% of respondents were visiting the area for the first time. Almost all respondents at Sans Souci / Kaimana Beach (88%) and Diamond Head / Kuilei Cliffs Beaches (85%) were repeat visitors.
• The largest percentage of users at Waikiki – Diamond Head Shoreline FMA were classified as having a strong protectionist value orientation toward coral reef areas (47%) followed by those with a moderate protection orientation (35%). The fewest users had a mixed protection – use orientation toward reef areas (19%). Respondents at Sans Souci / Kaimana Beach held stronger protectionist orientations toward reef areas (51%) than those at Diamond Head / Kuilei Cliffs Beaches (39%).
• In total, 52% of respondents at Waikiki – Diamond Head Shoreline FMA were male and 48% were female. The majority of users (58%) at Sans Souci / Kaimana Beach were female, whereas 68% of recreationists at Diamond Head / Kuilei Cliffs Beaches were male. At Sans Souci / Kaimana Beach, females were more likely to hold a stronger protectionist value orientation toward coral reef areas, whereas males were more likely to hold a mixed protection – use orientation. At Diamond Head / Kuilei Cliffs, the strong protection group also had a higher percentage of females (36%) compared to the mixed protection – use group (27%). Swimmers and sunbathers at the sites were slightly more likely to be female, whereas surfers were more likely to be male.
• The majority of respondents were younger than 40 years old, with the largest proportion between 20 and 29 years old (31%). The average (i.e., mean) age of users was 37 years old. Users at Sans Souci / Kaimana Beach were significantly older (mean age = 38.7 years) than those at Diamond Head / Kuilei Cliffs (34.1 years). Respondents at Sans
Recreation Carrying Capacity and Management at Waikiki – Diamond Head Shoreline FMA
v
Souci / Kaimana Beach who were classified as having a mixed protection – use orientation toward reef areas were slightly younger (mean age = 36.4 years) than those in the moderate protection and strong protection groups (37.8 and 39.5 years, respectively). There was no relationship between value orientations and age at Diamond Head / Kuilei Cliffs. Some activity groups (e.g., beach walkers) tended to be slightly older than those participating in other activities, whereas some groups were younger (e.g., surfers).
• Almost all respondents resided in the United States (92%) with the largest proportion living in Hawaii (78%) or California (9%). These results did not differ between the two sites (i.e., Sans Souci / Kaimana, Diamond Head / Kuilei Cliffs). Residents of Hawaii were more likely than nonresidents to have previously visited each site, were slightly more likely to participate in activities such as surfing, and were less likely to participate in activities such as sunbathing and beach walking at the sites.
Satisfaction with and Importance of Conditions and Experiences
• Overall satisfaction of summer users at Waikiki – Diamond Head Shoreline FMA was extremely high, as 92% were satisfied with their visit and almost no respondents (4%) were dissatisfied. Respondents at Diamond Head / Kuilei Cliffs were slightly less satisfied (89% satisfied) than users at Sans Souci / Kaimana (93%), but satisfaction was high at both sites and this difference between sites was not substantial.
• The majority of respondents were satisfied with most aspects of their experience and the conditions at Sans Souci / Kaimana Beach, especially not having to pay a fee to visit (95%) and with the presence of lifeguards at the beach (87%). Over 70% of respondents were also satisfied with the trash cans, absence of litter, and clean ocean water at this site. Respondents were most dissatisfied with the bathrooms and availability of parking at Sans Souci / Kaimana Beach (25% dissatisfied).
• At Diamond Head / Kuilei Cliffs, users were most satisfied with not having to pay a fee (82% satisfied) and the clean ocean water (81%). In addition, over 70% of respondents were satisfied with the showers and opportunities to escape crowds of people. Users were most dissatisfied with the lack of bathrooms at this site (44% dissatisfied).
• Respondents were more satisfied with trash cans, park benches, bathrooms, lifeguard presence, absence of litter, and not having to pay a fee at Sans Souci / Kaimana Beach. Respondents were more satisfied with the showers, parking availability, health of reefs, clean water, and opportunity to see marine life at Diamond Head / Kuilei Cliffs.
• The majority of respondents at Sans Souci / Kaimana rated almost all aspects of their experience and the conditions at this site as important, especially clean ocean water, absence of litter, no fees, and healthy coral reefs (over 90% of users rated as important). The least important characteristic at this site was picnic tables (23% unimportant).
• Users at Diamond Head / Kuilei Cliffs Beaches rated most aspects of their experience and the conditions at this site as important, especially clean ocean water, no litter, and healthy reefs (over 90% of users rated as important). Least important characteristics at this site were lifeguards (42% unimportant), park benches (52%), and picnic tables (54%).
• Respondents considered bathrooms, tables, benches, signs, lifeguards, and not paying fees to be more important at Sans Souci / Kaimana than at Diamond Head / Kuilei Cliffs.
Recreation Carrying Capacity and Management at Waikiki – Diamond Head Shoreline FMA
vi
• Users rated, on average, all aspects of their experience and the conditions at Sans Souci / Kaimana Beach as important and were satisfied with all of these aspects, suggesting that managers should “keep up the good work” in their management of this site.
• At Diamond Head / Kuilei Cliffs, respondents rated most experiences and conditions as important and were satisfied with most characteristics, suggesting that managers should “keep up the good work” in their management of most characteristics at this site. Users at this site, however, rated bathrooms as important, but were dissatisfied with bathrooms (or lack thereof) at this site, suggesting that managers need to concentrate on this issue at Diamond Head / Kuilei Cliffs.
Social Carrying Capacity Indicators
• Respondents at Sans Souci / Kaimana Beach encountered, on average, 78 to 112 other users at this site. At Diamond Head / Kuilei Cliffs Beaches, respondents encountered an average of 37 to 50 other users.
• Respondents would accept encountering, on average, a maximum of approximately 217 other people at Sans Souci / Kaimana Beach and 118 other people at Diamond Head / Kuilei Cliffs Beaches. When results are extrapolated to a landscape level and aggregated across the entire site, social carrying capacity indicator standards of quality are approximately 140 people at Sans Souci / Kaimana Beach and 111 people at Diamond Head / Kuilei Cliffs Beaches.
• Users at each site with a strong protectionist value orientation toward nearshore reef areas rated relatively low use levels as more acceptable and higher use levels as less acceptable than respondents with a mixed protection – use value orientation.
• In total, 44% of respondents felt crowded by the number of people encountered at Waikiki – Diamond Head Shoreline FMA in the summer. Total perceived crowding was higher at Sans Souci / Kaimana Beach (47% crowded) than Diamond Head / Kuilei Cliffs Beaches (39%). Both sites had "low normal" crowding, suggesting that a problem situation related to social issues such as crowding does not exist at these sites at this time.
• At Sans Souci / Kaimana Beach, respondents felt most crowded by the number of sunbathers and swimmers encountered at this site (39%). At Diamond Head / Kuilei Cliffs Beaches, respondents felt most crowded by the number of surfers (56%) and windsurfers / kitesurfers (34%) encountered.
• At Sans Souci / Kaimana Beach, residents of Hawaii felt significantly more crowded by sunbathers and swimmers (residents = 44%, nonresidents = 29%). At Diamond Head / Kuilei Cliffs, residents of Hawaii felt significantly more crowded by both surfers (residents = 63%, nonresidents = 41%) and windsurfers / kitesurfers (residents = 39%, nonresidents = 20%). At both sites, residents of Hawaii felt significantly more crowded by the total number of people encountered (Sans Souci Kaimana: residents = 54%, nonresidents = 30%; Diamond Head / Kuilei: residents = 45%, nonresidents = 22%).
• At both Sans Souci / Kaimana Beach and Diamond Head / Kuilei Cliffs Beaches, the majority of respondents reported encountering fewer people than the maximum number of people they would accept seeing at each site. Approximately one-third of respondents at Sans Souci / Kaimana Beach, however, encountered more than their maximum
Recreation Carrying Capacity and Management at Waikiki – Diamond Head Shoreline FMA
vii
tolerance limit and this site also had the highest amount of perceived crowding, suggesting that research and management attention may be needed to determine if use is expected to increase in the future, allowing management to anticipate any potential problems. Perceived crowding was highest for respondents who reported more encounters than their maximum tolerance level.
• Over 61% of respondents felt that the number of other people they encountered had no effect on their enjoyment. At both sites, however, respondents who encountered more people than they believed was acceptable for each site were more likely to say that the number of people they encountered reduced their enjoyment, but the largest percentage of these users at each site still felt that this number of encounters had no effect on their enjoyment (49% to 59%). This suggests that although crowding and use levels are important social issues at these sites, high use levels may not substantially distract from users' experiences at these sites; some users may feel crowded and encounter more people than they feel is acceptable, but this may not substantially alter their enjoyment.
Facility Carrying Capacity Indicators
• On average, respondents typically saw fewer bathrooms, showers, trash cans, picnic tables, park benches, and information signs than what is actually present at each site. In addition, they believed that there should still be more of each facility than what they saw. When comparing the actual number of each facility to how many respondents think should be at the site, however, it is evident that there are enough trash cans, tables, and benches at Sans Souci / Kaimana Beach; and trash cans and signs at Diamond Head / Kuilei Cliffs Beaches. According to users, there are not enough bathrooms, showers, and signs at Sans Souci / Kaimana Beach; and bathrooms, showers, tables, and benches at Diamond Head / Kuilei Cliffs.
• At both sites, the majority of respondents reported encountering fewer of each facility than what they feel should be at the site (i.e., their norm). Satisfaction scores for these facilities at both sites were lower for users reporting fewer of each facility than what they feel should be at the site (i.e., their norm). These findings suggest that users want more of each facility at each site and this would increase satisfaction with facilities.
• When users' norms are compared to the actual number of facilities at each site, there are actually enough of many facilities at each site (i.e., there was actually the same number or more of many facilities at each site than what users felt should be at each site). This finding suggests that: (a) users at each site underestimate the number of many facilities at each site by reporting fewer encounters with facilities than what is actually present at each site, and (b) there are enough of many types of facilities at each site to meet or exceed users' expectations and needs. At Diamond Head / Kuilei Cliffs Beaches, however, there were actually fewer bathrooms, picnic tables, and park benches (there are none of each of these facilities) than what summer users feel should be at this site.
Recreation Conflict and Coping Behavior
• The most commonly reported conflict events observed at Waikiki – Diamond Head Shoreline FMA were sunbathers and swimmers not looking where they were going (47%) and being too close (43%). One third of respondents also reported observing surfers not
Recreation Carrying Capacity and Management at Waikiki – Diamond Head Shoreline FMA
viii
looking where they were going (32%) and being too close (30%). Fewer summer users (less than 20%) reported observing conflict behaviors associated with snorkelers, divers, boaters, and anglers. Sunbathers and swimmers were observed being rude / discourteous, not looking where they were going, and being too close more often at Sans Souci / Kaimana Beach. Boaters were also observed being too close and not looking where they were going more often at Sans Souci / Kaimana Beach. Conversely, surfers, windsurfers, and kitesurfers were observed being too close, not looking where they were going, and being rude and discourteous more often and by over 40% of users at Diamond Head / Kuilei Cliffs Beaches.
• At Sans Souci / Kaimana Beach, the largest amount of conflict was with sunbathers and swimmers (31%), and boaters (23%). At Diamond Head / Kuilei Cliffs Beaches, 45% of respondents experienced conflict with surfers and 38% experienced conflict with windsurfers and kitesurfers. Few respondents (less than 19%) experienced conflict with snorkelers, divers, and anglers at each site. It is important to note, however, that this study occurred during an odd numbered year when angling was prohibited in this area so conflict with anglers may increase during years when this activity is permitted.
• Compared to nonresidents, residents of Hawaii experienced more conflict with all activity groups at both sites. For example, 38% of residents experienced conflict with sunbathers and swimmers at Sans Souci / Kaimana Beach, whereas only 19% of nonresidents experienced conflict with this activity group at this site. In addition, 54% of residents experienced conflict with surfers at Diamond Head / Kuilei Cliffs Beaches, whereas 23% of nonresidents experienced conflict with this activity group at this site.
• A large percentage of users at Sans Souci / Kaimana Beach (58%) and Diamond Head / Kuilei Cliffs Beaches (61%) observed people handling or standing on coral during their visits to the site. In addition, 75% of users think that people handling or standing on coral is a problem at Sans Souci / Kaimana Beach and 67% of users believe that these behaviors are a problem at Diamond Head / Kuilei Cliffs Beaches.
• In response to crowding and conflict, most respondents (72%) are still unlikely to change their behavior; they will come back to sites in Waikiki – Diamond Head Shoreline FMA realizing that conditions they experienced are suitable. However, 64% of respondents are likely to come back earlier or later in the day when less people may be in the area, and 61% are likely to come back, but avoid peak use times such as weekends and holidays, suggesting that many users are likely to be temporally displaced because of conditions they experienced. Only 27% of users are likely to go to other beach or marine areas on other parts of Oahu Island instead and 19% are likely to go to other nearby or adjacent beach or marine areas instead, suggesting that most users are unlikely to be spatially displaced because of conditions they experienced. Most respondents are also unlikely to experience a product shift by changing the way that they think about the area and deciding that it offers a different type of experience than they first believed (25%).
Evaluations and Tradeoffs of Potential Management Strategies
• The management strategy that received support from the most respondents at Sans Souci / Kaimana Beach and Diamond Head / Kuilei Cliffs Beaches (38% to 44%) was providing more educational and interpretive information. Users at Sans Souci / Kaimana
Recreation Carrying Capacity and Management at Waikiki – Diamond Head Shoreline FMA
ix
Beach were somewhat divided on whether there should be more enforcement of rules and regulations at this site. This strategy, however, was opposed by the majority of users at Diamond Head / Kuilei Cliffs Beaches (58% oppose). The majority of users at both sites also opposed designated parking for tour buses (66% to 74% oppose) and zoning of activities (50% to 51% oppose). Respondents were most strongly opposed to allowing commercial activities (e.g., tour operators) at each site (78% to 80% oppose).
• Respondents were presented with eight scenarios of varying use levels, impacts to coral reefs, amounts of litter, and conditions of facilities (i.e., factors), and then evaluated the acceptability of four management strategies for each scenario (improve education and awareness of users, restrict number of people [i.e., limit use], improve maintenance and upkeep, provide more facilities). Improving education and awareness was the most strongly supported management action for each scenario. Even for the scenario describing the lowest amount of negative impact for each factor, improving education and awareness was acceptable, suggesting that respondents believed that education and awareness of users at each site currently needs to be improved. If conditions deteriorate (e.g., more damage to reefs, litter), this action would be even more acceptable.
• Improving maintenance or upkeep was the second most strongly supported management action for each scenario. This strategy was acceptable even for the scenario describing the lowest amount of negative impact for each factor, suggesting that users believed that maintenance and upkeep at each site needs to be improved. If conditions worsen (e.g., more reef damage, litter), this strategy would be even more acceptable.
• The third most strongly supported management strategy for each scenario was providing more facilities and services. More facilities and services was acceptable even for the scenario describing the lowest amount of negative impact for each factor, suggesting that many current users would support more facilities and services at each site. If conditions deteriorate (e.g., more damage to reefs, litter), providing more facilities and services would be even more acceptable.
• Respondents were most strongly opposed to restricting the number of people allowed in the area. If site conditions worsen, however, restricting use would become more acceptable. If use levels are high, there is a substantial amount of litter and damage to coral reefs from recreation, and facilities are in disrepair, users would be more supportive of strategies designed to restrict the number of people allowed in the area.
• The most strongly supported strategy of improving education and awareness of people also generated the most consensus among respondents, suggesting that this would be the least controversial action. There was also strong consensus for improving maintenance and upkeep. The least acceptable strategy was restricting the number of people allowed in the area, but this was also the most controversial; it is likely that restricting the number of people allowed would generate controversy among users unless conditions deteriorated to a point where use levels were extremely high, there was substantial damage to reefs, litter was abundant, and facilities were in disrepair. Acceptance of each of the four management strategies did not substantively differ between the two sites (i.e., Sans Souci / Kaimana Beach, Diamond Head / Kuilei Cliffs Beaches) for each scenario.
Recreation Carrying Capacity and Management at Waikiki – Diamond Head Shoreline FMA
x
• Conjoint analyses showed that situational factor levels differentially affected acceptance of management strategies. The strategy "improve education and awareness of users" was rated as acceptable across all factor levels, but was most acceptable if the amount of damage to reefs was substantial. "Restricting the number of people allowed in the area" was acceptable for two factor levels, but was unacceptable if use levels were low and reef damage was minimal; if use levels were low and reef damage was minimal, this would not be a supported strategy. This strategy was most acceptable if use levels were high and the amount of damage to reefs was substantial. "Improve maintenance and upkeep" and "provide more facilities or services" were acceptable across all factor levels, but were most acceptable if facilities were in poor condition.
• When rating acceptance of "improving education and awareness of users," the most important factor was recreation damage to reefs. In rating acceptance of "restricting the number of people allowed" (i.e., limit use), the most important factors were use level and damage to coral reefs. When rating acceptance of "improving maintenance and upkeep" and "providing more facilities," the most important factor was condition of facilities.
Recommendations
• The types of people, activities in which they were participating, and their attitudes and preferences often differed between the two sites (i.e., Sans Souci / Kaimana Beach, Diamond Head / Kuilei Cliffs Beaches). This suggests the need for site-specific management of various areas within Waikiki-Diamond Head Shoreline FMA irrespective of the close proximity of some of these areas.
• Within each site, users were heterogeneous, exhibiting a range of demographic characteristics and preferences. This suggests that not all users will respond in the same manner to changes in conditions and management at each site. Despite this diversity of users, the largest proportion of respondents had previously visited each site before and were residents of Hawaii, suggesting that managers should take opinions of repeat visitors and local residents into consideration when making decisions affecting each site.
• The largest proportion of respondents had strong protectionist value orientations toward coral reef areas (i.e., biocentric, nature-centered), suggesting that recreation or other uses that have deleterious effects on coral reef ecosystems are not likely to be supported at each site. Research has shown that individuals' value orientations influence their attitudes, intentions, and behaviors, so knowing users' value orientations can be useful for estimating possible reactions to potentially controversial management actions. In addition, value orientations are stable and resistant to change, so attempts to inform and educate individuals with protectionist value orientations toward reef areas to consider adopting a favorable attitude and vote in support of actions that may be harmful to reef areas are unlikely to be successful.
• Although overall satisfaction of summer users at each site was extremely high, users were not satisfied with every aspect of the setting or their experience. At Sans Souci / Kaimana Beach, users were most dissatisfied with availability of parking and condition of bathrooms. At Diamond Head / Kuilei Cliffs Beaches, respondents were most dissatisfied with the lack of bathrooms. These issues deserve management attention.
Recreation Carrying Capacity and Management at Waikiki – Diamond Head Shoreline FMA
xi
• At Sans Souci / Kaimana Beach, respondents were most satisfied with the presence of lifeguards at the beach and that users were not required to pay a fee to visit the area. At Diamond Head / Kuilei Cliffs Beaches, users were most satisfied with the clean ocean water and that they did not have to pay a fee to visit the area These and other conditions (e.g., bathrooms and parking at Sans Souci / Kaimana Beach; signs and trash cans at Diamond Head / Kuilei Cliffs Beaches) should be maintained and monitored to ensure that user satisfaction does not decline.
• Users rated all aspects of their experience and the conditions at Sans Souci / Kaimana Beach as important and were satisfied with these aspects, suggesting that managers should "keep up the good work" in their current management of this site. At Diamond Head / Kuilei Cliffs Beaches, users also rated most aspects of their experience and the conditions as important and were satisfied with these aspects, suggesting that managers should "keep up the good work" in their management of this site. However, bathrooms were important to users at this site, but users were dissatisfied with the lack of bathrooms at this site, suggesting that managers need to concentrate on addressing the lack of bathrooms at Diamond Head / Kuilei Cliffs Beaches.
• Both Sans Souci / Kaimana Beach (47% of users felt crowded) and Diamond Head / Kuilei Cliffs Beaches (39% of users felt crowded) had "low normal" crowding, suggesting that a major problem situation with summer use crowding does not exist at these two sites at this time. Use levels and users' perceptions of crowding should be monitored to ensure that crowding does not increase.
• At both sites, the majority of users reported encountering fewer people than the maximum number that they would accept encountering, suggesting that summer use levels are not a major problem at each site. Given that approximately one-third of users at Sans Souci / Kaimana Beach, however, encountered more people than their maximum tolerance, research and management attention may be needed to determine if summer use is expected to increase dramatically. In addition, use levels should be monitored to ensure that they do not frequently exceed approximately 217 people at one time at Sans Souci / Kaimana Beach and 118 people at one time at Diamond Head / Kuilei Cliffs.
• At each site, the majority of users reported encountering fewer bathrooms, showers, trash cans, picnic tables, park benches, and information signs than they feel should be at each site. In other words, users want more of each facility at each site and this would increase their satisfaction. From a management perspective, however, this may not be financially or logistically feasible. When the number of each facility that users' felt should be at each site was compared to what was actually at each site, there were enough of most facilities. At Diamond Head / Kuilei Cliffs Beaches, however, managers should consider installing bathrooms, picnic tables, and park benches.
• There was not a substantial amount of conflict among activity groups at Sans Souci / Kaimana Beach. The most prevalent conflict was with sunbathers and swimmers at this site (31%). There was, however conflict with surfers (45%) and windsurfers / kitesurfers (38%) at Diamond Head / Kuilei Cliffs Beaches. Zoning activity groups to keep them apart is often used to mitigate conflict. Zoning does not seem to be feasible or necessary at Sans Souci / Kaimana Beach at this time, but may be useful for separating surfers and windsurfers / kitesurfers at Diamond Head / Kuilei Cliffs Beaches. Enforcing zones,
Recreation Carrying Capacity and Management at Waikiki – Diamond Head Shoreline FMA
xii
however, tends to be expensive and time consuming. It may more appropriate to inform users of appropriate behaviors by improving user education and awareness (e.g., signs, brochures, orientation sessions, contact with personnel).
• A large percentage of users observed people handling or standing on coral at each site and believed that this depreciative behavior was a problem at each site (58% to 61% observed, 67% to 75% felt it was a problem). Research has shown that touching or standing on coral reefs can cause harmful effects such as coral breakage and mortality. In addition, this behavior could pose safety risks to humans (e.g., cuts, scrapes, infections). As a result, management attention is needed to reduce the amount of handling and standing on coral at each site. A first step would be to provide interpretive and educational material at each site (e.g., signs, brochures, orientation sessions) informing users of the various problems associated with these behaviors. Following implementation of these indirect management actions, monitoring and additional follow-up research should be conducted to examine the extent to which participation in these behaviors has been reduced. If these approaches are unsuccessful, more direct management tactics such as regulations and enforcement may be necessary.
• The management strategy that would be supported by the most users at each site would be providing more interpretive and educational information (e.g., signs, brochures, orientation sessions, contact with personnel / lifeguards). Zoning of activities, parking for tour buses, and commercial activities (e.g., recreation tour operators) would be opposed by the majority of users. If managers decide that zoning, bus parking, and / or commercial activities are necessary in the future, users and local residents should be involved in informing the decision making process and a highly visible educational campaign should be implemented educating users and the community about the rationale for any decisions.
• Respondents believed that improved interpretive and educational information, more upkeep and maintenance of facilities, and more facilities would currently be acceptable at each site. Restricting the number of users allowed at each site (i.e., limiting use) would currently be unacceptable. If there is ever evidence of substantial coral reef damage from recreation at each site, the most supported management strategy would be to provide more interpretive and educational information to users. If there is evidence that facilities (e.g., bathrooms, showers, trash cans) are in disrepair at each site, the most supported management strategies would be to improve upkeep and maintenance followed by providing more facilities. Restricting the number of people allowed at each site would only be supported if there was evidence that use levels were extremely high, coral reefs were damaged substantially, litter was prevalent, and facilities were in disrepair.
Recreation Carrying Capacity and Management at Waikiki – Diamond Head Shoreline FMA
xiii
TABLE OF CONTENTS
Abstract ...................................................................................................................... ii Executive Summary ................................................................................................... iii Table of Contents....................................................................................................... xiii List of Tables ............................................................................................................. xv List of Figures ............................................................................................................ xvii Introduction and Purpose ........................................................................................... 1 Project Objectives ...................................................................................................... 2 Conceptual Foundation .............................................................................................. 2
Recreation Carrying Capacity........................................................................ 2 Recreation Encounters, Norms, and Crowding.............................................. 5 Recreation Conflict and Behavioral Responses............................................. 7 Recreation Satisfaction .................................................................................. 9 Recreation Management Tradeoffs................................................................ 11 Segmentation and Value Orientations ........................................................... 12
Methods / Approach .................................................................................................. 13 Study Areas.................................................................................................... 13 Data Collection .............................................................................................. 15
Results and Analyses ................................................................................................. 16
Personal and Trip Characteristics ................................................................. 16 Activity Groups .................................................................................... 16 Participation in Organized Tours ......................................................... 18 Previous Visitation ............................................................................... 19 Value Orientations toward Reef Areas ................................................ 19 Sociodemographic Characteristics........................................................ 24 Section Summary ................................................................................. 27
Satisfaction with and Importance of Conditions and Experiences ................ 28 Overall Satisfaction............................................................................... 28 Satisfaction with Specific Conditions and Experiences ....................... 28 Importance of Specific Conditions and Experiences ........................... 31 Importance – Performance Analysis..................................................... 34 Section Summary ................................................................................. 35
Social Carrying Capacity Indicators .............................................................. 37 Reported Encounters with Other Users ................................................ 37 Normative Acceptance for Encountering Other Users ........................ 40 Perceived Crowding.............................................................................. 43
Recreation Carrying Capacity and Management at Waikiki – Diamond Head Shoreline FMA
xiv
Relationships among Encounters, Norms, and Crowding .................... 44 Section Summary ................................................................................. 46
Facility Carrying Capacity Indicators............................................................ 47 Section Summary ................................................................................. 50
Recreation Conflict and Coping Behavior..................................................... 51 Conflict with Activity Groups .............................................................. 51 Depreciative Behavior toward Coral Reefs .......................................... 55 Recreation Displacement and Product Shift ......................................... 58 Section Summary ................................................................................. 59
Evaluations and Tradeoffs of Potential Management Strategies .................. 60 Support and Opposition of Potential Management Strategies ............. 60 Tradeoffs in Acceptance of Potential Management Strategies ............ 61 Section Summary ................................................................................. 70
Recommendations...................................................................................................... 71 References.................................................................................................................. 74 Appendix A. Survey Instruments.............................................................................. 80 Appendix B. Uncollapsed Frequencies..................................................................... 88
Recreation Carrying Capacity and Management at Waikiki – Diamond Head Shoreline FMA
xv
LIST OF TABLES
1 Completed surveys and response rates for each version at each site......................... 16
2 All activities in which respondents participated in the summer ................................ 17
3 Main activity groups in the summer .......................................................................... 18
4 Factor analysis of basic beliefs toward coral reef areas............................................. 20
5 Reliability analyses of protectionist and use value orientations ................................ 21
6 Cluster group membership at each site ...................................................................... 22
7 Value orientation items by cluster groups ................................................................. 23
8 Percentage of males and females in each cluster group at each site.......................... 24
9 Age of users at each site............................................................................................. 25
10 Respondent location of residence .............................................................................. 26
11 Percentage of Hawaiian residents and nonresidents in each cluster group at each site ............................................................................... 26
12 Differences in satisfaction with conditions and experiences between each site........ 31
13 Differences in importance of conditions and experiences among each site .............. 33
14 Example formula for estimating encounter numbers based on photographs for Sans Souci / Kaimana....................................................... 39
15 Average reported encounters at each site................................................................... 39
16 Maximum number of other people respondents would accept encountering ............ 40
17 Social norm / impact acceptability curve characteristics at each site ........................ 42
18 Perceived crowding at each site in the summer ......................................................... 43
19 Relationships among encounters, norms, and crowding at each site......................... 44
20 Effect of encounters on user enjoyment of site visit.................................................. 45
21 Facility encounters, norms, and actual numbers at each site ..................................... 48
22 Relationships among facility encounters, norms, and satisfaction at each site ......... 49
23 Relationships between norms and actual number of facilities at each site ................ 50
24 Observed activity group behavior at each site ........................................................... 51
25 Perceived activity group problem behavior at each site ............................................ 52
26 Overall amount of each type of conflict at each site.................................................. 54
27 Differences between residents and nonresidents in amount of each type of conflict at Sans Souci / Kaimana Beach................................................ 55
28 Differences between residents and nonresidents in amount of each type of conflict at Diamond Head / Kuilei Cliffs .......................................... 56
Recreation Carrying Capacity and Management at Waikiki – Diamond Head Shoreline FMA
xvi
29 Coping behavior in response to conditions at each site ............................................. 58
30 Support for management strategies at each site......................................................... 61
31 Orthogonal fractional factorial design for scenarios with varying combinations of factors and levels ....................................................... 63
32 Mean acceptance ratings and utility scores of management actions by situational factor levels at Waikiki-Diamond Head Shoreline FMA......................... 68
33 Relative importance of each factor for each management action at Waikiki-Diamond Head Shoreline FMA ............................................................... 69
Recreation Carrying Capacity and Management at Waikiki – Diamond Head Shoreline FMA
xvii
LIST OF FIGURES
1 Hypothetical social norm curve ................................................................................. 6
2 Conflict evaluation typology...................................................................................... 8
3 Importance-performance matrix for measuring satisfaction...................................... 10
4 Map of Waikiki-Diamond Head Shoreline FMA ...................................................... 14
5 Study site locations in Waikiki-Diamond Head Shoreline FMA............................... 14
6 Percent of respondents who visited as part of an organized / guided tour................. 19
7 Percent of respondents who had visited each site before their current trip ............... 19
8 Percentage of males and females at each site ............................................................ 24
9 Overall respondent satisfaction with their visit to each site ...................................... 28
10 Respondent satisfaction with conditions and experiences at Sans Souci / Kaimana Beach ................................................................................. 29
11 Respondent satisfaction with conditions and experiences at Diamond Head / Kuilei Cliffs ................................................................................ 30
12 Respondent importance that conditions and experiences are provided at Sans Souci / Kaimana Beach ............................................................ 32
13 Respondent importance that conditions and experiences are provided at Diamond Head / Kuilei Cliffs ........................................................... 33
14 Importance – performance analysis at each site ........................................................ 35
15 Photographs for measuring encounters and use level norms ..................................... 38
16 Social norm / impact acceptability curve for encounters with other people at each site..................................................................................... 42
17 Percent of users who have observed people handling or standing on coral at each site.................................................................. 56
18 Percent of users who think that people handling or standing on coral is a problem at each site ............................................. 57
19 PCI and mean acceptance of each management strategy across scenarios at Waikiki-Diamond Head Shoreline FMA .................................... 65
Recreation Carrying Capacity and Management at Waikiki – Diamond Head Shoreline FMA
1
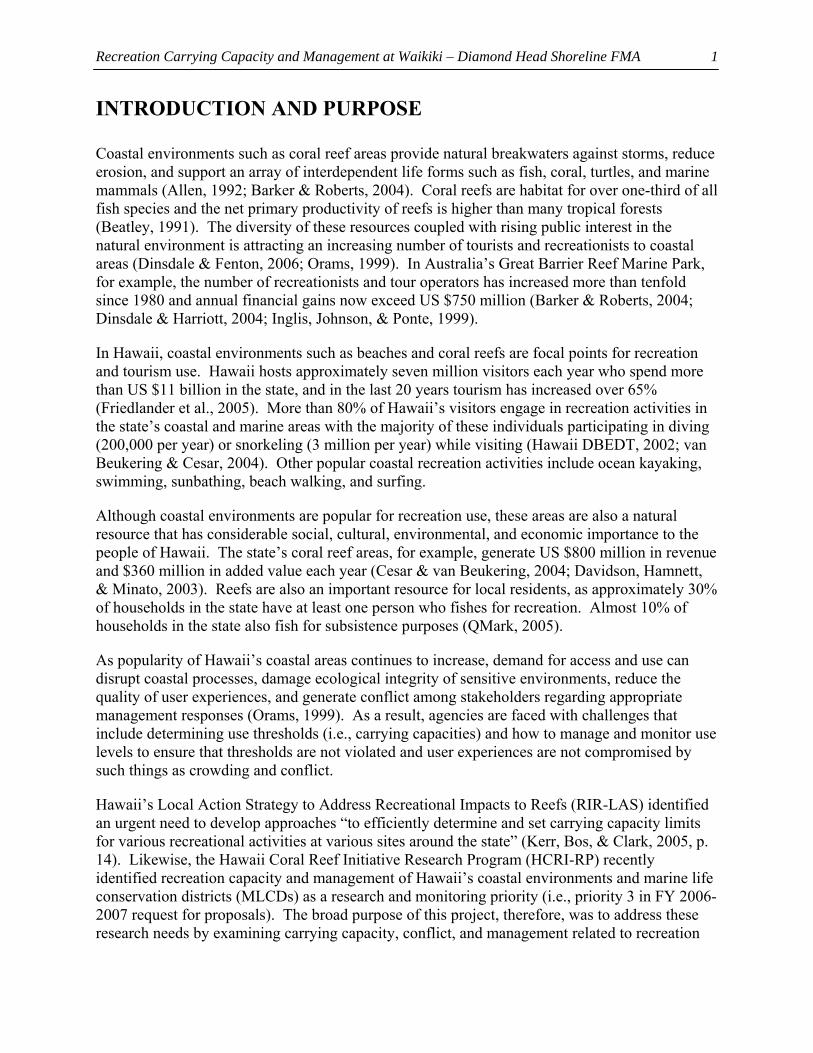
INTRODUCTION AND PURPOSE
Coastal environments such as coral reef areas provide natural breakwaters against storms, reduce erosion, and support an array of interdependent life forms such as fish, coral, turtles, and marine mammals (Allen, 1992; Barker & Roberts, 2004). Coral reefs are habitat for over one-third of all fish species and the net primary productivity of reefs is higher than many tropical forests (Beatley, 1991). The diversity of these resources coupled with rising public interest in the natural environment is attracting an increasing number of tourists and recreationists to coastal areas (Dinsdale & Fenton, 2006; Orams, 1999). In Australia’s Great Barrier Reef Marine Park, for example, the number of recreationists and tour operators has increased more than tenfold since 1980 and annual financial gains now exceed US $750 million (Barker & Roberts, 2004; Dinsdale & Harriott, 2004; Inglis, Johnson, & Ponte, 1999).
In Hawaii, coastal environments such as beaches and coral reefs are focal points for recreation and tourism use. Hawaii hosts approximately seven million visitors each year who spend more than US $11 billion in the state, and in the last 20 years tourism has increased over 65% (Friedlander et al., 2005). More than 80% of Hawaii’s visitors engage in recreation activities in the state’s coastal and marine areas with the majority of these individuals participating in diving (200,000 per year) or snorkeling (3 million per year) while visiting (Hawaii DBEDT, 2002; van Beukering & Cesar, 2004). Other popular coastal recreation activities include ocean kayaking, swimming, sunbathing, beach walking, and surfing.
Although coastal environments are popular for recreation use, these areas are also a natural resource that has considerable social, cultural, environmental, and economic importance to the people of Hawaii. The state’s coral reef areas, for example, generate US $800 million in revenue and $360 million in added value each year (Cesar & van Beukering, 2004; Davidson, Hamnett, & Minato, 2003). Reefs are also an important resource for local residents, as approximately 30% of households in the state have at least one person who fishes for recreation. Almost 10% of households in the state also fish for subsistence purposes (QMark, 2005).
As popularity of Hawaii’s coastal areas continues to increase, demand for access and use can disrupt coastal processes, damage ecological integrity of sensitive environments, reduce the quality of user experiences, and generate conflict among stakeholders regarding appropriate management responses (Orams, 1999). As a result, agencies are faced with challenges that include determining use thresholds (i.e., carrying capacities) and how to manage and monitor use levels to ensure that thresholds are not violated and user experiences are not compromised by such things as crowding and conflict.
Hawaii’s Local Action Strategy to Address Recreational Impacts to Reefs (RIR-LAS) identified an urgent need to develop approaches “to efficiently determine and set carrying capacity limits for various recreational activities at various sites around the state” (Kerr, Bos, & Clark, 2005, p. 14). Likewise, the Hawaii Coral Reef Initiative Research Program (HCRI-RP) recently identified recreation capacity and management of Hawaii’s coastal environments and marine life conservation districts (MLCDs) as a research and monitoring priority (i.e., priority 3 in FY 2006-2007 request for proposals). The broad purpose of this project, therefore, was to address these research needs by examining carrying capacity, conflict, and management related to recreation
Recreation Carrying Capacity and Management at Waikiki – Diamond Head Shoreline FMA
2
use at coastal sites in Hawaii. This report presents results of a project examining these issues at Waikiki – Diamond Head Shoreline Fisheries Management Area (FMA) on Oahu, Hawaii.
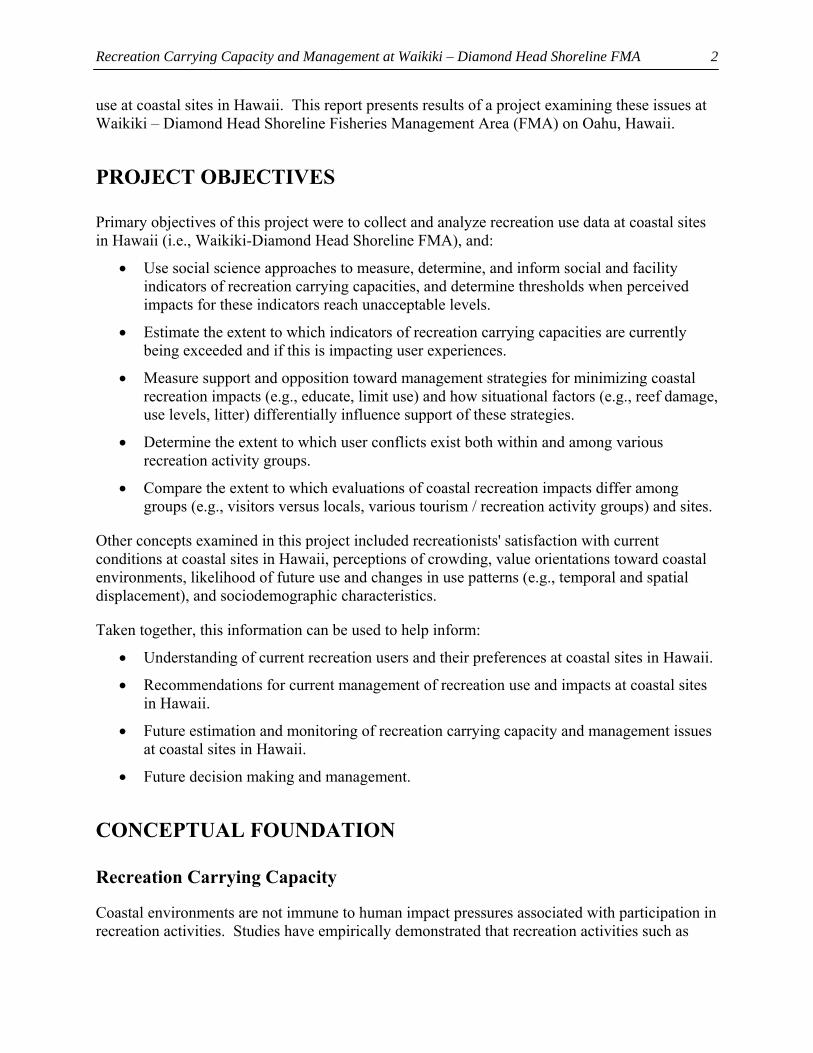
PROJECT OBJECTIVES
Primary objectives of this project were to collect and analyze recreation use data at coastal sites in Hawaii (i.e., Waikiki-Diamond Head Shoreline FMA), and:
• Use social science approaches to measure, determine, and inform social and facility indicators of recreation carrying capacities, and determine thresholds when perceived impacts for these indicators reach unacceptable levels.
• Estimate the extent to which indicators of recreation carrying capacities are currently being exceeded and if this is impacting user experiences.
• Measure support and opposition toward management strategies for minimizing coastal recreation impacts (e.g., educate, limit use) and how situational factors (e.g., reef damage, use levels, litter) differentially influence support of these strategies.
• Determine the extent to which user conflicts exist both within and among various recreation activity groups.
• Compare the extent to which evaluations of coastal recreation impacts differ among groups (e.g., visitors versus locals, various tourism / recreation activity groups) and sites.
Other concepts examined in this project included recreationists' satisfaction with current conditions at coastal sites in Hawaii, perceptions of crowding, value orientations toward coastal environments, likelihood of future use and changes in use patterns (e.g., temporal and spatial displacement), and sociodemographic characteristics.
Taken together, this information can be used to help inform:
• Understanding of current recreation users and their preferences at coastal sites in Hawaii.
• Recommendations for current management of recreation use and impacts at coastal sites in Hawaii.
• Future estimation and monitoring of recreation carrying capacity and management issues at coastal sites in Hawaii.
• Future decision making and management.
CONCEPTUAL FOUNDATION
Recreation Carrying Capacity
Coastal environments are not immune to human impact pressures associated with participation in recreation activities. Studies have empirically demonstrated that recreation activities such as
Recreation Carrying Capacity and Management at Waikiki – Diamond Head Shoreline FMA
3
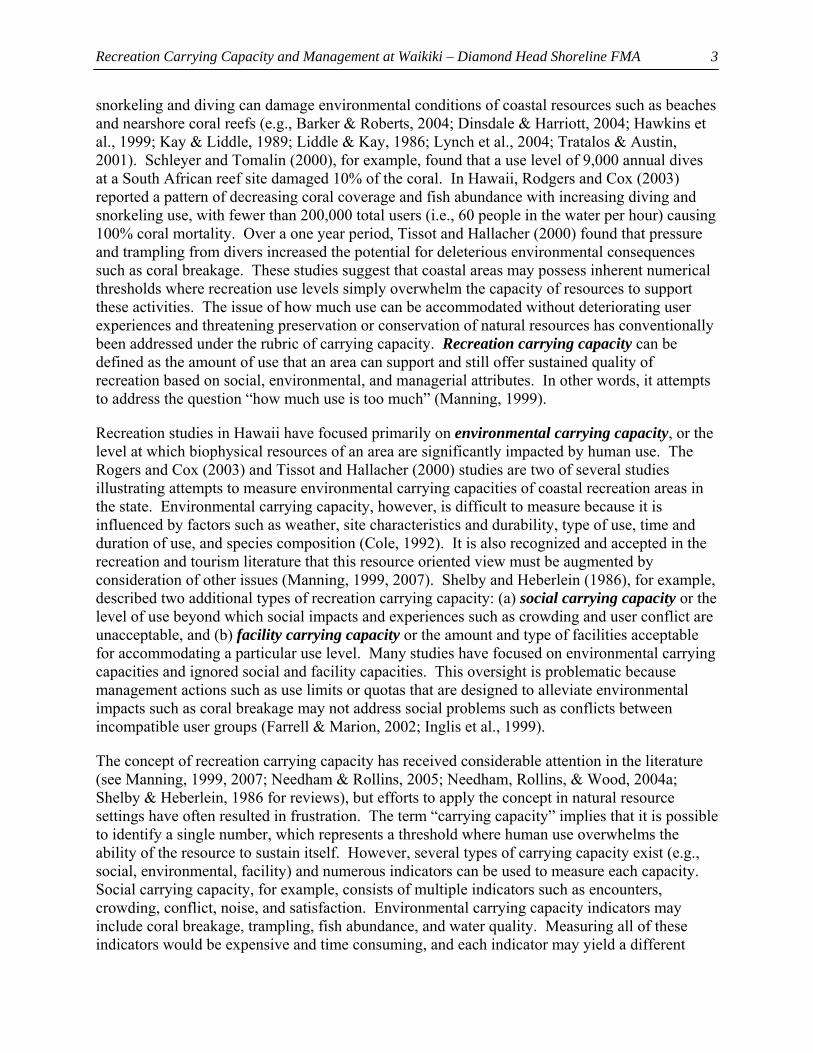
snorkeling and diving can damage environmental conditions of coastal resources such as beaches and nearshore coral reefs (e.g., Barker & Roberts, 2004; Dinsdale & Harriott, 2004; Hawkins et al., 1999; Kay & Liddle, 1989; Liddle & Kay, 1986; Lynch et al., 2004; Tratalos & Austin, 2001). Schleyer and Tomalin (2000), for example, found that a use level of 9,000 annual dives at a South African reef site damaged 10% of the coral. In Hawaii, Rodgers and Cox (2003) reported a pattern of decreasing coral coverage and fish abundance with increasing diving and snorkeling use, with fewer than 200,000 total users (i.e., 60 people in the water per hour) causing 100% coral mortality. Over a one year period, Tissot and Hallacher (2000) found that pressure and trampling from divers increased the potential for deleterious environmental consequences such as coral breakage. These studies suggest that coastal areas may possess inherent numerical thresholds where recreation use levels simply overwhelm the capacity of resources to support these activities. The issue of how much use can be accommodated without deteriorating user experiences and threatening preservation or conservation of natural resources has conventionally been addressed under the rubric of carrying capacity. Recreation carrying capacity can be defined as the amount of use that an area can support and still offer sustained quality of recreation based on social, environmental, and managerial attributes. In other words, it attempts to address the question “how much use is too much” (Manning, 1999).
Recreation studies in Hawaii have focused primarily on environmental carrying capacity, or the level at which biophysical resources of an area are significantly impacted by human use. The Rogers and Cox (2003) and Tissot and Hallacher (2000) studies are two of several studies illustrating attempts to measure environmental carrying capacities of coastal recreation areas in the state. Environmental carrying capacity, however, is difficult to measure because it is influenced by factors such as weather, site characteristics and durability, type of use, time and duration of use, and species composition (Cole, 1992). It is also recognized and accepted in the recreation and tourism literature that this resource oriented view must be augmented by consideration of other issues (Manning, 1999, 2007). Shelby and Heberlein (1986), for example, described two additional types of recreation carrying capacity: (a) social carrying capacity or the level of use beyond which social impacts and experiences such as crowding and user conflict are unacceptable, and (b) facility carrying capacity or the amount and type of facilities acceptable for accommodating a particular use level. Many studies have focused on environmental carrying capacities and ignored social and facility capacities. This oversight is problematic because management actions such as use limits or quotas that are designed to alleviate environmental impacts such as coral breakage may not address social problems such as conflicts between incompatible user groups (Farrell & Marion, 2002; Inglis et al., 1999).
The concept of recreation carrying capacity has received considerable attention in the literature (see Manning, 1999, 2007; Needham & Rollins, 2005; Needham, Rollins, & Wood, 2004a; Shelby & Heberlein, 1986 for reviews), but efforts to apply the concept in natural resource settings have often resulted in frustration. The term “carrying capacity” implies that it is possible to identify a single number, which represents a threshold where human use overwhelms the ability of the resource to sustain itself. However, several types of carrying capacity exist (e.g., social, environmental, facility) and numerous indicators can be used to measure each capacity. Social carrying capacity, for example, consists of multiple indicators such as encounters, crowding, conflict, noise, and satisfaction. Environmental carrying capacity indicators may include coral breakage, trampling, fish abundance, and water quality. Measuring all of these indicators would be expensive and time consuming, and each indicator may yield a different
Recreation Carrying Capacity and Management at Waikiki – Diamond Head Shoreline FMA
4
capacity number on scales that are not compatible or comparable. Calculating a single recreation carrying capacity number for an area, therefore, is neither feasible nor realistic.
There are also additional difficulties in attempting to apply the carrying capacity concept. For example, carrying capacity has often been misapplied to set use levels without considering how they meet management objectives. In addition, a capacity number can sometimes be changed in response to political pressures without considering relevant stakeholders (e.g., users, agencies, operators). Carrying capacity numbers are often too simplistic, based on arbitrary judgments, and fail to minimize impacts. The concept tends to overemphasize importance of "amount" of use and fails to consider other factors such as type of use and behavior of users. Finally, by focusing on amount of use, carrying capacity numbers often imply use limits or quotas if they are exceeded, which draws attention away from other strategies that may be available to managers such as temporal or spatial zoning and user education. Use limits are also controversial and heavy-handed because they may unnecessarily restrict user freedom, they are difficult and expensive to implement, and they may be perceived as a threat to generating tourism income, thus causing a lack of interest group or stakeholder “buy in” (Farrell & Marion, 2002).
Recreation almost always causes some social and environmental impacts, but descriptive scientific studies that attempt to identify a simple cause and effect relationship between human use and impact typically fail to provide clear guidance on where and when use thresholds are exceeded. It is important to recognize that some impact and change is inevitable and at some point the amount, nature, and type of change becomes unacceptable. The critical question, therefore, is not “how much use is too much,” but more importantly “how much impact or change is acceptable or should be allowed” (Manning, 1999, 2007).
To overcome difficulties associated with measuring carrying capacities, recreation and tourism researchers have turned to contemporary planning and management frameworks such as Limits of Acceptable Change (LAC; Stankey et al., 1985), Visitor Experience and Resource Protection (VERP; Manning, 2001), and Visitor Impact Management (VIM; Graefe, Kuss, & Vaske, 1990) to address this question of “how much impact or change is acceptable” (see Manning, 2004 for a review). These frameworks necessitate quantitatively measuring select social, resource, and facility indictors at specific sites (e.g., user crowding, perceived coral health) to reveal standards of quality or thresholds at which these indicator conditions become unacceptable (e.g., no more than 500 users per site at one time). These indicators are subsequently monitored by field personnel to ensure that standards are maintained, and if violated the application of acceptable management actions may need to be imposed (e.g., zoning, education, limit use).
These frameworks offer a proven tool for managers to understand the extent that indicator impacts are acceptable or unacceptable, identify the importance of indicators, and describe the amount of consensus among users regarding acceptable indicator conditions (McCool & Cole, 1997; Needham, Rollins, & Vaske, 2005). These frameworks also emphasize consideration of desired future outcomes and the inclusion of monitoring ensures that managers are explicitly aware of changing resource and experiential conditions, which enhances capability of managers to respond to changing conditions. Taken together, these frameworks are iterative and adaptive, and shift the emphasis and definition of recreation carrying capacity from “how many users can be accommodated in an area” to “what are the desired conditions of this area” (Manning, 2004).
Recreation Carrying Capacity and Management at Waikiki – Diamond Head Shoreline FMA
5
This approach to measuring and managing recreation carrying capacities is currently being used by several natural resource agencies (e.g., National Park Service) to address terrestrial social impacts including crowding and resource impacts such as erosion (e.g., Donnelly, Vaske, Whittaker, & Shelby, 2000; Manning, 2001; Needham et al., 2004a, 2005; Vaske & Donnelly, 2002). Needham et al. (2004a), for example, found that many recreationists at several sites reported high levels of crowding because they encountered more people than they believed each site could adequately handle. It was concluded that these indicators of social carrying capacity (i.e., use levels, crowding) were being exceeded. Directional trails, zoning, user fees, and education were supported management strategies for alleviating these social impacts. In a marine setting, Inglis et al. (1999) showed that seeing 14 users (e.g., snorkerlers) from shore and encountering six users in the water were threshold points at which social conditions became unacceptable and management attention was needed at the Great Barrier Reef in Australia.
This project used social science approaches to: (a) measure social (e.g., conflict, crowding) and facility (e.g., bathrooms, informational signage) indicators of recreation carrying capacity, (b) determine thresholds when perceived impacts for these indicators reach unacceptable levels, and (c) estimate the extent to which indicators of recreation carrying capacities are currently being exceeded and if this is impacting user experiences at coastal recreation sites in Hawaii.
Recreation Encounters, Norms, and Crowding
Encounters and crowding are two of the most commonly measured indicators of social carrying capacity in recreation settings (see Vaske & Donnelly, 2002 for a review). Reported encounters describe a subjective count of the number of other people that an individual remembers observing in a setting. Perceived crowding is a subjective negative evaluation that this number of people observed or number of encounters with other people, groups, or activities is too many (Needham et al., 2004a; Shelby, Vaske, & Heberlein, 1989; Vaske & Donnelly, 2002).
Popularity of recreation in many natural resource settings has led to concern about crowding and as a result, a wide body of research has attempted to understand and address this concern (see Manning, 2007; Shelby & Heberlein, 1986; Shelby et al., 1989 for reviews). Understanding users' reported encounters and perceived crowding, however, may not reveal maximum acceptable use levels or an understanding of how use should be managed and monitored. The structural norm approach offers a conceptual and applied basis to help address these issues. One line of research defines norms as standards that individuals use for evaluating activities, environments, or management strategies as good or bad, better or worse (e.g., Donnelly et al., 2000; Shelby, Vaske, & Donnelly, 1996; Vaske, Shelby, Graefe, & Heberlein, 1986). In other words, norms clarify what people believe conditions or behavior should be. Norm theory provides a basis for measuring indicators and formulating standards of quality, which are central to contemporary recreation and tourism planning frameworks such as LAC, VERP, and VIM.
A simplified example may help to illustrate. The provision of opportunities for solitude is a management goal in many parks and related recreation and tourism settings (Dearden & Rollins, 2002; Manning, 1999; Weaver, 2001). This goal, however, may be far too broad to guide management since it does not specify what constitutes solitude and how it should be measured and monitored. Indicators and standards of quality may help to resolve these issues. Surveys of recreationists may show that the number of encounters with other people is an important aspect
Recreation Carrying Capacity and Management at Waikiki – Diamond Head Shoreline FMA
6
of solitude, suggesting that it may be one indicator of solitude. Normative research may reveal that once many recreationists encounter 10 or more people in a specific area, they feel crowded and do not achieve an acceptable level of solitude. This suggests that encounters with 10 or more people may represent an appropriate standard of quality for a specific area.
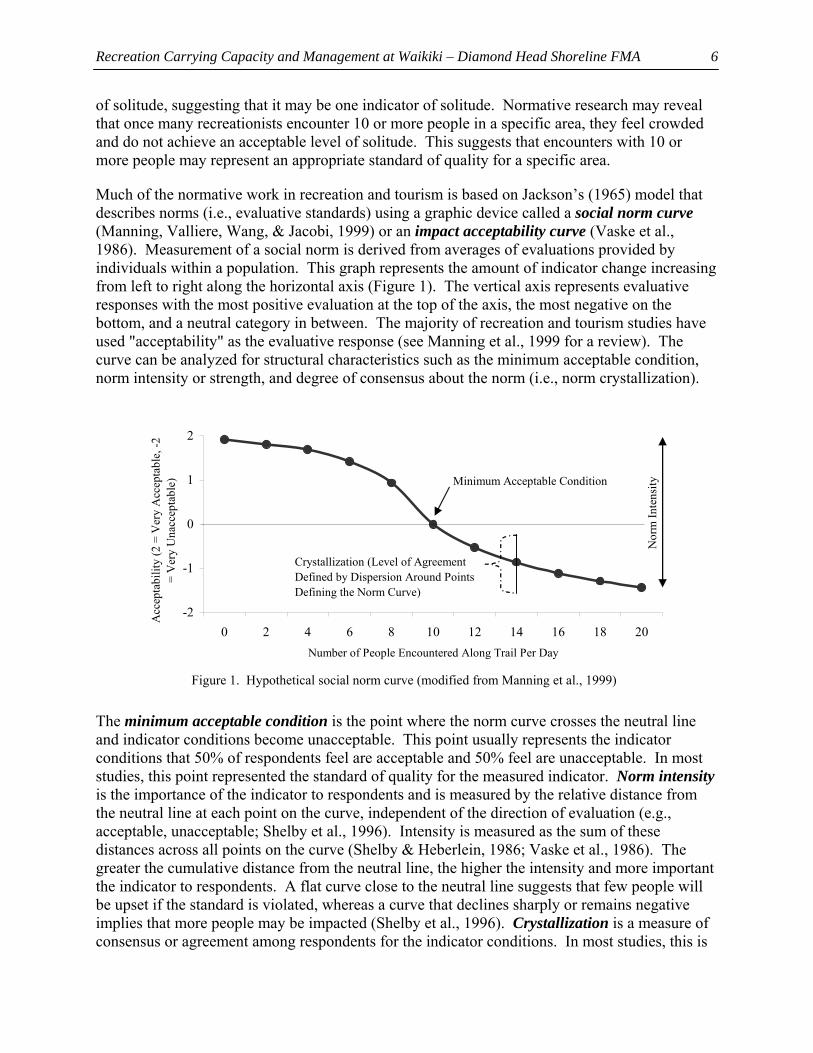
Much of the normative work in recreation and tourism is based on Jackson’s (1965) model that describes norms (i.e., evaluative standards) using a graphic device called a social norm curve (Manning, Valliere, Wang, & Jacobi, 1999) or an impact acceptability curve (Vaske et al., 1986). Measurement of a social norm is derived from averages of evaluations provided by individuals within a population. This graph represents the amount of indicator change increasing from left to right along the horizontal axis (Figure 1). The vertical axis represents evaluative responses with the most positive evaluation at the top of the axis, the most negative on the bottom, and a neutral category in between. The majority of recreation and tourism studies have used "acceptability" as the evaluative response (see Manning et al., 1999 for a review). The curve can be analyzed for structural characteristics such as the minimum acceptable condition, norm intensity or strength, and degree of consensus about the norm (i.e., norm crystallization).
-2
-1
0
1
2
0 2 4 6 8 10 12 14 16 18 20Number of People Encountered Along Trail Per Day
Acc
epta
bilit
y (2
= V
ery
Acc
epta
ble,
-2
= V
ery
Una
ccep
tabl
e) Minimum Acceptable Condition
Nor
m In
tens
ity
Crystallization (Level of Agreement Defined by Dispersion Around Points Defining the Norm Curve)
Figure 1. Hypothetical social norm curve (modified from Manning et al., 1999)
The minimum acceptable condition is the point where the norm curve crosses the neutral line and indicator conditions become unacceptable. This point usually represents the indicator conditions that 50% of respondents feel are acceptable and 50% feel are unacceptable. In most studies, this point represented the standard of quality for the measured indicator. Norm intensity is the importance of the indicator to respondents and is measured by the relative distance from the neutral line at each point on the curve, independent of the direction of evaluation (e.g., acceptable, unacceptable; Shelby et al., 1996). Intensity is measured as the sum of these distances across all points on the curve (Shelby & Heberlein, 1986; Vaske et al., 1986). The greater the cumulative distance from the neutral line, the higher the intensity and more important the indicator to respondents. A flat curve close to the neutral line suggests that few people will be upset if the standard is violated, whereas a curve that declines sharply or remains negative implies that more people may be impacted (Shelby et al., 1996). Crystallization is a measure of consensus or agreement among respondents for the indicator conditions. In most studies, this is
Recreation Carrying Capacity and Management at Waikiki – Diamond Head Shoreline FMA
7
presented as the average of the standard deviations (i.e., interval around the mean containing the majority or 68% of responses) for all points comprising the curve (Shelby & Heberlein, 1986; Shelby et al., 1996). If crystallization is high (i.e., small average standard deviation), managers may have confidence in using normative data to help formulate standards of quality for carrying capacity indicators that can then be monitored and managed (Manning, 1999, 2007).
Research suggests that when users perceive a setting to be crowded, they have at least implicitly compared conditions that they actually experienced (e.g., number of encounters) with their normative evaluation of what they feel are acceptable or unacceptable conditions for the setting (e.g., use levels; Vaske & Donnelly, 2002). For example, a comparative meta-analysis of multiple studies involving thousands of recreationists and tourists demonstrated that when encounters exceeded a user's norm for seeing others, perceived crowding was higher compared to those who encountered less than their norm (Vaske & Donnelly, 2002).
This project measured encounters and crowding, and used the structural norm approach to: (a) determine thresholds when perceived impacts for indicators reached unacceptable levels, and (b) estimate the extent to which indicators are currently being exceeded at coastal sites in Hawaii.
Recreation Conflict and Behavioral Responses
Like encounters and crowding, conflict is another indicator of social carrying capacity in recreation and tourism settings. Empirical research has revealed several different types of conflict that can occur between people participating in similar or different types of outdoor recreation (see Graefe & Thapa, 2004; Manning, 1999 for reviews). One-way or asymmetrical conflict occurs when one activity group experiences conflict with or dislikes another group, but not vice versa. A study of snowmobilers and cross-country skiers, for example, showed that skiers disliked encounters with snowmobilers, but snowmobilers were not in conflict with skiers (Vaske, Needham, & Cline Jr., 2007). Two-way conflict occurs when there is resentment or dislike in both directions (e.g., skiers in conflict with snowboarders, snowboarders in conflict with skiers; Thapa & Graefe, 2003; Vaske, Carothers, Donnelly, & Baird, 2000). Conflict between users engaged in different activities (e.g., hikers versus mountain bikers) is known as out-group conflict, whereas conflict between participants in the same activity (e.g., hikers versus other hikers) is known as in-group conflict (Manning, 1999).
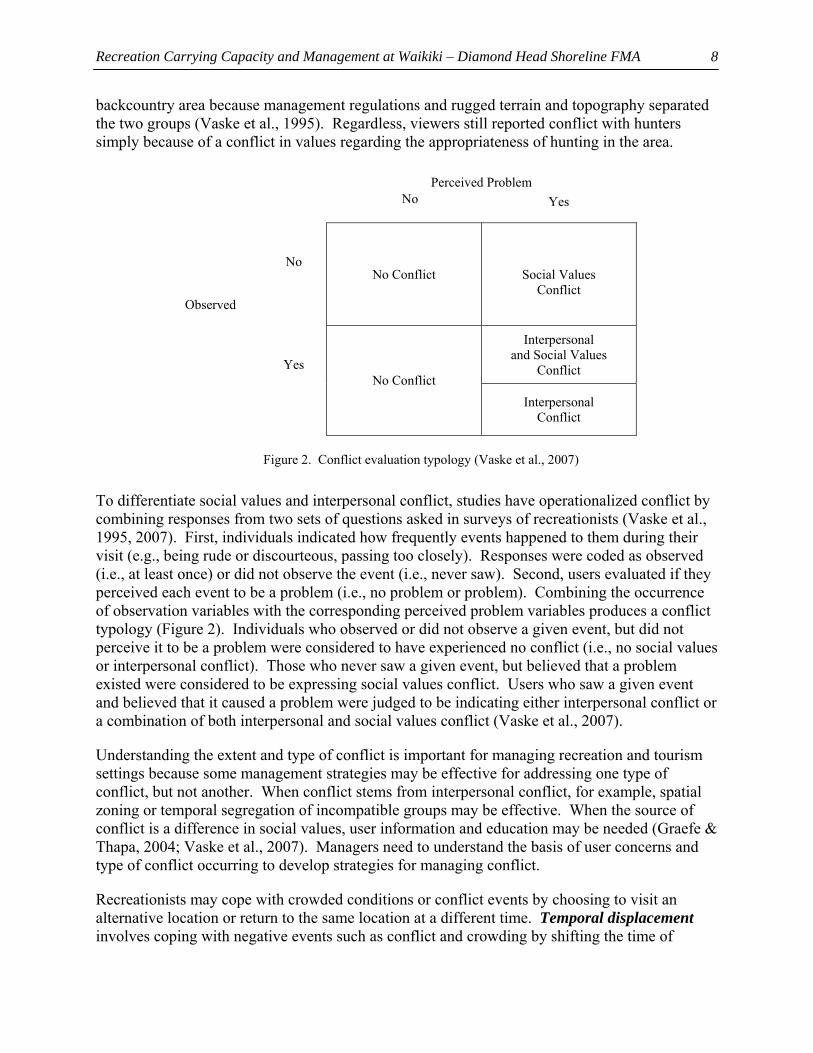
Most recreation and tourism studies have examined interpersonal or goal interference conflict where the actual physical presence or behavior of an individual or group interferes with goals, expectations, or behavior of another individual or group (Vaske et al., 2007). A snorkeler, for example, may experience interpersonal conflict if he or she is cut off by or collides with a surfer. Recent research has also introduced and explored the concept of social values conflict (Vaske, Donnelly, Wittmann, & Laidlaw, 1995; Vaske et al., 2007). Social values conflict occurs between groups who do not share similar opinions, norms, or values about an activity. Unlike interpersonal conflict, social values conflict is defined as conflict that can occur even when there is no direct physical contact or interaction among groups (Vaske et al., 2007). For example, although encounters with horseback riders may be rare in recreation settings such as parks and wilderness areas, recreationists may philosophically disagree about the appropriateness of such animals in these settings. A study of wildlife viewers and hunters showed that viewers did not witness many hunters or hunting behaviors (e.g., see animals be shot, hear shots fired) in a
Recreation Carrying Capacity and Management at Waikiki – Diamond Head Shoreline FMA
8
backcountry area because management regulations and rugged terrain and topography separated the two groups (Vaske et al., 1995). Regardless, viewers still reported conflict with hunters simply because of a conflict in values regarding the appropriateness of hunting in the area.
Perceived Problem No Yes
No No Conflict
Social Values
Conflict
Interpersonal and Social Values
Conflict
Observed
Yes No Conflict
Interpersonal Conflict
Figure 2. Conflict evaluation typology (Vaske et al., 2007)
To differentiate social values and interpersonal conflict, studies have operationalized conflict by combining responses from two sets of questions asked in surveys of recreationists (Vaske et al., 1995, 2007). First, individuals indicated how frequently events happened to them during their visit (e.g., being rude or discourteous, passing too closely). Responses were coded as observed (i.e., at least once) or did not observe the event (i.e., never saw). Second, users evaluated if they perceived each event to be a problem (i.e., no problem or problem). Combining the occurrence of observation variables with the corresponding perceived problem variables produces a conflict typology (Figure 2). Individuals who observed or did not observe a given event, but did not perceive it to be a problem were considered to have experienced no conflict (i.e., no social values or interpersonal conflict). Those who never saw a given event, but believed that a problem existed were considered to be expressing social values conflict. Users who saw a given event and believed that it caused a problem were judged to be indicating either interpersonal conflict or a combination of both interpersonal and social values conflict (Vaske et al., 2007).
Understanding the extent and type of conflict is important for managing recreation and tourism settings because some management strategies may be effective for addressing one type of conflict, but not another. When conflict stems from interpersonal conflict, for example, spatial zoning or temporal segregation of incompatible groups may be effective. When the source of conflict is a difference in social values, user information and education may be needed (Graefe & Thapa, 2004; Vaske et al., 2007). Managers need to understand the basis of user concerns and type of conflict occurring to develop strategies for managing conflict.
Recreationists may cope with crowded conditions or conflict events by choosing to visit an alternative location or return to the same location at a different time. Temporal displacement involves coping with negative events such as conflict and crowding by shifting the time of
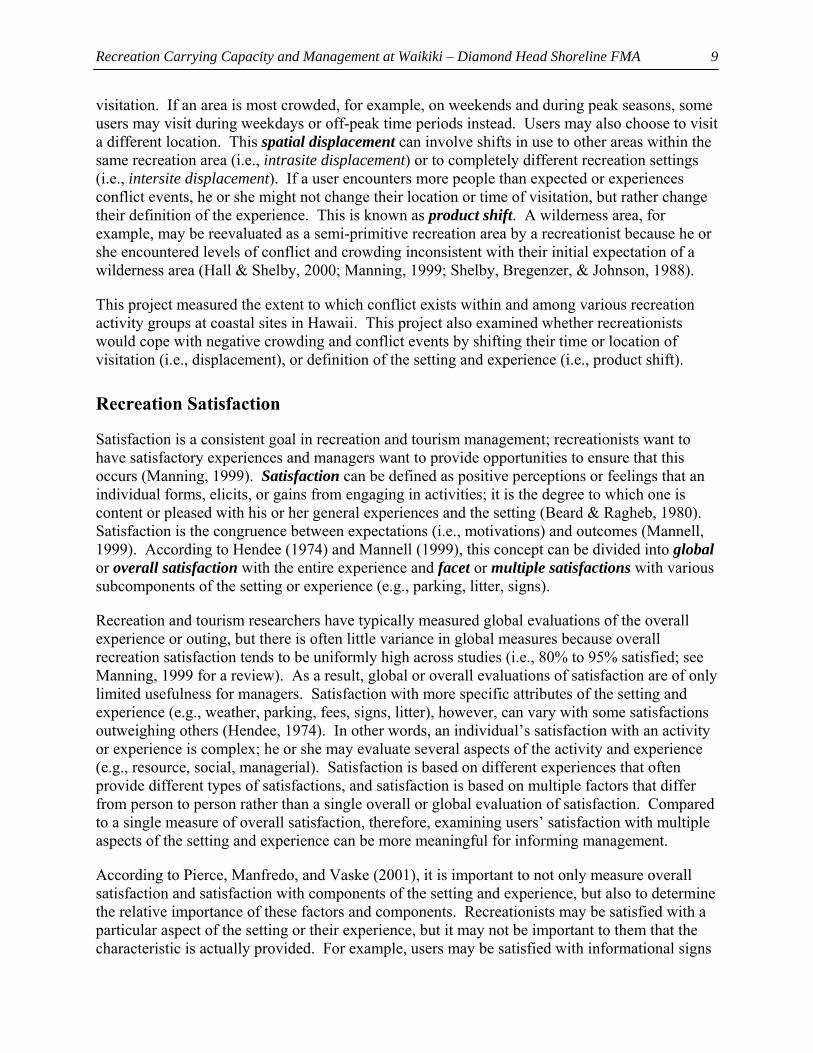
Recreation Carrying Capacity and Management at Waikiki – Diamond Head Shoreline FMA
9
visitation. If an area is most crowded, for example, on weekends and during peak seasons, some users may visit during weekdays or off-peak time periods instead. Users may also choose to visit a different location. This spatial displacement can involve shifts in use to other areas within the same recreation area (i.e., intrasite displacement) or to completely different recreation settings (i.e., intersite displacement). If a user encounters more people than expected or experiences conflict events, he or she might not change their location or time of visitation, but rather change their definition of the experience. This is known as product shift. A wilderness area, for example, may be reevaluated as a semi-primitive recreation area by a recreationist because he or she encountered levels of conflict and crowding inconsistent with their initial expectation of a wilderness area (Hall & Shelby, 2000; Manning, 1999; Shelby, Bregenzer, & Johnson, 1988).
This project measured the extent to which conflict exists within and among various recreation activity groups at coastal sites in Hawaii. This project also examined whether recreationists would cope with negative crowding and conflict events by shifting their time or location of visitation (i.e., displacement), or definition of the setting and experience (i.e., product shift).
Recreation Satisfaction
Satisfaction is a consistent goal in recreation and tourism management; recreationists want to have satisfactory experiences and managers want to provide opportunities to ensure that this occurs (Manning, 1999). Satisfaction can be defined as positive perceptions or feelings that an individual forms, elicits, or gains from engaging in activities; it is the degree to which one is content or pleased with his or her general experiences and the setting (Beard & Ragheb, 1980). Satisfaction is the congruence between expectations (i.e., motivations) and outcomes (Mannell, 1999). According to Hendee (1974) and Mannell (1999), this concept can be divided into global or overall satisfaction with the entire experience and facet or multiple satisfactions with various subcomponents of the setting or experience (e.g., parking, litter, signs).
Recreation and tourism researchers have typically measured global evaluations of the overall experience or outing, but there is often little variance in global measures because overall recreation satisfaction tends to be uniformly high across studies (i.e., 80% to 95% satisfied; see Manning, 1999 for a review). As a result, global or overall evaluations of satisfaction are of only limited usefulness for managers. Satisfaction with more specific attributes of the setting and experience (e.g., weather, parking, fees, signs, litter), however, can vary with some satisfactions outweighing others (Hendee, 1974). In other words, an individual’s satisfaction with an activity or experience is complex; he or she may evaluate several aspects of the activity and experience (e.g., resource, social, managerial). Satisfaction is based on different experiences that often provide different types of satisfactions, and satisfaction is based on multiple factors that differ from person to person rather than a single overall or global evaluation of satisfaction. Compared to a single measure of overall satisfaction, therefore, examining users’ satisfaction with multiple aspects of the setting and experience can be more meaningful for informing management.
According to Pierce, Manfredo, and Vaske (2001), it is important to not only measure overall satisfaction and satisfaction with components of the setting and experience, but also to determine the relative importance of these factors and components. Recreationists may be satisfied with a particular aspect of the setting or their experience, but it may not be important to them that the characteristic is actually provided. For example, users may be satisfied with informational signs
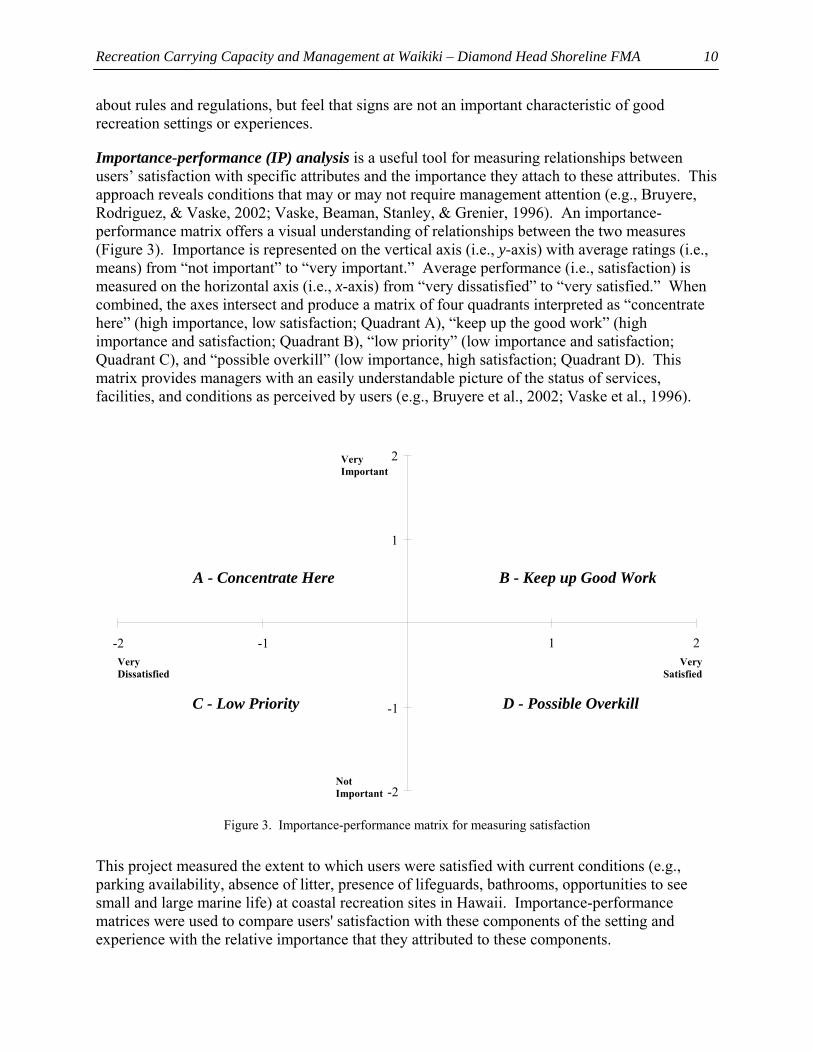
Recreation Carrying Capacity and Management at Waikiki – Diamond Head Shoreline FMA
10
about rules and regulations, but feel that signs are not an important characteristic of good recreation settings or experiences.
Importance-performance (IP) analysis is a useful tool for measuring relationships between users’ satisfaction with specific attributes and the importance they attach to these attributes. This approach reveals conditions that may or may not require management attention (e.g., Bruyere, Rodriguez, & Vaske, 2002; Vaske, Beaman, Stanley, & Grenier, 1996). An importance-performance matrix offers a visual understanding of relationships between the two measures (Figure 3). Importance is represented on the vertical axis (i.e., y-axis) with average ratings (i.e., means) from “not important” to “very important.” Average performance (i.e., satisfaction) is measured on the horizontal axis (i.e., x-axis) from “very dissatisfied” to “very satisfied.” When combined, the axes intersect and produce a matrix of four quadrants interpreted as “concentrate here” (high importance, low satisfaction; Quadrant A), “keep up the good work” (high importance and satisfaction; Quadrant B), “low priority” (low importance and satisfaction; Quadrant C), and “possible overkill” (low importance, high satisfaction; Quadrant D). This matrix provides managers with an easily understandable picture of the status of services, facilities, and conditions as perceived by users (e.g., Bruyere et al., 2002; Vaske et al., 1996).
Figure 3. Importance-performance matrix for measuring satisfaction
This project measured the extent to which users were satisfied with current conditions (e.g., parking availability, absence of litter, presence of lifeguards, bathrooms, opportunities to see small and large marine life) at coastal recreation sites in Hawaii. Importance-performance matrices were used to compare users' satisfaction with these components of the setting and experience with the relative importance that they attributed to these components.
Very Dissatisfied
VerySatisfied
Not Important
Very Important
-2
-1
1
2
-2 -1 1 2Very Dissatisfied
VerySatisfied
Not Important
Very Important
A - Concentrate Here B - Keep up Good Work
C - Low Priority D - Possible Overkill
Recreation Carrying Capacity and Management at Waikiki – Diamond Head Shoreline FMA
11
Recreation Management and Tradeoffs
A recent study in Hawaii demonstrated that residents believed that the tourism industry is approaching capacity and the islands are being managed for tourists at the expense of locals (QMark, 2005; “Tourism poll tells us to pay heed to locals,” 2006). Residents believed that pollution, overfishing, and nearshore recreation were major threats to Hawaii’s coastal areas, and that enforcement, new rules / guidelines, restricting use, and setting aside areas may be valuable strategies for managing these threats (QMark, 2005). Other recent studies have shown that the majority of marine recreationists considered Hawaii’s coastal areas to be healthy, but felt that more management was necessary to improve facilities and infrastructure, scientific assessment and monitoring, and enforcement (e.g., Cesar & van Beukering, 2004; Cesar, van Beukering, Dierking, Pintz, & Friedlander, 2004; Friedlander et al., 2005). These studies highlighted the importance and need for understanding user support and opposition toward management strategies designed to mitigate effects of recreation in coastal settings.
Traditional approaches for evaluating recreationists’ attitudes toward management strategies have simply involved asking users the extent to which they supported or opposed individual management strategies (Manning, 1999). Users may be asked, for example, whether they support or oppose providing more educational information such as signs, brochures, or orientation sessions (e.g., Lankford, Inui, Whittle, Luna, & Tyrone, 2005). These approaches, however, may result in a “ceiling effect” where almost all strategies are supported by most respondents, but actually implementing all strategies may not be logistically or financially feasible (Oh, 2001). Implementing a strategy may also not be possible without impacting something else. Therefore, there is a need in recreation management to understand the range of contextual factors and alternatives influencing management, and how the public responds to these factors. Given this complexity of recreation and tourism management, it may be more useful to examine users’ tradeoffs in their support of management strategies and regimes depending on a range of situational factors such as different levels of social, resource, and facility impacts. For example, if a coastal recreation site has adequate facilities, little crowding, and minimal coral reef impacts (i.e., situational factors), modifying any current management regimes may not be supported by users. Conversely, if the reef is damaged and the site is overcrowded, zoning or prohibiting some activities may be supported by users.
Recent research has used multivariate statistical techniques such as stated choice modeling and conjoint analysis to quantitatively measure the relative importance that users place on selected factors of recreation settings and the extent to which individuals make tradeoffs in their support of alternative management practices (e.g., Kneeshaw, Vaske, Bright, & Absher, 2004; Lawson, Roggenbuck, Hall, & Moldovanyi, 2006; Needham, 2008). Instead of asking users to rate their support for a single factor or attribute at one time, individuals choose among various scenarios describing alternative configurations of a set of factors. When evaluating each scenario, users weigh tradeoffs among the factors. This approach provides managers with an understanding of how users would prefer setting factors to be prioritized when preferred conditions cannot be provided for all factors simultaneously. In addition, this approach allows researchers and managers to rank alternative configurations of study factors from most acceptable to least acceptable for each management alternative (Lawson et al., 2006; Needham, 2008).
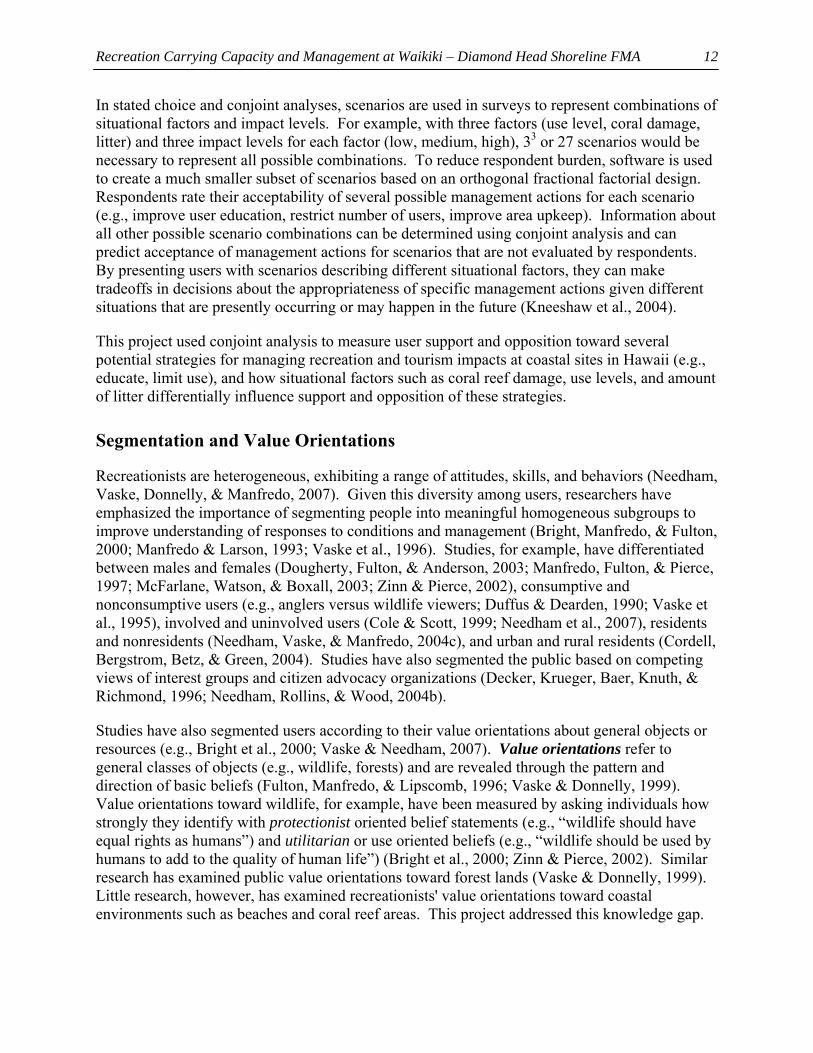
Recreation Carrying Capacity and Management at Waikiki – Diamond Head Shoreline FMA
12
In stated choice and conjoint analyses, scenarios are used in surveys to represent combinations of situational factors and impact levels. For example, with three factors (use level, coral damage, litter) and three impact levels for each factor (low, medium, high), 33 or 27 scenarios would be necessary to represent all possible combinations. To reduce respondent burden, software is used to create a much smaller subset of scenarios based on an orthogonal fractional factorial design. Respondents rate their acceptability of several possible management actions for each scenario (e.g., improve user education, restrict number of users, improve area upkeep). Information about all other possible scenario combinations can be determined using conjoint analysis and can predict acceptance of management actions for scenarios that are not evaluated by respondents. By presenting users with scenarios describing different situational factors, they can make tradeoffs in decisions about the appropriateness of specific management actions given different situations that are presently occurring or may happen in the future (Kneeshaw et al., 2004).
This project used conjoint analysis to measure user support and opposition toward several potential strategies for managing recreation and tourism impacts at coastal sites in Hawaii (e.g., educate, limit use), and how situational factors such as coral reef damage, use levels, and amount of litter differentially influence support and opposition of these strategies.
Segmentation and Value Orientations
Recreationists are heterogeneous, exhibiting a range of attitudes, skills, and behaviors (Needham, Vaske, Donnelly, & Manfredo, 2007). Given this diversity among users, researchers have emphasized the importance of segmenting people into meaningful homogeneous subgroups to improve understanding of responses to conditions and management (Bright, Manfredo, & Fulton, 2000; Manfredo & Larson, 1993; Vaske et al., 1996). Studies, for example, have differentiated between males and females (Dougherty, Fulton, & Anderson, 2003; Manfredo, Fulton, & Pierce, 1997; McFarlane, Watson, & Boxall, 2003; Zinn & Pierce, 2002), consumptive and nonconsumptive users (e.g., anglers versus wildlife viewers; Duffus & Dearden, 1990; Vaske et al., 1995), involved and uninvolved users (Cole & Scott, 1999; Needham et al., 2007), residents and nonresidents (Needham, Vaske, & Manfredo, 2004c), and urban and rural residents (Cordell, Bergstrom, Betz, & Green, 2004). Studies have also segmented the public based on competing views of interest groups and citizen advocacy organizations (Decker, Krueger, Baer, Knuth, & Richmond, 1996; Needham, Rollins, & Wood, 2004b).
Studies have also segmented users according to their value orientations about general objects or resources (e.g., Bright et al., 2000; Vaske & Needham, 2007). Value orientations refer to general classes of objects (e.g., wildlife, forests) and are revealed through the pattern and direction of basic beliefs (Fulton, Manfredo, & Lipscomb, 1996; Vaske & Donnelly, 1999). Value orientations toward wildlife, for example, have been measured by asking individuals how strongly they identify with protectionist oriented belief statements (e.g., “wildlife should have equal rights as humans”) and utilitarian or use oriented beliefs (e.g., “wildlife should be used by humans to add to the quality of human life”) (Bright et al., 2000; Zinn & Pierce, 2002). Similar research has examined public value orientations toward forest lands (Vaske & Donnelly, 1999). Little research, however, has examined recreationists' value orientations toward coastal environments such as beaches and coral reef areas. This project addressed this knowledge gap.
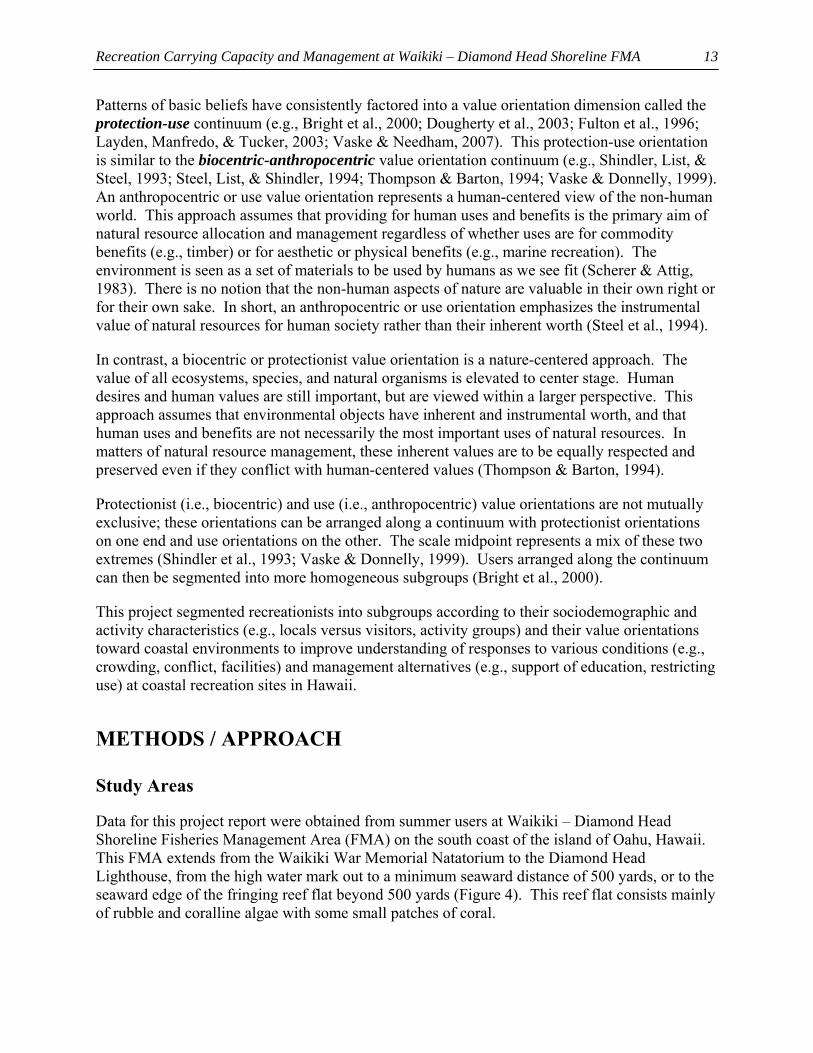
Recreation Carrying Capacity and Management at Waikiki – Diamond Head Shoreline FMA
13
Patterns of basic beliefs have consistently factored into a value orientation dimension called the protection-use continuum (e.g., Bright et al., 2000; Dougherty et al., 2003; Fulton et al., 1996; Layden, Manfredo, & Tucker, 2003; Vaske & Needham, 2007). This protection-use orientation is similar to the biocentric-anthropocentric value orientation continuum (e.g., Shindler, List, & Steel, 1993; Steel, List, & Shindler, 1994; Thompson & Barton, 1994; Vaske & Donnelly, 1999). An anthropocentric or use value orientation represents a human-centered view of the non-human world. This approach assumes that providing for human uses and benefits is the primary aim of natural resource allocation and management regardless of whether uses are for commodity benefits (e.g., timber) or for aesthetic or physical benefits (e.g., marine recreation). The environment is seen as a set of materials to be used by humans as we see fit (Scherer & Attig, 1983). There is no notion that the non-human aspects of nature are valuable in their own right or for their own sake. In short, an anthropocentric or use orientation emphasizes the instrumental value of natural resources for human society rather than their inherent worth (Steel et al., 1994).
In contrast, a biocentric or protectionist value orientation is a nature-centered approach. The value of all ecosystems, species, and natural organisms is elevated to center stage. Human desires and human values are still important, but are viewed within a larger perspective. This approach assumes that environmental objects have inherent and instrumental worth, and that human uses and benefits are not necessarily the most important uses of natural resources. In matters of natural resource management, these inherent values are to be equally respected and preserved even if they conflict with human-centered values (Thompson & Barton, 1994).
Protectionist (i.e., biocentric) and use (i.e., anthropocentric) value orientations are not mutually exclusive; these orientations can be arranged along a continuum with protectionist orientations on one end and use orientations on the other. The scale midpoint represents a mix of these two extremes (Shindler et al., 1993; Vaske & Donnelly, 1999). Users arranged along the continuum can then be segmented into more homogeneous subgroups (Bright et al., 2000).
This project segmented recreationists into subgroups according to their sociodemographic and activity characteristics (e.g., locals versus visitors, activity groups) and their value orientations toward coastal environments to improve understanding of responses to various conditions (e.g., crowding, conflict, facilities) and management alternatives (e.g., support of education, restricting use) at coastal recreation sites in Hawaii.
METHODS / APPROACH
Study Areas
Data for this project report were obtained from summer users at Waikiki – Diamond Head Shoreline Fisheries Management Area (FMA) on the south coast of the island of Oahu, Hawaii. This FMA extends from the Waikiki War Memorial Natatorium to the Diamond Head Lighthouse, from the high water mark out to a minimum seaward distance of 500 yards, or to the seaward edge of the fringing reef flat beyond 500 yards (Figure 4). This reef flat consists mainly of rubble and coralline algae with some small patches of coral.
Recreation Carrying Capacity and Management at Waikiki – Diamond Head Shoreline FMA
14
Figure 4. Map of Waikiki-Diamond Head Shoreline FMA
Fishing is allowed in this FMA on even numbered years, but the area is closed to fishing during odd numbered years. Fish are found on the shoreline, Natatorium wall, near exposed parts of the reef, and in a few submerged caves throughout the area. Sandy sediment on parts of the ocean floor makes visibility for snorkeling and diving best when there is little or no wave action in the area. High surf and swells, however, are common in this area especially during the summer, which limit opportunities for snorkeling and diving. These conditions tend to be more favorable for board sports such as surfing and windsurfing, which have become popular in this area especially during the summer months. This area also attracts sunbathers throughout the year.
Figure 5. Study site locations in Waikiki-Diamond Head Shoreline FMA
Recreation Carrying Capacity and Management at Waikiki – Diamond Head Shoreline FMA
15
This project focused on two main locations within and immediately adjacent to Waikiki – Diamond Head Shoreline FMA: (a) Sans Souci / Kaimana Beach, and (b) Diamond Head Beach Park and neighboring Kuilei Cliffs Beach Park (Figure 5). Sans Souci / Kaimana Beach is located immediately southeast of the Natatorium on the northwest end of the FMA in front of the New Otani Kaimana Beach Hotel and Colony Surf Apartments. Lifeguards are on duty and facilities include restrooms, showers, picnic tables, park benches, and pay telephones.
Diamond Head and Kuilei Cliffs Beaches are located on the southeast end of the FMA below the cliffs on which Diamond Head Lighthouse sits. This site consists of a long narrow beach, a few reefs, and habitat for fish and other marine life such as the Hawaiian monk seal. The beach area includes a shower and trash cans, but no restrooms or other facilities. Parking is available along Diamond Head Road, which is a short steep walk along paths from most of the beach area.
Data Collection
Data were obtained from surveys (Appendix A) administered onsite at two sites within and adjacent to Waikiki – Diamond Head Shoreline FMA: (a) Sans Souci / Kaimana Beach, and (b) Diamond Head Beach Park and neighboring Kuilei Cliffs Beach Park (Figure 5). Individuals at these sites during two weeks in July 2007 (July 9 to 22) and two weeks in August 2007 (August 2 to 15) were approached in parking areas and on the beach / shore, and asked to complete a survey onsite. Onsite surveys were required because personal contact information required for alternative approaches such as telephone or mail surveys was unavailable (e.g., anglers are not required to purchase fishing licenses in Hawaii, lifeguards rarely collect information about users). To increase probability of achieving a representative sample of summer users, sampling at the sites was alternated so that surveys were administered at each site at least once for each day of the week (i.e., Monday to Sunday) and at least once for each of three time periods each day (8:00 to 10:30 a.m., 11:30 a.m. to 2:00 p.m., 3:00 to 5:30 p.m.).
To minimize survey length and reduce respondent burden, it was necessary to develop two different survey versions to address all of the project objectives (Appendix A). Each respondent, however, was asked to complete only one version of the survey, not both versions. Given that use levels are relatively high at both sites, it was not feasible or necessary to survey every person at each site. As a result, individuals were selected through a systematic random sampling procedure (e.g., one random individual selected from every nth selected group). This reduced selection bias and is among the most widely accepted onsite sampling approaches for selecting a representative sample from a large number of recreationists (Salant & Dillman, 1994).
Users were asked if they would be willing to complete a survey, asked to read a letter of consent / recruitment, and then asked to complete and return the survey onsite. The survey version (i.e., version 1 or 2) that respondents received was systematically alternated (e.g., first person selected received version 1, the next person received version 2, the next person received version 1, etc.). Each survey version was printed in color on one legal sized (8 ½ x 14) piece of paper printed on both sides. Surveys took respondents less than 15 minutes to complete. Respondents were provided with a clipboard and pen to complete a survey onsite. This approach is consistent with research in recreation and human dimensions of natural resources (Mitra & Lankford, 1999).
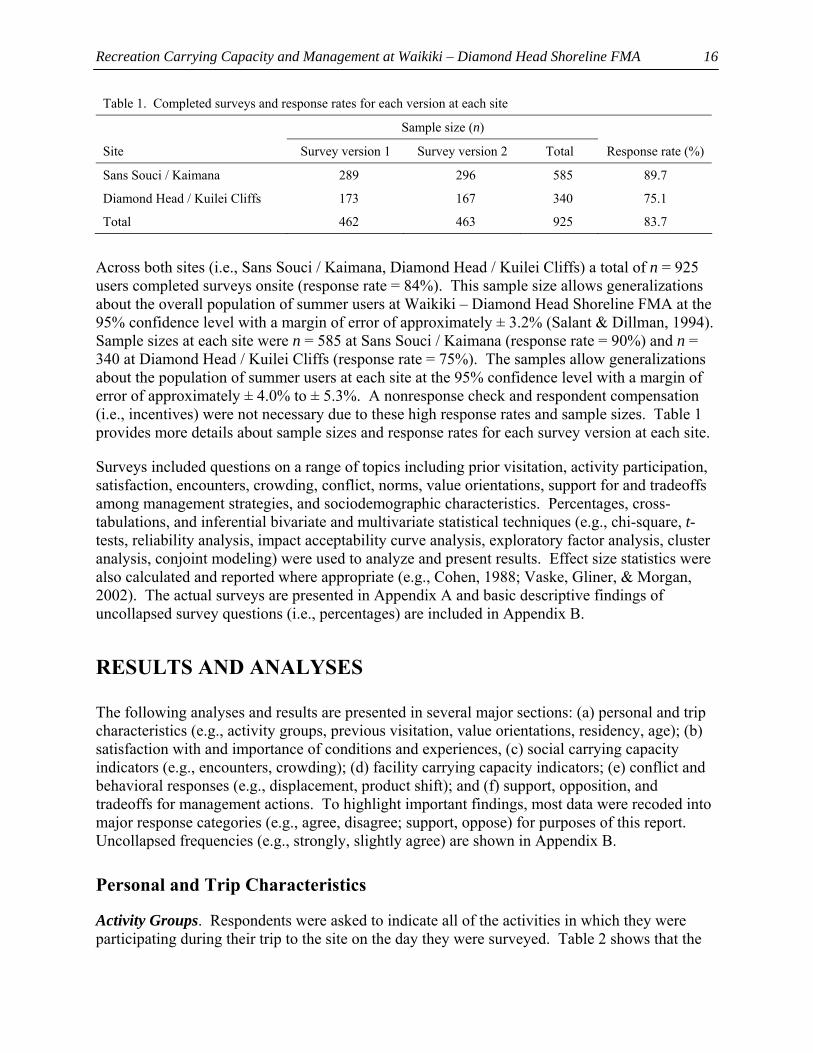
Recreation Carrying Capacity and Management at Waikiki – Diamond Head Shoreline FMA
16
Table 1. Completed surveys and response rates for each version at each site
Sample size (n)
Site Survey version 1 Survey version 2 Total Response rate (%)
Sans Souci / Kaimana 289 296 585 89.7
Diamond Head / Kuilei Cliffs 173 167 340 75.1
Total 462 463 925 83.7
Across both sites (i.e., Sans Souci / Kaimana, Diamond Head / Kuilei Cliffs) a total of n = 925 users completed surveys onsite (response rate = 84%). This sample size allows generalizations about the overall population of summer users at Waikiki – Diamond Head Shoreline FMA at the 95% confidence level with a margin of error of approximately ± 3.2% (Salant & Dillman, 1994). Sample sizes at each site were n = 585 at Sans Souci / Kaimana (response rate = 90%) and n = 340 at Diamond Head / Kuilei Cliffs (response rate = 75%). The samples allow generalizations about the population of summer users at each site at the 95% confidence level with a margin of error of approximately ± 4.0% to ± 5.3%. A nonresponse check and respondent compensation (i.e., incentives) were not necessary due to these high response rates and sample sizes. Table 1 provides more details about sample sizes and response rates for each survey version at each site.
Surveys included questions on a range of topics including prior visitation, activity participation, satisfaction, encounters, crowding, conflict, norms, value orientations, support for and tradeoffs among management strategies, and sociodemographic characteristics. Percentages, cross-tabulations, and inferential bivariate and multivariate statistical techniques (e.g., chi-square, t-tests, reliability analysis, impact acceptability curve analysis, exploratory factor analysis, cluster analysis, conjoint modeling) were used to analyze and present results. Effect size statistics were also calculated and reported where appropriate (e.g., Cohen, 1988; Vaske, Gliner, & Morgan, 2002). The actual surveys are presented in Appendix A and basic descriptive findings of uncollapsed survey questions (i.e., percentages) are included in Appendix B.
RESULTS AND ANALYSES
The following analyses and results are presented in several major sections: (a) personal and trip characteristics (e.g., activity groups, previous visitation, value orientations, residency, age); (b) satisfaction with and importance of conditions and experiences, (c) social carrying capacity indicators (e.g., encounters, crowding); (d) facility carrying capacity indicators; (e) conflict and behavioral responses (e.g., displacement, product shift); and (f) support, opposition, and tradeoffs for management actions. To highlight important findings, most data were recoded into major response categories (e.g., agree, disagree; support, oppose) for purposes of this report. Uncollapsed frequencies (e.g., strongly, slightly agree) are shown in Appendix B.
Personal and Trip Characteristics
Activity Groups. Respondents were asked to indicate all of the activities in which they were participating during their trip to the site on the day they were surveyed. Table 2 shows that the
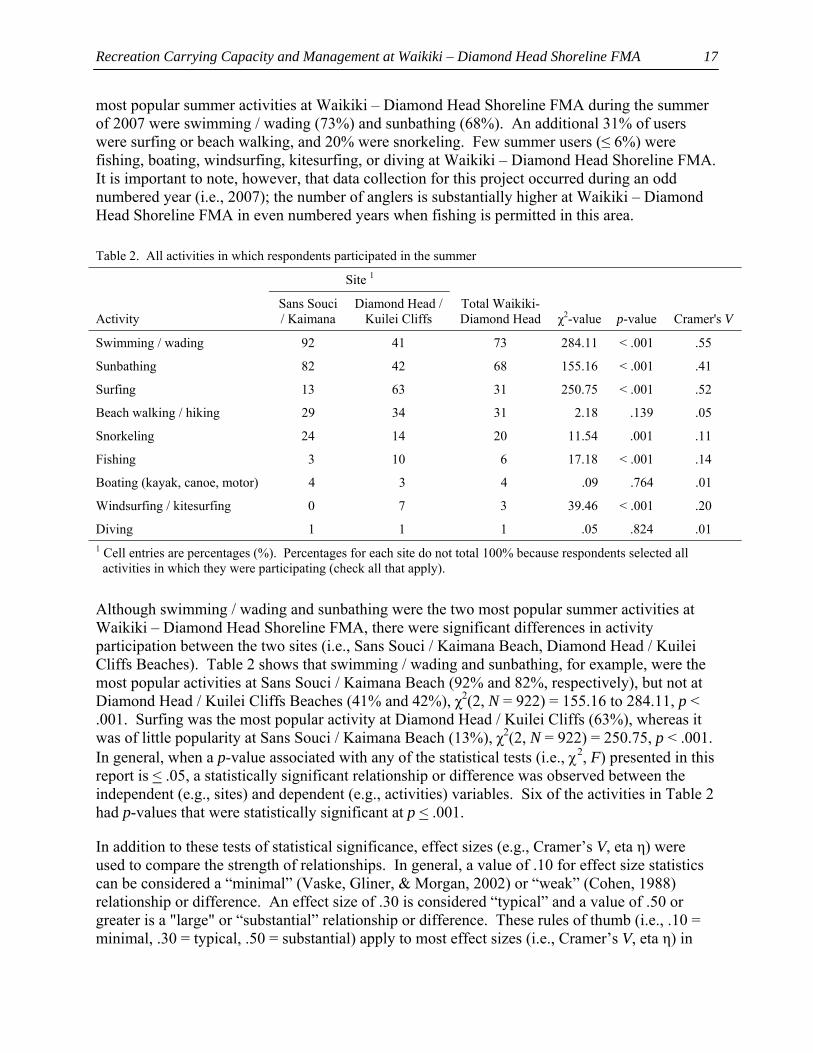
Recreation Carrying Capacity and Management at Waikiki – Diamond Head Shoreline FMA
17
most popular summer activities at Waikiki – Diamond Head Shoreline FMA during the summer of 2007 were swimming / wading (73%) and sunbathing (68%). An additional 31% of users were surfing or beach walking, and 20% were snorkeling. Few summer users (≤ 6%) were fishing, boating, windsurfing, kitesurfing, or diving at Waikiki – Diamond Head Shoreline FMA. It is important to note, however, that data collection for this project occurred during an odd numbered year (i.e., 2007); the number of anglers is substantially higher at Waikiki – Diamond Head Shoreline FMA in even numbered years when fishing is permitted in this area.
Table 2. All activities in which respondents participated in the summer
Site 1
Activity
Sans Souci / Kaimana
Diamond Head / Kuilei Cliffs
Total Waikiki-Diamond Head
χ2-value
p-value
Cramer's V
Swimming / wading 92 41 73 284.11 < .001 .55
Sunbathing 82 42 68 155.16 < .001 .41
Surfing 13 63 31 250.75 < .001 .52
Beach walking / hiking 29 34 31 2.18 .139 .05
Snorkeling 24 14 20 11.54 .001 .11
Fishing 3 10 6 17.18 < .001 .14
Boating (kayak, canoe, motor) 4 3 4 .09 .764 .01
Windsurfing / kitesurfing 0 7 3 39.46 < .001 .20
Diving 1 1 1 .05 .824 .01 1 Cell entries are percentages (%). Percentages for each site do not total 100% because respondents selected all activities in which they were participating (check all that apply).
Although swimming / wading and sunbathing were the two most popular summer activities at Waikiki – Diamond Head Shoreline FMA, there were significant differences in activity participation between the two sites (i.e., Sans Souci / Kaimana Beach, Diamond Head / Kuilei Cliffs Beaches). Table 2 shows that swimming / wading and sunbathing, for example, were the most popular activities at Sans Souci / Kaimana Beach (92% and 82%, respectively), but not at Diamond Head / Kuilei Cliffs Beaches (41% and 42%), χ2(2, N = 922) = 155.16 to 284.11, p < .001. Surfing was the most popular activity at Diamond Head / Kuilei Cliffs (63%), whereas it was of little popularity at Sans Souci / Kaimana Beach (13%), χ2(2, N = 922) = 250.75, p < .001. In general, when a p-value associated with any of the statistical tests (i.e., χ2, F) presented in this report is < .05, a statistically significant relationship or difference was observed between the independent (e.g., sites) and dependent (e.g., activities) variables. Six of the activities in Table 2 had p-values that were statistically significant at p < .001.
In addition to these tests of statistical significance, effect sizes (e.g., Cramer’s V, eta η) were used to compare the strength of relationships. In general, a value of .10 for effect size statistics can be considered a “minimal” (Vaske, Gliner, & Morgan, 2002) or “weak” (Cohen, 1988) relationship or difference. An effect size of .30 is considered “typical” and a value of .50 or greater is a "large" or “substantial” relationship or difference. These rules of thumb (i.e., .10 = minimal, .30 = typical, .50 = substantial) apply to most effect sizes (i.e., Cramer’s V, eta η) in
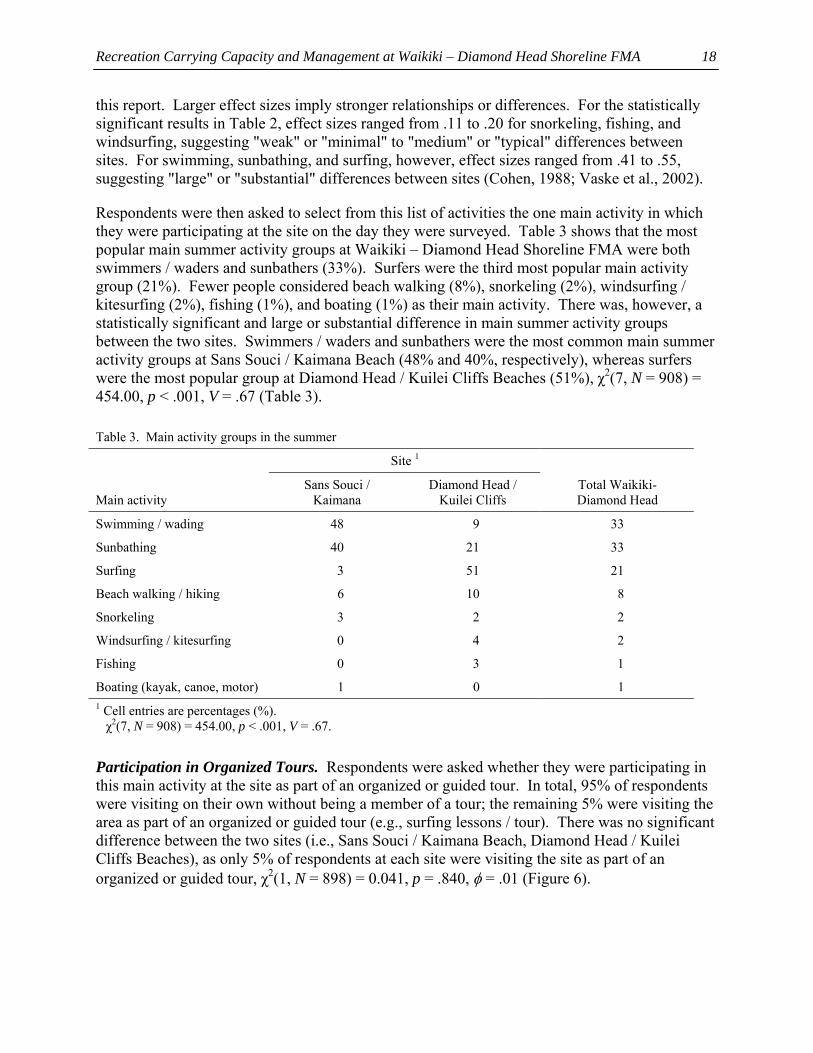
Recreation Carrying Capacity and Management at Waikiki – Diamond Head Shoreline FMA
18
this report. Larger effect sizes imply stronger relationships or differences. For the statistically significant results in Table 2, effect sizes ranged from .11 to .20 for snorkeling, fishing, and windsurfing, suggesting "weak" or "minimal" to "medium" or "typical" differences between sites. For swimming, sunbathing, and surfing, however, effect sizes ranged from .41 to .55, suggesting "large" or "substantial" differences between sites (Cohen, 1988; Vaske et al., 2002).
Respondents were then asked to select from this list of activities the one main activity in which they were participating at the site on the day they were surveyed. Table 3 shows that the most popular main summer activity groups at Waikiki – Diamond Head Shoreline FMA were both swimmers / waders and sunbathers (33%). Surfers were the third most popular main activity group (21%). Fewer people considered beach walking (8%), snorkeling (2%), windsurfing / kitesurfing (2%), fishing (1%), and boating (1%) as their main activity. There was, however, a statistically significant and large or substantial difference in main summer activity groups between the two sites. Swimmers / waders and sunbathers were the most common main summer activity groups at Sans Souci / Kaimana Beach (48% and 40%, respectively), whereas surfers were the most popular group at Diamond Head / Kuilei Cliffs Beaches (51%), χ2(7, N = 908) = 454.00, p < .001, V = .67 (Table 3).
Table 3. Main activity groups in the summer
Site 1
Main activity
Sans Souci / Kaimana
Diamond Head / Kuilei Cliffs
Total Waikiki- Diamond Head
Swimming / wading 48 9 33
Sunbathing 40 21 33
Surfing 3 51 21
Beach walking / hiking 6 10 8
Snorkeling 3 2 2
Windsurfing / kitesurfing 0 4 2
Fishing 0 3 1
Boating (kayak, canoe, motor) 1 0 1 1 Cell entries are percentages (%). χ2(7, N = 908) = 454.00, p < .001, V = .67.
Participation in Organized Tours. Respondents were asked whether they were participating in this main activity at the site as part of an organized or guided tour. In total, 95% of respondents were visiting on their own without being a member of a tour; the remaining 5% were visiting the area as part of an organized or guided tour (e.g., surfing lessons / tour). There was no significant difference between the two sites (i.e., Sans Souci / Kaimana Beach, Diamond Head / Kuilei Cliffs Beaches), as only 5% of respondents at each site were visiting the site as part of an organized or guided tour, χ2(1, N = 898) = 0.041, p = .840, φ = .01 (Figure 6).
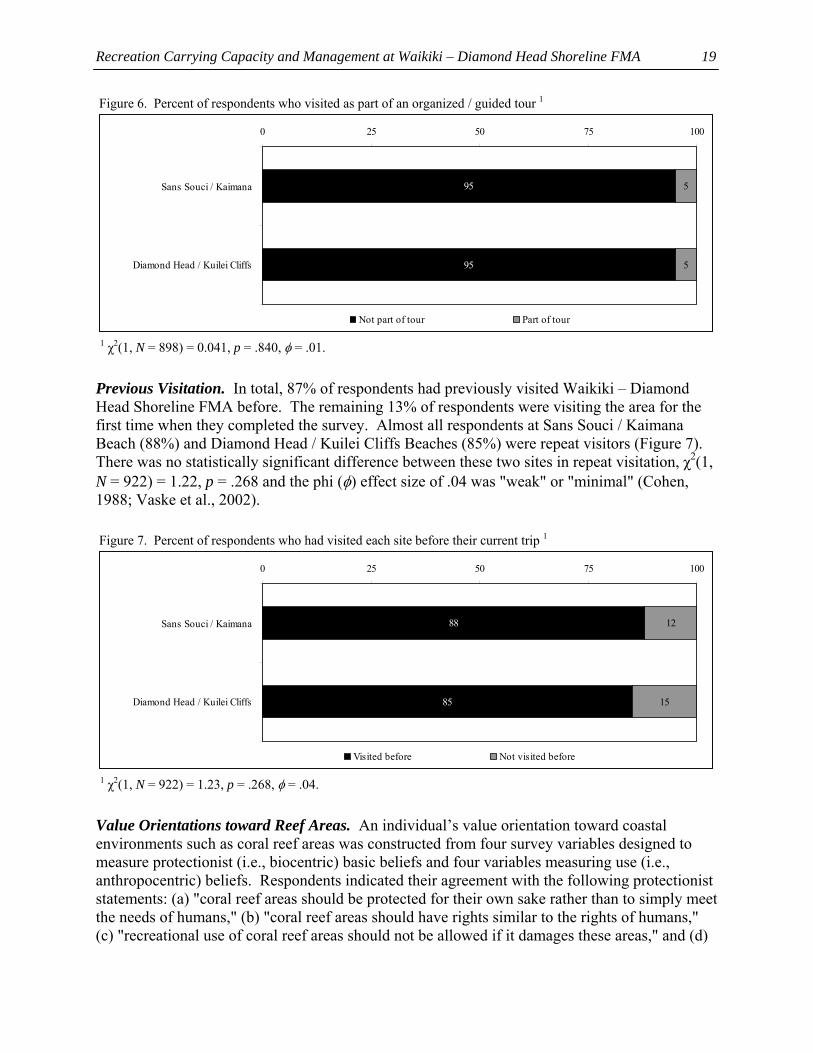
Recreation Carrying Capacity and Management at Waikiki – Diamond Head Shoreline FMA
19
Figure 6. Percent of respondents who visited as part of an organized / guided tour 1
95
95
5
5
0 25 50 75 100
Sans Souci / Kaimana
Diamond Head / Kuilei Cliffs
Not part of tour Part of tour
1 χ2(1, N = 898) = 0.041, p = .840, φ = .01.
Previous Visitation. In total, 87% of respondents had previously visited Waikiki – Diamond Head Shoreline FMA before. The remaining 13% of respondents were visiting the area for the first time when they completed the survey. Almost all respondents at Sans Souci / Kaimana Beach (88%) and Diamond Head / Kuilei Cliffs Beaches (85%) were repeat visitors (Figure 7). There was no statistically significant difference between these two sites in repeat visitation, χ2(1, N = 922) = 1.22, p = .268 and the phi (φ) effect size of .04 was "weak" or "minimal" (Cohen, 1988; Vaske et al., 2002).
Figure 7. Percent of respondents who had visited each site before their current trip 1
88
85
12
15
0 25 50 75 100
Sans Souci / Kaimana
Diamond Head / Kuilei Cliffs
Visited before Not visited before
1 χ2(1, N = 922) = 1.23, p = .268, φ = .04.
Value Orientations toward Reef Areas. An individual’s value orientation toward coastal environments such as coral reef areas was constructed from four survey variables designed to measure protectionist (i.e., biocentric) basic beliefs and four variables measuring use (i.e., anthropocentric) beliefs. Respondents indicated their agreement with the following protectionist statements: (a) "coral reef areas should be protected for their own sake rather than to simply meet the needs of humans," (b) "coral reef areas should have rights similar to the rights of humans," (c) "recreational use of coral reef areas should not be allowed if it damages these areas," and (d)
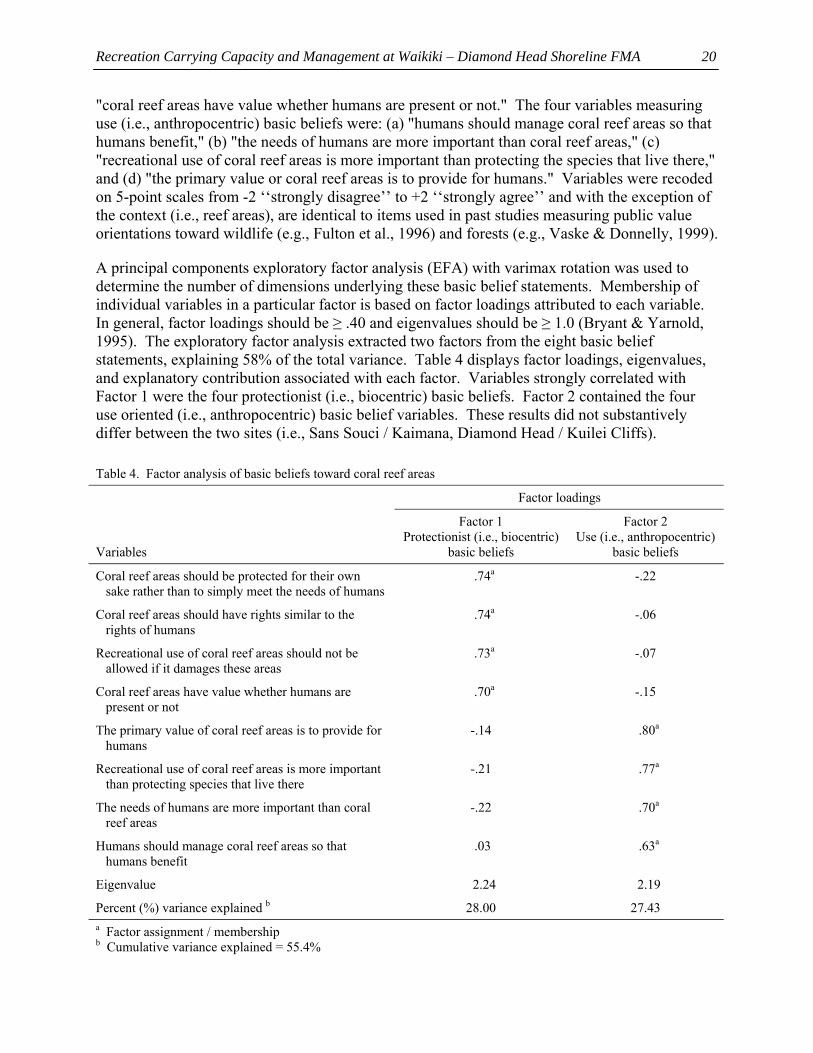
Recreation Carrying Capacity and Management at Waikiki – Diamond Head Shoreline FMA
20
"coral reef areas have value whether humans are present or not." The four variables measuring use (i.e., anthropocentric) basic beliefs were: (a) "humans should manage coral reef areas so that humans benefit," (b) "the needs of humans are more important than coral reef areas," (c) "recreational use of coral reef areas is more important than protecting the species that live there," and (d) "the primary value or coral reef areas is to provide for humans." Variables were recoded on 5-point scales from -2 ‘‘strongly disagree’’ to +2 ‘‘strongly agree’’ and with the exception of the context (i.e., reef areas), are identical to items used in past studies measuring public value orientations toward wildlife (e.g., Fulton et al., 1996) and forests (e.g., Vaske & Donnelly, 1999).
A principal components exploratory factor analysis (EFA) with varimax rotation was used to determine the number of dimensions underlying these basic belief statements. Membership of individual variables in a particular factor is based on factor loadings attributed to each variable. In general, factor loadings should be ≥ .40 and eigenvalues should be ≥ 1.0 (Bryant & Yarnold, 1995). The exploratory factor analysis extracted two factors from the eight basic belief statements, explaining 58% of the total variance. Table 4 displays factor loadings, eigenvalues, and explanatory contribution associated with each factor. Variables strongly correlated with Factor 1 were the four protectionist (i.e., biocentric) basic beliefs. Factor 2 contained the four use oriented (i.e., anthropocentric) basic belief variables. These results did not substantively differ between the two sites (i.e., Sans Souci / Kaimana, Diamond Head / Kuilei Cliffs).
Table 4. Factor analysis of basic beliefs toward coral reef areas
Factor loadings
Variables
Factor 1 Protectionist (i.e., biocentric)
basic beliefs
Factor 2 Use (i.e., anthropocentric)
basic beliefs
Coral reef areas should be protected for their own sake rather than to simply meet the needs of humans
.74a -.22
Coral reef areas should have rights similar to the rights of humans
.74a -.06
Recreational use of coral reef areas should not be allowed if it damages these areas
.73a -.07
Coral reef areas have value whether humans are present or not
.70a -.15
The primary value of coral reef areas is to provide for humans
-.14 .80a
Recreational use of coral reef areas is more important than protecting species that live there
-.21 .77a
The needs of humans are more important than coral reef areas
-.22 .70a
Humans should manage coral reef areas so that humans benefit
.03 .63a
Eigenvalue 2.24 2.19
Percent (%) variance explained b 28.00 27.43 a Factor assignment / membership b Cumulative variance explained = 55.4%
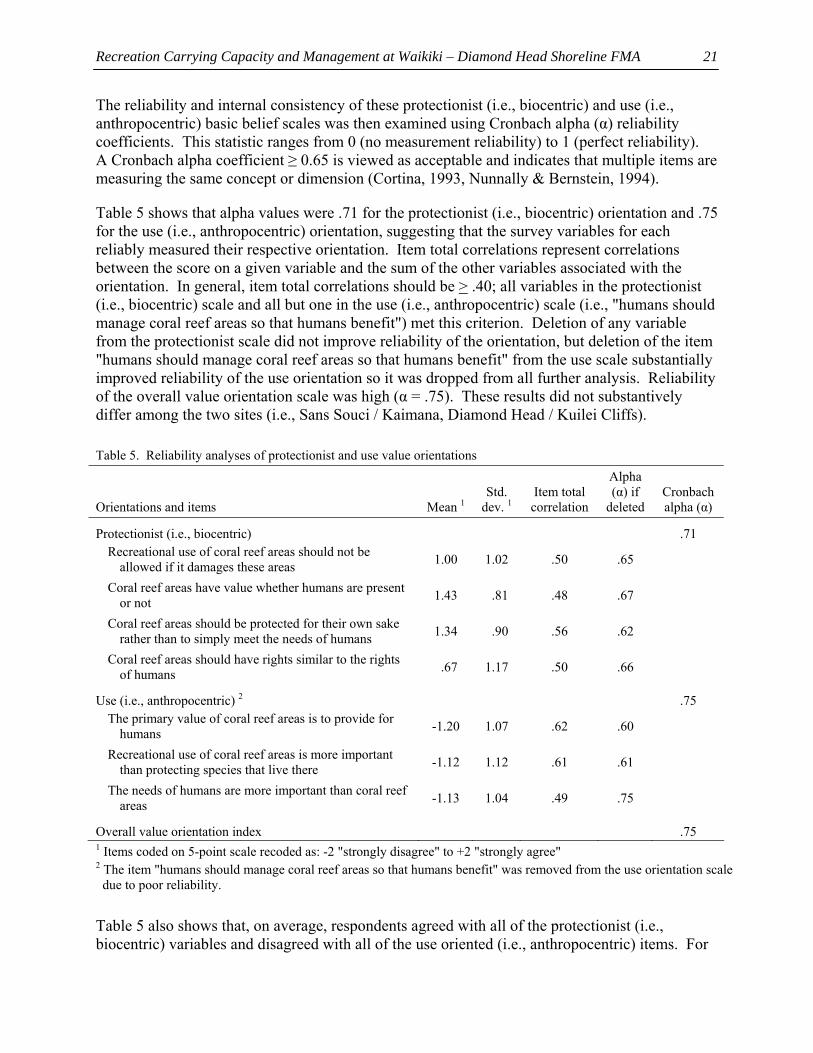
Recreation Carrying Capacity and Management at Waikiki – Diamond Head Shoreline FMA
21
The reliability and internal consistency of these protectionist (i.e., biocentric) and use (i.e., anthropocentric) basic belief scales was then examined using Cronbach alpha (α) reliability coefficients. This statistic ranges from 0 (no measurement reliability) to 1 (perfect reliability). A Cronbach alpha coefficient ≥ 0.65 is viewed as acceptable and indicates that multiple items are measuring the same concept or dimension (Cortina, 1993, Nunnally & Bernstein, 1994).
Table 5 shows that alpha values were .71 for the protectionist (i.e., biocentric) orientation and .75 for the use (i.e., anthropocentric) orientation, suggesting that the survey variables for each reliably measured their respective orientation. Item total correlations represent correlations between the score on a given variable and the sum of the other variables associated with the orientation. In general, item total correlations should be > .40; all variables in the protectionist (i.e., biocentric) scale and all but one in the use (i.e., anthropocentric) scale (i.e., "humans should manage coral reef areas so that humans benefit") met this criterion. Deletion of any variable from the protectionist scale did not improve reliability of the orientation, but deletion of the item "humans should manage coral reef areas so that humans benefit" from the use scale substantially improved reliability of the use orientation so it was dropped from all further analysis. Reliability of the overall value orientation scale was high (α = .75). These results did not substantively differ among the two sites (i.e., Sans Souci / Kaimana, Diamond Head / Kuilei Cliffs).
Table 5. Reliability analyses of protectionist and use value orientations Orientations and items
Mean 1
Std.
dev. 1
Item total correlation
Alpha (α) if
deleted
Cronbachalpha (α)
Protectionist (i.e., biocentric) .71 Recreational use of coral reef areas should not be
allowed if it damages these areas 1.00 1.02 .50 .65
Coral reef areas have value whether humans are present or not 1.43 .81 .48 .67
Coral reef areas should be protected for their own sake rather than to simply meet the needs of humans 1.34 .90 .56 .62
Coral reef areas should have rights similar to the rights of humans .67 1.17 .50 .66
Use (i.e., anthropocentric) 2 .75 The primary value of coral reef areas is to provide for
humans -1.20 1.07 .62 .60
Recreational use of coral reef areas is more important than protecting species that live there -1.12 1.12 .61 .61
The needs of humans are more important than coral reef areas -1.13 1.04 .49 .75
Overall value orientation index .75 1 Items coded on 5-point scale recoded as: -2 "strongly disagree" to +2 "strongly agree" 2 The item "humans should manage coral reef areas so that humans benefit" was removed from the use orientation scale due to poor reliability.
Table 5 also shows that, on average, respondents agreed with all of the protectionist (i.e., biocentric) variables and disagreed with all of the use oriented (i.e., anthropocentric) items. For
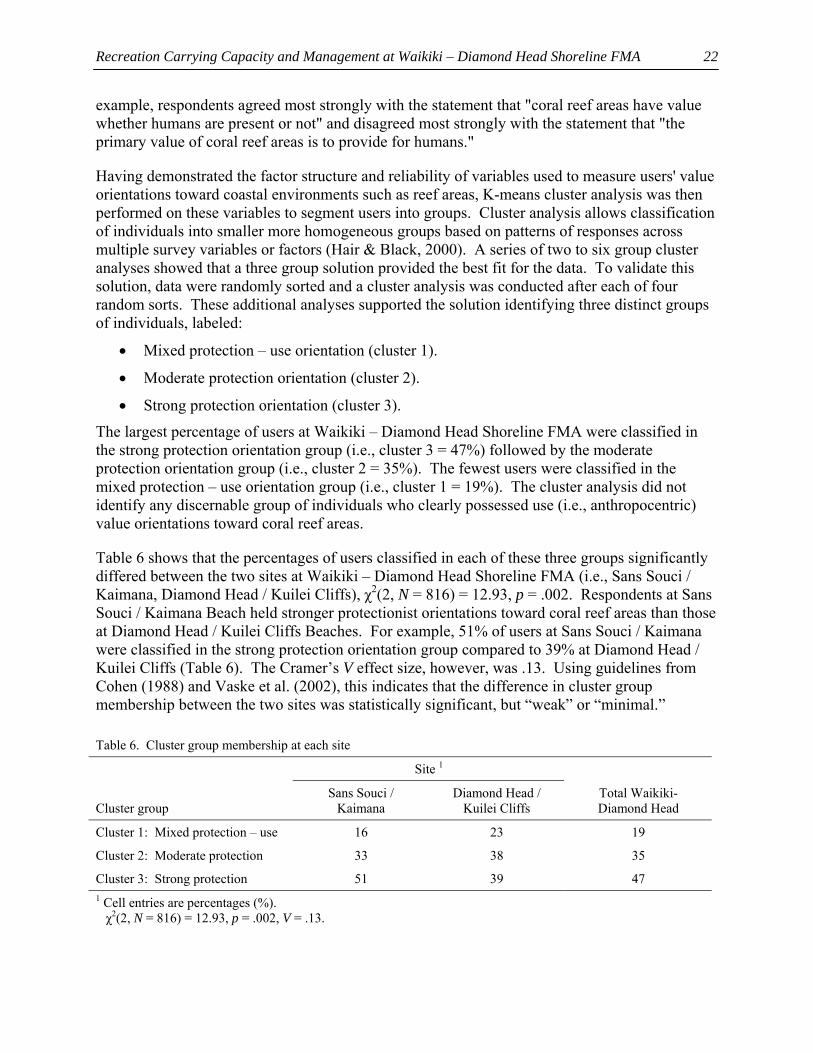
Recreation Carrying Capacity and Management at Waikiki – Diamond Head Shoreline FMA
22
example, respondents agreed most strongly with the statement that "coral reef areas have value whether humans are present or not" and disagreed most strongly with the statement that "the primary value of coral reef areas is to provide for humans."
Having demonstrated the factor structure and reliability of variables used to measure users' value orientations toward coastal environments such as reef areas, K-means cluster analysis was then performed on these variables to segment users into groups. Cluster analysis allows classification of individuals into smaller more homogeneous groups based on patterns of responses across multiple survey variables or factors (Hair & Black, 2000). A series of two to six group cluster analyses showed that a three group solution provided the best fit for the data. To validate this solution, data were randomly sorted and a cluster analysis was conducted after each of four random sorts. These additional analyses supported the solution identifying three distinct groups of individuals, labeled:
• Mixed protection – use orientation (cluster 1).
• Moderate protection orientation (cluster 2).
• Strong protection orientation (cluster 3).
The largest percentage of users at Waikiki – Diamond Head Shoreline FMA were classified in the strong protection orientation group (i.e., cluster 3 = 47%) followed by the moderate protection orientation group (i.e., cluster 2 = 35%). The fewest users were classified in the mixed protection – use orientation group (i.e., cluster 1 = 19%). The cluster analysis did not identify any discernable group of individuals who clearly possessed use (i.e., anthropocentric) value orientations toward coral reef areas.
Table 6 shows that the percentages of users classified in each of these three groups significantly differed between the two sites at Waikiki – Diamond Head Shoreline FMA (i.e., Sans Souci / Kaimana, Diamond Head / Kuilei Cliffs), χ2(2, N = 816) = 12.93, p = .002. Respondents at Sans Souci / Kaimana Beach held stronger protectionist orientations toward coral reef areas than those at Diamond Head / Kuilei Cliffs Beaches. For example, 51% of users at Sans Souci / Kaimana were classified in the strong protection orientation group compared to 39% at Diamond Head / Kuilei Cliffs (Table 6). The Cramer’s V effect size, however, was .13. Using guidelines from Cohen (1988) and Vaske et al. (2002), this indicates that the difference in cluster group membership between the two sites was statistically significant, but “weak” or “minimal.”
Table 6. Cluster group membership at each site
Site 1
Cluster group
Sans Souci / Kaimana
Diamond Head / Kuilei Cliffs
Total Waikiki- Diamond Head
Cluster 1: Mixed protection – use 16 23 19
Cluster 2: Moderate protection 33 38 35
Cluster 3: Strong protection 51 39 47 1 Cell entries are percentages (%). χ2(2, N = 816) = 12.93, p = .002, V = .13.
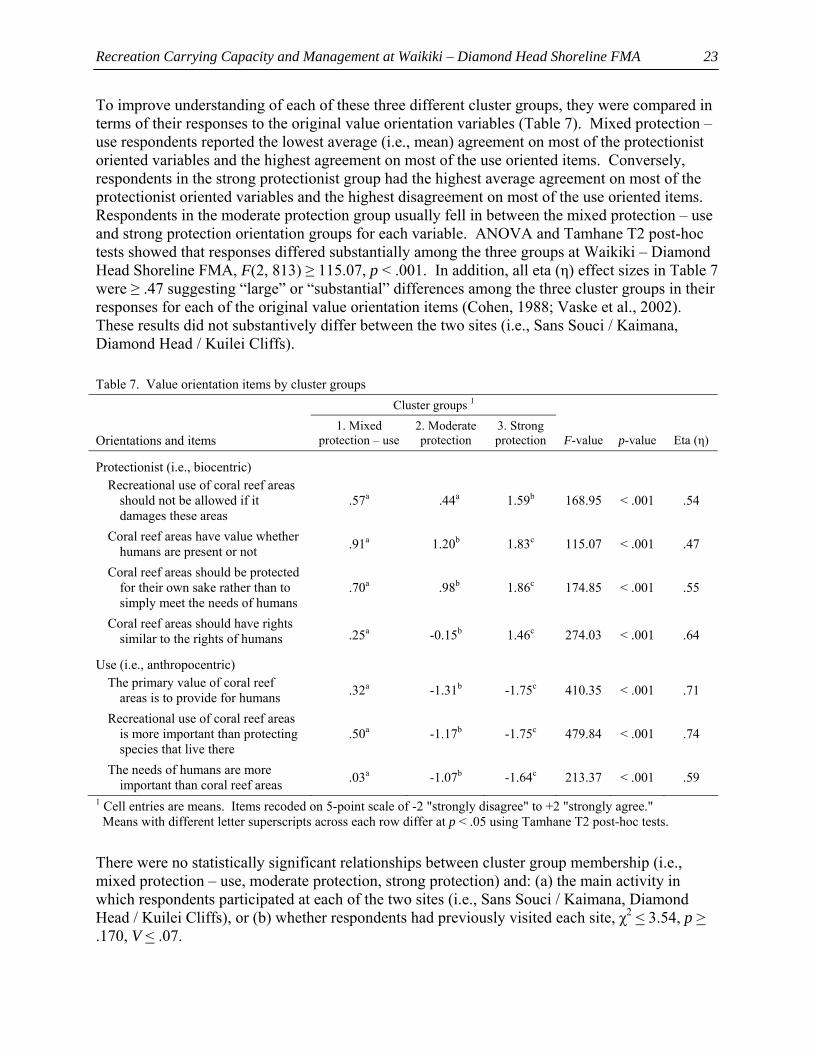
Recreation Carrying Capacity and Management at Waikiki – Diamond Head Shoreline FMA
23
To improve understanding of each of these three different cluster groups, they were compared in terms of their responses to the original value orientation variables (Table 7). Mixed protection – use respondents reported the lowest average (i.e., mean) agreement on most of the protectionist oriented variables and the highest agreement on most of the use oriented items. Conversely, respondents in the strong protectionist group had the highest average agreement on most of the protectionist oriented variables and the highest disagreement on most of the use oriented items. Respondents in the moderate protection group usually fell in between the mixed protection – use and strong protection orientation groups for each variable. ANOVA and Tamhane T2 post-hoc tests showed that responses differed substantially among the three groups at Waikiki – Diamond Head Shoreline FMA, F(2, 813) ≥ 115.07, p < .001. In addition, all eta (η) effect sizes in Table 7 were ≥ .47 suggesting “large” or “substantial” differences among the three cluster groups in their responses for each of the original value orientation items (Cohen, 1988; Vaske et al., 2002). These results did not substantively differ between the two sites (i.e., Sans Souci / Kaimana, Diamond Head / Kuilei Cliffs).
Table 7. Value orientation items by cluster groups Cluster groups 1 Orientations and items
1. Mixed protection – use
2. Moderate protection
3. Strong protection
F-value
p-value
Eta (η)
Protectionist (i.e., biocentric) Recreational use of coral reef areas
should not be allowed if it damages these areas
.57a .44a 1.59b 168.95 < .001 .54
Coral reef areas have value whether humans are present or not .91a 1.20b 1.83c 115.07 < .001 .47
Coral reef areas should be protected for their own sake rather than to simply meet the needs of humans
.70a .98b 1.86c 174.85 < .001 .55
Coral reef areas should have rights similar to the rights of humans .25a -0.15b 1.46c 274.03 < .001 .64
Use (i.e., anthropocentric) The primary value of coral reef
areas is to provide for humans .32a -1.31b -1.75c 410.35 < .001 .71
Recreational use of coral reef areas is more important than protecting species that live there
.50a -1.17b -1.75c 479.84 < .001 .74
The needs of humans are more important than coral reef areas .03a -1.07b -1.64c 213.37 < .001 .59
1 Cell entries are means. Items recoded on 5-point scale of -2 "strongly disagree" to +2 "strongly agree." Means with different letter superscripts across each row differ at p < .05 using Tamhane T2 post-hoc tests.
There were no statistically significant relationships between cluster group membership (i.e., mixed protection – use, moderate protection, strong protection) and: (a) the main activity in which respondents participated at each of the two sites (i.e., Sans Souci / Kaimana, Diamond Head / Kuilei Cliffs), or (b) whether respondents had previously visited each site, χ2 < 3.54, p > .170, V < .07.
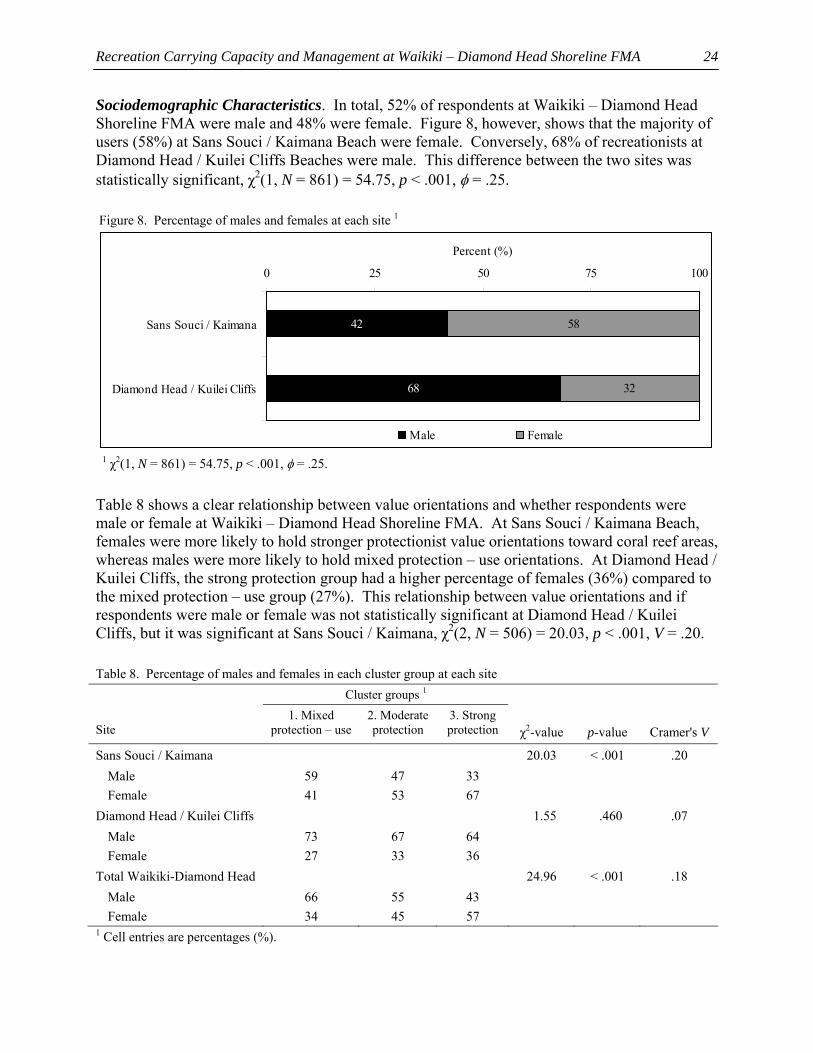
Recreation Carrying Capacity and Management at Waikiki – Diamond Head Shoreline FMA
24
Sociodemographic Characteristics. In total, 52% of respondents at Waikiki – Diamond Head Shoreline FMA were male and 48% were female. Figure 8, however, shows that the majority of users (58%) at Sans Souci / Kaimana Beach were female. Conversely, 68% of recreationists at Diamond Head / Kuilei Cliffs Beaches were male. This difference between the two sites was statistically significant, χ2(1, N = 861) = 54.75, p < .001, φ = .25.
Figure 8. Percentage of males and females at each site 1
42
68
58
32
0 25 50 75 100
Sans Souci / Kaimana
Diamond Head / Kuilei Cliffs
Percent (%)
Male Female
1 χ2(1, N = 861) = 54.75, p < .001, φ = .25.
Table 8 shows a clear relationship between value orientations and whether respondents were male or female at Waikiki – Diamond Head Shoreline FMA. At Sans Souci / Kaimana Beach, females were more likely to hold stronger protectionist value orientations toward coral reef areas, whereas males were more likely to hold mixed protection – use orientations. At Diamond Head / Kuilei Cliffs, the strong protection group had a higher percentage of females (36%) compared to the mixed protection – use group (27%). This relationship between value orientations and if respondents were male or female was not statistically significant at Diamond Head / Kuilei Cliffs, but it was significant at Sans Souci / Kaimana, χ2(2, N = 506) = 20.03, p < .001, V = .20.
Table 8. Percentage of males and females in each cluster group at each site Cluster groups 1 Site
1. Mixed protection – use
2. Moderate protection
3. Strong protection
χ2-value
p-value
Cramer's V
Sans Souci / Kaimana 20.03 < .001 .20 Male 59 47 33 Female 41 53 67
Diamond Head / Kuilei Cliffs 1.55 .460 .07 Male 73 67 64 Female 27 33 36
Total Waikiki-Diamond Head 24.96 < .001 .18 Male 66 55 43 Female 34 45 57
1 Cell entries are percentages (%).
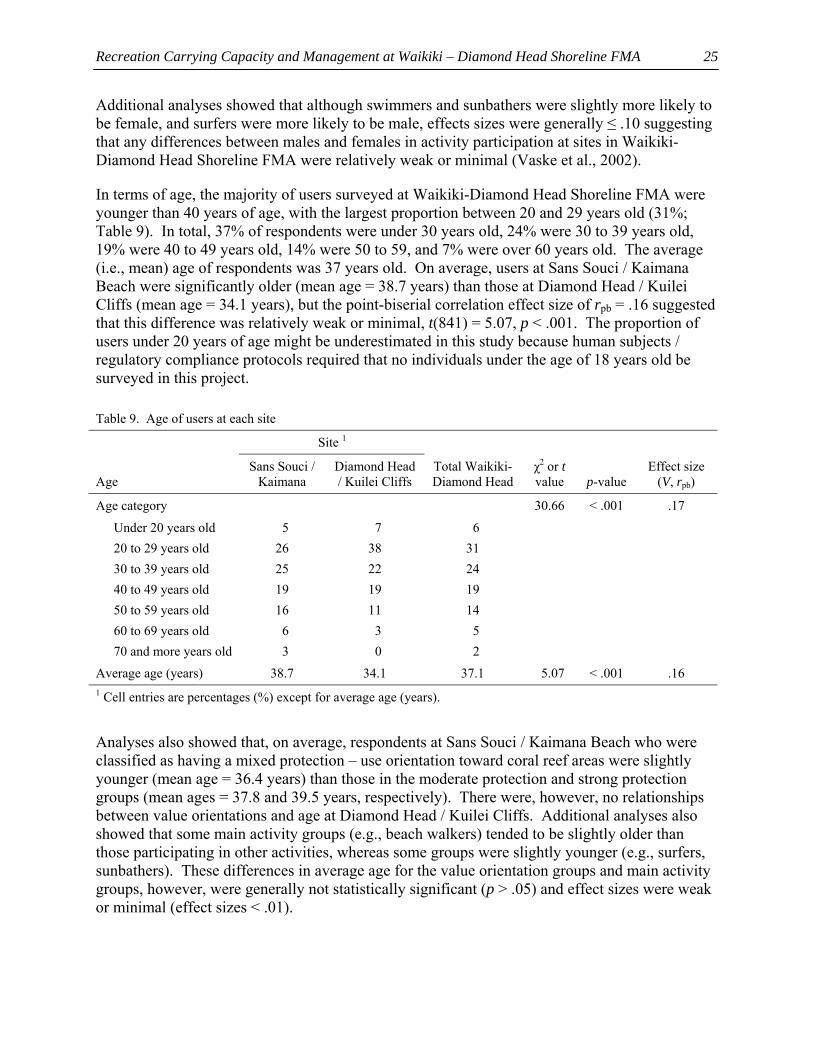
Recreation Carrying Capacity and Management at Waikiki – Diamond Head Shoreline FMA
25
Additional analyses showed that although swimmers and sunbathers were slightly more likely to be female, and surfers were more likely to be male, effects sizes were generally ≤ .10 suggesting that any differences between males and females in activity participation at sites in Waikiki-Diamond Head Shoreline FMA were relatively weak or minimal (Vaske et al., 2002).
In terms of age, the majority of users surveyed at Waikiki-Diamond Head Shoreline FMA were younger than 40 years of age, with the largest proportion between 20 and 29 years old (31%; Table 9). In total, 37% of respondents were under 30 years old, 24% were 30 to 39 years old, 19% were 40 to 49 years old, 14% were 50 to 59, and 7% were over 60 years old. The average (i.e., mean) age of respondents was 37 years old. On average, users at Sans Souci / Kaimana Beach were significantly older (mean age = 38.7 years) than those at Diamond Head / Kuilei Cliffs (mean age = 34.1 years), but the point-biserial correlation effect size of rpb = .16 suggested that this difference was relatively weak or minimal, t(841) = 5.07, p < .001. The proportion of users under 20 years of age might be underestimated in this study because human subjects / regulatory compliance protocols required that no individuals under the age of 18 years old be surveyed in this project.
Table 9. Age of users at each site
Site 1
Age
Sans Souci / Kaimana
Diamond Head / Kuilei Cliffs
Total Waikiki-Diamond Head
χ2 or t value
p-value
Effect size (V, rpb)
Age category 30.66 < .001 .17
Under 20 years old 5 7 6 20 to 29 years old 26 38 31 30 to 39 years old 25 22 24 40 to 49 years old 19 19 19 50 to 59 years old 16 11 14 60 to 69 years old 6 3 5 70 and more years old 3 0 2
Average age (years) 38.7 34.1 37.1 5.07 < .001 .16 1 Cell entries are percentages (%) except for average age (years).
Analyses also showed that, on average, respondents at Sans Souci / Kaimana Beach who were classified as having a mixed protection – use orientation toward coral reef areas were slightly younger (mean age = 36.4 years) than those in the moderate protection and strong protection groups (mean ages = 37.8 and 39.5 years, respectively). There were, however, no relationships between value orientations and age at Diamond Head / Kuilei Cliffs. Additional analyses also showed that some main activity groups (e.g., beach walkers) tended to be slightly older than those participating in other activities, whereas some groups were slightly younger (e.g., surfers, sunbathers). These differences in average age for the value orientation groups and main activity groups, however, were generally not statistically significant (p > .05) and effect sizes were weak or minimal (effect sizes < .01).
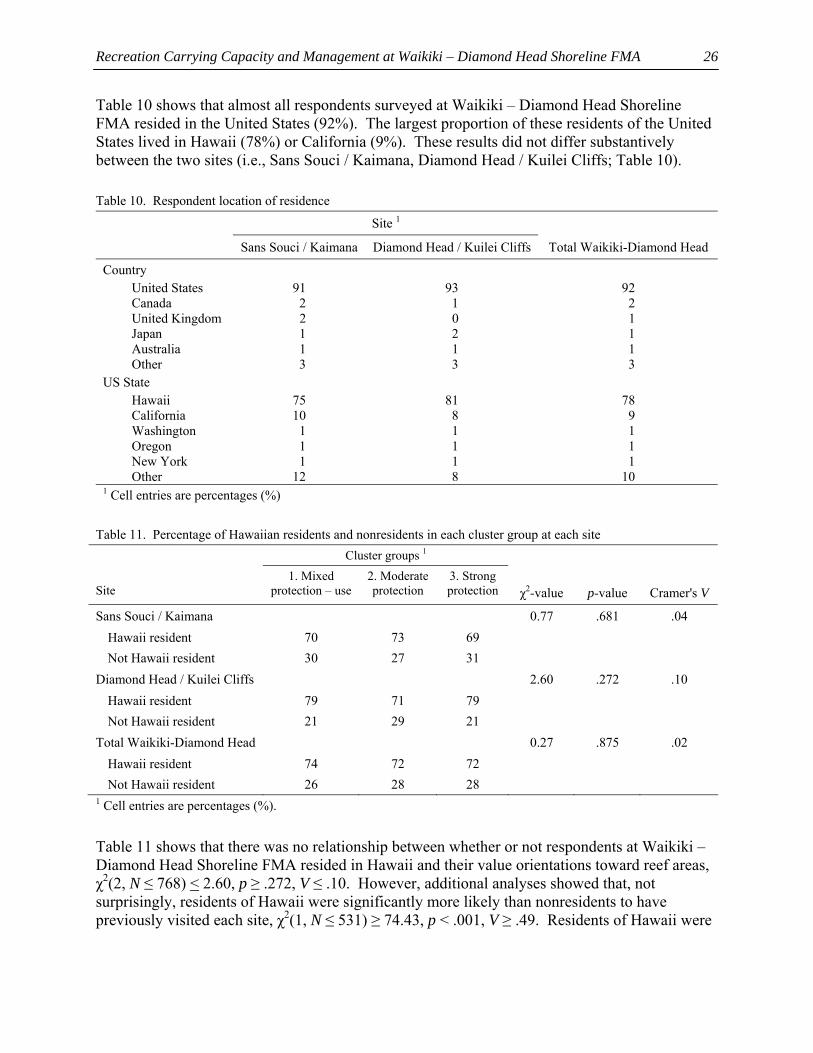
Recreation Carrying Capacity and Management at Waikiki – Diamond Head Shoreline FMA
26
Table 10 shows that almost all respondents surveyed at Waikiki – Diamond Head Shoreline FMA resided in the United States (92%). The largest proportion of these residents of the United States lived in Hawaii (78%) or California (9%). These results did not differ substantively between the two sites (i.e., Sans Souci / Kaimana, Diamond Head / Kuilei Cliffs; Table 10).
Table 10. Respondent location of residence
Site 1
Sans Souci / Kaimana Diamond Head / Kuilei Cliffs Total Waikiki-Diamond Head
Country United States 91 93 92 Canada 2 1 2 United Kingdom 2 0 1 Japan 1 2 1 Australia 1 1 1 Other 3 3 3
US State Hawaii 75 81 78 California 10 8 9 Washington 1 1 1 Oregon 1 1 1 New York 1 1 1 Other 12 8 10
1 Cell entries are percentages (%)
Table 11. Percentage of Hawaiian residents and nonresidents in each cluster group at each site Cluster groups 1 Site
1. Mixed protection – use
2. Moderate protection
3. Strong protection
χ2-value
p-value
Cramer's V
Sans Souci / Kaimana 0.77 .681 .04 Hawaii resident 70 73 69 Not Hawaii resident 30 27 31
Diamond Head / Kuilei Cliffs 2.60 .272 .10 Hawaii resident 79 71 79 Not Hawaii resident 21 29 21
Total Waikiki-Diamond Head 0.27 .875 .02 Hawaii resident 74 72 72 Not Hawaii resident 26 28 28
1 Cell entries are percentages (%).
Table 11 shows that there was no relationship between whether or not respondents at Waikiki – Diamond Head Shoreline FMA resided in Hawaii and their value orientations toward reef areas, χ2(2, N ≤ 768) < 2.60, p ≥ .272, V ≤ .10. However, additional analyses showed that, not surprisingly, residents of Hawaii were significantly more likely than nonresidents to have previously visited each site, χ2(1, N ≤ 531) ≥ 74.43, p < .001, V ≥ .49. Residents of Hawaii were
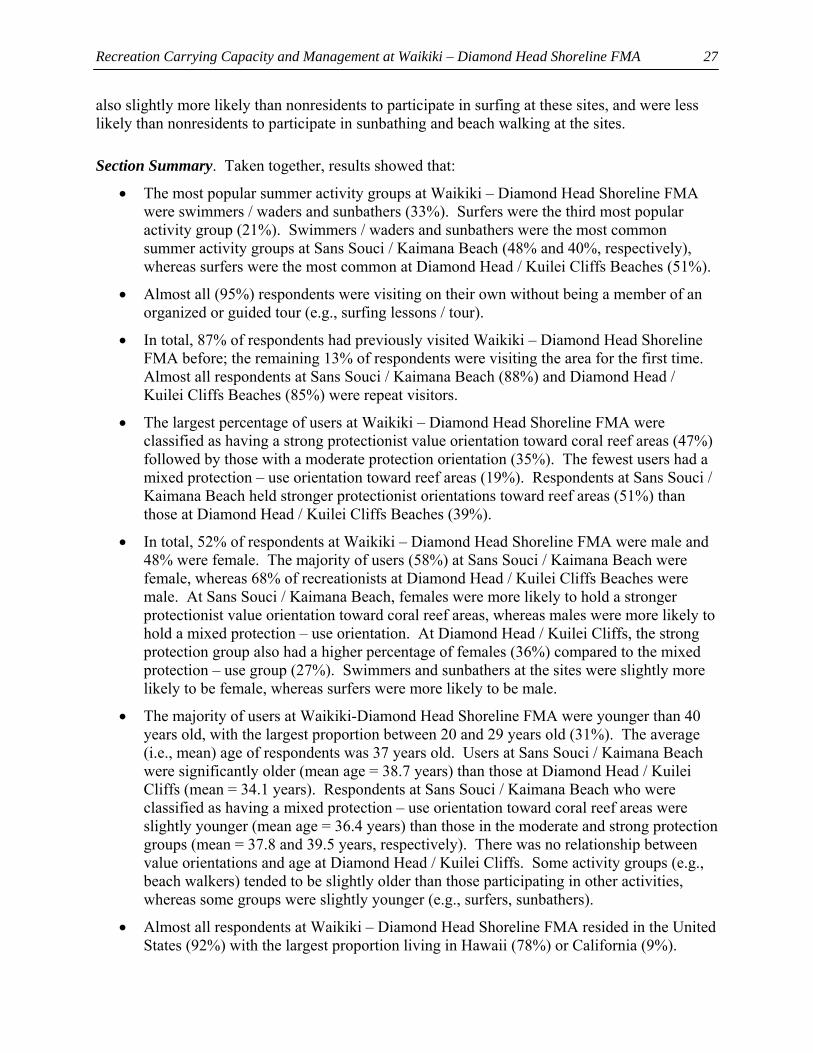
Recreation Carrying Capacity and Management at Waikiki – Diamond Head Shoreline FMA
27
also slightly more likely than nonresidents to participate in surfing at these sites, and were less likely than nonresidents to participate in sunbathing and beach walking at the sites.
Section Summary. Taken together, results showed that:
• The most popular summer activity groups at Waikiki – Diamond Head Shoreline FMA were swimmers / waders and sunbathers (33%). Surfers were the third most popular activity group (21%). Swimmers / waders and sunbathers were the most common summer activity groups at Sans Souci / Kaimana Beach (48% and 40%, respectively), whereas surfers were the most common at Diamond Head / Kuilei Cliffs Beaches (51%).
• Almost all (95%) respondents were visiting on their own without being a member of an organized or guided tour (e.g., surfing lessons / tour).
• In total, 87% of respondents had previously visited Waikiki – Diamond Head Shoreline FMA before; the remaining 13% of respondents were visiting the area for the first time. Almost all respondents at Sans Souci / Kaimana Beach (88%) and Diamond Head / Kuilei Cliffs Beaches (85%) were repeat visitors.
• The largest percentage of users at Waikiki – Diamond Head Shoreline FMA were classified as having a strong protectionist value orientation toward coral reef areas (47%) followed by those with a moderate protection orientation (35%). The fewest users had a mixed protection – use orientation toward reef areas (19%). Respondents at Sans Souci / Kaimana Beach held stronger protectionist orientations toward reef areas (51%) than those at Diamond Head / Kuilei Cliffs Beaches (39%).
• In total, 52% of respondents at Waikiki – Diamond Head Shoreline FMA were male and 48% were female. The majority of users (58%) at Sans Souci / Kaimana Beach were female, whereas 68% of recreationists at Diamond Head / Kuilei Cliffs Beaches were male. At Sans Souci / Kaimana Beach, females were more likely to hold a stronger protectionist value orientation toward coral reef areas, whereas males were more likely to hold a mixed protection – use orientation. At Diamond Head / Kuilei Cliffs, the strong protection group also had a higher percentage of females (36%) compared to the mixed protection – use group (27%). Swimmers and sunbathers at the sites were slightly more likely to be female, whereas surfers were more likely to be male.
• The majority of users at Waikiki-Diamond Head Shoreline FMA were younger than 40 years old, with the largest proportion between 20 and 29 years old (31%). The average (i.e., mean) age of respondents was 37 years old. Users at Sans Souci / Kaimana Beach were significantly older (mean age = 38.7 years) than those at Diamond Head / Kuilei Cliffs (mean = 34.1 years). Respondents at Sans Souci / Kaimana Beach who were classified as having a mixed protection – use orientation toward coral reef areas were slightly younger (mean age = 36.4 years) than those in the moderate and strong protection groups (mean = 37.8 and 39.5 years, respectively). There was no relationship between value orientations and age at Diamond Head / Kuilei Cliffs. Some activity groups (e.g., beach walkers) tended to be slightly older than those participating in other activities, whereas some groups were slightly younger (e.g., surfers, sunbathers).
• Almost all respondents at Waikiki – Diamond Head Shoreline FMA resided in the United States (92%) with the largest proportion living in Hawaii (78%) or California (9%).
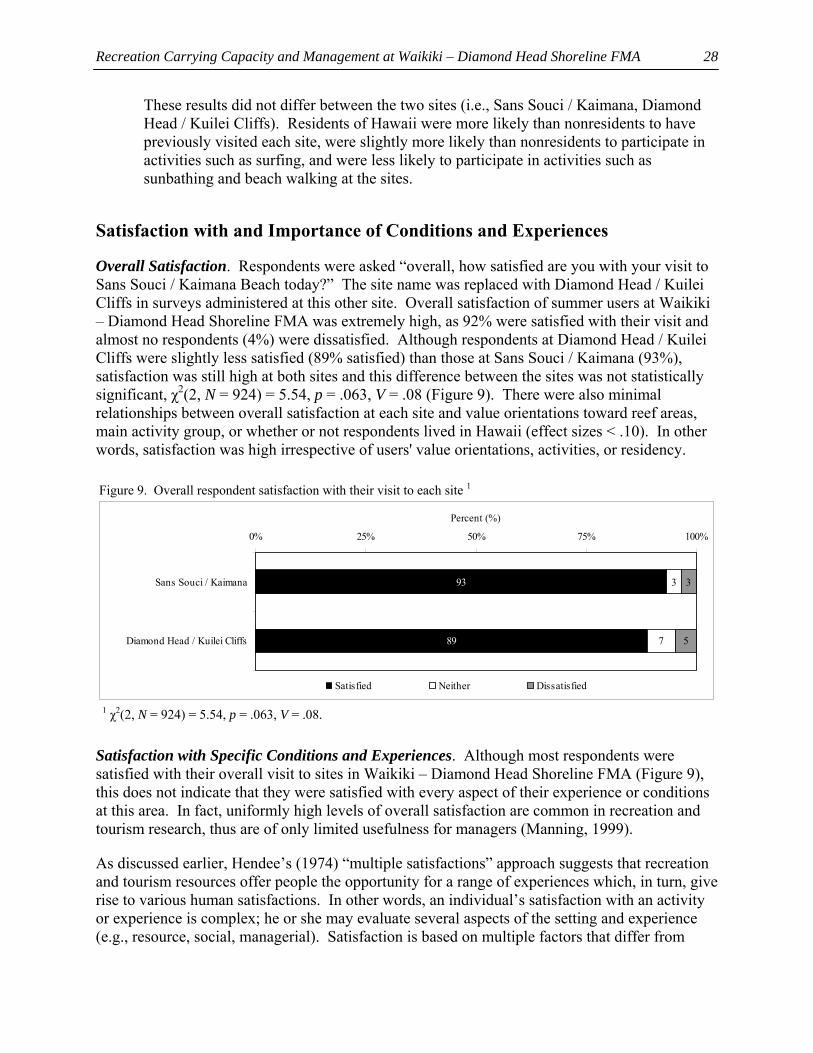
Recreation Carrying Capacity and Management at Waikiki – Diamond Head Shoreline FMA
28
These results did not differ between the two sites (i.e., Sans Souci / Kaimana, Diamond Head / Kuilei Cliffs). Residents of Hawaii were more likely than nonresidents to have previously visited each site, were slightly more likely than nonresidents to participate in activities such as surfing, and were less likely to participate in activities such as sunbathing and beach walking at the sites.
Satisfaction with and Importance of Conditions and Experiences
Overall Satisfaction. Respondents were asked “overall, how satisfied are you with your visit to Sans Souci / Kaimana Beach today?” The site name was replaced with Diamond Head / Kuilei Cliffs in surveys administered at this other site. Overall satisfaction of summer users at Waikiki – Diamond Head Shoreline FMA was extremely high, as 92% were satisfied with their visit and almost no respondents (4%) were dissatisfied. Although respondents at Diamond Head / Kuilei Cliffs were slightly less satisfied (89% satisfied) than those at Sans Souci / Kaimana (93%), satisfaction was still high at both sites and this difference between the sites was not statistically significant, χ2(2, N = 924) = 5.54, p = .063, V = .08 (Figure 9). There were also minimal relationships between overall satisfaction at each site and value orientations toward reef areas, main activity group, or whether or not respondents lived in Hawaii (effect sizes < .10). In other words, satisfaction was high irrespective of users' value orientations, activities, or residency.
Figure 9. Overall respondent satisfaction with their visit to each site 1
93
89
3
7
3
5
0% 25% 50% 75% 100%
Sans Souci / Kaimana
Diamond Head / Kuilei Cliffs
Percent (%)
Satisfied Neither Dissatisfied
1 χ2(2, N = 924) = 5.54, p = .063, V = .08.
Satisfaction with Specific Conditions and Experiences. Although most respondents were satisfied with their overall visit to sites in Waikiki – Diamond Head Shoreline FMA (Figure 9), this does not indicate that they were satisfied with every aspect of their experience or conditions at this area. In fact, uniformly high levels of overall satisfaction are common in recreation and tourism research, thus are of only limited usefulness for managers (Manning, 1999).
As discussed earlier, Hendee’s (1974) “multiple satisfactions” approach suggests that recreation and tourism resources offer people the opportunity for a range of experiences which, in turn, give rise to various human satisfactions. In other words, an individual’s satisfaction with an activity or experience is complex; he or she may evaluate several aspects of the setting and experience (e.g., resource, social, managerial). Satisfaction is based on multiple factors that differ from
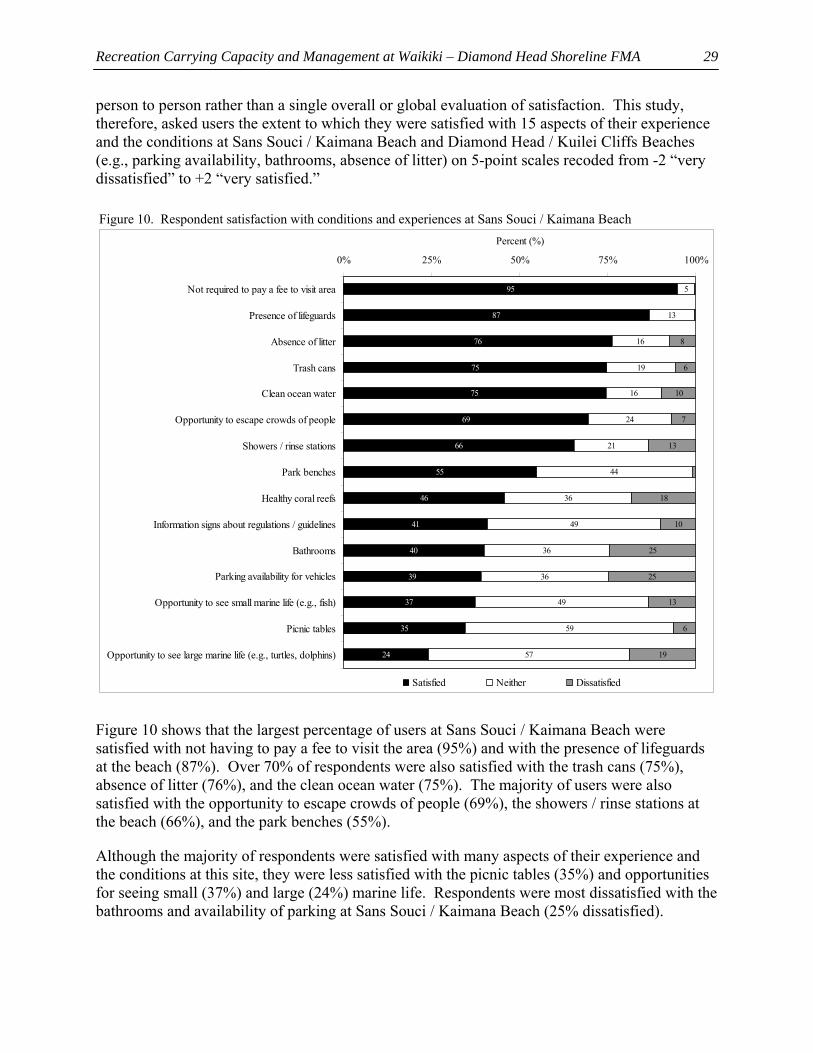
Recreation Carrying Capacity and Management at Waikiki – Diamond Head Shoreline FMA
29
person to person rather than a single overall or global evaluation of satisfaction. This study, therefore, asked users the extent to which they were satisfied with 15 aspects of their experience and the conditions at Sans Souci / Kaimana Beach and Diamond Head / Kuilei Cliffs Beaches (e.g., parking availability, bathrooms, absence of litter) on 5-point scales recoded from -2 “very dissatisfied” to +2 “very satisfied.”
Figure 10. Respondent satisfaction with conditions and experiences at Sans Souci / Kaimana Beach
95
87
76
75
75
69
66
55
46
41
40
39
37
35
24
5
13
16
19
16
24
21
44
36
49
36
36
49
59
57
8
6
10
7
13
18
10
25
25
13
6
19
0% 25% 50% 75% 100%
Not required to pay a fee to visit area
Presence of lifeguards
Absence of litter
Trash cans
Clean ocean water
Opportunity to escape crowds of people
Showers / rinse stations
Park benches
Healthy coral reefs
Information signs about regulations / guidelines
Bathrooms
Parking availability for vehicles
Opportunity to see small marine life (e.g., fish)
Picnic tables
Opportunity to see large marine life (e.g., turtles, dolphins)
Percent (%)
Satisfied Neither Dissatisfied
Figure 10 shows that the largest percentage of users at Sans Souci / Kaimana Beach were satisfied with not having to pay a fee to visit the area (95%) and with the presence of lifeguards at the beach (87%). Over 70% of respondents were also satisfied with the trash cans (75%), absence of litter (76%), and the clean ocean water (75%). The majority of users were also satisfied with the opportunity to escape crowds of people (69%), the showers / rinse stations at the beach (66%), and the park benches (55%).
Although the majority of respondents were satisfied with many aspects of their experience and the conditions at this site, they were less satisfied with the picnic tables (35%) and opportunities for seeing small (37%) and large (24%) marine life. Respondents were most dissatisfied with the bathrooms and availability of parking at Sans Souci / Kaimana Beach (25% dissatisfied).
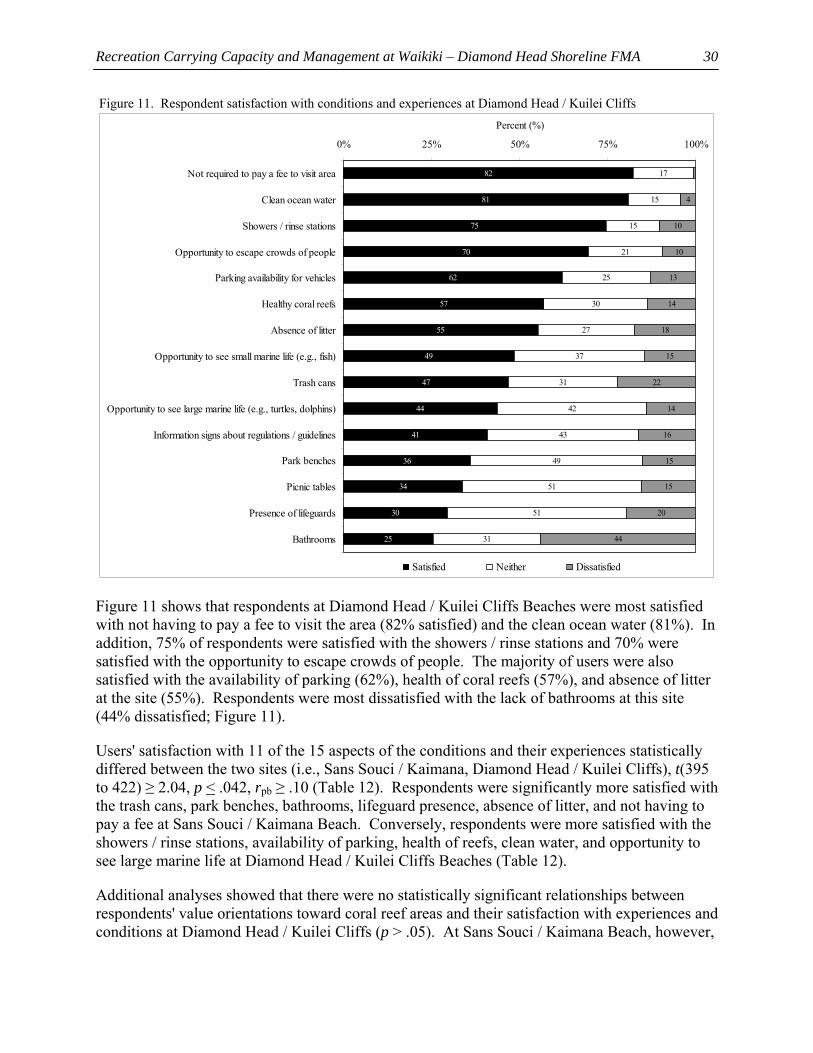
Recreation Carrying Capacity and Management at Waikiki – Diamond Head Shoreline FMA
30
Figure 11. Respondent satisfaction with conditions and experiences at Diamond Head / Kuilei Cliffs
82
81
75
70
62
57
55
49
47
44
41
36
34
30
25
17
15
15
21
25
30
27
37
31
42
43
49
51
51
31
10
10
13
14
18
22
14
16
15
15
20
44
15
4
0% 25% 50% 75% 100%
Not required to pay a fee to visit area
Clean ocean water
Showers / rinse stations
Opportunity to escape crowds of people
Parking availability for vehicles
Healthy coral reefs
Absence of litter
Opportunity to see small marine life (e.g., fish)
Trash cans
Opportunity to see large marine life (e.g., turtles, dolphins)
Information signs about regulations / guidelines
Park benches
Picnic tables
Presence of lifeguards
Bathrooms
Percent (%)
Satisfied Neither Dissatisfied
Figure 11 shows that respondents at Diamond Head / Kuilei Cliffs Beaches were most satisfied with not having to pay a fee to visit the area (82% satisfied) and the clean ocean water (81%). In addition, 75% of respondents were satisfied with the showers / rinse stations and 70% were satisfied with the opportunity to escape crowds of people. The majority of users were also satisfied with the availability of parking (62%), health of coral reefs (57%), and absence of litter at the site (55%). Respondents were most dissatisfied with the lack of bathrooms at this site (44% dissatisfied; Figure 11).
Users' satisfaction with 11 of the 15 aspects of the conditions and their experiences statistically differed between the two sites (i.e., Sans Souci / Kaimana, Diamond Head / Kuilei Cliffs), t(395 to 422) ≥ 2.04, p < .042, rpb ≥ .10 (Table 12). Respondents were significantly more satisfied with the trash cans, park benches, bathrooms, lifeguard presence, absence of litter, and not having to pay a fee at Sans Souci / Kaimana Beach. Conversely, respondents were more satisfied with the showers / rinse stations, availability of parking, health of reefs, clean water, and opportunity to see large marine life at Diamond Head / Kuilei Cliffs Beaches (Table 12).
Additional analyses showed that there were no statistically significant relationships between respondents' value orientations toward coral reef areas and their satisfaction with experiences and conditions at Diamond Head / Kuilei Cliffs (p > .05). At Sans Souci / Kaimana Beach, however,
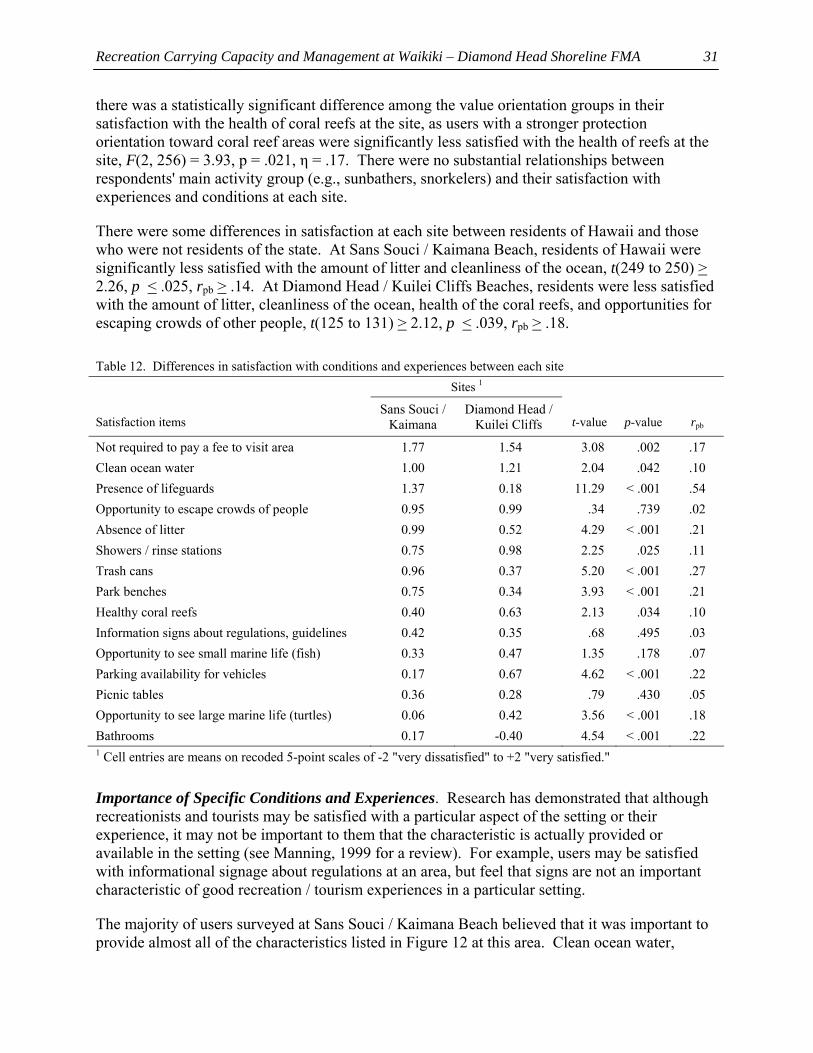
Recreation Carrying Capacity and Management at Waikiki – Diamond Head Shoreline FMA
31
there was a statistically significant difference among the value orientation groups in their satisfaction with the health of coral reefs at the site, as users with a stronger protection orientation toward coral reef areas were significantly less satisfied with the health of reefs at the site, F(2, 256) = 3.93, p = .021, η = .17. There were no substantial relationships between respondents' main activity group (e.g., sunbathers, snorkelers) and their satisfaction with experiences and conditions at each site.
There were some differences in satisfaction at each site between residents of Hawaii and those who were not residents of the state. At Sans Souci / Kaimana Beach, residents of Hawaii were significantly less satisfied with the amount of litter and cleanliness of the ocean, t(249 to 250) > 2.26, p < .025, rpb > .14. At Diamond Head / Kuilei Cliffs Beaches, residents were less satisfied with the amount of litter, cleanliness of the ocean, health of the coral reefs, and opportunities for escaping crowds of other people, t(125 to 131) > 2.12, p < .039, rpb > .18.
Table 12. Differences in satisfaction with conditions and experiences between each site Sites 1 Satisfaction items
Sans Souci /Kaimana
Diamond Head / Kuilei Cliffs
t-value
p-value
rpb
Not required to pay a fee to visit area 1.77 1.54 3.08 .002 .17 Clean ocean water 1.00 1.21 2.04 .042 .10 Presence of lifeguards 1.37 0.18 11.29 < .001 .54 Opportunity to escape crowds of people 0.95 0.99 .34 .739 .02 Absence of litter 0.99 0.52 4.29 < .001 .21 Showers / rinse stations 0.75 0.98 2.25 .025 .11 Trash cans 0.96 0.37 5.20 < .001 .27 Park benches 0.75 0.34 3.93 < .001 .21 Healthy coral reefs 0.40 0.63 2.13 .034 .10 Information signs about regulations, guidelines 0.42 0.35 .68 .495 .03 Opportunity to see small marine life (fish) 0.33 0.47 1.35 .178 .07 Parking availability for vehicles 0.17 0.67 4.62 < .001 .22 Picnic tables 0.36 0.28 .79 .430 .05 Opportunity to see large marine life (turtles) 0.06 0.42 3.56 < .001 .18 Bathrooms 0.17 -0.40 4.54 < .001 .22 1 Cell entries are means on recoded 5-point scales of -2 "very dissatisfied" to +2 "very satisfied."
Importance of Specific Conditions and Experiences. Research has demonstrated that although recreationists and tourists may be satisfied with a particular aspect of the setting or their experience, it may not be important to them that the characteristic is actually provided or available in the setting (see Manning, 1999 for a review). For example, users may be satisfied with informational signage about regulations at an area, but feel that signs are not an important characteristic of good recreation / tourism experiences in a particular setting.
The majority of users surveyed at Sans Souci / Kaimana Beach believed that it was important to provide almost all of the characteristics listed in Figure 12 at this area. Clean ocean water,
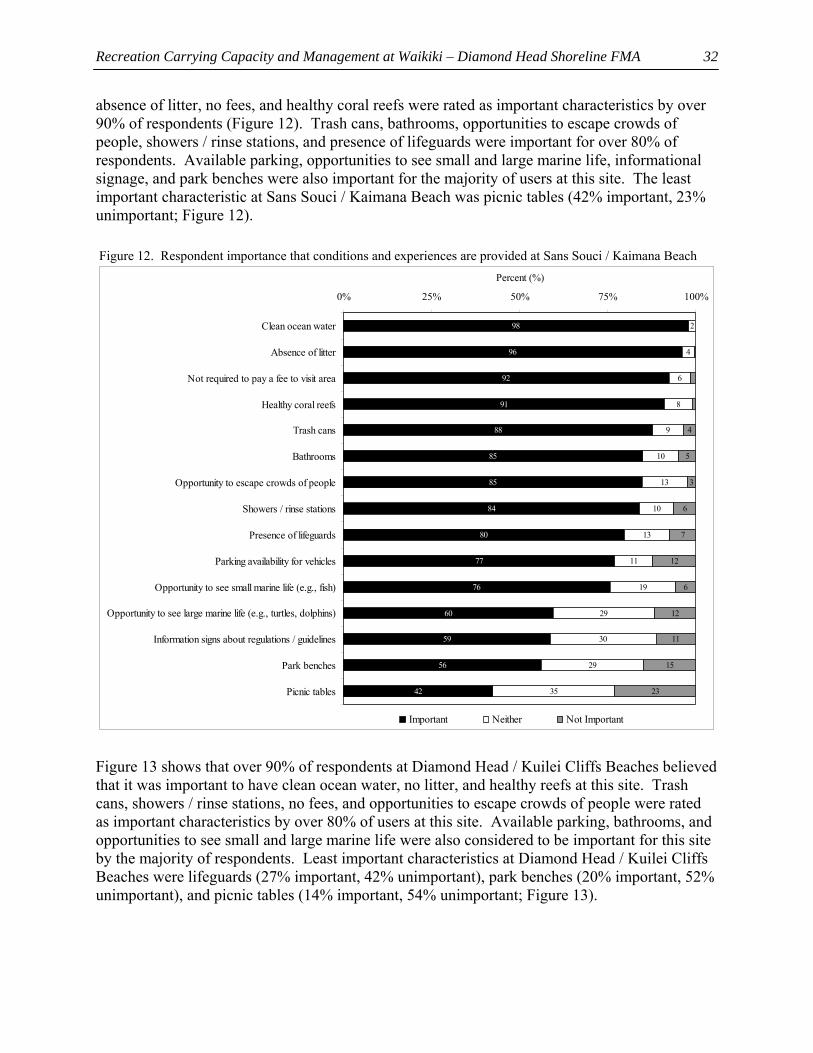
Recreation Carrying Capacity and Management at Waikiki – Diamond Head Shoreline FMA
32
absence of litter, no fees, and healthy coral reefs were rated as important characteristics by over 90% of respondents (Figure 12). Trash cans, bathrooms, opportunities to escape crowds of people, showers / rinse stations, and presence of lifeguards were important for over 80% of respondents. Available parking, opportunities to see small and large marine life, informational signage, and park benches were also important for the majority of users at this site. The least important characteristic at Sans Souci / Kaimana Beach was picnic tables (42% important, 23% unimportant; Figure 12).
Figure 12. Respondent importance that conditions and experiences are provided at Sans Souci / Kaimana Beach
98
96
92
91
88
85
85
84
80
77
76
60
59
56
42
4
6
8
9
10
13
10
13
11
19
29
30
29
35
7
12
6
12
11
15
23
2
3
4
5
6
0% 25% 50% 75% 100%
Clean ocean water
Absence of litter
Not required to pay a fee to visit area
Healthy coral reefs
Trash cans
Bathrooms
Opportunity to escape crowds of people
Showers / rinse stations
Presence of lifeguards
Parking availability for vehicles
Opportunity to see small marine life (e.g., fish)
Opportunity to see large marine life (e.g., turtles, dolphins)
Information signs about regulations / guidelines
Park benches
Picnic tables
Percent (%)
Important Neither Not Important
Figure 13 shows that over 90% of respondents at Diamond Head / Kuilei Cliffs Beaches believed that it was important to have clean ocean water, no litter, and healthy reefs at this site. Trash cans, showers / rinse stations, no fees, and opportunities to escape crowds of people were rated as important characteristics by over 80% of users at this site. Available parking, bathrooms, and opportunities to see small and large marine life were also considered to be important for this site by the majority of respondents. Least important characteristics at Diamond Head / Kuilei Cliffs Beaches were lifeguards (27% important, 42% unimportant), park benches (20% important, 52% unimportant), and picnic tables (14% important, 54% unimportant; Figure 13).
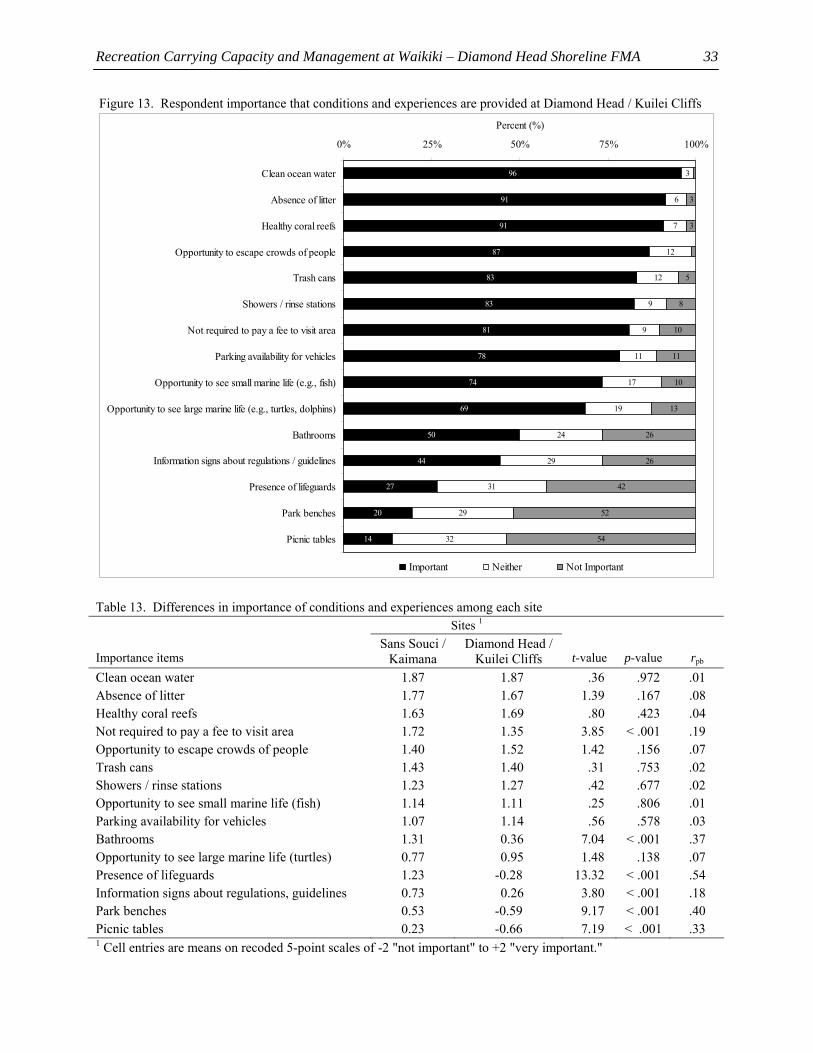
Recreation Carrying Capacity and Management at Waikiki – Diamond Head Shoreline FMA
33
Figure 13. Respondent importance that conditions and experiences are provided at Diamond Head / Kuilei Cliffs
96
91
91
87
83
83
81
78
74
69
50
44
27
20
14
6
7
12
12
9
9
11
17
19
24
29
31
29
32
10
13
26
26
42
52
54
3
10
3
5
8
11
3
0% 25% 50% 75% 100%
Clean ocean water
Absence of litter
Healthy coral reefs
Opportunity to escape crowds of people
Trash cans
Showers / rinse stations
Not required to pay a fee to visit area
Parking availability for vehicles
Opportunity to see small marine life (e.g., fish)
Opportunity to see large marine life (e.g., turtles, dolphins)
Bathrooms
Information signs about regulations / guidelines
Presence of lifeguards
Park benches
Picnic tables
Percent (%)
Important Neither Not Important
Table 13. Differences in importance of conditions and experiences among each site Sites 1 Importance items
Sans Souci /Kaimana
Diamond Head / Kuilei Cliffs
t-value
p-value
rpb
Clean ocean water 1.87 1.87 .36 .972 .01 Absence of litter 1.77 1.67 1.39 .167 .08 Healthy coral reefs 1.63 1.69 .80 .423 .04 Not required to pay a fee to visit area 1.72 1.35 3.85 < .001 .19 Opportunity to escape crowds of people 1.40 1.52 1.42 .156 .07 Trash cans 1.43 1.40 .31 .753 .02 Showers / rinse stations 1.23 1.27 .42 .677 .02 Opportunity to see small marine life (fish) 1.14 1.11 .25 .806 .01 Parking availability for vehicles 1.07 1.14 .56 .578 .03 Bathrooms 1.31 0.36 7.04 < .001 .37 Opportunity to see large marine life (turtles) 0.77 0.95 1.48 .138 .07 Presence of lifeguards 1.23 -0.28 13.32 < .001 .54 Information signs about regulations, guidelines 0.73 0.26 3.80 < .001 .18 Park benches 0.53 -0.59 9.17 < .001 .40 Picnic tables 0.23 -0.66 7.19 < .001 .33 1 Cell entries are means on recoded 5-point scales of -2 "not important" to +2 "very important."
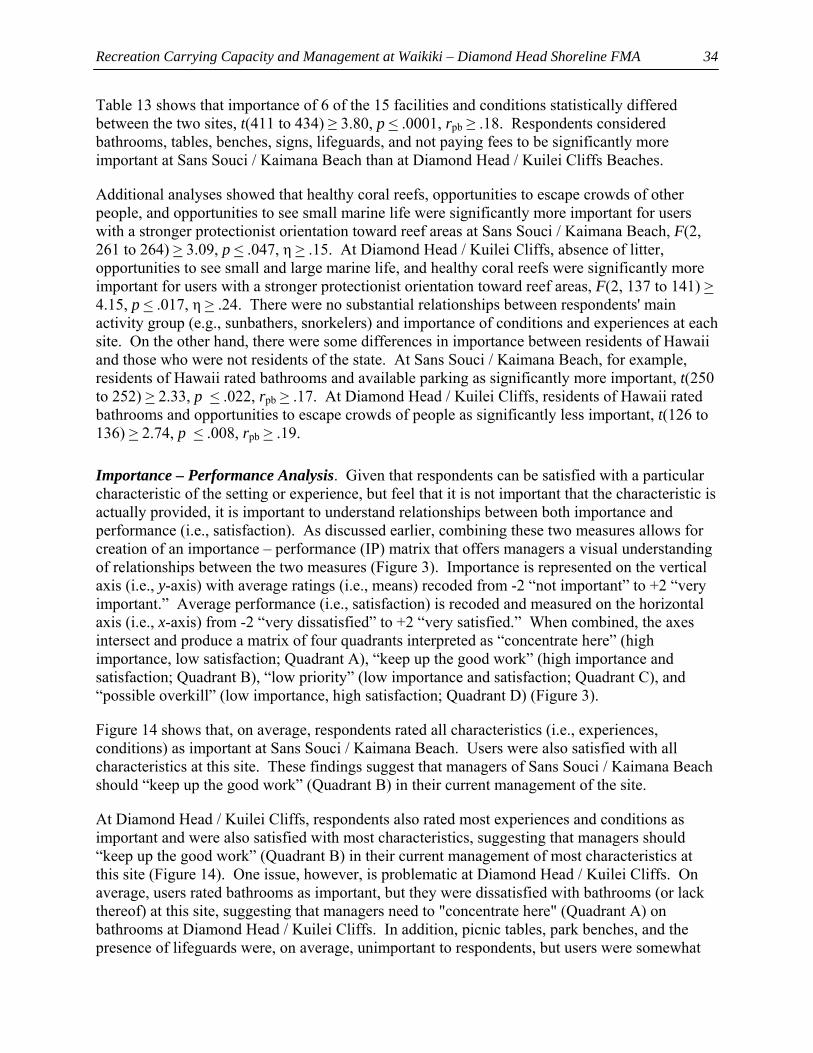
Recreation Carrying Capacity and Management at Waikiki – Diamond Head Shoreline FMA
34
Table 13 shows that importance of 6 of the 15 facilities and conditions statistically differed between the two sites, t(411 to 434) ≥ 3.80, p < .0001, rpb ≥ .18. Respondents considered bathrooms, tables, benches, signs, lifeguards, and not paying fees to be significantly more important at Sans Souci / Kaimana Beach than at Diamond Head / Kuilei Cliffs Beaches.
Additional analyses showed that healthy coral reefs, opportunities to escape crowds of other people, and opportunities to see small marine life were significantly more important for users with a stronger protectionist orientation toward reef areas at Sans Souci / Kaimana Beach, F(2, 261 to 264) > 3.09, p < .047, η > .15. At Diamond Head / Kuilei Cliffs, absence of litter, opportunities to see small and large marine life, and healthy coral reefs were significantly more important for users with a stronger protectionist orientation toward reef areas, F(2, 137 to 141) > 4.15, p < .017, η > .24. There were no substantial relationships between respondents' main activity group (e.g., sunbathers, snorkelers) and importance of conditions and experiences at each site. On the other hand, there were some differences in importance between residents of Hawaii and those who were not residents of the state. At Sans Souci / Kaimana Beach, for example, residents of Hawaii rated bathrooms and available parking as significantly more important, t(250 to 252) > 2.33, p < .022, rpb > .17. At Diamond Head / Kuilei Cliffs, residents of Hawaii rated bathrooms and opportunities to escape crowds of people as significantly less important, t(126 to 136) > 2.74, p < .008, rpb > .19.
Importance – Performance Analysis. Given that respondents can be satisfied with a particular characteristic of the setting or experience, but feel that it is not important that the characteristic is actually provided, it is important to understand relationships between both importance and performance (i.e., satisfaction). As discussed earlier, combining these two measures allows for creation of an importance – performance (IP) matrix that offers managers a visual understanding of relationships between the two measures (Figure 3). Importance is represented on the vertical axis (i.e., y-axis) with average ratings (i.e., means) recoded from -2 “not important” to +2 “very important.” Average performance (i.e., satisfaction) is recoded and measured on the horizontal axis (i.e., x-axis) from -2 “very dissatisfied” to +2 “very satisfied.” When combined, the axes intersect and produce a matrix of four quadrants interpreted as “concentrate here” (high importance, low satisfaction; Quadrant A), “keep up the good work” (high importance and satisfaction; Quadrant B), “low priority” (low importance and satisfaction; Quadrant C), and “possible overkill” (low importance, high satisfaction; Quadrant D) (Figure 3).
Figure 14 shows that, on average, respondents rated all characteristics (i.e., experiences, conditions) as important at Sans Souci / Kaimana Beach. Users were also satisfied with all characteristics at this site. These findings suggest that managers of Sans Souci / Kaimana Beach should “keep up the good work” (Quadrant B) in their current management of the site.
At Diamond Head / Kuilei Cliffs, respondents also rated most experiences and conditions as important and were also satisfied with most characteristics, suggesting that managers should “keep up the good work” (Quadrant B) in their current management of most characteristics at this site (Figure 14). One issue, however, is problematic at Diamond Head / Kuilei Cliffs. On average, users rated bathrooms as important, but they were dissatisfied with bathrooms (or lack thereof) at this site, suggesting that managers need to "concentrate here" (Quadrant A) on bathrooms at Diamond Head / Kuilei Cliffs. In addition, picnic tables, park benches, and the presence of lifeguards were, on average, unimportant to respondents, but users were somewhat
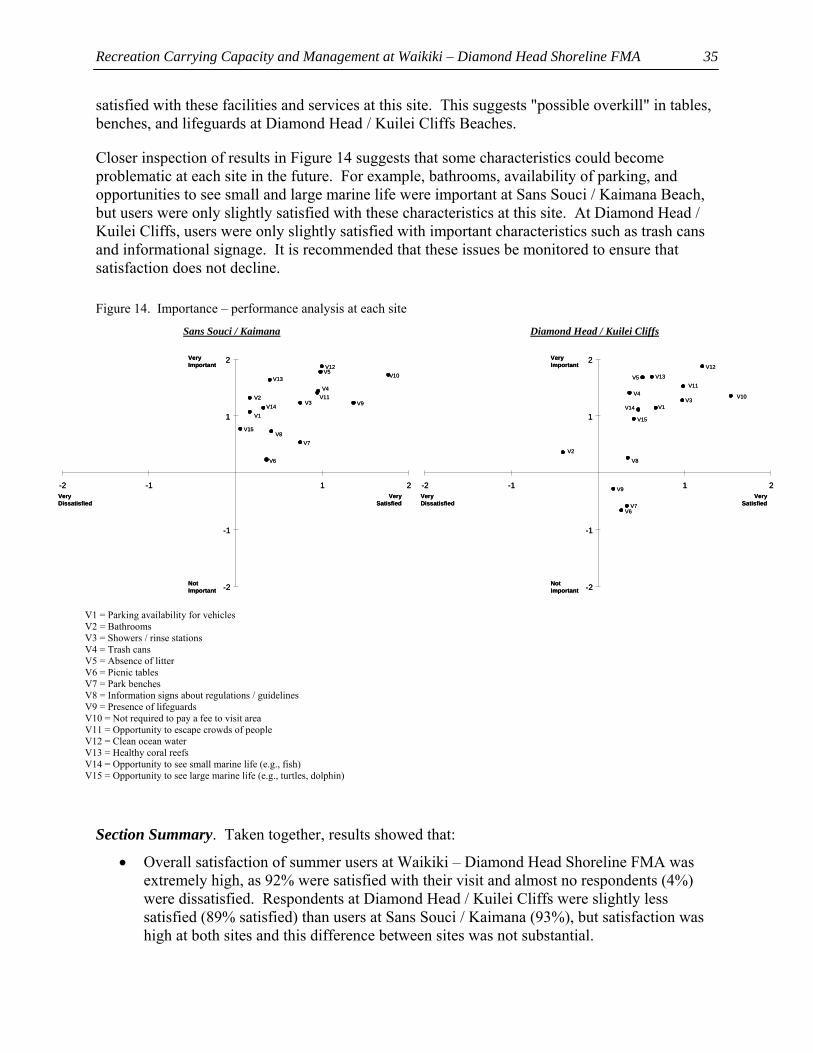
Recreation Carrying Capacity and Management at Waikiki – Diamond Head Shoreline FMA
35
satisfied with these facilities and services at this site. This suggests "possible overkill" in tables, benches, and lifeguards at Diamond Head / Kuilei Cliffs Beaches.
Closer inspection of results in Figure 14 suggests that some characteristics could become problematic at each site in the future. For example, bathrooms, availability of parking, and opportunities to see small and large marine life were important at Sans Souci / Kaimana Beach, but users were only slightly satisfied with these characteristics at this site. At Diamond Head / Kuilei Cliffs, users were only slightly satisfied with important characteristics such as trash cans and informational signage. It is recommended that these issues be monitored to ensure that satisfaction does not decline.
Figure 14. Importance – performance analysis at each site
Section Summary. Taken together, results showed that:
• Overall satisfaction of summer users at Waikiki – Diamond Head Shoreline FMA was extremely high, as 92% were satisfied with their visit and almost no respondents (4%) were dissatisfied. Respondents at Diamond Head / Kuilei Cliffs were slightly less satisfied (89% satisfied) than users at Sans Souci / Kaimana (93%), but satisfaction was high at both sites and this difference between sites was not substantial.
Sans Souci / Kaimana Diamond Head / Kuilei Cliffs
V1 = Parking availability for vehicles V2 = Bathrooms V3 = Showers / rinse stations V4 = Trash cans V5 = Absence of litter V6 = Picnic tables V7 = Park benches V8 = Information signs about regulations / guidelines V9 = Presence of lifeguards V10 = Not required to pay a fee to visit area V11 = Opportunity to escape crowds of people V12 = Clean ocean water V13 = Healthy coral reefs V14 = Opportunity to see small marine life (e.g., fish) V15 = Opportunity to see large marine life (e.g., turtles, dolphin)
VeryDissatisfied
VerySatisfied
NotImportant
VeryImportant
V1
V2V3
V4
V5
V6
V7V8
V9
V10
V11
V12
V13
V14
V15
-2
-1
1
2
-2 -1 1 2VeryDissatisfied
VerySatisfied
NotImportant
VeryImportant
V1
V2V3
V4
V5
V6
V7V8
V9
V10
V11
V12
V13
V14
V15
-2
-1
1
2
-2 -1 1 2VeryDissatisfied
VerySatisfied
NotImportant
VeryImportant
V1
V2
V3V4
V5
V6V7
V8
V9
V10
V11
V12
V13
V14
V15
-2
-1
1
2
-2 -1 1 2VeryDissatisfied
VerySatisfied
NotImportant
VeryImportant
V1
V2
V3V4
V5
V6V7
V8
V9
V10
V11
V12
V13
V14
V15
-2
-1
1
2
-2 -1 1 2
Recreation Carrying Capacity and Management at Waikiki – Diamond Head Shoreline FMA
36
• The majority of respondents were satisfied with most aspects of their experience and the conditions at Sans Souci / Kaimana Beach, especially not having to pay a fee to visit (95%) and with the presence of lifeguards at the beach (87%). Over 70% of respondents were also satisfied with the trash cans, absence of litter, and clean ocean water at this site. Respondents were most dissatisfied with the bathrooms and availability of parking at Sans Souci / Kaimana Beach (25% dissatisfied).
• At Diamond Head / Kuilei Cliffs Beaches, users were most satisfied with not having to pay a fee to visit (82% satisfied) and the clean ocean water (81%). In addition, over 70% of respondents were satisfied with the showers / rinse stations and opportunities to escape crowds of other people. Respondents were most dissatisfied with the lack of bathrooms at this site (44% dissatisfied).
• Respondents were significantly more satisfied with trash cans, park benches, bathrooms, lifeguard presence, absence of litter, and not having to pay a fee at Sans Souci / Kaimana Beach. Respondents were more satisfied with the showers / rinse stations, availability of parking, health of reefs, clean water, and opportunity to see large marine life at Diamond Head / Kuilei Cliffs Beaches.
• The majority of respondents at Sans Souci / Kaimana rated almost all aspects of their experience and the conditions at this site as important, especially clean ocean water, absence of litter, no fees, and healthy coral reefs (over 90% of users rated as important). The least important characteristic at this site was picnic tables (23% unimportant).
• Users at Diamond Head / Kuilei Cliffs Beaches rated most aspects of their experience and the conditions at this site as important, especially clean ocean water, no litter, and healthy reefs (over 90% of users rated as important). Least important characteristics at this site were lifeguards (42% unimportant), park benches (52%), and picnic tables (54%).
• Respondents considered bathrooms, tables, benches, signs, lifeguards, and not paying fees to be significantly more important at Sans Souci / Kaimana Beach than at Diamond Head / Kuilei Cliffs Beaches.
• Users rated, on average, all aspects of their experience and the conditions at Sans Souci / Kaimana Beach as important and were satisfied with all of these aspects, suggesting that managers should “keep up the good work” in their management of this site.
• At Diamond Head / Kuilei Cliffs, respondents rated most experiences and conditions as important and were satisfied with most characteristics, suggesting that managers should “keep up the good work” in their management of most characteristics at this site. Users at this site, however, rated bathrooms as important, but were dissatisfied with bathrooms (or lack thereof) at this site, suggesting that managers need to concentrate on this issue at Diamond Head / Kuilei Cliffs. In addition, picnic tables, park benches, and the presence of lifeguards were unimportant to most respondents at this site, but users were somewhat satisfied with these facilities and services, suggesting "possible overkill" in tables, benches, and lifeguards at Diamond Head / Kuilei Cliffs Beaches.
• Conditions such as the bathrooms and parking at Sans Souci / Kaimana Beach, and trash cans and signage at Diamond Head / Kuilei Cliffs should be monitored to ensure that satisfaction does not decline at each site.
Recreation Carrying Capacity and Management at Waikiki – Diamond Head Shoreline FMA
37
Social Carrying Capacity Indicators
As discussed earlier, the concepts of reported encounters, norms, and perceived crowding have received considerable attention in the recreation and tourism literature because they can be used together to: (a) estimate standards of quality for social carrying capacity indicators, and (b) examine the extent to which these standards are being met or exceeded at a particular location (see Manning, 1999, 2007 for reviews). Reported encounters describe a subjective count of the number of other people that an individual remembers observing in a setting. Perceived crowding refers to a subjective and negative evaluation that this reported number of encounters or people observed in an area is too many. Understanding reported encounters and perceived crowding, however, may not reveal maximum acceptable or tolerable use levels or an understanding of how use should be managed and monitored. Norms offer a theoretical and applied approach for helping to address these issues. Norms are standards that individuals use for evaluating activities, environments, or management strategies as good or bad, better or worse; they help to clarify what people believe conditions or behavior should be. Research suggests that when recreationists perceived a setting to be crowded, they likely encountered more than their norm for what they believe should be acceptable conditions or impacts (e.g., use levels) in the setting.
Reported Encounters with Other Users. Previous research has typically measured reported encounters in recreation and tourism settings by simply asking respondents to approximate how many other people they saw or encountered during their trip to a particular site (see Vaske & Donnelly, 2002 for a review). Responses are typically recorded in either: (a) an open ended format (i.e., fill in the blank) where respondents write a number corresponding to how many people they encountered, or (b) a close ended format where respondents circle one number from a series of numbers provided on a survey that corresponds to how many people they encountered (e.g., 5, 10, 20, 40 people). This project measured encounters using the close ended format where respondents were asked "approximately how many other people did you see in total at Sans Souci / Kaimana Beach today" and were given 15 different encounter levels from which to choose (0, 5, 10, 20, 35, 50, 75, 100, 200, 350, 500, 750, 1000, 1500, 2000+ people). Diamond Head Beach was substituted as the site name in surveys administered at this other site.
Recent studies, however, have demonstrated that it may be unrealistic to expect respondents to accurately ascertain from these written descriptions or lists in surveys exactly how many people they encountered or what would be acceptable or unacceptable. This is especially relevant in frontcountry settings were use levels are often high. It may be difficult, for example, for respondents to visualize what 1500 other people at a beach area would look like. Therefore, researchers have started using image capture technology (ICT) to measure perceptions of conditions such as encounters and use levels. ICT involves using computer software to manipulate and create visuals. Visuals provide a realistic and cognitively easier assessment of impacts and conditions, as they allow users to see what conditions would be like. Respondents evaluate several photographs depicting conditions (e.g., use levels) varied from low to high.
In addition to the close ended format discussed above, this project also employed a visual approach for measuring reported encounters and other related social carrying capacity indicators. Six photographs of increasing numbers of people at each site were embedded within the surveys (Figure 15). These photographs depicted 0 to 800 people per 500 x 200 yards with the number
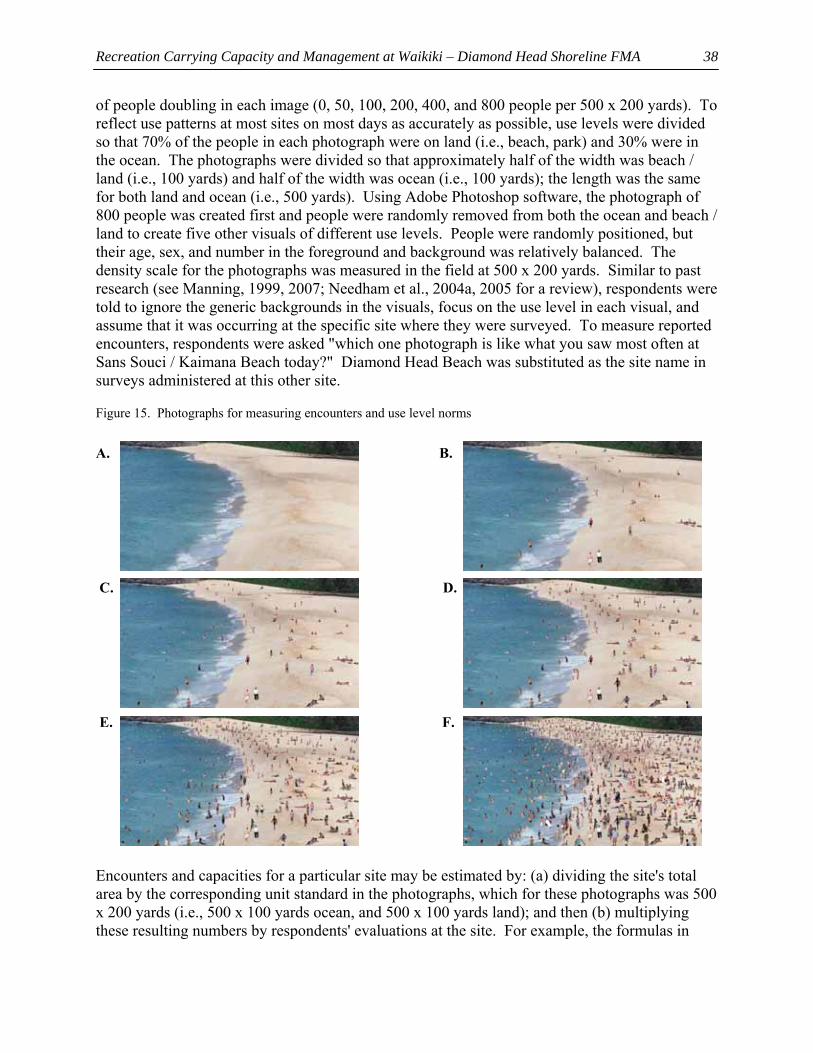
Recreation Carrying Capacity and Management at Waikiki – Diamond Head Shoreline FMA
38
of people doubling in each image (0, 50, 100, 200, 400, and 800 people per 500 x 200 yards). To reflect use patterns at most sites on most days as accurately as possible, use levels were divided so that 70% of the people in each photograph were on land (i.e., beach, park) and 30% were in the ocean. The photographs were divided so that approximately half of the width was beach / land (i.e., 100 yards) and half of the width was ocean (i.e., 100 yards); the length was the same for both land and ocean (i.e., 500 yards). Using Adobe Photoshop software, the photograph of 800 people was created first and people were randomly removed from both the ocean and beach / land to create five other visuals of different use levels. People were randomly positioned, but their age, sex, and number in the foreground and background was relatively balanced. The density scale for the photographs was measured in the field at 500 x 200 yards. Similar to past research (see Manning, 1999, 2007; Needham et al., 2004a, 2005 for a review), respondents were told to ignore the generic backgrounds in the visuals, focus on the use level in each visual, and assume that it was occurring at the specific site where they were surveyed. To measure reported encounters, respondents were asked "which one photograph is like what you saw most often at Sans Souci / Kaimana Beach today?" Diamond Head Beach was substituted as the site name in surveys administered at this other site.
Figure 15. Photographs for measuring encounters and use level norms
A. B. C. D. E. F.
Encounters and capacities for a particular site may be estimated by: (a) dividing the site's total area by the corresponding unit standard in the photographs, which for these photographs was 500 x 200 yards (i.e., 500 x 100 yards ocean, and 500 x 100 yards land); and then (b) multiplying these resulting numbers by respondents' evaluations at the site. For example, the formulas in
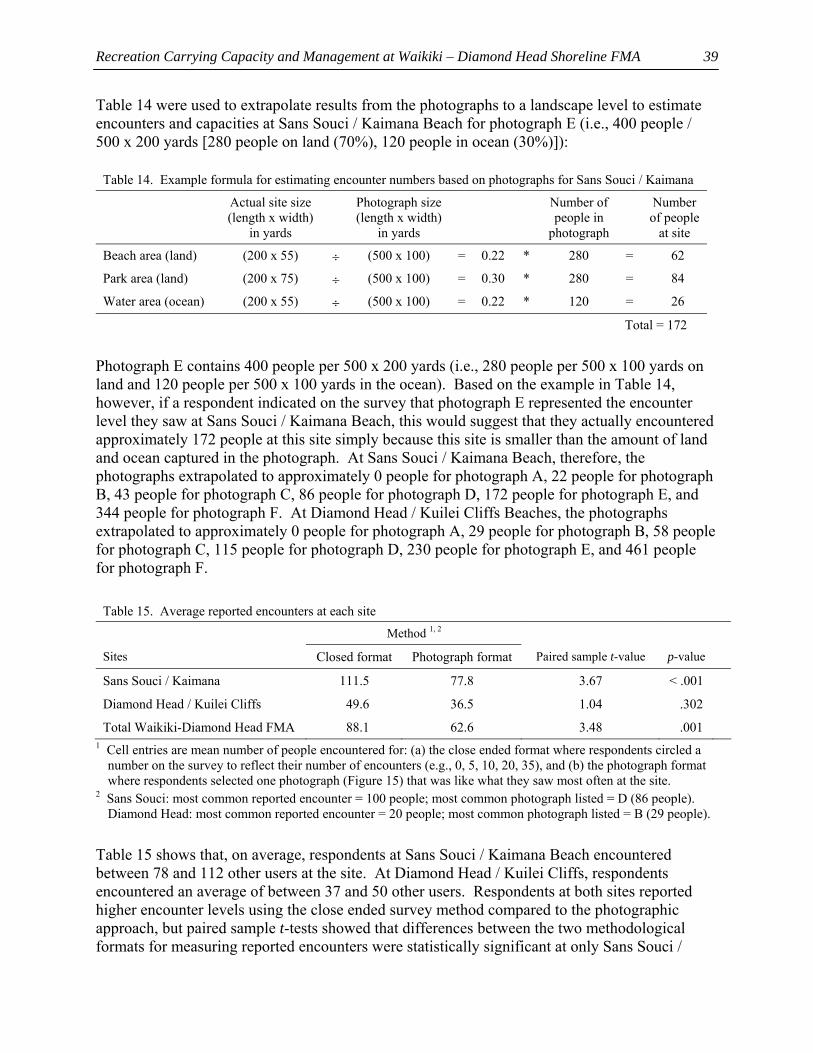
Recreation Carrying Capacity and Management at Waikiki – Diamond Head Shoreline FMA
39
Table 14 were used to extrapolate results from the photographs to a landscape level to estimate encounters and capacities at Sans Souci / Kaimana Beach for photograph E (i.e., 400 people / 500 x 200 yards [280 people on land (70%), 120 people in ocean (30%)]):
Table 14. Example formula for estimating encounter numbers based on photographs for Sans Souci / Kaimana
Actual site size (length x width)
in yards
Photograph size(length x width)
in yards
Number of people in
photograph
Number of people
at site
Beach area (land) (200 x 55) ÷ (500 x 100) = 0.22 * 280 = 62
Park area (land) (200 x 75) ÷ (500 x 100) = 0.30 * 280 = 84
Water area (ocean) (200 x 55) ÷ (500 x 100) = 0.22 * 120 = 26
Total = 172
Photograph E contains 400 people per 500 x 200 yards (i.e., 280 people per 500 x 100 yards on land and 120 people per 500 x 100 yards in the ocean). Based on the example in Table 14, however, if a respondent indicated on the survey that photograph E represented the encounter level they saw at Sans Souci / Kaimana Beach, this would suggest that they actually encountered approximately 172 people at this site simply because this site is smaller than the amount of land and ocean captured in the photograph. At Sans Souci / Kaimana Beach, therefore, the photographs extrapolated to approximately 0 people for photograph A, 22 people for photograph B, 43 people for photograph C, 86 people for photograph D, 172 people for photograph E, and 344 people for photograph F. At Diamond Head / Kuilei Cliffs Beaches, the photographs extrapolated to approximately 0 people for photograph A, 29 people for photograph B, 58 people for photograph C, 115 people for photograph D, 230 people for photograph E, and 461 people for photograph F.
Table 15. Average reported encounters at each site
Method 1, 2
Sites Closed format Photograph format Paired sample t-value p-value
Sans Souci / Kaimana 111.5 77.8 3.67 < .001
Diamond Head / Kuilei Cliffs 49.6 36.5 1.04 .302
Total Waikiki-Diamond Head FMA 88.1 62.6 3.48 .001 1 Cell entries are mean number of people encountered for: (a) the close ended format where respondents circled a
number on the survey to reflect their number of encounters (e.g., 0, 5, 10, 20, 35), and (b) the photograph format where respondents selected one photograph (Figure 15) that was like what they saw most often at the site.
2 Sans Souci: most common reported encounter = 100 people; most common photograph listed = D (86 people). Diamond Head: most common reported encounter = 20 people; most common photograph listed = B (29 people).
Table 15 shows that, on average, respondents at Sans Souci / Kaimana Beach encountered between 78 and 112 other users at the site. At Diamond Head / Kuilei Cliffs, respondents encountered an average of between 37 and 50 other users. Respondents at both sites reported higher encounter levels using the close ended survey method compared to the photographic approach, but paired sample t-tests showed that differences between the two methodological formats for measuring reported encounters were statistically significant at only Sans Souci /
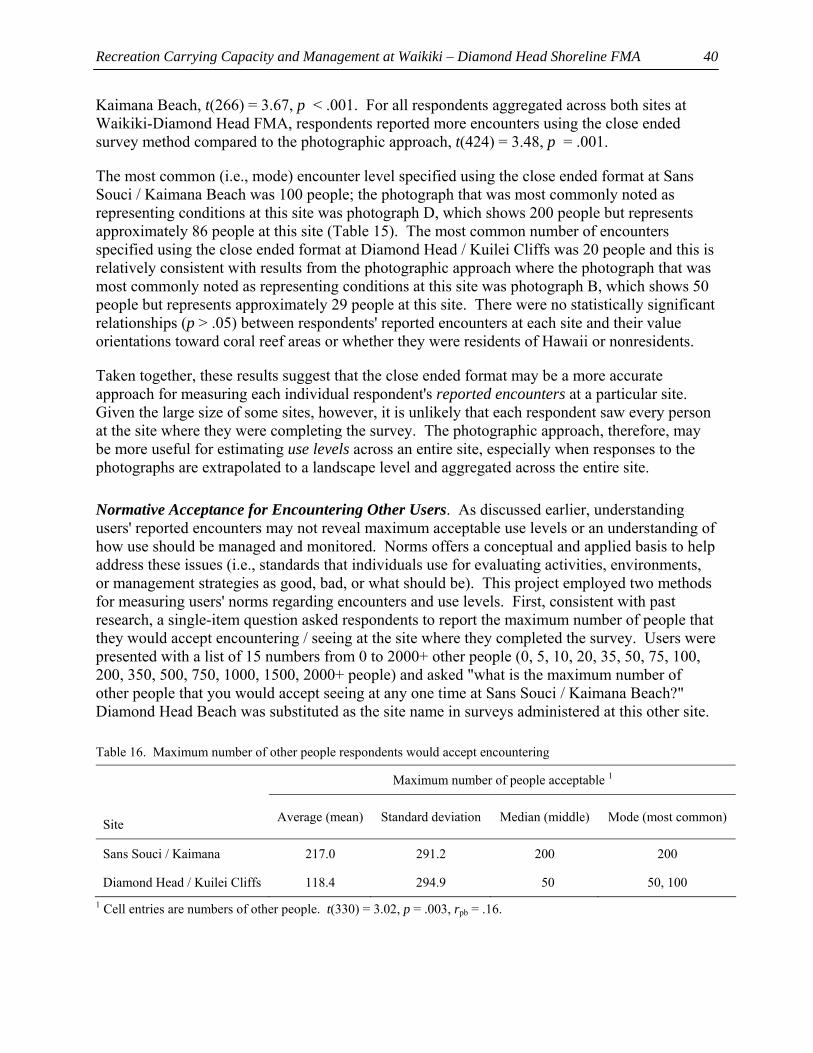
Recreation Carrying Capacity and Management at Waikiki – Diamond Head Shoreline FMA
40
Kaimana Beach, t(266) = 3.67, p < .001. For all respondents aggregated across both sites at Waikiki-Diamond Head FMA, respondents reported more encounters using the close ended survey method compared to the photographic approach, t(424) = 3.48, p = .001.
The most common (i.e., mode) encounter level specified using the close ended format at Sans Souci / Kaimana Beach was 100 people; the photograph that was most commonly noted as representing conditions at this site was photograph D, which shows 200 people but represents approximately 86 people at this site (Table 15). The most common number of encounters specified using the close ended format at Diamond Head / Kuilei Cliffs was 20 people and this is relatively consistent with results from the photographic approach where the photograph that was most commonly noted as representing conditions at this site was photograph B, which shows 50 people but represents approximately 29 people at this site. There were no statistically significant relationships (p > .05) between respondents' reported encounters at each site and their value orientations toward coral reef areas or whether they were residents of Hawaii or nonresidents.
Taken together, these results suggest that the close ended format may be a more accurate approach for measuring each individual respondent's reported encounters at a particular site. Given the large size of some sites, however, it is unlikely that each respondent saw every person at the site where they were completing the survey. The photographic approach, therefore, may be more useful for estimating use levels across an entire site, especially when responses to the photographs are extrapolated to a landscape level and aggregated across the entire site.
Normative Acceptance for Encountering Other Users. As discussed earlier, understanding users' reported encounters may not reveal maximum acceptable use levels or an understanding of how use should be managed and monitored. Norms offers a conceptual and applied basis to help address these issues (i.e., standards that individuals use for evaluating activities, environments, or management strategies as good, bad, or what should be). This project employed two methods for measuring users' norms regarding encounters and use levels. First, consistent with past research, a single-item question asked respondents to report the maximum number of people that they would accept encountering / seeing at the site where they completed the survey. Users were presented with a list of 15 numbers from 0 to 2000+ other people (0, 5, 10, 20, 35, 50, 75, 100, 200, 350, 500, 750, 1000, 1500, 2000+ people) and asked "what is the maximum number of other people that you would accept seeing at any one time at Sans Souci / Kaimana Beach?" Diamond Head Beach was substituted as the site name in surveys administered at this other site.
Table 16. Maximum number of other people respondents would accept encountering
Maximum number of people acceptable 1
Site Average (mean) Standard deviation Median (middle) Mode (most common)
Sans Souci / Kaimana 217.0 291.2 200 200
Diamond Head / Kuilei Cliffs 118.4 294.9 50 50, 100 1 Cell entries are numbers of other people. t(330) = 3.02, p = .003, rpb = .16.
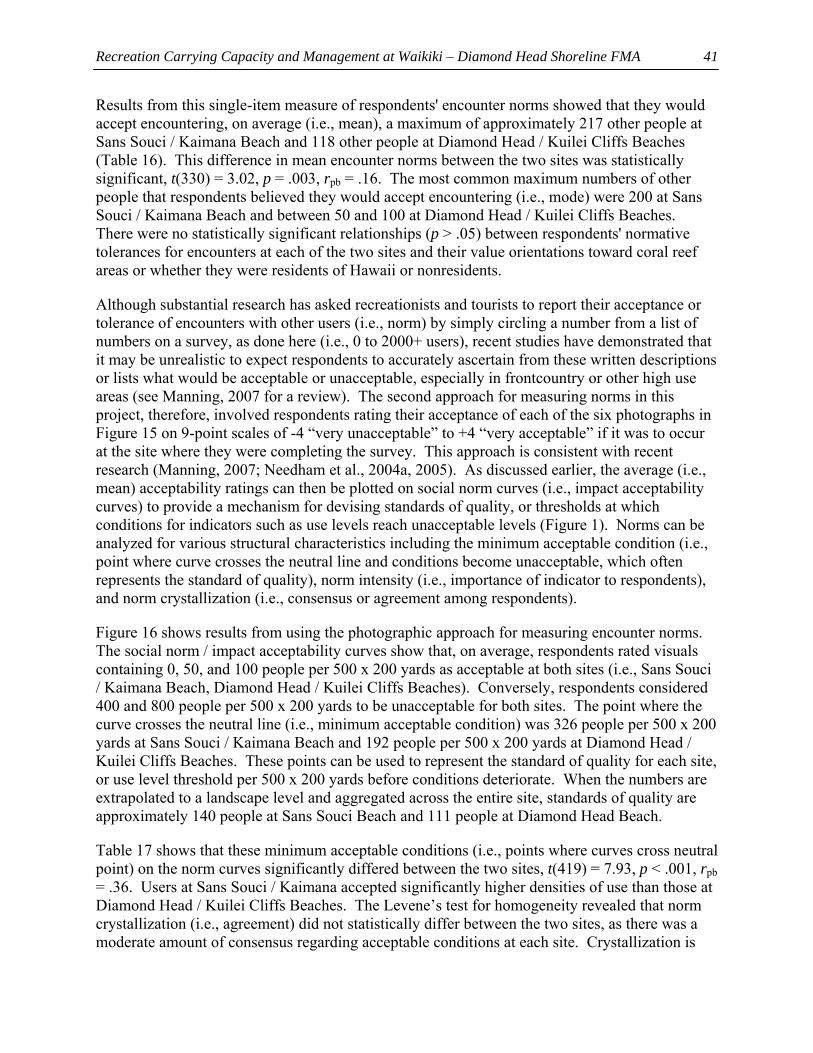
Recreation Carrying Capacity and Management at Waikiki – Diamond Head Shoreline FMA
41
Results from this single-item measure of respondents' encounter norms showed that they would accept encountering, on average (i.e., mean), a maximum of approximately 217 other people at Sans Souci / Kaimana Beach and 118 other people at Diamond Head / Kuilei Cliffs Beaches (Table 16). This difference in mean encounter norms between the two sites was statistically significant, t(330) = 3.02, p = .003, rpb = .16. The most common maximum numbers of other people that respondents believed they would accept encountering (i.e., mode) were 200 at Sans Souci / Kaimana Beach and between 50 and 100 at Diamond Head / Kuilei Cliffs Beaches. There were no statistically significant relationships (p > .05) between respondents' normative tolerances for encounters at each of the two sites and their value orientations toward coral reef areas or whether they were residents of Hawaii or nonresidents.
Although substantial research has asked recreationists and tourists to report their acceptance or tolerance of encounters with other users (i.e., norm) by simply circling a number from a list of numbers on a survey, as done here (i.e., 0 to 2000+ users), recent studies have demonstrated that it may be unrealistic to expect respondents to accurately ascertain from these written descriptions or lists what would be acceptable or unacceptable, especially in frontcountry or other high use areas (see Manning, 2007 for a review). The second approach for measuring norms in this project, therefore, involved respondents rating their acceptance of each of the six photographs in Figure 15 on 9-point scales of -4 “very unacceptable” to +4 “very acceptable” if it was to occur at the site where they were completing the survey. This approach is consistent with recent research (Manning, 2007; Needham et al., 2004a, 2005). As discussed earlier, the average (i.e., mean) acceptability ratings can then be plotted on social norm curves (i.e., impact acceptability curves) to provide a mechanism for devising standards of quality, or thresholds at which conditions for indicators such as use levels reach unacceptable levels (Figure 1). Norms can be analyzed for various structural characteristics including the minimum acceptable condition (i.e., point where curve crosses the neutral line and conditions become unacceptable, which often represents the standard of quality), norm intensity (i.e., importance of indicator to respondents), and norm crystallization (i.e., consensus or agreement among respondents).
Figure 16 shows results from using the photographic approach for measuring encounter norms. The social norm / impact acceptability curves show that, on average, respondents rated visuals containing 0, 50, and 100 people per 500 x 200 yards as acceptable at both sites (i.e., Sans Souci / Kaimana Beach, Diamond Head / Kuilei Cliffs Beaches). Conversely, respondents considered 400 and 800 people per 500 x 200 yards to be unacceptable for both sites. The point where the curve crosses the neutral line (i.e., minimum acceptable condition) was 326 people per 500 x 200 yards at Sans Souci / Kaimana Beach and 192 people per 500 x 200 yards at Diamond Head / Kuilei Cliffs Beaches. These points can be used to represent the standard of quality for each site, or use level threshold per 500 x 200 yards before conditions deteriorate. When the numbers are extrapolated to a landscape level and aggregated across the entire site, standards of quality are approximately 140 people at Sans Souci Beach and 111 people at Diamond Head Beach.
Table 17 shows that these minimum acceptable conditions (i.e., points where curves cross neutral point) on the norm curves significantly differed between the two sites, t(419) = 7.93, p < .001, rpb = .36. Users at Sans Souci / Kaimana accepted significantly higher densities of use than those at Diamond Head / Kuilei Cliffs Beaches. The Levene’s test for homogeneity revealed that norm crystallization (i.e., agreement) did not statistically differ between the two sites, as there was a moderate amount of consensus regarding acceptable conditions at each site. Crystallization is
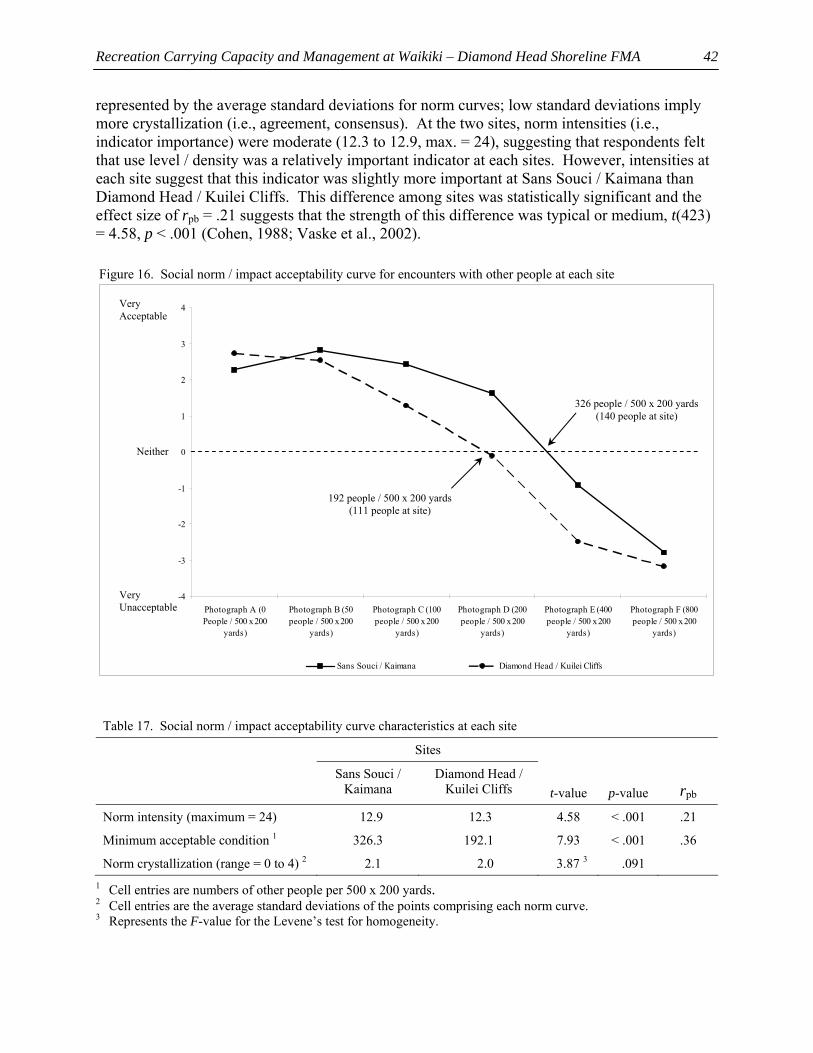
Recreation Carrying Capacity and Management at Waikiki – Diamond Head Shoreline FMA
42
represented by the average standard deviations for norm curves; low standard deviations imply more crystallization (i.e., agreement, consensus). At the two sites, norm intensities (i.e., indicator importance) were moderate (12.3 to 12.9, max. = 24), suggesting that respondents felt that use level / density was a relatively important indicator at each sites. However, intensities at each site suggest that this indicator was slightly more important at Sans Souci / Kaimana than Diamond Head / Kuilei Cliffs. This difference among sites was statistically significant and the effect size of rpb = .21 suggests that the strength of this difference was typical or medium, t(423) = 4.58, p < .001 (Cohen, 1988; Vaske et al., 2002).
Figure 16. Social norm / impact acceptability curve for encounters with other people at each site
-4
-3
-2
-1
0
1
2
3
4
Photograph A (0People / 500 x 200
yards)
Photograph B (50people / 500 x 200
yards)
Photograph C (100people / 500 x 200
yards)
Photograph D (200people / 500 x 200
yards)
Photograph E (400people / 500 x 200
yards)
Photograph F (800people / 500 x 200
yards)
Sans Souci / Kaimana Diamond Head / Kuilei Cliffs
Table 17. Social norm / impact acceptability curve characteristics at each site
Sites
Sans Souci / Kaimana
Diamond Head / Kuilei Cliffs
t-value
p-value
rpb
Norm intensity (maximum = 24) 12.9 12.3 4.58 < .001 .21
Minimum acceptable condition 1 326.3 192.1 7.93 < .001 .36
Norm crystallization (range = 0 to 4) 2 2.1 2.0 3.87 3 .091 1 Cell entries are numbers of other people per 500 x 200 yards. 2 Cell entries are the average standard deviations of the points comprising each norm curve. 3 Represents the F-value for the Levene’s test for homogeneity.
Very Acceptable
Very Unacceptable
Neither
326 people / 500 x 200 yards (140 people at site)
192 people / 500 x 200 yards (111 people at site)
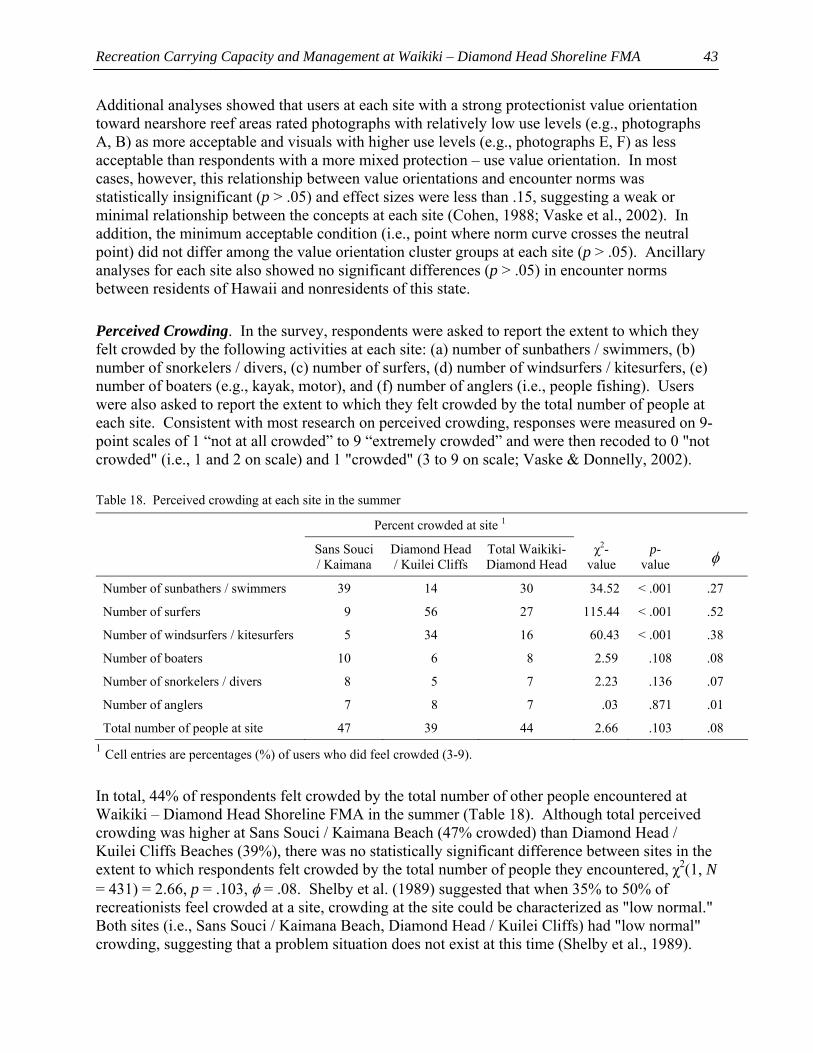
Recreation Carrying Capacity and Management at Waikiki – Diamond Head Shoreline FMA
43
Additional analyses showed that users at each site with a strong protectionist value orientation toward nearshore reef areas rated photographs with relatively low use levels (e.g., photographs A, B) as more acceptable and visuals with higher use levels (e.g., photographs E, F) as less acceptable than respondents with a more mixed protection – use value orientation. In most cases, however, this relationship between value orientations and encounter norms was statistically insignificant (p > .05) and effect sizes were less than .15, suggesting a weak or minimal relationship between the concepts at each site (Cohen, 1988; Vaske et al., 2002). In addition, the minimum acceptable condition (i.e., point where norm curve crosses the neutral point) did not differ among the value orientation cluster groups at each site (p > .05). Ancillary analyses for each site also showed no significant differences (p > .05) in encounter norms between residents of Hawaii and nonresidents of this state.
Perceived Crowding. In the survey, respondents were asked to report the extent to which they felt crowded by the following activities at each site: (a) number of sunbathers / swimmers, (b) number of snorkelers / divers, (c) number of surfers, (d) number of windsurfers / kitesurfers, (e) number of boaters (e.g., kayak, motor), and (f) number of anglers (i.e., people fishing). Users were also asked to report the extent to which they felt crowded by the total number of people at each site. Consistent with most research on perceived crowding, responses were measured on 9-point scales of 1 “not at all crowded” to 9 “extremely crowded” and were then recoded to 0 "not crowded" (i.e., 1 and 2 on scale) and 1 "crowded" (3 to 9 on scale; Vaske & Donnelly, 2002).
Table 18. Perceived crowding at each site in the summer
Percent crowded at site 1
Sans Souci / Kaimana
Diamond Head / Kuilei Cliffs
Total Waikiki-Diamond Head
χ2-value
p-value φ
Number of sunbathers / swimmers 39 14 30 34.52 < .001 .27
Number of surfers 9 56 27 115.44 < .001 .52
Number of windsurfers / kitesurfers 5 34 16 60.43 < .001 .38
Number of boaters 10 6 8 2.59 .108 .08
Number of snorkelers / divers 8 5 7 2.23 .136 .07
Number of anglers 7 8 7 .03 .871 .01
Total number of people at site 47 39 44 2.66 .103 .08 1 Cell entries are percentages (%) of users who did feel crowded (3-9).
In total, 44% of respondents felt crowded by the total number of other people encountered at Waikiki – Diamond Head Shoreline FMA in the summer (Table 18). Although total perceived crowding was higher at Sans Souci / Kaimana Beach (47% crowded) than Diamond Head / Kuilei Cliffs Beaches (39%), there was no statistically significant difference between sites in the extent to which respondents felt crowded by the total number of people they encountered, χ2(1, N = 431) = 2.66, p = .103, φ = .08. Shelby et al. (1989) suggested that when 35% to 50% of recreationists feel crowded at a site, crowding at the site could be characterized as "low normal." Both sites (i.e., Sans Souci / Kaimana Beach, Diamond Head / Kuilei Cliffs) had "low normal" crowding, suggesting that a problem situation does not exist at this time (Shelby et al., 1989).
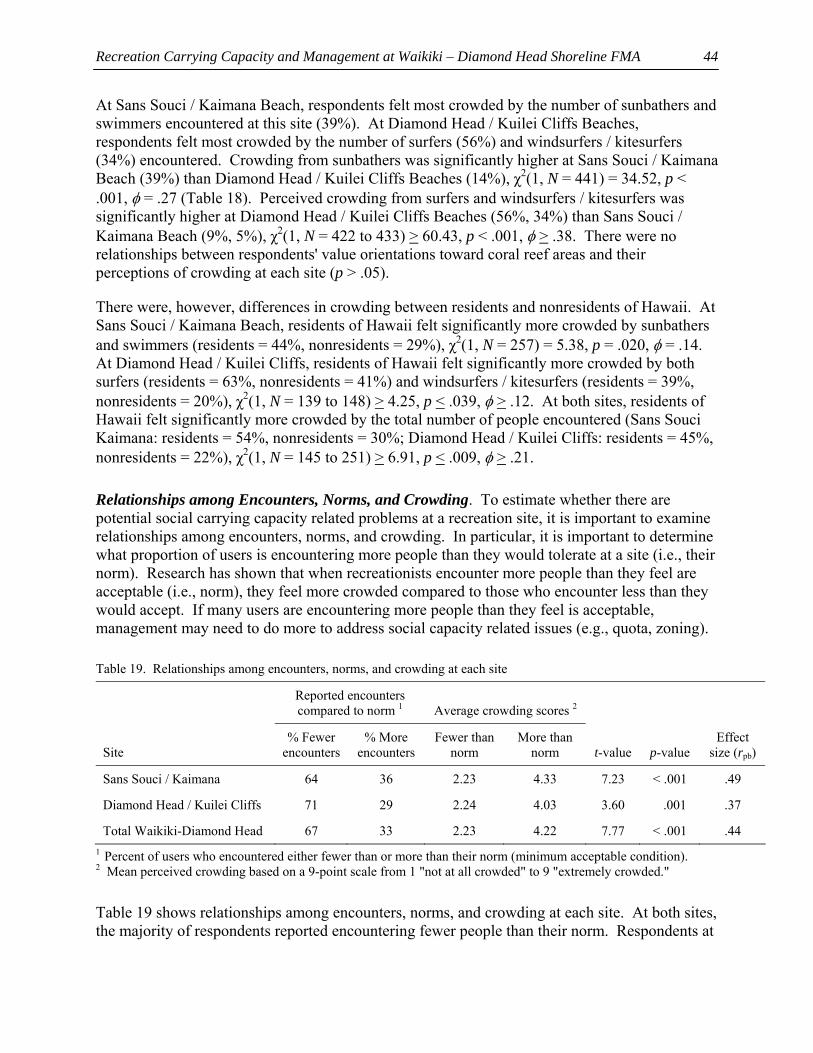
Recreation Carrying Capacity and Management at Waikiki – Diamond Head Shoreline FMA
44
At Sans Souci / Kaimana Beach, respondents felt most crowded by the number of sunbathers and swimmers encountered at this site (39%). At Diamond Head / Kuilei Cliffs Beaches, respondents felt most crowded by the number of surfers (56%) and windsurfers / kitesurfers (34%) encountered. Crowding from sunbathers was significantly higher at Sans Souci / Kaimana Beach (39%) than Diamond Head / Kuilei Cliffs Beaches (14%), χ2(1, N = 441) = 34.52, p < .001, φ = .27 (Table 18). Perceived crowding from surfers and windsurfers / kitesurfers was significantly higher at Diamond Head / Kuilei Cliffs Beaches (56%, 34%) than Sans Souci / Kaimana Beach (9%, 5%), χ2(1, N = 422 to 433) > 60.43, p < .001, φ > .38. There were no relationships between respondents' value orientations toward coral reef areas and their perceptions of crowding at each site (p > .05).
There were, however, differences in crowding between residents and nonresidents of Hawaii. At Sans Souci / Kaimana Beach, residents of Hawaii felt significantly more crowded by sunbathers and swimmers (residents = 44%, nonresidents = 29%), χ2(1, N = 257) = 5.38, p = .020, φ = .14. At Diamond Head / Kuilei Cliffs, residents of Hawaii felt significantly more crowded by both surfers (residents = 63%, nonresidents = 41%) and windsurfers / kitesurfers (residents = 39%, nonresidents = 20%), χ2(1, N = 139 to 148) > 4.25, p < .039, φ > .12. At both sites, residents of Hawaii felt significantly more crowded by the total number of people encountered (Sans Souci Kaimana: residents = 54%, nonresidents = 30%; Diamond Head / Kuilei Cliffs: residents = 45%, nonresidents = 22%), χ2(1, N = 145 to 251) > 6.91, p < .009, φ > .21.
Relationships among Encounters, Norms, and Crowding. To estimate whether there are potential social carrying capacity related problems at a recreation site, it is important to examine relationships among encounters, norms, and crowding. In particular, it is important to determine what proportion of users is encountering more people than they would tolerate at a site (i.e., their norm). Research has shown that when recreationists encounter more people than they feel are acceptable (i.e., norm), they feel more crowded compared to those who encounter less than they would accept. If many users are encountering more people than they feel is acceptable, management may need to do more to address social capacity related issues (e.g., quota, zoning).
Table 19. Relationships among encounters, norms, and crowding at each site
Reported encounters compared to norm 1
Average crowding scores 2
Site
% Fewer encounters
% More encounters
Fewer than norm
More than norm
t-value
p-value
Effect size (rpb)
Sans Souci / Kaimana 64 36 2.23 4.33 7.23 < .001 .49
Diamond Head / Kuilei Cliffs 71 29 2.24 4.03 3.60 .001 .37
Total Waikiki-Diamond Head 67 33 2.23 4.22 7.77 < .001 .44 1 Percent of users who encountered either fewer than or more than their norm (minimum acceptable condition). 2 Mean perceived crowding based on a 9-point scale from 1 "not at all crowded" to 9 "extremely crowded."
Table 19 shows relationships among encounters, norms, and crowding at each site. At both sites, the majority of respondents reported encountering fewer people than their norm. Respondents at
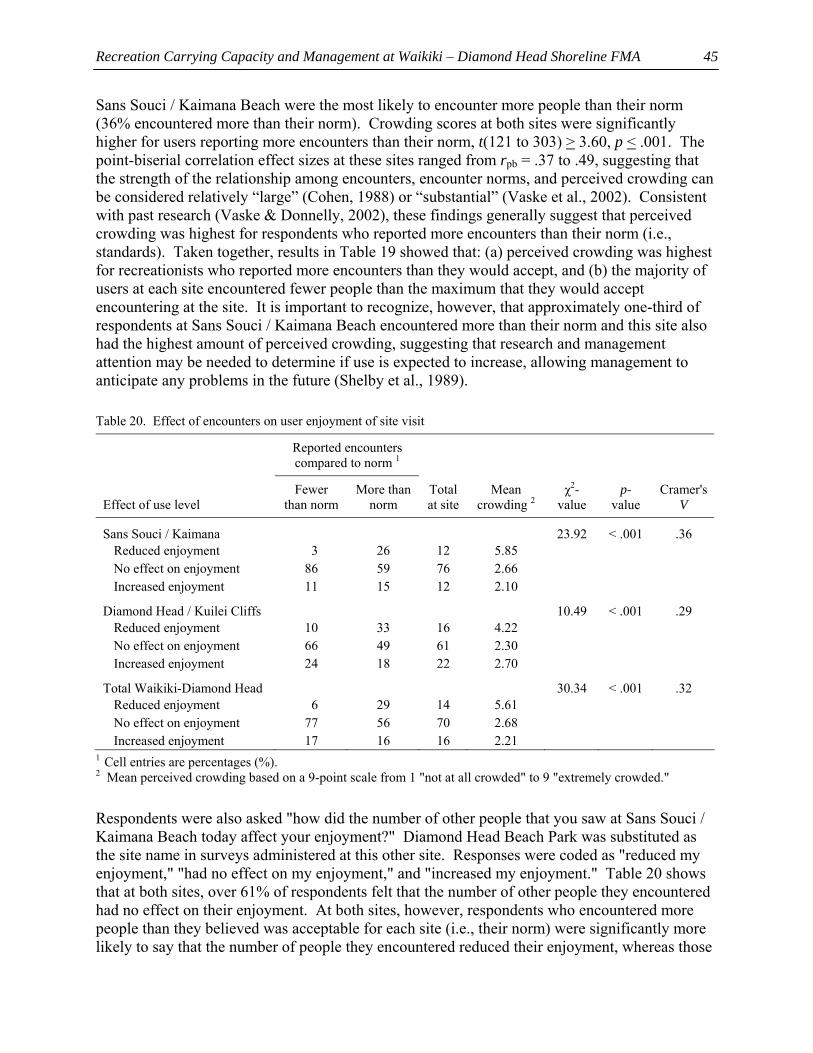
Recreation Carrying Capacity and Management at Waikiki – Diamond Head Shoreline FMA
45
Sans Souci / Kaimana Beach were the most likely to encounter more people than their norm (36% encountered more than their norm). Crowding scores at both sites were significantly higher for users reporting more encounters than their norm, t(121 to 303) > 3.60, p < .001. The point-biserial correlation effect sizes at these sites ranged from rpb = .37 to .49, suggesting that the strength of the relationship among encounters, encounter norms, and perceived crowding can be considered relatively “large” (Cohen, 1988) or “substantial” (Vaske et al., 2002). Consistent with past research (Vaske & Donnelly, 2002), these findings generally suggest that perceived crowding was highest for respondents who reported more encounters than their norm (i.e., standards). Taken together, results in Table 19 showed that: (a) perceived crowding was highest for recreationists who reported more encounters than they would accept, and (b) the majority of users at each site encountered fewer people than the maximum that they would accept encountering at the site. It is important to recognize, however, that approximately one-third of respondents at Sans Souci / Kaimana Beach encountered more than their norm and this site also had the highest amount of perceived crowding, suggesting that research and management attention may be needed to determine if use is expected to increase, allowing management to anticipate any problems in the future (Shelby et al., 1989).
Table 20. Effect of encounters on user enjoyment of site visit
Reported encounters compared to norm 1
Effect of use level
Fewer than norm
More than norm
Total at site
Mean crowding 2
χ2-value
p-value
Cramer's V
Sans Souci / Kaimana 23.92 < .001 .36 Reduced enjoyment 3 26 12 5.85 No effect on enjoyment 86 59 76 2.66 Increased enjoyment 11 15 12 2.10
Diamond Head / Kuilei Cliffs 10.49 < .001 .29 Reduced enjoyment 10 33 16 4.22 No effect on enjoyment 66 49 61 2.30 Increased enjoyment 24 18 22 2.70
Total Waikiki-Diamond Head 30.34 < .001 .32 Reduced enjoyment 6 29 14 5.61 No effect on enjoyment 77 56 70 2.68 Increased enjoyment 17 16 16 2.21
1 Cell entries are percentages (%). 2 Mean perceived crowding based on a 9-point scale from 1 "not at all crowded" to 9 "extremely crowded."
Respondents were also asked "how did the number of other people that you saw at Sans Souci / Kaimana Beach today affect your enjoyment?" Diamond Head Beach Park was substituted as the site name in surveys administered at this other site. Responses were coded as "reduced my enjoyment," "had no effect on my enjoyment," and "increased my enjoyment." Table 20 shows that at both sites, over 61% of respondents felt that the number of other people they encountered had no effect on their enjoyment. At both sites, however, respondents who encountered more people than they believed was acceptable for each site (i.e., their norm) were significantly more likely to say that the number of people they encountered reduced their enjoyment, whereas those
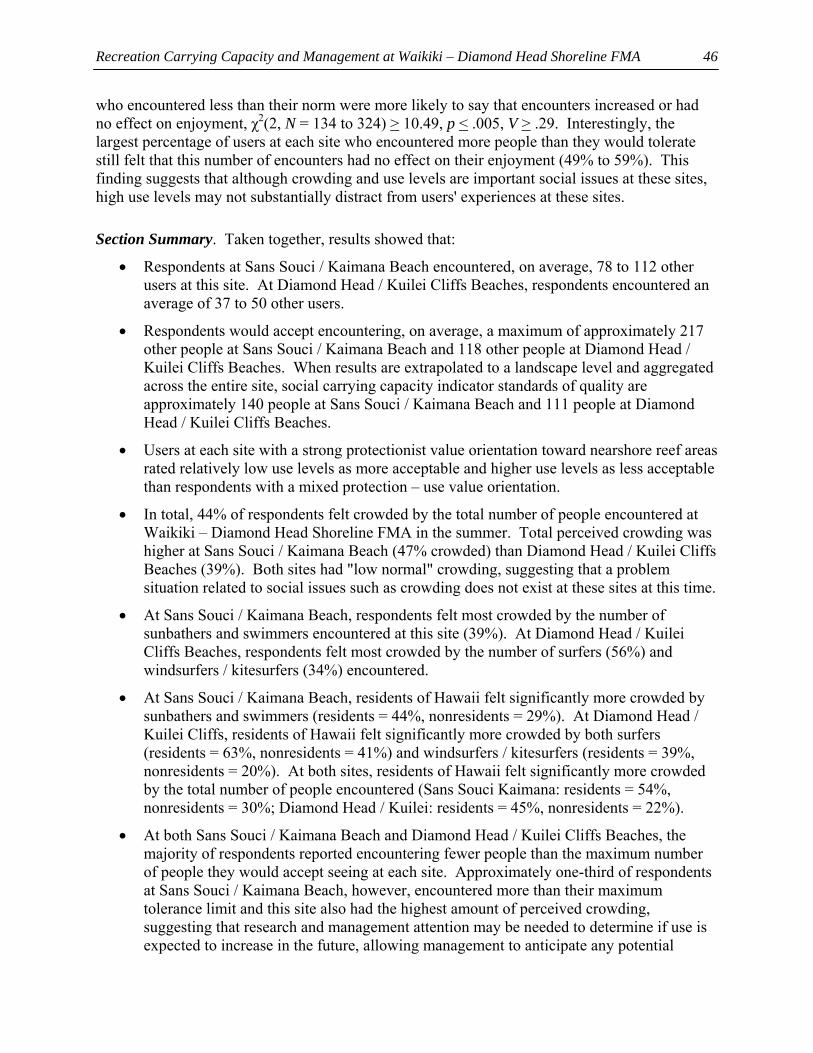
Recreation Carrying Capacity and Management at Waikiki – Diamond Head Shoreline FMA
46
who encountered less than their norm were more likely to say that encounters increased or had no effect on enjoyment, χ2(2, N = 134 to 324) > 10.49, p < .005, V > .29. Interestingly, the largest percentage of users at each site who encountered more people than they would tolerate still felt that this number of encounters had no effect on their enjoyment (49% to 59%). This finding suggests that although crowding and use levels are important social issues at these sites, high use levels may not substantially distract from users' experiences at these sites.
Section Summary. Taken together, results showed that:
• Respondents at Sans Souci / Kaimana Beach encountered, on average, 78 to 112 other users at this site. At Diamond Head / Kuilei Cliffs Beaches, respondents encountered an average of 37 to 50 other users.
• Respondents would accept encountering, on average, a maximum of approximately 217 other people at Sans Souci / Kaimana Beach and 118 other people at Diamond Head / Kuilei Cliffs Beaches. When results are extrapolated to a landscape level and aggregated across the entire site, social carrying capacity indicator standards of quality are approximately 140 people at Sans Souci / Kaimana Beach and 111 people at Diamond Head / Kuilei Cliffs Beaches.
• Users at each site with a strong protectionist value orientation toward nearshore reef areas rated relatively low use levels as more acceptable and higher use levels as less acceptable than respondents with a mixed protection – use value orientation.
• In total, 44% of respondents felt crowded by the total number of people encountered at Waikiki – Diamond Head Shoreline FMA in the summer. Total perceived crowding was higher at Sans Souci / Kaimana Beach (47% crowded) than Diamond Head / Kuilei Cliffs Beaches (39%). Both sites had "low normal" crowding, suggesting that a problem situation related to social issues such as crowding does not exist at these sites at this time.
• At Sans Souci / Kaimana Beach, respondents felt most crowded by the number of sunbathers and swimmers encountered at this site (39%). At Diamond Head / Kuilei Cliffs Beaches, respondents felt most crowded by the number of surfers (56%) and windsurfers / kitesurfers (34%) encountered.
• At Sans Souci / Kaimana Beach, residents of Hawaii felt significantly more crowded by sunbathers and swimmers (residents = 44%, nonresidents = 29%). At Diamond Head / Kuilei Cliffs, residents of Hawaii felt significantly more crowded by both surfers (residents = 63%, nonresidents = 41%) and windsurfers / kitesurfers (residents = 39%, nonresidents = 20%). At both sites, residents of Hawaii felt significantly more crowded by the total number of people encountered (Sans Souci Kaimana: residents = 54%, nonresidents = 30%; Diamond Head / Kuilei: residents = 45%, nonresidents = 22%).
• At both Sans Souci / Kaimana Beach and Diamond Head / Kuilei Cliffs Beaches, the majority of respondents reported encountering fewer people than the maximum number of people they would accept seeing at each site. Approximately one-third of respondents at Sans Souci / Kaimana Beach, however, encountered more than their maximum tolerance limit and this site also had the highest amount of perceived crowding, suggesting that research and management attention may be needed to determine if use is expected to increase in the future, allowing management to anticipate any potential
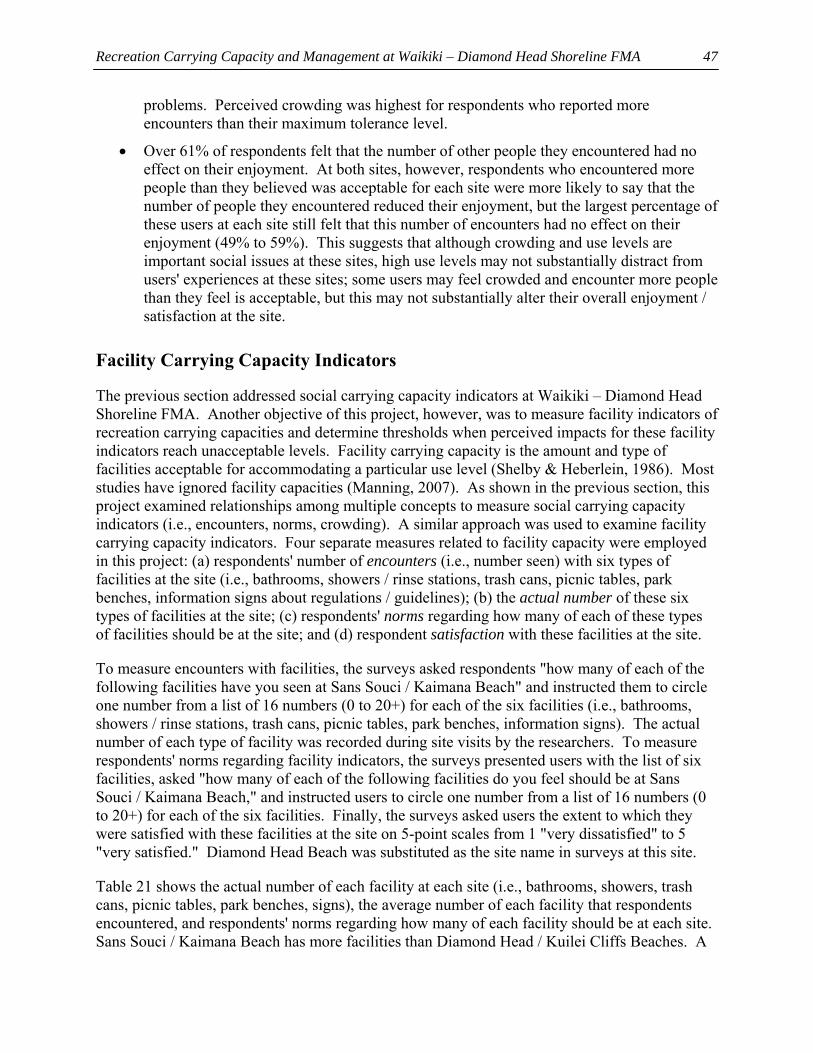
Recreation Carrying Capacity and Management at Waikiki – Diamond Head Shoreline FMA
47
problems. Perceived crowding was highest for respondents who reported more encounters than their maximum tolerance level.
• Over 61% of respondents felt that the number of other people they encountered had no effect on their enjoyment. At both sites, however, respondents who encountered more people than they believed was acceptable for each site were more likely to say that the number of people they encountered reduced their enjoyment, but the largest percentage of these users at each site still felt that this number of encounters had no effect on their enjoyment (49% to 59%). This suggests that although crowding and use levels are important social issues at these sites, high use levels may not substantially distract from users' experiences at these sites; some users may feel crowded and encounter more people than they feel is acceptable, but this may not substantially alter their overall enjoyment / satisfaction at the site.
Facility Carrying Capacity Indicators
The previous section addressed social carrying capacity indicators at Waikiki – Diamond Head Shoreline FMA. Another objective of this project, however, was to measure facility indicators of recreation carrying capacities and determine thresholds when perceived impacts for these facility indicators reach unacceptable levels. Facility carrying capacity is the amount and type of facilities acceptable for accommodating a particular use level (Shelby & Heberlein, 1986). Most studies have ignored facility capacities (Manning, 2007). As shown in the previous section, this project examined relationships among multiple concepts to measure social carrying capacity indicators (i.e., encounters, norms, crowding). A similar approach was used to examine facility carrying capacity indicators. Four separate measures related to facility capacity were employed in this project: (a) respondents' number of encounters (i.e., number seen) with six types of facilities at the site (i.e., bathrooms, showers / rinse stations, trash cans, picnic tables, park benches, information signs about regulations / guidelines); (b) the actual number of these six types of facilities at the site; (c) respondents' norms regarding how many of each of these types of facilities should be at the site; and (d) respondent satisfaction with these facilities at the site.
To measure encounters with facilities, the surveys asked respondents "how many of each of the following facilities have you seen at Sans Souci / Kaimana Beach" and instructed them to circle one number from a list of 16 numbers (0 to 20+) for each of the six facilities (i.e., bathrooms, showers / rinse stations, trash cans, picnic tables, park benches, information signs). The actual number of each type of facility was recorded during site visits by the researchers. To measure respondents' norms regarding facility indicators, the surveys presented users with the list of six facilities, asked "how many of each of the following facilities do you feel should be at Sans Souci / Kaimana Beach," and instructed users to circle one number from a list of 16 numbers (0 to 20+) for each of the six facilities. Finally, the surveys asked users the extent to which they were satisfied with these facilities at the site on 5-point scales from 1 "very dissatisfied" to 5 "very satisfied." Diamond Head Beach was substituted as the site name in surveys at this site.
Table 21 shows the actual number of each facility at each site (i.e., bathrooms, showers, trash cans, picnic tables, park benches, signs), the average number of each facility that respondents encountered, and respondents' norms regarding how many of each facility should be at each site. Sans Souci / Kaimana Beach has more facilities than Diamond Head / Kuilei Cliffs Beaches. A
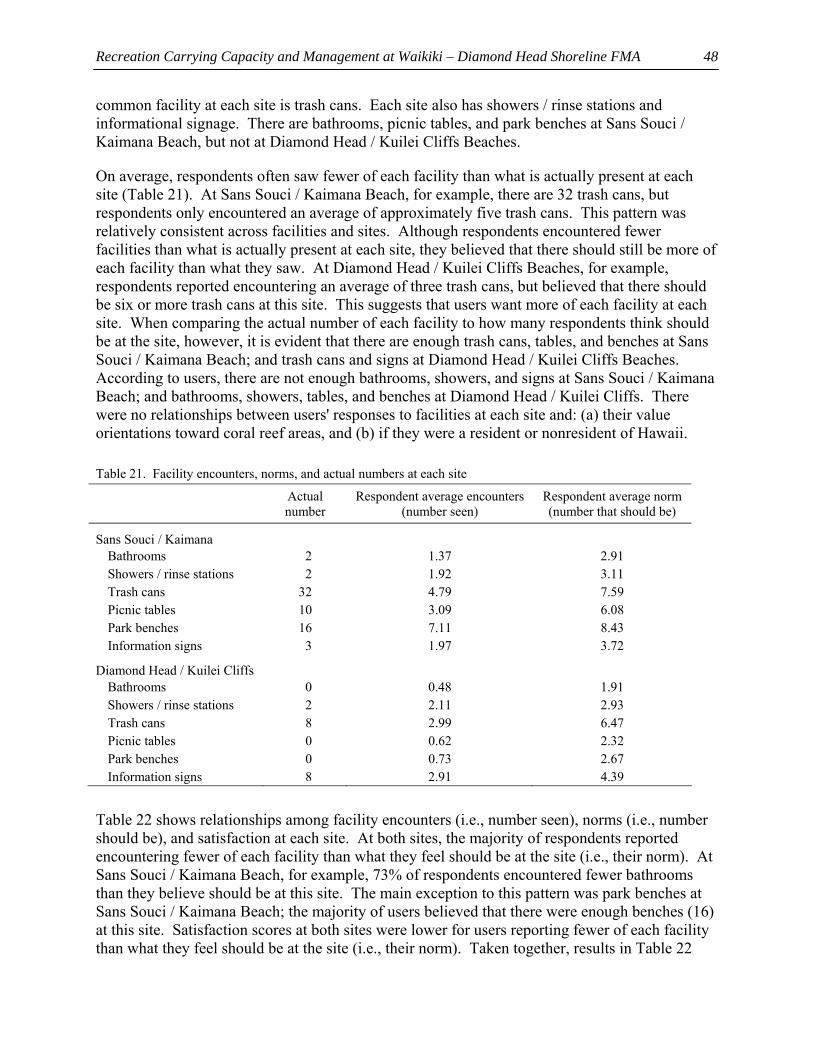
Recreation Carrying Capacity and Management at Waikiki – Diamond Head Shoreline FMA
48
common facility at each site is trash cans. Each site also has showers / rinse stations and informational signage. There are bathrooms, picnic tables, and park benches at Sans Souci / Kaimana Beach, but not at Diamond Head / Kuilei Cliffs Beaches.
On average, respondents often saw fewer of each facility than what is actually present at each site (Table 21). At Sans Souci / Kaimana Beach, for example, there are 32 trash cans, but respondents only encountered an average of approximately five trash cans. This pattern was relatively consistent across facilities and sites. Although respondents encountered fewer facilities than what is actually present at each site, they believed that there should still be more of each facility than what they saw. At Diamond Head / Kuilei Cliffs Beaches, for example, respondents reported encountering an average of three trash cans, but believed that there should be six or more trash cans at this site. This suggests that users want more of each facility at each site. When comparing the actual number of each facility to how many respondents think should be at the site, however, it is evident that there are enough trash cans, tables, and benches at Sans Souci / Kaimana Beach; and trash cans and signs at Diamond Head / Kuilei Cliffs Beaches. According to users, there are not enough bathrooms, showers, and signs at Sans Souci / Kaimana Beach; and bathrooms, showers, tables, and benches at Diamond Head / Kuilei Cliffs. There were no relationships between users' responses to facilities at each site and: (a) their value orientations toward coral reef areas, and (b) if they were a resident or nonresident of Hawaii.
Table 21. Facility encounters, norms, and actual numbers at each site
Actual number
Respondent average encounters(number seen)
Respondent average norm(number that should be)
Sans Souci / Kaimana Bathrooms 2 1.37 2.91 Showers / rinse stations 2 1.92 3.11 Trash cans 32 4.79 7.59 Picnic tables 10 3.09 6.08 Park benches 16 7.11 8.43 Information signs 3 1.97 3.72
Diamond Head / Kuilei Cliffs Bathrooms 0 0.48 1.91 Showers / rinse stations 2 2.11 2.93 Trash cans 8 2.99 6.47 Picnic tables 0 0.62 2.32 Park benches 0 0.73 2.67 Information signs 8 2.91 4.39
Table 22 shows relationships among facility encounters (i.e., number seen), norms (i.e., number should be), and satisfaction at each site. At both sites, the majority of respondents reported encountering fewer of each facility than what they feel should be at the site (i.e., their norm). At Sans Souci / Kaimana Beach, for example, 73% of respondents encountered fewer bathrooms than they believe should be at this site. The main exception to this pattern was park benches at Sans Souci / Kaimana Beach; the majority of users believed that there were enough benches (16) at this site. Satisfaction scores at both sites were lower for users reporting fewer of each facility than what they feel should be at the site (i.e., their norm). Taken together, results in Table 22
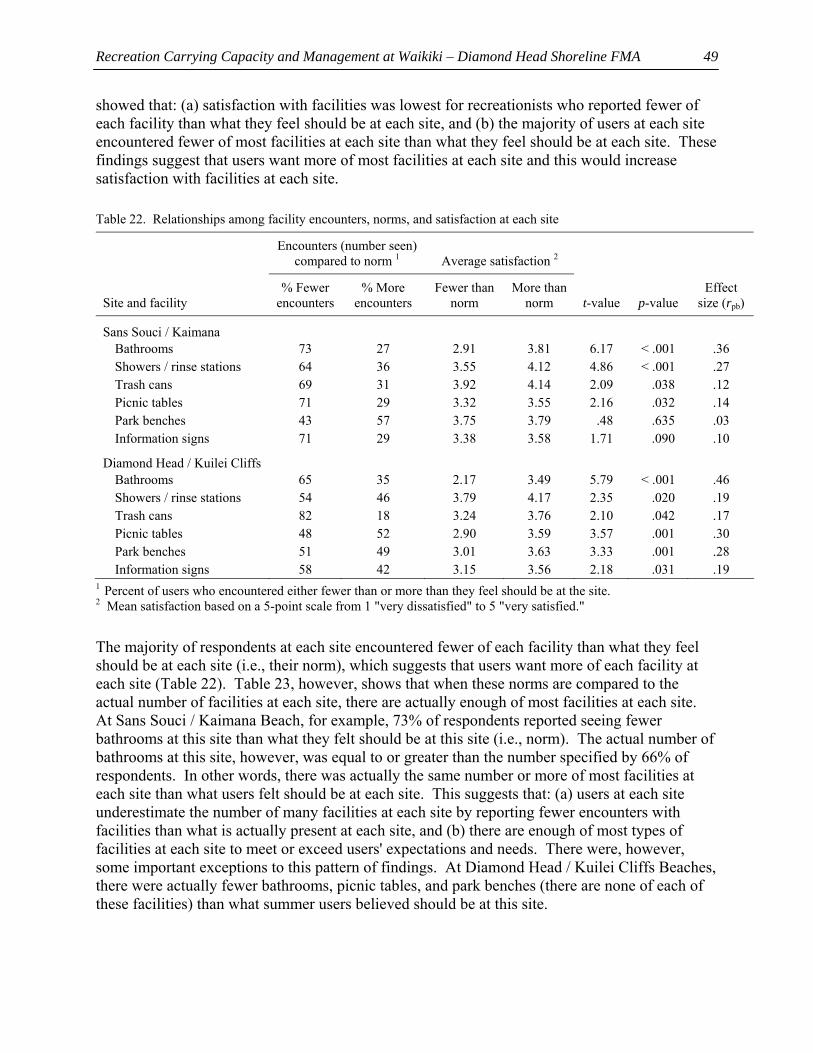
Recreation Carrying Capacity and Management at Waikiki – Diamond Head Shoreline FMA
49
showed that: (a) satisfaction with facilities was lowest for recreationists who reported fewer of each facility than what they feel should be at each site, and (b) the majority of users at each site encountered fewer of most facilities at each site than what they feel should be at each site. These findings suggest that users want more of most facilities at each site and this would increase satisfaction with facilities at each site.
Table 22. Relationships among facility encounters, norms, and satisfaction at each site
Encounters (number seen) compared to norm 1
Average satisfaction 2
Site and facility
% Fewer encounters
% More encounters
Fewer than norm
More than norm
t-value
p-value
Effect size (rpb)
Sans Souci / Kaimana Bathrooms 73 27 2.91 3.81 6.17 < .001 .36 Showers / rinse stations 64 36 3.55 4.12 4.86 < .001 .27 Trash cans 69 31 3.92 4.14 2.09 .038 .12 Picnic tables 71 29 3.32 3.55 2.16 .032 .14 Park benches 43 57 3.75 3.79 .48 .635 .03 Information signs 71 29 3.38 3.58 1.71 .090 .10
Diamond Head / Kuilei Cliffs Bathrooms 65 35 2.17 3.49 5.79 < .001 .46 Showers / rinse stations 54 46 3.79 4.17 2.35 .020 .19 Trash cans 82 18 3.24 3.76 2.10 .042 .17 Picnic tables 48 52 2.90 3.59 3.57 .001 .30 Park benches 51 49 3.01 3.63 3.33 .001 .28 Information signs 58 42 3.15 3.56 2.18 .031 .19
1 Percent of users who encountered either fewer than or more than they feel should be at the site. 2 Mean satisfaction based on a 5-point scale from 1 "very dissatisfied" to 5 "very satisfied."
The majority of respondents at each site encountered fewer of each facility than what they feel should be at each site (i.e., their norm), which suggests that users want more of each facility at each site (Table 22). Table 23, however, shows that when these norms are compared to the actual number of facilities at each site, there are actually enough of most facilities at each site. At Sans Souci / Kaimana Beach, for example, 73% of respondents reported seeing fewer bathrooms at this site than what they felt should be at this site (i.e., norm). The actual number of bathrooms at this site, however, was equal to or greater than the number specified by 66% of respondents. In other words, there was actually the same number or more of most facilities at each site than what users felt should be at each site. This suggests that: (a) users at each site underestimate the number of many facilities at each site by reporting fewer encounters with facilities than what is actually present at each site, and (b) there are enough of most types of facilities at each site to meet or exceed users' expectations and needs. There were, however, some important exceptions to this pattern of findings. At Diamond Head / Kuilei Cliffs Beaches, there were actually fewer bathrooms, picnic tables, and park benches (there are none of each of these facilities) than what summer users believed should be at this site.
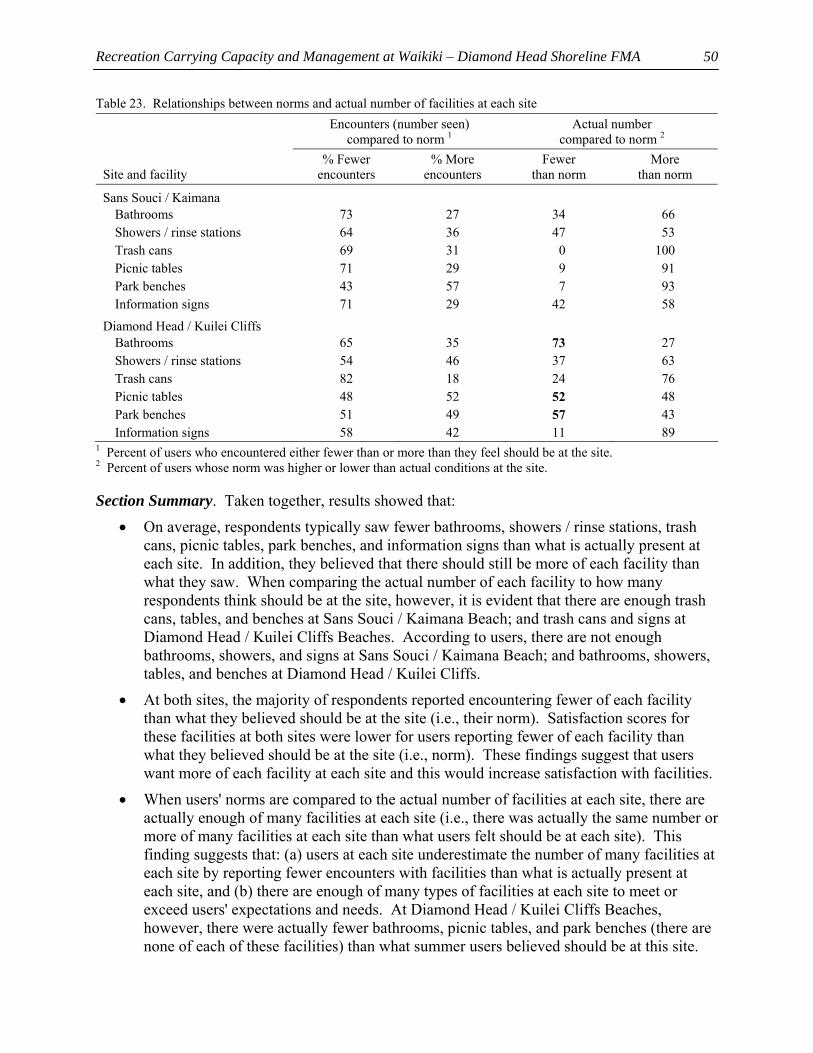
Recreation Carrying Capacity and Management at Waikiki – Diamond Head Shoreline FMA
50
Table 23. Relationships between norms and actual number of facilities at each site Encounters (number seen)
compared to norm 1 Actual number
compared to norm 2 Site and facility
% Fewer encounters
% More encounters
Fewer than norm
More than norm
Sans Souci / Kaimana Bathrooms 73 27 34 66 Showers / rinse stations 64 36 47 53 Trash cans 69 31 0 100 Picnic tables 71 29 9 91 Park benches 43 57 7 93 Information signs 71 29 42 58
Diamond Head / Kuilei Cliffs Bathrooms 65 35 73 27 Showers / rinse stations 54 46 37 63 Trash cans 82 18 24 76 Picnic tables 48 52 52 48 Park benches 51 49 57 43 Information signs 58 42 11 89
1 Percent of users who encountered either fewer than or more than they feel should be at the site. 2 Percent of users whose norm was higher or lower than actual conditions at the site.
Section Summary. Taken together, results showed that: • On average, respondents typically saw fewer bathrooms, showers / rinse stations, trash
cans, picnic tables, park benches, and information signs than what is actually present at each site. In addition, they believed that there should still be more of each facility than what they saw. When comparing the actual number of each facility to how many respondents think should be at the site, however, it is evident that there are enough trash cans, tables, and benches at Sans Souci / Kaimana Beach; and trash cans and signs at Diamond Head / Kuilei Cliffs Beaches. According to users, there are not enough bathrooms, showers, and signs at Sans Souci / Kaimana Beach; and bathrooms, showers, tables, and benches at Diamond Head / Kuilei Cliffs.
• At both sites, the majority of respondents reported encountering fewer of each facility than what they believed should be at the site (i.e., their norm). Satisfaction scores for these facilities at both sites were lower for users reporting fewer of each facility than what they believed should be at the site (i.e., norm). These findings suggest that users want more of each facility at each site and this would increase satisfaction with facilities.
• When users' norms are compared to the actual number of facilities at each site, there are actually enough of many facilities at each site (i.e., there was actually the same number or more of many facilities at each site than what users felt should be at each site). This finding suggests that: (a) users at each site underestimate the number of many facilities at each site by reporting fewer encounters with facilities than what is actually present at each site, and (b) there are enough of many types of facilities at each site to meet or exceed users' expectations and needs. At Diamond Head / Kuilei Cliffs Beaches, however, there were actually fewer bathrooms, picnic tables, and park benches (there are none of each of these facilities) than what summer users believed should be at this site.
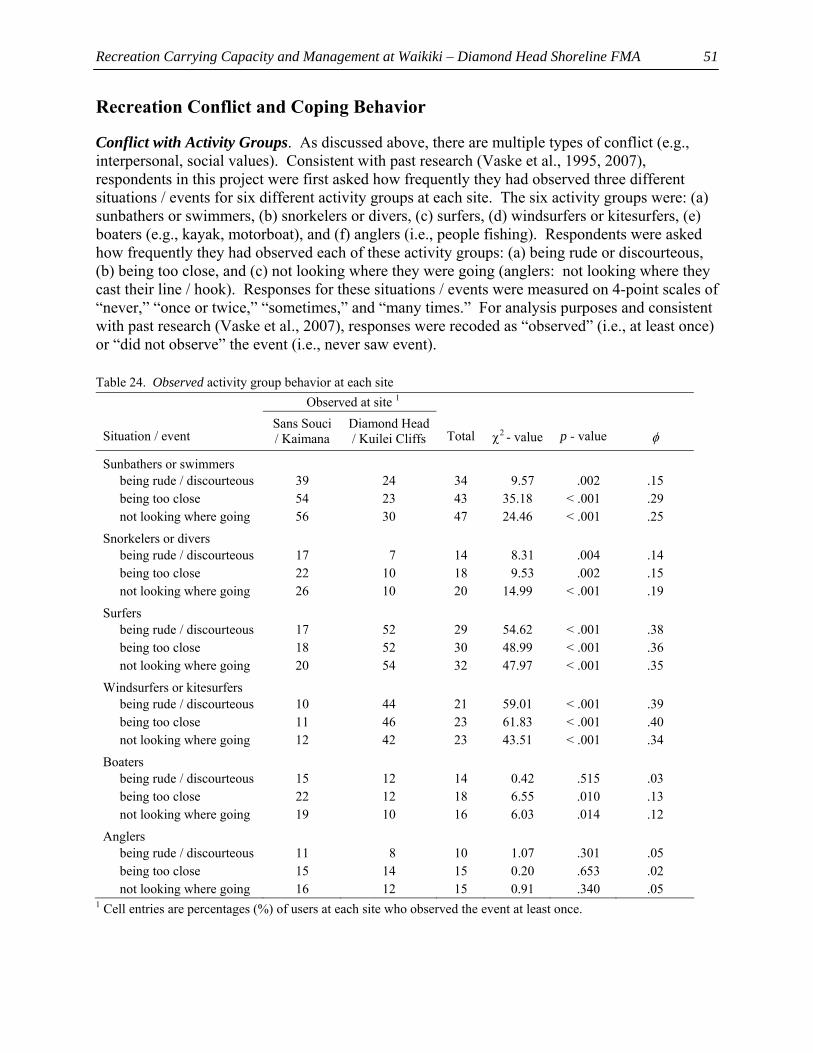
Recreation Carrying Capacity and Management at Waikiki – Diamond Head Shoreline FMA
51
Recreation Conflict and Coping Behavior
Conflict with Activity Groups. As discussed above, there are multiple types of conflict (e.g., interpersonal, social values). Consistent with past research (Vaske et al., 1995, 2007), respondents in this project were first asked how frequently they had observed three different situations / events for six different activity groups at each site. The six activity groups were: (a) sunbathers or swimmers, (b) snorkelers or divers, (c) surfers, (d) windsurfers or kitesurfers, (e) boaters (e.g., kayak, motorboat), and (f) anglers (i.e., people fishing). Respondents were asked how frequently they had observed each of these activity groups: (a) being rude or discourteous, (b) being too close, and (c) not looking where they were going (anglers: not looking where they cast their line / hook). Responses for these situations / events were measured on 4-point scales of “never,” “once or twice,” “sometimes,” and “many times.” For analysis purposes and consistent with past research (Vaske et al., 2007), responses were recoded as “observed” (i.e., at least once) or “did not observe” the event (i.e., never saw event).
Table 24. Observed activity group behavior at each site Observed at site 1 Situation / event
Sans Souci / Kaimana
Diamond Head / Kuilei Cliffs
Total
χ2 - value
p - value
φ
Sunbathers or swimmers being rude / discourteous 39 24 34 9.57 .002 .15 being too close 54 23 43 35.18 < .001 .29 not looking where going 56 30 47 24.46 < .001 .25
Snorkelers or divers being rude / discourteous 17 7 14 8.31 .004 .14 being too close 22 10 18 9.53 .002 .15 not looking where going 26 10 20 14.99 < .001 .19
Surfers being rude / discourteous 17 52 29 54.62 < .001 .38 being too close 18 52 30 48.99 < .001 .36 not looking where going 20 54 32 47.97 < .001 .35
Windsurfers or kitesurfers being rude / discourteous 10 44 21 59.01 < .001 .39 being too close 11 46 23 61.83 < .001 .40 not looking where going 12 42 23 43.51 < .001 .34
Boaters being rude / discourteous 15 12 14 0.42 .515 .03 being too close 22 12 18 6.55 .010 .13 not looking where going 19 10 16 6.03 .014 .12
Anglers being rude / discourteous 11 8 10 1.07 .301 .05 being too close 15 14 15 0.20 .653 .02 not looking where going 16 12 15 0.91 .340 .05
1 Cell entries are percentages (%) of users at each site who observed the event at least once.
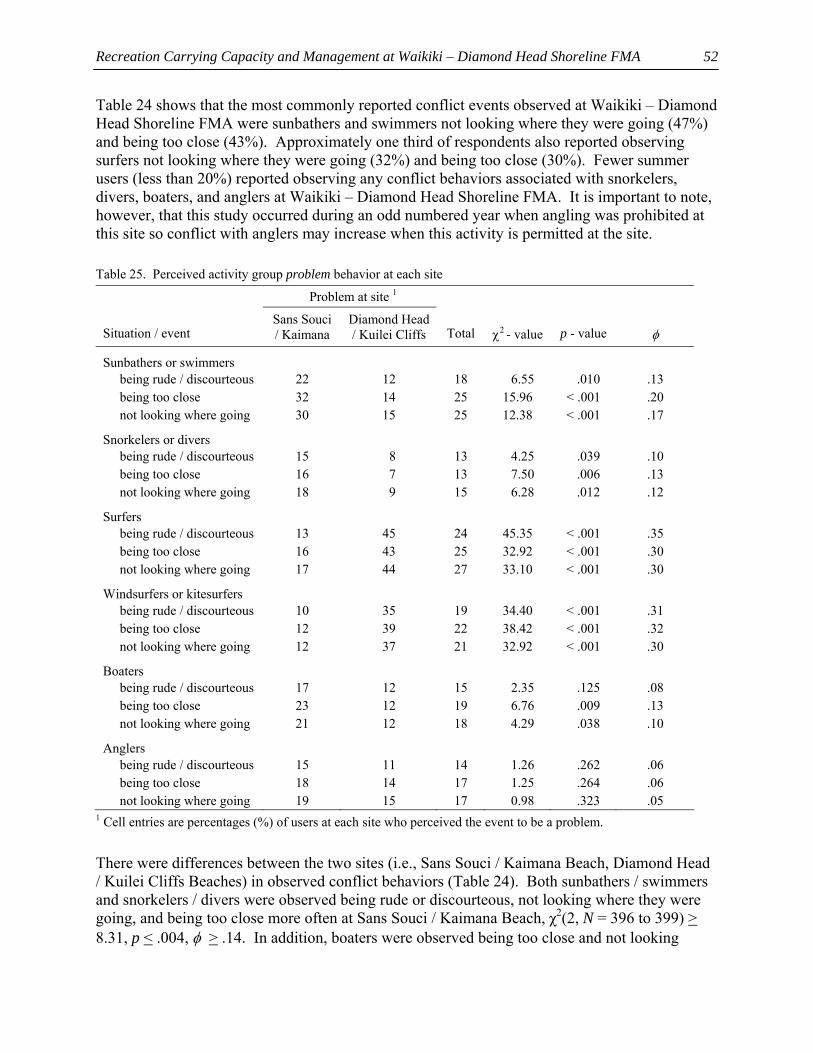
Recreation Carrying Capacity and Management at Waikiki – Diamond Head Shoreline FMA
52
Table 24 shows that the most commonly reported conflict events observed at Waikiki – Diamond Head Shoreline FMA were sunbathers and swimmers not looking where they were going (47%) and being too close (43%). Approximately one third of respondents also reported observing surfers not looking where they were going (32%) and being too close (30%). Fewer summer users (less than 20%) reported observing any conflict behaviors associated with snorkelers, divers, boaters, and anglers at Waikiki – Diamond Head Shoreline FMA. It is important to note, however, that this study occurred during an odd numbered year when angling was prohibited at this site so conflict with anglers may increase when this activity is permitted at the site.
Table 25. Perceived activity group problem behavior at each site
Problem at site 1 Situation / event
Sans Souci / Kaimana
Diamond Head / Kuilei Cliffs
Total
χ2 - value
p - value
φ
Sunbathers or swimmers being rude / discourteous 22 12 18 6.55 .010 .13 being too close 32 14 25 15.96 < .001 .20 not looking where going 30 15 25 12.38 < .001 .17
Snorkelers or divers being rude / discourteous 15 8 13 4.25 .039 .10 being too close 16 7 13 7.50 .006 .13 not looking where going 18 9 15 6.28 .012 .12
Surfers being rude / discourteous 13 45 24 45.35 < .001 .35 being too close 16 43 25 32.92 < .001 .30 not looking where going 17 44 27 33.10 < .001 .30
Windsurfers or kitesurfers being rude / discourteous 10 35 19 34.40 < .001 .31 being too close 12 39 22 38.42 < .001 .32 not looking where going 12 37 21 32.92 < .001 .30
Boaters being rude / discourteous 17 12 15 2.35 .125 .08 being too close 23 12 19 6.76 .009 .13 not looking where going 21 12 18 4.29 .038 .10
Anglers being rude / discourteous 15 11 14 1.26 .262 .06 being too close 18 14 17 1.25 .264 .06 not looking where going 19 15 17 0.98 .323 .05
1 Cell entries are percentages (%) of users at each site who perceived the event to be a problem.
There were differences between the two sites (i.e., Sans Souci / Kaimana Beach, Diamond Head / Kuilei Cliffs Beaches) in observed conflict behaviors (Table 24). Both sunbathers / swimmers and snorkelers / divers were observed being rude or discourteous, not looking where they were going, and being too close more often at Sans Souci / Kaimana Beach, χ2(2, N = 396 to 399) > 8.31, p < .004, φ > .14. In addition, boaters were observed being too close and not looking
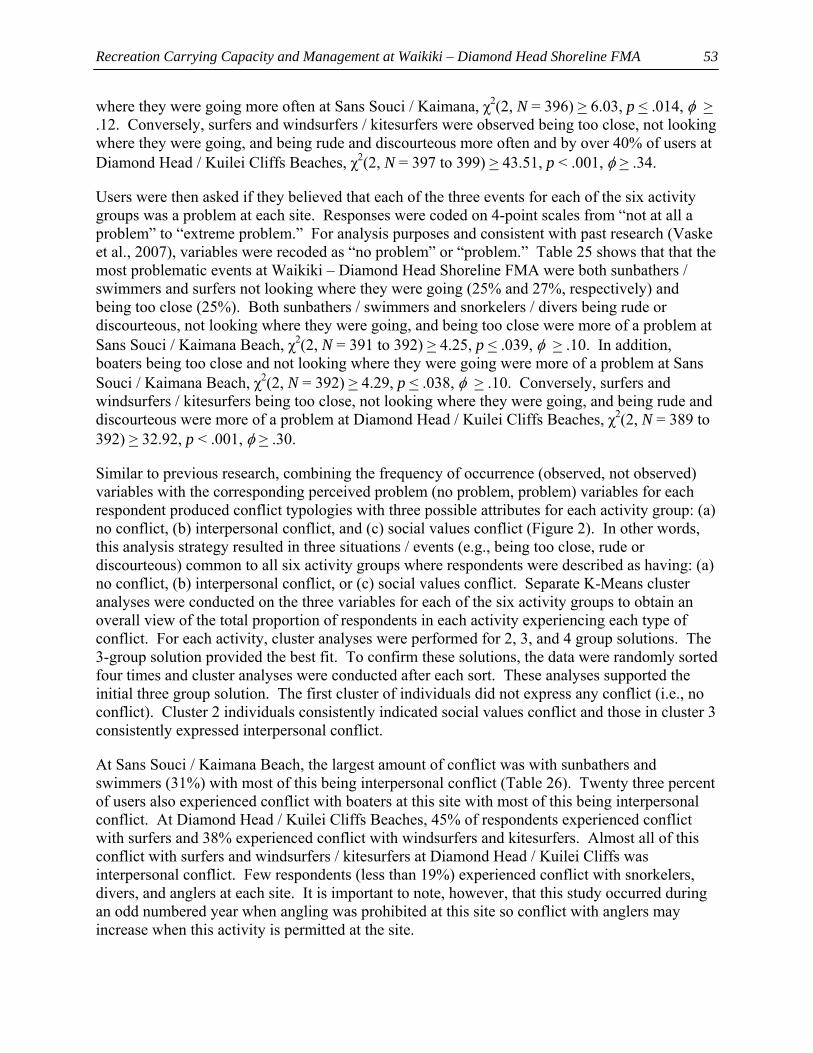
Recreation Carrying Capacity and Management at Waikiki – Diamond Head Shoreline FMA
53
where they were going more often at Sans Souci / Kaimana, χ2(2, N = 396) > 6.03, p < .014, φ > .12. Conversely, surfers and windsurfers / kitesurfers were observed being too close, not looking where they were going, and being rude and discourteous more often and by over 40% of users at Diamond Head / Kuilei Cliffs Beaches, χ2(2, N = 397 to 399) > 43.51, p < .001, φ > .34.
Users were then asked if they believed that each of the three events for each of the six activity groups was a problem at each site. Responses were coded on 4-point scales from “not at all a problem” to “extreme problem.” For analysis purposes and consistent with past research (Vaske et al., 2007), variables were recoded as “no problem” or “problem.” Table 25 shows that that the most problematic events at Waikiki – Diamond Head Shoreline FMA were both sunbathers / swimmers and surfers not looking where they were going (25% and 27%, respectively) and being too close (25%). Both sunbathers / swimmers and snorkelers / divers being rude or discourteous, not looking where they were going, and being too close were more of a problem at Sans Souci / Kaimana Beach, χ2(2, N = 391 to 392) > 4.25, p < .039, φ > .10. In addition, boaters being too close and not looking where they were going were more of a problem at Sans Souci / Kaimana Beach, χ2(2, N = 392) > 4.29, p < .038, φ > .10. Conversely, surfers and windsurfers / kitesurfers being too close, not looking where they were going, and being rude and discourteous were more of a problem at Diamond Head / Kuilei Cliffs Beaches, χ2(2, N = 389 to 392) > 32.92, p < .001, φ > .30.
Similar to previous research, combining the frequency of occurrence (observed, not observed) variables with the corresponding perceived problem (no problem, problem) variables for each respondent produced conflict typologies with three possible attributes for each activity group: (a) no conflict, (b) interpersonal conflict, and (c) social values conflict (Figure 2). In other words, this analysis strategy resulted in three situations / events (e.g., being too close, rude or discourteous) common to all six activity groups where respondents were described as having: (a) no conflict, (b) interpersonal conflict, or (c) social values conflict. Separate K-Means cluster analyses were conducted on the three variables for each of the six activity groups to obtain an overall view of the total proportion of respondents in each activity experiencing each type of conflict. For each activity, cluster analyses were performed for 2, 3, and 4 group solutions. The 3-group solution provided the best fit. To confirm these solutions, the data were randomly sorted four times and cluster analyses were conducted after each sort. These analyses supported the initial three group solution. The first cluster of individuals did not express any conflict (i.e., no conflict). Cluster 2 individuals consistently indicated social values conflict and those in cluster 3 consistently expressed interpersonal conflict.
At Sans Souci / Kaimana Beach, the largest amount of conflict was with sunbathers and swimmers (31%) with most of this being interpersonal conflict (Table 26). Twenty three percent of users also experienced conflict with boaters at this site with most of this being interpersonal conflict. At Diamond Head / Kuilei Cliffs Beaches, 45% of respondents experienced conflict with surfers and 38% experienced conflict with windsurfers and kitesurfers. Almost all of this conflict with surfers and windsurfers / kitesurfers at Diamond Head / Kuilei Cliffs was interpersonal conflict. Few respondents (less than 19%) experienced conflict with snorkelers, divers, and anglers at each site. It is important to note, however, that this study occurred during an odd numbered year when angling was prohibited at this site so conflict with anglers may increase when this activity is permitted at the site.
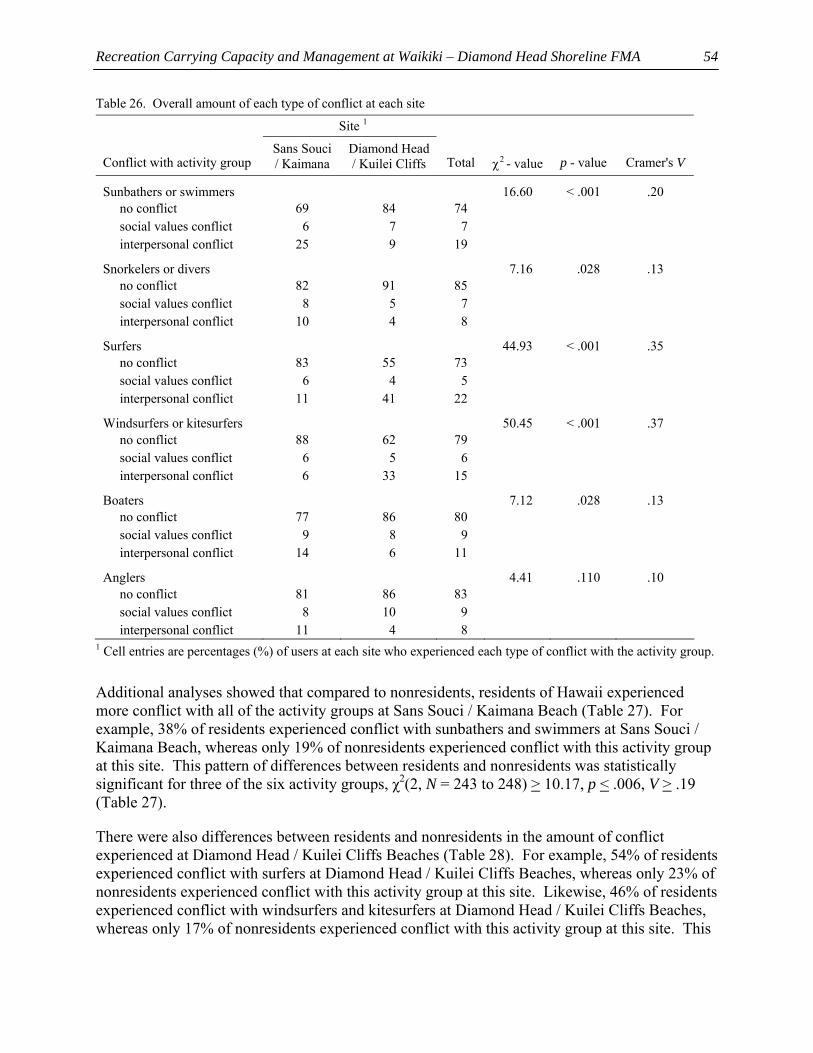
Recreation Carrying Capacity and Management at Waikiki – Diamond Head Shoreline FMA
54
Table 26. Overall amount of each type of conflict at each site
Site 1 Conflict with activity group
Sans Souci / Kaimana
Diamond Head / Kuilei Cliffs
Total
χ2 - value
p - value
Cramer's V
Sunbathers or swimmers 16.60 < .001 .20 no conflict 69 84 74 social values conflict 6 7 7 interpersonal conflict 25 9 19
Snorkelers or divers 7.16 .028 .13 no conflict 82 91 85 social values conflict 8 5 7 interpersonal conflict 10 4 8
Surfers 44.93 < .001 .35 no conflict 83 55 73 social values conflict 6 4 5 interpersonal conflict 11 41 22
Windsurfers or kitesurfers 50.45 < .001 .37 no conflict 88 62 79 social values conflict 6 5 6 interpersonal conflict 6 33 15
Boaters 7.12 .028 .13 no conflict 77 86 80 social values conflict 9 8 9 interpersonal conflict 14 6 11
Anglers 4.41 .110 .10 no conflict 81 86 83 social values conflict 8 10 9 interpersonal conflict 11 4 8
1 Cell entries are percentages (%) of users at each site who experienced each type of conflict with the activity group.
Additional analyses showed that compared to nonresidents, residents of Hawaii experienced more conflict with all of the activity groups at Sans Souci / Kaimana Beach (Table 27). For example, 38% of residents experienced conflict with sunbathers and swimmers at Sans Souci / Kaimana Beach, whereas only 19% of nonresidents experienced conflict with this activity group at this site. This pattern of differences between residents and nonresidents was statistically significant for three of the six activity groups, χ2(2, N = 243 to 248) > 10.17, p < .006, V > .19 (Table 27).
There were also differences between residents and nonresidents in the amount of conflict experienced at Diamond Head / Kuilei Cliffs Beaches (Table 28). For example, 54% of residents experienced conflict with surfers at Diamond Head / Kuilei Cliffs Beaches, whereas only 23% of nonresidents experienced conflict with this activity group at this site. Likewise, 46% of residents experienced conflict with windsurfers and kitesurfers at Diamond Head / Kuilei Cliffs Beaches, whereas only 17% of nonresidents experienced conflict with this activity group at this site. This
Recreation Carrying Capacity and Management at Waikiki – Diamond Head Shoreline FMA
55
pattern of differences between residents and nonresidents was statistically significant for three of the six activity groups, χ2(2, N = 131 to 134) > 6.41, p < .041, V > .17 (Table 28).
Table 27. Differences between residents and nonresidents in amount of each type of conflict at Sans Souci / Kaimana Beach 1
Conflict with activity group Residents Nonresidents χ2 - value p - value Cramer's V
Sunbathers or swimmers 10.68 .005 .20 no conflict 62 81 social values conflict 7 6 interpersonal conflict 31 13
Snorkelers or divers 10.17 .006 .19 no conflict 77 92 social values conflict 10 2 interpersonal conflict 13 6
Surfers 4.09 .129 .12 no conflict 80 88 social values conflict 8 2 interpersonal conflict 12 9
Windsurfers or kitesurfers 3.09 .213 .11 no conflict 86 92 social values conflict 6 6 interpersonal conflict 7 2
Boaters 2.90 .235 .11 no conflict 74 84 social values conflict 10 6 interpersonal conflict 16 11
Anglers 10.65 .005 .19 no conflict 77 89 social values conflict 9 8 interpersonal conflict 14 2
1 Cell entries are percentages (%) of users who experienced each type of conflict with the activity group.
Depreciative Behavior toward Coral Reefs. In addition to these activity conflicts, the surveys also asked respondents two questions regarding if they had seen users at the site handling or standing on coral and whether they believed that this was a problem at the site. First, users were asked how often they had seen people handling or standing on coral during any of their visits to the site. Responses were measured on a 4-point scale of “never,” “once or twice,” “sometimes,” and “many times.” For analysis purposes, responses were recoded as “observed” (i.e., at least once) or “did not observe.” Second, users were asked if they thought that people handling or standing on coral was a problem at the site. Responses were coded on a 4-point scale from “not at all a problem” to “extreme problem.” For analysis purposes, responses were recoded as “no problem” or “problem.”
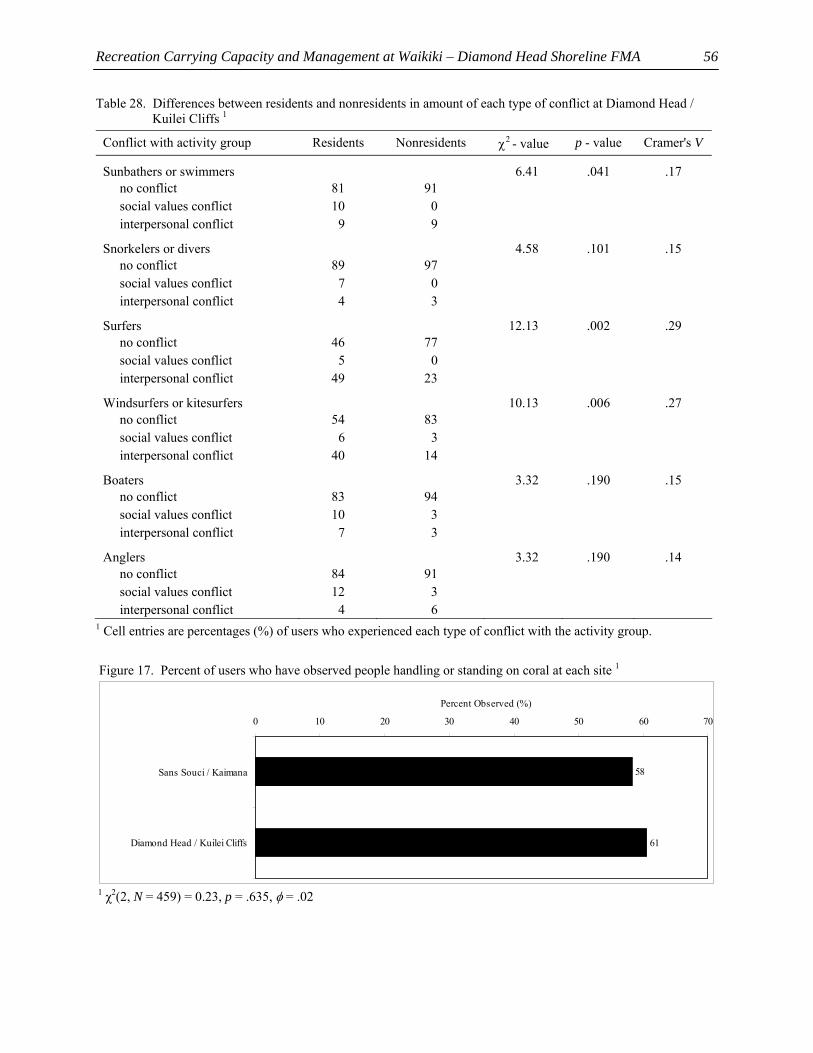
Recreation Carrying Capacity and Management at Waikiki – Diamond Head Shoreline FMA
56
Table 28. Differences between residents and nonresidents in amount of each type of conflict at Diamond Head / Kuilei Cliffs 1
Conflict with activity group Residents Nonresidents χ2 - value p - value Cramer's V
Sunbathers or swimmers 6.41 .041 .17 no conflict 81 91 social values conflict 10 0 interpersonal conflict 9 9
Snorkelers or divers 4.58 .101 .15 no conflict 89 97 social values conflict 7 0 interpersonal conflict 4 3
Surfers 12.13 .002 .29 no conflict 46 77 social values conflict 5 0 interpersonal conflict 49 23
Windsurfers or kitesurfers 10.13 .006 .27 no conflict 54 83 social values conflict 6 3 interpersonal conflict 40 14
Boaters 3.32 .190 .15 no conflict 83 94 social values conflict 10 3 interpersonal conflict 7 3
Anglers 3.32 .190 .14 no conflict 84 91 social values conflict 12 3 interpersonal conflict 4 6
1 Cell entries are percentages (%) of users who experienced each type of conflict with the activity group.
Figure 17. Percent of users who have observed people handling or standing on coral at each site 1
58
61
0 10 20 30 40 50 60 70
Sans Souci / Kaimana
Diamond Head / Kuilei Cliffs
Percent Observed (%)
1 χ2(2, N = 459) = 0.23, p = .635, φ = .02
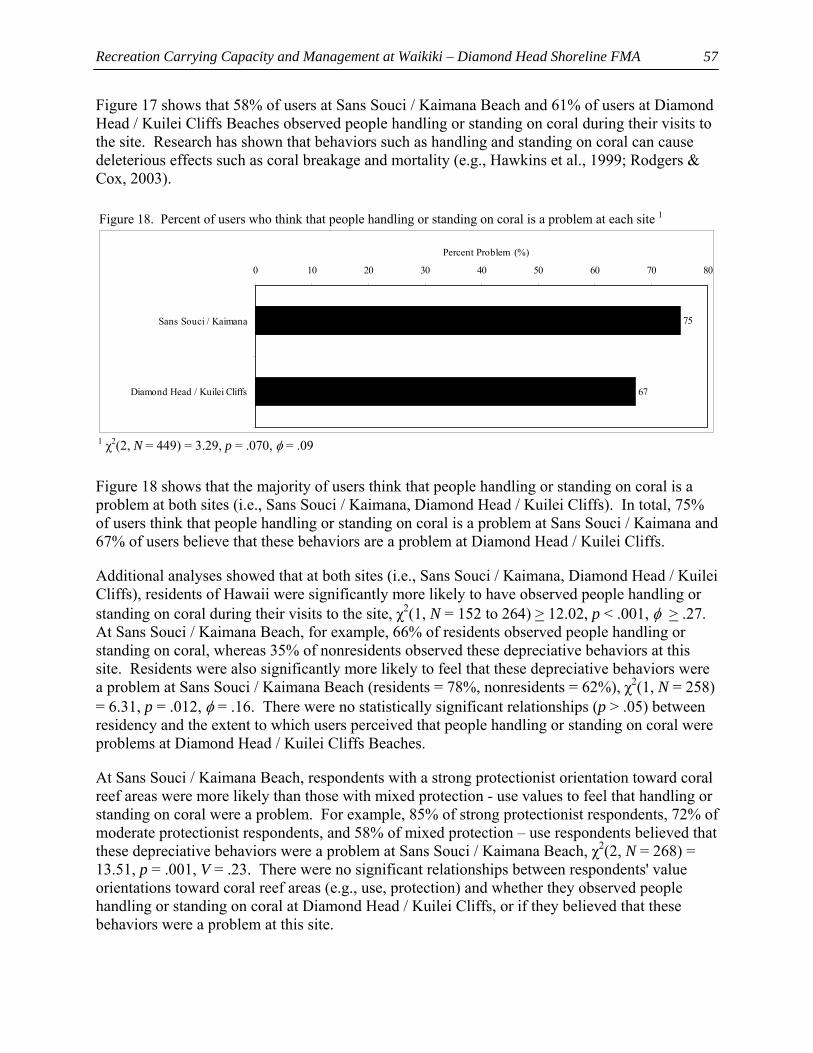
Recreation Carrying Capacity and Management at Waikiki – Diamond Head Shoreline FMA
57
Figure 17 shows that 58% of users at Sans Souci / Kaimana Beach and 61% of users at Diamond Head / Kuilei Cliffs Beaches observed people handling or standing on coral during their visits to the site. Research has shown that behaviors such as handling and standing on coral can cause deleterious effects such as coral breakage and mortality (e.g., Hawkins et al., 1999; Rodgers & Cox, 2003).
Figure 18. Percent of users who think that people handling or standing on coral is a problem at each site 1
75
67
0 10 20 30 40 50 60 70 80
Sans Souci / Kaimana
Diamond Head / Kuilei Cliffs
Percent Problem (%)
1 χ2(2, N = 449) = 3.29, p = .070, φ = .09
Figure 18 shows that the majority of users think that people handling or standing on coral is a problem at both sites (i.e., Sans Souci / Kaimana, Diamond Head / Kuilei Cliffs). In total, 75% of users think that people handling or standing on coral is a problem at Sans Souci / Kaimana and 67% of users believe that these behaviors are a problem at Diamond Head / Kuilei Cliffs.
Additional analyses showed that at both sites (i.e., Sans Souci / Kaimana, Diamond Head / Kuilei Cliffs), residents of Hawaii were significantly more likely to have observed people handling or standing on coral during their visits to the site, χ2(1, N = 152 to 264) > 12.02, p < .001, φ > .27. At Sans Souci / Kaimana Beach, for example, 66% of residents observed people handling or standing on coral, whereas 35% of nonresidents observed these depreciative behaviors at this site. Residents were also significantly more likely to feel that these depreciative behaviors were a problem at Sans Souci / Kaimana Beach (residents = 78%, nonresidents = 62%), χ2(1, N = 258) = 6.31, p = .012, φ = .16. There were no statistically significant relationships (p > .05) between residency and the extent to which users perceived that people handling or standing on coral were problems at Diamond Head / Kuilei Cliffs Beaches.
At Sans Souci / Kaimana Beach, respondents with a strong protectionist orientation toward coral reef areas were more likely than those with mixed protection - use values to feel that handling or standing on coral were a problem. For example, 85% of strong protectionist respondents, 72% of moderate protectionist respondents, and 58% of mixed protection – use respondents believed that these depreciative behaviors were a problem at Sans Souci / Kaimana Beach, χ2(2, N = 268) = 13.51, p = .001, V = .23. There were no significant relationships between respondents' value orientations toward coral reef areas (e.g., use, protection) and whether they observed people handling or standing on coral at Diamond Head / Kuilei Cliffs, or if they believed that these behaviors were a problem at this site.
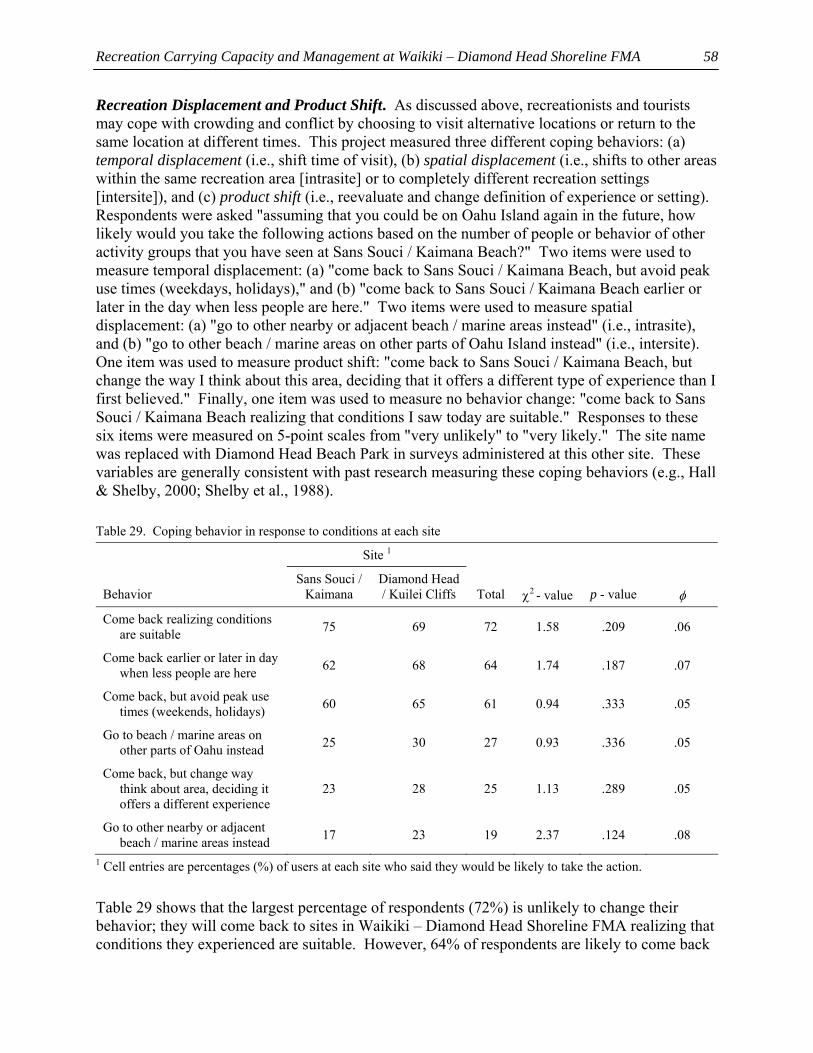
Recreation Carrying Capacity and Management at Waikiki – Diamond Head Shoreline FMA
58
Recreation Displacement and Product Shift. As discussed above, recreationists and tourists may cope with crowding and conflict by choosing to visit alternative locations or return to the same location at different times. This project measured three different coping behaviors: (a) temporal displacement (i.e., shift time of visit), (b) spatial displacement (i.e., shifts to other areas within the same recreation area [intrasite] or to completely different recreation settings [intersite]), and (c) product shift (i.e., reevaluate and change definition of experience or setting). Respondents were asked "assuming that you could be on Oahu Island again in the future, how likely would you take the following actions based on the number of people or behavior of other activity groups that you have seen at Sans Souci / Kaimana Beach?" Two items were used to measure temporal displacement: (a) "come back to Sans Souci / Kaimana Beach, but avoid peak use times (weekdays, holidays)," and (b) "come back to Sans Souci / Kaimana Beach earlier or later in the day when less people are here." Two items were used to measure spatial displacement: (a) "go to other nearby or adjacent beach / marine areas instead" (i.e., intrasite), and (b) "go to other beach / marine areas on other parts of Oahu Island instead" (i.e., intersite). One item was used to measure product shift: "come back to Sans Souci / Kaimana Beach, but change the way I think about this area, deciding that it offers a different type of experience than I first believed." Finally, one item was used to measure no behavior change: "come back to Sans Souci / Kaimana Beach realizing that conditions I saw today are suitable." Responses to these six items were measured on 5-point scales from "very unlikely" to "very likely." The site name was replaced with Diamond Head Beach Park in surveys administered at this other site. These variables are generally consistent with past research measuring these coping behaviors (e.g., Hall & Shelby, 2000; Shelby et al., 1988).
Table 29. Coping behavior in response to conditions at each site
Site 1
Behavior
Sans Souci / Kaimana
Diamond Head / Kuilei Cliffs
Total
χ2 - value
p - value
φ
Come back realizing conditions are suitable 75 69 72 1.58 .209 .06
Come back earlier or later in day when less people are here 62 68 64 1.74 .187 .07
Come back, but avoid peak use times (weekends, holidays) 60 65 61 0.94 .333 .05
Go to beach / marine areas on other parts of Oahu instead 25 30 27 0.93 .336 .05
Come back, but change way think about area, deciding it offers a different experience
23 28 25 1.13 .289 .05
Go to other nearby or adjacent beach / marine areas instead 17 23 19 2.37 .124 .08
1 Cell entries are percentages (%) of users at each site who said they would be likely to take the action.
Table 29 shows that the largest percentage of respondents (72%) is unlikely to change their behavior; they will come back to sites in Waikiki – Diamond Head Shoreline FMA realizing that conditions they experienced are suitable. However, 64% of respondents are likely to come back
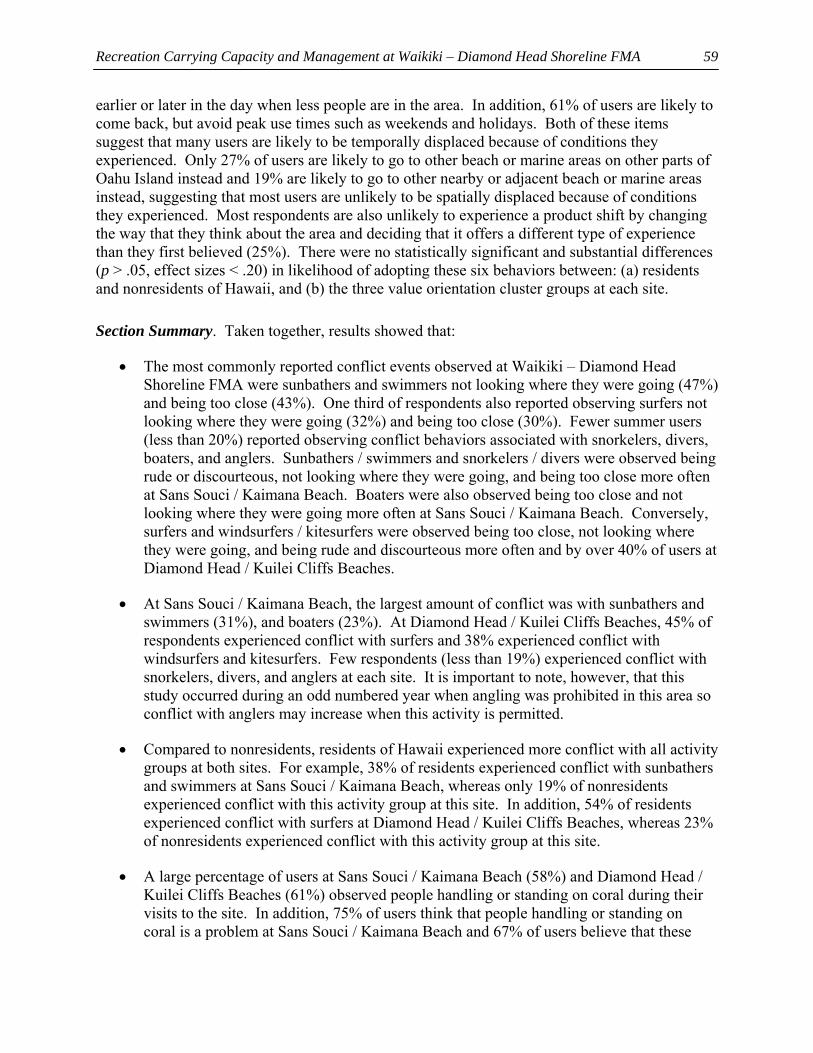
Recreation Carrying Capacity and Management at Waikiki – Diamond Head Shoreline FMA
59
earlier or later in the day when less people are in the area. In addition, 61% of users are likely to come back, but avoid peak use times such as weekends and holidays. Both of these items suggest that many users are likely to be temporally displaced because of conditions they experienced. Only 27% of users are likely to go to other beach or marine areas on other parts of Oahu Island instead and 19% are likely to go to other nearby or adjacent beach or marine areas instead, suggesting that most users are unlikely to be spatially displaced because of conditions they experienced. Most respondents are also unlikely to experience a product shift by changing the way that they think about the area and deciding that it offers a different type of experience than they first believed (25%). There were no statistically significant and substantial differences (p > .05, effect sizes < .20) in likelihood of adopting these six behaviors between: (a) residents and nonresidents of Hawaii, and (b) the three value orientation cluster groups at each site.
Section Summary. Taken together, results showed that:
• The most commonly reported conflict events observed at Waikiki – Diamond Head Shoreline FMA were sunbathers and swimmers not looking where they were going (47%) and being too close (43%). One third of respondents also reported observing surfers not looking where they were going (32%) and being too close (30%). Fewer summer users (less than 20%) reported observing conflict behaviors associated with snorkelers, divers, boaters, and anglers. Sunbathers / swimmers and snorkelers / divers were observed being rude or discourteous, not looking where they were going, and being too close more often at Sans Souci / Kaimana Beach. Boaters were also observed being too close and not looking where they were going more often at Sans Souci / Kaimana Beach. Conversely, surfers and windsurfers / kitesurfers were observed being too close, not looking where they were going, and being rude and discourteous more often and by over 40% of users at Diamond Head / Kuilei Cliffs Beaches.
• At Sans Souci / Kaimana Beach, the largest amount of conflict was with sunbathers and swimmers (31%), and boaters (23%). At Diamond Head / Kuilei Cliffs Beaches, 45% of respondents experienced conflict with surfers and 38% experienced conflict with windsurfers and kitesurfers. Few respondents (less than 19%) experienced conflict with snorkelers, divers, and anglers at each site. It is important to note, however, that this study occurred during an odd numbered year when angling was prohibited in this area so conflict with anglers may increase when this activity is permitted.
• Compared to nonresidents, residents of Hawaii experienced more conflict with all activity groups at both sites. For example, 38% of residents experienced conflict with sunbathers and swimmers at Sans Souci / Kaimana Beach, whereas only 19% of nonresidents experienced conflict with this activity group at this site. In addition, 54% of residents experienced conflict with surfers at Diamond Head / Kuilei Cliffs Beaches, whereas 23% of nonresidents experienced conflict with this activity group at this site.
• A large percentage of users at Sans Souci / Kaimana Beach (58%) and Diamond Head / Kuilei Cliffs Beaches (61%) observed people handling or standing on coral during their visits to the site. In addition, 75% of users think that people handling or standing on coral is a problem at Sans Souci / Kaimana Beach and 67% of users believe that these
Recreation Carrying Capacity and Management at Waikiki – Diamond Head Shoreline FMA
60
behaviors are a problem at Diamond Head / Kuilei Cliffs Beaches. At both sites, residents of Hawaii were significantly more likely to have observed people handling or standing on coral during their visits to the site.
• In response to crowding and conflict, most respondents (72%) are still unlikely to change their behavior; they will come back to sites in Waikiki – Diamond Head Shoreline FMA realizing that conditions they experienced are suitable. However, 64% of respondents are likely to come back earlier or later in the day when less people are in the area, and 61% are likely to come back, but avoid peak use times such as weekends and holidays, suggesting that many users are likely to be temporally displaced because of conditions they experienced. Only 27% of users are likely to go to other beach or marine areas on other parts of Oahu Island instead and 19% are likely to go to other nearby or adjacent beach or marine areas instead, suggesting that most users are unlikely to be spatially displaced because of conditions they experienced. Most respondents are also unlikely to experience a product shift by changing the way that they think about the area and deciding that it offers a different type of experience than they first believed (25%).
Evaluations and Tradeoffs of Potential Management Strategies
Support and Opposition of Potential Management Strategies. Recent studies have highlighted the importance and need for understanding user support and opposition toward management strategies designed to mitigate negative effects of coastal recreation in Hawaii (e.g., Cesar & van Beukering, 2004; Cesar et al., 2004; Friedlander et al., 2005). There are two general categories of approaches for managing recreation use. First, direct management strategies act directly on user behavior leaving little or no freedom of choice (Manning, 1999). Second, indirect management strategies attempt to influence the decision factors upon which users base their behavior (Manning, 1999). To illustrate, direct management practices aimed at reducing litter in a beach environment could include a regulation prohibiting littering and then enforcing this regulation with fines or other sanctions. An indirect management practice would be an education program designed to inform users of undesirable ecological and aesthetic impacts of litter, and encourage them to avoid littering.
This project asked summer users whether they supported or opposed five different direct and indirect management strategies: (a) "should commercial activities (e.g., recreation tour operators) be allowed at Sans Souci / Kaimana Beach," (b) "should there be designated parking areas for tour buses at Sans Souci / Kaimana Beach," (c) "should there be more enforcement of rules and regulations at Sans Souci / Kaimana Beach," (d) "should Sans Souci / Kaimana Beach be zoned so that different recreation activities do not overlap in the same areas," and (e) "should there be more educational or interpretive information at Sans Souci / Kaimana Beach?" Responses were coded as "no," "yes," or "unsure." The site name was replaced with Diamond Head Beach Park in surveys administered at this other site.
Table 30 shows that none of the strategies received support from the majority of users at Waikiki – Diamond Head Shoreline FMA. The strategy that received support from the most respondents at each site (38% to 44%) was providing more educational and interpretive information. Users at Sans Souci / Kaimana Beach were somewhat divided on whether there should be more
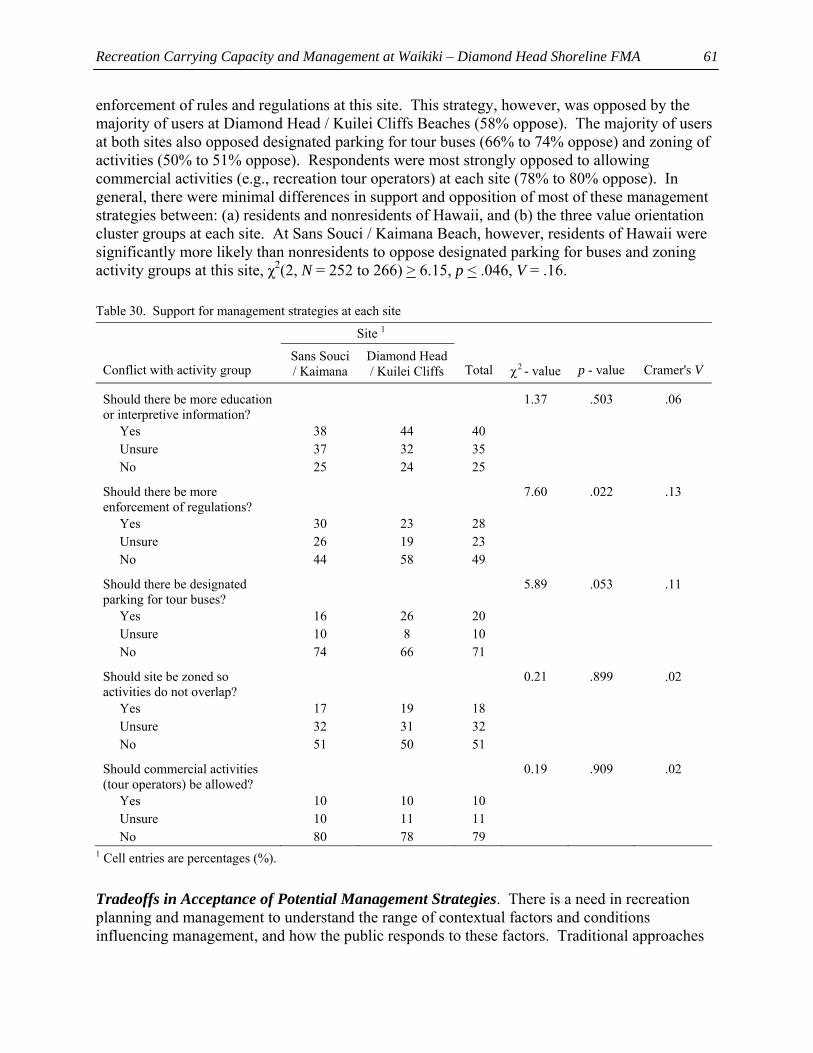
Recreation Carrying Capacity and Management at Waikiki – Diamond Head Shoreline FMA
61
enforcement of rules and regulations at this site. This strategy, however, was opposed by the majority of users at Diamond Head / Kuilei Cliffs Beaches (58% oppose). The majority of users at both sites also opposed designated parking for tour buses (66% to 74% oppose) and zoning of activities (50% to 51% oppose). Respondents were most strongly opposed to allowing commercial activities (e.g., recreation tour operators) at each site (78% to 80% oppose). In general, there were minimal differences in support and opposition of most of these management strategies between: (a) residents and nonresidents of Hawaii, and (b) the three value orientation cluster groups at each site. At Sans Souci / Kaimana Beach, however, residents of Hawaii were significantly more likely than nonresidents to oppose designated parking for buses and zoning activity groups at this site, χ2(2, N = 252 to 266) > 6.15, p < .046, V = .16.
Table 30. Support for management strategies at each site
Site 1 Conflict with activity group
Sans Souci / Kaimana
Diamond Head / Kuilei Cliffs
Total
χ2 - value
p - value
Cramer's V
Should there be more education or interpretive information?
1.37 .503 .06
Yes 38 44 40 Unsure 37 32 35 No 25 24 25
Should there be more enforcement of regulations?
7.60 .022 .13
Yes 30 23 28 Unsure 26 19 23 No 44 58 49
Should there be designated parking for tour buses?
5.89 .053 .11
Yes 16 26 20 Unsure 10 8 10 No 74 66 71
Should site be zoned so activities do not overlap?
0.21 .899 .02
Yes 17 19 18 Unsure 32 31 32 No 51 50 51
Should commercial activities (tour operators) be allowed?
0.19 .909 .02
Yes 10 10 10 Unsure 10 11 11 No 80 78 79
1 Cell entries are percentages (%).
Tradeoffs in Acceptance of Potential Management Strategies. There is a need in recreation planning and management to understand the range of contextual factors and conditions influencing management, and how the public responds to these factors. Traditional approaches
Recreation Carrying Capacity and Management at Waikiki – Diamond Head Shoreline FMA
62
for evaluating recreationists’ attitudes toward conditions and management strategies have typically involved asking users the extent to which they believed that conditions are important or if they supported or opposed individual management alternatives (Manning, 1999). These approaches were used in this study and results are discussed earlier in this section (e.g., should there be more enforcement of rules and regulations, should there be more educational or interpretive information). These approaches, however, rarely reflect the complexity of recreation and tourism management, as they do not address contextual factors that may influence decisions to support or oppose particular management actions. It may be more useful, therefore, to examine users’ tradeoffs in their support of management strategies and regimes depending on a range of situational factors such as different levels of social, resource, and facility impacts. For example, if a coastal recreation site has adequate facilities, little crowding, and minimal coral reef impacts (i.e., situational factors), modifying any current management regimes may not be supported by users. Conversely, if the reef is damaged and the site is overcrowded, actions such as zoning or limiting use levels may be supported by users. Understanding these types of situational influences on public acceptance of coastal recreation management may increase manager confidence when choosing among various potential actions.
Recent research has used multivariate statistical techniques such as stated choice modeling and conjoint analysis to quantitatively measure the relative importance that respondents place on selected factors of recreation settings and the extent to which individuals make tradeoffs in their support of alternative management practices (e.g., Kneeshaw et al., 2004; Lawson et al., 2006). Instead of asking respondents to rate their support for a single factor or attribute at one time, they evaluate scenarios describing alternative configurations of a set of factors. When evaluating each scenario, respondents weigh tradeoffs among factors when considering their acceptance of management strategies. This approach provides managers with an understanding of how recreationists would likely respond to implementation of management actions given combinations of current or future social, resource, and facility conditions (Lawson et al., 2006).
Conjoint analysis models how people make complex decisions based on multiple factors (e.g., Dennis, 1998; Luce & Tukey, 1964). The technique can be used to assess how situational factors such as use level, coral reef damage, and facility conditions influence recreationists' acceptance of coastal recreation management strategies (e.g., limit use, provide education). By presenting individuals with descriptions of different scenarios, respondents can make implicit tradeoffs in their decisions about acceptable management strategies. For the conjoint analysis in this project, scenarios were used to represent combinations of four situational factors and factor levels related to impacts associated with coastal recreation. Two factor levels were used for each factor:
• Number of people (i.e., use level) (low vs. high).
• Recreation damage to coral reef areas (minimal [less than 25% broken, trampled] vs. substantial [over 75% broken, trampled]).
• Amount of litter (none vs. some).
• Condition of facilities (e.g., bathrooms, showers, trash cans, signs) (good vs. poor).
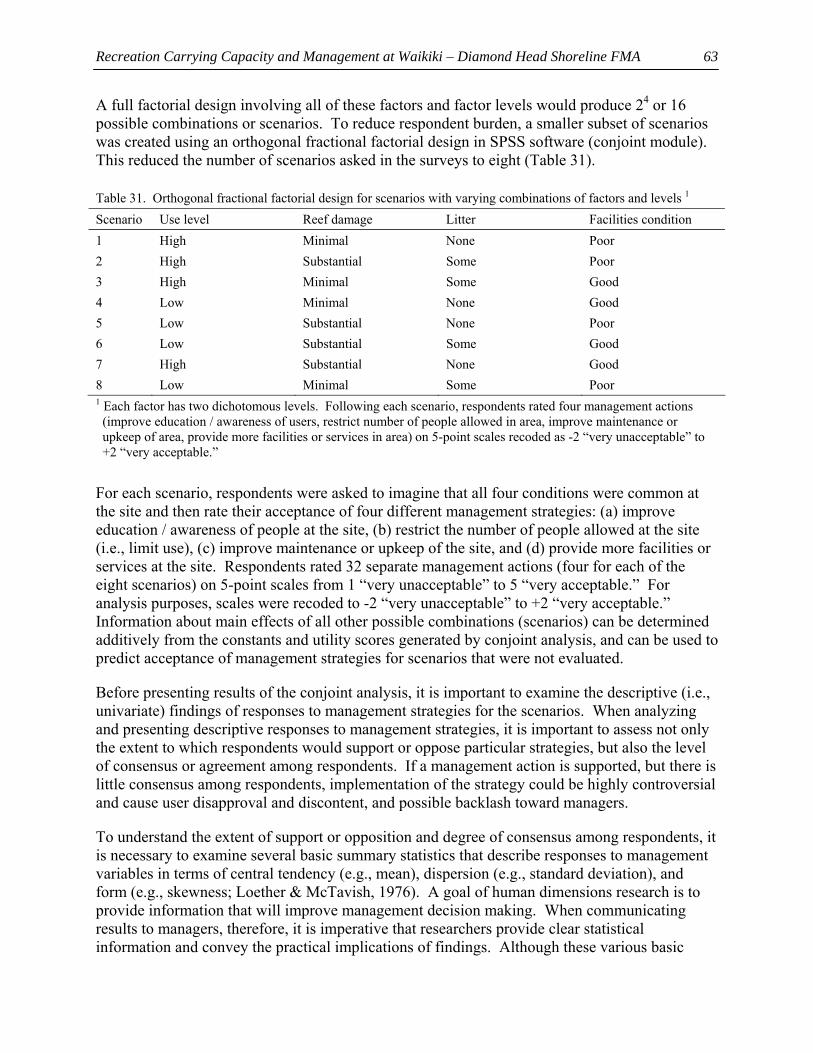
Recreation Carrying Capacity and Management at Waikiki – Diamond Head Shoreline FMA
63
A full factorial design involving all of these factors and factor levels would produce 24 or 16 possible combinations or scenarios. To reduce respondent burden, a smaller subset of scenarios was created using an orthogonal fractional factorial design in SPSS software (conjoint module). This reduced the number of scenarios asked in the surveys to eight (Table 31).
Table 31. Orthogonal fractional factorial design for scenarios with varying combinations of factors and levels 1 Scenario Use level Reef damage Litter Facilities condition 1 High Minimal None Poor 2 High Substantial Some Poor 3 High Minimal Some Good 4 Low Minimal None Good 5 Low Substantial None Poor 6 Low Substantial Some Good 7 High Substantial None Good 8 Low Minimal Some Poor 1 Each factor has two dichotomous levels. Following each scenario, respondents rated four management actions (improve education / awareness of users, restrict number of people allowed in area, improve maintenance or upkeep of area, provide more facilities or services in area) on 5-point scales recoded as -2 “very unacceptable” to +2 “very acceptable.”
For each scenario, respondents were asked to imagine that all four conditions were common at the site and then rate their acceptance of four different management strategies: (a) improve education / awareness of people at the site, (b) restrict the number of people allowed at the site (i.e., limit use), (c) improve maintenance or upkeep of the site, and (d) provide more facilities or services at the site. Respondents rated 32 separate management actions (four for each of the eight scenarios) on 5-point scales from 1 “very unacceptable” to 5 “very acceptable.” For analysis purposes, scales were recoded to -2 “very unacceptable” to +2 “very acceptable.” Information about main effects of all other possible combinations (scenarios) can be determined additively from the constants and utility scores generated by conjoint analysis, and can be used to predict acceptance of management strategies for scenarios that were not evaluated.
Before presenting results of the conjoint analysis, it is important to examine the descriptive (i.e., univariate) findings of responses to management strategies for the scenarios. When analyzing and presenting descriptive responses to management strategies, it is important to assess not only the extent to which respondents would support or oppose particular strategies, but also the level of consensus or agreement among respondents. If a management action is supported, but there is little consensus among respondents, implementation of the strategy could be highly controversial and cause user disapproval and discontent, and possible backlash toward managers.
To understand the extent of support or opposition and degree of consensus among respondents, it is necessary to examine several basic summary statistics that describe responses to management variables in terms of central tendency (e.g., mean), dispersion (e.g., standard deviation), and form (e.g., skewness; Loether & McTavish, 1976). A goal of human dimensions research is to provide information that will improve management decision making. When communicating results to managers, therefore, it is imperative that researchers provide clear statistical information and convey the practical implications of findings. Although these various basic
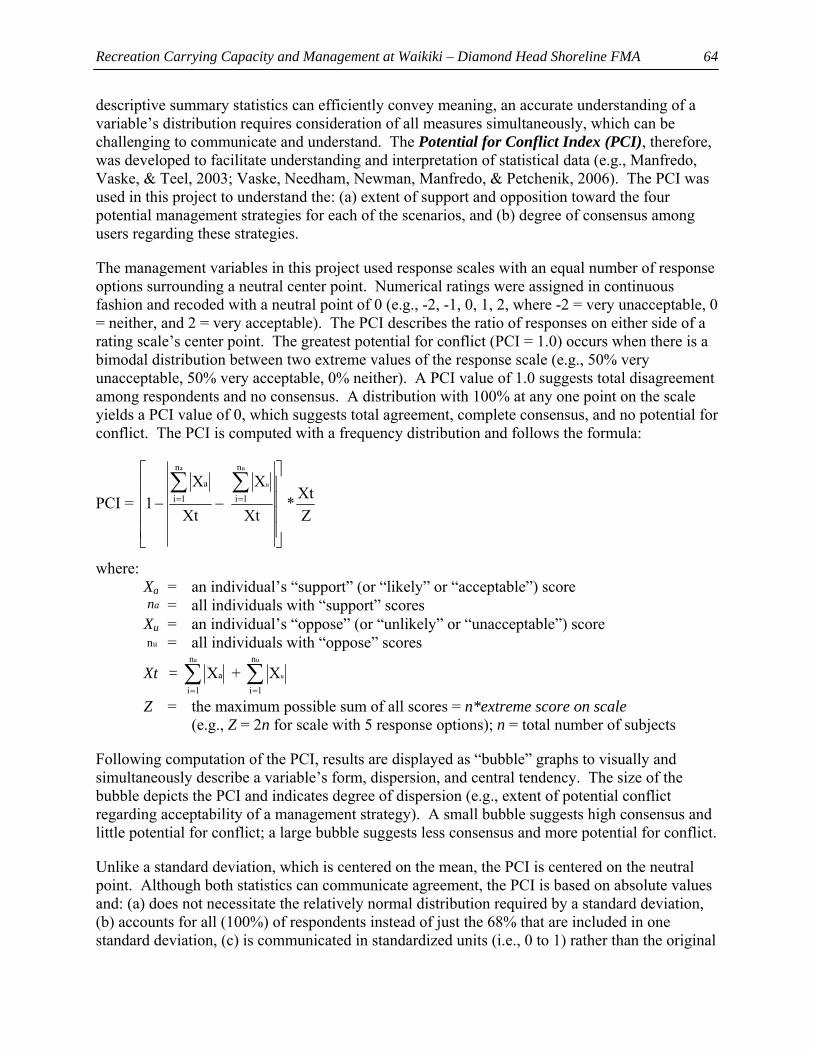
Recreation Carrying Capacity and Management at Waikiki – Diamond Head Shoreline FMA
64
descriptive summary statistics can efficiently convey meaning, an accurate understanding of a variable’s distribution requires consideration of all measures simultaneously, which can be challenging to communicate and understand. The Potential for Conflict Index (PCI), therefore, was developed to facilitate understanding and interpretation of statistical data (e.g., Manfredo, Vaske, & Teel, 2003; Vaske, Needham, Newman, Manfredo, & Petchenik, 2006). The PCI was used in this project to understand the: (a) extent of support and opposition toward the four potential management strategies for each of the scenarios, and (b) degree of consensus among users regarding these strategies.
The management variables in this project used response scales with an equal number of response options surrounding a neutral center point. Numerical ratings were assigned in continuous fashion and recoded with a neutral point of 0 (e.g., -2, -1, 0, 1, 2, where -2 = very unacceptable, 0 = neither, and 2 = very acceptable). The PCI describes the ratio of responses on either side of a rating scale’s center point. The greatest potential for conflict (PCI = 1.0) occurs when there is a bimodal distribution between two extreme values of the response scale (e.g., 50% very unacceptable, 50% very acceptable, 0% neither). A PCI value of 1.0 suggests total disagreement among respondents and no consensus. A distribution with 100% at any one point on the scale yields a PCI value of 0, which suggests total agreement, complete consensus, and no potential for conflict. The PCI is computed with a frequency distribution and follows the formula:
PCI =
⎥⎥⎥⎥
⎦
⎤
⎢⎢⎢⎢
⎣
⎡
−−∑∑==
Xt
X
Xt
X1
u
u
a n
1i
n
1ia
ZXt*
where: Xa = an individual’s “support” (or “likely” or “acceptable”) score
an = all individuals with “support” scores Xu = an individual’s “oppose” (or “unlikely” or “unacceptable”) score
un = all individuals with “oppose” scores
Xt = ∑=
an
1iaX + ∑
=
u
u
n
1iX
Z = the maximum possible sum of all scores = n*extreme score on scale (e.g., Z = 2n for scale with 5 response options); n = total number of subjects
Following computation of the PCI, results are displayed as “bubble” graphs to visually and simultaneously describe a variable’s form, dispersion, and central tendency. The size of the bubble depicts the PCI and indicates degree of dispersion (e.g., extent of potential conflict regarding acceptability of a management strategy). A small bubble suggests high consensus and little potential for conflict; a large bubble suggests less consensus and more potential for conflict.
Unlike a standard deviation, which is centered on the mean, the PCI is centered on the neutral point. Although both statistics can communicate agreement, the PCI is based on absolute values and: (a) does not necessitate the relatively normal distribution required by a standard deviation, (b) accounts for all (100%) of respondents instead of just the 68% that are included in one standard deviation, (c) is communicated in standardized units (i.e., 0 to 1) rather than the original
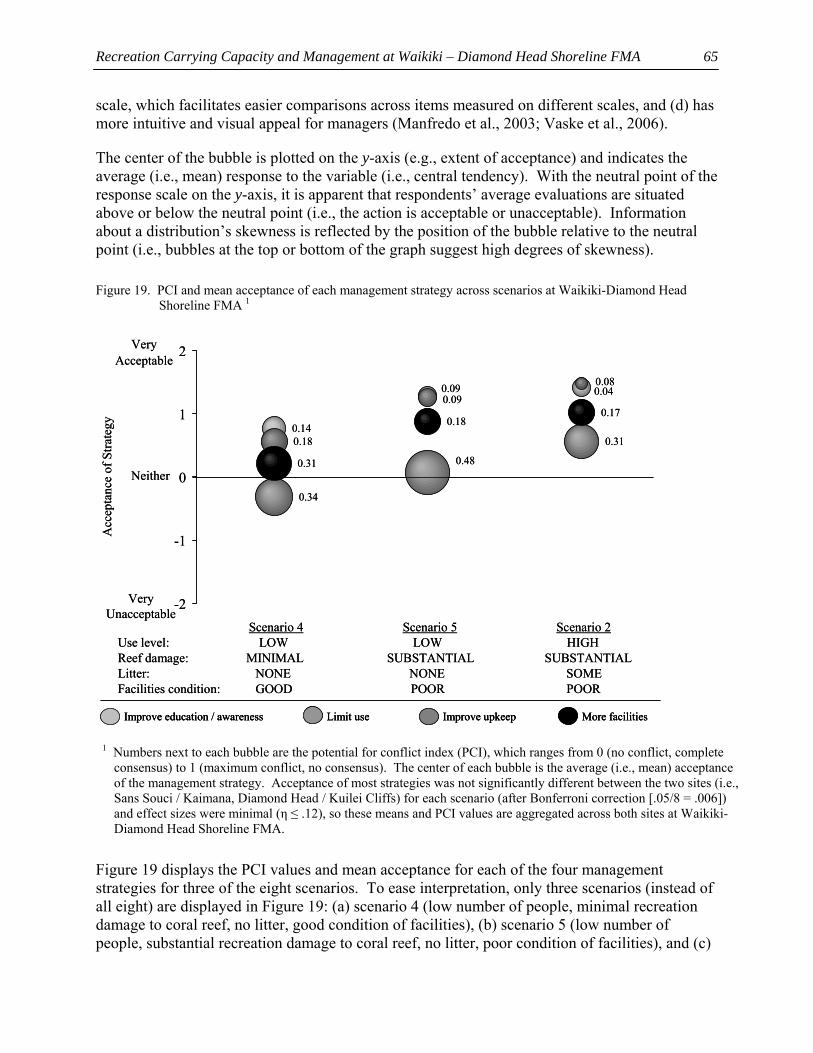
Recreation Carrying Capacity and Management at Waikiki – Diamond Head Shoreline FMA
65
scale, which facilitates easier comparisons across items measured on different scales, and (d) has more intuitive and visual appeal for managers (Manfredo et al., 2003; Vaske et al., 2006).
The center of the bubble is plotted on the y-axis (e.g., extent of acceptance) and indicates the average (i.e., mean) response to the variable (i.e., central tendency). With the neutral point of the response scale on the y-axis, it is apparent that respondents’ average evaluations are situated above or below the neutral point (i.e., the action is acceptable or unacceptable). Information about a distribution’s skewness is reflected by the position of the bubble relative to the neutral point (i.e., bubbles at the top or bottom of the graph suggest high degrees of skewness).
Figure 19. PCI and mean acceptance of each management strategy across scenarios at Waikiki-Diamond Head Shoreline FMA 1
1 Numbers next to each bubble are the potential for conflict index (PCI), which ranges from 0 (no conflict, complete
consensus) to 1 (maximum conflict, no consensus). The center of each bubble is the average (i.e., mean) acceptance of the management strategy. Acceptance of most strategies was not significantly different between the two sites (i.e., Sans Souci / Kaimana, Diamond Head / Kuilei Cliffs) for each scenario (after Bonferroni correction [.05/8 = .006]) and effect sizes were minimal (η ≤ .12), so these means and PCI values are aggregated across both sites at Waikiki-Diamond Head Shoreline FMA.
Figure 19 displays the PCI values and mean acceptance for each of the four management strategies for three of the eight scenarios. To ease interpretation, only three scenarios (instead of all eight) are displayed in Figure 19: (a) scenario 4 (low number of people, minimal recreation damage to coral reef, no litter, good condition of facilities), (b) scenario 5 (low number of people, substantial recreation damage to coral reef, no litter, poor condition of facilities), and (c)
0.14
0.34
0.310.18
0.31
0.180.17
0.090.08
0.48
0.09 0.04
-2
-1
0
1
2VeryAcceptable
Neither
VeryUnacceptable
Acc
epta
nce
of S
trate
gy
Scenario 4 Scenario 5 Scenario 2Use level: LOW LOW HIGHReef damage: MINIMAL SUBSTANTIAL SUBSTANTIALLitter: NONE NONE SOMEFacilities condition: GOOD POOR POOR
Improve education / awareness Improve upkeep More facilitiesLimit use
0.14
0.34
0.310.18
0.31
0.180.17
0.090.08
0.48
0.09 0.04
-2
-1
0
1
2VeryAcceptable
Neither
VeryUnacceptable
Acc
epta
nce
of S
trate
gy
Scenario 4 Scenario 5 Scenario 2Use level: LOW LOW HIGHReef damage: MINIMAL SUBSTANTIAL SUBSTANTIALLitter: NONE NONE SOMEFacilities condition: GOOD POOR POOR
Improve education / awarenessImprove education / awareness Improve upkeepImprove upkeep More facilitiesMore facilitiesLimit useLimit use
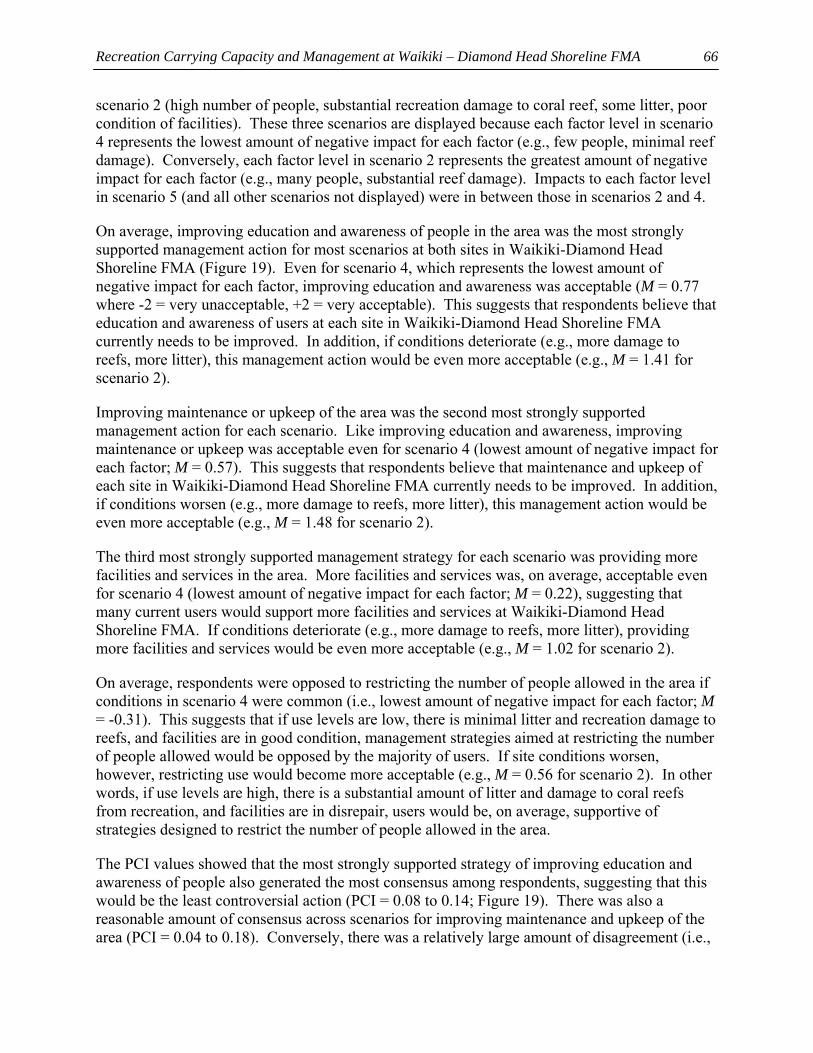
Recreation Carrying Capacity and Management at Waikiki – Diamond Head Shoreline FMA
66
scenario 2 (high number of people, substantial recreation damage to coral reef, some litter, poor condition of facilities). These three scenarios are displayed because each factor level in scenario 4 represents the lowest amount of negative impact for each factor (e.g., few people, minimal reef damage). Conversely, each factor level in scenario 2 represents the greatest amount of negative impact for each factor (e.g., many people, substantial reef damage). Impacts to each factor level in scenario 5 (and all other scenarios not displayed) were in between those in scenarios 2 and 4.
On average, improving education and awareness of people in the area was the most strongly supported management action for most scenarios at both sites in Waikiki-Diamond Head Shoreline FMA (Figure 19). Even for scenario 4, which represents the lowest amount of negative impact for each factor, improving education and awareness was acceptable (M = 0.77 where -2 = very unacceptable, +2 = very acceptable). This suggests that respondents believe that education and awareness of users at each site in Waikiki-Diamond Head Shoreline FMA currently needs to be improved. In addition, if conditions deteriorate (e.g., more damage to reefs, more litter), this management action would be even more acceptable (e.g., M = 1.41 for scenario 2).
Improving maintenance or upkeep of the area was the second most strongly supported management action for each scenario. Like improving education and awareness, improving maintenance or upkeep was acceptable even for scenario 4 (lowest amount of negative impact for each factor; M = 0.57). This suggests that respondents believe that maintenance and upkeep of each site in Waikiki-Diamond Head Shoreline FMA currently needs to be improved. In addition, if conditions worsen (e.g., more damage to reefs, more litter), this management action would be even more acceptable (e.g., M = 1.48 for scenario 2).
The third most strongly supported management strategy for each scenario was providing more facilities and services in the area. More facilities and services was, on average, acceptable even for scenario 4 (lowest amount of negative impact for each factor; M = 0.22), suggesting that many current users would support more facilities and services at Waikiki-Diamond Head Shoreline FMA. If conditions deteriorate (e.g., more damage to reefs, more litter), providing more facilities and services would be even more acceptable (e.g., M = 1.02 for scenario 2).
On average, respondents were opposed to restricting the number of people allowed in the area if conditions in scenario 4 were common (i.e., lowest amount of negative impact for each factor; M = -0.31). This suggests that if use levels are low, there is minimal litter and recreation damage to reefs, and facilities are in good condition, management strategies aimed at restricting the number of people allowed would be opposed by the majority of users. If site conditions worsen, however, restricting use would become more acceptable (e.g., M = 0.56 for scenario 2). In other words, if use levels are high, there is a substantial amount of litter and damage to coral reefs from recreation, and facilities are in disrepair, users would be, on average, supportive of strategies designed to restrict the number of people allowed in the area.
The PCI values showed that the most strongly supported strategy of improving education and awareness of people also generated the most consensus among respondents, suggesting that this would be the least controversial action (PCI = 0.08 to 0.14; Figure 19). There was also a reasonable amount of consensus across scenarios for improving maintenance and upkeep of the area (PCI = 0.04 to 0.18). Conversely, there was a relatively large amount of disagreement (i.e.,
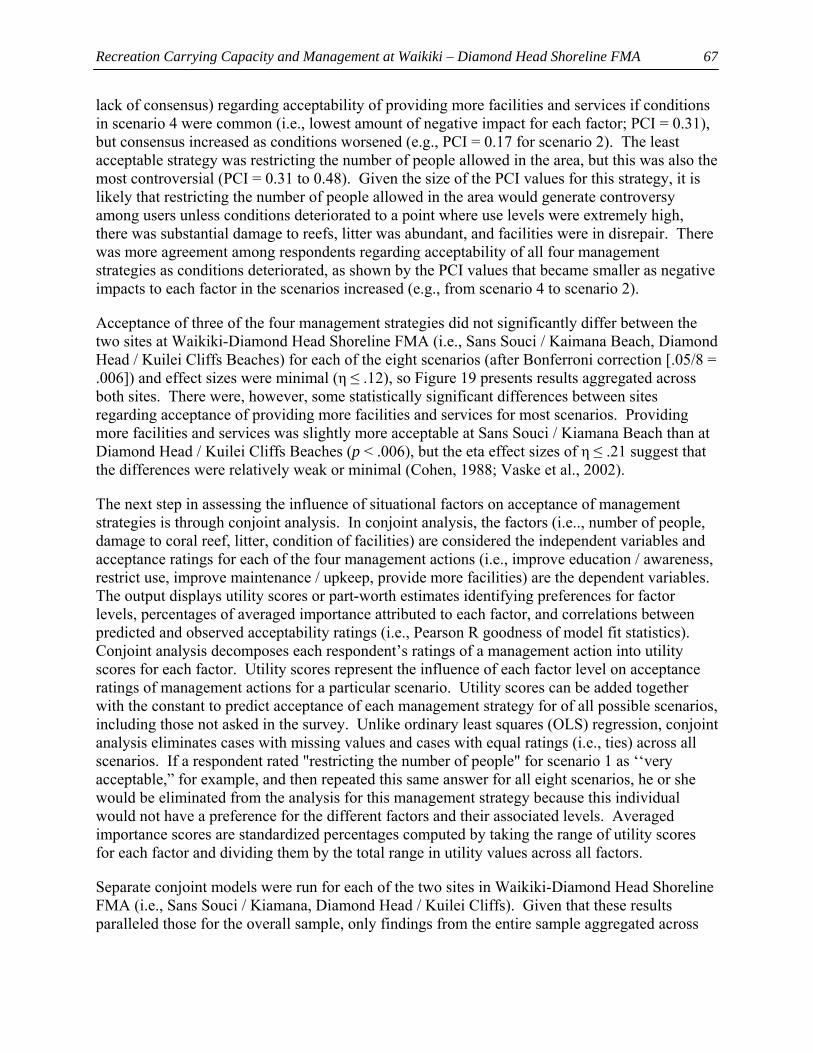
Recreation Carrying Capacity and Management at Waikiki – Diamond Head Shoreline FMA
67
lack of consensus) regarding acceptability of providing more facilities and services if conditions in scenario 4 were common (i.e., lowest amount of negative impact for each factor; PCI = 0.31), but consensus increased as conditions worsened (e.g., PCI = 0.17 for scenario 2). The least acceptable strategy was restricting the number of people allowed in the area, but this was also the most controversial (PCI = 0.31 to 0.48). Given the size of the PCI values for this strategy, it is likely that restricting the number of people allowed in the area would generate controversy among users unless conditions deteriorated to a point where use levels were extremely high, there was substantial damage to reefs, litter was abundant, and facilities were in disrepair. There was more agreement among respondents regarding acceptability of all four management strategies as conditions deteriorated, as shown by the PCI values that became smaller as negative impacts to each factor in the scenarios increased (e.g., from scenario 4 to scenario 2).
Acceptance of three of the four management strategies did not significantly differ between the two sites at Waikiki-Diamond Head Shoreline FMA (i.e., Sans Souci / Kaimana Beach, Diamond Head / Kuilei Cliffs Beaches) for each of the eight scenarios (after Bonferroni correction [.05/8 = .006]) and effect sizes were minimal (η ≤ .12), so Figure 19 presents results aggregated across both sites. There were, however, some statistically significant differences between sites regarding acceptance of providing more facilities and services for most scenarios. Providing more facilities and services was slightly more acceptable at Sans Souci / Kiamana Beach than at Diamond Head / Kuilei Cliffs Beaches (p < .006), but the eta effect sizes of η ≤ .21 suggest that the differences were relatively weak or minimal (Cohen, 1988; Vaske et al., 2002).
The next step in assessing the influence of situational factors on acceptance of management strategies is through conjoint analysis. In conjoint analysis, the factors (i.e.., number of people, damage to coral reef, litter, condition of facilities) are considered the independent variables and acceptance ratings for each of the four management actions (i.e., improve education / awareness, restrict use, improve maintenance / upkeep, provide more facilities) are the dependent variables. The output displays utility scores or part-worth estimates identifying preferences for factor levels, percentages of averaged importance attributed to each factor, and correlations between predicted and observed acceptability ratings (i.e., Pearson R goodness of model fit statistics). Conjoint analysis decomposes each respondent’s ratings of a management action into utility scores for each factor. Utility scores represent the influence of each factor level on acceptance ratings of management actions for a particular scenario. Utility scores can be added together with the constant to predict acceptance of each management strategy for of all possible scenarios, including those not asked in the survey. Unlike ordinary least squares (OLS) regression, conjoint analysis eliminates cases with missing values and cases with equal ratings (i.e., ties) across all scenarios. If a respondent rated "restricting the number of people" for scenario 1 as ‘‘very acceptable,” for example, and then repeated this same answer for all eight scenarios, he or she would be eliminated from the analysis for this management strategy because this individual would not have a preference for the different factors and their associated levels. Averaged importance scores are standardized percentages computed by taking the range of utility scores for each factor and dividing them by the total range in utility values across all factors.
Separate conjoint models were run for each of the two sites in Waikiki-Diamond Head Shoreline FMA (i.e., Sans Souci / Kiamana, Diamond Head / Kuilei Cliffs). Given that these results paralleled those for the overall sample, only findings from the entire sample aggregated across
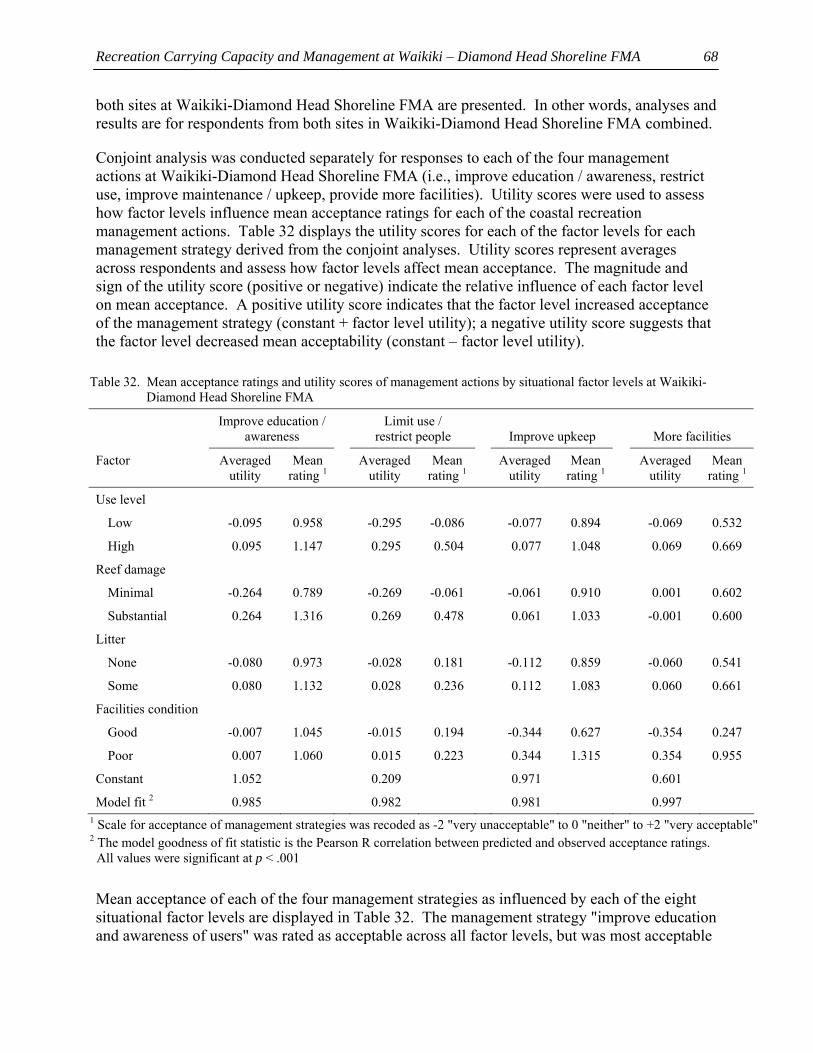
Recreation Carrying Capacity and Management at Waikiki – Diamond Head Shoreline FMA
68
both sites at Waikiki-Diamond Head Shoreline FMA are presented. In other words, analyses and results are for respondents from both sites in Waikiki-Diamond Head Shoreline FMA combined.
Conjoint analysis was conducted separately for responses to each of the four management actions at Waikiki-Diamond Head Shoreline FMA (i.e., improve education / awareness, restrict use, improve maintenance / upkeep, provide more facilities). Utility scores were used to assess how factor levels influence mean acceptance ratings for each of the coastal recreation management actions. Table 32 displays the utility scores for each of the factor levels for each management strategy derived from the conjoint analyses. Utility scores represent averages across respondents and assess how factor levels affect mean acceptance. The magnitude and sign of the utility score (positive or negative) indicate the relative influence of each factor level on mean acceptance. A positive utility score indicates that the factor level increased acceptance of the management strategy (constant + factor level utility); a negative utility score suggests that the factor level decreased mean acceptability (constant – factor level utility).
Table 32. Mean acceptance ratings and utility scores of management actions by situational factor levels at Waikiki- Diamond Head Shoreline FMA
Improve education / awareness
Limit use / restrict people
Improve upkeep
More facilities
Factor Averaged utility
Mean rating 1
Averaged utility
Mean rating 1
Averaged utility
Mean rating 1
Averaged utility
Mean rating 1
Use level
Low -0.095 0.958 -0.295 -0.086 -0.077 0.894 -0.069 0.532
High 0.095 1.147 0.295 0.504 0.077 1.048 0.069 0.669
Reef damage
Minimal -0.264 0.789 -0.269 -0.061 -0.061 0.910 0.001 0.602
Substantial 0.264 1.316 0.269 0.478 0.061 1.033 -0.001 0.600
Litter
None -0.080 0.973 -0.028 0.181 -0.112 0.859 -0.060 0.541
Some 0.080 1.132 0.028 0.236 0.112 1.083 0.060 0.661
Facilities condition
Good -0.007 1.045 -0.015 0.194 -0.344 0.627 -0.354 0.247
Poor 0.007 1.060 0.015 0.223 0.344 1.315 0.354 0.955
Constant 1.052 0.209 0.971 0.601
Model fit 2 0.985 0.982 0.981 0.997 1 Scale for acceptance of management strategies was recoded as -2 "very unacceptable" to 0 "neither" to +2 "very acceptable" 2 The model goodness of fit statistic is the Pearson R correlation between predicted and observed acceptance ratings. All values were significant at p < .001
Mean acceptance of each of the four management strategies as influenced by each of the eight situational factor levels are displayed in Table 32. The management strategy "improve education and awareness of users" was rated as acceptable across all factor levels, but was most acceptable
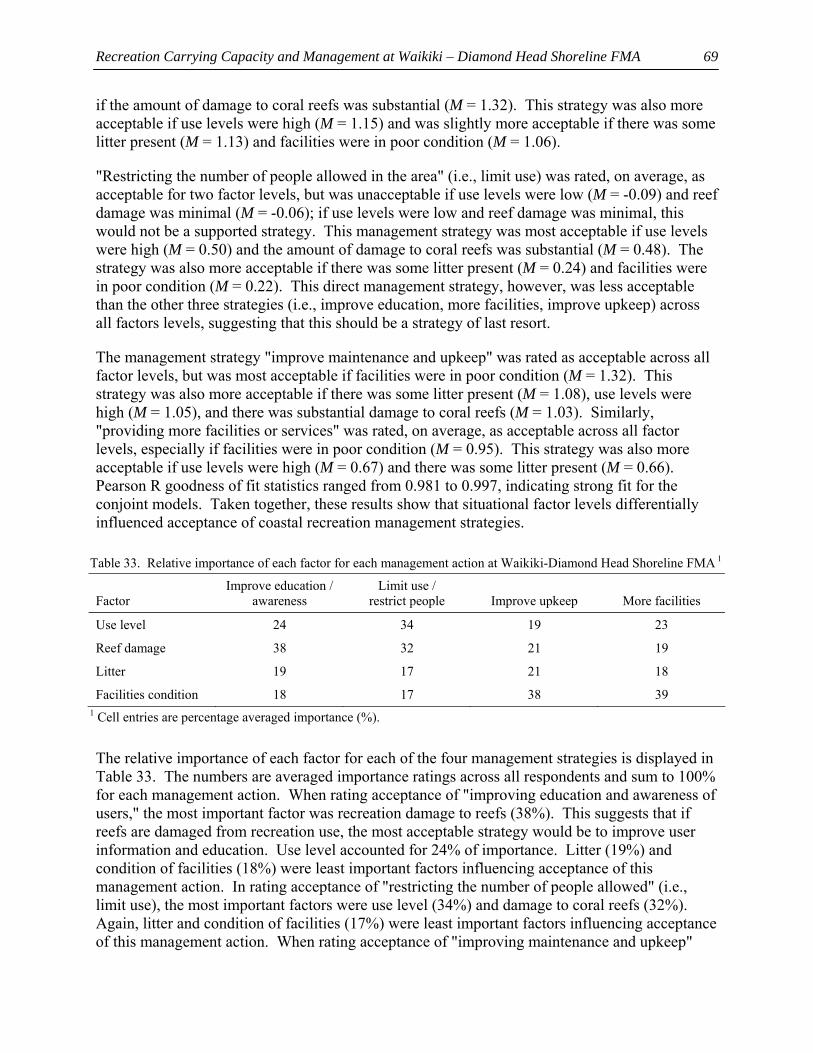
Recreation Carrying Capacity and Management at Waikiki – Diamond Head Shoreline FMA
69
if the amount of damage to coral reefs was substantial (M = 1.32). This strategy was also more acceptable if use levels were high (M = 1.15) and was slightly more acceptable if there was some litter present (M = 1.13) and facilities were in poor condition (M = 1.06).
"Restricting the number of people allowed in the area" (i.e., limit use) was rated, on average, as acceptable for two factor levels, but was unacceptable if use levels were low (M = -0.09) and reef damage was minimal (M = -0.06); if use levels were low and reef damage was minimal, this would not be a supported strategy. This management strategy was most acceptable if use levels were high (M = 0.50) and the amount of damage to coral reefs was substantial (M = 0.48). The strategy was also more acceptable if there was some litter present (M = 0.24) and facilities were in poor condition (M = 0.22). This direct management strategy, however, was less acceptable than the other three strategies (i.e., improve education, more facilities, improve upkeep) across all factors levels, suggesting that this should be a strategy of last resort.
The management strategy "improve maintenance and upkeep" was rated as acceptable across all factor levels, but was most acceptable if facilities were in poor condition (M = 1.32). This strategy was also more acceptable if there was some litter present (M = 1.08), use levels were high (M = 1.05), and there was substantial damage to coral reefs (M = 1.03). Similarly, "providing more facilities or services" was rated, on average, as acceptable across all factor levels, especially if facilities were in poor condition (M = 0.95). This strategy was also more acceptable if use levels were high (M = 0.67) and there was some litter present (M = 0.66). Pearson R goodness of fit statistics ranged from 0.981 to 0.997, indicating strong fit for the conjoint models. Taken together, these results show that situational factor levels differentially influenced acceptance of coastal recreation management strategies.
Table 33. Relative importance of each factor for each management action at Waikiki-Diamond Head Shoreline FMA 1
Factor
Improve education / awareness
Limit use / restrict people
Improve upkeep
More facilities
Use level 24 34 19 23
Reef damage 38 32 21 19
Litter 19 17 21 18
Facilities condition 18 17 38 39 1 Cell entries are percentage averaged importance (%).
The relative importance of each factor for each of the four management strategies is displayed in Table 33. The numbers are averaged importance ratings across all respondents and sum to 100% for each management action. When rating acceptance of "improving education and awareness of users," the most important factor was recreation damage to reefs (38%). This suggests that if reefs are damaged from recreation use, the most acceptable strategy would be to improve user information and education. Use level accounted for 24% of importance. Litter (19%) and condition of facilities (18%) were least important factors influencing acceptance of this management action. In rating acceptance of "restricting the number of people allowed" (i.e., limit use), the most important factors were use level (34%) and damage to coral reefs (32%). Again, litter and condition of facilities (17%) were least important factors influencing acceptance of this management action. When rating acceptance of "improving maintenance and upkeep"
Recreation Carrying Capacity and Management at Waikiki – Diamond Head Shoreline FMA
70
and "providing more facilities," the most important factor was condition of facilities (38% and 39%, respectively). This suggests that if facilities are in poor condition, the most acceptable strategies would be to improve maintenance and upkeep, and provide more facilities. Use level, reef damage, and litter were substantially less important in affecting acceptance of these two management actions (18% to 23%). Taken together, these results indicate that the relative importance of the four factors to mean acceptance ratings substantively differed according to the management actions evaluated.
Section Summary. Taken together, results showed that:
• The management strategy that received support from the most respondents at Sans Souci / Kaimana Beach and Diamond Head / Kuilei Cliffs Beaches (38% to 44%) was providing more educational and interpretive information. Users at Sans Souci / Kaimana Beach were somewhat divided on whether there should be more enforcement of rules and regulations at this site. This strategy, however, was opposed by the majority of users at Diamond Head / Kuilei Cliffs Beaches (58% oppose). The majority of users at both sites also opposed designated parking for tour buses (66% to 74% oppose) and zoning of activities (50% to 51% oppose). Respondents were most strongly opposed to allowing commercial activities (e.g., tour operators) at each site (78% to 80% oppose).
• Respondents were presented with eight scenarios of varying use levels, impacts to coral reefs, amounts of litter, and conditions of facilities (i.e., factors), and then evaluated the acceptability of four management strategies for each scenario (improve education and awareness of users, restrict number of people [i.e., limit use], improve maintenance and upkeep, provide more facilities). Improving education and awareness was the most strongly supported management action for each scenario. Even for the scenario describing the lowest amount of negative impact for each factor, improving education and awareness was acceptable, suggesting that respondents believed that education and awareness of users at each site currently needs to be improved. If conditions deteriorate (e.g., more damage to reefs, litter), this action would be even more acceptable.
• Improving maintenance or upkeep was the second most strongly supported management action for each scenario. This strategy was acceptable even for the scenario describing the lowest amount of negative impact for each factor, suggesting that users believed that maintenance and upkeep at each site needs to be improved. If conditions worsen (e.g., more reef damage, litter), this strategy would be even more acceptable.
• The third most strongly supported management strategy for each scenario was providing more facilities and services. More facilities and services was acceptable even for the scenario describing the lowest amount of negative impact for each factor, suggesting that many current users would support more facilities and services at each site. If conditions deteriorate (e.g., more damage to reefs, litter), providing more facilities and services would be even more acceptable.
• Respondents were most strongly opposed to restricting the number of people allowed in the area. If site conditions worsen, however, restricting use would become more acceptable. If use levels are high, there is a substantial amount of litter and damage to coral reefs from recreation, and facilities are in disrepair, users would be more supportive of strategies designed to restrict the number of people allowed in the area.
Recreation Carrying Capacity and Management at Waikiki – Diamond Head Shoreline FMA
71
• The most strongly supported strategy of improving education and awareness of people also generated the most consensus among respondents, suggesting that this would be the least controversial action. There was also strong consensus for improving maintenance and upkeep. The least acceptable strategy was restricting the number of people allowed in the area, but this was also the most controversial; it is likely that restricting the number of people allowed would generate controversy among users unless conditions deteriorated to a point where use levels were extremely high, there was substantial damage to reefs, litter was abundant, and facilities were in disrepair. Acceptance of each of the four management strategies did not substantively differ between the two sites (i.e., Sans Souci / Kaimana Beach, Diamond Head / Kuilei Cliffs Beaches) for each scenario.
• Conjoint analyses showed that situational factor levels differentially affected acceptance of management strategies. The strategy "improve education and awareness of users" was rated as acceptable across all factor levels, but was most acceptable if the amount of damage to reefs was substantial. "Restricting the number of people allowed in the area" was acceptable for two factor levels, but was unacceptable if use levels were low and reef damage was minimal; if use levels were low and reef damage was minimal, this would not be a supported strategy. This strategy was most acceptable if use levels were high and the amount of damage to reefs was substantial. "Improve maintenance and upkeep" and "provide more facilities or services" were acceptable across all factor levels, but were most acceptable if facilities were in poor condition.
• When rating acceptance of "improving education and awareness of users," the most important factor was recreation damage to reefs. In rating acceptance of "restricting the number of people allowed" (i.e., limit use), the most important factors were use level and damage to coral reefs. When rating acceptance of "improving maintenance and upkeep" and "providing more facilities," the most important factor was condition of facilities.
RECOMMENDATIONS
Based on these results from surveys of users at Waikiki-Diamond Head Shoreline FMA, the following management recommendations are proposed:
• The types of people, activities in which they were participating, and their attitudes and preferences often differed between the two sites (i.e., Sans Souci / Kaimana Beach, Diamond Head / Kuilei Cliffs Beaches). This suggests the need for site-specific management of various areas within Waikiki-Diamond Head Shoreline FMA irrespective of the close proximity of some of these areas.
• Within each site, users were heterogeneous, exhibiting a range of demographic characteristics and preferences. This suggests that not all users will respond in the same manner to changes in conditions and management at each site. Despite this diversity of users, the largest proportion of respondents had previously visited each site before and were residents of Hawaii, suggesting that managers should take opinions of repeat visitors and local residents into consideration when making decisions affecting each site.
Recreation Carrying Capacity and Management at Waikiki – Diamond Head Shoreline FMA
72
• The largest proportion of respondents had strong protectionist value orientations toward coral reef areas (i.e., biocentric, nature-centered), suggesting that recreation or other uses that have deleterious effects on coral reef ecosystems are not likely to be supported at each site. Research has shown that individuals' value orientations influence their attitudes, intentions, and behaviors, so knowing users' value orientations can be useful for estimating possible reactions to potentially controversial management actions. In addition, value orientations are stable and resistant to change, so attempts to inform and educate individuals with protectionist value orientations toward reef areas to consider adopting a favorable attitude and vote in support of actions that may be harmful to reef areas are unlikely to be successful.
• Although overall satisfaction of summer users at each site was extremely high, users were not satisfied with every aspect of the setting or their experience. At Sans Souci / Kaimana Beach, users were most dissatisfied with availability of parking and conditions of bathrooms. At Diamond Head / Kuilei Cliffs Beaches, respondents were most dissatisfied with the lack of bathrooms. These issues deserve management attention.
• At Sans Souci / Kaimana Beach, respondents were most satisfied with the presence of lifeguards at the beach and that users were not required to pay a fee to visit the area. At Diamond Head / Kuilei Cliffs Beaches, users were most satisfied with the clean ocean water and that they did not have to pay a fee to visit the area These and other conditions (e.g., bathrooms and parking at Sans Souci / Kaimana Beach; signs and trash cans at Diamond Head / Kuilei Cliffs Beaches) should be maintained and monitored to ensure that user satisfaction does not decline.
• Users rated all aspects of their experience and the conditions at Sans Souci / Kaimana Beach as important and were satisfied with these aspects, suggesting that managers should "keep up the good work" in their current management of this site. At Diamond Head / Kuilei Cliffs Beaches, users also rated most aspects of their experience and the conditions as important and were satisfied with these aspects, suggesting that managers should "keep up the good work" in their management of this site. However, bathrooms were important to users at this site, but users were dissatisfied with the lack of bathrooms at this site, suggesting that managers need to concentrate on addressing the lack of bathrooms at Diamond Head / Kuilei Cliffs Beaches.
• Both Sans Souci / Kaimana Beach (47% of users felt crowded) and Diamond Head / Kuilei Cliffs Beaches (39% of users felt crowded) had "low normal" crowding, suggesting that a major problem situation with summer use crowding does not exist at these two sites at this time. Use levels and users' perceptions of crowding should be monitored to ensure that crowding does not increase.
• At both sites, the majority of users reported encountering fewer people than the maximum number that they would accept encountering, suggesting that summer use levels are not a major problem at each site. Given that approximately one-third of users at Sans Souci / Kaimana Beach, however, encountered more people than their maximum tolerance, research and management attention may be needed to determine if summer use is expected to increase dramatically. In addition, use levels should be monitored to
Recreation Carrying Capacity and Management at Waikiki – Diamond Head Shoreline FMA
73
ensure that they do not frequently exceed approximately 217 people at one time at Sans Souci / Kaimana Beach and 118 people at one time at Diamond Head / Kuilei Cliffs.
• At each site, the majority of users reported encountering fewer bathrooms, showers, trash cans, picnic tables, park benches, and information signs than they feel should be at each site. In other words, users want more of each facility at each site and this would increase their satisfaction. From a management perspective, however, this may not be financially or logistically feasible. When the number of each facility that users' felt should be at each site was compared to what was actually at each site, there were enough of most facilities. At Diamond Head / Kuilei Cliffs Beaches, however, managers should consider installing bathrooms, picnic tables, and park benches.
• There was not a substantial amount of conflict among activity groups at Sans Souci / Kaimana Beach. The most prevalent conflict was with sunbathers and swimmers at this site (31%). There was, however conflict with surfers (45%) and windsurfers / kitesurfers (38%) at Diamond Head / Kuilei Cliffs Beaches. Zoning activity groups to keep them apart is often used to mitigate conflict. Zoning does not seem to be feasible or necessary at Sans Souci / Kaimana Beach at this time, but may be useful for separating surfers and windsurfers / kitesurfers at Diamond Head / Kuilei Cliffs Beaches. Enforcing zones, however, tends to be expensive and time consuming. It may more appropriate to inform users of appropriate behaviors by improving user education and awareness (e.g., signs, brochures, orientation sessions, contact with personnel).
• A large percentage of users observed people handling or standing on coral at each site and believed that this depreciative behavior was a problem at each site (58% to 61% observed, 67% to 75% felt it was a problem). Research has shown that touching or standing on coral reefs can cause harmful effects such as coral breakage and mortality. In addition, this behavior could pose safety risks to humans (e.g., cuts, scrapes, infections). As a result, management attention is needed to reduce the amount of handling and standing on coral at each site. A first step would be to provide interpretive and educational material at each site (e.g., signs, brochures, orientation sessions) informing users of the various problems associated with these behaviors. Following implementation of these indirect management actions, monitoring and additional follow-up research should be conducted to examine the extent to which participation in these behaviors has been reduced. If these approaches are unsuccessful, more direct management tactics such as regulations and enforcement may be necessary.
• The management strategy that would be supported by the most users at each site would be providing more interpretive and educational information (e.g., signs, brochures, orientation sessions, contact with personnel / lifeguards). Zoning of activities, parking for tour buses, and commercial activities (e.g., recreation tour operators) would be opposed by the majority of users. If managers decide that zoning, bus parking, and / or commercial activities are necessary in the future, users and local residents should be involved in informing the decision making process and a highly visible educational campaign should be implemented educating users and the community about the rationale for any decisions.
Recreation Carrying Capacity and Management at Waikiki – Diamond Head Shoreline FMA
74
• Respondents believed that improved interpretive and educational information, more upkeep and maintenance of facilities, and more facilities would currently be acceptable at each site. Restricting the number of users allowed at each site (i.e., limiting use) would currently be unacceptable. If there is ever evidence of substantial coral reef damage from recreation at each site, the most supported management strategy would be to provide more interpretive and educational information to users. If there is evidence that facilities (e.g., bathrooms, showers, trash cans) are in disrepair at each site, the most supported management strategies would be to improve upkeep and maintenance followed by providing more facilities. Restricting the number of people allowed at each site would only be supported if there was evidence that use levels were extremely high, coral reefs were damaged substantially, litter was prevalent, and facilities were in disrepair.
REFERENCES
Allen, W. (1992). Increased dangers to Caribbean marine ecosystems. Bioscience, 42, 330-335. Barker, N. H. L., & Roberts, C. M. (2004). Scuba diver behavior and the management of diving
impacts on coral reefs. Biological Conservation, 120, 481-489. Beard, J. G., & Ragheb, M. G. (1980). Measuring leisure satisfaction. Journal of Leisure
Research, 12, 20-33. Beatley, T. (1991). Protecting biodiversity in coastal environments: Introduction and overview.
Coastal Management, 19, 1-19. Bright, A. D., Manfredo, M. J., & Fulton, D. C. (2000). Segmenting the public: An application of
value orientations to wildlife planning in Colorado. Wildlife Society Bulletin, 28, 218-226.
Bruyere, B. L., Rodriguez, D. A., & Vaske, J. J. (2002). Enhancing importance – performance analysis through segmentation. Journal of Travel and Tourism Marketing, 12, 81-95.
Bryant, F. B., & Yarnold, P. R. (1995). Principal components analysis and exploratory and confirmatory factor analysis. In L. G. Grimm & P. R. Yarnold (Eds.), Reading and understanding multivariate statistics (pp. 99-136). Washington, D.C.: American Psychological Association.
Cesar, H. S. J., & van Beukering, P. J. H. (2004). Economic valuation of the coral reefs of Hawai’i. Pacific Science, 58, 231-242.
Cesar, H. S. J., van Beukering, P., Dierking, J., Pintz, S., Friedlander, A. (2004). Economics of MMAs in Hawaii: Interim results. Honolulu: Social Science Research Institute, U. of Hawaii.
Cohen, J. (1988). Statistical power analysis for the behavioral sciences. Hillsdale, NJ: Erlbaum. Cole, D. (1992). Modeling wilderness campsites: Factors that influence amount of impact.
Environmental Management, 16, 255-264. Cole, J. S., & Scott, D. (1999). Segmenting participation in wildlife watching: A comparison of
casual wildlife watchers and serious birders. Human Dimensions of Wildlife, 4(4), 44-61. Cordell, H. K., Bergstrom, J. C., Betz, C. J., & Green, G. T. (2004). Dominant socioeconomic
forces shaping the future of the United States. In M. J. Manfredo, J. J. Vaske, B. L. Bruyere, D. R. Field, & P. Brown (Eds.), Society and natural resources: A summary of knowledge (pp. 349-361). Jefferson, MO: Modern Litho.
Recreation Carrying Capacity and Management at Waikiki – Diamond Head Shoreline FMA
75
Cortina, J. M. (1993). What is coefficient alpha? An examination of theory and applications. Journal of Applied Psychology, 78, 98-104.
Davidson, K., Hamnett, M., & Minato, C. (2003). Economic value of Hawaii’s nearshore reefs. Honolulu: Social Science Research Institute, U. of Hawaii.
Dearden, P., & Rollins, R. (2002). Parks and protected areas in Canada: Planning and management. Toronto, ON: Oxford University Press.
Decker, D. J., Krueger, C. C., Baer, R. A., Knuth, B. A., & Richmond, M. E. (1996). From clients to stakeholders: A philosophical shift for fish and wildlife management. Human Dimensions of Wildlife, 1(1), 70-82.
Dennis, D. F. (1998). Analyzing public inputs to multiple objective decisions on national forests using conjoint analysis. Forest Science, 44, 421-429.
Dinsdale, E. A., & Fenton, D. M. (2006). Assessing coral reef condition: Eliciting community meanings. Society and Natural Resources, 19, 239-258.
Dinsdale, E. A., & Harriott, V. J. (2004). Assessing anchor damage on coral reefs: A case study in selection of environmental indicators. Environmental Management, 33, 126-139.
Donnelly, M. P., Vaske, J. J., Whittaker, D., & Shelby, B. (2000). Toward an understanding of norm prevalence: Analysis of 20 years of research. Environmental Management, 25, 403-414.
Dougherty, E. M., Fulton, D. C., & Anderson, D. H. (2003). The influence of gender on the relationship between wildlife value orientations, beliefs and the acceptability of lethal deer control in Cuyahoga Valley National Park. Society and Natural Resources, 16, 603-623.
Duffus, D. A., & Dearden, P. (1990). Non-consumptive wildlife-oriented recreation: A conceptual framework. Biological Conservation, 53(3), 213-231.
Farrell, T. A., & Marion, J. L. (2002). The protected area visitor impact management (PAVIM) framework: A simplified process for making management decisions. Journal of Sustainable Tourism, 10, 31-51.
Friedlander, A. M., Aeby, G., Brown, E., Clark, A., Coles, S., Dollar, S., et al. (2005). The state of coral reef ecosystems of the main Hawaiian Islands. In J. Waddell (Ed.), The state of coral reef ecosystems in the United States and Pacific Freely Associated States (pp. 222-269). Silver Spring, MD: NOAA/NCCOS Center for Coastal Monitoring & Assessment Biogeography Team.
Fulton, D. C., Manfredo, M. J., & Lipscomb, J. (1996). Wildlife value orientations: A conceptual and measurement approach. Human Dimensions of Wildlife, 1(2), 24-47.
Graefe, A. R., Kuss, F. R., & Vaske, J. J. (1990). Visitor impact management: The planning framework. Washington, D.C.: National Parks & Conservation Association.
Graefe, A. E., & Thapa, B. (2004). Conflict in natural resource recreation. In M. J. Manfredo, J. J. Vaske, B. L. Bruyere, D. R. Field, & P. J. Brown (Eds.), Society and natural resources: A summary of knowledge (pp. 209- 224). Jefferson, MO: Modern Litho.
Hair, J. F., & Black, W. C. (2000). Cluster analysis. In L. G. Grimm & P. R. Yarnold (Eds.), Reading and understanding more multivariate statistics (pp. 147-206). Washington, D.C.: American Psychological Association.
Hall, T. E., & Shelby, B. (2000). Temporal and spatial displacement: Evidence from a high use reservoir and alternate sites. Journal of Leisure Research, 32, 435-456.
Recreation Carrying Capacity and Management at Waikiki – Diamond Head Shoreline FMA
76
Hawaii Department of Business, Economic Development, and Tourism (DBEDT) (2002). State of Hawaii data book 2002: A statistical abstract. Honolulu: DBEDT Research and Economic Analysis Division, Statistics and Data Support Branch.
Hawkins, J., Roberts, C., Vant Hof, T., De Meyer, K., Tratalos, J., & Aldam, C. (1999). Effects of scuba diving on Caribbean coral and fish communities. Conservation Biology, 12, 888-897.
Hendee, J. C. (1974). A multiple-satisfaction approach to game management. Wildlife Society Bulletin, 2, 104-113.
Inglis, G. J., Johnson, V. I., & Ponte, F. (1999). Crowding norms in marine settings: A case study of snorkeling on the Great Barrier Reef. Environmental Management, 24, 369-381.
Kay, A. M., & Liddle, M. J. (1989). Impacts of human trampling in different zones of a coral reef flat. Environmental Management, 13, 509-520.
Kerr, W., Bos, M., & Clark, A. (2005). Hawaii’s local action strategy (LAS) to address recreational impacts to reefs. Honolulu: Dept. of Land and Natural Resources; Hawaii Ecotourism Association.
Kneeshaw, K., Vaske, J. J., Bright, A. D., & Absher, J. D. (2004). Situational influences of acceptable wildland fire management actions. Society and Natural Resources, 17, 477-489.
Lankford, S. V., Inui, Y., Whittle, A., Luna, R. & Tyrone, D. (2005). Sustainability of coastal / marine recreation: Modeling social carrying capacity for Hanauma Bay, Hawaii. Final project report for University of Hawaii Sea Grant College Program SOEST. Cedar Falls, IA: University of Northern Iowa.
Lawson, S. R., Roggenbuck, J. W., Hall, T. E., & Moldovanyi, A. (2006). A conjoint analysis of preference heterogeneity among day and overnight visitors to the Okefenokee Wilderness. Journal of Leisure Research, 38, 575-600.
Layden, P. C., Manfredo, M. J., & Tucker, P. (2003). Integrating public values toward wildlife into land us planning: A case study in La Plata County, Colorado. Wildlife Society Bulletin, 31(1), 174-184.
Liddle, M. J., & Kay, A. M. (1986). Resistance, survival, and recovery of trampled corals on the Great Barrier Reef. Biological Conservation, 87, 1-18.
Loether, J., & McTavish, D. G. (1976). Descriptive and inferential statistics: An introduction. A selectively combined edition of descriptive statistics for sociologists and inferential statistics for sociologists. Boston, MA: Allyn & Bacon.
Luce, R. D., & Tukey, J. W. (1964). Simultaneous conjoint measurement: A new type of fundamental measurement. Journal of Mathematical Psychology, 1, 1-27.
Lynch, T. P., Wilkinson, E., Melling, L., Hamilton, R., Macready, A., & Feary, S. (2004). Conflict and impacts of divers and anglers in a marine park. Environmental Management, 33, 196-211.
Manfredo, M. J., Fulton, D. C., & Pierce, C. L. (1997). Understanding voter behavior on wildlife ballot initiatives: Colorado’s trapping amendment. Human Dimensions of Wildlife, 2(4), 22-39.
Manfredo, M. J., & Larson, R. A. (1993). Managing for wildlife viewing recreation experiences: An application in Colorado. Wildlife Society Bulletin, 21, 226-236.
Manfredo, M. J., Vaske, J. J., & Teel, T. L. (2003). The potential for conflict index: A graphic approach to practical significance of human dimensions research. Human Dimensions of Wildlife, 8, 219-228.
Recreation Carrying Capacity and Management at Waikiki – Diamond Head Shoreline FMA
77
Mannell, R. C. (1999). Leisure experience and satisfaction. In E.L. Jackson & T.L. Burton (Eds.), Leisure studies: Prospects for the twenty-first century (pp. 235-252). State College, PA: Venture.
Manning, R. E. (1999). Studies in outdoor recreation: Search and research for satisfaction (2 ed.). Corvallis: Oregon State University Press.
Manning, R. (2001). Visitor experience and resource protection: A framework for managing the carrying capacity of national parks. Journal of Park & Recreation Administration, 19, 93-108.
Manning, R. E. (2004). Recreation planning frameworks. In M. J. Manfredo, J. J. Vaske, B. L. Bruyere, D. R. Field, & P. J. Brown (Eds), Society and natural resources: A summary of knowledge (pp. 83-92). Jefferson, MO: Modern Litho.
Manning, R. E. (2007). Parks and carrying capacity: Commons without tragedy. Washington, D.C.: Island Press.
Manning, R. E., Valliere, W. A., Wang, B., & Jacobi, C. (1999). Crowding norms: Alternative measurement approaches. Leisure Sciences, 21, 97-115.
McCool, S., & Cole, D. (1997). Experiencing limits of acceptable change: Some thoughts after a decade of implementation. In USDA Forest Service, Proceedings – Limits of acceptable change and related planning processes: Progress and future directions (pp. 72-78).Washington DC: US Government Printing Office.
McFarlane, B. L., Watson, D. O., & Boxall, P. C. (2003). Women hunters in Alberta, Canada: Girl power or guys in disguise? Human Dimensions of Wildlife, 8, 165-180.
Mitra, A., & Lankford, S. (1999). Research methods in park, recreation, and leisure services. Champaign, IL: Sagamore.
Needham, M. D. (2008). Visitor tradeoffs and preferences for conditions at Henry Rierson Spruce Run Campground in Clatsop State Forest, Oregon. Final project report for Oregon Department of Forestry. Corvallis: Oregon State University, Department of Forest Resources.
Needham, M. D., & Rollins, R. B. (2005). Interest group standards for recreation and tourism impacts at ski areas in the summer. Tourism Management, 26, 1-13.
Needham, M. D., Rollins, R. B., & Vaske, J. J. (2005). Skill level and normative evaluations among summer recreationists at alpine ski areas. Leisure / Loisir: Journal of the Canadian Association for Leisure Studies, 29(1), 71-94.
Needham, M. D., Rollins, R. B., & Wood, C. J. B. (2004a). Site-specific encounters, norms and crowding of summer visitors at alpine ski areas. International Journal of Tourism Research, 6, 421-437.
Needham, M. D., Rollins, R. B., & Wood, C. J. B. (2004b). Stakeholders’ perceptions of bear viewing tours at an alpine ski area in the summer. Human Dimensions of Wildlife, 9, 153-156.
Needham, M. D., Vaske, J. J., Donnelly, M. P., & Manfredo, M. J. (2007). Hunting specialization and its relationship to participation in response to chronic wasting disease. Journal of Leisure Research, 39, 413-437.
Needham, M. D., Vaske, J. J., & Manfredo, M. J. (2004c). Hunters’ behavior and acceptance of management actions related to chronic wasting disease in eight states. Human Dimensions of Wildlife, 9, 211-231.
Nunnally, J. C., & Bernstein, I. H. (1994). Psychometric theory. New York, NY: McGraw-Hill.
Recreation Carrying Capacity and Management at Waikiki – Diamond Head Shoreline FMA
78
Oh, H. (2001). Revisiting importance – performance analysis. Tourism Management, 22, 617-627.
Orams, M. (1999). Marine tourism: Development, impacts, and management. London: Routledge.
Pierce, C. L., Manfredo, M. J., & Vaske, J. J. (2001). Social science theories in wildlife management. In D. J. Decker, T. L. Brown, & W. F. Siemer (eds.), Human dimensions of wildlife management in North America (pp. 39-56). Bethesda, MD: The Wildlife Society.
QMark Research and Polling (2005). Noneconomic value of Hawaii’s coral reef: Results from telephone survey and focus groups. Honolulu: Social Science Research Institute, U. of Hawaii.
Rodgers, K. S., & Cox, E. F. (2003). The effects of trampling on Hawaiian corals along a gradient of human use. Biological Conservation, 112, 383-389.
Salant, P., & Dillman, D. A. (1994). How to conduct your own survey. New York, NY: John Wiley and Sons.
Scherer, D., & Attig, T. (1983). Ethics and the environment. Englewood Cliffs, NJ: Prentice Hall.
Schleyer, M. H., & Tomalin, B. J. (2000). Damage on South African coral reefs and an assessment of sustainable diving capacity using a fisheries approach. Bulletin of Marine Science, 67, 1025-1042.
Shelby, B., Bregenzer, N. S., & Johnson, R. (1988). Displacement and product shift: Empirical evidence from Oregon rivers. Journal of Leisure Research, 20, 274-288.
Shelby, B., & Heberlein, T. A. (1986). Carrying capacity in recreation settings. Corvallis: Oregon State University Press.
Shelby, B., Vaske, J. J., & Donnelly, M. P. (1996). Norms, standards, and natural resources. Leisure Sciences, 18, 103-123.
Shelby, B., Vaske, J. J., & Heberlein , T.A. (1989). Comparative analysis of crowding in multiple locations: Results from fifteen years of research. Leisure Sciences, 11, 269-291.
Shindler, B., List, P., & Steel, B. S. (1993). Managing federal forests: Public attitudes in Oregon and nationwide. Journal of Forestry, 3, 36-42.
Stankey, G. H., Cole, D. N., Lucas, R. C., Peterson, M. E., Frissell, S., & Washburne, R. F. (1985). The Limits of Acceptable Change System for wilderness planning. USDA Forest Service General Technical Report INT-176. Utah: Intermountain Forest & Range Station.
Steel, B. S., List, P., & Shindler, B. (1994). Conflicting values about federal forests: A comparison of national and Oregon publics. Society and Natural Resources, 7(2), 137-153.
Thapa, B., & Graefe, A. R. (2003). Level of skill and its relationship to recreation conflict and tolerance among adult skiers and snowboarders. World Leisure, 45, 15-27.
Thompson, S. C. G., & Barton, M. A. (1994). Ecocentric and anthropocentric attitudes toward the environment. Journal of Environmental Psychology, 14, 149-158.
Tissot, B. N., & Hallacher, L. E. (2000). Diver impacts on coral reefs at Kealakekua Bay, Hawai’i. Accessed April 2006 from: http://www.coralreefnetwork.com/research/kbay.
Tourism poll tells us to pay heed to locals. (2006, April 13). Honolulu Advertiser. Tratalos, J., & Austin, T. (2001). Impacts of recreational SCUBA diving on coral communities of
the Caribbean island of Grand Cayman. Biological Conservation, 102, 67-75.
Recreation Carrying Capacity and Management at Waikiki – Diamond Head Shoreline FMA
79
van Beukering, P. J. H., & Cesar, H. S. J. (2004). Ecological economic modeling of coral reefs: Evaluating tourist overuse at Hanauma bay and algae blooms at the Kihei coast, Hawai’i. Pacific Science, 58, 243-260.
Vaske, J. J., Beaman, J., Stanley, R., & Grenier, M. (1996). Importance performance and segmentation: Where do we go from here? Journal of Travel and Tourism Marketing, 5, 225-240.
Vaske, J. J., Carothers, P., Donnelly, M. P., & Baird, B. (2000). Recreation conflict among skiers and snowboarders. Leisure Sciences, 22, 297-313.
Vaske, J. J., & Donnelly, M. P. (1999). A value-attitude-behavior model predicting wildland voting intentions. Society and Natural Resources, 12, 523-537.
Vaske, J. J., & Donnelly, M. P. (2002). Generalizing the encounter-norm-crowding relationship. Leisure Sciences, 24, 255-270.
Vaske, J. J., Donnelly, M. P., Wittmann, K., & Laidlaw, S. (1995). Interpersonal versus social values conflict. Leisure Sciences, 17, 205-222.
Vaske, J. J., Gliner, J. A., & Morgan, G. A. (2002). Communicating judgments about practical significance: Effect size, confidence intervals and odds ratios. Human Dimensions of Wildlife, 7, 287-300.
Vaske, J. J., & Needham, M. D. (2007). Segmenting public beliefs about conflict with coyotes in an urban recreation setting. Journal of Park and Recreation Administration, 25(4), 79-98.
Vaske, J. J., Needham, M. D., & Cline Jr., R. C. (2007). Clarifying interpersonal and social values conflict among recreationists. Journal of Leisure Research, 39, 182-195.
Vaske, J. J., Needham, M. D., Newman, P., Manfredo, M. J., & Petchenik, J. (2006). Potential for conflict index: Hunters' responses to chronic wasting disease. Wildlife Society Bulletin, 34, 44-50.
Vaske, J. J., Shelby, B., Graefe, A. R., & Heberlein, T. A. (1986). Backcountry encounter norms: Theory, method, and empirical evidence. Journal of Leisure Research, 18, 137-153.
Weaver, D. (2001). Ecotourism. Sydney: Wiley. Zinn, H. C., & Pierce, C. L. (2002). Values, gender, and concern about potentially dangerous
wildlife. Environment & Behavior, 34(2), 240-257.
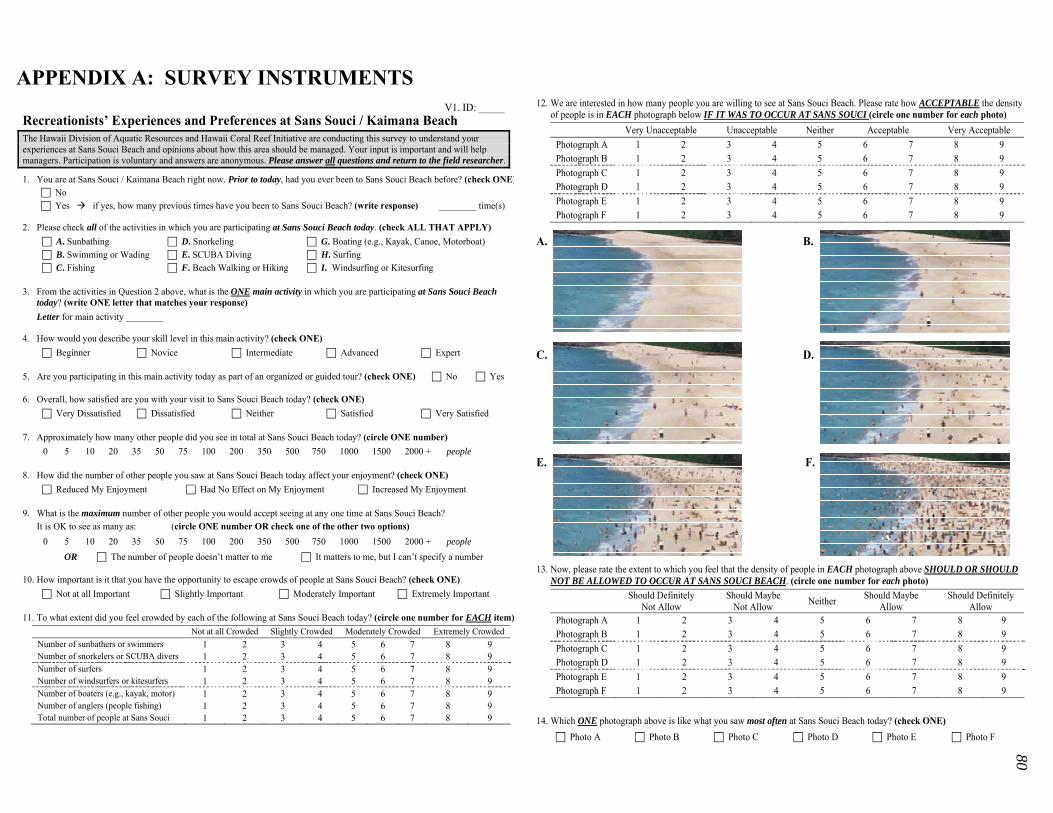
APPENDIX A: SURVEY INSTRUMENTS
Recreationists’ Experiences and Preferences at Sans Souci / Kaimana Beach The Hawaii Division of Aquatic Resources and Hawaii Coral Reef Initiative are conducting this survey to understand your experiences at Sans Souci Beach and opinions about how this area should be managed. Your input is important and will help managers. Participation is voluntary and answers are anonymous. Please answer all questions and return to the field researcher.
1. You are at Sans Souci / Kaimana Beach right now. Prior to today, had you ever been to Sans Souci Beach before? (check ONE) No Yes if yes, how many previous times have you been to Sans Souci Beach? (write response) ________ time(s)
2. Please check all of the activities in which you are participating at Sans Souci Beach today. (check ALL THAT APPLY) A. Sunbathing D. Snorkeling G. Boating (e.g., Kayak, Canoe, Motorboat) B. Swimming or Wading E. SCUBA Diving H. Surfing C. Fishing F. Beach Walking or Hiking I. Windsurfing or Kitesurfing
3. From the activities in Question 2 above, what is the ONE main activity in which you are participating at Sans Souci Beach today? (write ONE letter that matches your response) Letter for main activity ________
4. How would you describe your skill level in this main activity? (check ONE) Beginner Novice Intermediate Advanced Expert
5. Are you participating in this main activity today as part of an organized or guided tour? (check ONE) No Yes
6. Overall, how satisfied are you with your visit to Sans Souci Beach today? (check ONE) Very Dissatisfied Dissatisfied Neither Satisfied Very Satisfied
7. Approximately how many other people did you see in total at Sans Souci Beach today? (circle ONE number) 0 5 10 20 35 50 75 100 200 350 500 750 1000 1500 2000 + people
8. How did the number of other people you saw at Sans Souci Beach today affect your enjoyment? (check ONE) Reduced My Enjoyment Had No Effect on My Enjoyment Increased My Enjoyment
9. What is the maximum number of other people you would accept seeing at any one time at Sans Souci Beach? It is OK to see as many as: (circle ONE number OR check one of the other two options)
0 5 10 20 35 50 75 100 200 350 500 750 1000 1500 2000 + people OR The number of people doesn’t matter to me It matters to me, but I can’t specify a number
10. How important is it that you have the opportunity to escape crowds of people at Sans Souci Beach? (check ONE) Not at all Important Slightly Important Moderately Important Extremely Important
11. To what extent did you feel crowded by each of the following at Sans Souci Beach today? (circle one number for EACH item) Not at all Crowded Slightly Crowded Moderately Crowded Extremely Crowded Number of sunbathers or swimmers 1 2 3 4 5 6 7 8 9 Number of snorkelers or SCUBA divers 1 2 3 4 5 6 7 8 9 Number of surfers 1 2 3 4 5 6 7 8 9 Number of windsurfers or kitesurfers 1 2 3 4 5 6 7 8 9 Number of boaters (e.g., kayak, motor) 1 2 3 4 5 6 7 8 9 Number of anglers (people fishing) 1 2 3 4 5 6 7 8 9 Total number of people at Sans Souci 1 2 3 4 5 6 7 8 9
V1. ID: _____
12. We are interested in how many people you are willing to see at Sans Souci Beach. Please rate how ACCEPTABLE the density of people is in EACH photograph below IF IT WAS TO OCCUR AT SANS SOUCI (circle one number for each photo)
Very Unacceptable Unacceptable Neither Acceptable Very Acceptable Photograph A 1 2 3 4 5 6 7 8 9 Photograph B 1 2 3 4 5 6 7 8 9 Photograph C 1 2 3 4 5 6 7 8 9 Photograph D 1 2 3 4 5 6 7 8 9 Photograph E 1 2 3 4 5 6 7 8 9 Photograph F 1 2 3 4 5 6 7 8 9
A. B. C. D.
E. F.
13. Now, please rate the extent to which you feel that the density of people in EACH photograph above SHOULD OR SHOULD NOT BE ALLOWED TO OCCUR AT SANS SOUCI BEACH. (circle one number for each photo)
Should Definitely Not Allow
Should Maybe Not Allow Neither Should Maybe
Allow Should Definitely
Allow Photograph A 1 2 3 4 5 6 7 8 9 Photograph B 1 2 3 4 5 6 7 8 9 Photograph C 1 2 3 4 5 6 7 8 9 Photograph D 1 2 3 4 5 6 7 8 9 Photograph E 1 2 3 4 5 6 7 8 9 Photograph F 1 2 3 4 5 6 7 8 9
14. Which ONE photograph above is like what you saw most often at Sans Souci Beach today? (check ONE) Photo A Photo B Photo C Photo D Photo E Photo F
80
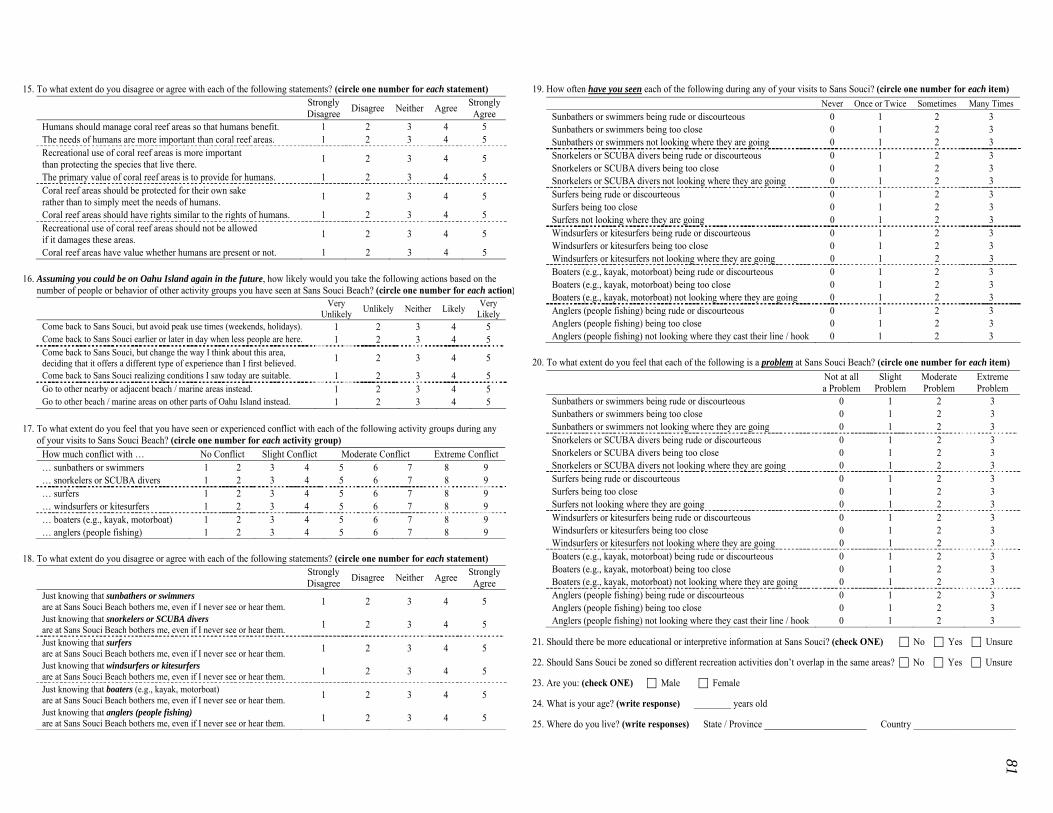
15. To what extent do you disagree or agree with each of the following statements? (circle one number for each statement)
StronglyDisagree Disagree Neither Agree Strongly
Agree Humans should manage coral reef areas so that humans benefit. 1 2 3 4 5 The needs of humans are more important than coral reef areas. 1 2 3 4 5 Recreational use of coral reef areas is more important than protecting the species that live there. 1 2 3 4 5
The primary value of coral reef areas is to provide for humans. 1 2 3 4 5 Coral reef areas should be protected for their own sake rather than to simply meet the needs of humans. 1 2 3 4 5
Coral reef areas should have rights similar to the rights of humans. 1 2 3 4 5 Recreational use of coral reef areas should not be allowed if it damages these areas. 1 2 3 4 5
Coral reef areas have value whether humans are present or not. 1 2 3 4 5
16. Assuming you could be on Oahu Island again in the future, how likely would you take the following actions based on the number of people or behavior of other activity groups you have seen at Sans Souci Beach? (circle one number for each action)
Very Unlikely Unlikely Neither Likely Very
Likely Come back to Sans Souci, but avoid peak use times (weekends, holidays). 1 2 3 4 5 Come back to Sans Souci earlier or later in day when less people are here. 1 2 3 4 5 Come back to Sans Souci, but change the way I think about this area, deciding that it offers a different type of experience than I first believed. 1 2 3 4 5
Come back to Sans Souci realizing conditions I saw today are suitable. 1 2 3 4 5 Go to other nearby or adjacent beach / marine areas instead. 1 2 3 4 5 Go to other beach / marine areas on other parts of Oahu Island instead. 1 2 3 4 5
17. To what extent do you feel that you have seen or experienced conflict with each of the following activity groups during any of your visits to Sans Souci Beach? (circle one number for each activity group)
How much conflict with … No Conflict Slight Conflict Moderate Conflict Extreme Conflict … sunbathers or swimmers 1 2 3 4 5 6 7 8 9 … snorkelers or SCUBA divers 1 2 3 4 5 6 7 8 9 … surfers 1 2 3 4 5 6 7 8 9 … windsurfers or kitesurfers 1 2 3 4 5 6 7 8 9 … boaters (e.g., kayak, motorboat) 1 2 3 4 5 6 7 8 9 … anglers (people fishing) 1 2 3 4 5 6 7 8 9
18. To what extent do you disagree or agree with each of the following statements? (circle one number for each statement) Strongly
Disagree Disagree Neither Agree StronglyAgree
Just knowing that sunbathers or swimmers are at Sans Souci Beach bothers me, even if I never see or hear them. 1 2 3 4 5
Just knowing that snorkelers or SCUBA divers are at Sans Souci Beach bothers me, even if I never see or hear them. 1 2 3 4 5
Just knowing that surfers are at Sans Souci Beach bothers me, even if I never see or hear them. 1 2 3 4 5
Just knowing that windsurfers or kitesurfers are at Sans Souci Beach bothers me, even if I never see or hear them. 1 2 3 4 5
Just knowing that boaters (e.g., kayak, motorboat) are at Sans Souci Beach bothers me, even if I never see or hear them. 1 2 3 4 5
Just knowing that anglers (people fishing) are at Sans Souci Beach bothers me, even if I never see or hear them. 1 2 3 4 5
19. How often have you seen each of the following during any of your visits to Sans Souci? (circle one number for each item) Never Once or Twice Sometimes Many Times Sunbathers or swimmers being rude or discourteous 0 1 2 3 Sunbathers or swimmers being too close 0 1 2 3 Sunbathers or swimmers not looking where they are going 0 1 2 3 Snorkelers or SCUBA divers being rude or discourteous 0 1 2 3 Snorkelers or SCUBA divers being too close 0 1 2 3 Snorkelers or SCUBA divers not looking where they are going 0 1 2 3 Surfers being rude or discourteous 0 1 2 3 Surfers being too close 0 1 2 3 Surfers not looking where they are going 0 1 2 3 Windsurfers or kitesurfers being rude or discourteous 0 1 2 3 Windsurfers or kitesurfers being too close 0 1 2 3 Windsurfers or kitesurfers not looking where they are going 0 1 2 3 Boaters (e.g., kayak, motorboat) being rude or discourteous 0 1 2 3 Boaters (e.g., kayak, motorboat) being too close 0 1 2 3 Boaters (e.g., kayak, motorboat) not looking where they are going 0 1 2 3 Anglers (people fishing) being rude or discourteous 0 1 2 3 Anglers (people fishing) being too close 0 1 2 3 Anglers (people fishing) not looking where they cast their line / hook 0 1 2 3
20. To what extent do you feel that each of the following is a problem at Sans Souci Beach? (circle one number for each item) Not at all
a Problem Slight
Problem Moderate Problem
Extreme Problem
Sunbathers or swimmers being rude or discourteous 0 1 2 3 Sunbathers or swimmers being too close 0 1 2 3 Sunbathers or swimmers not looking where they are going 0 1 2 3 Snorkelers or SCUBA divers being rude or discourteous 0 1 2 3 Snorkelers or SCUBA divers being too close 0 1 2 3 Snorkelers or SCUBA divers not looking where they are going 0 1 2 3 Surfers being rude or discourteous 0 1 2 3 Surfers being too close 0 1 2 3 Surfers not looking where they are going 0 1 2 3 Windsurfers or kitesurfers being rude or discourteous 0 1 2 3 Windsurfers or kitesurfers being too close 0 1 2 3 Windsurfers or kitesurfers not looking where they are going 0 1 2 3 Boaters (e.g., kayak, motorboat) being rude or discourteous 0 1 2 3 Boaters (e.g., kayak, motorboat) being too close 0 1 2 3 Boaters (e.g., kayak, motorboat) not looking where they are going 0 1 2 3 Anglers (people fishing) being rude or discourteous 0 1 2 3 Anglers (people fishing) being too close 0 1 2 3 Anglers (people fishing) not looking where they cast their line / hook 0 1 2 3
21. Should there be more educational or interpretive information at Sans Souci? (check ONE) No Yes Unsure
22. Should Sans Souci be zoned so different recreation activities don’t overlap in the same areas? No Yes Unsure
23. Are you: (check ONE) Male Female
24. What is your age? (write response) ________ years old
25. Where do you live? (write responses) State / Province ______________________ Country ______________________
81
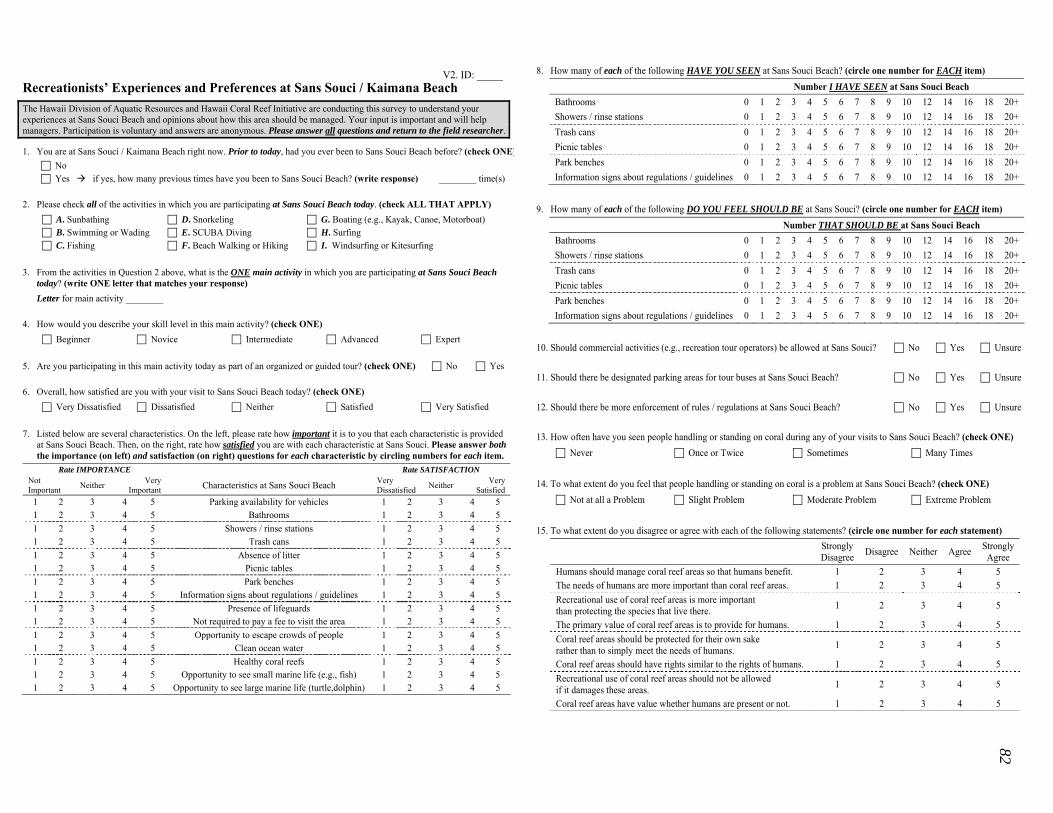
Recreationists’ Experiences and Preferences at Sans Souci / Kaimana Beach The Hawaii Division of Aquatic Resources and Hawaii Coral Reef Initiative are conducting this survey to understand your experiences at Sans Souci Beach and opinions about how this area should be managed. Your input is important and will help managers. Participation is voluntary and answers are anonymous. Please answer all questions and return to the field researcher.
1. You are at Sans Souci / Kaimana Beach right now. Prior to today, had you ever been to Sans Souci Beach before? (check ONE) No Yes if yes, how many previous times have you been to Sans Souci Beach? (write response) ________ time(s)
2. Please check all of the activities in which you are participating at Sans Souci Beach today. (check ALL THAT APPLY) A. Sunbathing D. Snorkeling G. Boating (e.g., Kayak, Canoe, Motorboat) B. Swimming or Wading E. SCUBA Diving H. Surfing C. Fishing F. Beach Walking or Hiking I. Windsurfing or Kitesurfing
3. From the activities in Question 2 above, what is the ONE main activity in which you are participating at Sans Souci Beach today? (write ONE letter that matches your response) Letter for main activity ________
4. How would you describe your skill level in this main activity? (check ONE) Beginner Novice Intermediate Advanced Expert
5. Are you participating in this main activity today as part of an organized or guided tour? (check ONE) No Yes
6. Overall, how satisfied are you with your visit to Sans Souci Beach today? (check ONE) Very Dissatisfied Dissatisfied Neither Satisfied Very Satisfied
7. Listed below are several characteristics. On the left, please rate how important it is to you that each characteristic is provided at Sans Souci Beach. Then, on the right, rate how satisfied you are with each characteristic at Sans Souci. Please answer both the importance (on left) and satisfaction (on right) questions for each characteristic by circling numbers for each item.
Rate IMPORTANCE Rate SATISFACTION Not Important Neither Very
Important Characteristics at Sans Souci Beach Very Dissatisfied Neither Very
Satisfied 1 2 3 4 5 Parking availability for vehicles 1 2 3 4 5 1 2 3 4 5 Bathrooms 1 2 3 4 5 1 2 3 4 5 Showers / rinse stations 1 2 3 4 5 1 2 3 4 5 Trash cans 1 2 3 4 5 1 2 3 4 5 Absence of litter 1 2 3 4 5 1 2 3 4 5 Picnic tables 1 2 3 4 5 1 2 3 4 5 Park benches 1 2 3 4 5 1 2 3 4 5 Information signs about regulations / guidelines 1 2 3 4 5 1 2 3 4 5 Presence of lifeguards 1 2 3 4 5 1 2 3 4 5 Not required to pay a fee to visit the area 1 2 3 4 5 1 2 3 4 5 Opportunity to escape crowds of people 1 2 3 4 5 1 2 3 4 5 Clean ocean water 1 2 3 4 5 1 2 3 4 5 Healthy coral reefs 1 2 3 4 5 1 2 3 4 5 Opportunity to see small marine life (e.g., fish) 1 2 3 4 5 1 2 3 4 5 Opportunity to see large marine life (turtle,dolphin) 1 2 3 4 5
V2. ID: _____
8. How many of each of the following HAVE YOU SEEN at Sans Souci Beach? (circle one number for EACH item) Number I HAVE SEEN at Sans Souci Beach Bathrooms 0 1 2 3 4 5 6 7 8 9 10 12 14 16 18 20+ Showers / rinse stations 0 1 2 3 4 5 6 7 8 9 10 12 14 16 18 20+ Trash cans 0 1 2 3 4 5 6 7 8 9 10 12 14 16 18 20+ Picnic tables 0 1 2 3 4 5 6 7 8 9 10 12 14 16 18 20+ Park benches 0 1 2 3 4 5 6 7 8 9 10 12 14 16 18 20+ Information signs about regulations / guidelines 0 1 2 3 4 5 6 7 8 9 10 12 14 16 18 20+
9. How many of each of the following DO YOU FEEL SHOULD BE at Sans Souci? (circle one number for EACH item) Number THAT SHOULD BE at Sans Souci Beach Bathrooms 0 1 2 3 4 5 6 7 8 9 10 12 14 16 18 20+ Showers / rinse stations 0 1 2 3 4 5 6 7 8 9 10 12 14 16 18 20+ Trash cans 0 1 2 3 4 5 6 7 8 9 10 12 14 16 18 20+ Picnic tables 0 1 2 3 4 5 6 7 8 9 10 12 14 16 18 20+ Park benches 0 1 2 3 4 5 6 7 8 9 10 12 14 16 18 20+ Information signs about regulations / guidelines 0 1 2 3 4 5 6 7 8 9 10 12 14 16 18 20+
10. Should commercial activities (e.g., recreation tour operators) be allowed at Sans Souci? No Yes Unsure
11. Should there be designated parking areas for tour buses at Sans Souci Beach? No Yes Unsure
12. Should there be more enforcement of rules / regulations at Sans Souci Beach? No Yes Unsure
13. How often have you seen people handling or standing on coral during any of your visits to Sans Souci Beach? (check ONE) Never Once or Twice Sometimes Many Times
14. To what extent do you feel that people handling or standing on coral is a problem at Sans Souci Beach? (check ONE) Not at all a Problem Slight Problem Moderate Problem Extreme Problem
15. To what extent do you disagree or agree with each of the following statements? (circle one number for each statement) Strongly
Disagree Disagree Neither Agree Strongly Agree
Humans should manage coral reef areas so that humans benefit. 1 2 3 4 5 The needs of humans are more important than coral reef areas. 1 2 3 4 5 Recreational use of coral reef areas is more important than protecting the species that live there. 1 2 3 4 5
The primary value of coral reef areas is to provide for humans. 1 2 3 4 5 Coral reef areas should be protected for their own sake rather than to simply meet the needs of humans. 1 2 3 4 5
Coral reef areas should have rights similar to the rights of humans. 1 2 3 4 5 Recreational use of coral reef areas should not be allowed if it damages these areas. 1 2 3 4 5
Coral reef areas have value whether humans are present or not. 1 2 3 4 5 82

The following shaded boxes contain 8 scenarios that describe potential conditions at Sans Souci. NO SCENARIOS ARE THE SAME. Carefully read each scenario then answer ALL questions after each scenario by circling one number for each action.
Scenario 1: Imagine all four of the following conditions were common at Sans Souci Beach: • HIGH number of people (use level) • MINIMAL recreation damage to coral reef (less than 25% broken, trampled) • NO litter • POOR condition of facilities (e.g., bathrooms, showers, trash cans, signs)
16. If all conditions in Scenario 1 were common how acceptable would it be for managers to take EACH of the following actions? Very Unacceptable Unacceptable Neither Acceptable Very Acceptable
Improve education / awareness of people in this area 1 2 3 4 5 Restrict the number of people allowed in this area 1 2 3 4 5 Improve maintenance or upkeep of this area 1 2 3 4 5 Provide more facilities or services in this area 1 2 3 4 5
Scenario 2: Imagine all four of the following conditions were common at Sans Souci Beach: • HIGH number of people (use level) • SUBSTANTIAL recreation damage to coral reef (over 75% broken, trampled) • SOME litter • POOR condition of facilities (e.g., bathrooms, showers, trash cans, signs)
17. If all conditions in Scenario 2 were common how acceptable would it be for managers to take EACH of the following actions? Very Unacceptable Unacceptable Neither Acceptable Very Acceptable
Improve education / awareness of people in this area 1 2 3 4 5 Restrict the number of people allowed in this area 1 2 3 4 5 Improve maintenance or upkeep of this area 1 2 3 4 5 Provide more facilities or services in this area 1 2 3 4 5
Scenario 3: Imagine all four of the following conditions were common at Sans Souci Beach: • HIGH number of people (use level) • MINIMAL recreation damage to coral reef (less than 25% broken, trampled) • SOME litter • GOOD condition of facilities (e.g., bathrooms, showers, trash cans, signs)
18. If all conditions in Scenario 3 were common how acceptable would it be for managers to take EACH of the following actions? Very Unacceptable Unacceptable Neither Acceptable Very Acceptable
Improve education / awareness of people in this area 1 2 3 4 5 Restrict the number of people allowed in this area 1 2 3 4 5 Improve maintenance or upkeep of this area 1 2 3 4 5 Provide more facilities or services in this area 1 2 3 4 5
Scenario 4: Imagine all four of the following conditions were common at Sans Souci Beach: • LOW number of people (use level) • MINIMAL recreation damage to coral reef (less than 25% broken, trampled) • NO litter • GOOD condition of facilities (e.g., bathrooms, showers, trash cans, signs)
19. If all conditions in Scenario 4 were common how acceptable would it be for managers to take EACH of the following actions? Very Unacceptable Unacceptable Neither Acceptable Very Acceptable
Improve education / awareness of people in this area 1 2 3 4 5 Restrict the number of people allowed in this area 1 2 3 4 5 Improve maintenance or upkeep of this area 1 2 3 4 5 Provide more facilities or services in this area 1 2 3 4 5
Scenario 5: Imagine all four of the following conditions were common at Sans Souci Beach: • LOW number of people (use level) • SUBSTANTIAL recreation damage to coral reef (over 75% broken, trampled) • NO litter • POOR condition of facilities (e.g., bathrooms, showers, trash cans, signs)
20. If all conditions in Scenario 5 were common how acceptable would it be for managers to take EACH of the following actions? Very Unacceptable Unacceptable Neither Acceptable Very Acceptable
Improve education / awareness of people in this area 1 2 3 4 5 Restrict the number of people allowed in this area 1 2 3 4 5 Improve maintenance or upkeep of this area 1 2 3 4 5 Provide more facilities or services in this area 1 2 3 4 5
Scenario 6: Imagine all four of the following conditions were common at Sans Souci Beach: • LOW number of people (use level) • SUBSTANTIAL recreation damage to coral reef (over 75% broken, trampled) • SOME litter • GOOD condition of facilities (e.g., bathrooms, showers, trash cans, signs)
21. If all conditions in Scenario 6 were common how acceptable would it be for managers to take EACH of the following actions? Very Unacceptable Unacceptable Neither Acceptable Very Acceptable
Improve education / awareness of people in this area 1 2 3 4 5 Restrict the number of people allowed in this area 1 2 3 4 5 Improve maintenance or upkeep of this area 1 2 3 4 5 Provide more facilities or services in this area 1 2 3 4 5
Scenario 7: Imagine all four of the following conditions were common at Sans Souci Beach: • HIGH number of people (use level) • SUBSTANTIAL recreation damage to coral reef (over 75% broken, trampled) • NO litter • GOOD condition of facilities (e.g., bathrooms, showers, trash cans, signs)
22. If all conditions in Scenario 7 were common how acceptable would it be for managers to take EACH of the following actions? Very Unacceptable Unacceptable Neither Acceptable Very Acceptable
Improve education / awareness of people in this area 1 2 3 4 5 Restrict the number of people allowed in this area 1 2 3 4 5 Improve maintenance or upkeep of this area 1 2 3 4 5 Provide more facilities or services in this area 1 2 3 4 5
Scenario 8: Imagine all four of the following conditions were common at Sans Souci Beach: • LOW number of people (use level) • MINIMAL recreation damage to coral reef (less than 25% broken, trampled) • SOME litter • POOR condition of facilities (e.g., bathrooms, showers, trash cans, signs)
23. If all conditions in Scenario 8 were common how acceptable would it be for managers to take EACH of the following actions? Very Unacceptable Unacceptable Neither Acceptable Very Acceptable
Improve education / awareness of people in this area 1 2 3 4 5 Restrict the number of people allowed in this area 1 2 3 4 5 Improve maintenance or upkeep of this area 1 2 3 4 5 Provide more facilities or services in this area 1 2 3 4 5
24. Are you: (check ONE) Male Female
25. What is your age? (write response) ________ years old
26. Where do you live? (write responses) State / Province ______________________ Country ______________________
83
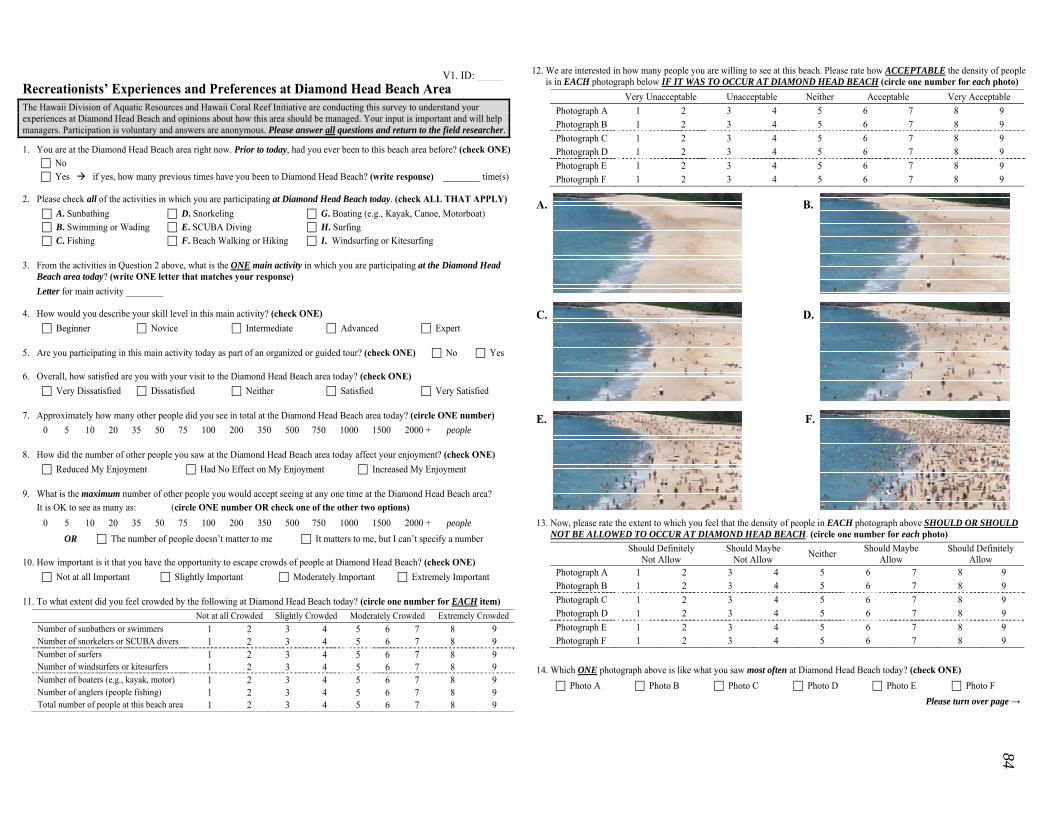
Recreationists’ Experiences and Preferences at Diamond Head Beach Area The Hawaii Division of Aquatic Resources and Hawaii Coral Reef Initiative are conducting this survey to understand your experiences at Diamond Head Beach and opinions about how this area should be managed. Your input is important and will help managers. Participation is voluntary and answers are anonymous. Please answer all questions and return to the field researcher.
1. You are at the Diamond Head Beach area right now. Prior to today, had you ever been to this beach area before? (check ONE) No Yes if yes, how many previous times have you been to Diamond Head Beach? (write response) ________ time(s)
2. Please check all of the activities in which you are participating at Diamond Head Beach today. (check ALL THAT APPLY) A. Sunbathing D. Snorkeling G. Boating (e.g., Kayak, Canoe, Motorboat) B. Swimming or Wading E. SCUBA Diving H. Surfing C. Fishing F. Beach Walking or Hiking I. Windsurfing or Kitesurfing
3. From the activities in Question 2 above, what is the ONE main activity in which you are participating at the Diamond Head Beach area today? (write ONE letter that matches your response) Letter for main activity ________
4. How would you describe your skill level in this main activity? (check ONE) Beginner Novice Intermediate Advanced Expert
5. Are you participating in this main activity today as part of an organized or guided tour? (check ONE) No Yes
6. Overall, how satisfied are you with your visit to the Diamond Head Beach area today? (check ONE) Very Dissatisfied Dissatisfied Neither Satisfied Very Satisfied
7. Approximately how many other people did you see in total at the Diamond Head Beach area today? (circle ONE number) 0 5 10 20 35 50 75 100 200 350 500 750 1000 1500 2000 + people
8. How did the number of other people you saw at the Diamond Head Beach area today affect your enjoyment? (check ONE) Reduced My Enjoyment Had No Effect on My Enjoyment Increased My Enjoyment
9. What is the maximum number of other people you would accept seeing at any one time at the Diamond Head Beach area? It is OK to see as many as: (circle ONE number OR check one of the other two options)
0 5 10 20 35 50 75 100 200 350 500 750 1000 1500 2000 + people OR The number of people doesn’t matter to me It matters to me, but I can’t specify a number
10. How important is it that you have the opportunity to escape crowds of people at Diamond Head Beach? (check ONE) Not at all Important Slightly Important Moderately Important Extremely Important
11. To what extent did you feel crowded by the following at Diamond Head Beach today? (circle one number for EACH item) Not at all Crowded Slightly Crowded Moderately Crowded Extremely Crowded Number of sunbathers or swimmers 1 2 3 4 5 6 7 8 9 Number of snorkelers or SCUBA divers 1 2 3 4 5 6 7 8 9 Number of surfers 1 2 3 4 5 6 7 8 9 Number of windsurfers or kitesurfers 1 2 3 4 5 6 7 8 9 Number of boaters (e.g., kayak, motor) 1 2 3 4 5 6 7 8 9 Number of anglers (people fishing) 1 2 3 4 5 6 7 8 9 Total number of people at this beach area 1 2 3 4 5 6 7 8 9
V1. ID: _____
Please turn over page →
12. We are interested in how many people you are willing to see at this beach. Please rate how ACCEPTABLE the density of people is in EACH photograph below IF IT WAS TO OCCUR AT DIAMOND HEAD BEACH (circle one number for each photo)
Very Unacceptable Unacceptable Neither Acceptable Very Acceptable Photograph A 1 2 3 4 5 6 7 8 9 Photograph B 1 2 3 4 5 6 7 8 9 Photograph C 1 2 3 4 5 6 7 8 9 Photograph D 1 2 3 4 5 6 7 8 9 Photograph E 1 2 3 4 5 6 7 8 9 Photograph F 1 2 3 4 5 6 7 8 9
A. B. C. D.
E. F.
13. Now, please rate the extent to which you feel that the density of people in EACH photograph above SHOULD OR SHOULD NOT BE ALLOWED TO OCCUR AT DIAMOND HEAD BEACH. (circle one number for each photo)
Should Definitely Not Allow
Should Maybe Not Allow Neither Should Maybe
Allow Should Definitely
Allow Photograph A 1 2 3 4 5 6 7 8 9 Photograph B 1 2 3 4 5 6 7 8 9 Photograph C 1 2 3 4 5 6 7 8 9 Photograph D 1 2 3 4 5 6 7 8 9 Photograph E 1 2 3 4 5 6 7 8 9 Photograph F 1 2 3 4 5 6 7 8 9
14. Which ONE photograph above is like what you saw most often at Diamond Head Beach today? (check ONE) Photo A Photo B Photo C Photo D Photo E Photo F
84
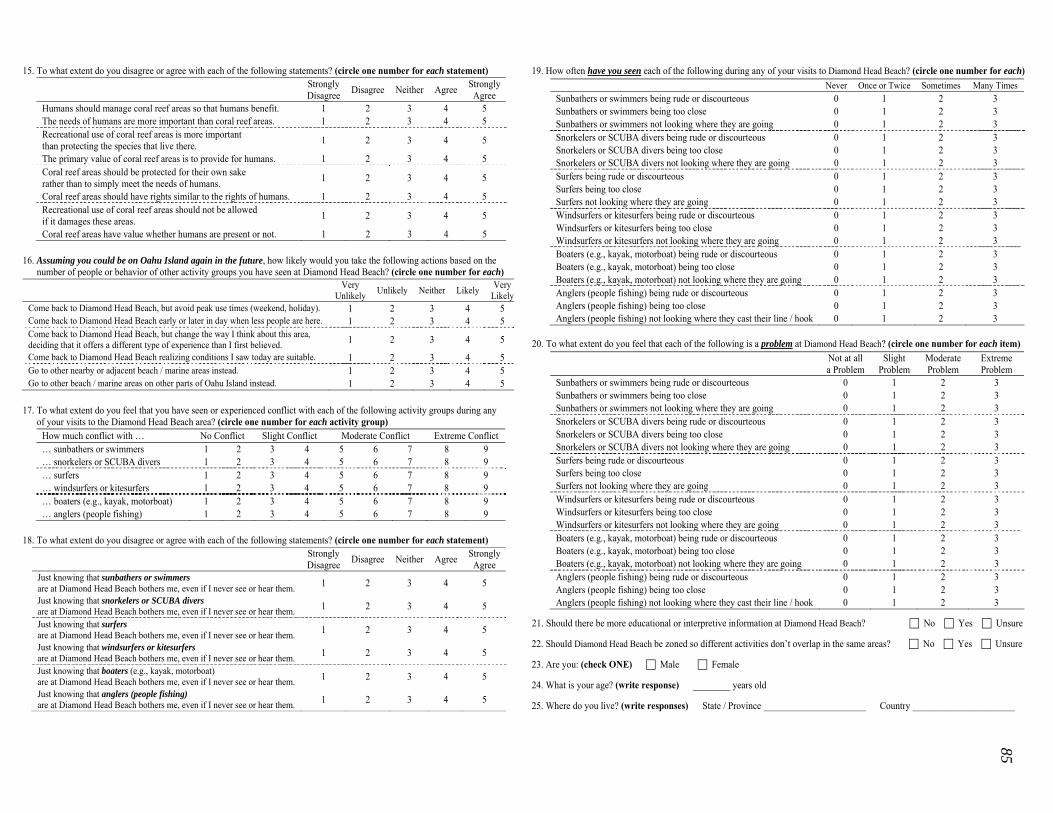
15. To what extent do you disagree or agree with each of the following statements? (circle one number for each statement) Strongly
Disagree Disagree Neither Agree StronglyAgree
Humans should manage coral reef areas so that humans benefit. 1 2 3 4 5 The needs of humans are more important than coral reef areas. 1 2 3 4 5 Recreational use of coral reef areas is more important than protecting the species that live there. 1 2 3 4 5
The primary value of coral reef areas is to provide for humans. 1 2 3 4 5 Coral reef areas should be protected for their own sake rather than to simply meet the needs of humans. 1 2 3 4 5
Coral reef areas should have rights similar to the rights of humans. 1 2 3 4 5 Recreational use of coral reef areas should not be allowed if it damages these areas. 1 2 3 4 5
Coral reef areas have value whether humans are present or not. 1 2 3 4 5
16. Assuming you could be on Oahu Island again in the future, how likely would you take the following actions based on the number of people or behavior of other activity groups you have seen at Diamond Head Beach? (circle one number for each)
Very Unlikely Unlikely Neither Likely Very
LikelyCome back to Diamond Head Beach, but avoid peak use times (weekend, holiday). 1 2 3 4 5 Come back to Diamond Head Beach early or later in day when less people are here. 1 2 3 4 5 Come back to Diamond Head Beach, but change the way I think about this area, deciding that it offers a different type of experience than I first believed. 1 2 3 4 5
Come back to Diamond Head Beach realizing conditions I saw today are suitable. 1 2 3 4 5 Go to other nearby or adjacent beach / marine areas instead. 1 2 3 4 5 Go to other beach / marine areas on other parts of Oahu Island instead. 1 2 3 4 5
17. To what extent do you feel that you have seen or experienced conflict with each of the following activity groups during any of your visits to the Diamond Head Beach area? (circle one number for each activity group)
How much conflict with … No Conflict Slight Conflict Moderate Conflict Extreme Conflict … sunbathers or swimmers 1 2 3 4 5 6 7 8 9 … snorkelers or SCUBA divers 1 2 3 4 5 6 7 8 9 … surfers 1 2 3 4 5 6 7 8 9 … windsurfers or kitesurfers 1 2 3 4 5 6 7 8 9 … boaters (e.g., kayak, motorboat) 1 2 3 4 5 6 7 8 9 … anglers (people fishing) 1 2 3 4 5 6 7 8 9
18. To what extent do you disagree or agree with each of the following statements? (circle one number for each statement) Strongly
Disagree Disagree Neither Agree StronglyAgree
Just knowing that sunbathers or swimmers are at Diamond Head Beach bothers me, even if I never see or hear them. 1 2 3 4 5
Just knowing that snorkelers or SCUBA divers are at Diamond Head Beach bothers me, even if I never see or hear them. 1 2 3 4 5
Just knowing that surfers are at Diamond Head Beach bothers me, even if I never see or hear them. 1 2 3 4 5
Just knowing that windsurfers or kitesurfers are at Diamond Head Beach bothers me, even if I never see or hear them. 1 2 3 4 5
Just knowing that boaters (e.g., kayak, motorboat) are at Diamond Head Beach bothers me, even if I never see or hear them. 1 2 3 4 5
Just knowing that anglers (people fishing) are at Diamond Head Beach bothers me, even if I never see or hear them. 1 2 3 4 5
19. How often have you seen each of the following during any of your visits to Diamond Head Beach? (circle one number for each) Never Once or Twice Sometimes Many Times Sunbathers or swimmers being rude or discourteous 0 1 2 3 Sunbathers or swimmers being too close 0 1 2 3 Sunbathers or swimmers not looking where they are going 0 1 2 3 Snorkelers or SCUBA divers being rude or discourteous 0 1 2 3 Snorkelers or SCUBA divers being too close 0 1 2 3 Snorkelers or SCUBA divers not looking where they are going 0 1 2 3 Surfers being rude or discourteous 0 1 2 3 Surfers being too close 0 1 2 3 Surfers not looking where they are going 0 1 2 3 Windsurfers or kitesurfers being rude or discourteous 0 1 2 3 Windsurfers or kitesurfers being too close 0 1 2 3 Windsurfers or kitesurfers not looking where they are going 0 1 2 3 Boaters (e.g., kayak, motorboat) being rude or discourteous 0 1 2 3 Boaters (e.g., kayak, motorboat) being too close 0 1 2 3 Boaters (e.g., kayak, motorboat) not looking where they are going 0 1 2 3 Anglers (people fishing) being rude or discourteous 0 1 2 3 Anglers (people fishing) being too close 0 1 2 3 Anglers (people fishing) not looking where they cast their line / hook 0 1 2 3
20. To what extent do you feel that each of the following is a problem at Diamond Head Beach? (circle one number for each item) Not at all
a Problem Slight
Problem Moderate Problem
Extreme Problem
Sunbathers or swimmers being rude or discourteous 0 1 2 3 Sunbathers or swimmers being too close 0 1 2 3 Sunbathers or swimmers not looking where they are going 0 1 2 3 Snorkelers or SCUBA divers being rude or discourteous 0 1 2 3 Snorkelers or SCUBA divers being too close 0 1 2 3 Snorkelers or SCUBA divers not looking where they are going 0 1 2 3 Surfers being rude or discourteous 0 1 2 3 Surfers being too close 0 1 2 3 Surfers not looking where they are going 0 1 2 3 Windsurfers or kitesurfers being rude or discourteous 0 1 2 3 Windsurfers or kitesurfers being too close 0 1 2 3 Windsurfers or kitesurfers not looking where they are going 0 1 2 3 Boaters (e.g., kayak, motorboat) being rude or discourteous 0 1 2 3 Boaters (e.g., kayak, motorboat) being too close 0 1 2 3 Boaters (e.g., kayak, motorboat) not looking where they are going 0 1 2 3 Anglers (people fishing) being rude or discourteous 0 1 2 3 Anglers (people fishing) being too close 0 1 2 3 Anglers (people fishing) not looking where they cast their line / hook 0 1 2 3
21. Should there be more educational or interpretive information at Diamond Head Beach? No Yes Unsure
22. Should Diamond Head Beach be zoned so different activities don’t overlap in the same areas? No Yes Unsure
23. Are you: (check ONE) Male Female
24. What is your age? (write response) ________ years old
25. Where do you live? (write responses) State / Province ______________________ Country ______________________
85
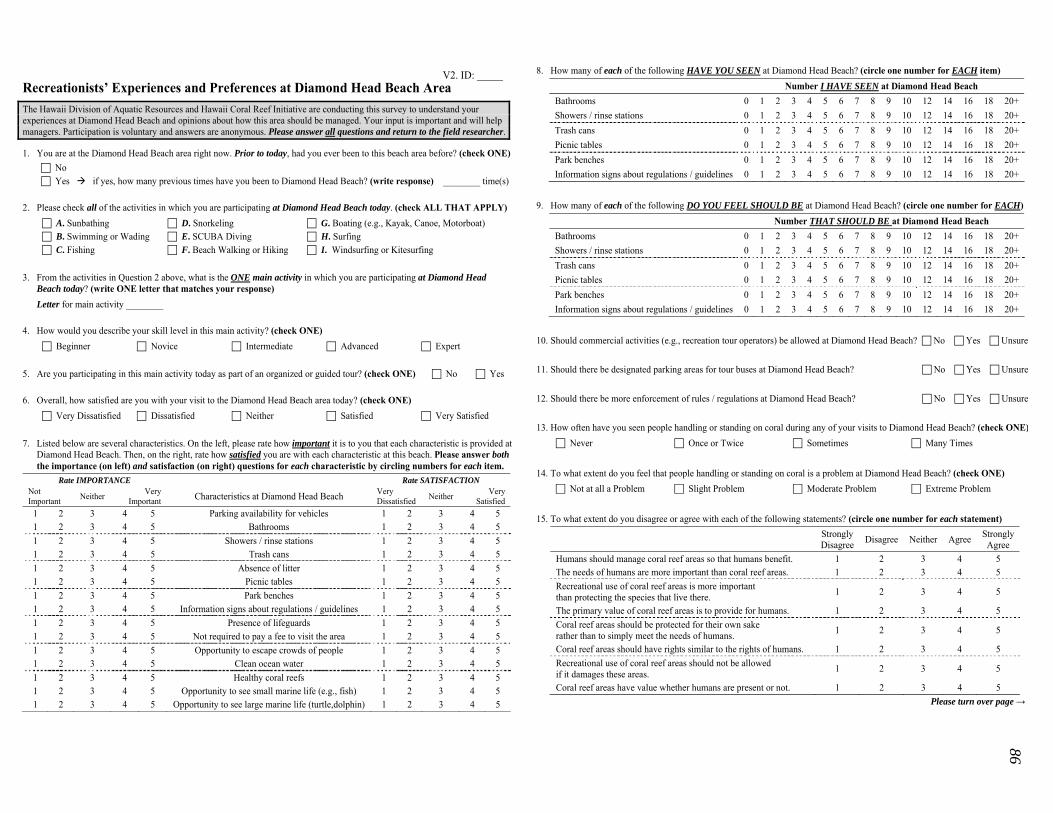
Recreationists’ Experiences and Preferences at Diamond Head Beach Area The Hawaii Division of Aquatic Resources and Hawaii Coral Reef Initiative are conducting this survey to understand your experiences at Diamond Head Beach and opinions about how this area should be managed. Your input is important and will help managers. Participation is voluntary and answers are anonymous. Please answer all questions and return to the field researcher.
1. You are at the Diamond Head Beach area right now. Prior to today, had you ever been to this beach area before? (check ONE) No Yes if yes, how many previous times have you been to Diamond Head Beach? (write response) ________ time(s)
2. Please check all of the activities in which you are participating at Diamond Head Beach today. (check ALL THAT APPLY) A. Sunbathing D. Snorkeling G. Boating (e.g., Kayak, Canoe, Motorboat) B. Swimming or Wading E. SCUBA Diving H. Surfing C. Fishing F. Beach Walking or Hiking I. Windsurfing or Kitesurfing
3. From the activities in Question 2 above, what is the ONE main activity in which you are participating at Diamond Head Beach today? (write ONE letter that matches your response) Letter for main activity ________
4. How would you describe your skill level in this main activity? (check ONE) Beginner Novice Intermediate Advanced Expert
5. Are you participating in this main activity today as part of an organized or guided tour? (check ONE) No Yes
6. Overall, how satisfied are you with your visit to the Diamond Head Beach area today? (check ONE) Very Dissatisfied Dissatisfied Neither Satisfied Very Satisfied
7. Listed below are several characteristics. On the left, please rate how important it is to you that each characteristic is provided at Diamond Head Beach. Then, on the right, rate how satisfied you are with each characteristic at this beach. Please answer both the importance (on left) and satisfaction (on right) questions for each characteristic by circling numbers for each item.
Rate IMPORTANCE Rate SATISFACTION Not Important Neither Very
Important Characteristics at Diamond Head Beach Very Dissatisfied Neither Very
Satisfied 1 2 3 4 5 Parking availability for vehicles 1 2 3 4 5 1 2 3 4 5 Bathrooms 1 2 3 4 5 1 2 3 4 5 Showers / rinse stations 1 2 3 4 5 1 2 3 4 5 Trash cans 1 2 3 4 5 1 2 3 4 5 Absence of litter 1 2 3 4 5 1 2 3 4 5 Picnic tables 1 2 3 4 5 1 2 3 4 5 Park benches 1 2 3 4 5 1 2 3 4 5 Information signs about regulations / guidelines 1 2 3 4 5 1 2 3 4 5 Presence of lifeguards 1 2 3 4 5 1 2 3 4 5 Not required to pay a fee to visit the area 1 2 3 4 5 1 2 3 4 5 Opportunity to escape crowds of people 1 2 3 4 5 1 2 3 4 5 Clean ocean water 1 2 3 4 5 1 2 3 4 5 Healthy coral reefs 1 2 3 4 5 1 2 3 4 5 Opportunity to see small marine life (e.g., fish) 1 2 3 4 5 1 2 3 4 5 Opportunity to see large marine life (turtle,dolphin) 1 2 3 4 5
V2. ID: _____
Please turn over page →
8. How many of each of the following HAVE YOU SEEN at Diamond Head Beach? (circle one number for EACH item) Number I HAVE SEEN at Diamond Head Beach Bathrooms 0 1 2 3 4 5 6 7 8 9 10 12 14 16 18 20+ Showers / rinse stations 0 1 2 3 4 5 6 7 8 9 10 12 14 16 18 20+ Trash cans 0 1 2 3 4 5 6 7 8 9 10 12 14 16 18 20+ Picnic tables 0 1 2 3 4 5 6 7 8 9 10 12 14 16 18 20+ Park benches 0 1 2 3 4 5 6 7 8 9 10 12 14 16 18 20+ Information signs about regulations / guidelines 0 1 2 3 4 5 6 7 8 9 10 12 14 16 18 20+
9. How many of each of the following DO YOU FEEL SHOULD BE at Diamond Head Beach? (circle one number for EACH) Number THAT SHOULD BE at Diamond Head Beach Bathrooms 0 1 2 3 4 5 6 7 8 9 10 12 14 16 18 20+ Showers / rinse stations 0 1 2 3 4 5 6 7 8 9 10 12 14 16 18 20+ Trash cans 0 1 2 3 4 5 6 7 8 9 10 12 14 16 18 20+ Picnic tables 0 1 2 3 4 5 6 7 8 9 10 12 14 16 18 20+ Park benches 0 1 2 3 4 5 6 7 8 9 10 12 14 16 18 20+ Information signs about regulations / guidelines 0 1 2 3 4 5 6 7 8 9 10 12 14 16 18 20+
10. Should commercial activities (e.g., recreation tour operators) be allowed at Diamond Head Beach? No Yes Unsure
11. Should there be designated parking areas for tour buses at Diamond Head Beach? No Yes Unsure
12. Should there be more enforcement of rules / regulations at Diamond Head Beach? No Yes Unsure
13. How often have you seen people handling or standing on coral during any of your visits to Diamond Head Beach? (check ONE) Never Once or Twice Sometimes Many Times
14. To what extent do you feel that people handling or standing on coral is a problem at Diamond Head Beach? (check ONE) Not at all a Problem Slight Problem Moderate Problem Extreme Problem
15. To what extent do you disagree or agree with each of the following statements? (circle one number for each statement) Strongly
Disagree Disagree Neither Agree Strongly Agree
Humans should manage coral reef areas so that humans benefit. 1 2 3 4 5 The needs of humans are more important than coral reef areas. 1 2 3 4 5 Recreational use of coral reef areas is more important than protecting the species that live there. 1 2 3 4 5
The primary value of coral reef areas is to provide for humans. 1 2 3 4 5 Coral reef areas should be protected for their own sake rather than to simply meet the needs of humans. 1 2 3 4 5
Coral reef areas should have rights similar to the rights of humans. 1 2 3 4 5 Recreational use of coral reef areas should not be allowed if it damages these areas. 1 2 3 4 5
Coral reef areas have value whether humans are present or not. 1 2 3 4 5
86
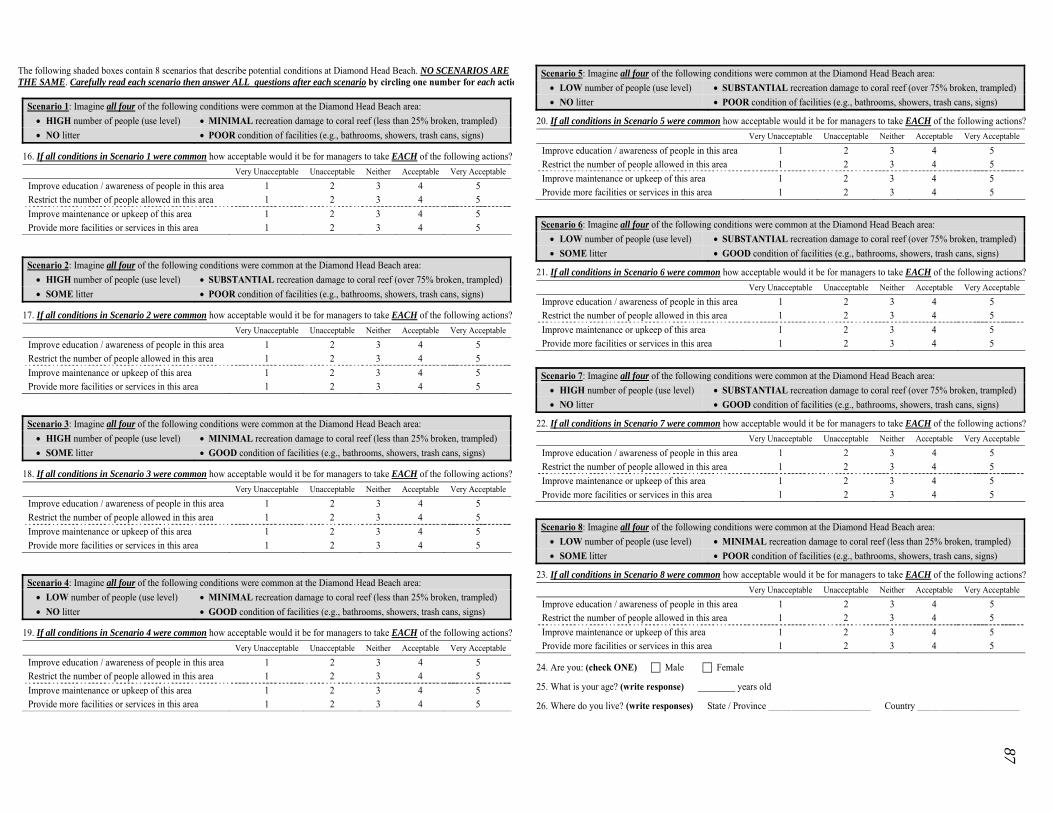
The following shaded boxes contain 8 scenarios that describe potential conditions at Diamond Head Beach. NO SCENARIOS ARETHE SAME. Carefully read each scenario then answer ALL questions after each scenario by circling one number for each actio
Scenario 1: Imagine all four of the following conditions were common at the Diamond Head Beach area: • HIGH number of people (use level) • MINIMAL recreation damage to coral reef (less than 25% broken, trampled) • NO litter • POOR condition of facilities (e.g., bathrooms, showers, trash cans, signs)
16. If all conditions in Scenario 1 were common how acceptable would it be for managers to take EACH of the following actions? Very Unacceptable Unacceptable Neither Acceptable Very Acceptable
Improve education / awareness of people in this area 1 2 3 4 5 Restrict the number of people allowed in this area 1 2 3 4 5 Improve maintenance or upkeep of this area 1 2 3 4 5 Provide more facilities or services in this area 1 2 3 4 5
Scenario 2: Imagine all four of the following conditions were common at the Diamond Head Beach area: • HIGH number of people (use level) • SUBSTANTIAL recreation damage to coral reef (over 75% broken, trampled) • SOME litter • POOR condition of facilities (e.g., bathrooms, showers, trash cans, signs)
17. If all conditions in Scenario 2 were common how acceptable would it be for managers to take EACH of the following actions? Very Unacceptable Unacceptable Neither Acceptable Very Acceptable
Improve education / awareness of people in this area 1 2 3 4 5 Restrict the number of people allowed in this area 1 2 3 4 5 Improve maintenance or upkeep of this area 1 2 3 4 5 Provide more facilities or services in this area 1 2 3 4 5
Scenario 3: Imagine all four of the following conditions were common at the Diamond Head Beach area: • HIGH number of people (use level) • MINIMAL recreation damage to coral reef (less than 25% broken, trampled) • SOME litter • GOOD condition of facilities (e.g., bathrooms, showers, trash cans, signs)
18. If all conditions in Scenario 3 were common how acceptable would it be for managers to take EACH of the following actions? Very Unacceptable Unacceptable Neither Acceptable Very Acceptable
Improve education / awareness of people in this area 1 2 3 4 5 Restrict the number of people allowed in this area 1 2 3 4 5 Improve maintenance or upkeep of this area 1 2 3 4 5 Provide more facilities or services in this area 1 2 3 4 5
Scenario 4: Imagine all four of the following conditions were common at the Diamond Head Beach area: • LOW number of people (use level) • MINIMAL recreation damage to coral reef (less than 25% broken, trampled) • NO litter • GOOD condition of facilities (e.g., bathrooms, showers, trash cans, signs)
19. If all conditions in Scenario 4 were common how acceptable would it be for managers to take EACH of the following actions? Very Unacceptable Unacceptable Neither Acceptable Very Acceptable
Improve education / awareness of people in this area 1 2 3 4 5 Restrict the number of people allowed in this area 1 2 3 4 5 Improve maintenance or upkeep of this area 1 2 3 4 5 Provide more facilities or services in this area 1 2 3 4 5
Scenario 5: Imagine all four of the following conditions were common at the Diamond Head Beach area: • LOW number of people (use level) • SUBSTANTIAL recreation damage to coral reef (over 75% broken, trampled) • NO litter • POOR condition of facilities (e.g., bathrooms, showers, trash cans, signs)
20. If all conditions in Scenario 5 were common how acceptable would it be for managers to take EACH of the following actions? Very Unacceptable Unacceptable Neither Acceptable Very Acceptable
Improve education / awareness of people in this area 1 2 3 4 5 Restrict the number of people allowed in this area 1 2 3 4 5 Improve maintenance or upkeep of this area 1 2 3 4 5 Provide more facilities or services in this area 1 2 3 4 5
Scenario 6: Imagine all four of the following conditions were common at the Diamond Head Beach area: • LOW number of people (use level) • SUBSTANTIAL recreation damage to coral reef (over 75% broken, trampled) • SOME litter • GOOD condition of facilities (e.g., bathrooms, showers, trash cans, signs)
21. If all conditions in Scenario 6 were common how acceptable would it be for managers to take EACH of the following actions? Very Unacceptable Unacceptable Neither Acceptable Very Acceptable
Improve education / awareness of people in this area 1 2 3 4 5 Restrict the number of people allowed in this area 1 2 3 4 5 Improve maintenance or upkeep of this area 1 2 3 4 5 Provide more facilities or services in this area 1 2 3 4 5
Scenario 7: Imagine all four of the following conditions were common at the Diamond Head Beach area: • HIGH number of people (use level) • SUBSTANTIAL recreation damage to coral reef (over 75% broken, trampled) • NO litter • GOOD condition of facilities (e.g., bathrooms, showers, trash cans, signs)
22. If all conditions in Scenario 7 were common how acceptable would it be for managers to take EACH of the following actions? Very Unacceptable Unacceptable Neither Acceptable Very Acceptable
Improve education / awareness of people in this area 1 2 3 4 5 Restrict the number of people allowed in this area 1 2 3 4 5 Improve maintenance or upkeep of this area 1 2 3 4 5 Provide more facilities or services in this area 1 2 3 4 5
Scenario 8: Imagine all four of the following conditions were common at the Diamond Head Beach area: • LOW number of people (use level) • MINIMAL recreation damage to coral reef (less than 25% broken, trampled) • SOME litter • POOR condition of facilities (e.g., bathrooms, showers, trash cans, signs)
23. If all conditions in Scenario 8 were common how acceptable would it be for managers to take EACH of the following actions? Very Unacceptable Unacceptable Neither Acceptable Very Acceptable
Improve education / awareness of people in this area 1 2 3 4 5 Restrict the number of people allowed in this area 1 2 3 4 5 Improve maintenance or upkeep of this area 1 2 3 4 5 Provide more facilities or services in this area 1 2 3 4 5
24. Are you: (check ONE) Male Female
25. What is your age? (write response) ________ years old
26. Where do you live? (write responses) State / Province ______________________ Country ______________________
87

APPENDIX B: UNCOLLAPSED FREQUENCIES
Recreationists’ Experiences and Preferences at Sans Souci / Kaimana Beach The Hawaii Division of Aquatic Resources and Hawaii Coral Reef Initiative are conducting this survey to understand your experiences at Sans Souci Beach and opinions about how this area should be managed. Your input is important and will help managers. Participation is voluntary and answers are anonymous. Please answer all questions and return to the field researcher.
1. You are at Sans Souci / Kaimana Beach right now. Prior to today, had you ever been to Sans Souci Beach before? (check ONE)17% No
83% Yes if yes, how many previous times have you been to Sans Souci Beach? (write response) ______ time(s)
2. Please check all of the activities in which you are participating at Sans Souci Beach today. (check ALL THAT APPLY) 81% A. Sunbathing 23% D. Snorkeling 4% G. Boating (e.g., Kayak, Canoe, Motorboat) 92% B. Swimming or Wading 1% E. SCUBA Diving 14% H. Surfing 4% C. Fishing 32% F. Beach Walking or Hiking 0% I. Windsurfing or Kitesurfing
3. From the activities in Question 2 above, what is the ONE main activity in which you are participating at Sans Souci Beach today? (write ONE letter that matches your response)
42% A. Sunbathing 3% D. Snorkeling 1% G. Boating (e.g., Kayak, Canoe, Motorboat) 45% B. Swimming or Wading 0% E. SCUBA Diving 2% H. Surfing 0% C. Fishing 7% F. Beach Walking or Hiking 0% I. Windsurfing or Kitesurfing
4. How would you describe your skill level in this main activity? (check ONE) 7% Beginner 6% Novice 32% Intermediate 24% Advanced 31% Expert
5. Are you participating in this main activity today as part of an organized or guided tour? (check ONE) 94% No 6% Yes
6. Overall, how satisfied are you with your visit to Sans Souci Beach today? (check ONE) 3% Very Dissatisfied 1% Dissatisfied 3% Neither 45% Satisfied 49% Very Satisfied
7. Approximately how many other people did you see in total at Sans Souci Beach today? average = 111.51 people
8. How did the number of other people you saw at Sans Souci Beach today affect your enjoyment? (check ONE) 10% Reduced My Enjoyment 76% Had No Effect on My Enjoyment 14% Increased My Enjoyment
9. What is the maximum number of other people you would accept seeing at any one time at Sans Souci Beach? It is OK to see as many as average = 217.01 people, 12% The number of people doesn’t matter to me, 19% It matters to me, but I can’t specify a number
10. How important is it that you have the opportunity to escape crowds of people at Sans Souci Beach? (check ONE) 11% Not at all Important 23% Slightly Important 47% Moderately Important 20% Extremely Important
11. To what extent did you feel crowded by each of the following at Sans Souci Beach today? (circle one number for EACH item) Not at all Crowded Slightly Crowded Moderately Crowded Extremely Crowded Number of sunbathers or swimmers 40% 21% 14% 8% 5% 4% 4% 3% 0% Number of snorkelers or SCUBA divers 68% 24% 3% 2% 2% 0% 0% 0% 0% Number of surfers 76% 15% 3% 2% 1% 1% 1% 1% 1% Number of windsurfers or kitesurfers 85% 10% 2% 1% 1% 0% 1% 0% 1% Number of boaters (e.g., kayak, motor) 73% 17% 4% 2% 2% 1% 0% 0% 1% Number of anglers (people fishing) 85% 8% 2% 1% 2% 1% 0% 0% 1% Total number of people at Sans Souci 35% 18% 17% 11% 5% 6% 6% 2% 1%
V1. ID: _____
12. We are interested in how many people you are willing to see at Sans Souci Beach. Please rate how ACCEPTABLE the density of people is in EACH photograph below IF IT WAS TO OCCUR AT SANS SOUCI (circle one number for each photo)
Very Unacceptable Unacceptable Neither Acceptable Very Acceptable Photograph A 9% 2% 3% 2% 6% 6% 4% 6% 62% Photograph B 3% 0% 1% 2% 3% 12% 6% 17% 55% Photograph C 2% 1% 0% 1% 4% 18% 20% 18% 36% Photograph D 4% 0% 2% 6% 8% 29% 18% 12% 21% Photograph E 16% 12% 15% 16% 14% 16% 4% 2% 6% Photograph F 59% 14% 6% 9% 4% 4% 1% 1% 3%
A. B. C. D.
E. F.
13. Now, please rate the extent to which you feel that the density of people in EACH photograph above SHOULD OR SHOULD NOT BE ALLOWED TO OCCUR AT SANS SOUCI BEACH. (circle one number for each photo)
Should Definitely Not Allow
Should Maybe Not Allow Neither Should Maybe
Allow Should Definitely
Allow Photograph A 8% 2% 1% 1% 10% 5% 1% 9% 64% Photograph B 2% 1% 1% 1% 7% 7% 3% 14% 65% Photograph C 2% 0% 0% 0% 7% 8% 13% 19% 51% Photograph D 4% 1% 2% 2% 6% 17% 11% 17% 40% Photograph E 18% 11% 11% 12% 11% 12% 7% 6% 12% Photograph F 54% 16% 6% 7% 7% 3% 2% 2% 7%
14. Which ONE photograph above is like what you saw most often at Sans Souci Beach today? (check ONE) 2% Photo A 13% Photo B 28% Photo C 43% Photo D 14% Photo E 1% Photo F
88
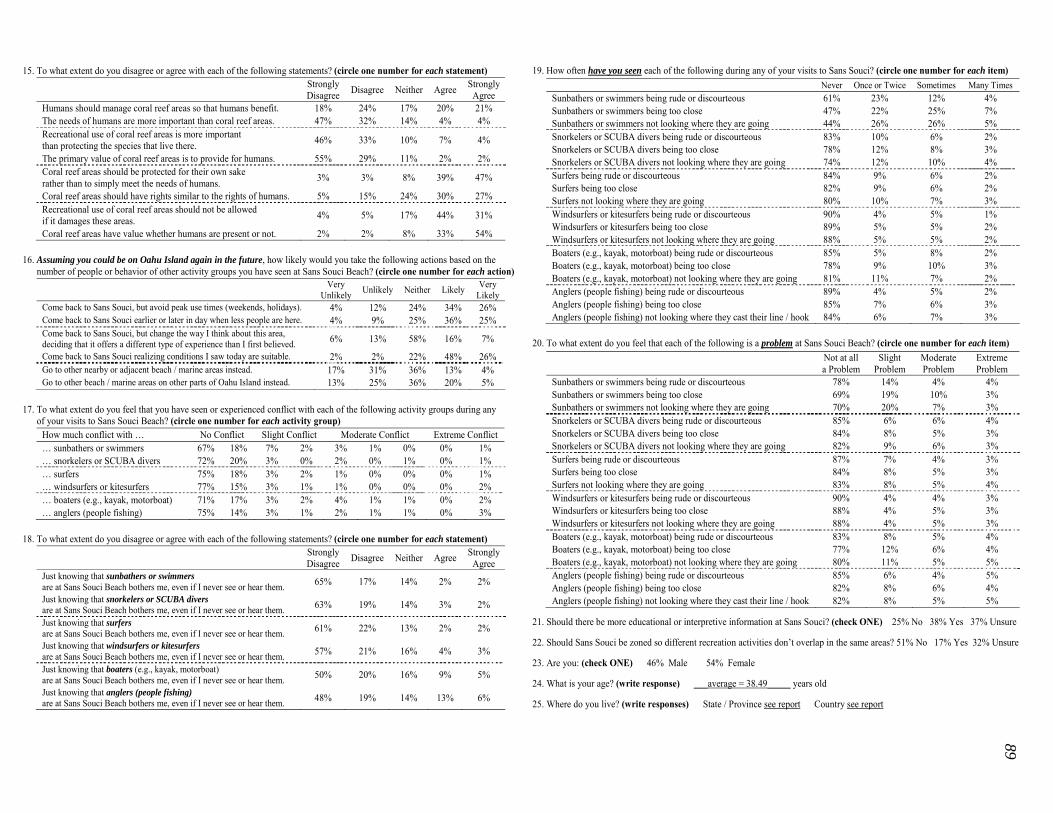
15. To what extent do you disagree or agree with each of the following statements? (circle one number for each statement) Strongly
Disagree Disagree Neither Agree StronglyAgree
Humans should manage coral reef areas so that humans benefit. 18% 24% 17% 20% 21% The needs of humans are more important than coral reef areas. 47% 32% 14% 4% 4% Recreational use of coral reef areas is more important than protecting the species that live there. 46% 33% 10% 7% 4%
The primary value of coral reef areas is to provide for humans. 55% 29% 11% 2% 2% Coral reef areas should be protected for their own sake rather than to simply meet the needs of humans. 3% 3% 8% 39% 47%
Coral reef areas should have rights similar to the rights of humans. 5% 15% 24% 30% 27% Recreational use of coral reef areas should not be allowed if it damages these areas. 4% 5% 17% 44% 31%
Coral reef areas have value whether humans are present or not. 2% 2% 8% 33% 54%
16. Assuming you could be on Oahu Island again in the future, how likely would you take the following actions based on the number of people or behavior of other activity groups you have seen at Sans Souci Beach? (circle one number for each action)
Very Unlikely Unlikely Neither Likely Very
Likely Come back to Sans Souci, but avoid peak use times (weekends, holidays). 4% 12% 24% 34% 26% Come back to Sans Souci earlier or later in day when less people are here. 4% 9% 25% 36% 25% Come back to Sans Souci, but change the way I think about this area, deciding that it offers a different type of experience than I first believed. 6% 13% 58% 16% 7%
Come back to Sans Souci realizing conditions I saw today are suitable. 2% 2% 22% 48% 26% Go to other nearby or adjacent beach / marine areas instead. 17% 31% 36% 13% 4% Go to other beach / marine areas on other parts of Oahu Island instead. 13% 25% 36% 20% 5%
17. To what extent do you feel that you have seen or experienced conflict with each of the following activity groups during any of your visits to Sans Souci Beach? (circle one number for each activity group)
How much conflict with … No Conflict Slight Conflict Moderate Conflict Extreme Conflict … sunbathers or swimmers 67% 18% 7% 2% 3% 1% 0% 0% 1% … snorkelers or SCUBA divers 72% 20% 3% 0% 2% 0% 1% 0% 1% … surfers 75% 18% 3% 2% 1% 0% 0% 0% 1% … windsurfers or kitesurfers 77% 15% 3% 1% 1% 0% 0% 0% 2% … boaters (e.g., kayak, motorboat) 71% 17% 3% 2% 4% 1% 1% 0% 2% … anglers (people fishing) 75% 14% 3% 1% 2% 1% 1% 0% 3%
18. To what extent do you disagree or agree with each of the following statements? (circle one number for each statement) Strongly
Disagree Disagree Neither Agree StronglyAgree
Just knowing that sunbathers or swimmers are at Sans Souci Beach bothers me, even if I never see or hear them. 65% 17% 14% 2% 2%
Just knowing that snorkelers or SCUBA divers are at Sans Souci Beach bothers me, even if I never see or hear them. 63% 19% 14% 3% 2%
Just knowing that surfers are at Sans Souci Beach bothers me, even if I never see or hear them. 61% 22% 13% 2% 2%
Just knowing that windsurfers or kitesurfers are at Sans Souci Beach bothers me, even if I never see or hear them. 57% 21% 16% 4% 3%
Just knowing that boaters (e.g., kayak, motorboat) are at Sans Souci Beach bothers me, even if I never see or hear them. 50% 20% 16% 9% 5%
Just knowing that anglers (people fishing) are at Sans Souci Beach bothers me, even if I never see or hear them. 48% 19% 14% 13% 6%
19. How often have you seen each of the following during any of your visits to Sans Souci? (circle one number for each item) Never Once or Twice Sometimes Many Times Sunbathers or swimmers being rude or discourteous 61% 23% 12% 4% Sunbathers or swimmers being too close 47% 22% 25% 7% Sunbathers or swimmers not looking where they are going 44% 26% 26% 5% Snorkelers or SCUBA divers being rude or discourteous 83% 10% 6% 2% Snorkelers or SCUBA divers being too close 78% 12% 8% 3% Snorkelers or SCUBA divers not looking where they are going 74% 12% 10% 4% Surfers being rude or discourteous 84% 9% 6% 2% Surfers being too close 82% 9% 6% 2% Surfers not looking where they are going 80% 10% 7% 3% Windsurfers or kitesurfers being rude or discourteous 90% 4% 5% 1% Windsurfers or kitesurfers being too close 89% 5% 5% 2% Windsurfers or kitesurfers not looking where they are going 88% 5% 5% 2% Boaters (e.g., kayak, motorboat) being rude or discourteous 85% 5% 8% 2% Boaters (e.g., kayak, motorboat) being too close 78% 9% 10% 3% Boaters (e.g., kayak, motorboat) not looking where they are going 81% 11% 7% 2% Anglers (people fishing) being rude or discourteous 89% 4% 5% 2% Anglers (people fishing) being too close 85% 7% 6% 3% Anglers (people fishing) not looking where they cast their line / hook 84% 6% 7% 3%
20. To what extent do you feel that each of the following is a problem at Sans Souci Beach? (circle one number for each item) Not at all
a Problem Slight
Problem Moderate Problem
Extreme Problem
Sunbathers or swimmers being rude or discourteous 78% 14% 4% 4% Sunbathers or swimmers being too close 69% 19% 10% 3% Sunbathers or swimmers not looking where they are going 70% 20% 7% 3% Snorkelers or SCUBA divers being rude or discourteous 85% 6% 6% 4% Snorkelers or SCUBA divers being too close 84% 8% 5% 3% Snorkelers or SCUBA divers not looking where they are going 82% 9% 6% 3% Surfers being rude or discourteous 87% 7% 4% 3% Surfers being too close 84% 8% 5% 3% Surfers not looking where they are going 83% 8% 5% 4% Windsurfers or kitesurfers being rude or discourteous 90% 4% 4% 3% Windsurfers or kitesurfers being too close 88% 4% 5% 3% Windsurfers or kitesurfers not looking where they are going 88% 4% 5% 3% Boaters (e.g., kayak, motorboat) being rude or discourteous 83% 8% 5% 4% Boaters (e.g., kayak, motorboat) being too close 77% 12% 6% 4% Boaters (e.g., kayak, motorboat) not looking where they are going 80% 11% 5% 5% Anglers (people fishing) being rude or discourteous 85% 6% 4% 5% Anglers (people fishing) being too close 82% 8% 6% 4% Anglers (people fishing) not looking where they cast their line / hook 82% 8% 5% 5%
21. Should there be more educational or interpretive information at Sans Souci? (check ONE) 25% No 38% Yes 37% Unsure
22. Should Sans Souci be zoned so different recreation activities don’t overlap in the same areas? 51% No 17% Yes 32% Unsure
23. Are you: (check ONE) 46% Male 54% Female
24. What is your age? (write response) ___average = 38.49_____ years old
25. Where do you live? (write responses) State / Province see report Country see report 89
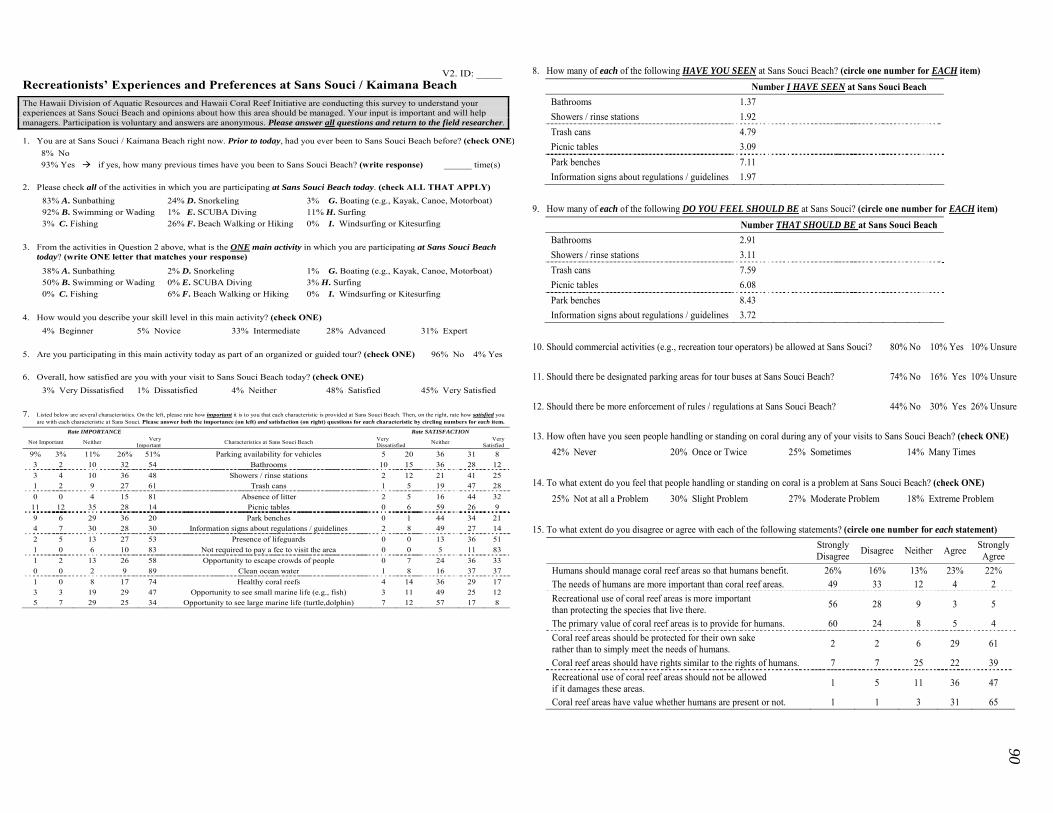
Recreationists’ Experiences and Preferences at Sans Souci / Kaimana Beach The Hawaii Division of Aquatic Resources and Hawaii Coral Reef Initiative are conducting this survey to understand your experiences at Sans Souci Beach and opinions about how this area should be managed. Your input is important and will help managers. Participation is voluntary and answers are anonymous. Please answer all questions and return to the field researcher.
1. You are at Sans Souci / Kaimana Beach right now. Prior to today, had you ever been to Sans Souci Beach before? (check ONE)8% No 93% Yes if yes, how many previous times have you been to Sans Souci Beach? (write response) ______ time(s)
2. Please check all of the activities in which you are participating at Sans Souci Beach today. (check ALL THAT APPLY) 83% A. Sunbathing 24% D. Snorkeling 3% G. Boating (e.g., Kayak, Canoe, Motorboat) 92% B. Swimming or Wading 1% E. SCUBA Diving 11% H. Surfing 3% C. Fishing 26% F. Beach Walking or Hiking 0% I. Windsurfing or Kitesurfing
3. From the activities in Question 2 above, what is the ONE main activity in which you are participating at Sans Souci Beach today? (write ONE letter that matches your response)
38% A. Sunbathing 2% D. Snorkeling 1% G. Boating (e.g., Kayak, Canoe, Motorboat) 50% B. Swimming or Wading 0% E. SCUBA Diving 3% H. Surfing 0% C. Fishing 6% F. Beach Walking or Hiking 0% I. Windsurfing or Kitesurfing
4. How would you describe your skill level in this main activity? (check ONE) 4% Beginner 5% Novice 33% Intermediate 28% Advanced 31% Expert
5. Are you participating in this main activity today as part of an organized or guided tour? (check ONE) 96% No 4% Yes
6. Overall, how satisfied are you with your visit to Sans Souci Beach today? (check ONE) 3% Very Dissatisfied 1% Dissatisfied 4% Neither 48% Satisfied 45% Very Satisfied
7. Listed below are several characteristics. On the left, please rate how important it is to you that each characteristic is provided at Sans Souci Beach. Then, on the right, rate how satisfied you are with each characteristic at Sans Souci. Please answer both the importance (on left) and satisfaction (on right) questions for each characteristic by circling numbers for each item.
Rate IMPORTANCE Rate SATISFACTION
Not Important Neither Very Important Characteristics at Sans Souci Beach Very
Dissatisfied Neither VerySatisfied
9% 3% 11% 26% 51% Parking availability for vehicles 5 20 36 31 8 3 2 10 32 54 Bathrooms 10 15 36 28 12 3 4 10 36 48 Showers / rinse stations 2 12 21 41 25 1 2 9 27 61 Trash cans 1 5 19 47 28 0 0 4 15 81 Absence of litter 2 5 16 44 32
11 12 35 28 14 Picnic tables 0 6 59 26 9 9 6 29 36 20 Park benches 0 1 44 34 21 4 7 30 28 30 Information signs about regulations / guidelines 2 8 49 27 14 2 5 13 27 53 Presence of lifeguards 0 0 13 36 51 1 0 6 10 83 Not required to pay a fee to visit the area 0 0 5 11 83 1 2 13 26 58 Opportunity to escape crowds of people 0 7 24 36 33 0 0 2 9 89 Clean ocean water 1 8 16 37 37 1 0 8 17 74 Healthy coral reefs 4 14 36 29 17 3 3 19 29 47 Opportunity to see small marine life (e.g., fish) 3 11 49 25 12 5 7 29 25 34 Opportunity to see large marine life (turtle,dolphin) 7 12 57 17 8
V2. ID: _____
8. How many of each of the following HAVE YOU SEEN at Sans Souci Beach? (circle one number for EACH item) Number I HAVE SEEN at Sans Souci Beach Bathrooms 1.37 Showers / rinse stations 1.92 Trash cans 4.79 Picnic tables 3.09 Park benches 7.11 Information signs about regulations / guidelines 1.97
9. How many of each of the following DO YOU FEEL SHOULD BE at Sans Souci? (circle one number for EACH item) Number THAT SHOULD BE at Sans Souci Beach Bathrooms 2.91 Showers / rinse stations 3.11 Trash cans 7.59 Picnic tables 6.08 Park benches 8.43 Information signs about regulations / guidelines 3.72
10. Should commercial activities (e.g., recreation tour operators) be allowed at Sans Souci? 80% No 10% Yes 10% Unsure
11. Should there be designated parking areas for tour buses at Sans Souci Beach? 74% No 16% Yes 10% Unsure
12. Should there be more enforcement of rules / regulations at Sans Souci Beach? 44% No 30% Yes 26% Unsure
13. How often have you seen people handling or standing on coral during any of your visits to Sans Souci Beach? (check ONE) 42% Never 20% Once or Twice 25% Sometimes 14% Many Times
14. To what extent do you feel that people handling or standing on coral is a problem at Sans Souci Beach? (check ONE) 25% Not at all a Problem 30% Slight Problem 27% Moderate Problem 18% Extreme Problem
15. To what extent do you disagree or agree with each of the following statements? (circle one number for each statement) Strongly
Disagree Disagree Neither Agree Strongly Agree
Humans should manage coral reef areas so that humans benefit. 26% 16% 13% 23% 22% The needs of humans are more important than coral reef areas. 49 33 12 4 2 Recreational use of coral reef areas is more important than protecting the species that live there. 56 28 9 3 5
The primary value of coral reef areas is to provide for humans. 60 24 8 5 4 Coral reef areas should be protected for their own sake rather than to simply meet the needs of humans. 2 2 6 29 61
Coral reef areas should have rights similar to the rights of humans. 7 7 25 22 39 Recreational use of coral reef areas should not be allowed if it damages these areas. 1 5 11 36 47
Coral reef areas have value whether humans are present or not. 1 1 3 31 65
90
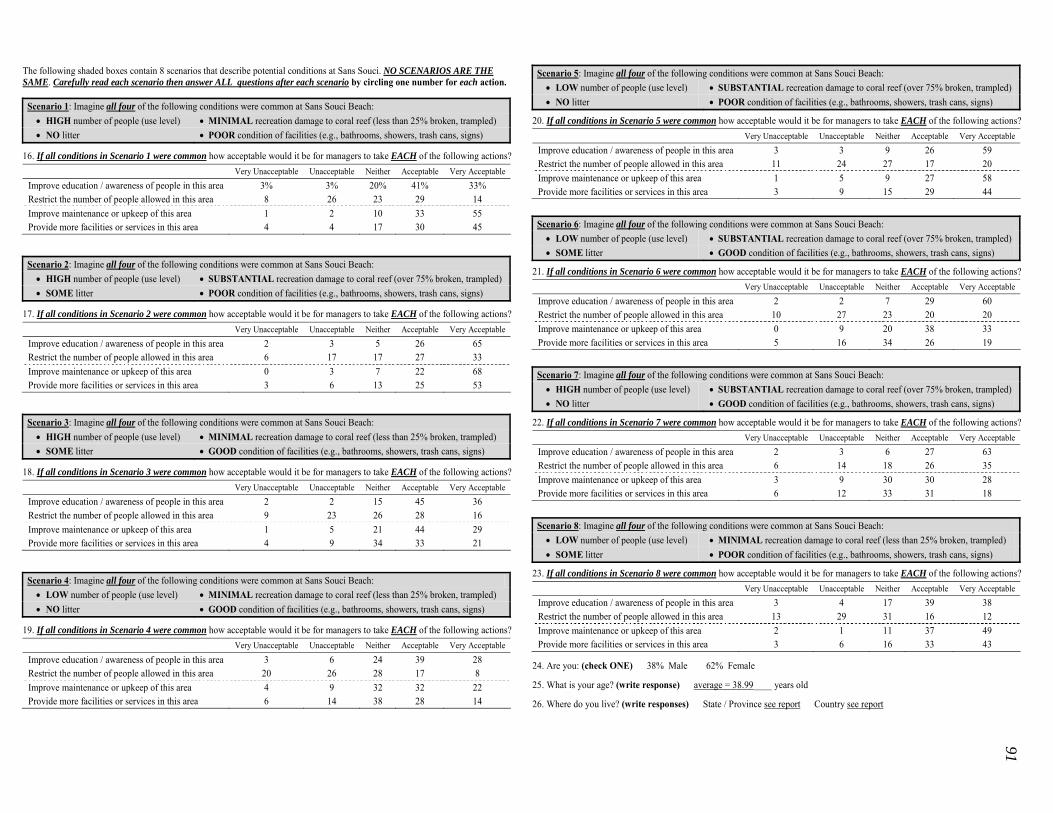
The following shaded boxes contain 8 scenarios that describe potential conditions at Sans Souci. NO SCENARIOS ARE THE SAME. Carefully read each scenario then answer ALL questions after each scenario by circling one number for each action.
Scenario 1: Imagine all four of the following conditions were common at Sans Souci Beach: • HIGH number of people (use level) • MINIMAL recreation damage to coral reef (less than 25% broken, trampled) • NO litter • POOR condition of facilities (e.g., bathrooms, showers, trash cans, signs)
16. If all conditions in Scenario 1 were common how acceptable would it be for managers to take EACH of the following actions? Very Unacceptable Unacceptable Neither Acceptable Very Acceptable Improve education / awareness of people in this area 3% 3% 20% 41% 33% Restrict the number of people allowed in this area 8 26 23 29 14 Improve maintenance or upkeep of this area 1 2 10 33 55 Provide more facilities or services in this area 4 4 17 30 45
Scenario 2: Imagine all four of the following conditions were common at Sans Souci Beach: • HIGH number of people (use level) • SUBSTANTIAL recreation damage to coral reef (over 75% broken, trampled) • SOME litter • POOR condition of facilities (e.g., bathrooms, showers, trash cans, signs)
17. If all conditions in Scenario 2 were common how acceptable would it be for managers to take EACH of the following actions? Very Unacceptable Unacceptable Neither Acceptable Very Acceptable Improve education / awareness of people in this area 2 3 5 26 65 Restrict the number of people allowed in this area 6 17 17 27 33 Improve maintenance or upkeep of this area 0 3 7 22 68 Provide more facilities or services in this area 3 6 13 25 53
Scenario 3: Imagine all four of the following conditions were common at Sans Souci Beach: • HIGH number of people (use level) • MINIMAL recreation damage to coral reef (less than 25% broken, trampled) • SOME litter • GOOD condition of facilities (e.g., bathrooms, showers, trash cans, signs)
18. If all conditions in Scenario 3 were common how acceptable would it be for managers to take EACH of the following actions? Very Unacceptable Unacceptable Neither Acceptable Very Acceptable Improve education / awareness of people in this area 2 2 15 45 36 Restrict the number of people allowed in this area 9 23 26 28 16 Improve maintenance or upkeep of this area 1 5 21 44 29 Provide more facilities or services in this area 4 9 34 33 21
Scenario 4: Imagine all four of the following conditions were common at Sans Souci Beach: • LOW number of people (use level) • MINIMAL recreation damage to coral reef (less than 25% broken, trampled) • NO litter • GOOD condition of facilities (e.g., bathrooms, showers, trash cans, signs)
19. If all conditions in Scenario 4 were common how acceptable would it be for managers to take EACH of the following actions? Very Unacceptable Unacceptable Neither Acceptable Very Acceptable
Improve education / awareness of people in this area 3 6 24 39 28 Restrict the number of people allowed in this area 20 26 28 17 8 Improve maintenance or upkeep of this area 4 9 32 32 22 Provide more facilities or services in this area 6 14 38 28 14
Scenario 5: Imagine all four of the following conditions were common at Sans Souci Beach: • LOW number of people (use level) • SUBSTANTIAL recreation damage to coral reef (over 75% broken, trampled) • NO litter • POOR condition of facilities (e.g., bathrooms, showers, trash cans, signs)
20. If all conditions in Scenario 5 were common how acceptable would it be for managers to take EACH of the following actions? Very Unacceptable Unacceptable Neither Acceptable Very Acceptable Improve education / awareness of people in this area 3 3 9 26 59 Restrict the number of people allowed in this area 11 24 27 17 20 Improve maintenance or upkeep of this area 1 5 9 27 58 Provide more facilities or services in this area 3 9 15 29 44
Scenario 6: Imagine all four of the following conditions were common at Sans Souci Beach: • LOW number of people (use level) • SUBSTANTIAL recreation damage to coral reef (over 75% broken, trampled) • SOME litter • GOOD condition of facilities (e.g., bathrooms, showers, trash cans, signs)
21. If all conditions in Scenario 6 were common how acceptable would it be for managers to take EACH of the following actions? Very Unacceptable Unacceptable Neither Acceptable Very Acceptable
Improve education / awareness of people in this area 2 2 7 29 60 Restrict the number of people allowed in this area 10 27 23 20 20 Improve maintenance or upkeep of this area 0 9 20 38 33 Provide more facilities or services in this area 5 16 34 26 19
Scenario 7: Imagine all four of the following conditions were common at Sans Souci Beach: • HIGH number of people (use level) • SUBSTANTIAL recreation damage to coral reef (over 75% broken, trampled) • NO litter • GOOD condition of facilities (e.g., bathrooms, showers, trash cans, signs)
22. If all conditions in Scenario 7 were common how acceptable would it be for managers to take EACH of the following actions? Very Unacceptable Unacceptable Neither Acceptable Very Acceptable Improve education / awareness of people in this area 2 3 6 27 63 Restrict the number of people allowed in this area 6 14 18 26 35 Improve maintenance or upkeep of this area 3 9 30 30 28 Provide more facilities or services in this area 6 12 33 31 18
Scenario 8: Imagine all four of the following conditions were common at Sans Souci Beach: • LOW number of people (use level) • MINIMAL recreation damage to coral reef (less than 25% broken, trampled) • SOME litter • POOR condition of facilities (e.g., bathrooms, showers, trash cans, signs)
23. If all conditions in Scenario 8 were common how acceptable would it be for managers to take EACH of the following actions? Very Unacceptable Unacceptable Neither Acceptable Very Acceptable Improve education / awareness of people in this area 3 4 17 39 38 Restrict the number of people allowed in this area 13 29 31 16 12 Improve maintenance or upkeep of this area 2 1 11 37 49 Provide more facilities or services in this area 3 6 16 33 43
24. Are you: (check ONE) 38% Male 62% Female
25. What is your age? (write response) average = 38.99____ years old
26. Where do you live? (write responses) State / Province see report Country see report
91
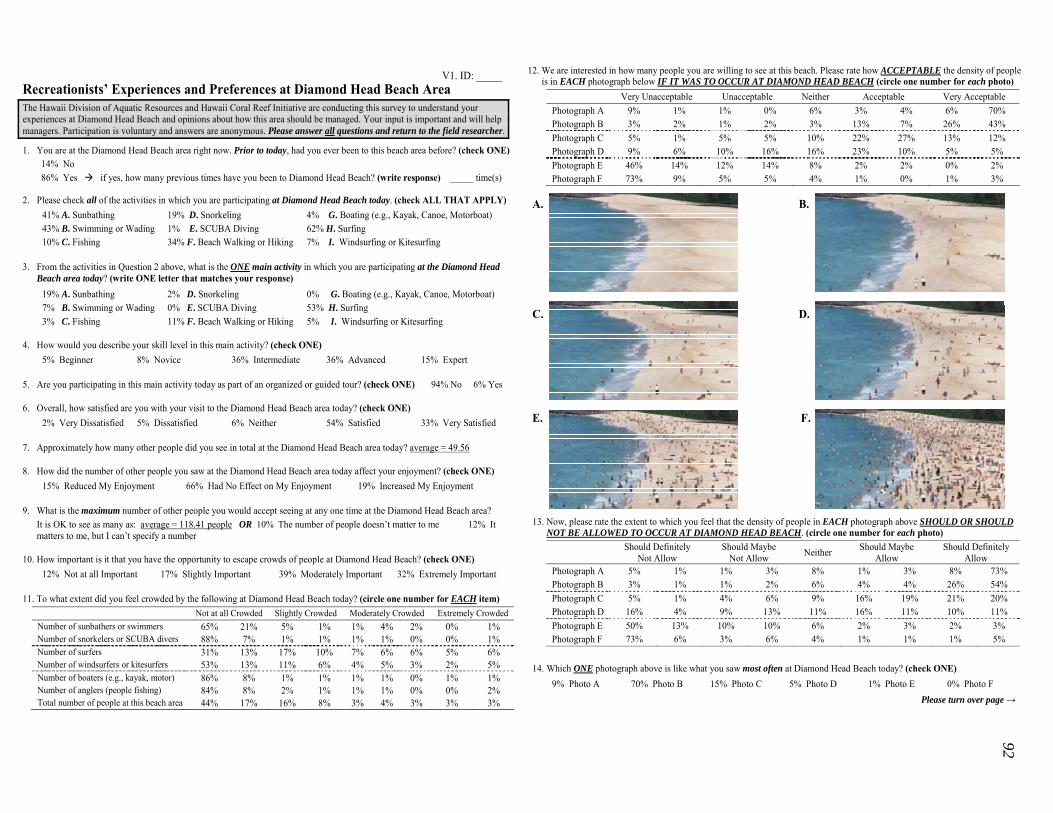
Recreationists’ Experiences and Preferences at Diamond Head Beach Area The Hawaii Division of Aquatic Resources and Hawaii Coral Reef Initiative are conducting this survey to understand your experiences at Diamond Head Beach and opinions about how this area should be managed. Your input is important and will help managers. Participation is voluntary and answers are anonymous. Please answer all questions and return to the field researcher.
1. You are at the Diamond Head Beach area right now. Prior to today, had you ever been to this beach area before? (check ONE)14% No 86% Yes if yes, how many previous times have you been to Diamond Head Beach? (write response) _____ time(s)
2. Please check all of the activities in which you are participating at Diamond Head Beach today. (check ALL THAT APPLY) 41% A. Sunbathing 19% D. Snorkeling 4% G. Boating (e.g., Kayak, Canoe, Motorboat) 43% B. Swimming or Wading 1% E. SCUBA Diving 62% H. Surfing 10% C. Fishing 34% F. Beach Walking or Hiking 7% I. Windsurfing or Kitesurfing
3. From the activities in Question 2 above, what is the ONE main activity in which you are participating at the Diamond Head Beach area today? (write ONE letter that matches your response)
19% A. Sunbathing 2% D. Snorkeling 0% G. Boating (e.g., Kayak, Canoe, Motorboat) 7% B. Swimming or Wading 0% E. SCUBA Diving 53% H. Surfing 3% C. Fishing 11% F. Beach Walking or Hiking 5% I. Windsurfing or Kitesurfing
4. How would you describe your skill level in this main activity? (check ONE) 5% Beginner 8% Novice 36% Intermediate 36% Advanced 15% Expert
5. Are you participating in this main activity today as part of an organized or guided tour? (check ONE) 94% No 6% Yes
6. Overall, how satisfied are you with your visit to the Diamond Head Beach area today? (check ONE) 2% Very Dissatisfied 5% Dissatisfied 6% Neither 54% Satisfied 33% Very Satisfied
7. Approximately how many other people did you see in total at the Diamond Head Beach area today? average = 49.56
8. How did the number of other people you saw at the Diamond Head Beach area today affect your enjoyment? (check ONE) 15% Reduced My Enjoyment 66% Had No Effect on My Enjoyment 19% Increased My Enjoyment
9. What is the maximum number of other people you would accept seeing at any one time at the Diamond Head Beach area? It is OK to see as many as: average = 118.41 people OR 10% The number of people doesn’t matter to me 12% It matters to me, but I can’t specify a number
10. How important is it that you have the opportunity to escape crowds of people at Diamond Head Beach? (check ONE) 12% Not at all Important 17% Slightly Important 39% Moderately Important 32% Extremely Important
11. To what extent did you feel crowded by the following at Diamond Head Beach today? (circle one number for EACH item) Not at all Crowded Slightly Crowded Moderately Crowded Extremely Crowded Number of sunbathers or swimmers 65% 21% 5% 1% 1% 4% 2% 0% 1% Number of snorkelers or SCUBA divers 88% 7% 1% 1% 1% 1% 0% 0% 1% Number of surfers 31% 13% 17% 10% 7% 6% 6% 5% 6% Number of windsurfers or kitesurfers 53% 13% 11% 6% 4% 5% 3% 2% 5% Number of boaters (e.g., kayak, motor) 86% 8% 1% 1% 1% 1% 0% 1% 1% Number of anglers (people fishing) 84% 8% 2% 1% 1% 1% 0% 0% 2% Total number of people at this beach area 44% 17% 16% 8% 3% 4% 3% 3% 3%
V1. ID: _____
Please turn over page →
12. We are interested in how many people you are willing to see at this beach. Please rate how ACCEPTABLE the density of people is in EACH photograph below IF IT WAS TO OCCUR AT DIAMOND HEAD BEACH (circle one number for each photo)
Very Unacceptable Unacceptable Neither Acceptable Very Acceptable Photograph A 9% 1% 1% 0% 6% 3% 4% 6% 70% Photograph B 3% 2% 1% 2% 3% 13% 7% 26% 43% Photograph C 5% 1% 5% 5% 10% 22% 27% 13% 12% Photograph D 9% 6% 10% 16% 16% 23% 10% 5% 5% Photograph E 46% 14% 12% 14% 8% 2% 2% 0% 2% Photograph F 73% 9% 5% 5% 4% 1% 0% 1% 3%
A. B. C. D.
E. F.
13. Now, please rate the extent to which you feel that the density of people in EACH photograph above SHOULD OR SHOULD NOT BE ALLOWED TO OCCUR AT DIAMOND HEAD BEACH. (circle one number for each photo)
Should Definitely Not Allow
Should Maybe Not Allow Neither Should Maybe
Allow Should Definitely
Allow Photograph A 5% 1% 1% 3% 8% 1% 3% 8% 73% Photograph B 3% 1% 1% 2% 6% 4% 4% 26% 54% Photograph C 5% 1% 4% 6% 9% 16% 19% 21% 20% Photograph D 16% 4% 9% 13% 11% 16% 11% 10% 11% Photograph E 50% 13% 10% 10% 6% 2% 3% 2% 3% Photograph F 73% 6% 3% 6% 4% 1% 1% 1% 5%
14. Which ONE photograph above is like what you saw most often at Diamond Head Beach today? (check ONE) 9% Photo A 70% Photo B 15% Photo C 5% Photo D 1% Photo E 0% Photo F
92
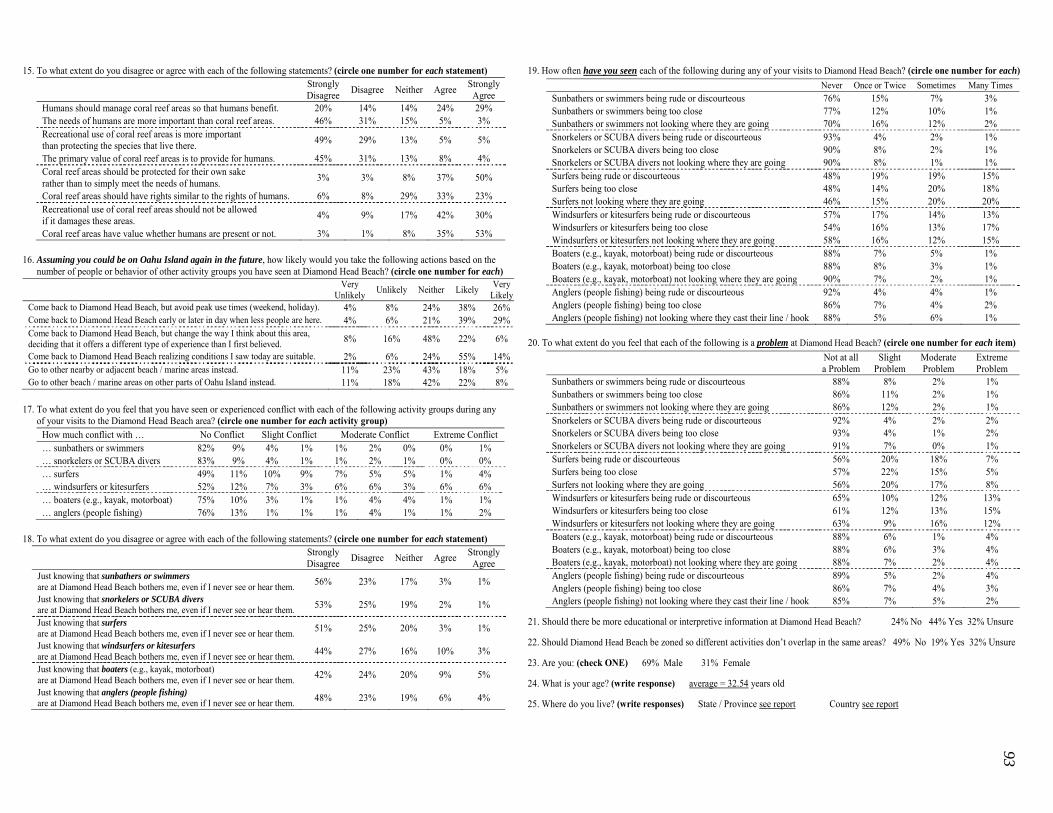
15. To what extent do you disagree or agree with each of the following statements? (circle one number for each statement) Strongly
Disagree Disagree Neither Agree StronglyAgree
Humans should manage coral reef areas so that humans benefit. 20% 14% 14% 24% 29% The needs of humans are more important than coral reef areas. 46% 31% 15% 5% 3% Recreational use of coral reef areas is more important than protecting the species that live there. 49% 29% 13% 5% 5%
The primary value of coral reef areas is to provide for humans. 45% 31% 13% 8% 4% Coral reef areas should be protected for their own sake rather than to simply meet the needs of humans. 3% 3% 8% 37% 50%
Coral reef areas should have rights similar to the rights of humans. 6% 8% 29% 33% 23% Recreational use of coral reef areas should not be allowed if it damages these areas. 4% 9% 17% 42% 30%
Coral reef areas have value whether humans are present or not. 3% 1% 8% 35% 53%
16. Assuming you could be on Oahu Island again in the future, how likely would you take the following actions based on the number of people or behavior of other activity groups you have seen at Diamond Head Beach? (circle one number for each)
Very Unlikely Unlikely Neither Likely Very
LikelyCome back to Diamond Head Beach, but avoid peak use times (weekend, holiday). 4% 8% 24% 38% 26%Come back to Diamond Head Beach early or later in day when less people are here. 4% 6% 21% 39% 29%Come back to Diamond Head Beach, but change the way I think about this area, deciding that it offers a different type of experience than I first believed. 8% 16% 48% 22% 6%
Come back to Diamond Head Beach realizing conditions I saw today are suitable. 2% 6% 24% 55% 14%Go to other nearby or adjacent beach / marine areas instead. 11% 23% 43% 18% 5% Go to other beach / marine areas on other parts of Oahu Island instead. 11% 18% 42% 22% 8%
17. To what extent do you feel that you have seen or experienced conflict with each of the following activity groups during any of your visits to the Diamond Head Beach area? (circle one number for each activity group)
How much conflict with … No Conflict Slight Conflict Moderate Conflict Extreme Conflict … sunbathers or swimmers 82% 9% 4% 1% 1% 2% 0% 0% 1% … snorkelers or SCUBA divers 83% 9% 4% 1% 1% 2% 1% 0% 0% … surfers 49% 11% 10% 9% 7% 5% 5% 1% 4% … windsurfers or kitesurfers 52% 12% 7% 3% 6% 6% 3% 6% 6% … boaters (e.g., kayak, motorboat) 75% 10% 3% 1% 1% 4% 4% 1% 1% … anglers (people fishing) 76% 13% 1% 1% 1% 4% 1% 1% 2%
18. To what extent do you disagree or agree with each of the following statements? (circle one number for each statement) Strongly
Disagree Disagree Neither Agree StronglyAgree
Just knowing that sunbathers or swimmers are at Diamond Head Beach bothers me, even if I never see or hear them. 56% 23% 17% 3% 1%
Just knowing that snorkelers or SCUBA divers are at Diamond Head Beach bothers me, even if I never see or hear them. 53% 25% 19% 2% 1%
Just knowing that surfers are at Diamond Head Beach bothers me, even if I never see or hear them. 51% 25% 20% 3% 1%
Just knowing that windsurfers or kitesurfers are at Diamond Head Beach bothers me, even if I never see or hear them. 44% 27% 16% 10% 3%
Just knowing that boaters (e.g., kayak, motorboat) are at Diamond Head Beach bothers me, even if I never see or hear them. 42% 24% 20% 9% 5%
Just knowing that anglers (people fishing) are at Diamond Head Beach bothers me, even if I never see or hear them. 48% 23% 19% 6% 4%
19. How often have you seen each of the following during any of your visits to Diamond Head Beach? (circle one number for each) Never Once or Twice Sometimes Many Times Sunbathers or swimmers being rude or discourteous 76% 15% 7% 3% Sunbathers or swimmers being too close 77% 12% 10% 1% Sunbathers or swimmers not looking where they are going 70% 16% 12% 2% Snorkelers or SCUBA divers being rude or discourteous 93% 4% 2% 1% Snorkelers or SCUBA divers being too close 90% 8% 2% 1% Snorkelers or SCUBA divers not looking where they are going 90% 8% 1% 1% Surfers being rude or discourteous 48% 19% 19% 15% Surfers being too close 48% 14% 20% 18% Surfers not looking where they are going 46% 15% 20% 20% Windsurfers or kitesurfers being rude or discourteous 57% 17% 14% 13% Windsurfers or kitesurfers being too close 54% 16% 13% 17% Windsurfers or kitesurfers not looking where they are going 58% 16% 12% 15% Boaters (e.g., kayak, motorboat) being rude or discourteous 88% 7% 5% 1% Boaters (e.g., kayak, motorboat) being too close 88% 8% 3% 1% Boaters (e.g., kayak, motorboat) not looking where they are going 90% 7% 2% 1% Anglers (people fishing) being rude or discourteous 92% 4% 4% 1% Anglers (people fishing) being too close 86% 7% 4% 2% Anglers (people fishing) not looking where they cast their line / hook 88% 5% 6% 1%
20. To what extent do you feel that each of the following is a problem at Diamond Head Beach? (circle one number for each item) Not at all
a Problem Slight
Problem Moderate Problem
Extreme Problem
Sunbathers or swimmers being rude or discourteous 88% 8% 2% 1% Sunbathers or swimmers being too close 86% 11% 2% 1% Sunbathers or swimmers not looking where they are going 86% 12% 2% 1% Snorkelers or SCUBA divers being rude or discourteous 92% 4% 2% 2% Snorkelers or SCUBA divers being too close 93% 4% 1% 2% Snorkelers or SCUBA divers not looking where they are going 91% 7% 0% 1% Surfers being rude or discourteous 56% 20% 18% 7% Surfers being too close 57% 22% 15% 5% Surfers not looking where they are going 56% 20% 17% 8% Windsurfers or kitesurfers being rude or discourteous 65% 10% 12% 13% Windsurfers or kitesurfers being too close 61% 12% 13% 15% Windsurfers or kitesurfers not looking where they are going 63% 9% 16% 12% Boaters (e.g., kayak, motorboat) being rude or discourteous 88% 6% 1% 4% Boaters (e.g., kayak, motorboat) being too close 88% 6% 3% 4% Boaters (e.g., kayak, motorboat) not looking where they are going 88% 7% 2% 4% Anglers (people fishing) being rude or discourteous 89% 5% 2% 4% Anglers (people fishing) being too close 86% 7% 4% 3% Anglers (people fishing) not looking where they cast their line / hook 85% 7% 5% 2%
21. Should there be more educational or interpretive information at Diamond Head Beach? 24% No 44% Yes 32% Unsure
22. Should Diamond Head Beach be zoned so different activities don’t overlap in the same areas? 49% No 19% Yes 32% Unsure
23. Are you: (check ONE) 69% Male 31% Female
24. What is your age? (write response) average = 32.54 years old
25. Where do you live? (write responses) State / Province see report Country see report
93
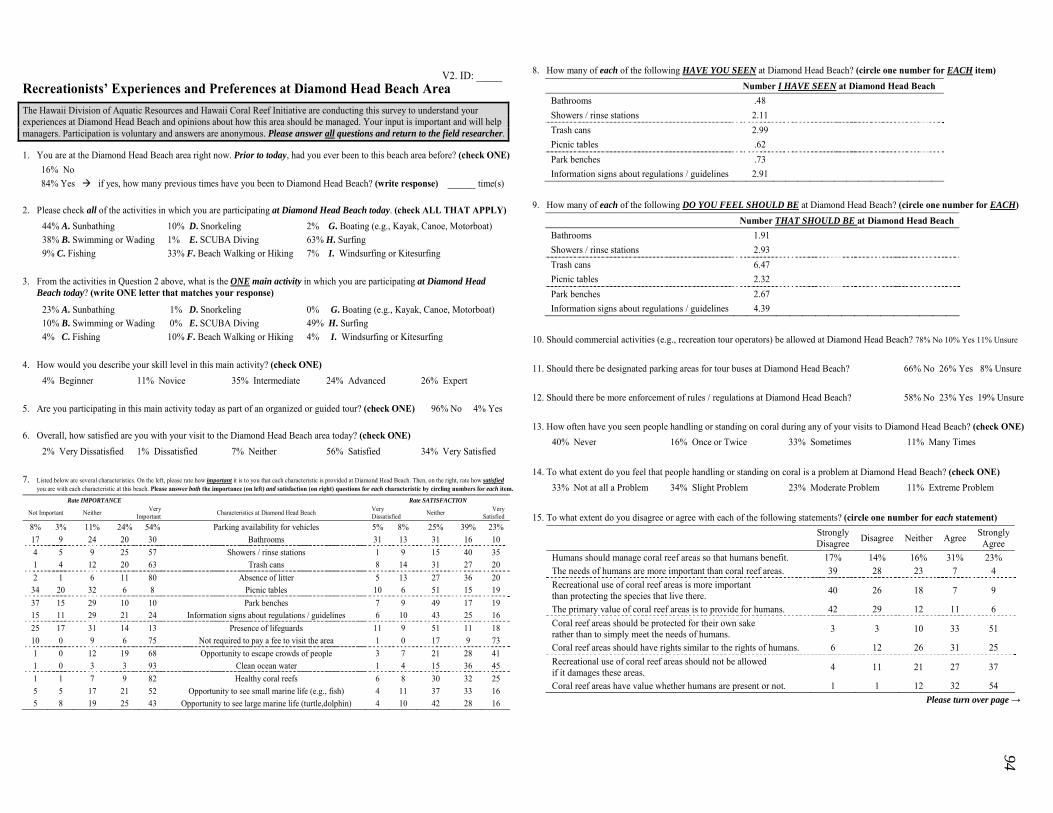
Recreationists’ Experiences and Preferences at Diamond Head Beach Area The Hawaii Division of Aquatic Resources and Hawaii Coral Reef Initiative are conducting this survey to understand your experiences at Diamond Head Beach and opinions about how this area should be managed. Your input is important and will help managers. Participation is voluntary and answers are anonymous. Please answer all questions and return to the field researcher.
1. You are at the Diamond Head Beach area right now. Prior to today, had you ever been to this beach area before? (check ONE)16% No 84% Yes if yes, how many previous times have you been to Diamond Head Beach? (write response) ______ time(s)
2. Please check all of the activities in which you are participating at Diamond Head Beach today. (check ALL THAT APPLY) 44% A. Sunbathing 10% D. Snorkeling 2% G. Boating (e.g., Kayak, Canoe, Motorboat) 38% B. Swimming or Wading 1% E. SCUBA Diving 63% H. Surfing 9% C. Fishing 33% F. Beach Walking or Hiking 7% I. Windsurfing or Kitesurfing
3. From the activities in Question 2 above, what is the ONE main activity in which you are participating at Diamond Head Beach today? (write ONE letter that matches your response)
23% A. Sunbathing 1% D. Snorkeling 0% G. Boating (e.g., Kayak, Canoe, Motorboat) 10% B. Swimming or Wading 0% E. SCUBA Diving 49% H. Surfing 4% C. Fishing 10% F. Beach Walking or Hiking 4% I. Windsurfing or Kitesurfing
4. How would you describe your skill level in this main activity? (check ONE) 4% Beginner 11% Novice 35% Intermediate 24% Advanced 26% Expert
5. Are you participating in this main activity today as part of an organized or guided tour? (check ONE) 96% No 4% Yes
6. Overall, how satisfied are you with your visit to the Diamond Head Beach area today? (check ONE) 2% Very Dissatisfied 1% Dissatisfied 7% Neither 56% Satisfied 34% Very Satisfied
7. Listed below are several characteristics. On the left, please rate how important it is to you that each characteristic is provided at Diamond Head Beach. Then, on the right, rate how satisfied you are with each characteristic at this beach. Please answer both the importance (on left) and satisfaction (on right) questions for each characteristic by circling numbers for each item.
Rate IMPORTANCE Rate SATISFACTION
Not Important Neither Very Important Characteristics at Diamond Head Beach Very
Dissatisfied Neither VerySatisfied
8% 3% 11% 24% 54% Parking availability for vehicles 5% 8% 25% 39% 23% 17 9 24 20 30 Bathrooms 31 13 31 16 10 4 5 9 25 57 Showers / rinse stations 1 9 15 40 35 1 4 12 20 63 Trash cans 8 14 31 27 20 2 1 6 11 80 Absence of litter 5 13 27 36 20
34 20 32 6 8 Picnic tables 10 6 51 15 19 37 15 29 10 10 Park benches 7 9 49 17 19 15 11 29 21 24 Information signs about regulations / guidelines 6 10 43 25 16 25 17 31 14 13 Presence of lifeguards 11 9 51 11 18 10 0 9 6 75 Not required to pay a fee to visit the area 1 0 17 9 73 1 0 12 19 68 Opportunity to escape crowds of people 3 7 21 28 41 1 0 3 3 93 Clean ocean water 1 4 15 36 45 1 1 7 9 82 Healthy coral reefs 6 8 30 32 25 5 5 17 21 52 Opportunity to see small marine life (e.g., fish) 4 11 37 33 16 5 8 19 25 43 Opportunity to see large marine life (turtle,dolphin) 4 10 42 28 16
V2. ID: _____
Please turn over page →
8. How many of each of the following HAVE YOU SEEN at Diamond Head Beach? (circle one number for EACH item) Number I HAVE SEEN at Diamond Head Beach Bathrooms .48 Showers / rinse stations 2.11 Trash cans 2.99 Picnic tables .62 Park benches .73 Information signs about regulations / guidelines 2.91
9. How many of each of the following DO YOU FEEL SHOULD BE at Diamond Head Beach? (circle one number for EACH) Number THAT SHOULD BE at Diamond Head Beach Bathrooms 1.91 Showers / rinse stations 2.93 Trash cans 6.47 Picnic tables 2.32 Park benches 2.67 Information signs about regulations / guidelines 4.39
10. Should commercial activities (e.g., recreation tour operators) be allowed at Diamond Head Beach? 78% No 10% Yes 11% Unsure
11. Should there be designated parking areas for tour buses at Diamond Head Beach? 66% No 26% Yes 8% Unsure
12. Should there be more enforcement of rules / regulations at Diamond Head Beach? 58% No 23% Yes 19% Unsure
13. How often have you seen people handling or standing on coral during any of your visits to Diamond Head Beach? (check ONE)40% Never 16% Once or Twice 33% Sometimes 11% Many Times
14. To what extent do you feel that people handling or standing on coral is a problem at Diamond Head Beach? (check ONE) 33% Not at all a Problem 34% Slight Problem 23% Moderate Problem 11% Extreme Problem
15. To what extent do you disagree or agree with each of the following statements? (circle one number for each statement) Strongly
Disagree Disagree Neither Agree Strongly Agree
Humans should manage coral reef areas so that humans benefit. 17% 14% 16% 31% 23% The needs of humans are more important than coral reef areas. 39 28 23 7 4 Recreational use of coral reef areas is more important than protecting the species that live there. 40 26 18 7 9
The primary value of coral reef areas is to provide for humans. 42 29 12 11 6 Coral reef areas should be protected for their own sake rather than to simply meet the needs of humans. 3 3 10 33 51
Coral reef areas should have rights similar to the rights of humans. 6 12 26 31 25 Recreational use of coral reef areas should not be allowed if it damages these areas. 4 11 21 27 37
Coral reef areas have value whether humans are present or not. 1 1 12 32 54
94

The following shaded boxes contain 8 scenarios that describe potential conditions at Diamond Head Beach. NO SCENARIOS ARETHE SAME. Carefully read each scenario then answer ALL questions after each scenario by circling one number for each actio
Scenario 1: Imagine all four of the following conditions were common at the Diamond Head Beach area: • HIGH number of people (use level) • MINIMAL recreation damage to coral reef (less than 25% broken, trampled) • NO litter • POOR condition of facilities (e.g., bathrooms, showers, trash cans, signs)
16. If all conditions in Scenario 1 were common how acceptable would it be for managers to take EACH of the following actions? Very Unacceptable Unacceptable Neither Acceptable Very Acceptable Improve education / awareness of people in this area 1% 4% 19% 46% 30% Restrict the number of people allowed in this area 10 27 33 21 9 Improve maintenance or upkeep of this area 2 2 13 45 38 Provide more facilities or services in this area 4 11 27 33 25
Scenario 2: Imagine all four of the following conditions were common at the Diamond Head Beach area: • HIGH number of people (use level) • SUBSTANTIAL recreation damage to coral reef (over 75% broken, trampled) • SOME litter • POOR condition of facilities (e.g., bathrooms, showers, trash cans, signs)
17. If all conditions in Scenario 2 were common how acceptable would it be for managers to take EACH of the following actions? Very Unacceptable Unacceptable Neither Acceptable Very Acceptable Improve education / awareness of people in this area 3 4 8 33 51 Restrict the number of people allowed in this area 9 14 23 29 25 Improve maintenance or upkeep of this area 1 3 10 31 55 Provide more facilities or services in this area 8 12 18 27 35
Scenario 3: Imagine all four of the following conditions were common at the Diamond Head Beach area: • HIGH number of people (use level) • MINIMAL recreation damage to coral reef (less than 25% broken, trampled) • SOME litter • GOOD condition of facilities (e.g., bathrooms, showers, trash cans, signs)
18. If all conditions in Scenario 3 were common how acceptable would it be for managers to take EACH of the following actions? Very Unacceptable Unacceptable Neither Acceptable Very Acceptable Improve education / awareness of people in this area 2 3 15 46 35 Restrict the number of people allowed in this area 10 25 28 26 11 Improve maintenance or upkeep of this area 2 5 24 41 29 Provide more facilities or services in this area 6 13 37 30 15
Scenario 4: Imagine all four of the following conditions were common at the Diamond Head Beach area: • LOW number of people (use level) • MINIMAL recreation damage to coral reef (less than 25% broken, trampled) • NO litter • GOOD condition of facilities (e.g., bathrooms, showers, trash cans, signs)
19. If all conditions in Scenario 4 were common how acceptable would it be for managers to take EACH of the following actions? Very Unacceptable Unacceptable Neither Acceptable Very Acceptable
Improve education / awareness of people in this area 5 8 28 33 27 Restrict the number of people allowed in this area 19 25 33 12 11 Improve maintenance or upkeep of this area 5 8 34 32 21 Provide more facilities or services in this area 10 19 38 21 12
Scenario 5: Imagine all four of the following conditions were common at the Diamond Head Beach area: • LOW number of people (use level) • SUBSTANTIAL recreation damage to coral reef (over 75% broken, trampled) • NO litter • POOR condition of facilities (e.g., bathrooms, showers, trash cans, signs)
20. If all conditions in Scenario 5 were common how acceptable would it be for managers to take EACH of the following actions? Very Unacceptable Unacceptable Neither Acceptable Very Acceptable Improve education / awareness of people in this area 2 7 17 28 47 Restrict the number of people allowed in this area 15 21 28 21 15 Improve maintenance or upkeep of this area 4 4 13 40 39 Provide more facilities or services in this area 8 10 26 30 27
Scenario 6: Imagine all four of the following conditions were common at the Diamond Head Beach area: • LOW number of people (use level) • SUBSTANTIAL recreation damage to coral reef (over 75% broken, trampled) • SOME litter • GOOD condition of facilities (e.g., bathrooms, showers, trash cans, signs)
21. If all conditions in Scenario 6 were common how acceptable would it be for managers to take EACH of the following actions? Very Unacceptable Unacceptable Neither Acceptable Very Acceptable
Improve education / awareness of people in this area 1 8 12 28 50 Restrict the number of people allowed in this area 18 19 32 15 16 Improve maintenance or upkeep of this area 5 3 22 34 36 Provide more facilities or services in this area 9 13 36 25 17
Scenario 7: Imagine all four of the following conditions were common at the Diamond Head Beach area: • HIGH number of people (use level) • SUBSTANTIAL recreation damage to coral reef (over 75% broken, trampled) • NO litter • GOOD condition of facilities (e.g., bathrooms, showers, trash cans, signs)
22. If all conditions in Scenario 7 were common how acceptable would it be for managers to take EACH of the following actions? Very Unacceptable Unacceptable Neither Acceptable Very Acceptable Improve education / awareness of people in this area 3 2 17 27 52 Restrict the number of people allowed in this area 8 12 30 27 23 Improve maintenance or upkeep of this area 6 8 24 32 30 Provide more facilities or services in this area 13 12 36 24 15
Scenario 8: Imagine all four of the following conditions were common at the Diamond Head Beach area: • LOW number of people (use level) • MINIMAL recreation damage to coral reef (less than 25% broken, trampled) • SOME litter • POOR condition of facilities (e.g., bathrooms, showers, trash cans, signs)
23. If all conditions in Scenario 8 were common how acceptable would it be for managers to take EACH of the following actions? Very Unacceptable Unacceptable Neither Acceptable Very Acceptable Improve education / awareness of people in this area 2 8 22 37 31 Restrict the number of people allowed in this area 16 27 30 16 11 Improve maintenance or upkeep of this area 3 5 16 43 34 Provide more facilities or services in this area 8 8 24 36 24
24. Are you: (check ONE) 67% Male 34% Female
25. What is your age? (write response) __average = 35.62______ years old
26. Where do you live? (write responses) State / Province see report Country see report
95