Embed Size (px)
Citation preview
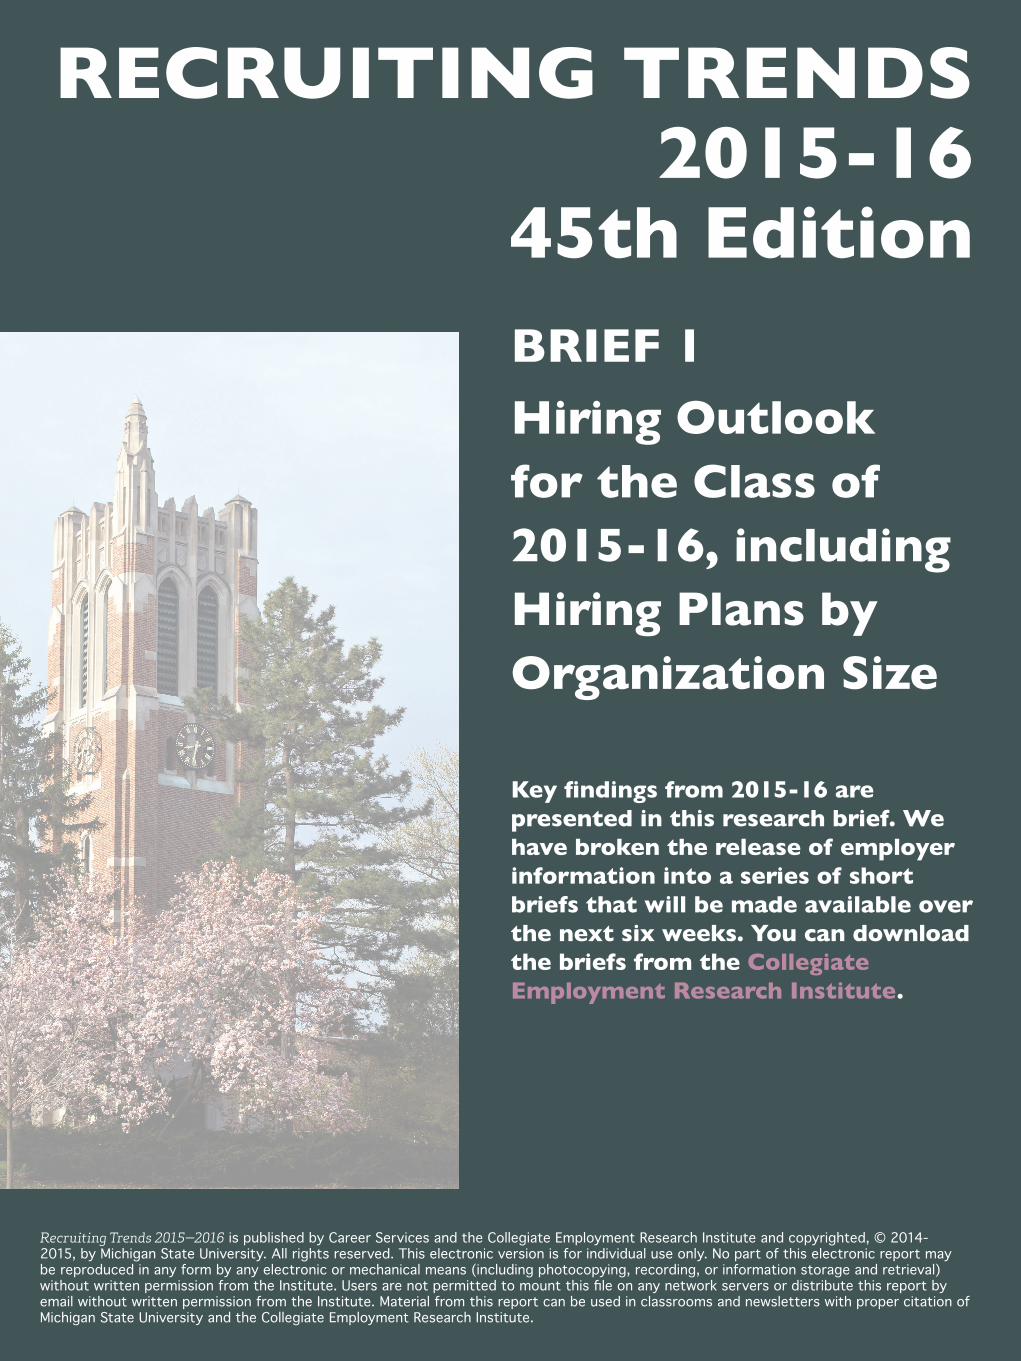
RECRUITING TRENDS 2015-16
45th Edition
Recruiting Trends 2015—2016 is published by Career Services and the Collegiate Employment Research Institute and copyrighted, © 2014-2015, by Michigan State University. All rights reserved. This electronic version is for individual use only. No part of this electronic report may be reproduced in any form by any electronic or mechanical means (including photocopying, recording, or information storage and retrieval) without written permission from the Institute. Users are not permitted to mount this file on any network servers or distribute this report by email without written permission from the Institute. Material from this report can be used in classrooms and newsletters with proper citation of Michigan State University and the Collegiate Employment Research Institute.
BRIEF 1Hiring Outlook for the Class of 2015-16, including Hiring Plans by Organization Size
Key findings from 2015-16 are presented in this research brief. We have broken the release of employer information into a series of short briefs that will be made available over the next six weeks. You can download the briefs from the Collegiate Employment Research Institute.
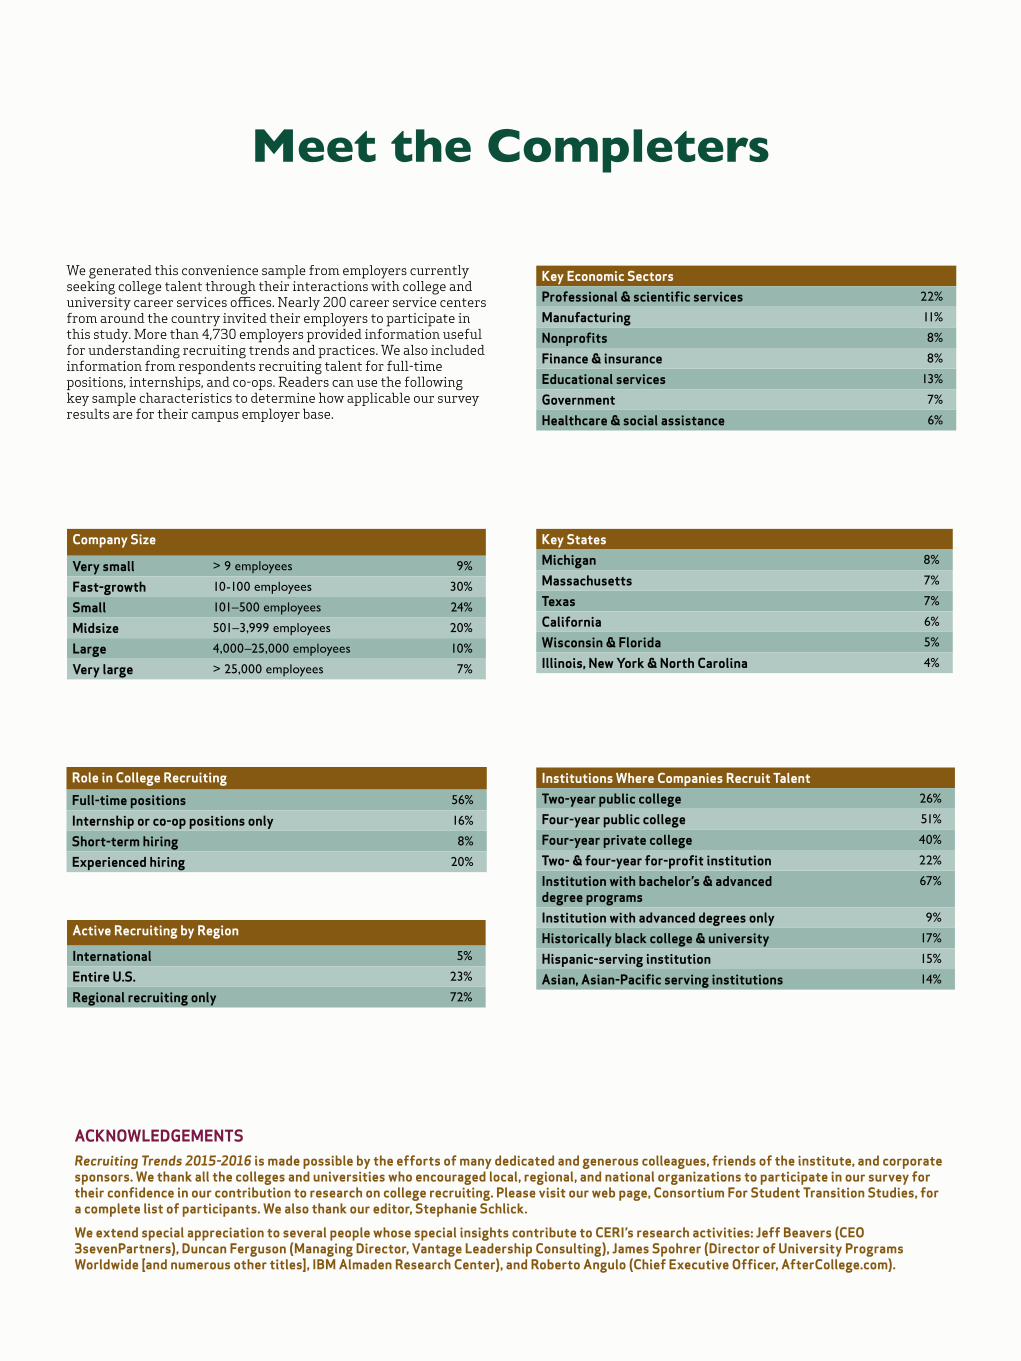
Role in College Recruiting
Full-time positions 56%
Internship or co-op positions only 16%
Short-term hiring 8%
Experienced hiring 20%
Company Size
Very small > 9 employees 9%
Fast-growth 10-100 employees 30%
Small 101–500 employees 24%
Midsize 501–3,999 employees 20%
Large 4,000–25,000 employees 10%
Very large > 25,000 employees 7%
Key Economic SectorsProfessional & scientific services 22%
Manufacturing 11%
Nonprofits 8%
Finance & insurance 8%
Educational services 13%
Government 7%
Healthcare & social assistance 6%
Key StatesMichigan 8%
Massachusetts 7%
Texas 7%
California 6%
Wisconsin & Florida 5%
Illinois, New York & North Carolina 4%
Institutions Where Companies Recruit TalentTwo-year public college 26%
Four-year public college 51%
Four-year private college 40%
Two- & four-year for-profit institution 22%
Institution with bachelor’s & advanced degree programs
67%
Institution with advanced degrees only 9%
Historically black college & university 17%
Hispanic-serving institution 15%
Asian, Asian-Pacific serving institutions 14%
Active Recruiting by Region
International 5%
Entire U.S. 23%
Regional recruiting only 72%
Meet the Completers
We generated this convenience sample from employers currently seeking college talent through their interactions with college and university career services offices. Nearly 200 career service centers from around the country invited their employers to participate in this study. More than 4,730 employers provided information useful for understanding recruiting trends and practices. We also included information from respondents recruiting talent for full-time positions, internships, and co-ops. Readers can use the following key sample characteristics to determine how applicable our survey results are for their campus employer base.
ACKNOWLEDGEMENTS Recruiting Trends 2015-2016 is made possible by the efforts of many dedicated and generous colleagues, friends of the institute, and corporate sponsors. We thank all the colleges and universities who encouraged local, regional, and national organizations to participate in our survey for their confidence in our contribution to research on college recruiting. Please visit our web page, Consortium For Student Transition Studies, for a complete list of participants. We also thank our editor, Stephanie Schlick.
We extend special appreciation to several people whose special insights contribute to CERI’s research activities: Jeff Beavers (CEO 3sevenPartners), Duncan Ferguson (Managing Director, Vantage Leadership Consulting), James Spohrer (Director of University Programs Worldwide [and numerous other titles], IBM Almaden Research Center), and Roberto Angulo (Chief Executive Officer, AfterCollege.com).
1Recruiting Trends 2015-16
Brief 1: Hiring Plans
The college labor market has been rebounding since the depths of the recession between 2009 and 2010. In fact, the slogan “recruit like it’s 1999” accurately describes the explosive growth in the college labor market for the past two years. Recruiting in 2013-14 and 2014-15 began early and continued through the entire academic year, capped by
the largest increase in education hiring in nearly a decade. Signs in the late summer of 2015 point to another explosive year, despite the gloomier forecast from the Federal Reserve at its September meeting. Since 2015-16 is shaping up to be as competitive as last year, we need to be aware of possible drags on the college hiring market.
The broad economic outlook seems to be improving: unemployment is about 5 percent; financial markets show steady overall improvement, and interest rates are still low. A recent U.S. census report, however, shows median household income has steadily eroded, apparently unfazed by these improvements. According to Neil Irwin, who cited a September 2015 population report in his New York Times article “Why Americans Still Think the Economy Is Terrible,” a middle income family “makes substantially less money in inflation-adjusted terms than [it] did 15 years ago. And there is no evidence that is reversing. Those families lost ground in 2014.”
Despite the negative news about middle-class wages, the new college labor market is growing: starting salaries are increasing and becoming competitive. The trend to watch is starting salaries for computer science, engineering, and several other academic majors. These offers may be enough to trigger higher salaries for all new graduates. While we would never claim rising tides lift all boats, higher starting salaries will give new graduates a better income level at which to begin their careers.
Placing the new college labor market in context Employment news has been largely positive throughout 2015. In his USA Today article “Work Aplenty, “ Paul Davidson was ecstatic, even borrowing the “like it’s 1999” tagline. If the job gains from late 2014 continue through 2015, businesses might be more confident about economic sustainability. The most job growth was projected for low-wage sectors (restaurant and retail).
The Manpower Employment Outlook data have all been positive, with the fourth quarter 2015 stronger than a year ago. They report 71 percent of employers plan to keep workforce levels steady, including replacement jobs, and 21 percent plan to hire. The sectors expected to perform well are Hospitality; Wholesale and Retail Trade; Professional, Business, and Scientific Services, and Transportation and Utilities.
Other sectors are struggling: none more than Mining and Oil. According to Oil and Gas Investor, citing a June 2015 Rigzone survey of global oil and gas hiring managers, “… 65% acknowledge that they have decreased their hiring plans. In addition, 54% of global hiring managers surveyed indicate that they think job cuts are more likely in the next six months, and 65% said they expect to experience a loss of budget for personnel for the year.” Since the survey, the September jobs report reveals 10,300 U.S. jobs were cut in Mining, with support activities decreasing by 7,200. Oil and gas extraction lost 1,100 jobs. Moreover, sectors highly involved in commodities and export trade have also reported concerns as the global economy has languished, especially in China.
Mixed reports for small businesses are emerging, with the National Federation of Independent Business (NFIB) stating that small business optimism was muted throughout much of the
summer. Their good news was that optimism increased (0.5%) from the previous month; at least it did not fall.
Juxtapose NFIB’s concerns against those of Small Business Trends. In his article “Small Businesses: Bullish on the Economy,” David Wallace reported the results of a survey completed by 1,000 employers, of which 38 percent plan to hire more employees and 28 percent plan to expand into new markets.
The most consistent employment figures come from the Bureau of Labor Statistics monthly employment report. From January through August, monthly job gains exceeded 175,000, and averaged 247,000 per month during the prior twelve months. In August, employment increased in Finance, Healthcare and Social Assistance; Hospitality; and Professional, Business, and Scientific Services. Employment in Manufacturing and Mining showed signs of trouble — none more than Mining and Oil as reflected in Caterpillar’s announcement of layoffs during a cyclical downturn. Manufacturing sectors related to oil (plastics, petroleum, and chemicals/pharmaceuticals) reported lower employment figures, as did export-driven sectors (primary metals, fabricated metals, machinery, and electrical equipment). Employment was mixed in Information Services. Publishing, Broadcasting, and Motion Pictures all reported less employment this year. Cable providers and broadcasters reported the largest drop due to realignment and switches in consumer preferences. Internet publishers, data processers, and Internet providers remained more positive.
The economic indicators and analyses of national jobs data provide the context for interpreting the survey results. Their effects on the new college labor market may be borne out in survey responses, which in some cases mirror the broader economic situation or differ slightly depending on the region where the survey respondents are located or hiring.
Our employersThis year about 4,723 employers provided enough information for our analyses. A complete profile can be found at the end of this brief. Fifty-six percent are recruiters seeking full-time talent or hiring managers overseeing talent acquisition within their organizations. Other contributors include recruiters seeking experienced talent (20%), internship and co-op managers (16%), and those filling short-term assignments of less than 6 months (8%). The results presented here focus on the information provided by full-time talent or hiring managers.
The respondents represent the rich diversity of companies and organizations seeking new college talent. Thirty-nine percent were organizations with 100 or fewer employees; 36 percent employed between 101 and 1,500; 14 percent, between 1,500 and 10,000; and 11 percent, more than 10,000.
Every major industrial segment (based on major NAIC codes) provided information for this survey. Sectors providing the highest number of respondents included: Educational Services; Finance and Insurance Services; Government; Healthcare and Social Services; Manufacturing; Nonprofits; and Professional, Business, and Scientific Services.
WHO ARE THE SUPER HIRERS? Organizations that plan to increase hiring by more than 100% are typically small companies (68%, <500 employees). However, large employers (18%, >4,000 employees) also plan on doubling their hiring targets. These organizations tend to be in the Professional, Business and Scientific Services sector (20%), Education (13%), Finance (11%), Manufacturing (11%), Construction (6%) and Information Services (5%). Most of the super hirers are located in Virginia and California, but can also be found in Michigan, Wisconsin, and Texas.
2Recruiting Trends 2015-16
Brief 1: Hiring Plans
An employer from every state, several territories, and neighboring countries appeared in the respondent pool. The respondents were geographically distributed across the country. States providing the highest number of respondents included Texas, California, Michigan, Massachusetts, Wisconsin and New York.
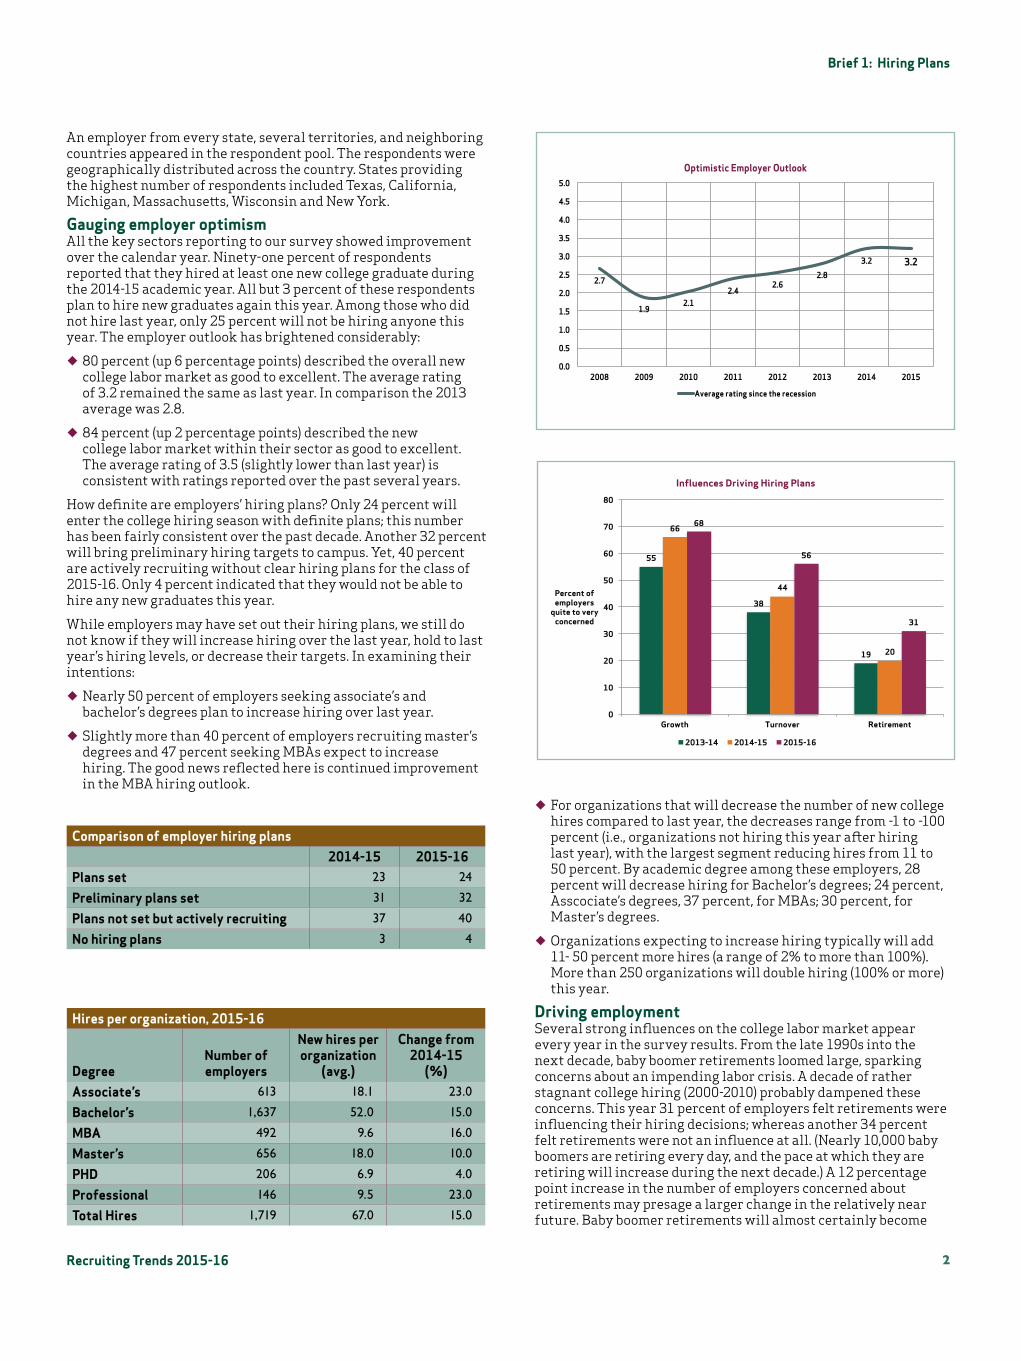
Gauging employer optimism All the key sectors reporting to our survey showed improvement over the calendar year. Ninety-one percent of respondents reported that they hired at least one new college graduate during the 2014-15 academic year. All but 3 percent of these respondents plan to hire new graduates again this year. Among those who did not hire last year, only 25 percent will not be hiring anyone this year. The employer outlook has brightened considerably:
¿ 80 percent (up 6 percentage points) described the overall new college labor market as good to excellent. The average rating of 3.2 remained the same as last year. In comparison the 2013 average was 2.8.
¿ 84 percent (up 2 percentage points) described the new college labor market within their sector as good to excellent. The average rating of 3.5 (slightly lower than last year) is consistent with ratings reported over the past several years.
How definite are employers’ hiring plans? Only 24 percent will enter the college hiring season with definite plans; this number has been fairly consistent over the past decade. Another 32 percent will bring preliminary hiring targets to campus. Yet, 40 percent are actively recruiting without clear hiring plans for the class of 2015-16. Only 4 percent indicated that they would not be able to hire any new graduates this year.
While employers may have set out their hiring plans, we still do not know if they will increase hiring over the last year, hold to last year’s hiring levels, or decrease their targets. In examining their intentions:
¿ Nearly 50 percent of employers seeking associate’s and bachelor’s degrees plan to increase hiring over last year.
¿ Slightly more than 40 percent of employers recruiting master’s degrees and 47 percent seeking MBAs expect to increase hiring. The good news reflected here is continued improvement in the MBA hiring outlook.
¿ For organizations that will decrease the number of new college hires compared to last year, the decreases range from -1 to -100 percent (i.e., organizations not hiring this year after hiring last year), with the largest segment reducing hires from 11 to 50 percent. By academic degree among these employers, 28 percent will decrease hiring for Bachelor’s degrees; 24 percent, Asscociate’s degrees, 37 percent, for MBAs; 30 percent, for Master’s degrees.
¿ Organizations expecting to increase hiring typically will add 11- 50 percent more hires (a range of 2% to more than 100%). More than 250 organizations will double hiring (100% or more) this year.
Driving employmentSeveral strong influences on the college labor market appear every year in the survey results. From the late 1990s into the next decade, baby boomer retirements loomed large, sparking concerns about an impending labor crisis. A decade of rather stagnant college hiring (2000-2010) probably dampened these concerns. This year 31 percent of employers felt retirements were influencing their hiring decisions; whereas another 34 percent felt retirements were not an influence at all. (Nearly 10,000 baby boomers are retiring every day, and the pace at which they are retiring will increase during the next decade.) A 12 percentage point increase in the number of employers concerned about retirements may presage a larger change in the relatively near future. Baby boomer retirements will almost certainly become
Hires per organization, 2015-16
DegreeNumber of employers
New hires per organization
(avg.)
Change from 2014-15
(%)Associate’s 613 18.1 23.0
Bachelor’s 1,637 52.0 15.0
MBA 492 9.6 16.0
Master’s 656 18.0 10.0
PHD 206 6.9 4.0
Professional 146 9.5 23.0
Total Hires 1,719 67.0 15.0
Comparison of employer hiring plans2014-15 2015-16
Plans set 23 24
Preliminary plans set 31 32
Plans not set but actively recruiting 37 40
No hiring plans 3 4
55
38
19
66
44
20
68
56
31
0
10
20
30
40
50
60
70
80
Growth Turnover Retirement
Percent of employers
quite to very concerned
Influences Driving Hiring Plans
2013-14 2014-15 2015-16
2.7
1.9 2.1
2.4 2.6
2.8
3.2 3.2
0.0
0.5
1.0
1.5
2.0
2.5
3.0
3.5
4.0
4.5
5.0
2008 2009 2010 2011 2012 2013 2014 2015
Optimistic Employer Outlook
Average rating since the recession
3Recruiting Trends 2015-16
Brief 1: Hiring Plans
One figure to follow over the five-year rise of the labor market is the average expected hires for bachelor’s degrees. While the mix of employers changes year to year, the large sample size each year affords some stability in this figure. In 2011-12, the average number of expected hires was 26.5 (this sample was skewed toward organizations hiring large numbers). In 2012-13 and 2013-14, the average hovered around 25. This year the average has more than doubled to 52, marking a significant explosion in opportunities.
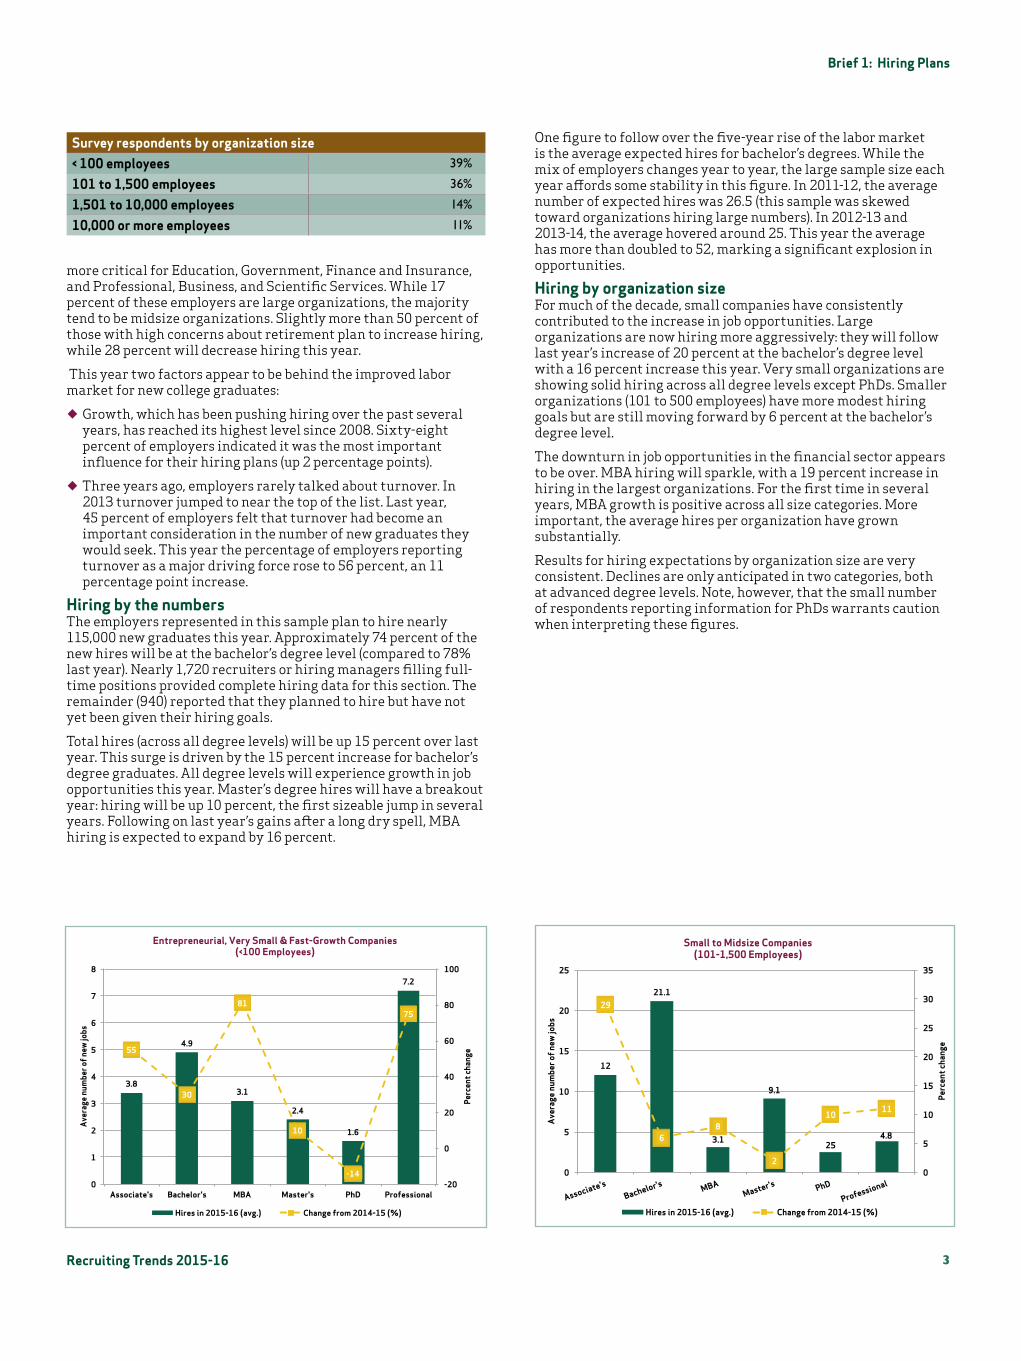
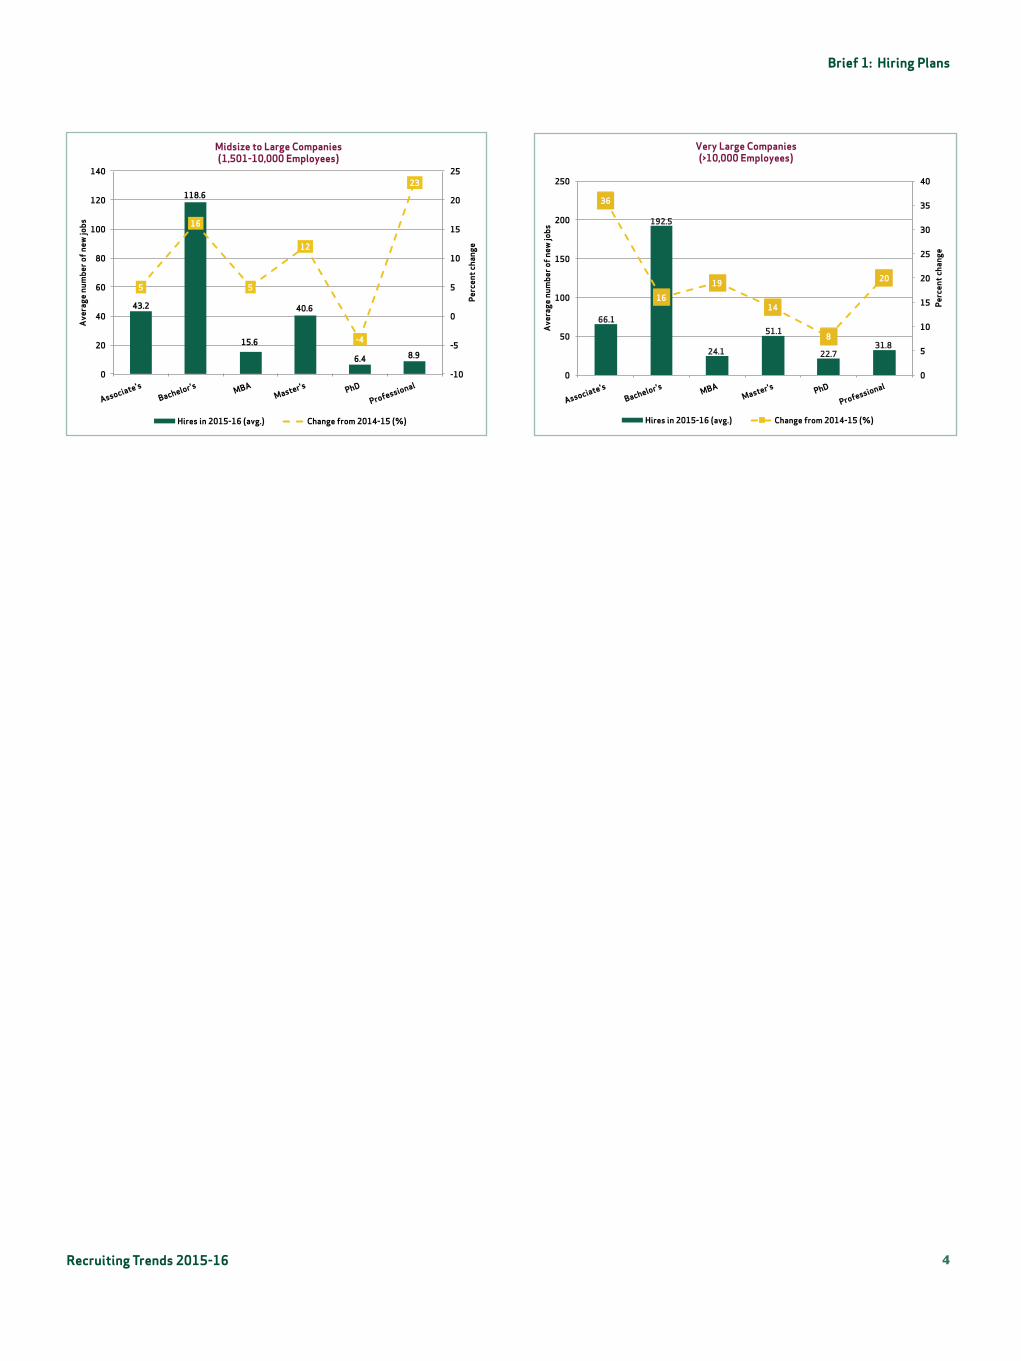
Hiring by organization size For much of the decade, small companies have consistently contributed to the increase in job opportunities. Large organizations are now hiring more aggressively: they will follow last year’s increase of 20 percent at the bachelor’s degree level with a 16 percent increase this year. Very small organizations are showing solid hiring across all degree levels except PhDs. Smaller organizations (101 to 500 employees) have more modest hiring goals but are still moving forward by 6 percent at the bachelor’s degree level.
The downturn in job opportunities in the financial sector appears to be over. MBA hiring will sparkle, with a 19 percent increase in hiring in the largest organizations. For the first time in several years, MBA growth is positive across all size categories. More important, the average hires per organization have grown substantially.
Results for hiring expectations by organization size are very consistent. Declines are only anticipated in two categories, both at advanced degree levels. Note, however, that the small number of respondents reporting information for PhDs warrants caution when interpreting these figures.
more critical for Education, Government, Finance and Insurance, and Professional, Business, and Scientific Services. While 17 percent of these employers are large organizations, the majority tend to be midsize organizations. Slightly more than 50 percent of those with high concerns about retirement plan to increase hiring, while 28 percent will decrease hiring this year.
This year two factors appear to be behind the improved labor market for new college graduates:
¿ Growth, which has been pushing hiring over the past several years, has reached its highest level since 2008. Sixty-eight percent of employers indicated it was the most important influence for their hiring plans (up 2 percentage points).
¿ Three years ago, employers rarely talked about turnover. In 2013 turnover jumped to near the top of the list. Last year, 45 percent of employers felt that turnover had become an important consideration in the number of new graduates they would seek. This year the percentage of employers reporting turnover as a major driving force rose to 56 percent, an 11 percentage point increase.
Hiring by the numbersThe employers represented in this sample plan to hire nearly 115,000 new graduates this year. Approximately 74 percent of the new hires will be at the bachelor’s degree level (compared to 78% last year). Nearly 1,720 recruiters or hiring managers filling full-time positions provided complete hiring data for this section. The remainder (940) reported that they planned to hire but have not yet been given their hiring goals.
Total hires (across all degree levels) will be up 15 percent over last year. This surge is driven by the 15 percent increase for bachelor’s degree graduates. All degree levels will experience growth in job opportunities this year. Master’s degree hires will have a breakout year: hiring will be up 10 percent, the first sizeable jump in several years. Following on last year’s gains after a long dry spell, MBA hiring is expected to expand by 16 percent.
Survey respondents by organization size < 100 employees 39%
101 to 1,500 employees 36%
1,501 to 10,000 employees 14%
10,000 or more employees 11%
3.8
4.9
3.1
2.4
1.6
7.2
55
30
81
10
-14
75
-20
0
20
40
60
80
100
0
1
2
3
4
5
6
7
8
Associate's Bachelor's MBA Master's PhD Professional
Perc
ent c
hang
e
Ave
rage
num
ber o
f new
jobs
Entrepreneurial, Very Small & Fast-Growth Companies (<100 Employees)
Hires in 2015-16 (avg.) Change from 2014-15 (%)
12
21.1
3.1
9.1
25 4.8
29
6 8
2
10 11
0
5
10
15
20
25
30
35
0
5
10
15
20
25
Associate's
Bachelor's MBA
Master's PhD
Professional
Perc
ent c
hang
e
Ave
rage
num
ber o
f new
jobs
Small to Midsize Companies (101-1,500 Employees)
Hires in 2015-16 (avg.) Change from 2014-15 (%)
4Recruiting Trends 2015-16
Brief 1: Hiring Plans
66.1
192.5
24.1
51.1
22.7 31.8
36
16
19
14
8
20
0
5
10
15
20
25
30
35
40
0
50
100
150
200
250
Associate's Bachelor's
MBA Master's PhD
Professional
Perc
ent c
hang
e
Ave
rage
num
ber o
f new
jobs
Very Large Companies (>10,000 Employees)
Hires in 2015-16 (avg.) Change from 2014-15 (%)
43.2
118.6
15.6
40.6
6.4 8.9
5
16
5
12
-4
23
-10
-5
0
5
10
15
20
25
0
20
40
60
80
100
120
140
Associate's
Bachelor's MBA
Master's PhD
Professional
Perc
ent c
hang
e
Ave
rage
num
ber o
f new
jobs
Midsize to Large Companies (1,501-10,000 Employees)
Hires in 2015-16 (avg.) Change from 2014-15 (%)