Embed Size (px)
Citation preview

Journal of Research in Personality 35, 138–167 (2001)doi:10.1006/jrpe.2000.2302, available online at http://www.idealibrary.com on
Refining the Architecture of Aggression: A Measurement Modelfor the Buss–Perry Aggression Questionnaire
Fred B. Bryant and Bruce D. Smith
Loyola University Chicago
Among the most popular measures of aggression is the 29-item, self-report Ag-gression Questionnaire (AQ; Buss & Perry, 1992; Buss & Warren, 2000). Structuralanalyses of the AQ have revealed four underlying factors: Physical Aggression,Verbal Aggression, Anger, and Hostility. However, these four factors explain toolittle common variance (i.e., about 80%) to be an adequate measurement model. Inthe present study, we used confirmatory factor analysis with a total sample of 1154respondents to compare four alternative measurement models for the AQ that arecurrently in use. Replicating earlier work, none of these models fit the data well,and the original four-factor model achieved only mediocre goodness-of-fit in threeindependent samples (GFI 5 .76 2 .81). To develop a more appropriate measure-ment model, we omitted items with low loadings or multiple loadings based onprincipal components analysis and excluded items with reverse-scored wording.This yielded a 12-item, four-factor measurement model with acceptable goodness-of-fit (GFI 5 .94). Secondary analysis of two independent data sets confirmed therefined model’s generalizability for British (Archer, Holloway, & McLoughlin,1995; GFI 5 .93) and Canadian (Harris, 1995; GFI 5 .94) samples. The refinedmodel yielded equivalent factor structures for males and females in all three sam-ples. We also replicated the refined four-factor model in two additional Americansamples, who completed a new short form of the AQ containing only the subset of12 items in random order. Additional analyses provided evidence supporting themodel’s construct validity and demonstrated stronger discriminant validity for therefined Hostility factor compared to its predecessor. The new short form of the AQthus not only contains fewer than half as many items as the original, but also ispsychometrically superior. 2001 Academic Press
The authors thank John Archer and Julie Harris for graciously providing us with data fromtheir published articles. We also gratefully acknowledge the helpful advice of Mary Harris,the invaluable research assistance of Rebecca Guilbault, and the insightful editorial feedbackof Craig Colder and an anonymous reviewer. Earlier versions of this article were presentedat the American Psychological Association convention, Chicago, IL, August 1997, and at theJoint Meeting of the Classification Society of North America and the Psychometric Society,Urbana, IL, June 1998.
Address correspondence and reprint requests to Fred B. Bryant, Department of Psychol-ogy, Loyola University Chicago, 6525 North Sheridan Road, Chicago, IL 60626. E-mail:[email protected].
1380092-6566/01 $35.00Copyright 2001 by Academic PressAll rights of reproduction in any form reserved.

ARCHITECTURE OF AGGRESSION 139
Much work has emphasized the role of physical aggression, verbal aggres-sion, anger, and hostility as subtraits in a global conceptualization of aggres-sion (Buss, 1961; Buss & Durkee, 1957; Buss & Perry, 1992; Harris, 1995;Zillmann, 1979). Early measurement of aggression used an experimentalmethodology, required a laboratory, and suffered difficulties in interpretingaggressive intent (Zillmann, 1979). To reduce the time, effort, and resourcesinvolved in measuring aggression, Buss and Durkee (1957) developed a 75-item self-report instrument, the Buss–Durkee Hostility Inventory, which ag-gression researchers have often used.
To improve the psychometric properties of this instrument, Buss andPerry (1992) more recently developed a 29-item self-report questionnaire,the Aggression Questionnaire (AQ; Buss & Perry, 1992; Buss & Warren,2000). They designed the AQ to measure four dispositional subtraits of ag-gression, which they defined as follows: ‘‘Physical and verbal aggression,which involve hurting or harming others, represent the instrumental or mo-tor component of behavior. Anger, which involves physiological arousaland preparation for aggression, represents the emotional or affective com-ponent of behavior. Hostility, which consists of feelings of ill will and in-justice, represents the cognitive component of behavior’’ (Buss & Perry,1992, p. 457).
In constructing this questionnaire, Buss and Perry (1992) borrowed someitems intact from the earlier Hostility Inventory, revised other Buss–Durkeeitems to improve clarity, and added many new items to generate an initialpool of 52 questions. They then administered this set of 52 questions tothree successive samples of 406, 448, and 399 college students and analyzedthe structure of responses using exploratory principal components analysiswith oblique rotations. Although they had originally generated items for sixa priori components of aggression (Physical Aggression, Verbal Aggression,Anger, Indirect Aggression, Resentment, and Suspicion), only four corre-lated factors emerged—Physical Aggression, Verbal Aggression, Anger, andHostility—on which a core set of 29 items loaded, and this four-factor struc-ture appeared to replicate across all three samples. Buss and Perry (1992)next used confirmatory factor analysis to evaluate the goodness-of-fit of threealternative measurement models for the set of 29 items: (a) a global one-factor model that assumes all items reflect a single general aggression factor;(b) a four-factor model that represents the structure found in the principalcomponents analysis; and (c) a hierarchical factor model that assumes thefour correlated, first-order factors reflect a single, second-order ‘‘super fac-tor’’ of aggression. Figure 1 presents a graphical representation of each ofthese three measurement models.
As a sole measure of each model’s goodness-of-fit, Buss and Perry (1992)computed the ratio of chi-square to degrees of freedom (cf. Hoelter, 1983).Based on the notion that ratios under 2 reflect acceptable fit, Buss and Perry
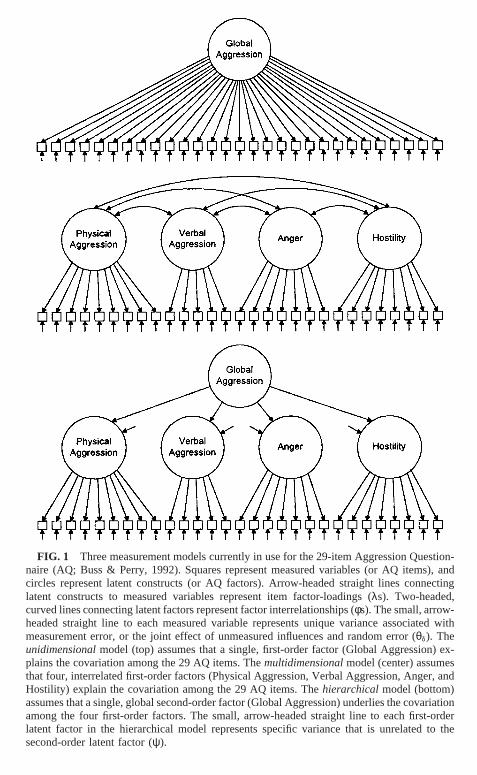
FIG. 1 Three measurement models currently in use for the 29-item Aggression Question-naire (AQ; Buss & Perry, 1992). Squares represent measured variables (or AQ items), andcircles represent latent constructs (or AQ factors). Arrow-headed straight lines connectinglatent constructs to measured variables represent item factor-loadings (λs). Two-headed,curved lines connecting latent factors represent factor interrelationships (φs). The small, arrow-headed straight line to each measured variable represents unique variance associated withmeasurement error, or the joint effect of unmeasured influences and random error (θδ ). Theunidimensional model (top) assumes that a single, first-order factor (Global Aggression) ex-plains the covariation among the 29 AQ items. The multidimensional model (center) assumesthat four, interrelated first-order factors (Physical Aggression, Verbal Aggression, Anger, andHostility) explain the covariation among the 29 AQ items. The hierarchical model (bottom)assumes that a single, global second-order factor (Global Aggression) underlies the covariationamong the four first-order factors. The small, arrow-headed straight line to each first-orderlatent factor in the hierarchical model represents specific variance that is unrelated to thesecond-order latent factor (ψ).

ARCHITECTURE OF AGGRESSION 141
(1992) concluded that both the four-factor model (χ2/df 5 1.94) and thehigher-order factor model (χ2/df 5 1.95) fit the pooled data reasonably well,whereas the one-factor model (χ2/df 5 2.27) did not. Recalculating the modelchi-squares from the known degrees of freedom reveals that both the four-factor model, χ2(371) 5 719.7, and the higher-order model, χ2(373) 5 727.4,fit the data significantly better (both ∆χ2s . 128.3, ps , .00001) than didthe one-factor model, χ2(377) 5 855.8. Because Buss and Perry (1992) re-ported no other goodness-of-fit measures, however, we know nothing aboutthe proportion of variance–covariance information that these models ex-plained in their data or how much better these models fit relative to a worse-case ‘‘null’’ model that assumes there are no common factors. Such measuresof absolute and relative fit would be useful in deciding whether either of themultidimensional frameworks represents an acceptable measurement modelfor the AQ.
Although Buss and Perry (1992) proposed their four-factor solution as ameasurement model for the AQ, more recent analyses (Archer, Kilpatrick, &Bramwell, 1995; Harris, 1995; Williams, Boyd, Cascardi, & Poythress,1996) suggest that this structure explains too little common variance amongthe 29 items (i.e., about 80%) to serve as a measurement model. Accordingly,the primary goal of the present study was to develop an acceptable measure-ment model for the AQ and to assess its construct validity.
As a means of improving the measurement precision of the AQ, previousresearchers have proposed discarding AQ items that are relatively unreliableindicators of Hostility. Indeed, omitting Buss and Perry’s (1992, Table 1,p. 454) sixth and eighth indicators of Hostility has been found to increasethe reliability of the Hostility factor in both Canadian (Harris, 1995) andDutch (Meesters, Muris, Bosma, Schouten, & Beuving, 1996) samples. Yet,this approach is not without its critics (Bernstein & Gesn, 1997). The keytheoretical issue here is whether it is better to have a global, somewhat het-erogeneous construct of known theoretical utility or to have a more specificand psychometrically purified construct (cf. Bryant, Yarnold, & Grimm,1996).
Researchers using the AQ have typically adopted one of two dominantstrategies for scoring the instrument. The first strategy assumes that all AQitems reflect a single underlying construct reflecting a person’s global predis-position toward aggression. With this unidimensional approach, researcherssimply sum responses to the 29 items to construct an AQ total score (e.g.,Buss & Perry, 1992). The second strategy assumes that aggression consistsof four correlated dimensions reflecting a person’s predisposition toward ag-gression in the physical, verbal, emotional (Anger), and cognitive (Hostility)domains. With this multidimensional approach, researchers construct fourseparate subscale scores by summing or averaging responses to the set ofAQ items tapping each domain of aggression (e.g., Felsten & Hill, 1998).

142 BRYANT AND SMITH
Yet, neither of these two approaches adequately captures the variation inpeople’s responses to the AQ. More specifically, measurement error andother constructs in addition to aggression have an unacceptably large influ-ence on responses to the set of 29 AQ items. Although the theoretical modelunderlying the AQ is conceptually well grounded in the aggression literature,researchers need a better operational framework for quantifying responsesto the instrument. With this aim in mind, we sought to improve the correspon-dence between the conceptual and operational definitions underlying the AQand to develop a more reasonable measurement model for the AQ.
We worked with five independent data sets: three primary data sets thatwe collected for this study and two archival data sets that others had collectedearlier. First, we collected a new data set to evaluate and compare the explan-atory power of four different measurement models for the AQ that are cur-rently in use in the literature. We also used these new data to develop abetter-fitting refined version of Buss and Perry’s (1992) four-factor modeland to compare the convergent and discriminant validity of this refined modelwith that of the original. We then obtained two preexisting AQ data sets—a British sample (Archer, Holloway, & McLoughlin, 1995) and a Canadiansample (Harris, 1995)—with which we assessed the cross-sample generaliz-ability of both the original and refined models. Finally, we collected newdata from two additional American samples to evaluate the refined model’sreplicability using a new ‘‘short form’’ of the AQ, containing only the subsetof 12 items in random order.
METHOD
Participants and Procedure
Sample 1. The first sample consisted of new data from 307 American undergraduates (173females, 131 males, and 3 who did not report gender) at a private metropolitan university whovoluntarily participated. Average age was 18.94 (SD 5 1.21). Respondents completed a batteryof tests, including the 29-item Aggression Questionnaire (AQ; Buss & Perry, 1992; Buss &Warren, 2000).
Sample 2. The second sample, which we used for cross-validation, was originally collectedby Archer, Holloway, and McLoughlin (1995). The sample consisted of 200 British undergrad-uates (100 females and 100 males). Average age was 25.13 (SD 5 6.17). Participants com-pleted the 29-item AQ using the same 5-point scale. The data consisted of the raw AQ dataanalyzed by Archer et al. (1995).
Sample 3. The third sample, also used for cross-validation, was originally collected by Harris(1995). The sample consisted of 306 Canadian undergraduates (151 female and 155 male).Average age was comparable to U.S. college samples (cf. Harris, 1995). Participants completedthe 29-item AQ using the same 5-point scale. The data consisted of the covariance matrixanalyzed by Harris (1995).
Sample 4. The fourth sample was used to assess the replicability of the refined four-factormodel using a new ‘‘short form’’ of the AQ. The sample consisted of 171 American undergrad-uates (123 females and 48 males) at a private metropolitan university who voluntarily partici-pated. Average age was 18.35 (SD 5 0.84). Respondents completed a shortened version ofthe AQ containing only the 12 items comprising the refined four-factor measurement model.

ARCHITECTURE OF AGGRESSION 143
Sample 5. The fifth sample was also used to assess the replicability of the refined four-factor model using the new ‘‘short form’’ of the AQ. The sample consisted of 170 Americanundergraduates (124 females and 46 males) at a private metropolitan university who volun-tarily participated. Average age was 18.64 (SD 5 1.57). Respondents completed the shortened12-item version of the AQ.
Aggression Questionnaire
Original AQ. Respondents in Samples 1–3 completed a battery of tests, including the 29-item Aggression Questionnaire (Buss & Perry, 1992; Buss & Warren, 2000). Participants ratedhow well each AQ item described themselves using the original 5-point scale, ranging fromextremely uncharacteristic of me (1) to extremely characteristic of me (5), as defined by theoriginal instrument. Following Buss and Perry’s (1992, p. 453) instructions, each sample re-ceived a different random ordering of the 29 AQ items.
Short form of the AQ. Respondents in Samples 4 and 5 completed a new, shortened versionof the AQ containing only the 12 items comprising the refined four-factor measurement model.Using Buss and Perry’s (1992, p. 454) Table 1, the randomized order of the items was 11,23, 8, 25, 21, 14, 15, 2, 13, 24, 6, and 20. Participants rated each AQ item using a 6-pointscale, ranging from extremely uncharacteristic of me (1) to extremely characteristic of me(6). Changing from the original 5-point scale to a 6-point scale eliminated the scale’s midpoint,thereby forcing respondents to decide whether each statement was characteristic of them. Aresponse scale with an even number of points also better enables researchers to use a median-split on single items to categorize respondents as aggressive versus nonaggressive in specificsituations (cf. Sudman & Bradburn, 1982). As a precedent, Velicer, Govia, Cherico, and Corri-veau (1985) have modified the response scale of the Buss–Durkee Hostility Scale to makethis instrument more reliable.
Criterion Measures
In addition to completing the AQ, a random subset of 180 participants in Sample 1 (70males and 110 females) also filled out a set of criterion measures for use in evaluating theAQ’s construct validity. These criterion measures served as standards for assessing the conver-gent and discriminant validity of the dimensions comprising both Buss and Perry’s originalfour-factor model and the new, refined measurement model for the AQ.
Physical Aggression. As a criterion measure of physical aggression, we used the Assaultsubscale from the Buss–Durkee Hostility Inventory (Buss & Durkee, 1957). Buss (1961) re-ported a 5-week test–retest reliability of .78 for this subscale. As validity evidence, men whohave committed domestic violence score higher on the Assault subscale compared to controls(Maiuro, Cahn, Vitaliano, Wagner, & Zegree, 1988). Although the original Buss–Durkee As-sault subscale consisted of 10 items, we decided to use only those Assault items that had notbeen adapted by Buss and Perry in constructing the AQ. Specifically, 5 Assault subscale itemswere worded almost identically in Buss and Perry’s AQ (Buss–Durkee items 9, 17, 25, 65,and 70). We chose to exclude these items from the Assault subscale because their comparablewording might otherwise spuriously inflate the degree of association between this criterionmeasure and the AQ (cf. Nichols, Licht, & Pearl, 1982).
Verbal Aggression. As a criterion measure of verbal aggression, we used the Verbal Hostilitysubscale of the Buss–Durkee Hostility Inventory (Buss & Durkee, 1957). Buss (1961) reporteda 5-week test–retest reliability of .72 for this subscale. Supporting construct validity, VerbalHostility score is a stronger predictor of hostile content in stories told in response to projectivestimuli (Buss, Fischer, & Simmons, 1962) and of verbal aggression in role-playing responses tofrustrating everyday events (Leibowitz, 1968) compared to the other Buss–Durkee subscales.Although the original Verbal Hostility subscale had 13 items, we omitted 5 of these (Buss–
144 BRYANT AND SMITH
Durkee items 7, 19, 23, 43, and 63) because of their nearly identical wording with AQ itemsto avoid artificially inflating the correlation between the AQ and this criterion measure (cf.Nichols et al., 1982).
Anger Arousal. As a criterion measure of anger, we chose the Anger Arousal subscale ofthe Multidimensional Anger Inventory (MAI; Siegel, 1986). We selected the Anger Arousalsubscale of the MAI as an anger criterion measure because it more closely matches Buss andPerry’s (1992) conceptual definition of anger as involving ‘‘physiological arousal’’ (p. 457)compared to other anger scales and because it has been found to be more reliable than theanger-range, anger-in, and anger-out MAI subscales (Siegel, 1986). Siegel (1986) reportedreliability coefficients for this subscale of .83 for a college sample and .82 for a sample offactory workers. As validity evidence, Siegel (1986) found Anger Arousal scores correlatedsignificantly with the magnitude and duration subscales of the Harburg Anger-In/Anger-OutInventory (Harburg, Erfurt, Hauenstein, Chape, Schull, & Schork, 1973) and with the magni-tude subscale of the Novaco Anger Inventory (Novaco, 1975). Although the original MAIAnger Arousal subscale contained eight items, we used only four of these (MAI items 9, 10,14, and 26) and omitted items with wording that overlapped the Buss–Perry items to avoidartificially inflating the correlation between the AQ and this criterion measure (cf. Nichols etal., 1982).
Hostility. As a criterion measure of global hostility, we chose the Cook–Medley HostilityScale (Ho; Cook & Medley, 1954). Based on a subset of 50 true–false items from the Minne-sota Multiphasic Personality Inventory, the Ho is intended to assess primarily cynicism andparanoid alienation. Scores on this instrument have a 3-year test–retest correlation of .84(Shekelle, Gale, Ostfeld, & Paul, 1983). As evidence of prospective validity, the scale appearsto be an independent predictor of later coronary disease (Barefoot, Dahlstrom, & Williams,1983).
Measurement Models Evaluated in This Study
A systematic literature search uncovered four different measurement models for the AQcurrently in use: (a) a unidimensional ‘‘total score’’ model that assumes a single, global Ag-gression factor explains responses to all 29 AQ items; (b) Buss and Perry’s (1992) originalfour-factor model (Physical Aggression, Verbal Aggression, Anger, and Hostility) for the 29-item AQ; (c) Buss and Perry’s (1992) hierarchical version of this four-factor model that as-sumes a single second-order Aggression factor underlies the covariation among the four first-order factors; and (d) a modified four-factor model for 27 AQ items, consisting of Buss andPerry’s original Physical Aggression, Verbal Aggression, and Anger factors, along with Har-ris’s (1995) reduced Hostility factor (omitting its sixth and eighth indicators).
We also evaluated the goodness-of-fit of two new factor structures that we developed aspotential measurement models for the AQ. The first of these new models consisted of ourrefined version of Buss and Perry’s original four factors for a subset of 12 AQ items. Thesecond new model was a hierarchical version of this refined four-factor model that assumesa single-order Aggression factor underlies the covariation among the four first-order factors.
Overview of Analyses
Our analyses addressed four main questions. (1) Do the existing one-, four-, or hierarchical-factor structures provide an acceptable measurement model for the AQ? To answer this ques-tion, we used confirmatory factor analysis (CFA) to impose each of these factor models onthree different data sets and to evaluate each model’s goodness-of-fit across samples. (2) Ifavailable models prove inadequate, then what might be a more appropriate measurement modelfor the AQ? Here we used principal components analysis to eliminate unreliable AQ itemsin order to develop an acceptable measurement model. (3) Are the same measurement models

ARCHITECTURE OF AGGRESSION 145
warranted for males and females? To address this question, we used multigroup CFA to testhypotheses about the invariance of the refined AQ measurement model with respect to gender.(4) Is there any evidence for the convergent or discriminant validity of the multiple AQ factors?Here we used CFA to test hypotheses about the relationships among the AQ factors and thecriterion measures of aggression.
Analysis Strategy
Stage One. The analysis unfolded in four stages, each using CFA via LISREL 8 (Joreskog &Sorbom, 1996). In Stage One, we began by using the data from Samples 1–3 to examine thefit of the four, existing measurement models for the AQ. To evaluate each model’s goodness-of-fit to the data, we used three measures of absolute fit and two measures of relative fit (cf.Hu & Bentler, 1998). These multiple measures of model fit provide complementary informa-tion about how well a particular model explains the data and should not be construed asredundant (cf. Bollen, 1989; McDonald & Marsh, 1990).
As measures of each model’s absolute fit, we used the ratio of chi-square to degrees offreedom (χ2/df; Hoelter, 1983), the goodness-of-fit index (GFI; Joreskog & Sorbom, 1996),and the root-mean-square error of approximation (RMSEA; Steiger, 1989). Although the firsttwo of these measures of model fit have limited utility (Hu & Bentler, 1998), we have reportedthem in order to maximize the comparability of our results with those of prior researcherswho reported these fit measures for the same models. In judging absolute fit, smaller ratiosof chi-square to degrees of freedom reflect better absolute fit, with ratios near two consideredacceptable (Hoelter, 1983). Analogous to R2 in multiple regression, GFI reflects the proportionof available variation–covariation information in the data that the given model explains, withlarger GFI values representing better model fit. Bentler and Bonett (1980) have suggested thatformal measurement models have a GFI $ .90. RMSEA reflects the size of the residuals thatresult when using the model to predict the data, with smaller values indicating better fit. Ac-cording to Browne and Cudeck (1993), RMSEA of .05 or lower represents ‘‘close fit,’’RMSEA between .05 and .08 represents ‘‘reasonably close fit,’’ and RMSEA above .10 repre-sents ‘‘an unacceptable model.’’ We also directly compared the absolute fit of nested modelsby contrasting their goodness-of-fit chi-square values and computing the p value associatedwith the difference in these nested chi-squares (with accompanying difference in degrees offreedom).
As measures of each model’s relative fit, we used the comparative fit index (CFI; Bentler,1990) and the nonnormed fit index (NNFI; Bentler & Bonett, 1980; Tucker & Lewis, 1973).We have chosen to report these particular measures because they have more desirable psycho-metric properties than other measures of relative fit (Bentler, 1990; Hu & Bentler, 1998; Marsh,Balla, & Hau, 1996; McDonald & Marsh, 1990). Each of these two relative fit measures usesa different formula to contrast the goodness-of-fit chi-square of a given model with that of a‘‘null’’ model, which assumes sampling error alone explains the covariation among observedmeasures (i.e., that there is no common variance among the AQ items). For each relative fitindex, larger values represent better fit, with values of .90 or higher considered acceptable(Bentler & Bonett, 1980).
Stage Two. Given the poor fit of the unidimensional and multidimensional models, wesought to develop a better-fitting, refined measurement model in Stage Two of the analysis.Stage Two consisted of four phases. In the first phase (model refinement), we subjected thedata of Sample 1 to a principal components analysis (PCA) with oblique rotation in order toexplore the structure underlying the AQ. Extracting four factors, we looked for items withlow communalities or multiple loadings across factors to identify questions that are unreliableindicators of aggression or that reflect more than one dimension of aggression. We also decidedto omit items that are reverse-scored because we wanted the refined measurement model touse only indicators that reflect the endorsement of aggression rather than the rejection of

146 BRYANT AND SMITH
nonaggression. This latter approach has been useful in refining measurement models for otherconstructs, such as affect intensity (Bryant et al., 1996).
In the second phase of Stage Two (model evaluation), we used CFA to impose a parsimoni-ous confirmatory version of this new measurement model on the data of Samples 1–3, usingthe refined subset of AQ items. We also evaluated a hierarchical form of this model in whicha single, second-order factor explained the relationships among the four first-order factors. Inaddition, we used multigroup CFA to evaluate the generalizability of these refined measure-ment models across Samples 1–3. In these multigroup analyses, we contrasted the goodness-of-fit chi-squares of two nested CFA models: one constraining the magnitudes of the factorloadings to be equal for all three samples and the other omitting this invariance constraint.A statistically significant difference in the chi-square values of these two models (∆χ2) indi-cates that the given model yields different factor loadings across samples (cf. Bryant & Baxter,1997; Bryant & Yarnold, 1995). Given a significant overall structural difference, we usedmultigroup CFA with equality constraints to pinpoint the specific items responsible for cross-sample differences. In accordance with standard practice in the structural equation modelingliterature, all multigroup analyses were performed using covariance matrices as input (cf.Joreskog & Sorbom, 1996).
In the third phase of Stage Two, for comparison purposes we tested a condensed, alternativeform of Buss and Perry’s (1992) original four-factor that preserved the full range of itemcontent while reducing the number of indicators per factor. Here we used a ‘‘partial disaggrega-tion’’ approach (Bagozzi & Edwards, 1998; Bagozzi & Heatherton, 1994; Hull, Lehn, & Ted-lie, 1991) to reconfigure Buss and Perry’s (1992) original ‘‘total disaggregation’’ model (whichhad nine indicators for PA, five indicators for VA, seven indicators for ANG, and eight indica-tors for HO) in terms of three indicators for each latent variable. This entailed parceling indi-vidual items into composite indicators for each factor, so as to modify the ‘‘atomistic’’ originalmodel into a more ‘‘molecular’’ form. As Bagozzi and Heatherton (1994) have noted, CFAmodels containing more than about five measures per factor are unlikely to fit the data satisfac-torily. For this reason, we sought to test the goodness-of-fit of a condensed form of Buss andPerry’s original four-factor model and to evaluate its cross-sample generalizability.
In the fourth phase of Stage Two (testing gender invariance), we used multigroup CFA todetermine whether the refined measurement models provided an equivalent goodness-of-fit tothe data of males and females in Samples 1 and 2. This involved contrasting the goodness-of-fit chi-squares of two nested CFA models: one constraining the magnitudes of the factorloadings to be equal for males and females and the other omitting this invariance constraint.A statistically significant difference in the chi-square values of these two models (∆χ2) indi-cates that the given model yields different factor loadings for men and women (cf. Bryant &Baxter, 1997; Bryant & Yarnold, 1995). Given a significant overall structural difference, weused multigroup CFA with equality constraints to pinpoint the specific items responsible forgender differences. Again, all multigroup analyses were performed on covariance matrices(cf. Joreskog & Sorbom, 1996).
Stage Three. In Stage Three of the analysis, we evaluated and compared the convergentand discriminant validity of the refined and original versions of the four-factor model. Herewe used CFA with equality constraints to determine whether each of the four AQ factorsshowed a stronger relationship with the criterion measure to which it is presumed to correspondthan with the other criterion measures.
Stage Four. Having established the cross-sample generalizability of the refined measurementmodel, we sought to reconfirm it in the final stage of the analysis using a new ‘‘short form’’of the AQ, which contains only the refined subset of 12 items. Here we used CFA to imposethe refined measurement model on the data of Samples 4 and 5, who completed this new,short form of the AQ. We also used multigroup CFA to assess the generalizability of therefined measurement model across Samples 4 and 5 as well as the model’s invariance withrespect to gender in both of these samples.

ARCHITECTURE OF AGGRESSION 147
RESULTS AND DISCUSSION
Stage One: Assessing Current Measurement Models
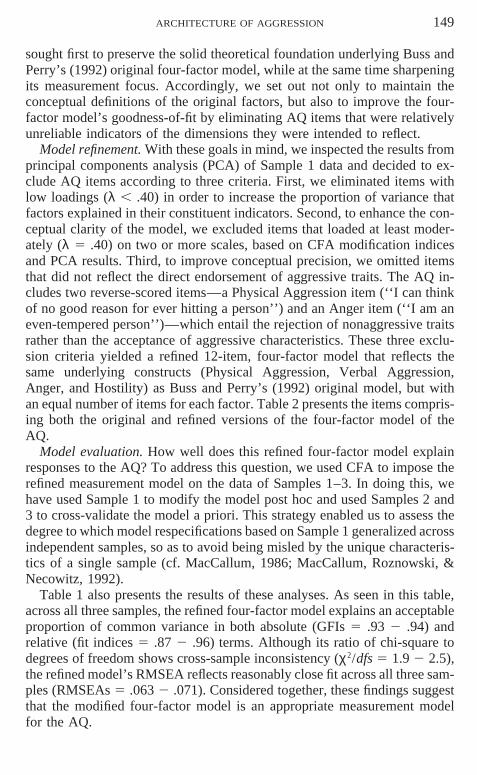
We used CFA first to evaluate the goodness-of-fit of the four alternativemeasurement models currently in the literature, using the AQ data of Sam-ples 1–3. Which model, if any, provides the most reasonable representationof responses to this instrument? Table 1 presents the results of these analyses.Across all three samples, the explanatory power of existing measurementmodels fell short of accepted standards. First, a single ‘‘AQ total score’’provided an inadequate measurement model for Samples 1–3, leaving toomuch common variance unexplained in both an absolute (GFIs 5 .65 2 .70)and relative (fit indices 5 .59 2 .66) sense. For all three samples, this one-factor model also had a relatively high ratio of chi-square to degrees of free-dom (χ2/dfs 5 3.4 2 4.2) and an unacceptably large, root-mean-square errorof approximation (RMSEAs 5 .098 2 .109). These findings support theAQ’s multidimensionality.
Yet, none of the multidimensional models currently available provides anacceptable measurement model for the AQ. Both Buss and Perry’s (1992)original four-factor model and its hierarchical counterpart fit the data of allthree samples better than the unidimensional model, all ∆χ2s(6) . 379.2, ps, .0001. However, for all three samples, each of these multifactor structuresfails to achieve sufficient goodness-of-fit to be an acceptable measurementmodel in both absolute (GFIs 5.76 2 .81) and relative (fit indices 5 .76 2.82) terms. Furthermore, the chi-square to degrees of freedom ratios for thesemodels (χ2/dfs 5 2.4 2 2.8) show ‘‘a poor fit’’ (Buss & Perry, 1992, p. 454),and their RMSEAs show room for improvement (RMSEAs 5 .072 2 .084).Evidently, current measurement models of the AQ operationalize underlyingsubtraits of aggression in ways that do not correspond closely enough to theconceptual framework that Buss and Perry (1995) intended. This conclusionis consistent with those of previous researchers (e.g., Archer, Kilpatrick, &Bramwell, 1995; Harris, 1995; Williams et al., 1996) who have noted theinadequacy of existing factor models for the AQ.
Imposed on the data of Samples 1–3, the four-factor model containingHarris’s (1995) condensed Hostility factor fared little better (see Table 1).Although this modified model was a significant improvement in fit over theoriginal four-factor model for all three samples, all ∆χ2(53)s . 143.6, p ,.0001, it nevertheless fell short of accepted standards for a formal measure-ment in both an absolute (GFIs 5 .78 2 .83) and relative (fit indices 5.79 2 .83) sense. Taken as a whole, this evidence underscores the need fora better fitting measurement model for the AQ.
Stage Two: Developing a Better Fitting Measurement Model
What might a more appropriate measurement model look like, and howshould we best go about developing it? In answering these questions, we
148 BRYANT AND SMITH
TA
BL
E1
Goo
dnes
s-of
-Fit
Stat
istic
sfo
rV
ario
usM
easu
rem
ent
Mod
els
ofth
eA
QIm
pose
don
Sam
ples
1–3
Rel
ativ
eA
bsol
ute
fitm
easu
res
fitm
easu
res
Mod
elN
o.ite
ms
Sam
ple
χ2df
χ2 /df
GFI
RM
SEA
CFI
NN
FI
One
-fac
tor
291
1567
.937
74.
2.7
0.1
02.6
6.6
4(t
otal
scor
e)2
1267
.837
73.
4.6
5.1
09.6
2.5
93
1469
.137
73.
9.6
8.0
98.6
6.6
3B
uss
&Pe
rry’
s29
110
42.8
371
2.8
.81
.077
.81
.79
four
fact
ors:
288
6.4
371
2.4
.76
.084
.78
.76
PA,
VA
,A
NG
,H
O3
950.
337
12.
6.8
1.0
72.8
2.8
0B
uss
&Pe
rry’
s29
110
46.4
373
2.8
.81
.077
.81
.79
hier
arch
ical
mod
el:
288
8.5
373
2.4
.76
.083
.78
.76
one
seco
nd-o
rder
fact
or3
969.
637
32.
6.8
1.0
72.8
1.8
0B
uss
&Pe
rry’
s27
188
1.9
318
2.9
.82
.076
.83
.82
PA,
VA
,A
NG
,&
273
4.2
318
2.3
.78
.081
.81
.79
Har
ris’
sH
Ofa
ctor
380
6.6
318
2.5
.83
.071
.83
.81
Four
refin
edfa
ctor
s:12
110
5.7
482.
2.9
4.0
63.9
6.9
4PA
,V
A,
AN
G,
HO
292
.448
1.9
.93
.068
.95
.93
312
1.7
482.
5.9
4.0
71.9
1.8
7R
efine
dhi
erar
chic
al12
110
8.5
502.
2.9
4.0
62.9
6.9
4m
odel
:2
94.4
501.
9.9
3.0
67.9
5.9
3on
ese
cond
-ord
erfa
ctor
313
3.6
502.
7.9
3.0
74.9
0.8
6
Not
e.PA
5Ph
ysic
alA
ggre
ssio
n;V
A5
Ver
balA
ggre
ssio
n;A
NG
5A
nger
;HO
5H
ostil
ity;G
FI5
good
ness
-of-
fitin
dex
(Jor
esko
g&
Sorb
om,
1996
);R
MSE
A5
root
-mea
n-sq
uare
erro
rof
appr
oxim
atio
n(S
teig
er,
1989
);C
FI5
com
para
tive
fitin
dex
(Ben
tler,
1990
);N
NFI
5no
nnor
med
fitin
dex
(Ben
tler
&B
onet
t,19
80).
Sam
ple
15
307
Am
eric
anun
derg
radu
ates
;Sa
mpl
e2
520
0B
ritis
hun
derg
radu
ates
(Arc
her,
Hol
low
ay,
&M
cLou
ghlin
,19
95);
Sam
ple
35
306
Can
adia
nun
derg
radu
ates
(Har
ris,
1995
).T
heab
ove
good
ness
-of-
fitst
atis
tics
are
from
anal
yses
cond
ucte
dvi
aL
ISR
EL
8(J
ores
kog
&So
rbom
,19
96).
ARCHITECTURE OF AGGRESSION 149
sought first to preserve the solid theoretical foundation underlying Buss andPerry’s (1992) original four-factor model, while at the same time sharpeningits measurement focus. Accordingly, we set out not only to maintain theconceptual definitions of the original factors, but also to improve the four-factor model’s goodness-of-fit by eliminating AQ items that were relativelyunreliable indicators of the dimensions they were intended to reflect.
Model refinement. With these goals in mind, we inspected the results fromprincipal components analysis (PCA) of Sample 1 data and decided to ex-clude AQ items according to three criteria. First, we eliminated items withlow loadings (λ , .40) in order to increase the proportion of variance thatfactors explained in their constituent indicators. Second, to enhance the con-ceptual clarity of the model, we excluded items that loaded at least moder-ately (λ 5 .40) on two or more scales, based on CFA modification indicesand PCA results. Third, to improve conceptual precision, we omitted itemsthat did not reflect the direct endorsement of aggressive traits. The AQ in-cludes two reverse-scored items—a Physical Aggression item (‘‘I can thinkof no good reason for ever hitting a person’’) and an Anger item (‘‘I am aneven-tempered person’’)—which entail the rejection of nonaggressive traitsrather than the acceptance of aggressive characteristics. These three exclu-sion criteria yielded a refined 12-item, four-factor model that reflects thesame underlying constructs (Physical Aggression, Verbal Aggression,Anger, and Hostility) as Buss and Perry’s (1992) original model, but withan equal number of items for each factor. Table 2 presents the items compris-ing both the original and refined versions of the four-factor model of theAQ.
Model evaluation. How well does this refined four-factor model explainresponses to the AQ? To address this question, we used CFA to impose therefined measurement model on the data of Samples 1–3. In doing this, wehave used Sample 1 to modify the model post hoc and used Samples 2 and3 to cross-validate the model a priori. This strategy enabled us to assess thedegree to which model respecifications based on Sample 1 generalized acrossindependent samples, so as to avoid being misled by the unique characteris-tics of a single sample (cf. MacCallum, 1986; MacCallum, Roznowski, &Necowitz, 1992).
Table 1 also presents the results of these analyses. As seen in this table,across all three samples, the refined four-factor model explains an acceptableproportion of common variance in both absolute (GFIs 5 .93 2 .94) andrelative (fit indices 5 .87 2 .96) terms. Although its ratio of chi-square todegrees of freedom shows cross-sample inconsistency (χ2/dfs 5 1.9 2 2.5),the refined model’s RMSEA reflects reasonably close fit across all three sam-ples (RMSEAs 5 .063 2 .071). Considered together, these findings suggestthat the modified four-factor model is an appropriate measurement modelfor the AQ.

150 BRYANT AND SMITH
TABLE 2Items Constituting the Original and Refined Measurement Models of the AQ
Factor Constituent items
Physical Aggression 1. Once in a while I can’t control the urge to hit another person.2. Given enough provocation, I may hit another person.3. If somebody hits me, I hit back.4. I get into fights a little more than the average person.5. If I have to resort to violence to protect my rights, I will.6. There are people who pushed me so far that we came to
blows.7. I can think of no good reason for ever hitting a person.
[reverse-scored]8. I have threatened people I know.9. I have become so mad that I have broken things.
Verbal Aggression 10. I tell my friends openly when I disagree with them.11. I often find myself disagreeing with people.12. When people annoy me, I may tell them what I think of them.13. I can’t help getting into arguments when people disagree
with me.14. My friends say that I’m somewhat argumentative.
Anger 15. I flare up quickly but get over it quickly.16. When frustrated, I let my irritation show.17. I sometimes feel like a powder keg ready to explode.18. I am an even-tempered person. [reverse-scored]19. Some of my friends think I’m a hothead.20. Sometimes I fly off the handle for no good reason.21. I have trouble controlling my temper.
Hostility 22. I am sometimes eaten up with jealousy.23. At times I feel I have gotten a raw deal out of life.24. Other people always seem to get the breaks.25. I wonder why sometimes I feel so bitter about things.26. I know that ‘‘friends’’ talk about me behind my back.27. I am suspicious of overly friendly strangers.28. I sometimes feel that people are laughing at me behind my
back.29. When people are especially nice, I wonder what they want.
Note: The 29 items constituting the original four-factor model for the Aggression Question-naire (AQ) are listed in the order presented by Buss and Perry (1992, Table 1, p. 454). Bussand Perry (1992) instructed researchers to randomly order the above items when administeringthe AQ. The order of the 29 AQ items for Sample 1 was 26, 15, 11, 10, 16, 27, 2, 4, 29, 12,21, 13, 14, 8, 5, 22, 28, 7, 20, 6, 25, 19, 23, 3, 24, 1, 9, 17, and 18. Items in bold comprisethe refined four-factor measurement model. The randomized order of these questions in the12-item short form of the AQ is 11, 23, 8, 25, 21, 14, 15, 2, 13, 24, 6, and 20. From ‘‘TheAggression Questionnaire,’’ by A. H. Buss and M. Perry, 1992, Journal of Personality andSocial Psychology, 63, p. 454 (Table 1). Copyright by the American Psychological Associa-tion. Adapted with permission.

ARCHITECTURE OF AGGRESSION 151
Results converge on an identical conclusion concerning the hierarchicalversion of this refined model. Specifically, a model specifying a single, over-arching second-order aggression trait that explains the covariation amongthe four first-order factors fit the data of all three samples reasonably well,both absolutely (GFIs 5 .93 2 .94) and relatively (fit indices 5 .86 2 .96).This hierarchical model also showed chi-square to degrees of freedom ratios(χ2/dfs 5 1.9 2 2.7) and RMSEAs (5 .062 2 .074) comparable to thoseof the refined four-factor model across the three samples. Thus, both therefined four-factor model and its hierarchical counterpart represent accept-able measurement models for the AQ.
Testing cross-sample generalizability. Having identified an appropriatemeasurement structure, we next used multigroup CFA to evaluate the cross-sample generalizability of the four-factor model more systematically. Weconsidered first the question of whether the refined four-factor model pro-duces the same factor loadings across the three samples. In other words, doPhysical Aggression, Verbal Aggression, Anger, and Hostility have the samemeanings for American (Sample 1), British (Sample 2), and Canadian (Sam-ple 3) undergraduates?
Table 3 presents the loadings for the four-factor model imposed on thedata of each sample. An initial omnibus test revealed that the magnitudesof these factor loadings varied across samples, ∆χ2(16, n 5 813) 5 29.3,p , .022. Following up the omnibus test, only Samples 1 and 3 showedsignificant differences in factor loadings, ∆χ2(8, n 5 613) 5 24.3, p , .003,whereas loadings were equivalent for Samples 1 and 2, ∆χ2(8, n 5 507) 511.1, p . .19; and Samples 2 and 3, ∆χ2(8, n 5 506) 5 7.7, p . .46. Addi-tional multigroup CFAs disclosed that only one factor loading actually dif-fered significantly for Samples 1 and 3—the loading for Anger item 1 (‘‘Iflare up quickly but get over it quickly’’) was stronger for the Canadiansample, ∆χ2(1, n 5 613) 5 13.8, p , .0003—and all other loadings for thefour-factor model were statistically comparable, ∆χ2(7, n 5 613) 5 12.5,p . .09. Supporting this conclusion, a model that constrains (a) all factorloadings except Anger item 1 to be equal across Samples 1–3 and (b) Angeritem 1 to load equally for Samples 1 and 2 but not for Sample 3 fit the dataof the three samples no worse than a multigroup model with no equalityconstraints, ∆χ2(15, n 5 813) 5 19.5, p . .19. These results indicate thatthe loadings of the four-factor model are largely (11/12 5 92%) invariantacross the three samples; they also suggest that the meaning of aggression,as defined by the refined measurement model, holds across culture.
The same cannot be said of Buss and Perry’s (1992) original four-factormodel, which produced nonequivalent loadings for all three samples, ∆χ2(50,n 5 813) 5 554.8, p , .0001. Indeed, the original four-factor model yieldedstrong differences in loadings when comparing Samples 1 and 2, ∆χ2(25,n 5 507) 5 67.6, p , .0001; Samples 2 and 3, ∆χ2(25, n 5 506) 5 634.4,

152 BRYANT AND SMITH
TA
BL
E3
CFA
Fact
orL
oadi
ngs
for
the
Refi
ned
12-I
tem
,Fo
ur-F
acto
rM
easu
rem
ent
Mod
elof
the
AQ
PAV
AA
NG
HO
sam
ple
sam
ple
sam
ple
sam
ple
AQ
item
s1
23
12
31
23
12
3
2.G
iven
enou
ghpr
ovoc
atio
n,I
may
hit
anot
her
pers
on.
7670
586.
The
rear
epe
ople
who
push
edm
eso
far
that
we
cam
eto
blow
s.72
7365
8.I
have
thre
aten
edpe
ople
Ikn
ow.
8082
6811
.I
ofte
nfin
dm
ysel
fdi
sagr
eein
gw
ithpe
ople
.80
7570
13.
Ica
n’t
help
getti
ngin
toar
gum
ents
whe
npe
ople
disa
gree
with
me.
8271
6814
.M
yfr
iend
ssa
yth
atI’
mso
mew
hat
argu
men
tativ
e.58
6176
15.
Ifla
reup
quic
kly
but
get
over
itqu
ickl
y.50
6269
20.
Som
etim
esI
flyof
fth
eha
ndle
for
nogo
odre
ason
8183
5721
.I
have
trou
ble
coun
trol
ling
my
tem
per.
7171
3423
.A
ttim
esI
feel
Iha
vego
tten
ara
wde
alou
tof
life.
6576
4524
.O
ther
peop
leal
way
sse
emto
get
the
brea
ks.
7775
6425
.I
won
der
why
som
etim
esI
feel
sobi
tter
abou
tth
ings
.68
6852
Not
e.PA
5Ph
ysic
alA
ggre
ssio
n;V
A5
Ver
bal
Agg
ress
ion;
AN
G5
Ang
er;
HO
5H
ostil
ity.
Dec
imal
poin
tsar
eom
itted
.It
emnu
mbe
rsin
pare
nthe
ses
refe
rto
the
orig
inal
orde
ring
ofite
ms
inB
uss
and
Perr
y’s
(199
2,p.
454)
Tab
le1.
Bla
nklo
adin
gsw
ere
fixed
atze
ro.
The
load
ings
ofite
ms
2,14
,20
,an
d23
wer
efix
edat
unst
anda
rdiz
edva
lues
of1.
0to
scal
eth
ela
tent
vari
able
sin
mul
tigro
upco
nfirm
ator
yan
alys
es.

ARCHITECTURE OF AGGRESSION 153
p , .0001; and Samples 1 and 3, ∆χ2(25, n 5 613) 5 126.9, p , .0001.Clearly, the refined measurement model is superior to the original in termsof both its goodness-of-fit and its cross-cultural generalizability.
Comparing the refined hierarchical model across samples, the second-order Aggression factor had the same relationships with the four first-orderfactors in Samples 1 and 2, χ2(3, n 5 507) 5 0.6, p . .89; but the Aggression‘‘super factor’’ had less to do with Anger in Canadian Sample 3 comparedto American Sample 1, χ2(1, n 5 613) 5 25.5, p , .0001; and British Sample2, χ2(1, n 5 506) 5 24.6, p , .0001 (see Table 4). These results are consis-tent with the earlier finding that the four-factor model fits the data of Sample3 better than the hierarchical model.
Comparing the original hierarchical model across samples, the second-order Aggression factor had the same relationships with the four first-orderfactors in Samples 1 and 2, χ2(3, n 5 507) 5 1.9, p . .59; but the Aggression‘‘super factor’’ had less to do with Anger in Canadian Sample 3 comparedto American Sample 1, χ2(1, n 5 613) 5 22.6, p , .00005; and BritishSample 2, χ2(1, n 5 506) 5 28.8, p , .00001 (see Table 4). Unlike therefined hierarchical model, however, second-order Aggression also had moreto do with Hostility in Canadian Sample 3 compared to the American Sample1, χ2(1, n 5 613) 5 34.0, p , .00001; and British Sample 2, χ2(1, n 5 506)5 16.6, p , .0009 (see Table 4). Thus, the refined second-order CFA modelshowed stronger cross-cultural generalizability than did the original second-order CFA model.
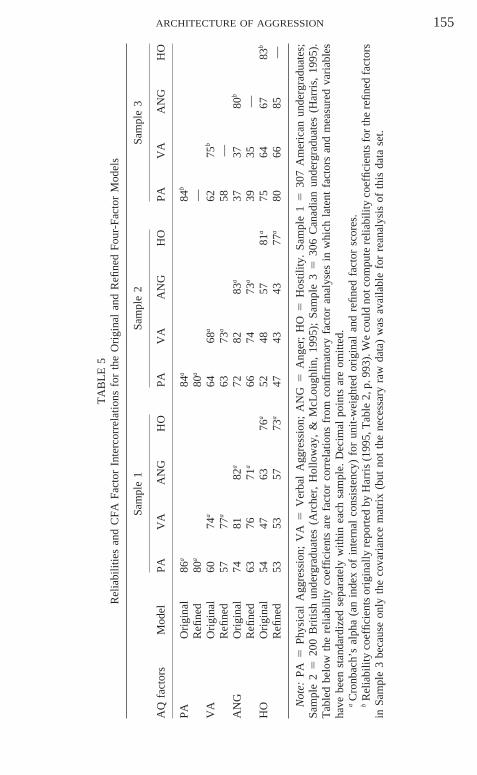
We also addressed the question of whether the four factors comprisingthe refined model interrelate in the same ways for the American, British, andCanadian samples. Table 5 presents the reliabilities and factor intercorrela-tions for this model imposed on the data of Samples 1–3. Using the modelwith partially invariant loadings as a baseline (cf. Byrne, Shavelson, & Mu-then, 1989), the refined four-factor model produced different factor correla-tions for the three samples, ∆χ2(12, n 5 813) 5 65.3, p , .0001. AlthoughSamples 1 and 2 had equivalent factor intercorrelations, ∆χ2(6, n 5 507) 53.1, p . .79; Sample 3 had different factor intercorrelations compared toSample 1, ∆χ2(6, n 5 613) 5 53.1, p , .0001; and Sample 2, ∆χ2(6, n 5506) 5 46.3, p , .0001. Thus, the four refined AQ factors interrelated differ-ently among the Canadian sample than among the American and Britishsamples.
Although the correlation between Physical and Verbal Aggression wasthe same in all three samples, ∆χ2(2) 5 4.2, p . .12, Physical Aggressioncorrelated more strongly with Anger in the Canadian sample than in the othertwo samples, both ∆χ2(1)s . 5.1, ps , .025. For the Canadian sample, Ver-bal Aggression also correlated more strongly with Anger, both ∆χ2(1)s .14.0, ps , .002; but Hostility correlated less strongly with Physical Ag-gression, both ∆χ2(1)s . 9.2, ps , .0025, with Verbal Aggression, both
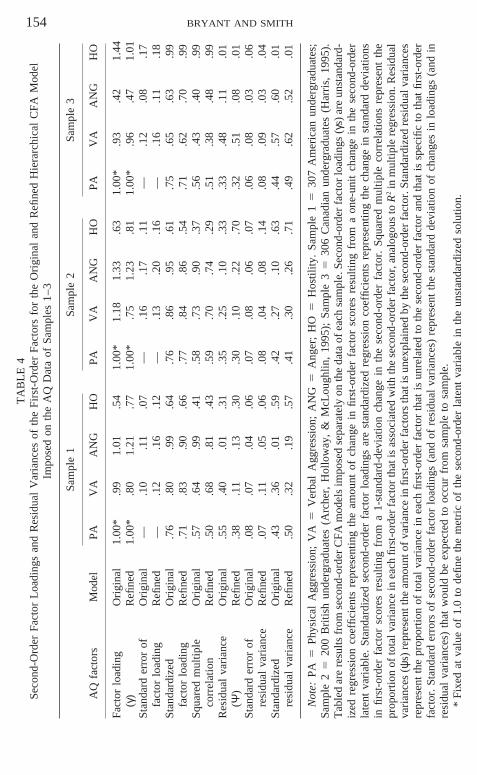
154 BRYANT AND SMITHT
AB
LE
4Se
cond
-Ord
erFa
ctor
Loa
ding
san
dR
esid
ual
Var
ianc
esof
the
Firs
t-O
rder
Fact
ors
for
the
Ori
gina
lan
dR
efine
dH
iera
rchi
cal
CFA
Mod
elIm
pose
don
the
AQ
Dat
aof
Sam
ples
1–3
Sam
ple
1Sa
mpl
e2
Sam
ple
3
AQ
fact
ors
Mod
elPA
VA
AN
GH
OPA
VA
AN
GH
OPA
VA
AN
GH
O
Fact
orlo
adin
gO
rigi
nal
1.00
*.9
91.
01.5
41.
00*
1.18
1.33
.63
1.00
*.9
3.4
21.
44(γ
)R
efine
d1.
00*
.80
1.21
.77
1.00
*.7
51.
23.8
11.
00*
.96
.47
1.01
Stan
dard
erro
rof
Ori
gina
l—
.10
.11
.07
—.1
6.1
7.1
1—
.12
.08
.17
fact
orlo
adin
gR
efine
d—
.12
.16
.12
—.1
3.2
0.1
6—
.16
.11
.18
Stan
dard
ized
Ori
gina
l.7
6.8
0.9
9.6
4.7
6.8
6.9
5.6
1.7
5.6
5.6
3.9
9fa
ctor
load
ing
Refi
ned
.71
.83
.90
.66
.77
.84
.86
.54
.71
.62
.70
.99
Squa
red
mul
tiple
Ori
gina
l.5
7.6
4.9
9.4
1.5
8.7
3.9
0.3
7.5
6.4
3.4
0.9
9co
rrel
atio
nR
efine
d.5
0.6
8.8
1.4
3.5
9.7
0.7
4.2
9.5
1.3
8.4
8.9
9R
esid
ual
vari
ance
Ori
gina
l.5
5.4
0.0
1.3
1.3
5.2
5.1
0.3
3.3
3.4
8.1
1.0
1(Ψ
)R
efine
d.3
8.1
1.1
3.3
0.3
0.1
0.2
2.7
0.3
2.5
1.0
8.0
1St
anda
rder
ror
ofO
rigi
nal
.08
.07
.04
.06
.07
.08
.06
.07
.06
.08
.03
.06
resi
dual
vari
ance
Refi
ned
.07
.11
.05
.06
.08
.04
.08
.14
.08
.09
.03
.04
Stan
dard
ized
Ori
gina
l.4
3.3
6.0
1.5
9.4
2.2
7.1
0.6
3.4
4.5
7.6
0.0
1re
sidu
alva
rian
ceR
efine
d.5
0.3
2.1
9.5
7.4
1.3
0.2
6.7
1.4
9.6
2.5
2.0
1
Not
e:PA
5Ph
ysic
alA
ggre
ssio
n;V
A5
Ver
bal
Agg
ress
ion;
AN
G5
Ang
er;
HO
5H
ostil
ity.
Sam
ple
15
307
Am
eric
anun
derg
radu
ates
;Sa
mpl
e2
520
0B
ritis
hun
derg
radu
ates
(Arc
her,
Hol
low
ay,
&M
cLou
ghlin
,19
95);
Sam
ple
35
306
Can
adia
nun
derg
radu
ates
(Har
ris,
1995
).T
able
dar
ere
sults
from
seco
nd-o
rder
CFA
mod
els
impo
sed
sepa
rate
lyon
the
data
ofea
chsa
mpl
e.Se
cond
-ord
erfa
ctor
load
ings
(γs)
are
unst
anda
rd-
ized
regr
essi
onco
effic
ient
sre
pres
entin
gth
eam
ount
ofch
ange
infir
st-o
rder
fact
orsc
ores
resu
lting
from
aon
e-un
itch
ange
inth
ese
cond
-ord
erla
tent
vari
able
.St
anda
rdiz
edse
cond
-ord
erfa
ctor
load
ings
are
stan
dard
ized
regr
essi
onco
effic
ient
sre
pres
entin
gth
ech
ange
inst
anda
rdde
viat
ions
infir
st-o
rder
fact
orsc
ores
resu
lting
from
a1-
stan
dard
-dev
iatio
nch
ange
inth
ese
cond
-ord
erfa
ctor
.Sq
uare
dm
ultip
leco
rrel
atio
nsre
pres
ent
the
prop
ortio
nof
tota
lvar
ianc
ein
each
first
-ord
erfa
ctor
that
isas
soci
ated
with
the
seco
nd-o
rder
fact
or,a
nalo
gous
toR
2in
mul
tiple
regr
essi
on.R
esid
ual
vari
ance
s(ψ
s)re
pres
entt
heam
ount
ofva
rian
cein
first
-ord
erfa
ctor
sth
atis
unex
plai
ned
byth
ese
cond
-ord
erfa
ctor
.Sta
ndar
dize
dre
sidu
alva
rian
ces
repr
esen
tth
epr
opor
tion
ofto
tal
vari
ance
inea
chfir
st-o
rder
fact
orth
atis
unre
late
dto
the
seco
nd-o
rder
fact
oran
dth
atis
spec
ific
toth
atfir
st-o
rder
fact
or.S
tand
ard
erro
rsof
seco
nd-o
rder
fact
orlo
adin
gs(a
ndof
resi
dual
vari
ance
s)re
pres
ent
the
stan
dard
devi
atio
nof
chan
ges
inlo
adin
gs(a
ndin
resi
dual
vari
ance
s)th
atw
ould
beex
pect
edto
occu
rfr
omsa
mpl
eto
sam
ple.
*Fi
xed
atva
lue
of1.
0to
defin
eth
em
etri
cof
the
seco
nd-o
rder
late
ntva
riab
lein
the
unst
anda
rdiz
edso
lutio
n.
ARCHITECTURE OF AGGRESSION 155
TA
BL
E5
Rel
iabi
litie
san
dC
FAFa
ctor
Inte
rcor
rela
tions
for
the
Ori
gina
lan
dR
efine
dFo
ur-F
acto
rM
odel
s
Sam
ple
1Sa
mpl
e2
Sam
ple
3
AQ
fact
ors
Mod
elPA
VA
AN
GH
OPA
VA
AN
GH
OPA
VA
AN
GH
O
PAO
rigi
nal
86a
84a
84b
Refi
ned
80a
80a
—V
AO
rigi
nal
6074
a64
68a
6275
b
Refi
ned
5777
a63
73a
58—
AN
GO
rigi
nal
7481
82a
7282
83a
3737
80b
Refi
ned
6376
71a
6674
73a
3935
—H
OO
rigi
nal
5447
6376
a52
4857
81a
7564
6783
b
Refi
ned
5353
5773
a47
4343
77a
8066
85—
Not
e:PA
5Ph
ysic
alA
ggre
ssio
n;V
A5
Ver
bal
Agg
ress
ion;
AN
G5
Ang
er;
HO
5H
ostil
ity.
Sam
ple
15
307
Am
eric
anun
derg
radu
ates
;Sa
mpl
e2
520
0B
ritis
hun
derg
radu
ates
(Arc
her,
Hol
low
ay,
&M
cLou
ghlin
,19
95);
Sam
ple
35
306
Can
adia
nun
derg
radu
ates
(Har
ris,
1995
).T
able
dbe
low
the
relia
bilit
yco
effic
ient
sar
efa
ctor
corr
elat
ions
from
confi
rmat
ory
fact
oran
alys
esin
whi
chla
tent
fact
ors
and
mea
sure
dva
riab
les
have
been
stan
dard
ized
sepa
rate
lyw
ithin
each
sam
ple.
Dec
imal
poin
tsar
eom
itted
.a
Cro
nbac
h’s
alph
a(a
nin
dex
ofin
tern
alco
nsis
tenc
y)fo
run
it-w
eigh
ted
orig
inal
and
refin
edfa
ctor
scor
es.
bR
elia
bilit
yco
effic
ient
sor
igin
ally
repo
rted
byH
arri
s(1
995,
Tab
le2,
p.99
3).W
eco
uld
notc
ompu
tere
liabi
lity
coef
ficie
nts
for
the
refin
edfa
ctor
sin
Sam
ple
3be
caus
eon
lyth
eco
vari
ance
mat
rix
(but
not
the
nece
ssar
yra
wda
ta)
was
avai
labl
efo
rre
anal
ysis
ofth
isda
tase
t.

156 BRYANT AND SMITH
∆χ2(1)s . 3.8, ps , .05, and with Anger, both ∆χ2(1)s . 7.5, ps , .006,compared to the American and British samples. Although interesting froma cross-cultural perspective, these differences in factor interrelationships donot alter the conclusion that the 12 AQ indicators measure the latent factorsin comparable ways for all three samples (cf. Kline, 1998).
Comparing the original and refined factors. For purposes of comparison,Table 5 also displays the correlations among Buss and Perry’s (1992) originalfour factors in these same three samples. As evident in this table, the patternof correlations among the refined factors is strikingly similar to the patternof correlations among the original Buss–Perry factors. Indeed, the refinedfactors have only slightly lower internal consistency reliabilities than theiroriginal counterparts. This is important because it suggests that refining thefactors improved the model’s overall goodness-of-fit, but did not substan-tially reduce the reliabilities of the individual factors.1
Testing a ‘‘Partially Disaggregated’’ form of Buss and Perry’s originalmodel. Before abandoning Buss and Perry’s (1992) original four-factormodel, we reconfigured it into a ‘‘partially disaggregated’’ measurementmodel that preserved the full range of ‘‘totally disaggregated’’ item contentwhile reducing the number of indicators per factor (cf. Bagozzi & Edwards,1998; Bagozzi & Heatherton, 1994; Hull et al., 1991). To do this, we modi-fied the nine single-item indicators for PA into three composite measures,using as indicators (a) the mean of the three PA items from the refined mea-surement model; (b) the mean of original AQ items 1, 3, and 4; and (c) themean of original AQ items 5, 7, and 9. We modified the five single-itemindicators for VA into three measures, using as indicators (a) the mean ofthe three VA items from the refined measurement model, (b) original AQitem 10, and (c) original AQ item 12. We modified the seven single-itemindicators for ANG into three composite measures, using as indicators (a)the mean of the three ANG items from the refined measurement model, (b)the mean of original AQ items 16 and 17, and (c) the mean of original AQitems 18 and 19. Finally, we modified the eight single-item indicators forHO into three composite measures, using as indicators (a) the mean of thethree HO items from the refined measurement model; (b) the mean of originalAQ items 22, 26, and 27; and (c) the mean of original AQ items 28 and 29.
We then imposed this ‘‘partially disaggregated’’ four-factor model on the
1 As further evidence concerning the degree of conceptual overlap between the refined andoriginal Buss–Perry factors, we correlated unit-weighted factor scores for the former and thelatter within Samples 1 and 2. (We were unable to correlate factor scores in Sample 3 becauseonly the covariance matrix, and not the necessary raw data, was available for reanalysis.)For Samples 1 and 2, respectively, these intercorrelations were uniformly high: (a) PhysicalAggression (.91 and .86), (b) Verbal Aggression (.90 in both samples), (c) Anger (.90 and.85), and (d) Hostility (.83 and .85). These findings suggest that the refined AQ factors basicallymeasure the same latent constructs as the original factors.

ARCHITECTURE OF AGGRESSION 157
data of Samples 1 and 2 to evaluate its goodness-of-fit and cross-samplegeneralizability. (We could not construct partially disaggregated indicatorsfor Sample 3 because only the covariance matrix was available for reanalysisof this sample.) Although the partial disaggregation model provided a satis-factory fit to the data of Sample 1, χ2(48, n 5 307) 5 157.6, χ2/df 5 3.3,GFI 5 .93, RMSEA 5 .083, CFI 5 .93, NNFI 5 .91; it did not adequatelyfit the data of Sample 2, χ2(48, n 5 200) 5 197.4, χ2/df 5 4.1, GFI 5.87, RMSEA 5 .120, CFI 5 .88, NNFI 5 .83. Multigroup analyses furtherdemonstrated that neither the factor loadings, ∆χ2(8, n 5 507) 5 32.2, p ,.0001, nor the factor variances–covariances, ∆χ2(10, n 5 507) 5 115.8,p , .00001, of this partially disaggregated model were invariant across thetwo samples. Thus, even in a ‘‘partially disaggregated’’ form, Buss and Per-ry’s (1992) original four-factor model does not provide an acceptable mea-surement model for the AQ.
Testing the Gender Invariance of the Refined Model. Does aggressionmean the same thing to men and women? Is the refined measurement modelfor the AQ equally applicable to the data of males and females? This is acritical question for researchers interested in using the AQ to compare levelsof aggression in men and women. With respect to this question, Buss andPerry (1992) reported that men’s and women’s loadings differed in separatefour-factor PCA solutions, though they did not directly test the gender invari-ance of the four-factor model.
The refined four-factor model generated gender-equivalent loadings forthe British Sample 2, ∆χ2(8, n 5 200) 5 6.0, p . .64, but not for the Ameri-can Sample 1, ∆χ2(8, n 5 304) 5 21.4, p , .007. (Because only the pooledcovariance matrix was available for reanalysis of Harris’s data, we could nottest for gender invariance in Sample 3.) Follow-up multigroup CFAs re-vealed that only one factor loading actually differed significantly for malesand females in Sample 1—the loading for Physical Aggression item 3(‘‘There are people who have pushed me so hard that we came to blows’’)was stronger for men than women, ∆χ2(8, n 5 304) 5 12.3, p , .0005—andall other loadings for the four-factor model were gender-equivalent, ∆χ2(7,n 5 304) 5 2.9, p . .89. These findings suggest that the loadings of therefined four-factor model are largely invariant with respect to gender. Like-wise for the hierarchical model, the overarching second-order Aggressionfactor showed comparable relationships with the four first-order factors formales and females in both Sample 1, ∆χ2(4, n 5 304) 5 1.5, p . .82, andSample 2, ∆χ2(4, n 5 200) 5 5.9, p . .20. Thus, the refined factors appearto have substantially the same meaning for men and women.
Stage Three: Assessing Construct Validity
What evidence of convergent or discriminant validity is there for the re-fined AQ factors? And how does this validity evidence compare to that for

158 BRYANT AND SMITH
Buss and Perry’s original AQ factors? To address these questions, we usedCFA with equality constraints in Sample 1 data to test hypotheses aboutrelationships between (a) the four AQ factors in both their refined and origi-nal forms; and (b) the four criterion measures of physical assault, verbalhostility, anger arousal, and global hostility. We used CFA rather than tradi-tional correlational methods because it allowed us to estimate the relationshipbetween aggression subtraits and criterion measures, partialing out measure-ment error, and also provided a way to systematically test hypotheses aboutthe strength of associations across measures.
Because measurement error attenuates relationships, different measuresmay demonstrate different interrelationships due to differences in reliability.For this reason, it is important to control for differential reliability whenassessing the strength of relationships between observed measures. Tradi-tional correlational methods assume that all analyzed variables are measuredperfectly and therefore do not allow researchers to adjust for differentialreliability (Kline, 1998; Maruyama, 1998). Using CFA, in contrast, enabledus to control for differences in the reliabilities of the AQ factors and thecriterion measures, which might otherwise influence the strength of the ob-served associations (Bagozzi, 1993; Judd, Jessor, & Donovan, 1986).
Another advantage of CFA over the traditional correlational approach isthat it allowed us to use equality constraints to systematically test hypothesesabout the strength of the relationships among the latent constructs. Typically,researchers have simply eyeballed differences in correlation coefficients todetermine the degree to which measures show convergent or discriminantvalidity. Using CFA, in contrast, enabled us to test the statistical significanceof differences in the magnitude of validity coefficients by contrasting thegoodness-of-fit chi-square values (and degrees of freedom) of two nestedmodels: one that constrained the correlations in question to have equal valueand one that contained no equality constraint. A significant difference inthese two nested chi-square values signifies that the correlations differ inmagnitude (cf. Bryant & Baxter, 1997; Bryant & Yarnold, 1995).
To obtain the multiple indicators required for CFA while also minimizingthe number of measured variables in the model, we used the ‘‘partial disag-gregation’’ approach to parcel each of the four criterion measures into twocomposite indicators. For the Buss–Durkee Physical Assault scale, wesummed responses to the odd-numbered items (1, 3, and 5) to create oneindicator and summed responses to the even-numbered items (2 and 4) tocreate a second indicator. For the Buss–Durkee Verbal Hostility scale, wesummed responses to items 1–4 to create one indicator and summed re-sponses to items 5–8 to create a second indicator. For the MAI AngerArousal scale, we summed responses to items 1 and 2 to create one indicatorand summed responses to items 3 and 4 to create a second indicator. Totalscores on split-halves of the Cook–Medley Hostility Scale served as indica-

ARCHITECTURE OF AGGRESSION 159
TABLE 6Correlations of the Refined and Original AQ Factors with the Criterion Measures
Refined AQ factors Original AQ factors
Criterion measures PA VA ANG HO PA VA ANG HO
Buss–Durkee Physical Assault 85 62 65 43 90 62 70 44Buss–Durkee Verbal Hostility 57 64 72 45 63 66 74 45MAI Anger Arousal 64 66 91 77 64 64 93 88Cook–Medley Hostility 46 60 64 89 49 58 65 84
Note. PA 5 Physical Aggression; VA 5 Verbal Aggression; ANG 5 Anger; HO 5 Hostil-ity. These data are from a random subset of 180 American undergraduates (70 males and 110females) from Sample 1. Tabled are standardized φ coefficients (analogous to Pearson correla-tion coefficients) from confirmatory factor analyses. These coefficients reflect the degree ofassociation between latent constructs that have been adjusted for differences in measurementreliability. Cronbach’s αs for unit-weighted factor scores on the criterion measures were asfollows: Physical Assault (.64), Verbal Hostility (.63), Anger Arousal (.82), and Cook-MedleyHostility (.86). All φs are statistically significant at p , .00001, two-tailed.
tors for the criterion measure of Hostility. This yielded eight composite in-dicators of four criterion factors. CFA revealed that the intended four-factor model for the criterion measures (i.e., correlated factors of PhysicalAssault, Verbal Hostility, Anger Arousal, and Global Hostility) was an ac-ceptable measurement model for the eight composite indicators, χ2(14, n 5180) 5 19.2, p . .16, GFI 5 .97, RMSEA 5 .0454, CFI 5 .99, NNFI 5.98.
Refined AQ Factors. We next analyzed the 12 items constituting the re-fined four-factor model for the AQ together with the eight criterion measuresand examined the factor intercorrelations. Table 6 presents the correlationsbetween the four refined AQ factors and the four criterion constructs forthis CFA model. To assess discriminant validity, we first examined thesecorrelations separately within each factor, conducting an initial omnibus testof the homogeneity of correlations across criterion measures for each columnin the table. The hypothesis of equality in correlations across criteria (i.e.,no discriminant validity) was rejected for the AQ factors of Physical Aggres-sion, ∆χ2(3, n 5 180) 5 22.5, p , .0001; Anger, ∆χ2(3, n 5 180) 5 23.0,p , .0001; and Hostility, ∆χ2(3, n 5 180) 5 50.0, p , .0001; but not forVerbal Aggression, ∆χ2(3, n 5 180) 5 1.1, p . .77.
Supporting the construct validity of the Physical Aggression factor, fol-low-up CFA tests using equality constraints revealed that levels of this AQfactor were more strongly correlated with the Physical Assault criterion thanwith the criteria of Verbal Hostility, ∆χ2(1, n 5 180) 5 10.0, p , .002;Anger Arousal, ∆χ2(1, n 5 180) 5 6.6, p , .01; and Global Hostility, ∆χ2(1,n 5 180) 5 19.2, p , .0001. Supporting the construct validity of the Anger

160 BRYANT AND SMITH
factor, levels of this AQ factor were more strongly correlated with the AngerArousal criterion than with the criteria of Verbal Hostility, ∆χ2(1, n 5 180)5 9.2, p , .025; Anger Arousal, ∆χ2(1, n 5 180) 5 6.8, p , .009; andGlobal Hostility, ∆χ2(1, n 5 180) 5 20.7, p , .0001. And supporting theconstruct validity of the Hostility factor, levels of this AQ factor were morestrongly correlated with the Global Hostility criterion than with the criteriaof Physical Aggression, ∆χ2(1, n 5 180) 5 13.3, p , .003; Verbal Aggres-sion, ∆χ2(1, n 5 180) 5 14.0, p , .0002; and Anger Arousal, ∆χ2(1, n 5180) 5 6.0, p , .015. Thus, three of the four refined AQ factors showedevidence of convergent and discriminant validity.2
Original AQ Factors. We next analyzed the 29 items constituting Bussand Perry’s (1992) original four-factor measurement model together withthe eight criterion measures and examined the factor intercorrelations. Table6 also presents the correlations between the four original AQ factors and thefour criterion constructs for this CFA model. As with the refined measure-ment model, we first examined these correlations separately within factors,conducting an initial omnibus test of the homogeneity of correlations foreach column in the table. Paralleling results for the refined AQ factors, thehypothesis of equality in correlations across criteria (i.e., no discriminantvalidity) was rejected for the original AQ factors of Physical Aggression,∆χ2(3, n 5 180) 5 27.4, p , .0001; Anger, ∆χ2(3, n 5 180) 5 31.1, p ,.0001; and Hostility, ∆χ2(3, n 5 180) 5 50.6, p , .0001; but not for VerbalAggression, ∆χ2(3, n 5 180) 5 1.5, p . .68. Thus, in both refined andoriginal forms, Verbal Aggression lacked discriminant validity.
Supporting the construct validity of the original Physical Aggression fac-tor, follow-up CFA tests using equality constraints revealed that levels of
2 We also assessed the discriminant validity of unit-weighted factor scores for the refinedAQ model in terms of their predictive utility in distinguishing males and females. Buss andPerry (1992, p. 455) originally reported that males had higher scores than females on PhysicalAggression (PA), Verbal Aggression (VA), and Hostility (HO), but not on Anger (ANG).Multivariate analyses of variance revealed a significant multivariate main effect of gender forSample 1, F(4, 299) 5 21.1, p , .0001; Sample 2, F(4, 195) 5 4.3, p , .002; Sample 4,F(4, 166) 5 6.5, p , .0001; and Sample 5, F(4, 165) 5 8.9, p , .0001. (We could not testfor gender differences in factor means for Sample 3 because only the covariance matrix wasavailable for reanalysis of these data.) Univariate ANOVAs revealed that males scored higherthan females on (a) PA in American Samples 1, 4, and 5, all ps , .0001, effect sizes d 5.85, .54, and 1.0, respectively, but not in British Sample 2, p . .60, d 5 .07; (b) VA inSamples 1 and 4, ps , .02, ds 5 .45 and .42, respectively, but not in Samples 2 and 5,ps . .17, ds 5 .11 and .23, respectively; (c) ANG in Sample 5, p , .02, d 5 .58, but notin Samples 1, 2, and 4, ps . .37, ds 5 .15, .12, and .03, respectively; and (d) HO in Samples1 and 5, ps , .02, ds 5 .35 and .46, respectively, but not in Samples 2 and 4, ps . .07, ds5 .25 and .22, respectively. Though somewhat inconsistent across samples, these results gener-ally converge with those of previous researchers and provide at least partial support for thediscriminant validity of the refined AQ factors.

ARCHITECTURE OF AGGRESSION 161
this AQ factor were more strongly correlated with the Physical Assault crite-rion than with the criteria of Verbal Hostility, ∆χ2(1, n 5 180) 5 11.7,p , .0007; Anger Arousal, ∆χ2(1, n 5 180) 5 11.9, p , .0006; and GlobalHostility, ∆χ2(1, n 5 180) 5 26.1, p , .0001. Supporting the constructvalidity of the Anger factor, levels of this AQ factor were more stronglycorrelated with the Anger Arousal criterion than with the criteria of VerbalHostility, ∆χ2(1, n 5 180) 5 8.7, p , .004; Anger Arousal, ∆χ2(1, n 5 180)5 8.3, p , .004; and Global Hostility, ∆χ2(1, n 5 180) 5 30.2, p , .0001.And partially supporting the construct validity of the Hostility factor, levelsof this AQ factor were more strongly correlated with the Global Hostilitycriterion than with the criteria of Physical Assault, ∆χ2(1, n 5 180) 5 20.0,p , .0001, and Verbal Hostility, ∆χ2(1, n 5 180) 5 24.7, p , .0001. How-ever, unlike the refined Hostility factor, Buss and Perry’s original Hostilityfactor correlated equally with both the Global Hostility and Anger Arousalcriteria, ∆χ2(1, n 5 180) 5 0.7, p . .41. This result is consistent with earlierfindings of a high degree of overlap between these two dimensions (Harris,1997). Thus, only two of the four original AQ factors showed evidence ofconvergent and discriminant validity.
Considered together, what do these results tell us about the refined mea-surement model? First, the construct validity of the refined AQ factors ap-pears to be as good or better than the construct validity of the original Buss–Perry factors. For both models, the Physical Aggression and Anger factorsshowed the strongest evidence of convergent and discriminant validity,whereas the Verbal Aggression factor showed the weakest. The Hostilityfactor, in contrast, had stronger discriminant validity in its refined form thanin its original form. Taken as a whole, these findings support the constructvalidity of the refined measurement model for the AQ, and they suggest thatthe process of modifying the original factors has essentially preserved theirconceptual content.
Stage Four: Comparing the Original and Short Forms of the AQ
Our final research objective was to readminister the refined subset of 12AQ items as a shortened version of the AQ and to evaluate the degree towhich the four-factor measurement model replicated in this new form (cf.Yarnold, Bryant, & Grimm, 1987). Accordingly, we analyzed the responsesof Samples 4 and 5 to this new, short form of the AQ. Results revealed thatthe refined four-factor model replicated in both samples. Specifically, theintended four-factor model provided an acceptable measurement model forthe 12 items in both Sample 4, χ2(48, n 5 171) 5 116.94, GFI 5 .90,RMSEA 5 .092, CFI 5.92, NNFI 5 .90; and Sample 5, χ2(1, n 5 170) 5119.14, GFI 5 .90, RMSEA 5 .094, CFI 5 .91, NNFI 5 .88. The refinedhierarchical also provided an acceptable measurement model for the 12 itemsin both Sample 4, χ2(50, n 5 171) 5 118.1, GFI 5 .89, RMSEA 5 .090,
162 BRYANT AND SMITH
CFI5.92, IFI 5 .93, NNFI 5 .90; and Sample 5, χ2(50, n 5 170) 5 119.4,GFI 5 .90, RMSEA 5 .091, CFI 5 .92, NNFI 5 .89.
As a measure of each factor’s internal consistency, we also computedCronbach’s alphas for unit-weighted scores on the refined AQ factors. Forboth Samples 4 and 5, respectively, reliability coefficients were generallyacceptable for the refined factors of Physical Aggression (.79 and .80), Ver-bal Aggression (.83 and .80), Anger (.76 and .76), and Hostility (.75 and.70). These reliabilities are generally comparable to those for Samples 1 and2, which used the longer, original form of the AQ (see Table 5).
We also used multigroup CFA to assess the generalizability of the refinedmeasurement model across Samples 4 and 5 and across all five samples.Confirming replicability, the refined four-factor model produced equivalentloadings, ∆χ2(8, n 5 341) 5 4.7, p . .78, and equivalent factor variances–covariances, ∆χ2(10, n 5 341) 5 5.8, p . .82, for Samples 4 and 5. Analyz-ing the data of all five samples simultaneously, we found that the refinedfour-factor model produced (a) fully invariant loadings in Samples 1, 2,4, and 5; and (b) 11 of 12 invariant loadings in Sample 3, ∆χ2(46, n 5 1154)5 24.9, p . .99. In addition, the overarching higher-order Aggression factorhad the same relationships with the first-order AQ factors across Samples1, 2, 4, and 5, ∆χ2(12, n 5 848) 5 14.5, p . .26. Thus, the refined measure-ment model replicates with the shortened version of the AQ.
As a strong test of the comparability of the factors represented in the shortand long forms of the AQ, we reran the analyses for Samples 4 and 5 fixingthe factor intercorrelations in the model to the exact values found earlier forour American Sample 1 (see Table 5). Using the factor correlations fromthe earlier sample did not significantly worsen the fit of the model for eitherSample 4, ∆χ2(6, n 5 171) 5 12.4, p . .05, or Sample 5, ∆χ2(6, n 5170) 5 11.8, p . .06. Thus, shortening the AQ to 12 items does not appearto change the conceptual meaning of the underlying aggression subtraits.
GENERAL DISCUSSION
The most important finding of the present study is the discovery of anappropriate measurement model for the Aggression Questionnaire. AlthoughBuss and Perry’s (1992) original four-factor model has a strong theoreticalfoundation, it explains too little common variance in the 29 AQ items to serveas a formal measurement model. The refined model, in contrast, preserves theconceptual content of the original model, but improves its statistical preci-sion. That the refined model replicates with both the original and short ver-sions of the AQ, is equally applicable for both males and females, and holdsacross independent samples from three different countries (i.e., UnitedStates, England, and Canada) increases our confidence in the external valid-ity of this measurement model.
Our data also provide strong support for the convergent and discriminant

ARCHITECTURE OF AGGRESSION 163
validity of the refined Physical Aggression, Anger, and Hostility factors.Each of these factors correlated more strongly with the criterion measure towhich it is presumed to correspond than to the other criterion measures. TheVerbal Aggression factor, in contrast, showed no discriminant validity ineither its original or refined forms, and was at least moderately correlatedwith each of the other AQ factors. Clearly, future work is needed to establishthe construct validity of this particular subtrait.
Our data further demonstrate that the refined Hostility factor has greaterdiscriminant validity than the original Hostility factor. The latter correlatedequally with scores on both the Cook–Medley Hostility Scale and the MAIAnger Arousal subscale, whereas the former correlated more strongly withCook–Medley scores than with the other criterion measures. It is instructiveto note that Buss and Perry (1992) originally defined hostility as the cognitivecomponent of aggression, consisting of ‘‘feelings of ill will and injustice’’(p. 457). By this definition, hostility is a cognitive dimension that includesnegative feelings. That the original Hostility factor had equivalent correla-tions with the hostility and anger criteria is entirely consistent with this con-ceptualization. The refined Hostility factor, in contrast, excludes items tap-ping jealousy (item 22), paranoia (item 28), and suspiciousness (items 27and 29). Omitting these items appears to disentangle Hostility from Anger,giving the former a more exclusively cognitive focus.
What measurement model should researchers adopt in using the AQ, andhow should they best score this instrument? Our findings clearly indicatethat dispositional aggression (as measured by the AQ) is multidimensional.Thus, examining the four separate subtraits is more reasonable both concep-tually and statistically than relying solely on a pooled ‘‘total score.’’ Indeed,by collapsing across multiple dimensions, AQ total score could conceivablyobscure differences that exist for individual factors. This suggests that itwould be unwise for researchers to use only the 29-item total score in quanti-fying responses to the AQ.
Our data also demonstrate that the refined four-factor model is superiorto Buss and Perry’s (1992) original four-factor model in its overall goodness-of-fit to the data. In other words, the 12 AQ items constituting the refinedmodel more closely reflect the underlying subtraits of physical aggression,verbal aggression, anger, and hostility than do the 29 items constituting theoriginal model. Although the four original factors offer somewhat greaterinternal consistency in terms of Cronbach’s alpha, this apparent advantagedisappears when the reliabilities of the refined factors are corrected for differ-ences in the number of constituent items (adjusted αs 5 .88 2 .92), using theSpearman–Brown prophecy formula (Magnusson, 1967). Thus, the refinedmodel appears to provide a valid and reliable means of measuring the fouraggression subtraits, using either the original 29-item AQ or its 12-item shortform.

164 BRYANT AND SMITH
Whether one should adopt the four-factor model or its hierarchical coun-terpart depends on one’s research objectives. The first-order model enablesone to examine the relationships among each of the four AQ factors as wellas the specific correlates of each subtrait of aggression. The higher-ordermodel, in contrast, enables one to examine the common variance among thefour AQ factors as an independent or dependent variable in its own right.In either case, the present study suggests that researchers can enhance bothconceptual and predictive precision by using the refined measurement modelfor the AQ.
Our research conclusions are constrained by several important limitations.First, we used only self-report measures as criteria in assessing constructvalidity. Clearly, it would be advantageous to include behavioral and physio-logical criterion measures of physical and verbal aggression, anger, and hos-tility (cf. Leibowitz, 1968). This would increase confidence that the AQ actu-ally measures these aggression subtraits. In addition, we used only collegestudent samples across the three countries, and our results may not generalizeto older adults or offender populations (cf. Williams et al., 1996).
In closing, we note two unresolved measurement issues concerning theAQ. The first issue concerns the nature of the response scale used to quantifyAQ responses. Although we changed the original 5-point scale to a 6-pointscale in the AQ short form, we preserved the original anchors for the scaleendpoints: extremely uncharacteristic of me to extremely characteristic ofme. However, the exact meaning of this scale remains somewhat unclear.Specifically, is an uncharacteristic–characteristic scale unipolar or bipolar(cf. Sudman & Bradburn, 1982)? Might respondents interpret ‘‘extremelyuncharacteristic’’ to mean that the particular characteristic in question is sounlike them that its opposite actually holds true for them? Such bipolaritywould be conceptually inconsistent with traditional theoretical formulationsof aggression. In the future, it might be better to anchor the scale with notat all characteristic of me to very much characteristic of me, so as to avoidconceptual confusion.
A final measurement issue concerns the order of the items constitutingthe AQ. Buss and Perry (1992) did not report the order of the 29 items inthe original AQ, but simply advised researchers to ‘‘make up their own . . .version by scrambling the items so that items do not pile up’’ (footnote 1,p. 453). Accordingly, different users have used different randomized order-ings of the AQ items. This approach has drawbacks, however. Though appar-ently intended to enhance measurement validity, the practice of rerandomiz-ing the order of the AQ items across studies makes it extremely difficult toconduct secondary analyses of existing AQ data sets, as done in the presentstudy. When comparing data across studies, one must not only determinethe specific order of the items that each researcher has used, but must alsomatch up items across studies and then rearrange all AQ items in each data

ARCHITECTURE OF AGGRESSION 165
set into one universal order, constructing a complex form of ‘‘Rosetta Stone’’in the process. For example, AQ item 11 in our Sample 1 is (a) item 21 inBuss and Perry’s (1992, p. 454) Table 1; (b) item 22 in Archer, Holloway,and McLoughlin’s (1995) data set; (c) item 29 in Harris’s (1995) data set;and (d) item 5 in our 12-item short form of the AQ. Rerandomizing the orderof AQ items at each administration makes little sense, given the methodologi-cal sufficiency of a single random order. To facilitate comparison of resultsacross studies, we strongly urge future researchers to adopt a standard ran-dom order of the AQ items (the note for Table 2 reports the order we haveused for both the original and short forms of the AQ).
Finally, we alert researchers to the fact that Western Psychological Ser-vices (Los Angeles, CA) has recently developed a new 34-item version ofthe original 29-item AQ (Buss & Warren, 2000). This new instrument con-tains all but one of the original Buss–Perry items (14 of which have beenmodified to improve readability), along with a new, 6-item Indirect Aggres-sion subscale. Although Indirect Aggression was initially a component ofthe Buss–Durkee Hostility Inventory (Buss & Durkee, 1957), Buss and Perry(1992) omitted this dimension of aggression in their original AQ. Research-ers wishing to use the short form of the AQ should note that the questionsin the new AQ have been arranged so that the first 12 items represent theindicators constituting our refined measurement model. Advantages to usingthis new 34-item AQ (Buss & Warren, 2000), as opposed to the original 29-item AQ (Buss & Perry, 1992), include the availability of (a) more extensiveevidence supporting construct validity; (b) large-scale, national norms; (c)a reliable subscale to tap Indirect Aggression; and (d) a single, fixed orderfor the AQ items.
REFERENCES
Archer, J., Kilpatrick, G., & Bramwell, R. (1995). Comparison of two aggression inventories.Aggressive Behavior, 21, 371–380.
Archer, J., Holloway, R., & McLoughlin, K. (1995). Self-reported physical aggression amongyoung men. Aggressive Behavior, 21, 325–342.
Bagozzi, R. P. (1993). Assessing construct validity in personality research: Applications tomeasures of self-esteem. Journal of Research in Personality, 27, 49–87.
Bagozzi, R. P., & Edwards, J. R. (1998). A general approach for representing constructs inorganizational research. Organizational Research Methods, 1, 45–87.
Bagozzi, R. P., & Heatherton, T. F. (1994). A general approach to representing multifacetedpersonality constructs: Application to state self-esteem. Structural Equation Modeling,1, 35–67.
Barefoot, J. C., Dahlstrom, W. G., & Williams, R. B., Jr. (1983). Hostility, CHD incidenceand total mortality: A 25-year follow-up study of 255 physicians. Psychosomatic Medi-cine, 45, 59–63.
Bentler, P. M. (1990). Comparative fit indexes in structural models. Psychological Bulletin,107, 238–246.
166 BRYANT AND SMITH
Bentler P. M., & Bonett, D. G. (1980). Significance tests and goodness of fit in the analysisof covariance structures. Psychological Bulletin, 88, 588–606.
Bernstein, I. A., & Gesn, P. R. (1997). On the dimensionality of the Buss/Perry AggressionQuestionnaire. Behavior Research and Therapy, 35, 563–568.
Bollen, K. A. (1989). Structural equations with latent variables. New York: Wiley.
Browne, M. W., & Cudeck, R. (1989). Single-sample cross-validation indices for covariancestructures. Multivariate Behavioral Research, 24, 445–455.
Bryant, F. B., & Baxter, W. J. (1997). The structure of positive and negative automatic cogni-tion. Cognition and Emotion, 11, 225–258.
Bryant, F. B., & Yarnold, P. R. (1995). Principal-components analysis and exploratory andconfirmatory factor analysis. In L. G. Grimm & P. R. Yarnold (Eds.), Reading and under-standing multivariate statistics (pp. 99–136). Washington, DC: American PsychologicalAssociation.
Bryant, F. B., Yarnold, P. R., & Grimm, L. G. (1996). Toward a measurement model of theAffect Intensity Measure: A three-factor structure. Journal of Research in Personality,30, 223–247.
Byrne, B. M., Shavelson, R. J., & Muthen, B. (1989). Testing for the equivalence of factorcovariance and mean structures: The issue of partial measurement invariance. Psychologi-cal Bulletin, 105, 456–466.
Buss, A. H. (1961). The psychology of aggression. New York: Wiley.
Buss, A. H., & Durkee, A. (1957). An inventory for assessing different kinds of hostility.Journal of Consulting Psychology, 21, 343–349.
Buss, A. H., Fischer, H., & Simmons, A. J. (1962). Aggression and hostility in psychiatricpatients. Journal of Consulting, 26, 84–89.
Buss, A. H., & Perry, M. (1992). The Aggression Questionnaire. Journal of Personality andSocial Psychology, 63, 452–459.
Buss, A. H., & Warren, W. L. (2000). The Aggression Questionnaire manual. Los Angeles:Western Psychological Services.
Cook, W. W., & Medley, D. M. (1954). Proposed Hostility and Pharisaic-Virtue scales forthe MMPI. Journal of Applied Psychology, 38, 414–418.
Felsten, G., & Hill, V. (1998). Aggression Questionnaire hostility scale predicts anger in re-sponse to mistreatment. Behavior Research and Therapy, 37, 87–97.
Harburg, E., Erfurt, J. C., Hauenstein, L. S., Chape, C., Schull, W. J., & Schork, M. A. (1973).Socio-ecological stress, suppressed hostility, skin color, and black–white male bloodpressure. Psychosomatic Medicine, 35, 276–296.
Harris, J. A. (1995). Confirmatory factor analysis of the Aggression Questionnaire. BehaviorResearch and Therapy, 33, 991–993.
Harris, J. A. (1997). A further evaluation of the Aggression Questionnaire: Issues of validityand reliability. Behavior Research and Therapy, 35, 1047–1053.
Hoelter, J. W. (1983). The analysis of covariance structures: Goodness-of-fit indices. Sociolog-ical Methods and Research, 11, 325–344.
Hu, L.-T., & Bentler, P. M. (1998). Fit indices in covariance structure modeling: Sensitivityto underparameterized model misspecification. Psychological Methods, 3, 424–453.
Hull, J. G., Lehn, D. A., & Tedlie, J. C. (1991). A general approach to testing multifacetedpersonality constructs. Journal of Personality and Social Psychology, 61, 932–945.
Joreskog, K. G., & Sorbom, D. G. (1996). LISREL 8: User’s reference guide. Chicago: Scien-tific Software.

ARCHITECTURE OF AGGRESSION 167
Judd, C. M., Jessor, R., & Donovan, J. E. (1986). Structural equation models and personalityresearch. Journal of Personality, 54, 149–198.
Kline, R. B. (1998). Principles and practice of structural equation modeling. New York:Guilford.
Leibowitz, G. (1968). Comparison of self-report and behavioral techniques of assessing ag-gression. Journal of Consulting and Clinical Psychology, 32, 21–25.
MacCallum, R. C. (1986). Specification searches in covariance structure modeling. Psycholog-ical Bulletin, 100, 107–120.
MacCallum, R. C., Roznowski, M., & Necowitz, L. B. (1992). Model modification in covari-ance structure analysis: The problem of capitalization on chance. Psychological Bulletin,111, 490–504.
Magnusson, D. (1967). Test theory. Reading, MA: Addison–Wesley.
Maiuro, R. D., Cahn, T. S., Vitaliano, P. P., Wagner, B. C., & Zegree, J. B. (1988). Anger,hostility, and depression in domestically violent versus generally assaultive men and non-violent control subjects. Journal of Consulting and Clinical Psychology, 56, 17–23.
Marsh, H. W., Balla, J. R., & Hau, K.-T. (1996). An evaluation of incremental fit indices: Aclarification of mathematical and empirical properties. In G. A. Marcoulides & R. E.Schumacker (Eds.), Advanced structural equation modeling: Issues and techniques(pp. 315–353). Mahwah, NJ: Erlbaum.
Maruyama, G. M. (1998). Basics of structural equation modeling. Thousand Oaks, CA: Sage.
McDonald, R. P., & Marsh, H. W. (1990). Choosing a multivariate model: Noncentrality andgoodness of fit. Psychological Bulletin, 107, 247–255.
Meesters, C., Muris, P., Bosma, H., Schouten, E., & Beuving, S. (1996). Psychometric evalua-tion of the Dutch version of the Aggression Questionnaire. Behavior Research and Ther-apy, 34, 839–843.
Nichols, J. G., Licht, B. G., & Pearl, R. A. (1982). Some dangers of using personality question-naires to study personality. Psychological Bulletin, 92, 572–580.
Novaco, R. (1975). Anger control: The development and evaluation of an experimental treat-ment. Lexington, MA: Lexington Books.
Shekelle, R. B., Gale, M., Ostfeld, A. M., & Paul, O. (1983). Hostility, risk of coronary heartdisease, and mortality. Psychosomatic Medicine, 45, 109–114.
Siegel, J. M. (1986). The Multidimensional Anger Inventory. Journal of Personality and SocialPsychology, 51, 191–200.
Steiger, J. H. (1990). Structural model evaluation and modification: An interval estimationapproach. Multivariate Behavioral Research, 25, 173–180.
Sudman, S., & Bradburn, N. M. (1982). Asking questions: A practical guide to questionnaireconstruction. San Francisco: Jossey–Bass.
Tucker, L. R., & Lewis, C. (1973). A reliability coefficient for maximum likelihood factoranalysis. Psychometrika, 38, 1–10.
Velicer, W. F., Govia, J. M., Cherico, N. P., & Corriveau, D. P. (1985). Item format and thestructure of the Buss–Durkee Hostility Inventory. Aggressive Behavior, 11, 65–82.
Williams, T. W., Boyd, J. C., Cascardi, M. A., & Poythress, N. (1996). Factor structure andconvergent validity of the Aggression Questionnaire in an offender population. Psycho-logical Assessment, 8, 398–403.
Yarnold, P. R., Bryant, F. B., & Grimm, L. G. (1987). Comparing the long and short formsof the Student Jenkins Activity Survey. Journal of Behavioral Medicine, 10, 75–90.
Zillmann, D. (1979). Hostility and aggression. Hillsdale, NJ: Earlbaum.