Embed Size (px)
Citation preview

Warsaw School of Economics
REGIONAL
INVESTMENT
ATTRACTIVENESS 2014
Hanna Godlewska-Majkowska, Ph.D.,
Associate Professor at the Warsaw School of Economics
Agnieszka Komor, Ph.D.
Mariusz Czernecki, M.A.
Magdalena Typa, M.A.
Report prepared for the Polish Information
and Foreign Investment Agency
at the Institute of Enterprise, Warsaw School of Economics
Warsaw, December 2014
2014

Regional investment attractiveness 2014
2
Polish Information and Foreign Investment Agency (PAIiIZ) is a
governmental institution and has been servicing investors since 1992. Its mission
is to create a positive image of Poland in the world and increase the inflow of
foreign direct investments by encouraging international companies to invest in
Poland. PAIiIZ is a useful partner for foreign entrepreneurs entering the Polish
market. The Agency guides investors through all the essential administrative and
legal procedures that involve a project. It also provides rapid access to complex information relating to
legal and business matters regarding investments. Moreover, it helps in finding the appropriate
partners and suppliers together with new locations.
PAIiIZ provides free of charge professional advisory services for investors, including:
investment site selection in Poland,
tailor-made investors visits to Poland,
information on legal and economic environment,
information on available investment incentives,
facilitating contacts with central and local authorities,
identification of suppliers and contractors,
care of existing investors (support of reinvestments in Poland).
Besides the OECD National Contact Point, PAIiIZ also maintains an Information Point for
e supported by the
Regional Investor Assistance Centres. Thanks to the training and ongoing support of the Agency,
the Centres provide complex professional services for investors at voivodship level.
On the website www.paiz.gov.pl an investor can find all the necessary information concerning key
facts about Poland, Polish economy, legal regulations in Poland and detailed information which could
be useful for any company wanting to set up a business in Poland.
Since 2011 China Poland Economic Cooperation Centre operates in PAIiIZ as a "one-stop shop"
providing comprehensive information on investment opportunities in Poland and offering support for
Chinese companies during the investment process. The Centre is responsible for: promotion of Poland
as a location for FDI, identifying sources of foreign direct investment, supporting the missions and
delegations from China, preparing analysis & information, maintaining regular contact with Chinese
companies operating in Poland, Go China Project. More information you can find on:
www.gochina.gov.pl.
Also since 2013 PAIiIZ is implementing the program. Its aim is to encourage Polish
entrepreneurs to enter the African markets and to promote Poland in Africa. Therefore PAIiIZ is
organizing: fact finding missions to African countries, participation of Polish entrepreneurs in fairs,
conferences, seminars and workshops both in Poland and in Africa. Furthermore the Agency is
preparing publications on African markets. More information you can find on: www.goafrica.gov.pl.
Regional investment attractiveness 2014
3
INTRODUCTION
The report has been prepared to order of the Polish Information and Foreign Investment
Agency and is the next edition of the regional investment attractiveness reports. The reports
have been published since 2008. They are the result of scientific research conducted since
2002 under the supervision of H. Godlewska-Majkowska, Ph.D., university professor of the
Warsaw School of Economics, in the Institute of Enterprise, Collegium of Business
Administration of the Warsaw School of Economics. All the authors are the core members of
a team that develops methodology of calculating regional investment attractiveness.
The report consists of a few parts. The first part includes the synthetic presentation of the
-economic potential of the voivodship and the level of
economic development as well as economy structure. The most important socio-economic
data, including information on investment attractiveness, is presented in a table. The first part
of the report also presents the position of the voivodship compared to other Polish and
European Union regions, paying special attention to the most important industries and high
potential sectors.
attractiveness at the levels of counties (Polish: county) and communes (Polish: gmina). The
territorial units can be compared to the other territorial units from all of the Polish regions as
the calculations have been made for all of them.
In the third part of the report the main business environment institutions in the voivodship are
presented, taking into consideration kinds of support which they offer to investors. This part
also includes information on location of the Special Economic Zones (SEZs) in the
voivodship and information on the results of their activities. The third part of the report is
it possible to point out such communes that are not only attractive for potential investors but
also offer them well-prepared information on the Internet.
The report is completed with the Appendix including tables with comparisons of investment
nd communes. There is also some more
detailed information in the Appendix concerning effects of functioning of the Special
Economic Zones in the region.
There are two approaches to the investment attractiveness presented in this work. One of them
is potential investment attractiveness, defined as a set of regional location advantages that
Another approach is real investment attractiveness
investments. They can be measured by effectiveness of capital spending.1
1. More information on this topic can be found in:
, H. Godlewska-Majkowska (ed.), Studia i Analizy Instytutu

Regional investment attractiveness 2014
4
Potential investment attractiveness indices in their simplified version (PAI1) measure the
location-specific advantages of regions. They are calculated for territorial units of various
levels of statistical division of the country (communes Polish: gmina, counties Polish:
powiat, subregions, voivodships/regions). These indices refer to the whole national economy
and to the selected sections: C manufacturing industry, G trade and repair, I tourism and
catering, M professional, scientific and technical services. These sections are the core of the
national economy.
Besides, some indices are calculated only for the voidoships, on the basis of characteristics
available only on the regional or macroregional level which allows evaluating their
investment attractiveness in a much broader context. These are PAI2 indices, which are
calculated both from a general point of view and with reference to the above mentioned
sections of the economy.
What is more, ranks of real investment attractiveness, which relates to the inflow of capital (in
the form of investments) and the effects of investments considered from a point of view of
productivity and returns on the outlays made, are used in this report. Real investment
attractiveness can be calculated for voivodships, based on the statistical data available on the
regional level.
The measurements in use are subject to annual review thanks to consulting them with foreign
investor assistance institutions and direct contact to territorial self-government units as well as
organizations of entrepreneurs. A description of methodological approach to measuring
investment attractiveness of Polish regions, counties and communes can be found online on
the website of the Institute of Enterprise at the Warsaw School of Economics
(http://kolegia.sgh.waw.pl/pl/KNoP/struktura/IP/struktura/ZOB/), as well as in numerous
scientific publications and expert opinions.
H. Godlewska-Majkowska, Polish regions and
their investment attractiveness in the EU, in: POLAND Competitiveness Report 2013. National and Regional
Dimensions, M. Weresa (ed.), Oficyna Wydawnicza SGH, Warsaw 2013, pp 299-316.

Regional investment attractiveness 2014
5
1. THE PROFILE OF REGIONAL ECONOMY OF LOWER
SILESIAN ( ) VOIVODSHIP
is one of the three most attractive regions of
Its advantages are:
very high level of economic development, significantly exceeding the national
average,
highly beneficial geopolitical location by virtue of the proximity of Germany and the
Czech Republic as well as an attractive location in view of sales markets of
agglomerations of Prague, Berlin and Warsaw,
very well-developed transport infrastructure (roads, railways, waterways, airways) and
communications/telecomputer infrastructure:
o convenient road connections: A4 highway, international roads: E40, E36, E65
and E67,
o an expanded system of railways: international railways E30 and E59,
o a well-developed network of water transport (the Oder system enables to ship
by barges from Lower Silesia to the port complex of Szczecin-
through the Oder-Spree and Oder-Havel channels. Lower Silesia is connected
to the system of inland waterways of Western Europe),
o -Strachowice offers international air
connections with Frankfurt upon Main, Munich, London, Copenhagen, Milan,
Dublin, Nottingham, Dortmund, Shannon, Glasgow, Liverpool, Stockholm,
Cork and Rome,
o a very good access to the Internet (in this respect the voivodship belongs to the
highest rated regions in Poland),
the presence of many higher education institutions among which there are many
renowned Polish scientific establishments,
rich cultural heritage (numerous monuments among which UNESCO World Heritage
Jawor should be noted) and natural conditions (The Sudetes, Sudetian Foreland) set
foundations for the development of tourist services,
specialization in the modern kinds of industrial production (the manufacture of: means
of transport, pharmaceuticals, consumer electronics, household appliances/ white and
brown goods),
highly developed agriculture, in particular plant production which is a foundation of
the development of food processing,
numerous locations of special economic zones offering favourable conditions of
conducting a business to investors.
The general characteristics of the Lower Silesian voivodship are presented in Table 1.

Regional investment attractiveness 2014
6
Table 1. General characteristics of the economy of Lower Silesian voivodship
Feature Lower Silesian
voivodship Poland Share [%]
Market Potential
GDP per capita 2012 (PLN/person) 47140.9 41439.1 -
Population (persons) on 31
December 2013 2909997 38495659 7.60%
Human Resources Potential
Higher education institutions
graduates (persons) in 2013 39855 454986 8.80%
Secondary schools graduates
(persons) in 2013 17550 271333 6.50%
Number of employed persons in
2013 1056 15568 6.80%
Structure of employed persons in
2013
agriculture 5.6%
industry 34.8%
services 59.6%
12.0%
30.5%
57.5%
Investment outlays and capital of companies with foreign capital participation in the voivodship
Investment outlays (PLN m) in
2012 5339.6 79942.6 6.70%
Capital of companies (PLN n) in
2012 17507.2 206992 8.50%
Special Economic Zones (SEZs) in the voivodship*
Legnica SEZ
Tarnobrzeg SEZ
Distinguishing investment attractiveness ratings PAI _2 and RAI (class A, B and C)
Potential investment attractiveness PAI_2
National economy class A
Capital-intensive industry class A
Labour-intensive industry class A
Trade and repair class A
Tourism and catering class B
Real investment attractiveness RAI
National economy class A
Industry class A
Trade and repair class C
Tourism and gastronomy class B
Professional, scientific and technical services class B
Counties and communes distinguished according to the Potential Attractiveness Index for the national
economy (PAI1_GN)
Counties Class A
Class B

Regional investment attractiveness 2014
7
Communes Class A
-
-
Szczawno- -
- -Gorce (u), Jedlina-
-r), Brzeg Dolny (u-r), Siechnice (u-r),
Bogatynia (u-r), Strzegom (u- -r), Prochowice (u-r),
- - -r)
Class B
-
r), Jelcz-Laskowice (u-r), S - - - -
- - -r), Lubawka (u- -r), Stronie
- - -r), Szczytna (u-r),
-r), Trzebnica (u- -r)
Additional information: (u) urban commune, (r) rural commune, (u-r) urban-rural commune.
PAI potential investment attractiveness, RAI real investment attractiveness
* For more information see Table 2 in the Appendix.
tions.
The number of inhabitants of the voivodship amounts to 2,914,362 (as of 2013), which is
7.6% of the population of Poland. The age structure in the voivodship in 2013 was as follows:
16.9% of the population at pre-productive age, 64.1% at productive age and 19.0% at post-
productive age (for Poland it was 18.2%, 63.4% and 18.4% respectively).
The main potential for human capital creation in the voivodship lies in 35 higher education
institutions in which there are 141,707 students studying, which makes up 9.1% of all
students in Poland. Moreover, 6.9% of the secondary school students in the voivodship attend
vocational schools and 7% attend technical schools.
The registered unemployment rate in the voivodship amounted to 11.2% in August 2014,
compared to 11.7% in Poland. The average monthly gross wages and salaries in enterprises
sector in the first half-year of 2014 amounted to PLN 4011.5, which is 106.4% of the average
for Poland.
In 2012 Lower Silesian voivodship made a contribution of 8.6 % to the GDP of Poland.
Calculated per capita, it amounted to PLN 47140.9 with the average for Poland PLN 41439.1.
With this result the voivodship takes the second place in the country. The GDP growth rate in
the voivodship in the years 2003-2012 amounted to 209.3% while the average for Poland
amounted to 189.2%.
In comparison with the whole country the structure of employment in the voivodship is
characterised by a relatively high share of the service sector (59.5%) whereas a share of the
agricultural and industrial sectors are respectively 5.5% and 34.8% (Central Statistical Office,
Local Data Bank 2014).
vehicles, trailers and semi-trailers
at the end of 2013), manufacture of computers, electronic and optical products (9%), as well

Regional investment attractiveness 2014
8
as manufacture of rubber and plastic products (7%), manufacture of food products and metal
products (6% each).
High development potential of the voivodship and high level of industrialization made Lower
Silesian voivodship the main manufacturer of motor vehicles and vehicle parts in the country
The
production). It also distinguishes itself as a region that manufactures leather and leather
products (25%), textiles (20%), rubber and plastic products (11%), electric appliances (11%),
machinery and appliances (11%) and metal products (9%).
When it comes to most of the above-mentioned sectors, the voivodship improved its
competitive position w
production) 2
. It applies to the following sectors:
manufacture of motor vehicles, trailers and semi-trailers, excluding motorcycles,
manufacture of computers, electronic and optical products,
manufacture of rubber and plastic products,
manufacture of textile products,
manufacture of paper and paper products,
manufacture of chemicals and chemical products,
manufacture of fabricated metal products (except machinery and equipment).
important for the investors. The voivodship's strategic sectors mentioned in the strategy of
regional development include above all: copper ore and brown coal mining and processing,
extraction of rock mineral resources, manufacture of textiles, manufacture of food and
beverages, manufacture of wooden products, manufacture of chemical products, production of
machines and electrical appliances, production of machinery and electrical apparatus,
manufacture of glassware and ceramics, production of components and motor vehicles parts.
For the entrepreneurs willing to invest in Lower Silesian voivodship the list of the high
potential sectors may be a good hint. The list was prepared by the Polish Information and
Foreign Investment Agency in cooperation with the Lower Silesian voivodship self-
government, based on the observations on investments inflows to the voivodship. The high
potential sectors on the list include automotive, electric machines, high-tech and BPO sectors.
Investments of this kind can be located on preferential conditions in the specially prepared
places in the Special Economic Zones:
e following subzones:
2 Calculations based on the Statistical Bulletin of the Lower Silesian Voivodship from the 1st quarter of 2014
and Statistical Bulletin, I quarter of 2014, www.stat.gov.pl (10 November 2014).

Regional investment attractiveness 2014
9
-r), Janowice
-r), Nowogrodziec (u-r), Piechowice (u), Prusice (u-r),
-r),
Legnica SEZ
-r), Prochowice
(u- - -
Tarnobrzeg SEZ, subzone: Kobierzyce (r),
-r),
- -r), Jelcz-Laskowice
(u- - Ruda (u), Nowa Ruda (r),
-r), Strzelin (u-r),
- -r),
- - skie (u-r),
-r).
In the all above-mentioned locations investors can benefit from tax allowances amounting to
25% - 45%, depending on the enterprise size more information can be found on
http://www.paiz.gov.pl/investment_support/investment_incentives_in_SEZ.
2. THE PROFILE OF REGIONAL ECONOMY OF KUYAVIAN-
POMERANIAN (KUJAWSKO-POMORSKIE) VOIVODSHIP Kuyavian-Pomeranian (kujawsko-pomorskie) voivodship is situated in the central part of
the country. It is renowned for its very well-developed agriculture which has become a
foundation of the development of investments in the food industry. Moreover, for industrial
industrial investments.
The advantages of the voivodship are:
its central location in Poland, where important traffic routes intersect, including lines
belonging to the trans-European transport network TEN-T, which facilitates the
access to Polish markets and suppliers, both from Poland and abroad,
a good access to social infrastructure including in particular medical units, sanatoria
and health resorts,
good research and development facilities,
deserves a note as a UNESCO World Heritage site) and natural conditions (the
Kuyavian Lake District and its salt springs) set the foundations for the development
of tourism and health services,
Regional investment attractiveness 2014
10
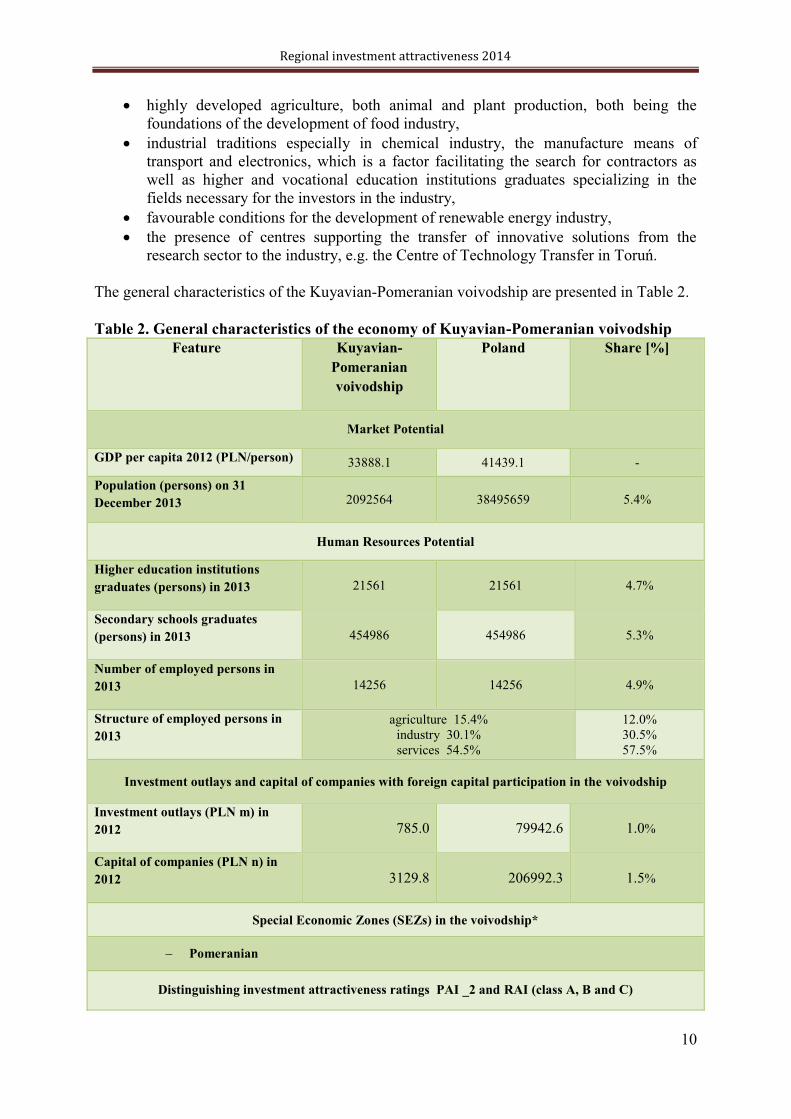
highly developed agriculture, both animal and plant production, both being the
foundations of the development of food industry,
industrial traditions especially in chemical industry, the manufacture means of
transport and electronics, which is a factor facilitating the search for contractors as
well as higher and vocational education institutions graduates specializing in the
fields necessary for the investors in the industry,
favourable conditions for the development of renewable energy industry,
the presence of centres supporting the transfer of innovative solutions from the
The general characteristics of the Kuyavian-Pomeranian voivodship are presented in Table 2.
Table 2. General characteristics of the economy of Kuyavian-Pomeranian voivodship
Feature Kuyavian-
Pomeranian
voivodship
Poland Share [%]
Market Potential
GDP per capita 2012 (PLN/person) 33888.1 41439.1 -
Population (persons) on 31
December 2013 2092564 38495659 5.4%
Human Resources Potential
Higher education institutions
graduates (persons) in 2013 21561 21561 4.7%
Secondary schools graduates
(persons) in 2013 454986 454986 5.3%
Number of employed persons in
2013 14256 14256 4.9%
Structure of employed persons in
2013
agriculture 15.4%
industry 30.1%
services 54.5%
12.0%
30.5%
57.5%
Investment outlays and capital of companies with foreign capital participation in the voivodship
Investment outlays (PLN m) in
2012 785.0 79942.6 1.0%
Capital of companies (PLN n) in
2012 3129.8 206992.3 1.5%
Special Economic Zones (SEZs) in the voivodship*
Pomeranian
Distinguishing investment attractiveness ratings PAI _2 and RAI (class A, B and C)

Regional investment attractiveness 2014
11
Real investment attractiveness RAI Industry class C
Counties and communes distinguished according to the Potential Attractiveness Index for the national
economy (PAI1_GN)
Counties Class A
Class B
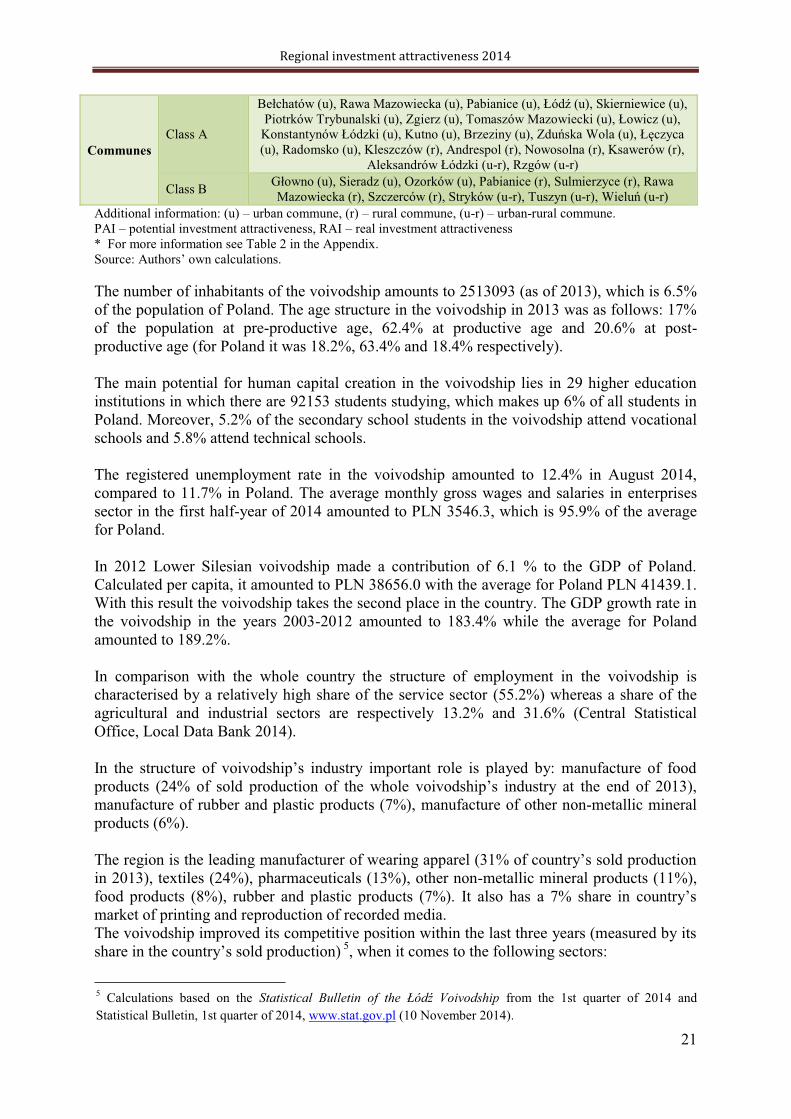
Communes
Class A -
Brodnica (u), Osielsko (r), Solec Kujawski (u- -r)
Class B -r), Barcin (u-r),
-r)
Additional information: (u) urban commune, (r) rural commune, (u-r) urban-rural commune.
PAI potential investment attractiveness, RAI real investment attractiveness
* For more information see Table 2 in the Appendix.
The number of inhabitants of the voivodship amounts to 2092564 (as of 2013), which is 5.4%
of the population of Poland. The age structure in the voivodship in 2013 was as follows:
18.5% of the population at pre-productive age, 63.7% at productive age and 17.8% at post-
productive age (for Poland it was 18.2%, 63.4% and 18.4% respectively).
The main potential for human capital creation in the voivodship lies in 22 higher education
institutions in which there are 69486 students studying, which makes up 4.5 % of all students
in Poland. Moreover, 7% of the secondary school students in the voivodship attend vocational
schools and 5.9% attend technical schools.
The registered unemployment rate in the voivodship amounted to 15.8% in August 2014,
compared to 11.7% in Poland. The average monthly gross wages and salaries in enterprises
sector in the first half-year of 2014 amounted to PLN 3303.0, which is 87.6% of the average
for Poland.
In 2012 Kuyavian-Pomeranian voivodship made a contribution of 4.4% to the GDP of Poland.
Calculated per capita, it amounted to PLN 33888.1 with the average for Poland PLN 41439.1.
With this result the voivodship takes the 10th place in the country. The GDP growth rate in
the voivodship in the years 2003-2012 amounted to 173.3% while the average for Poland
amounted to 189.2%.
In comparison with the whole country the structure of employment in the voivodship is
characterised by a relatively high share of the service sector (54.5%) whereas a share of the
agricultural and industrial sectors are respectively 15.4% and 30.1% (Central Statistical
Office, Regional Data Bank 2014).
the end of 2013),
manufacture of paper and paper products (13%), manufacture of chemicals and chemical

Regional investment attractiveness 2014
12
products (11%), manufacture of rubber and plastic products and manufacture of metal
products (9% each).
Industrial traditions and favourable location (concerning supplies) made Kuyavian-
Pomeranian voivodship the main manufacturer of paper and paper products (20% of the
manufacture of
products (7%), rubber and plastic products (7%), printing industry, manufacture of metal
products and furniture (about 6% each).
When it comes to most of the above-mentioned sectors, the voivodship improved or
maintained its competitive position within the last three years (measured by its share in the 3
. It applies to the following sectors:
manufacture of paper and paper products,
manufacture of rubber and plastic products,
manufacture of wood, wood and cork products, except furniture; articles of straw
and plaiting materials,
manufacture of fabricated metal products (except machinery and equipment),
manufacture of furniture,
manufacture of machinery and equipment.
important for the investors. The voivodship's strategic sectors mentioned in the strategy of
regional development include above all: agri-food industry and industries that strengthen
voivodship innovativeness and business environment quality.
For the entrepreneurs willing to invest in Kuyavian-Pomeranian voivodship the list of the high
potential sectors may be a good hint. The list was prepared by the Polish Information and
Foreign Investment Agency in cooperation with the Kuyavian-Pomeranian voivodship self-
government, based on the observations on investments inflows to the voivodship. The high
potential sectors on the list include electronic, electric machines, chemical and food sectors.
Investments of this kind can be located on preferential conditions in the specially prepared
places in the Special Economic Zone: Pomeranian SEZ, in the following subzones:
Pomeranian SEZ, subzones: Barcin (u-r
Pomorskie (u- -
In the all above-mentioned locations investors can benefit from tax allowances amounting to
35% - 55%, depending on the enterprise size more information can be found on
3 Calculations based on the Statistical Bulletin of the Kuyavian-Pomeranian Voivodship from the 1st quarter of
2014 and Statistical Bulletin, 1st quarter of 2014, www.stat.gov.pl (10 November 2014). A change of 0.25
percentage point was considered as maintaining competitive position.

Regional investment attractiveness 2014
13
http://www.paiz.gov.pl/investment_support/investment_incentives_in_SEZ.
3. THE PROFILE OF REGIONAL ECONOMY OF LUBLIN
VOIVODSHIP Lublin voivodship is situated in central-eastern Poland. It stands out in terms of exceptionally
favourable conditions for the development of food industry because of the agricultural
character of the most part of the voivodship and very high specialisation in cultivation of
industrial plants, fruit and vegetables. The cleanness of natural environment, multiculturalism
the Polesie and Roztocze National Parks as well as 16 landscape parks) create good
conditions for the development of tourism (including agritourism) and regional products
manufacturing (including ecological food).
Moreover, the advantages of the voivodship are:
its favourable location on an international traffic route, i.e. pan-European corridor
East-West, which makes foreign market accessible, including the ones of Ukraine and
Belarus,
relatively low labour costs (wages and salaries amounting to 87.9% of the national
average) and at the same time access to well-qualified human resources in the cities of
the region,
big R&D potential thanks to an important role of academic establishments of Lublin in
the Polish science and higher education. In 2010 the Ministry of Science and Higher
Education ranked among the best scientific establishments in Poland the following
d the Faculty
of Law, Canon Law and Administration of the John Paul II Catholic University of
Lublin, the Faculty of Law and Administration of the Maria Curie-
the Pharmaceutical Faculty with Medical Analytics Division of the Medical University
of Lublin as well as the Institute for Central-Eastern Europe in Lublin,
industrial traditions, in particular in reference to transport, machine, chemical and food
industries,
predestination to the development of BPO by virtue of access to well-qualified human
resources and their low wage expectations.
The general characteristics of the Lublin voivodship are presented in Table 3.

Regional investment attractiveness 2014
14
Table 3. General characteristics of the economy of Lublin voivodship
Feature Lublin
voivodship
Poland Share [%]
Market Potential
GDP per capita 2012 (PLN/person) 28374.6 41439.1 -
Population (persons) on 31
December 2013 2156150 38495659 5.6%
Human Resources Potential
Higher education institutions
graduates (persons) in 2013 27326 454986 6.0%
Secondary schools graduates
(persons) in 2013 17420 271333 6.4%
Number of employed persons in
2013 958 15568 6.2%
Structure of employed persons in
2013 agriculture 26.5%
industry 21.8%
services 51.7%
12.0%
30.5%
57.5%
Investment outlays and capital of companies with foreign capital participation in the voivodship
Investment outlays (PLN m) in
2012 520.4 79942.6 0.7%
Capital of companies (PLN n) in
2012 1526.0 206992.3 0.7%
Special Economic Zones (SEZs) in the voivodship*
Mielec
Starachowice
Tarnobrzeg
Counties and communes distinguished according to the Potential Attractiveness Index for the national
economy (PAI1_GN)
Counties Class A
Class B
Communes
Class A
-r)
Class B -r),
Lubelski (u-r), Parczew (u-r), Kazimierz Dolny (u-r)
Additional information: (u) urban commune, (r) rural commune, (u-r) urban-rural commune.
PAI potential investment attractiveness, RAI real investment attractiveness
* For more information see Table 2 in the Appendix.
The number of inhabitants of the voivodship amounts to 2156150 (as of 2013), which is 5.6%
of the population of Poland. The age structure in the voivodship in 2013 was as
follows:18.4% of the population at pre-productive age, 62.7% at productive age and 18.9% at
post-productive age (for Poland it was 18.2%, 63.4% and 18.4% respectively).
Regional investment attractiveness 2014
15
The main potential for human capital creation in the voivodship lies in 19 higher education
institutions in which there are 85876 students studying, which makes up 5.5% of all students
in Poland. Moreover, 4.8% of the secondary school students in the voivodship attend
vocational schools and 5.7% attend technical schools.
The registered unemployment rate in the voivodship amounted to 12.6% in August 2014,
compared to 11.7% in Poland. The average monthly gross wages and salaries in enterprises
sector in the first half-year of 2014 amounted to PLN 3379.0, which is 87.3% of the average
for Poland.
In 2012 Lublin voivodship made a contribution of 3.8 % to the GDP of Poland. Calculated per
capita, it amounted to PLN 28374.6with the average for Poland PLN 41439.1. With this result
the voivodship takes the 15th place in the country. The GDP growth rate in the voivodship in
the years 2003-2012 amounted to 178.9% while the average for Poland amounted to 189.2%.
In comparison with the whole country the structure of employment in the voivodship is
characterised by a relatively high share of the service sector (51.7%) whereas a share of the
agricultural and industrial sectors are respectively 26.5% and 21.8% (Central Statistical
Office, Regional Data Bank 2014).
The
manufacture of beverages (5%), manufacture of machinery and appliances and manufacture
of metal products (4% each).
The region is the main manufacturer of beverages (% of sold production of the whole
When it comes to most of the above-mentioned sectors, the voivodship improved or
maintained its competitive position within the last three years (measured by its share in the
manufacture of food products,
manufacture of machinery and appliances,
manufacture of paper and paper products,
printing and reproduction of recorded media,
manufacture of pharmaceutical products.
important for the investors. The voivodship's strategic sectors mentioned in the strategy of
regional development include above all: electronic, electromachinery, chemical and food
sectors.
Investments of this kind can be located on preferential conditions in the specially prepared
places in the Special Economic Zones: Mielec SEZ, Starachowice SEZ, Tarnobrzeg SEZ
in the following subzones:
Mielec SEZ, subzones:
Starachowice SEZ, subzones:

Regional investment attractiveness 2014
16
Tarnobrzeg SEZ, subzones: -r),
-r), Ryki (u-
Lubelski (r).
In the all above-mentioned locations investors can benefit from tax allowances amounting to
50% - 70%, depending on the enterprise size more information can be found on
http://www.paiz.gov.pl/investment_support/investment_incentives_in_SEZ.
4. THE PROFILE OF REGIONAL ECONOMY OF LUBUSZ
(LUBUSKIE) VOIVODSHIP Lubusz (Lubuskie) voivodship is situated in central-western Poland. It borders Germany,
which facilitates international economic cooperation. Fourteen border crossings and the
membership of the Pro Europe Viadrina Euroregion and Spree-Neisse-Bober Euroregion
create good conditions for economic cooperation. The main socio-economic and
administrative centres are
-governmental authorities.
The advantages of the voivodship include:
a highly beneficial geopolitical location at the Western border, which allows to access
attractive sales markets of Germany and other Western Europe countries,
a beneficial location on an international traffic route, i.e. pan-European corridor East-
West, which enables access to the foreign markets,
a very well-developed regional communications network both roads and railways, well-
developed near-border infrastructure,
a well-developed network of water transport (the Oder system enables to ship by barges
from Lower Silesia to the port complex of Szczecin- -
Spree and Oder-Havel channels Lower Silesia is connected to the system of inland
waterways of Western Europe),
very good access to the Internet (in this respect the voivodship belongs to the highest
rated regions in Poland),
the transborder location of international Viadrina University offering among others the
following courses of study: management, international management, economics,
international business administration, German law, German-Polish law, cultural studies,
UNESCO World Heritage site) as well as numerous lakes, all conducive to the
development of tourism,
good conditions of the development of industry thanks to the presence of higher
education institutions offering technical courses of studies and attractive investment
offers from special economic zones.

Regional investment attractiveness 2014
17
The general characteristics of the Lubusz voivodship are presented in Table 4.
Table 4. General characteristics of the economy of Lubusz voivodship
Feature Lubusz
voivodship
Poland Share [%]
Market Potential
GDP per capita 2012 (PLN/person) 34282.0 41439.1 -
Population (persons) on 31
December 2013 1021470 38495659 2.7%
Human Resources Potential
Higher education institutions
graduates (persons) in 2013 5996 454986 1.3%
Secondary schools graduates
(persons) in 2013 6417 271333 2.4%
Number of employed persons in
2013 405 15568 2.6%
Structure of employed persons in
2013 agriculture 8.7%
industry 33.2%
services 58.1%
12.0%
30.5%
57.5%
Investment outlays and capital of companies with foreign capital participation in the voivodship
Investment outlays (PLN m) in 2012 605.9 79942.6 0.8%
Capital of companies (PLN n) in
2012 1958.1 206992.3 0.9%
Special Economic Zones (SEZs) in the voivodship*
Kostrzyn-
Distinguishing investment attractiveness ratings PAI _2 and RAI (class A, B and C)
Potential investment attractiveness PAI_2
Real investment attractiveness RAI National economy class C
Industry class C
Counties and communes distinguished according to the Potential Attractiveness Index for the national
economy (PAI1_GN)
Counties Class A city
Communes
Class A -r)
Class B Babimost (u- -r),
- -r), Skwierzyna (u-r), Wschowa (u-r)
Additional information: (u) urban commune, (r) rural commune, (u-r) urban-rural commune.
PAI potential investment attractiveness, RAI real investment attractiveness
* For more information see Table 2 in the Appendix.

Regional investment attractiveness 2014
18
The number of inhabitants of the voivodship amounts to 1021470 (as of 2013), which is 2.7%
of the population of Poland. The age structure in the voivodship in 2013 was as follows:
18.4% of the population at pre-productive age, 64.4% at productive age and 17.2% at post-
productive age (for Poland it was 18.2%, 63.4% and 18.4% respectively).
The main potential for human capital creation in the voivodship lies in 8 higher education
institutions in which there are 19000 students studying, which makes up 1.2% of all students
in Poland. Moreover, 3.1% of the secondary school students in the voivodship attend
vocational schools and 2.9% attend technical schools.
The registered unemployment rate in the voivodship amounted to 13.1% in August 2014,
compared to 11.7% in Poland. The average monthly gross wages and salaries in enterprises
sector in the first half-year of 2014 amounted to PLN 3293.5, which is 94% of the average for
Poland.
In 2012 Lubusz voivodship made a contribution of 2.2% to the GDP of Poland. Calculated per
capita, it amounted to PLN 34282.0 with the average for Poland PLN 41439.1. With this
result the voivodship takes the 9th place in the country. The GDP growth rate in the
voivodship in the years 2003-2012 amounted to 181.9% while the average for Poland
amounted to 189.2%.
The structure of employment in the voivodship is characterised by a relatively high share of
the service sector (58.1%) whereas shares of the agricultural and industrial sectors are
respectively 8.7% and 33.2% (Central Statistical Office, Regional Data Bank 2014).
ry important role is played by: manufacture of motor
vehicles, trailers and semi-trailers (excluding motorcycles) (16% of sold production of the
wood, wood and cork
products, except furniture; articles of straw and plaiting materials (14%), manufacture of food
products (10%), manufacture of paper and paper products (9%).
The region is the main manufacturer of wood, wood and cork products, except furniture (13%
of sold production of the whole
products (10%).
When it comes to most of the above-mentioned sectors, the voivodship improved its
production) 4
. It applies to the following sectors:
manufacture of leather and leather products,
manufacture of fabricated metal products (except machinery and equipment),
manufacture of furniture,
manufacture of motor vehicles trailers and semi-trailers (excluding motorcycles).
4 Calculations based on the Statistical Bulletin of the Lubusz Voivodship from the 1st quarter of 2014 and
Statistical Bulletin, 1st quarter of 2014, www.stat.gov.pl (10 November 2014). A change of 0.25 percentage
point was considered as maintaining competitive position.

Regional investment attractiveness 2014
19
important for the investors. The voivodship's strategic sectors mentioned in the strategy of
regional development include above all: wood pulp and paper, wood, electronic, food, glass,
construction ceramics, machines and biotechnology.
For the entrepreneurs willing to invest in Lubusz voivodship the list of the high potential
sectors may be a good hint. The list was prepared by the Polish Information and Foreign
Investment Agency in cooperation with the Lubusz voivodship self-government, based on the
observations on investments inflows to the voivodship. The high potential sectors on the list
include automotive industry and electronics, timber industry, food industry and glass industry.
Investments of this kind can be located on preferential conditions in the specially prepared
places in the Special Economic Zones: Kostrzyn- in the
following subzones:
Kostrzyn- ubice SEZ, subbzones: - -r),
Dobiegniew (u- -r),
-r), Lubsko (u- -
(u), Rzepin (u-r), Skwierzyna (u- - -
: Szprotawa (u-r).
In the all above-mentioned locations investors can benefit from tax allowances amounting to
35% - 55%, depending on the enterprise size more information can be found on
http://www.paiz.gov.pl/investment_support/investment_incentives_in_SEZ.
5. THE PROFILE OF REGIONAL ECONOMY OF
VOIVODSHIP
Europe. It is a region with industrial traditions associated with textile industry and
other branches
of industry develop in the region, in particular the manufacture of household appliances
(white and brown goods) and biotech industry.
The advantages of the voivodship are:
its excellent location in terms of communications; in the voivodship, in the proximity
attractiveness as a location for investments targeted at domestic market of Poland.
access to big human resources including not only cheap low-qualified workers but also
well-qualified employees, which is possible thanks to the presence of numerous higher
and vocational education institutions,
big R&D potential of the higher education institutions and research establishments of

Regional investment attractiveness 2014
20
substantial resources of brown coal thanks to which the surplus of cheap electricity is
available in the voivodship,
large resources of thermal waters which can set the foundations for the development of
renewable energy and health resorts in the region,
attractive investment offers for investors in the locations of special economic zones.
5.
Table 5
Feature voivodship Poland Share [%]
Market Potential
GDP per capita 2012 (PLN/person) 38656.0 41439.1 -
Population (persons) on 31
December 2013 2513093 38495659 6,5%
Human Resources Potential
Higher education institutions
graduates (persons) in 2013 25846 454986 5,7%
Secondary schools graduates
(persons) in 2013 17365 271333 6,4%
Number of employed persons in
2013 1248 15568 8,0%
Structure of employed persons in
2013 agriculture 13.2%
industry 31.6%
services 55.2%
12.0%
30.5%
57.5%
Investment outlays and capital of companies with foreign capital participation in the voivodship
Investment outlays (PLN m) in
2012 2565.1 79942.6 3.2%
Capital of companies (PLN n) in
2012 5096.1 206992.3 2.5%
Special Economic Zones (SEZs) in the voivodship*
Starachowice
Distinguishing investment attractiveness ratings PAI _2 and RAI (class A, B and C)
Potential investment attractiveness PAI_2 National economy class C
Capital-intensive industry class C
Labour-intensive industry class C
Trade class C
Real investment attractiveness RAI National economy class C
Trade class B
Tourism class C
Counties and communes distinguished according to the Potential Attractiveness Index for the national
economy (PAI1_GN)
Counties Class A
Regional investment attractiveness 2014
21
Communes
Class A
- -r)
Class B -r), Tuszyn (u- -r)
Additional information: (u) urban commune, (r) rural commune, (u-r) urban-rural commune.
PAI potential investment attractiveness, RAI real investment attractiveness
* For more information see Table 2 in the Appendix.
The number of inhabitants of the voivodship amounts to 2513093 (as of 2013), which is 6.5%
of the population of Poland. The age structure in the voivodship in 2013 was as follows: 17%
of the population at pre-productive age, 62.4% at productive age and 20.6% at post-
productive age (for Poland it was 18.2%, 63.4% and 18.4% respectively).
The main potential for human capital creation in the voivodship lies in 29 higher education
institutions in which there are 92153 students studying, which makes up 6% of all students in
Poland. Moreover, 5.2% of the secondary school students in the voivodship attend vocational
schools and 5.8% attend technical schools.
The registered unemployment rate in the voivodship amounted to 12.4% in August 2014,
compared to 11.7% in Poland. The average monthly gross wages and salaries in enterprises
sector in the first half-year of 2014 amounted to PLN 3546.3, which is 95.9% of the average
for Poland.
In 2012 Lower Silesian voivodship made a contribution of 6.1 % to the GDP of Poland.
Calculated per capita, it amounted to PLN 38656.0 with the average for Poland PLN 41439.1.
With this result the voivodship takes the second place in the country. The GDP growth rate in
the voivodship in the years 2003-2012 amounted to 183.4% while the average for Poland
amounted to 189.2%.
In comparison with the whole country the structure of employment in the voivodship is
characterised by a relatively high share of the service sector (55.2%) whereas a share of the
agricultural and industrial sectors are respectively 13.2% and 31.6% (Central Statistical
Office, Local Data Bank 2014).
manufacture of rubber and plastic products (7%), manufacture of other non-metallic mineral
products (6%).
in 2013), textiles (24%), pharmaceuticals (13%), other non-metallic mineral products (11%),
food products
market of printing and reproduction of recorded media.
The voivodship improved its competitive position within the last three years (measured by its
duction) 5
, when it comes to the following sectors:
5 Calculations based on the Statistical Bulletin from the 1st quarter of 2014 and
Statistical Bulletin, 1st quarter of 2014, www.stat.gov.pl (10 November 2014).

Regional investment attractiveness 2014
22
manufacture of food products,
manufacture of rubber and plastic products,
manufacture of metal (except machinery and equipment),
manufacture of furniture,
manufacture of pharmaceuticals,
manufacture of motor vehicles (excluding motorcycles), trailers and semi-trailers,
manufacture of computers, electronic and optical products,
manufacture of other non-metallic products,
manufacture of paper and paper products.
The information on sectors that are f
important for the investors. The voivodship's strategic sectors mentioned in the strategy of
regional development include above all: energy production, logistics, textile manufacture,
agri-food industry, construction, chemical industry, biotechnology.
may be a good hint. The list was prepared by the Polish Information and Foreign Investment
Agency in coopera -government, based on the observations
on investments inflows to the voivodship. The high potential sectors on the list include textile,
wearing apparel and knitting industry, advanced building materials, medicine, pharmacy,
cosmetics, energy production (including renewable energy sources), innovative agriculture
and agri-food industry, media, informatics and telecommunications, mechatronics.
Investments of this kind can be located on preferential conditions in the specially prepared
places in the Special Economic Zones:
the following subzones:
: -
-
-
Trybunalski (u), Radomsko (u), Rawa Mazowiecka (u), Sieradz (u), Skierniewice (u),
- zowiecki (r),
- -r),
- -r),
Starachowice SEZ in subzone
In the all above-mentioned locations investors can benefit from tax allowances amounting to
35% - 55%, depending on the enterprise size more information can be found on
http://www.paiz.gov.pl/investment_support/investment_incentives_in_SEZ.

Regional investment attractiveness 2014
23
6. THE PROFILE OF REGIONAL ECONOMY OF LESSER
POLAND (M ) VOIVODSHIP Lesser Poland voivodship is situated in central-southern Poland and borders Slovakia. It is an
important region for Polish tourism because of its attractive mountain areas in the south of the
voivodship (the Tatra mountains and the Podhale) as well as numerous cultural monuments.
Cracow, a former capital of Poland, now its second largest city, plays a particular role for
Lesser Poland and for the economy of entire Poland. Lesser Poland stands out in terms of a
very high density of population, which is chiefly due to the land fragmentation.
The advantages of the voivodship are:
a convenient location in terms of communication: a main transit corridor from
Western Europe to the Ukraine (A4 highway), convenient train connection (the
European transport corridor TINA III runs through the region); international airport in
-Balice (the second largest airport in Poland); six road border crossings and
big R&D potential of the higher education institutions and research establishments of
Cracow among which scientific establishments ranked by the Ministry of Science and
Higher Education in the highest category constitute a numerous group,
substantial human resources, both low-qualified workers with low wage expectations
and well-qualified specialists,
great tourist attractions, in particular UNESCO World Heritage sites deserve a note:
The Old Town in Cracow, Auschwitz-Birkenau, German Nazi Concentration and
Extermination Camp (1940-1945), Wieliczka Salt Mine, the Mannerist Architectural
and Park Landscape Complex and Pilgrimage Park in Kalwaria Zebrzydowska,
wooden churches of southern Lesser Poland in Binarowa, Blizne, Lipnica Murowana,
investment incentives for investors offered in special economic zones.
The general characteristics of the Lesser Poland voivodship are presented in Table 6.

Regional investment attractiveness 2014
24
Table 6. General characteristics of the economy of Lesser Poland voivodship
Feature Lesser Poland
voivodship Poland Share [%]
Market Potential
GDP per capita 2012 (PLN/person) 35163.6 41439.1 -
Population (persons) on 31
December 2013 3360581 38495659 8.7%
Human Resources Potential
Higher education institutions
graduates (persons) in 2013 53988 454986 11.9%
Secondary schools graduates
(persons) in 2013 26649 271333 9.8%
Number of employed persons in
2013 1315 15568 8.4%
Structure of employed persons in
2013
agriculture 11.9%
industry 31.4%
services 56.7%
12.0%
30.5%
57.5%
Investment outlays and capital of companies with foreign capital participation in the voivodship
Investment outlays (PLN m) in
2012 2986.2 79942.6 3.7%
Capital of companies (PLN n) in
2012 13148.5 206992.3 6.4%
Special Economic Zones (SEZs) in the voivodship*
Katowice
Mielec
Distinguishing investment attractiveness ratings PAI _2 and RAI (class A, B and C)
Potential investment attractiveness PAI_2
National economy class B
Capital-intensive industry class B
Labour-intensive industry class B
Trade class C
Tourism class B
Education class C
Real investment attractiveness RAI
Industry class C
Tourism class C
Professional, scientific and technical activities class A
Counties and communes distinguished according to the Potential Attractiveness Index for the national
economy (PAI1_GN)
Counties Class A
Class B
Communes Class A
(r), Klucze (r), Nie - -r), Olkusz (u-r), Skawina (u-r),
Wieliczka (u- -r), Zator (u- -r), Alwernia (u-r),

Regional investment attractiveness 2014
25
Dobczyce (u-r), Wadowice (u- - -r),
Krynica- -r), Trzebinia (u-r), Brzeszcze (u-r)
Class B -Luborzyca (r), Polanka Wielka (r), Pcim (r), Spytkowice (r),
Jerzmanowice-
Krzeszowice (u-r), Wolbrom (u- - -r), Brzesko (u-r),
Piwniczna- -r), Muszyna (u-r), - -r), Nowy
-r)
Additional information: (u) urban commune, (r) rural commune, (u-r) urban-rural commune.
PAI potential investment attractiveness, RAI real investment attractiveness
* For more information see Table 2 in the Appendix.
The number of inhabitants of the voivodship amounts to 3360581 (as of 2013), which is 8.7%
of the population of Poland. The age structure in the voivodship in 2013 was as follows:
19.2% of the population at pre-productive age, 63.1% at productive age and 17.7% at post-
productive age (for Poland it was 18.2%, 63.4% and 18.4% respectively).
The main potential for human capital creation in the voivodship lies in 32 higher education
institutions in which there are 189609 students studying, which makes up 12.2% of all
students in Poland. Moreover, 10.4% of the secondary school students in the voivodship
attend vocational schools and 9.4% attend technical schools.
The registered unemployment rate in the voivodship amounted to 10% in August 2014,
compared to 11.7% in Poland. The average monthly gross wages and salaries in enterprises
sector in the first half-year of 2014 amounted to PLN 3614.9, which is 124.8% of the average
for Poland.
In 2012 Lesser Poland voivodship made a contribution of 7.4 % to the GDP of Poland.
Calculated per capita, it amounted to PLN 35163.6 with the average for Poland PLN 41439.1.
With this result the voivodship takes the second place in the country. The GDP growth rate in
the voivodship in the years 2003-2012 amounted to 192% while the average for Poland
amounted to 189.2%.
The structure of employment in the voivodship is characterised by a relatively high share of
the service sector (56.7%) whereas a share of the agricultural and industrial sectors are
respectively 11.9% and 31.4% (Central Statistical Office, Regional Data Bank 2014).
manufacture of metal products (8%), manufacture of electric appliances (6%), manufacture of
rubber and plastic products (5%) and manufacture of metals (5%).
Traditions of breeding animals made Lesser Poland an important manufacturer of leather and
at
the end of 2013). The voivodship also distinguished itself as a manufacturer of metals (9%)
and metal products (9%), electric appliances (9%) and clothing (7%).

Regional investment attractiveness 2014
26
When it comes to most of the above-mentioned sectors, the voivodship improved its
competit
production) 6
. It applies to the following sectors:
manufacture of food products,
manufacture of metal products,
manufacture of leather and leather products,
manufacture of fabricated metal products (except machinery and equipment),
manufacture of computers, electronic and optical products,
manufacture of machinery and appliances,
manufacture of textiles.
The information on sectors that are found as strategi
important for the investors. The voivodship's strategic sectors mentioned in the strategy of
regional development include above all: education, higher education and science, information
society, research and development, high-tech sector, tourism and culture.
For the entrepreneurs willing to invest in Lesser Poland voivodship the list of the high
potential sectors may be a good hint. The list was prepared by the Polish Information and
Foreign Investment Agency in cooperation with the Lesser Poland voivodship self-
government, based on the observations on investments inflows to the voivodship. The high
potential sectors on the list include:
biotechnology and life sciences,
sustainable energy,
ICT/BPO/SSC,
chemistry,
metals and metal products,
electrotechnical and machine industry,
creative industries, including free-time industry.
Investments of this kind can be located on preferential conditions in the specially prepared
places in the Special Economic Zones: Katowic
following subzones:
Katowice SEZ, in subzones: -r),
subzones: -r), Bochnia (u), Bochnia (r), Bukowno (u),
- - -r), Dobczyce
(u- -
- - -r), Wolbrom
(u- -r),
SSE Mielec, in subzone Gorlice (u).
6 Calculations based on the Statistical Bulletin of the Lesser Poland Voivodship from the 1st quarter of 2014 and
Statistical Bulletin, I quarter of 2014, www.stat.gov.pl (10 November 2014).
Regional investment attractiveness 2014
27
In the all above-mentioned locations investors can benefit from tax allowances amounting to
35% - 55%, depending on the enterprise size more information can be found on
http://www.paiz.gov.pl/investment_support/investment_incentives_in_SEZ.
7. THE PROFILE OF REGIONAL ECONOMY OF MAZOVIAN
(MAZOWIECKIE) VOIVODSHIP Mazovian voivodship is situated in central-eastern Poland in the Mazovian Lowlands. It is
the largest and most populous region of Poland. It is the most economically developed and the
most attractive voivodship for investments and distances all other regions of Poland in terms
of GDP per capita. A characteristic feature of the region is its servicisation, which means that
in accordance with a high level of economic development modern services like financial
intermediation, business services, telecommunications and education play an important role.
Moreover, almost all branches of industry have developed in Mazovia, particularly
manufacture of means of transportation and petrochemical industry. The main administrative
centre is Warsaw, the capital city of Poland, which (together with its suburban area) is one of
the most attractive investment areas in the whole country.
The advantages of the voivodship are:
its central location at the intersection of traffic routes and in the trans-European
transport corridors providing connection to the larger cities of Poland and Europe,
Poland's largest international airport, i.e. Warsaw Chopin Airport, which handles
almost 50% of the whole passenger traffic in Poland and maintains ca. 100 regular
plane connections with domestic and foreign airports,
presence of numerous higher education institutions and research establishments,
the highest GDP per capita rate in the country,
substantial human resources, including both low-qualified workers with low wage
expectations and specialists trained in various fields,
very high labour productivity compensating a relatively high level of wages and
salaries,
presence of the Warsaw Stock Exchange, the capital centre of Central and Eastern
Europe,
investment incentives for investors offered in special economic zones.
The general characteristics of the Mazovian voivodship are presented in Table 7.

Regional investment attractiveness 2014
28
Table 7. General characteristics of the economy of Mazovian voivodship
Feature Mazovian
voivodship Poland Share [%]
Market Potential
GDP per capita 2012 (PLN/person) 67996.0 41439.1 -
Population (persons) on 31
December 2013 5316840 38495659 13.8%
Human Resources Potential
Higher education institutions
graduates (persons) in 2013 79159 454986 17.4%
Secondary schools graduates
(persons) in 2013 38183 271333 14.1%
Number of employed persons in
2013 2408 15568 15.5%
Structure of employed persons in
2013 agriculture 11.0%
industry 22.2%
services 66.8%
12.0%
30.5%
57.5%
Investment outlays and capital of companies with foreign capital participation in the voivodship
Investment outlays (PLN m) in
2012 39236.5 79942.6 49.1%
Capital of companies (PLN n) in
2012 98456.7 206992.3 47.6%
Special Economic Zones (SEZs) in the voivodship*
Starachowice
Tarnobrzeg
Warmian-Mazurian
Distinguishing investment attractiveness ratings PAI _2 and RAI (class A, B and C)
Potential investment attractiveness PAI_2
National economy class A
Capital-intensive industry class A
Labour-intensive industry class A
Trade class A
Tourism class A
Education class A
Real investment attractiveness RAI
National economy class A
Industry class A
Trade class A
Tourisma class A
Professional, scientific and economic activities class A
Counties and communes distinguished according to the Potential Attractiveness Index for the national
economy (PAI1_GN)
Counties Class A
Warszawa,
Piaseczno, Warsaw West, Grodzisk Mazowiecki, city of Radom
Class B Legionowo

Regional investment attractiveness 2014
29
Communes
Class A
-r),
-r), Konstancin-Jeziorna (u-r), Grodzisk Mazowiecki (u-
- -r), Serock (u-r), Kozienice (u-r), Radzymin (u-r),
-r), Tarczyn (u- - - -r),
- zegi (u-r)
Class B - -r),
Karczew (u- - -r)
Additional information: (u) urban commune, (r) rural commune, (u-r) urban-rural commune.
PAI potential investment attractiveness, RAI real investment attractiveness
* For more information see Table 2 in the Appendix.
The number of inhabitants of the voivodship amounts 5316840 (as of 2013), which is 13.8%
of the population of Poland. The age structure in the voivodship in 2013 was as follows:
18.5% of the population at pre-productive age, 62.5% at productive age and 19.0% at post-
productive age (for Poland it was 18.2%, 63.4% and 18.4% respectively).
The main potential for human capital creation in the voivodship lies in 107 higher education
institutions in which there are 294413 students studying, which makes up 19% of all students
in Poland. Moreover, 9.2% of the secondary school students in the voivodship attend
vocational schools and 11.3% attend technical schools.
The registered unemployment rate in the voivodship amounted to 10.1% in August 2014,
compared to 11.7% in Poland. The average monthly gross wages and salaries in enterprises
sector in the first half-year of 2014 amounted to PLN 4707.5, which is 124.8% of the average
for Poland.
In 2012 Mazovian voivodship made a contribution of 22.7 % to the GDP of Poland.
Calculated per capita, it amounted to PLN 67996 with the average for Poland PLN 41439.1.
With this result the voivodship takes the first place in the country. The GDP growth rate in the
voivodship in the years 2003-2012 amounted to 205.3% while the average for Poland
amounted to 189.2%.
In comparison with the whole country the structure of employment in the voivodship is
characterised by a relatively high share of the service sector (66.8%) whereas a share of the
agricultural and industrial sectors are respectively 11% and 11.2% (Central Statistical Office,
Regional Data Bank 2014).
and air conditioning supply (19 % of sold production of the whole voivodsh
the end of 2013), manufacture of food products (18%) and manufacture of chemicals and
chemical products (7%).
As the biggest Polish region the voivodship takes leading positions when it comes to
competitive position in the most industri
production of the following industries:

Regional investment attractiveness 2014
30
production in 2013)
printing and reproduction of recorded media (28%)
manufacture of beverages (28%),
manufacture of basic pharmaceutical products and pharmaceutical preparation (25%),
manufacture of food products (24%)
manufacture of computers, electronic and optical products (23%)
manufacture of electric appliances (21%)
.
The voivodship improved or maintained its competitive position within the last three years 7
in the following sectors:
manufacture of food products,
manufacture of paper and paper products,
manufacture of chemicals and chemical products,
manufacture fabricated metal products (except machinery and equipment),
electrical equipment and non-electric household appliances,
manufacture of computers, electronic and optical products,
manufacture of electric appliances,
manufacture of machinery and appliances.
important for the investors. The voivodship's strategic sectors mentioned in the strategy of
regional development include above all: agriculture, industry, services, tourism (especially
foreign), chemical industry, construction, logistics, food industry, growth of innovativeness
and competitiveness of the region, teleinformatization, improvement of communication and
transport on the region (especially civil aviation) and multifunctional development of rural
areas.
For the entrepreneurs willing to invest in Mazovian voivodship the list of the high potential
sectors may be a good hint. The list was prepared by the Polish Information and Foreign
Investment Agency in cooperation with the Mazovian voivodship self-government, based on
the observations on investments inflows to the voivodship. The high potential sectors on the
list include food, construction and BPO sectors.
Investments of this kind can be located on preferential conditions in the specially prepared
places in the Special Economic Zones:
Tarnobrzeg SEZ, Warmian-Mazurian SEZ, in the following subzones:
in subzones: Grodzisk Mazowiecki (u-
Starachowice SEZ in subzones: - -r),
in subzones:
7 Calculations based on the Statistical Bulletin of the Mazovian Voivodship from the 1st quarter of 2014 and
Statistical Bulletin, I quarter of 2014, www.stat.gov.pl (10 November 2014).

Regional investment attractiveness 2014
31
Tarnobrzeg SEZ in subzones: -r),
-r), Pilawa (u-r), Pionki (u), Przasnysz (r), Radom (u), Siedlce
-r),
Warmian-Mazurian SEZ in subzones:
In the all above-mentioned locations investors can benefit from tax allowances in most
- 55% (except from Warsaw, where it amounts
from 15% to 35% till 31 December 2017 and from 10% to 30% since 1 January 2018; and
enterprise size more information can be found on
http://www.paiz.gov.pl/investment_support/investment_incentives_in_SEZ.
8. THE PROFILE OF REGIONAL ECONOMY OF OPOLE
(OPOLE) VOIVODSHIP
Opole voivodship is situated in the south-western part of Poland. It is a region with very
intensive agriculture thanks to which it is a beneficial location for food industry. The high
level of agrarian culture and fertile soils also influence positively the quality of location for
food industry. The region has long-established industrial traditions, in particular in the
manufacture of food, mineral products, metal products, machinery and equipment as well as
chemicals and chemical products. Its near-border location and numerous border crossings
(both road and railway ones) predisposes the region to cooperation with Germany and the
Czech Republic.
The advantages of the voivodship are also:
its location on main domestic and European traffic routes (A4 highway),
excellent access to inland shipping thanks to the Oder and the Gliwice-
largest inland port in Poland),
well-developed communications infrastructure including access to the Internet (the
voivodship belongs to the highest rated regions in Poland),
presence of higher education institutions,
rich resources for manufacture of mineral products the possibility of specialisation
in sectors supporting the construction industry,
multicultural mindset of the inhabitants of the voivodship which results in their
tolerance and openness to the inflow of foreign capital; this feature is strengthened by
the membership of Opole voivodship of the Praded Euroregion and the Silesia
Euroregion.
The general characteristics of the Opole voivodship are presented in Table 8.

Regional investment attractiveness 2014
32
Table 8. General characteristics of the economy of Opole voivodship
Feature Opole voivodship Poland Share [%]
Market Potential
GDP per capita 2012 (PLN/person) 33071.0 41439.1 -
Population (persons) on 31
December 2013 1004416 38495659 2.6%
Human Resources Potential
Higher education institutions
graduates (persons) in 2013 10850 454986 2.4%
Secondary schools graduates
(persons) in 2013 6119 271333 2.3%
Number of employed persons in
2013 346 15568 2.2%
Structure of employed persons in
2013
agriculture 11.9%
industry 36.3%
services 51.8%
12.0%
30.5%
57.5%
Investment outlays and capital of companies with foreign capital participation in the voivodship
Investment outlays (PLN m) in
2012 950.8 79942.6 1.2%
Capital of companies (PLN n) in
2012 1708.4 206992.3 0.8%
Special Economic Zones (SEZs) in the voivodship*
Katowice SEZ
Starachowice SEZ
Distinguishing investment attractiveness ratings PAI _2 and RAI (class A, B and C)
Potential investment attractiveness PAI_2
Real investment attractiveness RAI Trade class C
Counties and communes distinguished according to the Potential Attractiveness Index for the national
economy (PAI1_GN)
Counties Class A city of Opole
Communes
Class A
-
-r), Prudnik (u- -r), Gogolin
(u-r)
Class B -r), Krapkowice (u-r),
Kluczbork (u-r), Ujazd (u- -r)
Additional information: (u) urban commune, (r) rural commune, (u-r) urban-rural commune.
PAI potential investment attractiveness, RAI real investment attractiveness
* For more information see Table 2 in the Appendix.
The number of inhabitants of the voivodship amounts to 1004416 (as of 2013), which is 7.6%
of the population of Poland. The age structure in the voivodship in 2013 was as follows:
Regional investment attractiveness 2014
33
16.4% of the population at pre-productive age, 64.7% at productive age and 18.9% at post-
productive age (for Poland it was 18.2%, 63.4% and 18.4% respectively).
The main potential for human capital creation in the voivodship lies in 6 higher education
institutions in which there are 30975 students studying, which makes up 2% of all students in
Poland. Moreover, 3.1% of the secondary school students in the voivodship attend vocational
schools and 2.7% attend technical schools.
The registered unemployment rate in the voivodship amounted to 12.3% in August 2014,
compared to 11.7% in Poland. The average monthly gross wages and salaries in enterprises
sector in the first half-year of 2014 amounted to PLN 3488.1, which is 92.5% of the average
for Poland.
In 2012 Opole voivodship made a contribution of 2.1% to the GDP of Poland. Calculated per
capita, it amounted to PLN 33071 with the average for Poland PLN 41439.1. With this result
the voivodship takes the 11th place in the country. The GDP growth rate in the voivodship in
the years 2003-2012 amounted to 179.2% while the average for Poland amounted to 189.2%.
The structure of employment in the voivodship is characterised by a relatively low share of
the service sector (51.8%) whereas a share of the agricultural and industrial sectors are
respectively 11.9% and 36.3% (Central Statistical Office, Regional Data Bank 2014).
manufacture of chemicals and chemical products (16%), manufacture of other non-metallic
mineral products (14%) and manufacture of motor vehicles, trailers and semi-trailers (7%).
As the voivodship is one of the smallest regions the voivodship has strong position only on
chemical and chemical
2013).
When it comes to most of the above-mentioned sectors, the voivodship improved or
maintained its competitive position within the last three years (measured by its share in the
s sold production)8. It applies to the following sectors: chemical industry, agri-food
industry, construction, energy production, machinery production, metal industry, timber
industry and non-metallic resources industry.
The information on sectors that ar
important for the investors. The voivodship's strategic sectors mentioned in the strategy of
regional development include above all: food industry, chemical industry and construction.
Investments of this kind can be located on preferential conditions in the specially prepared
places in the Special Economic Zones: , in the
following subzones:
Katowice SEZ in subzones: -r), Gogolin (u- ierzyn-
Kietrz (u-r), Krapkowice (u-r), Olesno (u-r), Strzelce Opolee (u-r),
Ujazd (u-r),
8 Calculations based on the Statistical Bulletin of the Opole Voivodship from the 1st quarter of 2014 and
Statistical Bulletin, I quarter of 2014, www.stat.gov.pl (10 November 2014).

Regional investment attractiveness 2014
34
Starachowice SEZ in subzones:
: Kluczbork (u- -r), Nysa (u-r), Opole
(u), Praszka (u-r), Prudnik (u-r), Skarbimierz (r).
In the all above-mentioned locations investors can benefit from tax allowances amounting to
35% - 55%, depending on the enterprise size more information can be found on
http://www.paiz.gov.pl/investment_support/investment_incentives_in_SEZ.
9. THE PROFILE OF REGIONAL ECONOMY OF
SUBCARPATHIAN VOIVODSHIP
Subcarpathian voivodship is located on the south-eastern Poland. It borders with Slovakia
(in the south) and Ukraine (in the east). The region if famous because of mining: such as
sulphur, crude oil and natural gas, as well as minerals: gypsum, sandstones and limestone
mined to date in the active modern mines. The main sectors are: agriculture, industry, mining,
food, pharmaceutical, aerospace and information technology.
The main advantages of the region are:
developing aviation industry,
pharmaceutical industry very well developed, information technology and food
processing,
establishing Subcarpathian Science and Technology Park in ,
good transport connections: an international airport, the A4 motorway, running through
the county main transport corridors TINA network,
mining raw materials such as sulphur, oil and gas, minerals that are mined mainly in the
mountainous southern part: sandstone, limestone, gypsum (including gypsum alabaster),
ceramic clays, sands (including glass sands) and gravel, and peat, mineral and
geothermal,
large tracts of state forests make a significant supplier of wood and offer the possibility
of using wood biomass for renewable energy production,
availability of highly trained personnel and technical management especially in the
aerospace, electrical engineering, chemical ( University of Technology and is
the largest technical university south-eastern Polish, with the only training centre in the
country's civil aviation pilots).
The general characteristics of the Subcarpathian voivodship are presented in Table 9.

Regional investment attractiveness 2014
35
Table 9. General characteristics of the economy of Subcarpathian voivodship
Feature Subcarpathian
voivodship Poland Share [%]
Market potential
GDP per capita 2012 (PLN/person) 27713.9 41439.1 -
Population (persons) on 31
December 2013 2129294 38495659 5.5%
Human resources potential
Higher education institutions
graduates (persons) in 2013 20524 454986 4.5%
Secondary schools graduates
(persons) in 2013 17549 271333 6.5%
Number of employed persons in
2013 800 15568 5.1%
Structure of employed persons in
2013
agriculture 17.9% industry 30.3%
service 51.8%
12.0% 30.5% 57.5%
Investment outlays and capital of companies with foreign capital participation in the voivodship
Investment outlays (PLN m) in
2012 3726.4 79942.6 4.7%
Capital of companies (PLN n) in
2012 2463.9 206992.3 1.2%
Special Economic Zones (SEZs) in the voivodship*
Mielec
Tarnobrzeg
Distinguishing investment attractiveness ratings PAI _2 and RAI (class A, B and C)
Potential investment attractiveness PAI_2
Real investment attractiveness RAI
Counties and communes distinguished according to the Potential Attractiveness Index for the national
economy (PAI1_GN)
Counties Class A
Communes
Class A
Nisko (u-r)
Class B - - -r), Ropczyce (u-r),
Dukla (u-r) Additional information: (u) urban commune, (r) rural commune, (u-r) urban-rural commune. PAI potential investment attractiveness, RAI real investment attractiveness * For more information see Table 2 in the Appendix.

Regional investment attractiveness 2014
36
The number of inhabitants of the voivodship amounts to 2129294 (as of 2013), which is 5.5%
of the population of Poland. The age structure in the voivodship in 2013 was as follows:
19.1% of the population at pre-productive age, 63.7% at productive age and 17.2% at post-
productive age (for Poland it was 18.2%, 63.4% and 18.4% respectively).
The main potential for human capital creation in the voivodship lies in 15 higher education
institutions in which there are 62731 students studying, which makes up 4.1% of all students
in Poland. Moreover, 5.9% of the secondary school students in the voivodship attend
vocational schools and 6.7% attend technical schools.
The registered unemployment rate in the voivodship amounted to 14.2% in August 2014,
compared to 11.7% in Poland. The average monthly gross wages and salaries in enterprises
sector in the first half-year of 2014 amounted to PLN 3231.1, which is 85.7% of the average
for Poland.
In 2012 Subcarpathian voivodship made a contribution of 3.7% to the GDP of Poland.
Calculated per capita, it amounted to PLN 27713.9 with the average for Poland PLN 41439.1.
With this result the voivodship takes the 16th place in the country. The GDP growth rate in
the voivodship in the years 2003-2012 amounted to 180.0% while the average for Poland
amounted to 189.2%.
In comparison with the whole country the structure of employment in the voivodship is
characterised by a relatively high share of the service sector (51.8%) whereas a share of the
agricultural and industrial sectors are respectively 17.9% and 30.3% (Central Statistical
Office, Local Data Bank 2014).
Important industry sectors in the voivodship are: manufacture of rubber and plastic products
(14% of the value of production sold in whole voivodship at the end of 2013), the production
of motor vehicles, trailers and semi-trailers, with the exception of motorcycles (12%),
manufacture of other transport equipment (11%), manufacture of food products (9%),
manufacture of fabricated metal products, except machinery and equipment (9%),
manufacture of products of wood and cork, except furniture, with the production of articles of
straw and materials plaiting (8%).
On a national scale region is a leading manufacturer of aviation equipment, which is reflected
in a 24-percent share of the region in the national value of sold production of "manufacture of
other transport equipment". Subcarpathian is also an important manufacturer of products of
wood and cork, except furniture (10% of the national value of production sold in 2013), as
well as rubber and plastic products (8%).
When it comes to most of the above-mentioned sectors, the voivodship improved or
maintained its competitive position within the last three years (measured by its share in the 9
.
It applies to the following sectors:
9
Calculations based on the Statistical Bulletin of the Subcarpathian Voivodship from the 1st quarter of
2014 and Statistical Bulletin, I quarter of 2014, www.stat.gov.pl (10 November 2014). A change of 0.25
percentage point was considered as maintaining competitive position.

Regional investment attractiveness 2014
37
manufacture of motor vehicles, trailers and semi-trailers, with the exception of
motorcycles,
manufacture of other transport equipment,
manufacture of fabricated metal products, except machinery and equipment,
metal production,
food production,
manufacture of other non-metallic mineral products.
important for the investors. The voivodship's strategic sectors mentioned in the strategy of
regional development include above all: aviation industry, electrical machinery, agri-food,
chemical, tourism.
For the entrepreneurs willing to invest in Subcarpathian voivodship the list of the high
potential sectors may be a good hint. The list was prepared by the Polish Information and
Foreign Investment Agency in cooperation with the Subcarpathian voivodship self-
government, based on the observations on investments inflows to the voivodship.
The high potential sectors on the list include:
aviation industry,
informatics,
foundry.
Investments of this kind can be located on preferential conditions in the specially prepared
places in the Special Economic Zones:
the following subzones:
SEZ, subzones: -r),
SEZ subzones: Krosno (u),
Mielec SEZ subzones: -
-
-
- -r),
Tarnobrzeg SEZ subzones: -r), Nisko (u-
- -r), Stalowa Wola (u),
Tarnobrzeg (u).
In the all above-mentioned locations investors can benefit from tax allowances amounting to
50% - 70%, depending on the enterprise size more information can be found on
http://www.paiz.gov.pl/investment_support/investment_incentives_in_SEZ.

Regional investment attractiveness 2014
38
10. THE PROFILE OF REGIONAL ECONOMY OF
PODLASKIE VOIVODSHIP
Podlaskie voivodship is located in north-eastern Poland. It borders with Lithuania and
Belarus. It is a mainly agricultural region, with a dynamically developing sector of the food,
especially milk, meat, poultry and cereals, as well as the sectors: light, wood, construction and
engineering.
Advantages of the Podlaskie voivodship include:
located in the geographical centre of Europe and the European Union, which plays a
crucial role in the transport of both local and international transport,
located in the province of many transit roads, the most important: Berlin - Warsaw -
Grodno - St. Petersburg
route Warsaw - Helsinki (part of the expressway - Via Baltica, which connects the
Baltic countries of western Europe)
a large area of grassland creates conditions for the breeding of cattle, mostly dairy,
which was reflected in the leading position in the market of Podlasie province
because of the good conditions for livestock development opportunities exist for
renewable energy production,
well-developed higher education:
o University of Bialystok - the main fields of study: computer science, biology,
chemistry, economics, physics, mathematics, environmental protection, law,
sociology, philology East Slavic,
o Bialystok Technical University - the main fields of study: architecture and
urban planning, construction, electronics and telecommunications, electricity,
engineering, computer science, environmental engineering, mechanical
engineering, production management, Highly rated (category I) by the Ministry
of Education and Higher Education Institutions:
o Medical University of Bialystok; Faculty of Medicine and Dentistry and the
Faculty of Pharmacy and Laboratory Medicine,
o University of Bialystok; Faculty of Health Sciences and Department of
Physics,
low labour costs are accompanied by relatively high labour productivity,
a relatively high level of innovation in comparison to the achieved level of economic
development,
in the region there are four national parks: National Park (a UNESCO
World Heritage Site), the Biebrza National Park Narew National Park, National Park
Wigierski.
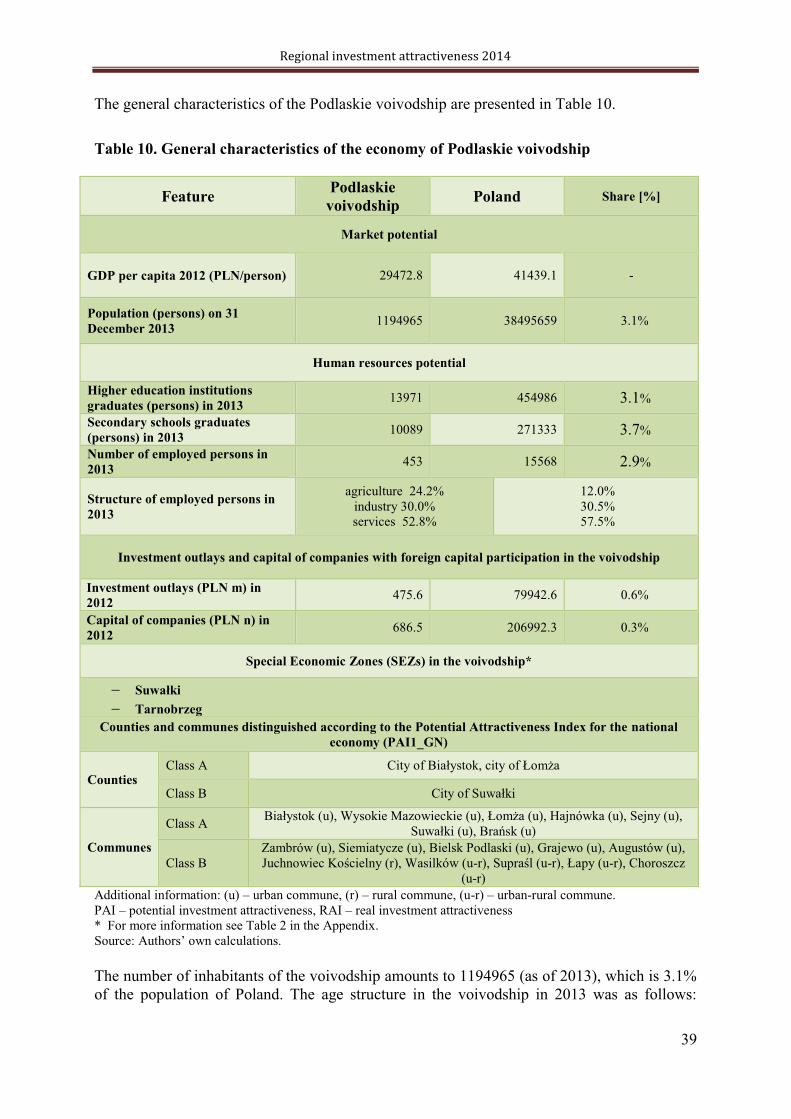
Regional investment attractiveness 2014
39
The general characteristics of the Podlaskie voivodship are presented in Table 10.
Table 10. General characteristics of the economy of Podlaskie voivodship
Feature Podlaskie
voivodship Poland Share [%]
Market potential
GDP per capita 2012 (PLN/person) 29472.8 41439.1 -
Population (persons) on 31
December 2013 1194965 38495659 3.1%
Human resources potential
Higher education institutions
graduates (persons) in 2013 13971 454986 3.1%
Secondary schools graduates
(persons) in 2013 10089 271333 3.7%
Number of employed persons in
2013 453 15568 2.9%
Structure of employed persons in
2013
agriculture 24.2%
industry 30.0%
services 52.8%
12.0%
30.5%
57.5%
Investment outlays and capital of companies with foreign capital participation in the voivodship
Investment outlays (PLN m) in
2012 475.6 79942.6 0.6%
Capital of companies (PLN n) in
2012 686.5 206992.3 0.3%
Special Economic Zones (SEZs) in the voivodship*
Tarnobrzeg Counties and communes distinguished according to the Potential Attractiveness Index for the national
economy (PAI1_GN)
Counties Class A
Class B
Communes
Class A
Class B
- - -r), Choroszcz
(u-r) Additional information: (u) urban commune, (r) rural commune, (u-r) urban-rural commune. PAI potential investment attractiveness, RAI real investment attractiveness * For more information see Table 2 in the Appendix.
The number of inhabitants of the voivodship amounts to 1194965 (as of 2013), which is 3.1%
of the population of Poland. The age structure in the voivodship in 2013 was as follows:

Regional investment attractiveness 2014
40
17.9% of the population at pre-productive age, 63.6% at productive age and 18.5% at post-
productive age (for Poland it was 18.2%, 63.4% and 18.4% respectively).
The main potential for human capital creation in the voivodship lies in 18 higher education
institutions in which there are 42057 students studying, which makes up 2.7 % of all students
in Poland. Moreover, 2.2% of the secondary school students in the voivodship attend
vocational schools and 3.5% attend technical schools.
The registered unemployment rate in the voivodship amounted to 13.3% in August 2014,
compared to 11.7% in Poland. The average monthly gross wages and salaries in enterprises
sector in the first half-year of 2014 amounted to PLN 3304.2, which is 87.6% of the average
for Poland.
In 2012 Podlaskie voivodship made a contribution of 2.2% to the GDP of Poland. Calculated
per capita, it amounted to PLN 29472.8 with the average for Poland PLN 41439.1. With this
result the voivodship takes the 14th place in the country. The GDP growth rate in the
voivodship in the years 2003-2012 amounted to 174.3% while the average for Poland
amounted to 189.2%.
In comparison with the whole country the structure of employment in the voivodship is
characterised by a relatively high share of the service sector (52.8%) whereas a share of the
agricultural and industrial sectors are respectively 24.2% and 23.0% (Central Statistical
Office, Local Data Bank 2014).
Important industry sectors in the voivodship is food production. In 2013 the food industry
accounted for as much as 56% of the value of sold production of industry as a whole Podlasie.
Apart from food industry there are other important sectors such as: production of wood and
cork, except furniture, with the production of articles of straw and plaiting materials (9%),
manufacture of rubber and plastic products (6%) and manufacture of machinery and
equipment (5%).
On the Poland's scale Podlaskie voivodship is quite important manufacturer of wood and cork,
except furniture (7% of the national value of production sold in 2013 and food (6%).
When it comes to most of the above-mentioned sectors, the voivodship improved or
maintained its competitive position within the last three years (measured by its share in the 10
.
It applies to the following sectors:
manufacture of food products,
manufacture of products of wood and cork, except furniture,
printing and reproduction of recorded media.
The information on
important for the investors. The voivodship's strategic sectors mentioned in the strategy of
regional development include above all: food industry, engineering, timber and furniture
industry, tourism.
10
Calculations based on the Statistical Bulletin of the Podlaskie Voivodship from the 1st quarter of 2014 and
Statistical Bulletin, I quarter of 2014, www.stat.gov.pl (10 November 2014). A change of 0.25 percentage point
was considered as maintaining competitive position.
Regional investment attractiveness 2014
41
For the entrepreneurs willing to invest in Podlaskie voivodship the list of the high potential
sectors may be a good hint. The list was prepared by the Polish Information and Foreign
Investment Agency in cooperation with the Podlaskie voivodship self-government, based on
the observations on investments inflows to the voivodship.
The high potential sectors on the list include:
food sector,
machine industry,
tourism sector.
Investments of this kind can be located on preferential conditions in the specially prepared
places in the Special Economic Zones: Tarnobrzeg, in the following subzones:
SEZ subzones :
Tarnobrzeg SEZ subzones: -r).
In the all above-mentioned locations investors can benefit from tax allowances amounting to
50% - 70%, depending on the enterprise size more information can be found on
http://www.paiz.gov.pl/investment_support/investment_incentives_in_SEZ.
11. THE PROFILE OF REGIONAL ECONOMY OF
POMERANIAN VOIVODSHIP
The economy of Pomeranian voivodship is one of the best developing regional economies in
Poland. Its coastal location is conductive to the development of maritime economy in the
region: manufacture and repair of vessels and management of ports, fishery or coastal
tourism. Recent years are characterized by the robust growth of boat-building: in little
shipyards both modern yachts and replicas of medieval boats are built.
The main advantages of the voivodship are:
two science and technology parks and two special economic zones in the voivodship.
ong others a
manufacturer of access control devices (Satel), a manufacturer of multimedia software
(Young Digital Planet) and a R&D centre of Intel Technology Poland have their seats.
The company DGT, a well-known manufacturer of modern communications systems,
operate and, what is more, 18% of computer software is made in the voivodship,
Pomerania is the world leader in amber products. In more than 3 thousand small
workshops about 10 thousand artisans and artists work and design jewellery. Their
annual revenue, especially export revenue, is estimated to more than USD 300m. In
2006 the
favourable natural conditions conducive to the development of tourism,

Regional investment attractiveness 2014
42
significant port complex in the region of both domestic and international importance,
big R&D potential of voivodship's higher education institutions and research
establishments. What distinguishes the system of education in the region, is the
presence of higher education institutions offering courses of study connected with
maritime economy ranked high (category I) by the Ministry of Science and Higher
Education (the Institute of Hydroengineering, Maritime Institute).
The general characteristics of the Pomeranian voivodship are presented in Table 11.
Table 11. General characteristics of the economy of Pomeranian voivodship
Feature Pomeranian
voivodship Poland Share [%]
Market Potential
GDP per capita 2012
(PLN/person) 39759.4 41439.1 -
Population (persons) on
31 December 2013 2295811 38495659 6.0%
Human Recourses Potential
Higher education
institutions graduates
(persons) in 2013 28064 454986 6.2%
Secondary schools
graduates (persons) in
2013 15215 271333 5.6%
Number of employed
persons in 2013 894 15568 5.7%
Structure of employed
persons in 2013
agriculture 7.1%
industry 31.0%
services 61.9%
12.0%
30.5%
57.5%
Investment outlays and capital of companies with foreign capital participation in the voivodship
Investment outlays (PLN
m) in 2012 2616.7 79942.6 3.3%
Capital of companies
(PLN n) in 2012 15837.1 206992.3 7.7%
Special Economic Zones (SEZs) in the voivodship
Pomeranian
Distinguishing investment attractiveness ratings PAI _2 and RAI (class A, B and C)
Potential investment
attractiveness PAI_2
The national economy class B Capital-intensive industry class B Industry laborious class B Business class B Tourism class A Education class B
Real investment
attractiveness RAI The national economy class C Industry class C
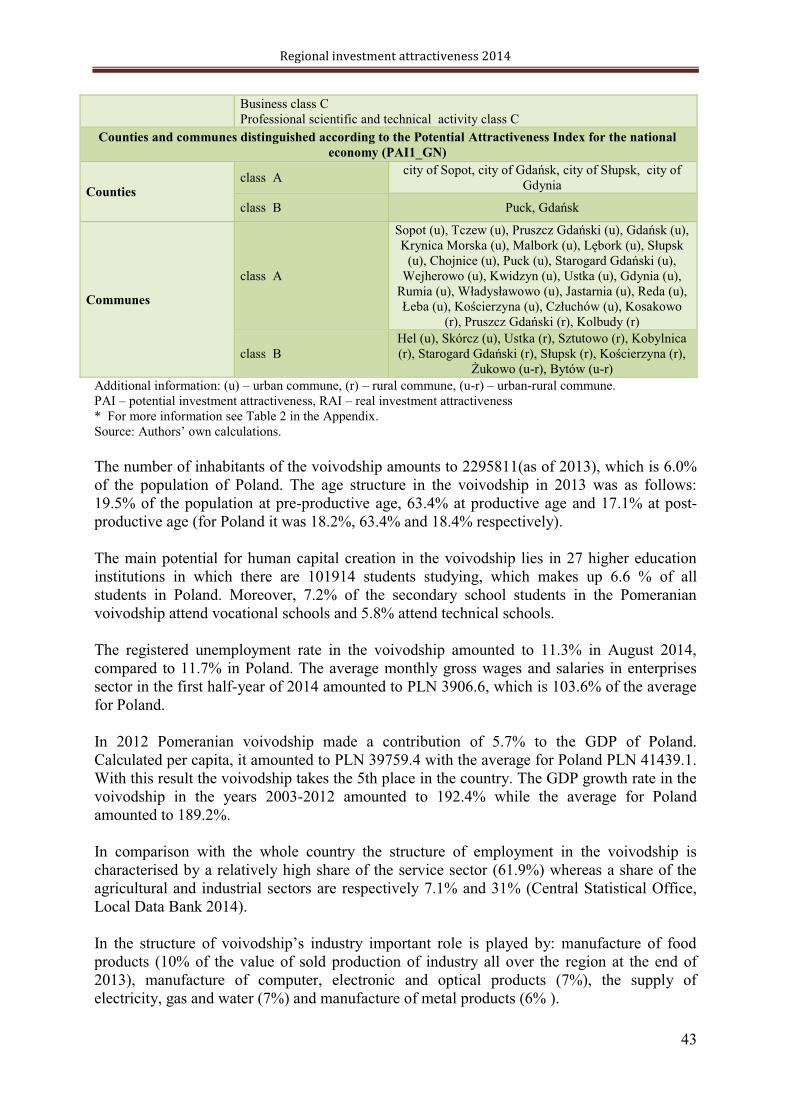
Regional investment attractiveness 2014
43
Business class C Professional scientific and technical activity class C
Counties and communes distinguished according to the Potential Attractiveness Index for the national
economy (PAI1_GN)
Counties class A
Gdynia
class B
Communes
class A
Krynica Morska (u),
Wejherowo (u), Kwidzyn (u), Ustka (u), Gdynia (u),
ski (r), Kolbudy (r)
class B - -r)
Additional information: (u) urban commune, (r) rural commune, (u-r) urban-rural commune. PAI potential investment attractiveness, RAI real investment attractiveness * For more information see Table 2 in the Appendix.
The number of inhabitants of the voivodship amounts to 2295811(as of 2013), which is 6.0%
of the population of Poland. The age structure in the voivodship in 2013 was as follows:
19.5% of the population at pre-productive age, 63.4% at productive age and 17.1% at post-
productive age (for Poland it was 18.2%, 63.4% and 18.4% respectively).
The main potential for human capital creation in the voivodship lies in 27 higher education
institutions in which there are 101914 students studying, which makes up 6.6 % of all
students in Poland. Moreover, 7.2% of the secondary school students in the Pomeranian
voivodship attend vocational schools and 5.8% attend technical schools.
The registered unemployment rate in the voivodship amounted to 11.3% in August 2014,
compared to 11.7% in Poland. The average monthly gross wages and salaries in enterprises
sector in the first half-year of 2014 amounted to PLN 3906.6, which is 103.6% of the average
for Poland.
In 2012 Pomeranian voivodship made a contribution of 5.7% to the GDP of Poland.
Calculated per capita, it amounted to PLN 39759.4 with the average for Poland PLN 41439.1.
With this result the voivodship takes the 5th place in the country. The GDP growth rate in the
voivodship in the years 2003-2012 amounted to 192.4% while the average for Poland
amounted to 189.2%.
In comparison with the whole country the structure of employment in the voivodship is
characterised by a relatively high share of the service sector (61.9%) whereas a share of the
agricultural and industrial sectors are respectively 7.1% and 31% (Central Statistical Office,
Local Data Bank 2014).
products (10% of the value of sold production of industry all over the region at the end of
2013), manufacture of computer, electronic and optical products (7%), the supply of
electricity, gas and water (7%) and manufacture of metal products (6% ).

Regional investment attractiveness 2014
44
As a coastal region Pomeranian voivodship has a significant share of the national output
section "Manufacture of other transport equipment". This share amounted in 2013 to 20%.
manufacture of computer, electronic and optical products (17%),
manufacture of products of wood and cork, except furniture; manufacture of articles of
straw and plaiting materials (7%),
manufacture of fabricated metal products, except machinery and equipment (7%),
machinery and equipment (6%).
When it comes to most of the above-mentioned sectors, the Pomeranian voivodship improved
or maintained its competitive position within the last three years (measured by its share in the 11
It applies to the following sectors:
manufacture of products of wood and cork, except furniture; manufacture of
articles of straw and plaiting materials,
food production,
manufacture of other non-metallic mineral products,
manufacture of fabricated metal products, except machinery and equipment,
production of computers, electronic and optical products,
manufacture of electrical equipment,
manufacture of motor vehicles, trailers and semi-trailers, excluding motorcycles,
manufacture of furniture.
authorities can be
important for the investors. The voivodship's strategic sectors mentioned in the strategy of
regional development include above all: high-tech, logistics, maritime, tourism, agri-food
sector.
For the entrepreneurs willing to invest in Pomeranian voivodship the list of the high potential
sectors may be a good hint. The list was prepared by the Polish Information and Foreign
Investment Agency in cooperation with the Pomeranian voivodship self-government, based
on the observations on investments inflows to the voivodship. The high potential sectors on
the list include:
BPO / SSC / BSS,
energy,
ICT ,
logistics,
chemistry,
11
Calculations based on the Statistical Bulletin of the Pomeranian Voivodship from the 1st quarter of 2014 and
Statistical Bulletin, I quarter of 2014, www.stat.gov.pl (10 November 2014). A change of 0.25 percentage point
was considered as maintaining competitive position.

Regional investment attractiveness 2014
45
automotive.
Investments of this kind can be located on preferential conditions in the specially prepared
places in the Special Economic Zone: Pomeranian SEZ, in the following subzones:
Pomeranian SEZ subzones:
(u-r), Tczew (u), Tczew (r)
upsk SEZ subzones: Debrzno (u- -r)
In the all above-mentioned locations investors can benefit from tax allowances amounting to
35% - 55%, depending on the enterprise size more information can be found on
http://www.paiz.gov.pl/investment_support/investment_incentives_in_SEZ.
12. THE PROFILE OF REGIONAL ECONOMY OF SILESIAN
VOIVODSHIP
Silesian voivodship is one of the most attractive voivodships in terms of investment
attractiveness. It is confirmed by a high value of GDP generated by the region. It is influenced
by a number of factors connected mainly with voivodship's natural resources which
determined the economic development of the region.
The main advantages of the voivodship are:
the biggest city complex in Poland, creating a unique investment potential
the biggest traffic junction in Poland, conductive to industry development, with
numerous cooperative connections - good connections provided by the Katowice
International Airport, A4 highway, E40 road (European route), E75 road (European
route) and direct train connection with such cities as Berlin, Vienna, Budapest,
Bratislava, Prague, Moscow, Hamburg,
and machinery industry) but subject to successful restructuring,
numerous economic subzones, offering attractive investment sites,
the m
Technology, Silesia University of Technology), which is a result of economic profile
of the region,
the voivodship offers wide investment opportunities, which is confirmed by very high
investment attractiveness ranks for the national economy, labour-intensive industry,
capital- intensive industry, trade, tourism, financial intermediary, services for business
and education.
The general characteristics of the Silesian voivodship are presented in Table 12.

Regional investment attractiveness 2014
46
Table 12. General characteristics of the economy of Silesian voivodship
Feature Silesian voivodship Poland Share [%]
Market potential
GDP per capita 2012
(PLN/person) 44065.9 41439.1 -
Population (persons) on
31 December 2013 4599447 38495659 11.9%
Human Resources Potential
Higher education
institutions graduates
(persons) in 2013 44687 454986 9.8%
Secondary schools
graduates (persons) in
2013 30612 271333 11.3%
Number of employed
persons in 2013 1903 15568 12.2%
Structure of employed
persons in 2013
agriculture 2.6%
industry 39.7%
services 57.7%
12.0%
30.5%
57.5%
Investment outlays and capital of companies with foreign capital participation in the voivodship
Investment outlays
(PLN m) in 2012 6776.9 79942.6 8.5%
Capital of companies
(PLN n) in 2012 19124.0 206992.3 9.2%
Special Economic Zones (SEZs) in the voivodship*
Katowice
Distinguishing investment attractiveness ratings PAI _2 and RAI (class A, B and C)
Potential investment
attractiveness PAI_2
National economy class A
Capital-intensive industry class B
Labour-intensive industry lass A
Business class A
Education class B
Real investment
attractiveness RAI
National economy class C
Industry class C
Trade class C
Tourism class C
Scientific and technical activity class C
Counties and communes distinguished according to the Potential Attractiveness Index for the national
economy (PAI1_GN)
Counties Class A
Bielsko-
-
Bytom, city of

Regional investment attractiveness 2014
47
Class B Pszczyna, city of Jaworzno, , Bielsko-
Communes
Class A
(u), Tychy (u), Gliwice (u), Bielsko-
-
Raci
Wis
-
ski (r), Olsztyn (r), Psary (r), Buczkowice (r),
-r), Wilamowice (u-r), Pszczyna (u-r),
-r), Czechowice-Dziedzice (u-r)
Class B
Mszana (r), Poczesna (r), Herby (r), Wilkowice (r),
Gaszowice (
- -r), Siewierz
(u-r), Czerwionka-Leszczyny (u- -r),
Krzepice (u-r) Additional information: (u) urban commune, (r) rural commune, (u-r) urban-rural commune. PAI potential investment attractiveness, RAI real investment attractiveness * For more information see Table 2 in the Appendix.
The number of inhabitants of the voivodship amounts to 4599447 (as of 2013), which is
11.9% of the population of Poland. The age structure in the voivodship in 2013 was as
follows: 16.9% of the population at pre-productive age, 63.8% at productive age and 19.3% at
post-productive age (for Poland it was 18.2%, 63.4% and 18.4% respectively).
The main potential for human capital creation in the voivodship lies in 41 higher education
institutions in which there are 144545students studying, which makes up 9.3 % of all students
in Poland. Moreover, 10.9% of the secondary school students in the voivodship attend
vocational schools and 12.0 % attend technical schools.
The registered unemployment rate in the voivodship amounted to 9% in August 2014,
compared to 11.7% in Poland. The average monthly gross wages and salaries in enterprises
sector in the first half-year of 2014 amounted to PLN 4048,3, which is 107.4% of the average
for Poland.
In 2012 Silesian voivodship made a contribution of 12.7% to the GDP of Poland. Calculated
per capita, it amounted to PLN 44065.9 with the average for Poland PLN 41439.1. With this
result the voivodship takes the 3rd place in the country. The GDP growth rate in the

Regional investment attractiveness 2014
48
voivodship in the years 2003-2012 amounted to 173.3% while the average for Poland
amounted to 189.2%.
In comparison with the whole country the structure of employment in the voivodship is
characterised by a relatively high share of the service sector (57.7%) whereas a share of the
agricultural and industrial sectors are respectively 2.6% and 39.7% (Central Statistical Office,
Local Data Bank 2014)
In the structure of Silesian voivodship industry one can see the impact of restructuring typical
for regions of the genesis of mining and smelting. This is reflected in the high proportion of
the value of sold production of industry throughout the voivodship at the end of 2013.
manufacture of motor vehicles, trailers and semi-trailers, with the exception of motorcycles
(23%). In the structure of the industry metal production (13%), mining and mining (13%),
manufacture of fabricated metal products, except machinery and equipment (8%) and
manufacture of food products (7%) still play important role.
Silesian voivodship definitely has a very competitive position in many types of industry as it
is the biggest industry area in Poland. Voivodship has significant interests in national output
in following sectors:
metal production (59% of national production in 2013)
mining (44%),
manufacture of motor vehicles, trailers and semi-trailers, with the exception of
motorcycles (39%),
manufacture of fabricated metal products, except machinery and equipment (22%),
manufacture of other non-metallic mineral products (16),
manufacture of electrical equipment (15),
manufacture of machinery and equipment not elsewhere classified (15%),
production of food. (7%).
When it comes to most of the above-mentioned sectors, the voivodship improved or
maintained its competitive position within the last three years (measured by its share in the 12
. It applies to the following sectors:
metal production,
manufacture of rubber and plastic,
manufacture of motor vehicles, trailers and semi-trailers, with the exception of
motorcycles,
manufacture of fabricated metal products, except machinery and equipment,
manufacture of other non-metallic mineral products,
food production,
manufacture of electrical equipment,
manufacture of machinery and equipment not elsewhere classified.
12
Calculations based on the Statistical Bulletin of the Silesian Voivodship from the 1st quarter of 2014 and
Statistical Bulletin, I quarter of 2014, www.stat.gov.pl (10 November 2014). A change of 0.25 percentage point
was considered as maintaining competitive position.

Regional investment attractiveness 2014
49
important for the investors. The voivodship's strategic sectors mentioned in the strategy of
regional development include above all: SMEs, R & D sector and the implementation of new
technology, agri-food sector, the tourism sector, modernized of traditional industries (coal,
steel, coke).
For the entrepreneurs willing to invest in Silesian voivodship the list of the high potential
sectors may be a good hint. The list was prepared by the Polish Information and Foreign
Investment Agency in cooperation with the Silesian voivodship self-government, based on the
observations on investments inflows to the voivodship. The high potential sectors on the list
include:
automotive,
BPO,
IT,
tourism,
environmental investments,
renewable energy sources (RES).
Investments of this kind can be located on preferential conditions in the specially prepared
places in the Special Economic Zone: Katowice SEZ, in the following subzones:
Katowice SEZ subzones: Bielsko- -
Dziedzice (u-r), Czerwionka-Leszczyny (u-
-
Koniecpol (u-
Radziechowy-Wieprz (r), Rajcza (r), Rudziniec (r), Rybnik (u), Siemianowice
(u), Siewierz (u-
In the all above-mentioned locations investors can benefit from tax allowances amounting to
25% - 45%, depending on the enterprise size more information can be found on
http://www.paiz.gov.pl/investment_support/investment_incentives_in_SEZ.
13. THE PROFILE OF REGIONAL ECONOMY OF
DSHIP
is situated in the central part of Poland near large urban
total area), the farming of cattle, horses and poultry prevails. A characteristic element is the
Kielce Highlands, which in turn influences the development of tourism.

Regional investment attractiveness 2014
50
The main advantages of the voivodship are:
two state universities: the Kielce University of Technology and the Jan Kochanowski
University of Humanities and Sciences in Kielce, the part of which is the Faculty of
Health Sciences ranked in the highest category 1 by the Ministry of Science and
Higher Education,
favourable conditi
natural resources deposits of natural resources used in the construction industry (the
-
mineral waters (Busko-
(Busko-
favourable conditions for the development of food industry,
rich mineral springs of therapeutically waters and a well-developed base of treatment
facilities and sanatoria, recreation establishments, hotels and guest houses,
the presence of quite well-developed branches of industry smelting industry
-Kamienna), manufacture of machinery and equipment
(Starachowice), manufacture of construction materials (Kielce), manufacture of
The general characteristics of the region are presented in Table 13.
Table 13
Feature voivodship
Poland Share [%]
Market potential
GDP per capita 2012
(PLN/person) 30726.9 41439.1 -
Population (persons) on
31 December 2013
1268239 38495659 3.3%
Human resources potential
Higher education
institutions graduates (persons) in
2013
13023 454986 2.9%
Secondary schools
graduates (persons) in 2013
9838 271333 3.6%
Number of employed
persons in 2013
554 15568 3.6%
Structure of employed
persons in 2013
agriculture 21.8%
industry 27.8%
services 50.4%
12.0%
30.5%
57.5%

Regional investment attractiveness 2014
51
Investment outlays and capital of companies with foreign capital participation in the voivodship
Investment outlays (PLN
m) in 2012
1299.7 79942.6 1.6%
Capital of companies
(PLN n) in 2012
2925.8 206992.3 1.4%
Special Economic Zones (SEZs) in the voivodship*
Starachowice
Tarnobrzeg Counties and communes distinguished according to the Potential Attractiveness Index for the national
economy (PAI1_GN)
Counties Class A City of Kielce
Class B
Communes Class A -Kamienna (u),
- - -r)
Class B Strawczyn (r), Solec-
-r)
Additional information: (u) urban commune, (r) rural commune, (u-r) urban-rural
commune.
PAI potential investment attractiveness, RAI real investment attractiveness
* For more information see Table 2 in the Appendix.
The number of inhabitants of the voivodship amounts to 1268239 (as of 2013), which is 3.3%
of the population of Poland. The age structure in the voivodship in 2013 was as
follows:17.3% of the population at pre-productive age, 62.9% at productive age and 19.8% at
post productive age (for Poland it was 18.2%, 63.4% and 18.4% respectively).
The main potential for human capital creation in the voivodship lies in 15 higher education
institutions in which there are 33760 students studying, which makes up 2.2 % of all students
in Poland. Moreover, 3.1% of the secondary school students in the voivodship attend
vocational schools and 3.9% attend technical schools.
The registered unemployment rate in the voivodship amounted to 14.6% in August 2014,
compared to 11.7% in Poland. The average monthly gross wages and salaries in enterprises
sector in the first half-year of 2014 amounted to PLN 3286.4, which is 87.2% of the average
for Poland.
Poland.
Calculated per capita, it amounted to PLN 30726.9 with the average for Poland PLN 41439.1.
With this result the voivodship takes the 12th place in the country. The GDP growth rate in
the voivodship in the years 2003-2012 amounted to 174.8% while the average for Poland
amounted to 189.2%.
Regional investment attractiveness 2014
52
In comparison with the whole country the structure of employment in the voivodship is
characterized by a relatively high share of the service sector (50.4%) whereas a share of the
agricultural and industrial sectors are respectively 21.8% and 50.4% (Central Statistical
Office, Local Data Bank 2014).
-
represented in structure of the industry.
Moreover in structure of the industry are: manufacture of metal products (8%), which is also
linked to historically shaped industry profile of the region, production of food (15%), as well
as production of wood and cork, except furniture, with the production of articles of straw and
plaiting materials (6%). In the structure of sales also clearly marked with a production of
machinery and equipment (5%).
because of its size in only a few types of activity reached a
significant producer position in mineral industry on a national scale. Which is reflected in a
12 percent share of the region in the national value of sold production from non-metallic
mineral products.
When it comes to most of the above-mentioned sectors, the voivodship improved or
maintained its competitive position within the last three years (measured by its share in the 13
manufacture of textiles,
manufacture of products of wood and cork, except furniture, with the production
of articles of straw and plaiting materials,
manufacture of products from non-metallic mineral,
machinery and equipment,
manufacture of food products.
important for the investors. The voivodship's strategic sectors mentioned in the strategy of
regional development include above all: machine industry, automotive, metallurgy,
electronics, precision engineering, agri-food, building materials, construction, mining of
mineral resources.
For the entrepreneurs willing to
potential sectors may be a good hint. The list was prepared by the Polish Information and
-
government, based on the observations on investments inflows to the voivodship.
The high potential sectors on the list include:
metal,
building,
13
Calculations based on the from the 1st quarter of 2014 and
Statistical Bulletin, I quarter of 2014, www.stat.gov.pl (10 November 2014). A change of 0.25 percentage point
was considered as maintaining competitive position.

Regional investment attractiveness 2014
53
therapeutic spa and rehabilitation.
Investments of this kind can be located on preferential conditions in the specially prepared
places in the Special Economic Zones: Starachowice, Tarnobrzeg, in the following
subzones:
Starachowice SEZ subzones: -r), Morawica (r), Ostrowiec
- -Kamienna (u),
Starachowic - -r),
Tarnobrzeg SEZ subzones: - -
In the all above-mentioned locations investors can benefit from tax allowances amounting to
35% - 45%, depending on the enterprise size more information can be found on
http://www.paiz.gov.pl/investment_support/investment_incentives_in_SEZ.

Regional investment attractiveness 2014
54
14. THE PROFILE OF REGIONAL ECONOMY OF
WARMIAN-MASURIAN VOIVODSHIP
Warmian-Masurian voivodship is situated in the north-eastern part of Poland and as the only
voivodship it borders on the Kaliningrad Oblast (the Russian Federation), which gives huge
opportunities of cooperation with the markets of Eastern Europe, including Russia. In the
voivodship there are also huge opportunities of developing the manufacture of high-quality
food, which is determined by the favourable structure of farm size and the presence of
unoccupied production space in agriculture.
The main advantages of the voivodship are:
favourable natural conditions (lake districts, forests) for the development of
tourism,
agro tourism as well as 'clean' (green) industry using renewable energy,
the planned A1 and Via Baltica routes that give opportunities to develop very good
connections in the future,
lagoon.
Currently a project of building a shipping canal through the Vistula Spit with the cooperation
with the Ukraine, which additionally raises the advantages of the region in terms of transport,
there are high ranked scientific establishments and courses of study connected with
agriculture and food processing: the Institute of Animal Reproduction and Food Research of
the Polish Academy of Sciences in Olsztyn and Warmian-Masurian University in Olsztyn: the
Faculty of Animal Bioengineering, the Faculty of Environmental Protection and Fishery, the
Faculty of Veterinary Medicine, the Faculty of Environmental Management and Agriculture,
the Faculty of Food Sciences,
is the main centre of food industry, the manufacture of tires, timber industry and tourism.
It is also a sea port.
The general characteristics of the voivodship are presented in Table 14.
Table 14. General characteristics of the economy of Warmian-Masurian voivodship
Feature
Warmian
Masurian
voivodship
Poland Share [%]
Market potential
GDP per capita 2012
(PLN/person) 29780.6 41439.1 -
Population (persons) on
31 December 2013
1446915 38495659 3.8%
Human resources potential

Regional investment attractiveness 2014
55
Higher education
institutions graduates (persons) in
2013
12480 454986 2.7%
Secondary schools
graduates (persons) in 2013
9625 271333 3.5%
Number of employed
persons in 2013
529 15568 3.4%
Structure of employed
persons in 2013
agriculture12.7% industry 30.8% services 56.5%
12.0% 30.5% 57.5%
Investment outlays and capital of companies with foreign capital participation in the voivodship
Investment outlays (PLN
m) in 2012
323.2 79942.6 0.4%
Capital of companies
(PLN n) in 2012
1666.2 206992.3 0.8%
Special Economic Zones (SEZs) in the voivodship*
Warmian-Masurian
Distinguishing investment attractiveness ratings PAI _2 and RAI (class A, B and C)
Potential investment
attractiveness PAI_2 Tourism (Class C)
Counties and communes distinguished according to the Potential Attractiveness Index for the national
economy (PAI1_GN)
Counties Class A
Class B
Communes Class A Bartoszyce (u),
Stawiguda (r), Nidzica (u-r)
Class B Nowe Miasto Lubawskie (u), Braniewo (u), Dywity
- -r), Olecko (u-r)
Additional information: (u) urban commune, (r) rural commune, (u-r) urban-rural commune. PAI potential investment attractiveness, RAI real investment attractiveness * For more information see Table 2 in the Appendix.
The number of inhabitants of the voivodship amounts to 1446915 (as of 2013), which is 3.8%
of the population of Poland. The age structure in the voivodship in 2013 was as follows: 19%
of the population at pre-productive age, 64.7% at productive age and 16.3% at post productive
age (for Poland it was 18.2%, 63.4% and 18.4% respectively).

Regional investment attractiveness 2014
56
The main potential for human capital creation in the voivodship lies in 7 higher education
institutions in which there are 39397 students studying, which makes up 2.5 % of all students
in Poland. Moreover, 4.4% of the secondary school students in the voivodship attend
vocational
schools and 4.0% attend technical schools.
The registered unemployment rate in the voivodship amounted to 18.4% in August 2014,
compared to 11.7% in Poland.14
The average monthly gross wages and salaries in enterprises
sector in the first half-year of 2014 amounted to PLN 3144.6, which is 83.4% of the average
for Poland.
In 2012 Warmian-Masurian voivodship made a contribution of 2.7% to the GDP of Poland.
Calculated per capita, it amounted to PLN 29780.6 with the average for Poland PLN 41439.1.
With this result the voivodship takes the 10th place in the country. The GDP growth rate in
the voivodship in the years 2003-2012 amounted to 173.3% while the average for Poland
amounted to 189.2%.
In comparison with the whole country the structure of employment in the voivodship is
characterized by a relatively high share of the service sector (56.5%) whereas a share of the
agricultural and industrial sectors are respectively 12.7% and 30.8% (Central Statistical
Office, Local Data Bank 2014).
Warmian and Masurian voivodship is specialized in the production of food. In 2013 the food
industry accounted for as much as 38% of the value of sold production of industry in whole
Podlasie. Noteworthy industries are also: furniture (10%), products of wood and cork, except
furniture, with the production of articles of straw and plaiting materials (5%) and metal
products (6%).
Warmian and Masurian voivodship is an important producer of furniture (10% of the national
value of production sold in 2013). Moreover reaches about 5-percent share in the domestic
production of food and wood products.
When it comes to most of the above-mentioned sectors, the voivodship improved or
maintained its competitive position within the last three years (measured by its share in the
It applies to the following sectors:
manufacture of metal products,
manufacture of clothes,
manufacture of other non-metallic mineral products.
important for the investors. The voivodship's strategic sectors mentioned in the strategy of
regional development include above all: agri-food industry, furniture, tourism, sports
equipment and rubber products.
For the entrepreneurs willing to invest in Warmian-Masurian voivodship the list of the high
potential sectors may be a good hint. The list was prepared by the Polish Information and
14
Unemployed and unemployment rate by voivodships, sub-regions and counties (as of the end of August 2012).
GUS.

Regional investment attractiveness 2014
57
Foreign Investment Agency in cooperation with the Warmian-Masurian voivodship self-
government, based on the observations on investments inflows to the voivodship.
The high potential sectors on the list include:
food and agriculture,
wood,
tourism,
rubber products,
renewable energy.
Investments of this kind can be located on preferential conditions in the specially prepared
places in the Special Economic Zones: , Warmian-Masurian, in subzones:
SEZ, subzones: -r),
Warmian-Masurian SEZ, subzones: Barczewo (u-r), Bartoszyce (u), Bartoszyce (r),
Biskupiec (u-r), Dobre Miasto (u- -
- -r),
Nowe Miasto Lubawskie (u), Olecko (u-r), Olsztyn (u), Olsztynek (u-r), Orzysz (u-r),
-r), Piecki (r), Pisz (u-r), Szczytno (r), Wielbark (r).
In the all above-mentioned locations investors can benefit from tax allowances amounting to
50% - 70%, depending on the enterprise size more information can be found on
http://www.paiz.gov.pl/investment_support/investment_incentives_in_SEZ.
15. THE PROFILE OF REGIONAL ECONOMY OF GREATER
POLAND VOIVODSHIP
Greater Poland voivodship is one of the economically best-developed voivodships of Poland.
It is characterised by a high concentration of foreign capital invested in Poland and high
investment outlays per capita.
The main advantages of the voivodship are:
its balanced economic development with a high degree of industrialisation and a
high level of technology,
the high potential of human resources, shaped by the presence of the best
universities in Poland (ranked in the category 1 by the Ministry of Science and

Regional investment attractiveness 2014
58
good transport connections among others through A2 highway, which connects
Western Europe with Russia and Eastern countries, as well as good plane
connections (domestic and international airport) and water connections (the Oder
waterway),
region of Greater Poland and an important centre of industry, trade, culture, higher
education and research, and also belongs to the leading Polish cities in economic
terms.
The general characteristics of the voivodship are presented in Table 15.
Table 15. General characteristics of the economy of Greater Poland voivodship
Feature Greater Poland
voivodship Poland Share [%]
Market Potential
GDP per capita 2012
(PLN/person) 43364.1 41439.1 -
Population (persons) on
31 December 2013) 3467016 38495659 9.0%
Human Resources Potential
Higher education
institutions graduates
(persons) in 2013 42062 454986 9.2%
Secondary schools
graduates (persons) in
2013 23949 271333 8.8%
Number of employed
persons on 2013 1366 15568 8.8%
Structure of employed
persons in 2013
agriculture 13.0% industry 35.5% services 51.5%
12.0% 30.5% 57.5%
Investment outlays and capital of companies with foreign capital participation in the voivodship
Investment outlays (PLN
m) in 2012 9852.3 79942.6 12.3%
Capital of companies
(PLN m) in 2012 16661.9 206992.3 8.0%
Special economic zones (SEZs) in the voivodship
Kostrzyn-
Pomeranian

Regional investment attractiveness 2014
59
Distinguishing investment attractiveness ratings PAI _2 and RAI (class A, B and C)
Potential investment
attractiveness PAI_2
National economy Class B National economy Class C Capital-intensive industry Class C Labour-intensive industry Class C Trade Class C Tourism Class C Education Class C
Real investment
attractiveness RAI
National economy Class C Industry Class C Trade Class A Tourism Class C Scientific and technical activities Class B
Counties and communes distinguished according to the Potential Attractiveness Index for the national
economy (PAI1_GN)
Counties Class A City of Leszno,
Class B City of Kalisz
Communes
Class A
(u), Kalisz (u),
Komorniki (r), Dopiewo (r), Czerwonak (r),
(u-r), Kleczew (u- -
(u- -r), Jarocin (u- - -
r)
Class B
- -
r), Mosina (u- -r), Grodzisk
Wielkopolski (u-r), Pobiedziska (u- (u-
-r), Rawicz (u-r), Oborniki (u-r),
Wolsztyn (u-r), Margonin (u- -
-r), Krotoszyn (u-r), Nekla * (u-r),
Kostrzyn (u-r), Opalenica (u-r), Pniewy (u-r) Explanations: (u) urban commune, (r) rural commune, (u-r) urban-rural commune. PAI potential attractiveness index, RAI real attractiveness index * More information in Appendix in table 3.
The number of inhabitants of the voivodship in 2013 amounts to 3467016, which is 9% of the
population of Poland. The age structure in the voivodship in 2013 was as follows: 19.3% of
the population at pre-productive age, 63.6% at productive age and 17.1% at post-productive
age (for Poland it was 18.2%, 63.4% and 18.4% respectively).
The main potential for human capital creation in the voivodship lies in 39 higher education
institutions in which there are 143310 thousand students studying, which makes up 9.3% of
all students in Poland. Moreover, 12.4% of the secondary school students in the voivodship
attend vocational schools and 9.1% attend technical schools.
The registered unemployment rate in the voivodship amounted to 8.1% in August 2014,
compared to 11.7% in Poland. The average monthly gross wages and salaries in enterprises

Regional investment attractiveness 2014
60
sector in the first half-year of 2014 amounted to PLN 3503.1, which is 92.9% of the average
for Poland
In 2012 Greater Poland voivodship made a contribution of 9.4 % to the GDP of Poland.
Calculated per capita, it amounted to PLN 43364.1 with the average for Poland PLN 41439.1.
With this result the voivodship takes the 4th place in the country. The GDP growth rate in the
voivodship in the years 2003-2012 amounted to 193.7% while the average for Poland
amounted to 189,2%.
In comparison with the whole country the structure of employment in the voivodship is
characterised by a relatively low share of the service sector (51.5%) whereas shares of the
agricultural and industrial sectors are respectively 13% and 35.5% (Central Statistical Office,
Local Data Bank, 2014).
Greater Poland voivodship is one of most developed industrial regions in Poland. In the
Greater Poland voivodship structure of industry several sectors stand out: food production
(21% of the whole industry voivodship production), and motor vehicle and trailer
production except motorcycles (14%), manufacture of electrical equipment (8%), rubber and
plastic products production (7%).
As an important industrial region Greater Poland voivodship has a significant share of
domestic production in many industries, while maintaining or increasing the region's
competitive position in the domestic market in the last three years. This applies to the
production of:
beverage (28% of national production in 2013),
manufacture of textiles (23%),
manufacture of machinery and equipment not elsewhere classified (22%),
manufacture of electrical equipment (22%),
manufacture of motor vehicles, trailers and semi-trailers, with the exception of
motorcycles (16%),
manufacture of paper and paper products (16%),
manufacture of products of wood and cork, except furniture; manufacture of articles of
straw and plaiting materials (15%),
printing and reproduction of recorded media (15%),
agricultural machinery and equipment (13%),
manufacture of fabricated metal products, except machinery and equipment (9%),
manufacture of other non-metallic mineral products (9%),
production of food. (7%).
Greater Poland is also an important producer of food (14%), furniture (18%) and clothing.
The regional development strategy of Greater Poland voivodship till 2020 does not mention
strategic sectors but suggests creating favourable conditions for the functioning of companies

Regional investment attractiveness 2014
61
(branches, sectors) or instruments of support. The strategy does not describe market
behaviours of business subjects nor it formulates goals whose accomplishment requires
macroeconomic solutions, legislative or fiscal changes, nor mentions goals and tasks in the
fields which cannot be subject to successful public intervention. It refers particularly to
industrial sectors and branches.
Investors may find useful a list of high opportunity sectors in Greater Poland voivodship
prepared by Polish Information and Foreign Investment Agency with Local Government of
the Greater Poland cooperation. The list is prepared based on observations of trends in
investment inflows to the region.
The high opportunity sectors are:
automotive,
BPO,
logistics.
Investments can be attractively located in Special Economic Zones (SEZs). Preferential
conditions of conducting business activities are offered in the voivodship i.a. in the following
special economic zones:
, subzones
Kostrzyn- , subzones: Buk (u- -r),
- -r), Wronki (u-r),
, subzones -
(u-r), Przykona (r), Turek (u),
Pomeranian SEZ, subzones
, subzones: Jarocin (u- -r), Leszno (u),
Rawicz (u- - -r),
, subzones: Kalisz (u).
In the all above-mentioned locations investors can benefit from tax allowances amounting to
35% - 55%, depending on the enterprise size more information can be found on
http://www.paiz.gov.pl/investment_support/investment_incentives_in_SEZ.
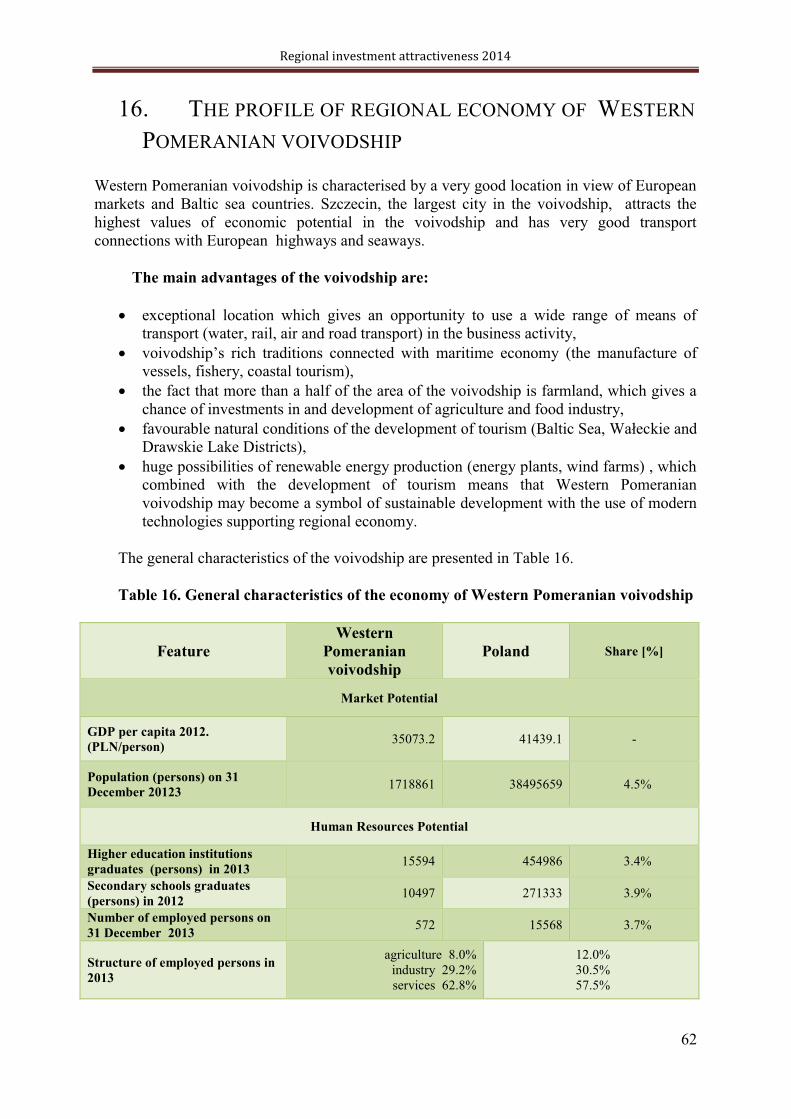
Regional investment attractiveness 2014
62
16. THE PROFILE OF REGIONAL ECONOMY OF WESTERN
POMERANIAN VOIVODSHIP
Western Pomeranian voivodship is characterised by a very good location in view of European
markets and Baltic sea countries. Szczecin, the largest city in the voivodship, attracts the
highest values of economic potential in the voivodship and has very good transport
connections with European highways and seaways.
The main advantages of the voivodship are:
exceptional location which gives an opportunity to use a wide range of means of
transport (water, rail, air and road transport) in the business activity,
(the manufacture of
vessels, fishery, coastal tourism),
the fact that more than a half of the area of the voivodship is farmland, which gives a
chance of investments in and development of agriculture and food industry,
kie and
Drawskie Lake Districts),
huge possibilities of renewable energy production (energy plants, wind farms) , which
combined with the development of tourism means that Western Pomeranian
voivodship may become a symbol of sustainable development with the use of modern
technologies supporting regional economy.
The general characteristics of the voivodship are presented in Table 16.
Table 16. General characteristics of the economy of Western Pomeranian voivodship
Feature
Western
Pomeranian
voivodship
Poland Share [%]
Market Potential
GDP per capita 2012.
(PLN/person) 35073.2 41439.1 -
Population (persons) on 31
December 20123 1718861 38495659 4.5%
Human Resources Potential
Higher education institutions
graduates (persons) in 2013 15594 454986 3.4%
Secondary schools graduates
(persons) in 2012 10497 271333 3.9%
Number of employed persons on
31 December 2013 572 15568 3.7%
Structure of employed persons in
2013
agriculture 8.0% industry 29.2% services 62.8%
12.0% 30.5% 57.5%
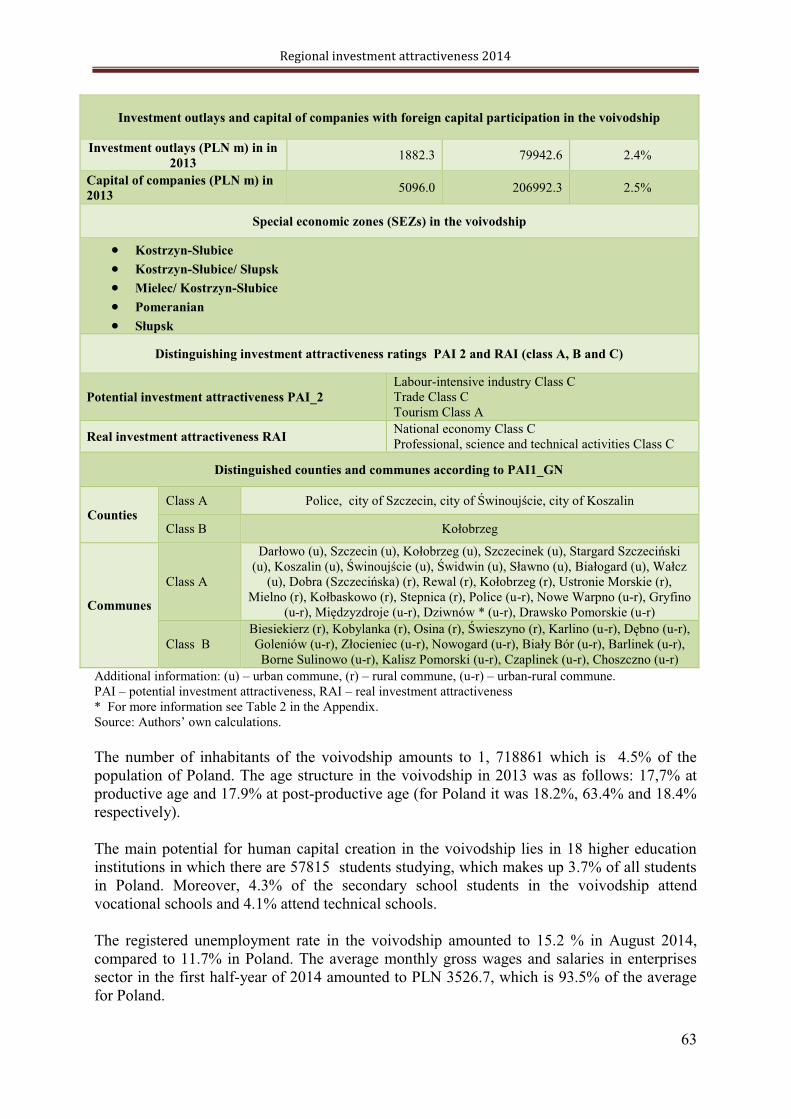
Regional investment attractiveness 2014
63
Investment outlays and capital of companies with foreign capital participation in the voivodship
Investment outlays (PLN m) in in
2013 1882.3 79942.6 2.4%
Capital of companies (PLN m) in
2013 5096.0 206992.3 2.5%
Special economic zones (SEZs) in the voivodship
Kostrzyn-
Kostrzyn-
Mielec/ Kostrzyn-
Pomeranian
Distinguishing investment attractiveness ratings PAI 2 and RAI (class A, B and C)
Potential investment attractiveness PAI_2 Labour-intensive industry Class C Trade Class C Tourism Class A
Real investment attractiveness RAI National economy Class C Professional, science and technical activities Class C
Distinguished counties and communes according to PAI1_GN
Counties Class A Police, city of Szczecin,
Class B
Communes
Class A (u), Dobra
-r), Nowe Warpno (u-r), Gryfino
(u- - -r), Drawsko Pomorskie (u-r)
Class B Biesiekierz (r), Kobylanka - -r),
- -r), Nowogard (u- -r), Barlinek (u-r),
Borne Sulinowo (u-r), Kalisz Pomorski (u-r), Czaplinek (u-r), Choszczno (u-r) Additional information: (u) urban commune, (r) rural commune, (u-r) urban-rural commune. PAI potential investment attractiveness, RAI real investment attractiveness * For more information see Table 2 in the Appendix.
The number of inhabitants of the voivodship amounts to 1, 718861 which is 4.5% of the
population of Poland. The age structure in the voivodship in 2013 was as follows: 17,7% at
productive age and 17.9% at post-productive age (for Poland it was 18.2%, 63.4% and 18.4%
respectively).
The main potential for human capital creation in the voivodship lies in 18 higher education
institutions in which there are 57815 students studying, which makes up 3.7% of all students
in Poland. Moreover, 4.3% of the secondary school students in the voivodship attend
vocational schools and 4.1% attend technical schools.
The registered unemployment rate in the voivodship amounted to 15.2 % in August 2014,
compared to 11.7% in Poland. The average monthly gross wages and salaries in enterprises
sector in the first half-year of 2014 amounted to PLN 3526.7, which is 93.5% of the average
for Poland.

Regional investment attractiveness 2014
64
In 2012 Western Pomeranian voivodship made a contribution of 3.8 % to the GDP of Poland.
Calculated per capita, it amounted to PLN 35073.2 with the average for Poland PLN 41439.1.
With this result the voivodship takes the 8th place in the country. The GDP growth rate in the
voivodship in the years 2003-2012 amounted to 169.9% while the average for Poland
amounted to 189.2 %.
In comparison with the whole country the structure of employment in the voivodship is
characterised by a relatively high share of the service sector (62.8%) whereas shares of the
agricultural and industrial sectors are respectively 8.0% and 29.2% (Central Statistical Office,
Local Data Bank 2014).
In the Western Pomeranian voivodship structure of industry several sectors stand out: food
production (22% of the whole industry voivodship production), wood and cork products,
except furniture, articles of straw and plaiting materials (12%), fabricated metal products
except machinery and equipment (9%) and motor vehicle and trailer production except
motorcycles (4%).
Region is a leading producer of wood and cork products except furniture (14% of domestic
production value sold in 2013).
In last three years Western Pomeranian voivodship increased or maintained its
competitive position in industry measured with share of domestic value production in:
food production,
fabricated metal products except machinery and equipment production,
motor vehicle and trailer production except motorcycles production,
rubber and plastic products production.
Information about the voivodship's strategic sectors are important for investors. Based on the
strategy of regional development strategic sectors include: marine economy, industry,
tourism, well-developed commercial and virtual services, computer industry,
telecommunications, IT services, biotechnology, genetic technologies, consulting services,
knowledge services and development of telemetry.
Investors may find useful a list of high opportunity sectors in Western Pomeranian voivodship
prepared by Polish Information and Foreign Investment Agency with Local Government of
the West Pomeranian Region cooperation. The list is prepared based on
observations of trends in investment inflows to the region.
The high opportunity sectors are:
BPO,
logistics,
renewable energy sources (wind energy),
tourism.
Investments can be attractively located in Special Economic Zones (SEZs). Preferential
conditions of conducting business activities are offered in the voivodship i.a. in the following

Regional investment attractiveness 2014
65
special economic zones: Kostrzyn- - lec/Kostrzyn-
.
Each SEZ has it's subzone or subzones as follows:
Kostrzyn- , subzones: Barlinek (u- -r),
Gryfino (u- -r), Nowogard (u- -r), Police (u-r),
Kostrzyn-S , subzone: Karlino (u-r),
Mielec/Kostrzyn- , subzone: Szczecin (u),
Pomeranian SEZ, subzone:
, subzones: Biesiekierz (r), Kalisz Pomorski (u-
(u-r), Szczecinek (u), Tychowo (u-
In all Special Economic Zones mentioned above investors can get income tax relief from 35%
up to 55% depending on the size of the company. Further information can be found on:
http://www.paiz.gov.pl/investment_support/sez .
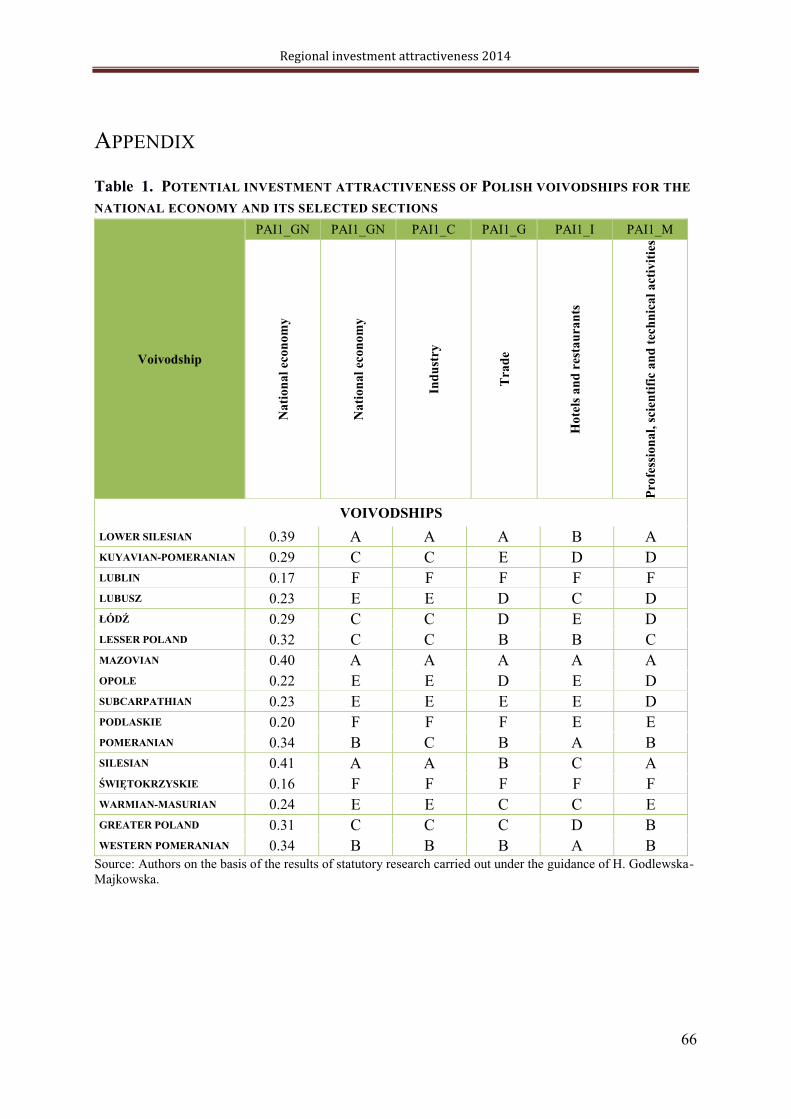
Regional investment attractiveness 2014
66
APPENDIX
Table 1. POTENTIAL INVESTMENT ATTRACTIVENESS OF POLISH VOIVODSHIPS FOR THE
NATIONAL ECONOMY AND ITS SELECTED SECTIONS
Voivodship
PAI1_GN PAI1_GN PAI1_C PAI1_G PAI1_I PAI1_M
Na
tio
na
l ec
on
om
y
N
ati
on
al
eco
no
my
Ind
ust
ry
Tra
de
Ho
tels
an
d r
esta
ura
nts
Pro
fess
ion
al,
sci
enti
fic
an
d t
ech
nic
al
act
ivit
ies
VOIVODSHIPS
LOWER SILESIAN 0.39 A A A B A
KUYAVIAN-POMERANIAN 0.29 C C E D D
LUBLIN 0.17 F F F F F
LUBUSZ 0.23 E E D C D
0.29 C C D E D
LESSER POLAND 0.32 C C B B C
MAZOVIAN 0.40 A A A A A
OPOLE 0.22 E E D E D
SUBCARPATHIAN 0.23 E E E E D
PODLASKIE 0.20 F F F E E
POMERANIAN 0.34 B C B A B
SILESIAN 0.41 A A B C A
0.16 F F F F F
WARMIAN-MASURIAN 0.24 E E C C E
GREATER POLAND 0.31 C C C D B
WESTERN POMERANIAN 0.34 B B B A B Source: Authors on the basis of the results of statutory research carried out under the guidance of H. Godlewska-
Majkowska.

Regional investment attractiveness 2014
67
Table 2. POTENTIAL INVESTMENT ATTRACTIVENESS OF COUNTIES FOR THE NATIONAL
ECONOMY AND ITS SELECTED SECTIONS
County
PAI1_GN PAI1_GN PAI1_C PAI1_G PAI1_I PAI1_M
Na
tio
na
l ec
on
om
y
Na
tio
na
l ec
on
om
y
Ind
ust
ry
Tra
de
Ho
tels
an
d r
esta
ura
nts
Pro
fess
ion
al,
sci
enti
fic
an
d t
ech
nic
al
act
ivit
ies
LOWER SILESIAN VOIVODSHIP
Polkowice 0.374 A A A A A
city of 0.373 A A A A A
Lubin 0.320 A A A B A
city of Legnica 0.319 A A A B A
0.318 A A A A A
city of 0.318 A A A A A
0.291 B B A C B
Zgorzelec 0.284 B B B A C
0.270 B B B C C
0.269 B B B C C
0.267 C B C A C
0.261 C C C C C
0.254 C C C D C
0.250 C C B B D
0.248 C C C B D
0.247 C C C B D
Trzebnica 0.245 C C C D C
0.243 C C C C D
KUYAVIAN-POMERANIAN VOIVODSHIP
0.365 A A A A A
0.338 A A A B A
Bydgoszcz 0.319 A A A C A
0.317 A B A C A
Bydgoszcz 0.262 C C C C C
LUBELSKIE VOIVODSHIP
city of 0.355 A A A A A
city of Lublin 0.347 A A A A A

Regional investment attractiveness 2014
68
city of 0.317 A A A C A
city of 0.303 A A B B A
0.269 B B C D C
0.262 C C C C C
LUBUSZ VOIVODSHIP
city of 0.347 A A A A A
city of
Wielkopolski 0.320 A A A A A
0.248 C C C B C
0.241 C D C B D
VOIVODSHIP
0.332 A A A A A
city of Skierniewice 0.322 A A A A A
city of 0.315 A A A B A
city of
Trybunalski 0.302 A A A C A
0.263 C B B B C
Zgierz 0.255 C B C D C
Pabianice 0.252 C C C D C
LESSER POLAND VOIVODSHIP
city of 0.358 A A A A A
city of 0.322 A A A B A
city of 0.313 A A A A A
0.285 B B C C C
Wieliczka 0.282 B B B B B
0.272 B B B B C
Olkusz 0.270 B B B C C
0.266 C B C B C
0.263 C B C D C
Bochnia 0.261 C C C C C
Wadowice 0.242 C D D D D
MAZOVIAN VOIVODSHIP
capital city of Warsaw 0.423 A A A A A
city of Siedlce 0.361 A A A A A
city of 0.353 A A A A A
city of 0.350 A A A A A
0.324 A A A A A
Piaseczno 0.318 A A A A A
Warsaw West 0.302 A A A A A
Grodzisk Mazowiecki 0.299 A A A A B
city of Radom 0.298 A B B D A
Legionowo 0.280 B B B A B
Otwock 0.259 C C C B C
0.258 C C C C C
Mazowiecki 0.245 C C C C D
OPOLSKIE VOIVODSHIP

Regional investment attractiveness 2014
69
city of Opole 0.333 A A A A A
Krapkowice 0.261 C B B B C
- 0.255 C C D C C
Brzeg 0.250 C C C C C
Opole 0.241 C C D D D
SUBCARPATHIAN VOIVODSHIP
city of 0.357 A A A A A
city of Krosno 0.339 A A A A A
city of 0.314 A A A A A
city of Tarnobrzeg 0.310 A A A A A
Stalowa Wola 0.257 C C C D C
PODLASKIE VOIVODSHIP
city of 0.368 A A A A A
city of 0.295 A B A A A
city of 0.287 B B A B A
POMERANIAN VOIVODSHIP
city of Sopot 0.384 A A A A A
city of 0.363 A A A A A
city of 0.324 A A A B A
city of Gdynia 0.318 A A A A A
Puck 0.288 B B B A B
0.279 B B B C C
0.251 C C C B D
0.244 C D D C C
Wejherowo 0.244 C D C C C
SILESIAN VOIVODSHIP
city of Tychy 0.353 A A A A A
city of Gliwice 0.345 A A A A A
city of 0.344 A A A B A
m .Bielsko- 0.337 A A A A A
city of 0.336 A A A A A
city of Katowice 0.332 A A A A A
city of 0.330 A A A C A
city of Rybnik 0.330 A A A A A
city of 0.329 A A A A A
city of 0.326 A A A B A
city of 0.319 A A A C A
city of - 0.316 A A A B A
city of Zabrze 0.310 A A A B A
city of Sosnowiec 0.310 A A B B A
- 0.306 A A A A B
city of 0.306 A A A B B
city of Bytom 0.302 A B A E A
city of 0.301 A A B B A
0.299 A A B A A

Regional investment attractiveness 2014
70
city of Siemianowice
0.295 A B A C A
Pszczyna 0.293 B B B B B
city of Jaworzno 0.286 B B C C B
0.277 B B B B C
Bielsko- 0.270 B B B C C
0.267 C B B B C
Gliwice 0.266 C C C C C
Cieszyn 0.262 C C B B C
0.256 C C C C C
0.249 C C C C D
Zawiercie 0.243 C C D D D
VOIVODSHIP
city of Kielce 0.329 A A A B A
-Kamienna 0.243 C C D E D
WARMIAN-MASURIAN VOIVODSHIP
city of Olsztyn 0.352 A A A A A
city of 0.316 A A A B A
0.251 C C C C C
GREATER POLAND VOIVODSHIP
city of Leszno 0.359 A A A A A
city of 0.352 A A A A A
city of Konin 0.338 A A A A A
0.304 A A A A A
city of Kalisz 0.287 B B A C A
0.261 C C C C C
Turek 0.257 C C C D C
0.255 C C C C C
0.251 C C C D C
Wielkopolski 0.248 C C C C C
0.246 C C C C D
Oborniki 0.244 C C D E D
0.241 C C C C D
WESTERN POMERANIAN VOIVODSHIP
Police 0.362 A A A A A
city of Szczecin 0.332 A A A A A
city of 0.332 A A A A A
city of Koszalin 0.313 A A A A A
0.285 B B A A B
0.260 C C D C C
Szczecinek 0.254 C C C C C
Drawsko Pomorskie 0.250 C C C C D
0.249 C C C A D
0.249 C C C A C
Source: Authors on the basis of the results of statutory research carried out under the guidance of H. Godlewska-
Majkowska.

Regional investment attractiveness 2014
71