Embed Size (px)
Citation preview

Transport StatisticsBulletin 2014
“Transport is the heartbeat of South Africa’s economic growth and social development”
Transport Statistics


Transport Statistics Bulletin: 2014 “Transport, the Heartbeat of Economic Growth and Social Development”

Annual Transport Statistics Bulletin 2014 Republic of South Africab
Copyright © 2017
Department of Transport (DOT), 159 Struben Street, Forum Building, Pretoria, 0001
“Extracts of this document may be copied or reproduced provided that the source is fully
acknowledged.”
Department of Transport Cataloguing-in-Publication Data
Transport Statistics Bulletin/Department of Transport, 2014
Pretoria: Department of Transport
p109
ISBN: 978-0-621-45585-4
Annually
Title continues in English only
1. Transport Statistics Bulletin 2014
I. Republic of South Africa. Department of Transport
II. Title
(LCSH 29)
This publication can be accessed on the Department of Transport website: www.transport.gov.za
Copies are available from: Information Centre, Department of Transport
Tel: +27 (0) 12 309 3657
Fax: +27 (0) 12 309 3757
E-mail: [email protected]

Annual Transport Statistics Bulletin 2014 Republic of South Africa i
ACKNOWLEDGEMENTS
The Department of Transport wish to extend its sincere thanks to the organisations that supplied
the data for inclusion in the Annual Transport Statistics Bulletin: 2014. In alphabetical order they
are:
Airports Company of South Africa
Association of Motorcycle Importers and Distributors
Department of Energy
Gautrain Management Agency
National Association of Automobile Manufacturers of South Africa
Port Regulator Authority
Passenger Rail Agency of South Africa
Road Traffi c Management Corporation
South African Airways
South African Civil Aviation Authority
South African National Roads Agency Limited
South African Petroleum Industry Association
Statistics South Africa
Transnet Freight Rail
Transnet National Port Authority
Transnet Pipelines
Comments, additional information and enquiries can be directed to the Statistical Analysis
Directorate at [email protected] or Tel: +27 (0) 12 309 3190.

Annual Transport Statistics Bulletin 2014 Republic of South Africaii
Mr. Mathabatha Mokonyama
Acting Director-General: Transport
FOREWORD
This is the 2014 edition of the annual Transport Statistics Bulletin. The main aim of the Transport
Statistics Bulletin is to compile statistical information from various sources in the transport sector
into a comprehensive bulletin for use by policymakers, industry players, transport analysts and the
wider South African community. The publication covers a wide variety of statistics for all modes
of transport, that include aviation, road, rail and maritime. It, inter alia, consists of a series of
information on passenger volumes, ports operations, live vehicle population, road safety, airports
and many other topics that may be of interest to the transport sector.
The statistics covered in the bulletin were collected to a large extent from government departments
and government agencies in the transport sector. Since the bulletin is a compendium of transport
statistics, it therefore acts as a one-stop source of statistical information and thus enabling users
to make comparison of trends across modes in respect of transport indicators. We trust that it will
continue to be a useful source of information.

Annual Transport Statistics Bulletin 2014 Republic of South Africa iii
TABLE OF CONTENTS
ACKNOWLEDGEMENTS ................................................................................................................. i
FOREWORD ................................................................................................................................... ii
TABLE OF CONTENTS .................................................................................................................. iii
LIST OF TABLES ........................................................................................................................... iv
LIST OF FIGURES ......................................................................................................................... vi
LIST OF MAPS ............................................................................................................................. vii
ABBREVIATIONS AND ACRONYMS ............................................................................................ vii
EXECUTIVE SUMMARY ...............................................................................................................viii
SECTION 1: GENERAL INFORMATION .......................................................................................1
1.1 EMPLOYMENT .........................................................................................................................2
1.2 TRANSPORT AND ECONOMY ................................................................................................6
1.3 FINANCE AND INFRA-STRUCTURE ......................................................................................11
1.4 LAND TRANSPORT STATISTICS ...........................................................................................14
SECTION 2: ROAD ......................................................................................................................17
2.1 ROAD NETWORK AND INFRASTRUCTURE EXPENDITURE ................................................19
2.2 MOTOR VEHICLES PRODUCTION AND SALES ...................................................................20
2.3 MOTOR VEHICLES REGISTRATION ......................................................................................27
2.4 LICENSING INFORMATION ...................................................................................................35
2.5 ROAD SAFETY .......................................................................................................................39
SECTION 3: MARITIME ..............................................................................................................51
3.1 CARGO HANDLED AND VESSELS’ ARRIVALS .....................................................................53
SECTION 4: AVIATION ................................................................................................................68
4.1 AIRCRAFT REGISTRATION AND LICENSING .......................................................................70
4.2 AIR TRAFFIC INFORMATION .................................................................................................75
4.3 AIRCRAFT ACCIDENTS AND INCIDENTS .............................................................................77
SECTION 5: RAIL ........................................................................................................................79
5.1 RAIL PASSENGER INFORMATION ........................................................................................81
5.2 RAIL PERFORMANCE ............................................................................................................85
5.3 GAUTRAIN STATISTICS .........................................................................................................88
SECTION 6: PIPELINES ..............................................................................................................91
6.1 PIPELINES ..............................................................................................................................93
Notes ............................................................................................................................................96

Annual Transport Statistics Bulletin 2014 Republic of South Africaiv
LIST OF TABLES
Table 1.1: Formal Sector Employment by Industry, 2009 - 2014 2Table 1.2: Annual Employment in Vehicle Manufacturing Industry,2008 - 2014 3Table 1.3: Transnet Employment in Operational Divisions, 2008-2014 4Table 1.4: Contribution of the Transport and Communication Sectors to the Gross Domestic Product (GDP), 2008-2014 6Table 1.5: Motor Trade Sales, 2008-2014 7Table 1.6: Contribution of each type of activity to the percentage change in motor trade sales, 2014 8Table 1.7: Provincial motor vehicle licence revenue by province, 2010/11 - 2013/14 8Table 1.8: Basic Fuel Prices (cents/litre) and Exchange Rate (R/US$), 2014 9Table 1.9: Summary of Expenditure on Infrastructure, 2007/08-2013/14 11Table 1.10: New Vehicle Manufacturing Industry Capital Expenditure, 2008 - 2014 12Table 1.11: Average Motor Vehicle Assembly Industry Capacity Utilisation Levels, 2008 - 2014 12Table 1.12: South Africa’s Automotive Industry’s Performance in a Global Context, 2008 - 2014 13Table 1.13: Total Freight Transport Estimates, 2010-2014 14Table 1.14: Distribution of tourists by mode of travel and place of arrival, 2014 16Table 2.1: Provincial Roads Maintenance Grant Expenditure, 2012/13-2013/14 19Table 2.2: Vehicles Production, Sales, Exports and Imports, 2008 - 2014 20Table 2.3: Vehicle Retail Sales by Type in 2014 21Table 2.4: Motorcycles Sales by User Class and Engine Class, 2008 - 2014 23Table 2.5: World Motor Vehicle Production by Region, 2013 to 2014 24Table 2.6: World Motor Vehicle Production by Country, 2013 to 2014 25Table 2.7: Live Vehicle Population by Province, 2008-2014 27Table 2.8: New Vehicles Registration by Province, 2014 29Table 2.9: Used Vehicles Registration by Province, 2014 30Table 2.10: Annual Number of Registered Motorised Vehicles, 2008 - 2014 31Table 2.11: Annual Live Motorised Vehicle Population by Province, 2008 - 2014 32Table 2.12: Age of Motor Vehicle Population, 2014 33Table 2.13: Number of Learners Licences Issued, 2014 35Table 2.14: Number of Driving Licences Issued per Province by Category, 2014 36Table 2.15: Annual Number of Driving Licences Issued per Category, 2008-2014 37Table 2.16: Annual Number of Professional Driving Permits (PrDP’s) Issued, 2008-2014 38Table 2.17: Traffi c Volumes, 2013 – 2014 39Table 2.18: Number of fatal crashes & fatalities, 2014 40Table 2.19: Law Enforcement – National Achievement, Easter 2014 40Table 2.20: Number of fatal crashes & fatalities, 2013/14 - 2014/15 41Table 2.21: Percentage share of crashes per day of the week, Festive 2014 42Table 2.22: Percentage share of fatalities per road user group, Festive 2014 42Table 2.23: Percentage share of fatalities per Gender & Race, Festive 2014 43Table 2.24: Law enforcement – National Achievement, Festive 2014 44Table 2.25: Number of unroadworthy vehicles, 2014 45
Annual Transport Statistics Bulletin 2014 Republic of South Africa v
Table 2.26: Number of unlicensed vehicles, 2014 46Table 2.27: Number of fatal crashes & fatalities per province, 2013 – 2014 47Table 2.28: Monthly number of fatal crashes & fatalities, 2013 -2014 48Table 2.29: Number of fatalities per road user group & Severity of fatal crashes over 12 months period, 2013 – 2014 49Table 2.30: Crash Type nationally, 2014 50Table 2.31: Vehicle/Road/Human factors nationally, 2014 50Table 3.1: Bulk Cargo Handled (Metric Tons), 2014 53Table 3.2: Breakbulk Cargo Handled(Metric Tons), 2014 54Table 3.3: Total Cargo Handled (Metric Tons), 2014 55Table 3.4: Annual Bulk Handled(Metric Tons) in South African Ports, 2008 - 2014 56Table 3.5: Annual Break Bulk Handled (MetricTons) in South African Ports, 2008-2014 57Table 3.6: Annual Cargo Handled in South African Ports, 2008-2014 58Table 3.7: Total Cargo (Metric Tons) Imported and Exported through South African Ports, 2008-2014 60Table 3.8: Total Number of Containers Invoiced at South African Ports (in 6M Units TEU’s), 2014 62Table 3.9: Annual Number of Containers Invoiced at South African Ports (6M Units TEU’s), 2008-2014 63Table 3.10: Total Number of Vessels Arrived at South African Ports, Jan to Dec 2014 65Table 3.11: Annual Number of Vessel Arrivals at South African Ports, 2008-2014 67Table 4.1: Number of Pilot and Other Licenses Issued by Gender 70Table 4.2: Number of Civil Registered Aircrafts 72Table 4.3: Number of Sports and Recreational / NTCA Registered Aircrafts 73Table 4.4: Passenger Volumes by Airport 75Table 4.5: Aircraft Movements by Airport 76Table 4.6: Aircraft Accidents and Incidents 77Table 4.7: Aircraft Accidents and Incidents, 2008 – 2014 77Table 5.1: Metrorail Rail Passengers by Region, 2013 – 2014 81Table 5.2: Passenger Kilometres Travelled by Region, 2013 - 2014 83Table 5.3: Monthly Percentage Change from Previous Year in Passenger Kilometres Travelled by Region 2014 84Table 5.4: Number of Trains ran, 2013 – 2014 85Table 5.5: Average Percentage of Trains on Time, 2013 - 2014 86Table 5.6: Average Percentage of Trains Delayed, 2013 – 2014 86Table 5.7: Average Percentage of Trains Cancelled, 2013 - 2014 86Table 5.8: Accidents in Passenger Rail Operations, 2010-2014 87Table 5.9: Gautrain Passenger Flows, 2014 88Table 5.10: Annual Gautrain Passenger Flows, 2013 – 2014 89Table 6.1: Annual Volumes of Petroleum Products Transported, 2009 - 2014 93Table 6.2: Sources of crude oil for SAPIA members, 2009 – 2014 94

Annual Transport Statistics Bulletin 2014 Republic of South Africavi
LIST OF FIGURES
Figure 1.1: Percentage Changes in Formal Sector Employment by Industry 2Figure 1.2: Percentage change in Average Employment in Vehicle Manufacturing Industry, 2008–2014 4Figure 1.3: Annual Number of Transnet Employment, 2008-2014 5Figure 1.4: Percentage share Contribution of the Transport and Communication Sectors to the Gross Domestic Product (GDP), 2008-2014 6Figure 1.5: Annual Motor Trade Sales, 2008-2014 7Figure 1.6: Provincial motor vehicle licence revenue by province, 2013/14 9Figure 1.7: Average Basic Fuel Price (cents/litre) 10Figure 1.8: Year on Year change in Basic Fuel Price (cents/litre), 2013 to 2014 10Figure 1.9: Summary of Expenditure on Infrastructure, 2008/09-2013/14 12Figure 1.10: South Africa Share of Global Production, 2008 to 2014 13Figure 1.11: Total Freight Payload (000 tons) Estimates for 2014 15Figure 2.1: Provincial Roads Maintenance Grant Expenditure, 2011/12 to 2013/14 19Figure 2.2: Vehicles Domestically Produced, 2008-2014 21Figure 2.3: Annual Vehicle Retails Sales by Type in 2014 22Figure 2.4: Motorcycles Sales by User Class and Engine Class,2008-2014 24Figure 2.5: World Motor Vehicle Production by Region, 2013 to 2014 25Figure 2.6: World Motor Vehicle Production by Country, 2013 to 2014 26Figure 2.7: Live vehicle population by province, as at 31 December 2014 28Figure 2.8: Live vehicle population by vehicle type, as at 31 December 2014 28Figure 2.9: Percentage change in Registered Motorised Vehicles, 2008 2014 31Figure 2.10: Annual Live Motorised Vehicle Population by Province 2008 2014 32Figure 2.11: Age of Motor Vehicle Population 1 - 6, 2014 34Figure 2.12: Number of Learners Licences Issued by Category, 2014 35 Figure 2.13: Driving Licences Issued in 2014 by Category 36Figure 2.14: Annual Driving Licences Issued by Category, 2008-2014 37Figure 2.15: Annual Number of Professional Driving Permits (PrDP’s) Issued, 2008-2014 38Figure 2.16: Percentage change in Traffi c Volumes, 2013-2014 39Figure 2.17: Number of fatal crashes & fatalities, 2014 40Figure 2.18: Percentage change in fatal crashes & fatalities, 2013/14 - 2014/15 41Figure 2.19: Percentage share of crashes per day of the week, Festive 2014 42Figure 2.20: Percentage share of fatalities per road user group, Festive 2014 43Figure 2.21: Number of unroadworthy vehicles, 2014 45Figure 2.22: Number of unlicensed vehicles, 2014 46Figure 2.23: Number of fatal crashes & fatalities per province, 2014 47Figure 2.24: Monthly number of fatal crashes & fatalities, 2014 48Figure 2.25: Fatalities per road user group over 12 months period, 2014 49 Figure 3.1: Total Bulk, Break-bulk and Cargo Handled (Metric Tons), 2014 56Figure 3.2: Annual Bulk Handled (Metric Tons) in South African Ports, 2014 57Figure 3.3: Annual Break Bulk Handled (Metric Tons) in South African Ports, 2014 58Figure 3.4: Annual Cargo Handled (Metric Tons) in South African Ports, 2014 59

Annual Transport Statistics Bulletin 2014 Republic of South Africa vii
Figure 3.5: Total Cargo (Metric Tons) Imported and Exported through South African Ports, 2008-2015 61Figure 3.6: Number of Containers Invoiced at South African Ports, 2008-2014 64Figure 3.7: Annual Number of Vessel Arrivals at South African Ports, 2008-2014 67Figure 4.1: Number Pilot and Other Licences issued by Gender, 2008-2014 71Figure 4.2: Annual Number of Civil Registered Aircrafts, 2008-2014 73Figure 4.3: Annual Number of Sports and Recreational / NTCA Registered Aircrafts, 2008-2014 74Figure 4.4: Annual Number of Passenger Volumes, 2014 75Figure 4.5: Aircraft Movements by Airport, 2014 76Figure 4.6: Annual Number of Aircraft Fatal Accidents and Fatalities, 2008-2014 78Figure 5.1: Metrorail Rail Passenger Volumes, 2013-2014 82Figure 5.2: Passenger Kilometres Travelled by Region, 2013-2014 84Figure 5.3: Number of Trains ran, 2013-2014 85Figure 5.4: Accidents in Passenger Rail Operations, 2010-2014 87Figure 5.5: Number of Gautrain Passengers, 2013/14 89Figure 5.6: Annual Passenger Flows, 2013-2014 90Figure 6.1: Annual Volumes of Petroleum Products Transported, 2009-2014 93Figure 6.2: Sources of crude oil for SAPIA members, 2009-2014 95
LIST OF MAPS
Map A: National Road Network of the Republic of South Africa 18Map B: Major Ports of the Republic of South Africa 52Map C: Airports of the Republic of South Africa 69Map D: National Railway Network of the Republic of South Africa 80Map E: Republic of South Africa Pipeline Network 92
ABBREVIATIONS AND ACRONYMS
ACSA Airports Company of South Africa AMID Association of Motorcycle Importers and Distributors DOE Department of Energy DOT Department of Transport GMA GaGautrain Management Agency NAAMSA National Association of Automobile Manufacturers of South Africa PRA Port Regulator Authority PRASA Passenger Rail Agency of South Africa RTMC Road Traffi c Management Corporation SAA South African Airways SACAA South African Civil Aviation Authority SANRAL South African National Roads Agency Limited SAPIA SAPIA South African Petroleum Industry Association StatsSA Statistics South Africa TFR Transnet Freight Rail TNPA Transnet National Port Authority

Annual Transport Statistics Bulletin 2014 Republic of South Africaviii
EXECUTIVE SUMMARY
INTRODUCTIONThe objective of the Transport Statistics Bulletin is to provide a comprehensive publication of transport statistics which give a coherent summary of transport activity in South Africa.
This section seeks to present selected high level transport indicators from the Statistical Bulletin 2014. It solely based on information that the Department of Transport was able to get from stakeholders in the transport sector. The summary of results follows the sequence of the sections that are in the bulletin.
GENERAL TRANSPORT RELATED TRENDSEmployment in the transport sector decreased by 9.6% to 952 000 in 2014 when compared with that of the fourth quarter of 2013. Transport sector constituted about 6% of the total formal sector employment in fourth quarter 2014 (Stats SA, 2014).
Audited transport related infrastructure expenditure outcomes in other spheres of Government, agencies and departments grew by 9% from R39,3 billion in 2013/14 to R43 billion in 2013/14.
Estimates from Statistics South Africa indicated that the payload transported on rail increased from 214 million tons in 2013 to about 223 million in 2014. A signifi cant proportion (72%) of the payload continued to be carried by road.
ROADS
Infrastructure
Approximately R8,7 billion was spent on provincial roads maintenance in 2013/14. Kwazulu-Natal had the highest proportion of expenditure of 21.1%, then followed by Eastern Cape and Limpopo with 17.6% and 15.9% respectively. The total expenditure on provincial road maintenance had actually increased by 28% in 2013/14 when compared to that of 2012/13.
Vehicle Population and Licensing
The number of registered motorised vehicles increased by about 3.4% to 10,2 million in 2014. Gauteng province had the largest share of 38.9% of live motorised vehicle population in 2014, followed by Western Cape and Kwazulu-Natal with 16% and 13.9% respectively. The number of driving licences issued increased by 4.7% to 11.1 million in 2014 from 10,6 million in 2013.
Road Safety
South African roads had 10,367 fatal crashes which resulted in 12,702 fatalities in the calendar year 2014. The percentage increase in fatal crashes was 1.9% whereas that of fatalities was 7.2% when compared to 2013.

Annual Transport Statistics Bulletin 2014 Republic of South Africa ix
MARITIME
Annual Cargo and Bulk
The total cargo handled by South African ports increased by 2.8% to 220 million metric tons in 2014, with Richards Bay continuing to have the largest percentage share of 42.9%.The annual bulk increased to approximately 204 million metric tons in 2014 with Richards Bay port continuing to handle the largest share of the annual bulk (44%) followed by Saldanha Bay and Durban ports with 31% and 18% respectively.
Imports and Exports
Imports handled at the South African ports dropped by 0.8% to about 50.1 million tons in 2014 while exports handled dropped by 23.5% to approximately 164 million tons in the same year.
AVIATION
Licensing and Registration
The number of pilot and other licences issued declined by 17.1% to 2304 in 2014. Licences issued to males constituted about 42% of the total fi gure. Civil registered aircraft had an upturn of about 1.3% to 6059 in 2014.
Air traffi c
Passenger volumes at airports run by ACSA increased by 3.5% to 35.9 million in 2014 from 34.7 million in 2013. OR Tambo Airport continued to have the highest share (53%) of passenger volumes followed by Cape Town (24%) and Durban (12%). The same upward trend was observed in aircraft movements which increased by 5.3% to 541 126 in 2014.
Air Safety
Aircraft accidents and fatalities generally decreased in 2014 when compared to 2013. Accidents decreased by 9.3% to 129 while fatalities decreased by 11.4% to 31 in 2014.
RAIL
Passenger rail information
The average Metro Rail passenger volume per month for the calendar year 2014 was approximately 44 million passengers. The percentage of trains that were on time was 82%.
The Gautrain has had a 16 % increase in passenger volumes transported to about 14.9 million passengers in 2014.

Annual Transport Statistics Bulletin 2014 Republic of South Africax
Rail Safety
The total number of accidents recorded in the passenger rail operations decreased by 12.5 % to 42 in 2014.
PIPELINES
The total annual volume of petroleum products transported through pipelines grew by 4.4% to 16.5 billion litres in 2014.

SECTION 1GENERAL INFORMATION

Annual Transport Statistics Bulletin 2014 Republic of South Africa2
1.1 EMPLOYMENT
Table 1.1: Formal Sector Employment by Industry, 2009 – 2014
October to December (Fourth Quarter) Year-on-year change
(%)
2009 2010 2011 2012 2013 2014
Thousand
Agriculture 624 627 630 685 713 742 -0.6%
Mining 301 298 327 357 426 427 12.0%
Manufacturing 1,792 1,783 1,789 1,730 1,766 1,749 -2.7%
Utilities 102 94 81 98 127 104 24.1%
Construction 1,127 1,056 1,057 1,061 1,204 1,334 6.4%
Trade 2,933 2,975 3,060 2,921 3,224 3,247 3.7%
Transport 767 761 788 816 961 952 -9.6%
Finance & other business services 1,812 1,594 1,739 1,804 2,037 2,039 4.5%
Community & Social services 2,661 2,826 2,902 3,028 3,470 3,501 6.7%
Private Households 1,129 1,117 1,118 1,076 1,244 1,219 4.6%
Total 13,248 13,131 13,422 13,577 15,177 15,320 4.5%
Note: Due to rounding, numbers do not necessarily add to totals
Source: Statistics South Africa (Stats SA)
Table 1.1 shows that employment in the transport sector decreased by 9.6% to 952 000 in 2014
when compared with that of the fourth quarter of 2013. Transport sector constituted about 6.2%
of the total formal sector employment in fourth quarter 2014.
Figure 1.1: Percentage of Employment in the Transport Sector, 2009 – 2014
Source: Statistics South Africa (Stats SA)
20,0
15,0
10,0
5,0
0,0
-5,020142009 2010 2011 2012 2013
Transport -0,9-0,9 -0,8 3,5 3,6 17,8
Annual Transport Statistics Bulletin 2014 Republic of South Africa 3
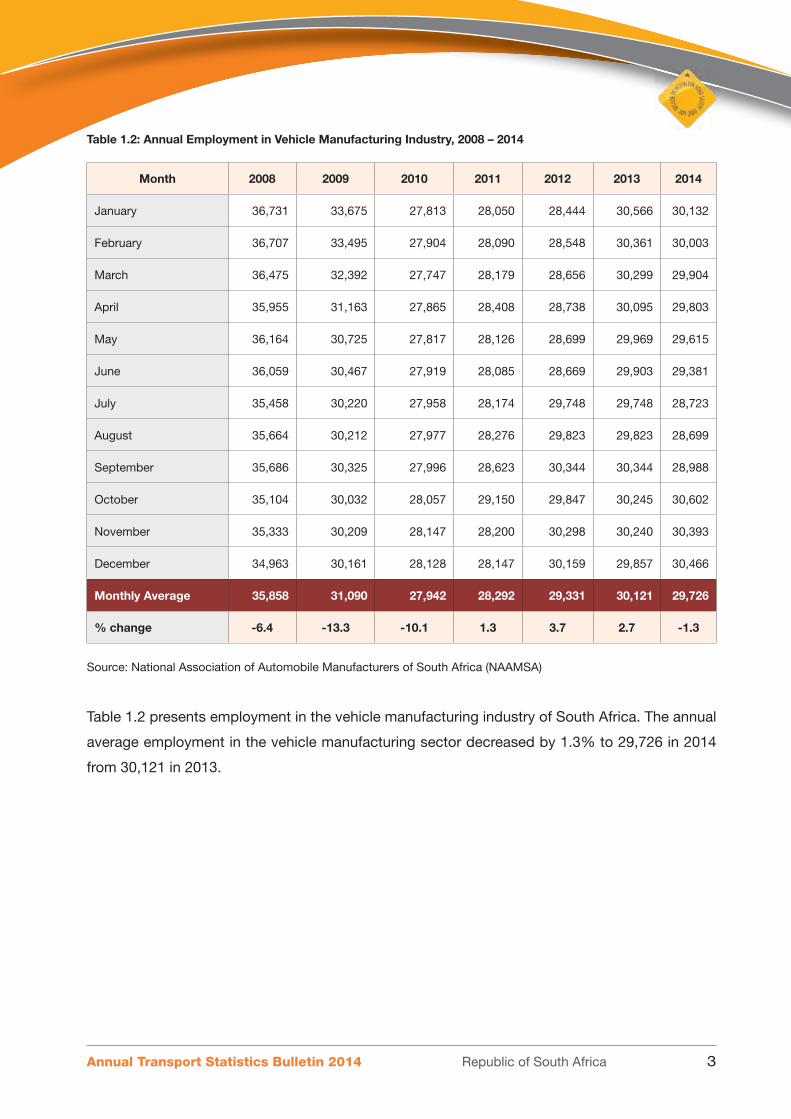
Table 1.2: Annual Employment in Vehicle Manufacturing Industry, 2008 – 2014
Month 2008 2009 2010 2011 2012 2013 2014
January 36,731 33,675 27,813 28,050 28,444 30,566 30,132
February 36,707 33,495 27,904 28,090 28,548 30,361 30,003
March 36,475 32,392 27,747 28,179 28,656 30,299 29,904
April 35,955 31,163 27,865 28,408 28,738 30,095 29,803
May 36,164 30,725 27,817 28,126 28,699 29,969 29,615
June 36,059 30,467 27,919 28,085 28,669 29,903 29,381
July 35,458 30,220 27,958 28,174 29,748 29,748 28,723
August 35,664 30,212 27,977 28,276 29,823 29,823 28,699
September 35,686 30,325 27,996 28,623 30,344 30,344 28,988
October 35,104 30,032 28,057 29,150 29,847 30,245 30,602
November 35,333 30,209 28,147 28,200 30,298 30,240 30,393
December 34,963 30,161 28,128 28,147 30,159 29,857 30,466
Monthly Average 35,858 31,090 27,942 28,292 29,331 30,121 29,726
% change -6.4 -13.3 -10.1 1.3 3.7 2.7 -1.3
Source: National Association of Automobile Manufacturers of South Africa (NAAMSA)
Table 1.2 presents employment in the vehicle manufacturing industry of South Africa. The annual
average employment in the vehicle manufacturing sector decreased by 1.3% to 29,726 in 2014
from 30,121 in 2013.

Annual Transport Statistics Bulletin 2014 Republic of South Africa4
Figure 1.2: Percentage change in Average Employment in Vehicle Manufacturing Industry, 2008 – 2014
Source: National Association of Automobile Manufacturers of South Africa (NAAMSA)
Table 1.3: Transnet Employment in Operational Divisions, 2008 – 2014
Operational Division 2008 2009 2010 2011 2012 2013 2014Year on Year % Change
Spoornet (TFR incl RME) 24,577 24,234 23,609 23,374 25,442 29,489 29,225 -0.01
Transwerk (TRE) 13,486 13,622 12,922 12,282 12,572 12,752 12,428 -0.03
TNPA 3,173 3,255 3,150 3,245 3,422 3,584 3,823 0.07
Petronet (TPL) 466 477 523 515 565 627 621 -0.01
SAPO (TPT) 5,395 5,267 5,306 5,720 6,211 6,662 6,624 -0.01
Other (TCP,TP,TCC) 2,710 1,610 1,950 0.21
Total Permanent Employees
47,097 46,855 47,129 47,763 50,922 54,724 54,671 0.00
Permanent & Fixed Term Employees
57,983 56,866 56,242 55,519 60,739 64,352 64,122 0.00
Note: dashes denote Operational Divisions are no longer under Transnet
Source: Transnet
There has been a decrease in the permanent employment at Transnet operational division from
54,724 in 2013 to 54,672 in 2014.
6,0
4,0
2,0
0,0
-2,0
-4,0
-6,0
-8,0
-10,0
-12,0
-14,0
-16,0
20142009 2010 2011 2012 2013Employment in Vehicle Manufacturing Industry 2,7-6,4 -13,3 -10,1 1,3 3,7
2008
-1,3

Annual Transport Statistics Bulletin 2014 Republic of South Africa 5
70 000
60 000
50 000
40 000
30 000
20 000
10 000
-
Total Permanent Employees
Permanent & Fixed Term Employees
Figure 1.3: Annual Number of Transnet Employment, 2008 – 2014
2008 2009 2010 2011 2012 2013 2014
47 097
57 983
46 855
56 866
47 129
56 242
47 763
55 519
50 922
60 739
54 724
64 352
54 671
64 122

Annual Transport Statistics Bulletin 2014 Republic of South Africa6
1.2 TRANSPORT AND ECONOMY
Table 1.4: Contribution of the Transport and Communication Sectors to the Gross Domestic Product (GDP), 2008-2014
2008 2009 2010 2011 2012 2013 2014
R’million
GDP at market prices 2,708,601 2,666,940 2,748,008 2,836,287 2,899,247 2,963,389 3,008,576
Transport, storage and communication
226,136 354,870 229,499 236,439 236,439 247,062 252,648
Percentage Contribution of Transport, Storage & Comminication to GDP
8.35% 13.31% 8.35% 8.34% 8.16% 8.34% 8.40%
Source: Statistics South Africa (Stats SA)
The overall contribution to the gross domestic product (GDP) at market prices of the Transport,
storage and communication sector stood at about 8.4% in 2014 (Table 1.4).
Figure 1.4: Percentage share Contribution of the Transport and Communication Sectors to the Gross Domestic Product (GDP), 2008-2014
Source: Statistics South Africa (Stats SA)
2008 2009 2010 2011 2012 2013 2014
14,0%
12,0%
10,0%
8,0%
6,0%
4,0%
2,0%
0,0%
Percentage Contribution of Transport, Storage & Communication GDP
8,3% 13,3% 8,4% 8,3% 8,2% 8,3% 8,4%
Annual Transport Statistics Bulletin 2014 Republic of South Africa 7
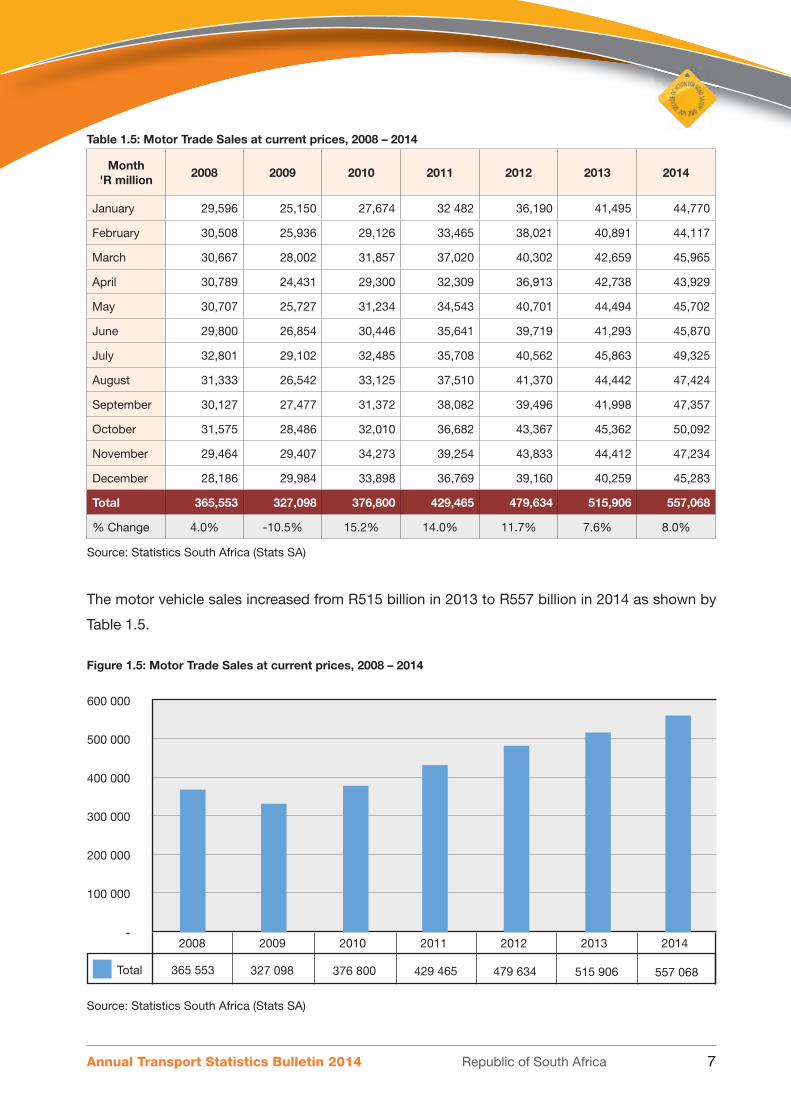
Table 1.5: Motor Trade Sales at current prices, 2008 – 2014
Month 'R million
2008 2009 2010 2011 2012 2013 2014
January 29,596 25,150 27,674 32 482 36,190 41,495 44,770
February 30,508 25,936 29,126 33,465 38,021 40,891 44,117
March 30,667 28,002 31,857 37,020 40,302 42,659 45,965
April 30,789 24,431 29,300 32,309 36,913 42,738 43,929
May 30,707 25,727 31,234 34,543 40,701 44,494 45,702
June 29,800 26,854 30,446 35,641 39,719 41,293 45,870
July 32,801 29,102 32,485 35,708 40,562 45,863 49,325
August 31,333 26,542 33,125 37,510 41,370 44,442 47,424
September 30,127 27,477 31,372 38,082 39,496 41,998 47,357
October 31,575 28,486 32,010 36,682 43,367 45,362 50,092
November 29,464 29,407 34,273 39,254 43,833 44,412 47,234
December 28,186 29,984 33,898 36,769 39,160 40,259 45,283
Total 365,553 327,098 376,800 429,465 479,634 515,906 557,068
% Change 4.0% -10.5% 15.2% 14.0% 11.7% 7.6% 8.0%
Source: Statistics South Africa (Stats SA)
The motor vehicle sales increased from R515 billion in 2013 to R557 billion in 2014 as shown by
Table 1.5.
Figure 1.5: Motor Trade Sales at current prices, 2008 – 2014
Source: Statistics South Africa (Stats SA)
600 000
500 000
400 000
300 000
200 000
100 000
-2008 2009 2010 2011 2012 2013 2014
365 553 327 098 376 800 429 465 479 634 515 906 557 068Total
Annual Transport Statistics Bulletin 2014 Republic of South Africa8
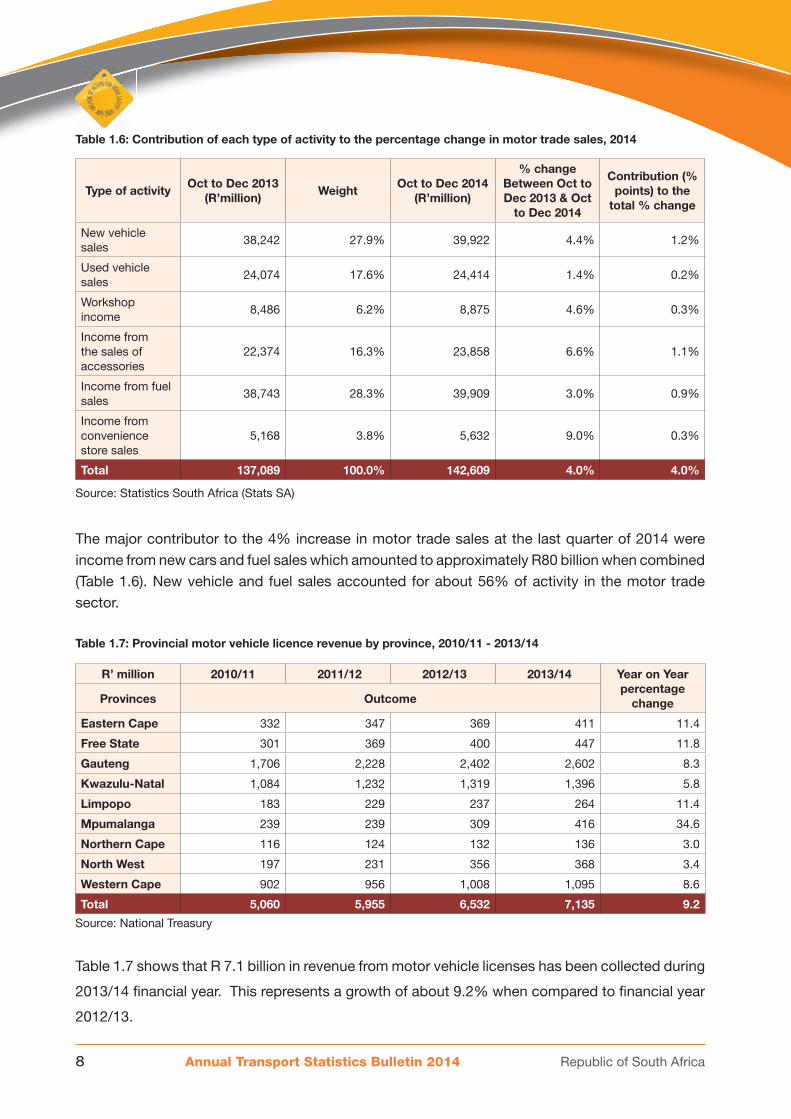
Table 1.6: Contribution of each type of activity to the percentage change in motor trade sales, 2014
Type of activityOct to Dec 2013
(R’million)Weight
Oct to Dec 2014 (R’million)
% change Between Oct to Dec 2013 & Oct
to Dec 2014
Contribution (% points) to the
total % change
New vehicle sales
38,242 27.9% 39,922 4.4% 1.2%
Used vehicle sales
24,074 17.6% 24,414 1.4% 0.2%
Workshop income
8,486 6.2% 8,875 4.6% 0.3%
Income from the sales of accessories
22,374 16.3% 23,858 6.6% 1.1%
Income from fuel sales
38,743 28.3% 39,909 3.0% 0.9%
Income from convenience store sales
5,168 3.8% 5,632 9.0% 0.3%
Total 137,089 100.0% 142,609 4.0% 4.0%
Source: Statistics South Africa (Stats SA)
The major contributor to the 4% increase in motor trade sales at the last quarter of 2014 were
income from new cars and fuel sales which amounted to approximately R80 billion when combined
(Table 1.6). New vehicle and fuel sales accounted for about 56% of activity in the motor trade
sector.
Table 1.7: Provincial motor vehicle licence revenue by province, 2010/11 - 2013/14
R’ million 2010/11 2011/12 2012/13 2013/14 Year on Year percentage
changeProvinces Outcome
Eastern Cape 332 347 369 411 11.4
Free State 301 369 400 447 11.8
Gauteng 1,706 2,228 2,402 2,602 8.3
Kwazulu-Natal 1,084 1,232 1,319 1,396 5.8
Limpopo 183 229 237 264 11.4
Mpumalanga 239 239 309 416 34.6
Northern Cape 116 124 132 136 3.0
North West 197 231 356 368 3.4
Western Cape 902 956 1,008 1,095 8.6
Total 5,060 5,955 6,532 7,135 9.2
Source: National Treasury
Table 1.7 shows that R 7.1 billion in revenue from motor vehicle licenses has been collected during
2013/14 fi nancial year. This represents a growth of about 9.2% when compared to fi nancial year
2012/13.

Annual Transport Statistics Bulletin 2014 Republic of South Africa 9
Figure 1.6: Provincial motor vehicle licence revenue by province, 2013/14
Source: National Treasury
Table 1.8: Basic Fuel Prices (cents/litre) and Exchange Rate (R/US$), 2014
2014 RSA c/litre
Petrol 93 Unleaded
Petrol 95 Unleaded
Diesel 0.05% Sulphur
Diesel 0.005% Sulphur
Illum Paraffi n
Exchange Rate Rands/
US$
Average Dated Brent
Crude
January 781.190 792.190 856.630 860.030 864.128 10.3581 110.73
February 817.990 828.990 878.030 882.030 876.128 10.8105 108.35
March 851.790 862.790 903.630 908.030 892.128 11.0054 108.87
April 835.590 848.590 873.630 879.030 853.128 10.7695 107.67
May 829.370 842.370 852.630 858.030 834.128 10.5576 108.31
June 813.950 826.950 835.630 839.030 824.128 10.4042 109.69
July 842.950 857.950 849.630 853.030 847.128 10.6743 111.62
August 838.570 853.570 839.630 844.030 840.128 10.6609 106.64
September 771.750 786.750 818.630 824.030 821.128 10.6781 101.57
October 773.750 781.750 805.630 811.030 807.128 10.6781 97.73
November 728.750 736.750 744.630 744.630 755.128 11.1004 87.54
December 648.250 656.250 686.630 692.030 701.128 11.0969 79.75
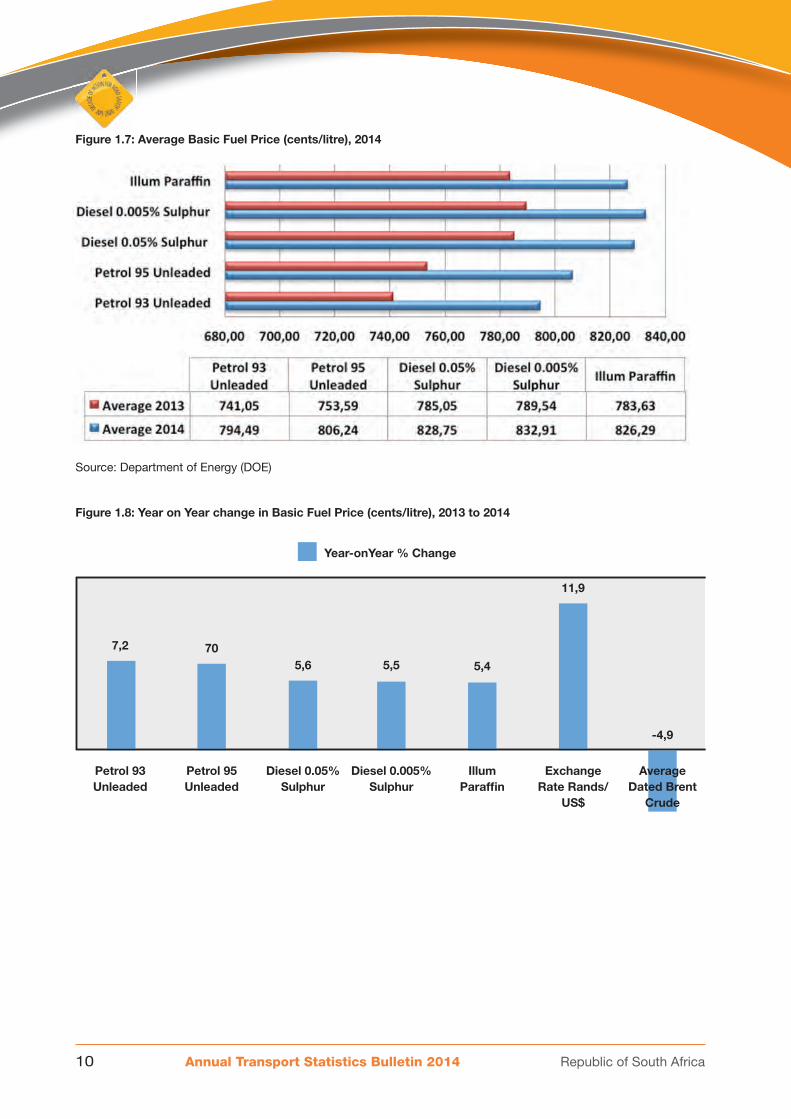
Average 2014 794.492 806.242 828.747 832.913 826.295 10.7328 103.21
Average 2013 741.051 753.585 785.047 789.537 783.633 9.590 108.505
Year-on-Year % Change
7.2% 7.0% 5.6% 5.5% 5.4% 11.9% -4.9%
Source: Department of Energy (DME)
Annual Transport Statistics Bulletin 2014 Republic of South Africa10
Figure 1.7: Average Basic Fuel Price (cents/litre), 2014
Source: Department of Energy (DOE)
Figure 1.8: Year on Year change in Basic Fuel Price (cents/litre), 2013 to 2014
Year-onYear % Change
Petrol 93Unleaded
Petrol 95Unleaded
Diesel 0.05%Sulphur
Diesel 0.005%Sulphur
IllumParaffi n
ExchangeRate Rands/
US$
AverageDated Brent
Crude
7,2 705,6 5,5 5,4
11,9
-4,9

Annual Transport Statistics Bulletin 2014 Republic of South Africa 11
1.3 FINANCE AND INFRA-STRUCTURE
Table 1.9: Summary of Expenditure on Infrastructure, 2008/09-2013/14
Infrastructure transfers to other spheres, agencies and departments
Expenditure outcome
Audited Audited Audited Audited Audited Audited
R thousand 2008/09 2009/10 2010/11 2011/12 2012/13 2013/14
Rail-Passenger Rail Agency 5,417,290 7,017,635 8,265,206 9,474,098 10,227,905 11,159,113
Rail-Gautrain 3,265,993 2,976,720 438,360 5,300 0 0
Bus subsidies and Public Transport Operations Grant
3,840,873 3,899,643 3,863,033 4,153,232 4,317,269 4,552,521
Roads-SANRAL 4,059,964 5,608,086 6,844,501 14,401,596 9,728,055 10,497,184
Roads-Provincial Roads Grant 3,323,019 4,162,161 4,080,104 5,872,354 6,828,533 8,737,775
Roads-Overload Control and Roads Grants
38,796 44,416 11,038 0 0 0
Roads-Road Asset management System
8,900 12,800 10,400 35,439 37,295 52,205
Taxi 565,567 730,452 609,207 576,323 605,705 590,786
Public Transport infrastructure and Systems:
-Municipalities 2,919,830 2,418,177 3,699,462 4,803,347 4,988,103 4,668,676
-Passenger Rail Agency 0 464,758 500,000 0 0 0
-S.A. National Roads Agencies 100,000 106,000 0 0 0 0
Public Transport Network Grant 0 0 0 0 0 881,305
Disaster Management Grant 1,035,473 116,900 0 240,000 489,912 367,822
Coal haulage 0 0 0 585,000 663,400 808,900
Road Accident Fund 2,500,000 0 0 0 0 0
Transfer to other Public Entities 154,144 159,579 147,168 161,012 479,526 306,931
eNaTIS maintenance from transaction fees
165,000 198,835 186,040 417,640 297,000 0
Other 766,814 747,836 500,630 471,190 665,512 413,626
Total 28,161,663 28,663,998 29,155,149 41,196,531 39,328,215 43,036,844
% Change - 1.8 1.7 41.3 -4.5 9.4
Source: National Treasury
Table 1.10 shows that audited infrastructure expenditure outcomes in other spheres of Government,
agencies and departments grew from R39.3 billion in 2012/13 to R43 billion in 2013/14. This
represents a 9.4% year on year increase.

Annual Transport Statistics Bulletin 2014 Republic of South Africa12
Figure 1.9: Summary of Expenditure on Infrastructure, 2008/09-2013/14
Source: Department of Transport
Table 1.10: New Vehicle Manufacturing Industry Capital Expenditure, 2008 – 2014
Capital Expenditure 2008 2009 2010 2011 2012 2013 2014
Product/Local/Content/Export Investment/ Production Facilities 2 807,7 2 215,9 3351,1 3522,7 3990,2 3604.9 6092
Land and Buildings 329,1 178,7 441,2 176,4 402,2 424.3 478
Support Infrastructure (I.T., R&D, Technical, etc.) 153,1 74,1 202,4 203,6 306,1 319.3 347
Total 3 289,9 2468,0 3994,7 3902,7 4698,5 4348.5 6917
Source: National Association of Automobile Manufacturers of South Africa (NAAMSA)
Table 1.11: Average Motor Vehicle Assembly Industry Capacity Utilisation Levels, 2008 – 2014
2008 2009 2010 2011 2012 2013 2014
Cars 68.3% 59.4% 77.1% 81.6% 86.5% 68.00% 67.00%
Light Commercials 73.9% 56.5% 68.4% 73.5% 87.8% 75.30% 80.50%
Medium Commercials 89.9% 64.6% 77.2% 88.4% 84.3% 59.80% 85.70%
Heavy Commercials 87.6% 66.1% 77.5% 89.9% 86.9% 69.30% 80.70%
Source: National Association of Automobile Manufacturers of South Africa (NAAMSA)
There has been an increase in expenditure on production facilities by automotive manufacturers
to R6.9 billion in 2014 from about R4.3 billion in 2013.
Thou
sand
s
50 000
40 000
30 000
20 000
10 000
02008/9 2009/10 2010/11 2011/12 2012/13 2013/14
Total 28 161 663 28 663 998 29 155 149 41 196 531 39 328 215 43 036 844

Annual Transport Statistics Bulletin 2014 Republic of South Africa 13
Table 1.11 indicates the percentage of productive capacity utilization in the automotive production
plants in South Africa. There was a general improvement in the utilization of production capacity
for almost all the classes of vehicles in 2014 except in the cars segment. This observation is
consistent with the increase in capital expenditure on production facilities in Table 1.10.
Table 1.12: South Africa’s Automotive Industry’s Performance in a Global Context, 2008 – 2014
2008 2009 2010 2011 2012 2013 2014
Global Vehicle Production 70,5 61,0 77.61 79.88 84.14 87.2 89.77
SA Vehicle Production 0.6 0.4 0.472 0.533 0.546 0.5 0.566
SA Share of Global Production 0.8% 0.6% 0.6% 0.7% 0.6% 0.6% 0.6%
Source: National Association of Automobile Manufacturers of South Africa (NAAMSA), International Organisation of
Motor Vehicle Manufacturers (OICA)
Table 1.12 shows that the South African share in the global vehicle production remain steady at
0.6%.
Figure 1.10: South Africa Share of Global Production, 2008 – 2014
0,9%
0,8%
0,7%
0,6%
0,5%
0,4%
0,3%
0,2%
0,1%
0,0%2008 2009 2010 2011 2012 2013 2014
SA Share of Global Production 0,8% 0,6% 0,6% 0,7% 0,6% 0,6% 0,6%

Annual Transport Statistics Bulletin 2014 Republic of South Africa14
1.4 LAND TRANSPORT STATISTICS
Table 1.13: Total Freight Transport Estimates, 2011 – 2014
RAIL ROAD
Payload (000 tons) Income (R
million)2014
Payload (000 tons) Income (R
million)20142011 1/ 2012 1/ 2013 2014 2011 1/ 2012 1/ 2013 2014
January 14,094 16,809 17,244 18,079 2,890 33,933 36,752 41,865 42,045 6,249
February 16,845 17,673 19,051 17,188 2,732 36,962 39,821 43,896 44,559 6,611
March 15,970 17,699 17,323 16,925 2,625 42,653 39,493 43,231 45,697 6,611
April 16,395 17,220 17,961 19,561 3,249 39,674 37,536 44,445 46,703 6,717
May 16,445 15,570 14,808 15,512 2,623 41,059 41,777 45,549 48,832 7,233
June 13,004 17,953 18,506 19,128 3,121 42,325 41,481 42,610 47,812 7,099
July 15,990 18,390 18,776 18,795 3,080 42,704 40,327 46,069 48,728 7,208
August 16,409 17,016 18,482 18,832 3,242 43,544 41,811 45,754 48,142 7,040
September 18,212 18,874 18,734 20,336 3,378 44,578 39,026 45,092 48,791 7,225
October 18,037 16,455 18,464 19,663 3,068 43,738 41,884 45,047 50,118 7,404
November 17,900 18,615 18,164 20,284 3,277 45,776 46,612 47,066 51,547 7,721
December 17,251 17,142 17,318 19,265 3,074 38,194 37,533 40,397 42,291 6,176
Total 196,552 209,416 214,831 223,568 36,359 495,140 484,053 531,021 565,265 83,294
1/ Preliminary
Source: Statistics South Africa (Stats SA)
Table 1.15 shows that the payload transported on rail increased from 214 million tons in 2013 to
about 223 million in 2014. The payload transported by road increased from 531 million tons to 565
million tons in 2014.

Annual Transport Statistics Bulletin 2014 Republic of South Africa 15
Figure 1.11: Total Freight Payload (000 tons) Estimates 2011 to 2014
2011 2012 2013 2014
600 000
500 000
400 000
300 000
200 000
100 000
0
RailRoad
Annual Transport Statistics Bulletin 2014 Republic of South Africa16
Source: Statistics South Africa
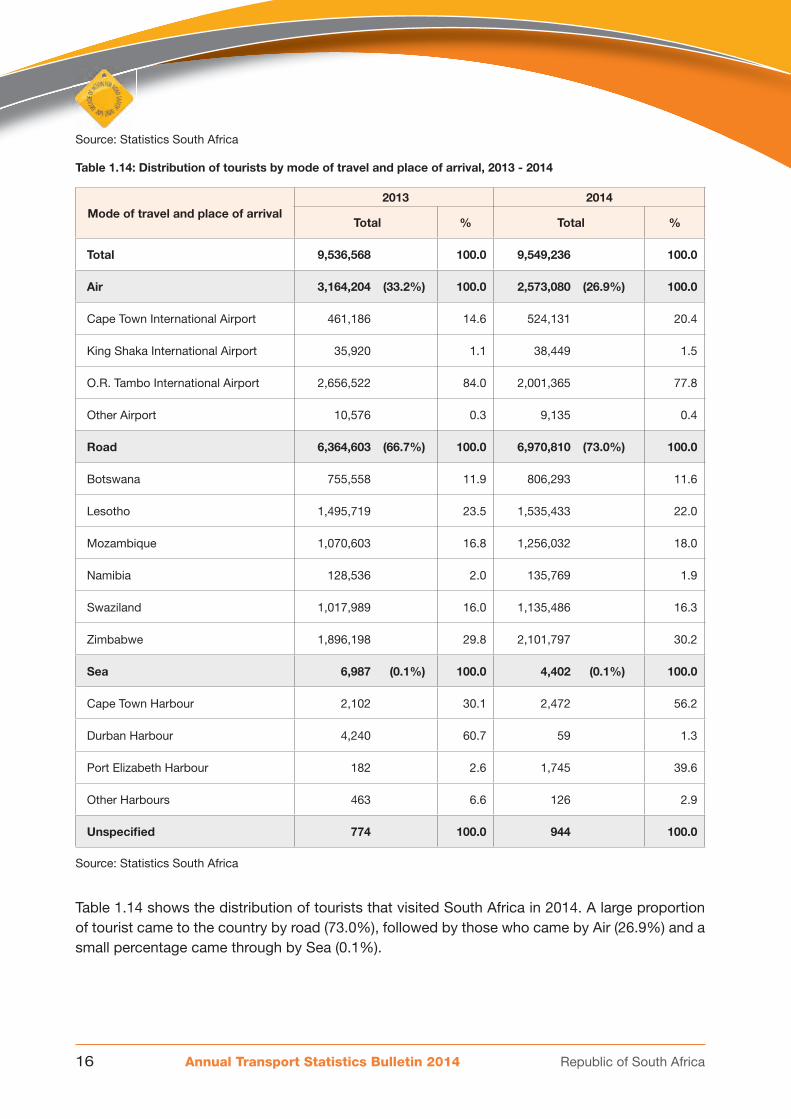
Table 1.14: Distribution of tourists by mode of travel and place of arrival, 2013 - 2014
Mode of travel and place of arrival 2013 2014
Total % Total %
Total 9,536,568 100.0 9,549,236 100.0
Air 3,164,204 (33.2%) 100.0 2,573,080 (26.9%) 100.0
Cape Town International Airport 461,186 14.6 524,131 20.4
King Shaka International Airport 35,920 1.1 38,449 1.5
O.R. Tambo International Airport 2,656,522 84.0 2,001,365 77.8
Other Airport 10,576 0.3 9,135 0.4
Road 6,364,603 (66.7%) 100.0 6,970,810 (73.0%) 100.0
Botswana 755,558 11.9 806,293 11.6
Lesotho 1,495,719 23.5 1,535,433 22.0
Mozambique 1,070,603 16.8 1,256,032 18.0
Namibia 128,536 2.0 135,769 1.9
Swaziland 1,017,989 16.0 1,135,486 16.3
Zimbabwe 1,896,198 29.8 2,101,797 30.2
Sea 6,987 (0.1%) 100.0 4,402 (0.1%) 100.0
Cape Town Harbour 2,102 30.1 2,472 56.2
Durban Harbour 4,240 60.7 59 1.3
Port Elizabeth Harbour 182 2.6 1,745 39.6
Other Harbours 463 6.6 126 2.9
Unspecifi ed 774 100.0 944 100.0
Source: Statistics South Africa
Table 1.14 shows the distribution of tourists that visited South Africa in 2014. A large proportion of tourist came to the country by road (73.0%), followed by those who came by Air (26.9%) and a small percentage came through by Sea (0.1%).

SECTION 2ROADS

Annual Transport Statistics Bulletin 2014 Republic of South Africa18
Map
A: N
atio
nal R
oad
Net
wor
k of
the
Rep
ublic
of S
outh
Afr
ica

Annual Transport Statistics Bulletin 2014 Republic of South Africa 19
2.1 ROAD INFRASTRUCTURE EXPENDITURE
Table 2.1: Provincial Roads Maintenance Grant Expenditure (R thousand), 2011/12 – 2013/14
Province 2011/12 2012/13 2013/142013/14
Percentage Share
Eastern Cape 1,034,086 1,203,807 1,292,390 17.6%
Free State 494,381 520,495 1,325,323 7.6%
Gauteng 566,917 572,770 655,148 8.4%
KwaZulu-Natal 1,236,648 1,440,471 1,523,528 21.1%
Limpopo 1,108,550 1,087,122 572,344 15.9%
Mpumalanga 605,437 581,694 1,489,393 8.5%
Northern Cape 501,826 584,011 699,484 8.6%
North West 407,755 359,268 661,905 5.3%
Western Cape 411,141 478,895 518,160 7.0%
Totals 6,366,741 6,828,533 8,737,775 100.0%
% Change - 7.3% 28.0%
Source: Department of Transport
Table 2.1 shows that approximately R8,7 billion was spent on provincial roads maintenance in
2013/14, Kwazulu-Natal had the highest proportion of 21.1%, then followed by Eastern Cape
and Limpopo with 17.6% and 15.9% respectively. The total expenditure on provincial road
maintenance increased by a whopping 28% in 2013/14 when compared to that of 2012/13.
Thou
sand
s
10 000
9 000
8 000
7 000
6 000
5 000
4 000
3 000
2 000
1 000
02011/12 2012/13 2013/14
Figure 2.1: Provincial Roads Maintenance Grant Expenditure, 2011/12 – 2013/14
Source: Department of Transport

Annual Transport Statistics Bulletin 2014 Republic of South Africa20
2.2 MOTOR VEHICLES PRODUCTION AND SALES
Table 2.2: Vehicles Production, Sales, Exports and Imports, 2008 – 2014
2008 2009 2010 2011 2012 2013 2014
CARS
Domestically Produced
Local Sales 125 454 94 379 113 740 124 736 120 417 113 247 122 571
Exports (CBU) 195 670 128 602 181 654 1 287 529 151 659 151 893 154 920
Total Domestic Production 321 124 222 981 295 394 312 265 272 076 265 140 277 491
CBU Imports
NAAMSA 169 610 130 326 165 341 206 830
AMH & Others 34 198 33 424 58 049 64 726
Total Car Imports 203 808 163 750 223 390 271 556 323 796 338 701 318 343
Re-exported imports 1 609 1 652 1 650
TOTAL LOCAL CAR MARKET 329 262 258 129 337 130 396 292 442 604 450 296 439 264
LIGHT COMMERCIALS
Domestically Produced
Local Sales 118 641 85 663 96 823 108 704 121 638 127 051 137 044
Exports 87 314 45 514 56 950 84 125 123 443 121 345 118 585
Total Domestic Production 205 955 131 177 153 773 192 829 245 081 248 396 255 629
CBU Imports
NAAMSA 40 647 24 459 27 790 31 993
AMH & Others 10 178 8 037 9 121 8 604
Total LCV Imports 50 825 32 496 36 911 40 597 38 741 41 253 36 951
Re-exported imports 205 308 306
TOTAL LOCAL LCV MARKET 169 466 118 159 133 756 149 301 160 174 167 996 173 689
MEDIUM & HEAVY COMMERCIALS
NAAMSA sales (incl. Imports) 34 659 18 934 22 021 26 656 27 841 30 924 31 551
Exports 1 227 831 861 803 1 076 1 206 1 412
TOTAL MCV/HCV MARKET 34 659 18 934 22 021 26 656 27 841 30 924 31 551
TOTAL AGGREGATE MARKET 533 387 395 222 492 907 572 249 630 619 649 216 644 504
TOTAL AGGREGATE EXPORTS 284 211 174 947 239 465 272 457 277 992 276 404 276 873
TOTAL DOMESTIC PRODUCTION 562 965 373 923 472 049 532 645 546 074 545 666 566 083
GDP GROWTH RATE 3.2% -1.5% 3.0% 3.2% 2.2% 2.2% 1.5%
NO OF VEHICLE PRODUSED PER EMPLOYEE PER ANNUM
15.7 13.2 16.8 18.8 18.7 18.1 19.3
Note: Domestically produced cars and LCVs total represents a proxy for aggregate local production. Information based on data collected by NAAMSA and estimates of non-NAAMSA sales. CBU Export fi gures are based on projections announced to date. Announcements of new CBU export programmes could change projections.
Source: National Association of Automobile Manufacturers of South Africa (NAAMSA)
The total domestic vehicle production increased to 566,083 units in 2014 from 545,666 units in
2013.

Annual Transport Statistics Bulletin 2014 Republic of South Africa 21
Table 2.3: Vehicle Retail Sales by Type in 2008 – 2014
Market 2008 2009 2010 2011 2012 2013 2014
BUS 912 1 434 1 434 972 1 089 1 046 1 253
HCV 6 276 3 839 3 839 4 693 4 944 5 474 5 441
LCV 118 641 110 122 110 122 140 680 147 357 169 209 173 782
MCV 6 601 7 229 7 229 8 663 9 346 11 583 11 001
PAS 124 696 224 705 224 705 330 703 364 724 450 466 438 942
XHV 9 633 6 432 6 432 11 710 11 913 12 820 13 838
Total 266 759 353 761 425 737 497 421 539 373 650 598 644 257
% Change - 32.61 20.35 16.84 8.43 20.62 -0.97 Note: HCV – Heavy Commercial Vehicle LCV – Light Commercial Vehicle < 3501kg MCV – Medium Commercial Vehicle 3501-8500kg XHV – Extra Heavy Vehicle > 16500kg PAS – Passenger Vehicle BUS – Bus > 8500kg
Source: National Association of Automobile Manufacturers of South Africa (NAAMSA)
Vehicle retail sales declined from 650,598 units in 2013 to 644,257 units in 2014 (Table 2.3). This
was a 0.97% decrease in the volume of annual vehicle sales compared to 2013.
Figure 2.2: Vehicles Domestically Produced, 2008 – 2014
Source: National Association of Automobile Manufacturers of South Africa (NAAMSA)
600 000
500 000
400 000
300 000
200 000
100 000
02008 2009 2010 2011 2012 2013 2014
562 965
373 923
472 049
532 645 546 074 545 666566 083

Annual Transport Statistics Bulletin 2014 Republic of South Africa22
Figure 2.3: Annual Vehicle Retails Sales by Type in 2008 – 2014
Source: National Association of Automobile Manufacturers of South Africa (NAAMSA)
100%
90%
80%
70%
60%
50%
40%
30%
20%
10%
0%
BUS HCV LCV MCV PAS XHV
2008 2009 2010 2011 2012 2013 2014

Annual Transport Statistics Bulletin 2014 Republic of South Africa 23
Table 2.4: Motorcycles Sales by User Class and Engine Class, 2008 – 2014.
User Class 2008 2009 2010 2011 2012 2013 2014
A
Scooters 0 - 500 2 613 1 807 1 873 5 919 6 367 4 552 4 126
Scooters 501 Up 64 39 35 33 75 75 77
Speciality 769 568 368 527 727 559 414
0 - 150 2 591 2 160 2 110 4 337 5 541 5 315 4 615
Commercial 3 323 2 018 1 729 1 614 1 681 1 063 561
Agricultural 1 035 1 166 883 640 480 545 431
Sub Total A 10 395 7 758 6 998 13 070 14 871 12 109 10 224
B
Trail 151 Up 4 830 3 684 3 790 4 436 4 923 5 571 4 275
Road 151 - 800 2 047 1 355 1 267 1 940 2 987 2 687 1 821
Road 800 Up 2 458 1 989 1 672 1 486 1 836 1 518 1 736
Cruiser 1 549 1 008 446 617 742 539 258
Sub Total B 10 884 8 036 7 175 8 479 10 488 10 315 8 090
C
Competition 2 065 1 466 1 361 998 959 891 971
Off Road 2 644 1 949 1 651 2 751 2 728 2 408 1 781
Sub Total C 4 709 3 415 3 012 3 749 3 687 3 299 2 752
TOTAL A+B+C 25 988 19 209 17 185 25 298 29 046 25 819 21 066
D
Quads - Rec 3 519 1 752 574 431 247 131 60
Quads - Util 3 786 1 993 1 702 1 767 2 045 1 809 1 706
Quads - Special 484 275 274 319 215 168 251
Side-by-sides 623 440 409 566 528 477 463
Sub Total D 8 412 4 460 2 959 3 083 3 035 2 585 2 480
Total A+B+C+D 34 400 23 669 20 144 28 381 32 081 28 404 23 546
Percentage Change -16.5% -31.2% -14.9% 40.9% 13.0% -11.5% -17.1%
Source: Association of Motorcycle Importers and Distributors (AMID)
The total motorcycles sales for all user type class decreased by 17.1% to 23,546 units in 2014
from 28,404 units in 2013 (Table 2.4 and Figure 2.4).

Annual Transport Statistics Bulletin 2014 Republic of South Africa24
Figure 2.4: Motorcycles Sales by User Class and Engine Class, 2008 -2014
Source: Association of Motorcycle Importers and Distributors (AMID)
2008 2009 2010 2011 2012 2013 2014
Percentage Change -16,5% -31,2% -14,9% 40,9% 13,0% -11,5% -17,1%
-16,5% -31,2% -14,9%
40,9%
13,0%
-11,5% -17,1%
Table 2.5: World Motor Vehicle Production by Region, 2013 to 2014
RegionYTD 2013 YTD 2014
Year on Year % ChangeQ4 Q4
Europe 19 825 240 20 435 074 3.08
North America 16 501 115 17 419 895 5.57
South America 4 580 291 3 799 329 -17.05
Asia-Oceania 45 778 533 47 360 322 3.46
Africa 625 655 719 608 15.02
Total 87 310 834 89 734 228 2.78
Source: National Association of Automobile Manufacturers of South Africa (NAAMSA)
Table 2.5 shows that the world motor vehicle production grew by 2.78% to 89,7 million units in
the fourth quarter of 2014. Motor vehicle production in the African region had the highest year on
year increase of 15.02%

Annual Transport Statistics Bulletin 2014 Republic of South Africa 25
EUROPE NORTH AMERICA
SOUTH AMERICA
ASIA-OCEANIA AFRICA TOTAL
Year on year % Change
Figure 2.5: World Motor Vehicle Production by Region, 2013 to 2014
Source: Association of Motorcycle Importers and Distributors (AMID)
3,085,57
-17,05
3,46
15,02
2,78
Table 2.6: World Motor Vehicle Production by Country, 2013 to 2014
Rank Country RegionYTD 2013 YTD 2014 Year on Year %
ChangeQ4 Q4
1 CHINA Asia-Oceania 22 116 825 23 722 890 7.26
2 USA North America 11 066 432 11 660 699 5.37
3 JAPAN Asia-Oceania 9 630 181 9 774 665 1.50
4 GERMANY Europe 5 718 222 5 907 548 3.31
5 SOUTH KOREA Asia-Oceania 4 521 429 4 524 932 0.08
6 INDIA Asia-Oceania 3 898 425 3 840 160 -1.49
7 MEXICO North America 3 054 849 3 365 306 10.16
8 BRAZIL South America 3 712 380 3 146 118 -15.25
9 SPAIN Europe 2 163 338 2 402 978 11.08
10 CANADA North America 2 379 834 2 393 890 0.59
24 SOUTH AFRICA Africa 545 913 566 083 3.69
Source: National Association of Automobile Manufacturers of South Africa (NAAMSA)
South Africa is ranked 24th in the list of the largest motor vehicle production countries in the world
with 566,083 units produced in 2014. The top countries with the largest motor vehicle production
globally are China and USA with 23.7 million and 11.6 million units respectively.

Annual Transport Statistics Bulletin 2014 Republic of South Africa26
0,00
0
CH
INA
US
A
JAPA
N
GE
RM
AN
Y
SO
UTH
KO
RE
A
IND
IA
ME
XIC
O
BR
AZ
IL
SPA
IN
CA
NA
DA
SO
UTH
AFR
ICA
Year on year % Change
Figure 2.6: World Motor Vehicle Production by Country, 2013 to 2014
2,265,37
1,503,31 0,08
-1,49
10,16
-15,25
11,08
3,690,59
Source: National Association of Automobile Manufacturers of South Africa (NAAMSA)

Annual Transport Statistics Bulletin 2014 Republic of South Africa 27
2.3
M
OT
OR
VE
HIC
LES
RE
GIS
TR
AT
ION
Tab
le 2
.7: L
ive
Vehi
cle
Po
pul
atio
n b
y P
rovi
nce,
as
at 3
1 D
ecem
ber
201
4
Vehi
cle
Clas
s
Prov
ince
Tota
l%
of t
otal
se
lf-pr
opel
led
Gaut
eng
Kwaz
ulu
Nata
lW
este
rn
Cape
East
ern
Cape
Free
Sta
teM
pum
alan
gaNo
rth W
est
Lim
popo
North
ern
Cape
Mot
or c
ars
and
stat
ion
wag
ons
2 77
3 84
7 9
13 9
841
144
817
414
645
295
704
382
495
287
897
289
051
118
451
6 62
0 89
164
.70%
Min
ibus
es 1
16 1
14 4
7 61
5 3
2 20
2 2
1 91
2 1
2 00
5 2
1 55
3 1
7 14
4 2
0 69
5 4
518
293
758
2.87
%
Buse
s, b
us tr
ains
, mid
ibus
es 1
8 69
9 7
354
6 2
37 3
672
2 7
51 7
284
3 6
74 5
513
1 6
30 5
6 81
40.
56%
Mot
orcy
cles
, qua
druc
ycle
s, tr
icyc
les
148
035
35
379
84
339
23
850
21
202
20
853
15
230
10
607
8 5
48 3
68 0
433.
60%
LDV’
s, p
anel
van
s, o
ther
ligh
t loa
d ve
h’s
GVM
<=
350
0kg
755
381
331
183
296
246
185
422
124
484
194
689
140
555
200
769
74
384
2 30
3 11
322
.51%
Truc
ks (H
eavy
load
veh
icle
s GV
M >
350
0kg)
135
228
49
346
39
644
22
225
21
587
40
488
18
213
23
400
9 6
31 3
59 7
623.
52%
Othe
r sel
f-pr
opel
led
vehi
cles
35
957
31
938
35
622
15
031
37
442
26
720
23
336
15
794
8 6
69 2
30 5
092.
25%
Tota
l sel
f-pr
opel
led
vehi
cles
3 98
3 26
11
416
799
1 63
9 10
7 6
86 7
57 5
15 1
75 6
94 0
82 5
06 0
49 5
65 8
29 2
25 8
3110
232
890
% o
f to
tal t
ow
vehi
cles
Prov
inci
al %
of t
otal
38.9
3%13
.85%
16.0
2%6.
71%
5.03
%6.
78%
4.95
%5.
53%
2.21
%10
0.00
%
Cara
vans
40
704
7 8
28 1
6 77
1 5
364
7 9
40 1
0 25
1 6
692
5 5
24 2
987
104
061
9.43
%
Ligh
t loa
d tra
ilers
GVM
<=
350
0kg
319
823
79
191
130
844
52
736
61
369
60
847
50
743
38
590
26
923
821
066
74.3
8%
Heav
y lo
ad tr
aile
rs G
VM >
350
0kg
57
611
24
247
17
948
7 3
97 1
6 62
2 2
9 61
8 1
1 23
3 8
259
5 7
46 1
78 6
8116
.19%
Tota
l tra
ilers
418
138
111
266
165
563
65
497
85
931
100
716
68
668
52
373
35
656
1 10
3 80
8
Prov
inci
al %
of t
otal
37.8
8%10
.08%
15.0
0%5.
93%
7.78
%9.
12%
6.22
%4.
74%
3.23
%10
0.00
%
All o
ther
and
unk
now
n ve
hicl
es 5
387
3 2
05 4
606
2 7
12 4
123
4 2
16 4
901
2 6
55 1
422
33
227
Tota
l num
ber o
f liv
e ve
hicl
es4
406
786
1 53
1 27
01
809
276
754
966
605
229
799
014
579
618
620
857
262
909
11 3
69 9
25
Prov
inci
al %
of t
otal
38.7
6%13
.47%
15.9
1%6.
64%
5.32
%7.
03%
5.10
%5.
46%
2.31
%10
0.00
% S
ourc
e: D
epar
tmen
t of
Tra
nsp
ort
Annual Transport Statistics Bulletin 2014 Republic of South Africa28
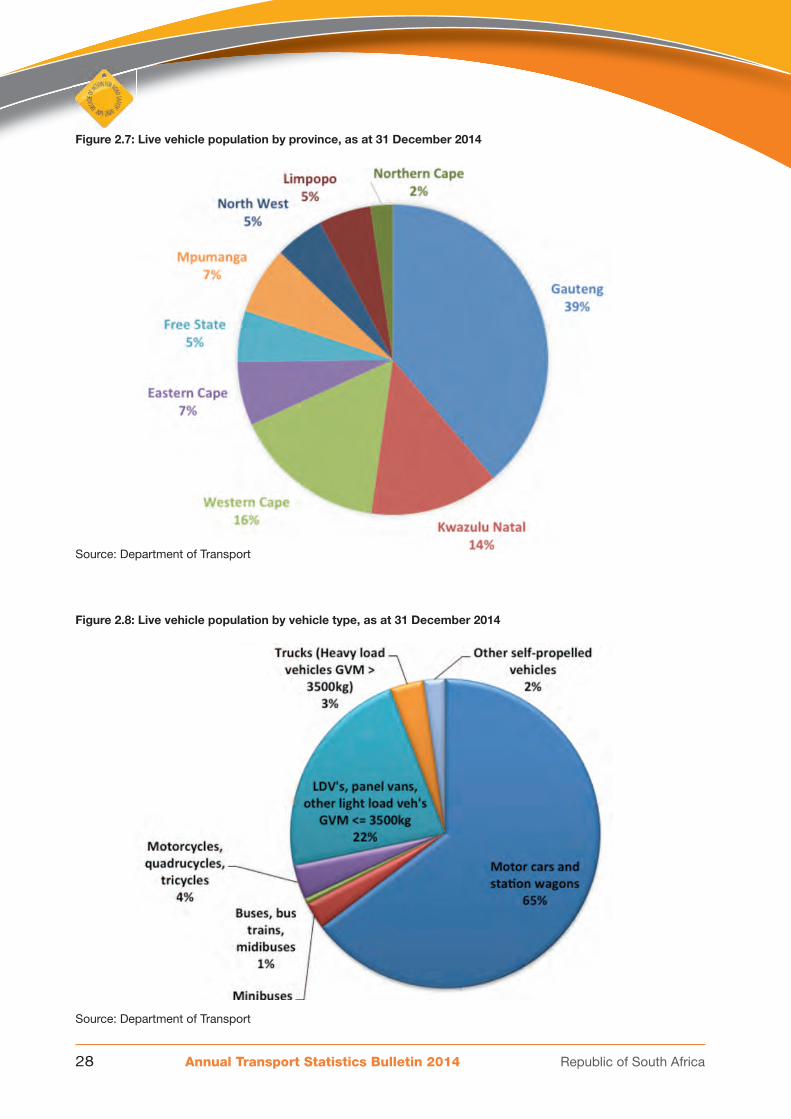
Figure 2.7: Live vehicle population by province, as at 31 December 2014
Figure 2.8: Live vehicle population by vehicle type, as at 31 December 2014
Source: Department of Transport
Source: Department of Transport
Annual Transport Statistics Bulletin 2014 Republic of South Africa 29
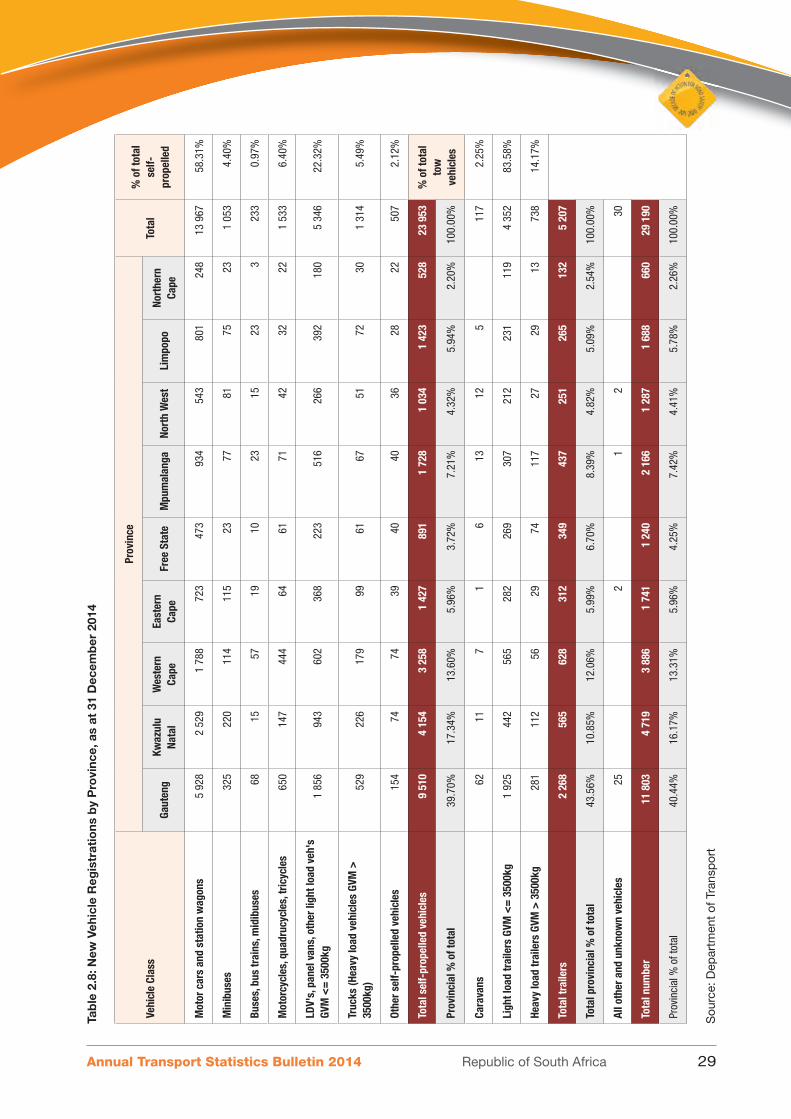
Tab
le 2
.8: N
ew V
ehic
le R
egis
trat
ions
by
Pro
vinc
e, a
s at
31
Dec
emb
er 2
014
Vehi
cle
Clas
s
Prov
ince
Tota
l%
of t
otal
se
lf-pr
opel
led
Gaut
eng
Kwaz
ulu
Nata
lW
este
rn
Cape
East
ern
Cape
Free
Sta
teM
pum
alan
gaNo
rth
Wes
tLi
mpo
poNo
rthe
rn
Cape
Mot
or c
ars
and
stat
ion
wag
ons
5 9
28 2
529
1 7
88 7
23 4
73 9
34 5
43 8
01 2
48 1
3 96
758
.31%
Min
ibus
es 3
25 2
20 1
14 1
15 2
3 7
7 8
1 7
5 2
3 1
053
4.40
%
Buse
s, b
us tr
ains
, mid
ibus
es 6
8 1
5 5
7 1
9 1
0 2
3 1
5 2
3 3
233
0.97
%
Mot
orcy
cles
, qua
druc
ycle
s, tr
icyc
les
650
147
444
64
61
71
42
32
22
1 5
336.
40%
LDV'
s, p
anel
van
s, o
ther
ligh
t loa
d ve
h's
GVM
<=
350
0kg
1 8
56 9
43 6
02 3
68 2
23 5
16 2
66 3
92 1
80 5
346
22.3
2%
Truc
ks (H
eavy
load
veh
icle
s GV
M >
35
00kg
) 5
29 2
26 1
79 9
9 6
1 6
7 5
1 7
2 3
0 1
314
5.49
%
Othe
r sel
f-pr
opel
led
vehi
cles
154
74
74
39
40
40
36
28
22
507
2.12
%
Tota
l sel
f-pr
opel
led
vehi
cles
9 5
10 4
154
3 2
58 1
427
891
1 7
28 1
034
1 4
23 5
28 2
3 95
3%
of t
otal
to
w
vehi
cles
Prov
inci
al %
of t
otal
39.7
0%17
.34%
13.6
0%5.
96%
3.72
%7.
21%
4.32
%5.
94%
2.20
%10
0.00
%
Cara
vans
62
11
7 1
6 1
3 1
2 5
1
172.
25%
Ligh
t loa
d tr
aile
rs G
VM <
= 3
500k
g 1
925
442
565
282
269
307
212
231
119
4 3
5283
.58%
Heav
y lo
ad tr
aile
rs G
VM >
350
0kg
281
112
56
29
74
117
27
29
13
738
14.1
7%
Tota
l tra
ilers
2 2
68 5
65 6
28 3
12 3
49 4
37 2
51 2
65 1
32 5
207
Tota
l pro
vinc
ial %
of t
otal
43.5
6%10
.85%
12.0
6%5.
99%
6.70
%8.
39%
4.82
%5.
09%
2.54
%10
0.00
%
All o
ther
and
unk
now
n ve
hicl
es 2
5
2
1
2
3
0
Tota
l num
ber
11
803
4 7
19 3
886
1 7
41 1
240
2 1
66 1
287
1 6
88 6
60 2
9 19
0
Prov
inci
al %
of t
otal
40.4
4%16
.17%
13.3
1%5.
96%
4.25
%7.
42%
4.41
%5.
78%
2.26
%10
0.00
%
Sou
rce:
Dep
artm
ent
of T
rans
por
t

Annual Transport Statistics Bulletin 2014 Republic of South Africa30
Tab
le 2
.9: U
sed
Veh
icle
Reg
istr
atio
ns b
y P
rovi
nce,
as
at 3
1 D
ecem
ber
201
4
Vehi
cle
Clas
s
Prov
ince
Tota
l%
of t
otal
se
lf-pr
opel
led
Gaut
eng
Kwaz
ulu
Nata
lW
este
rn
Cape
East
ern
Cape
Free
Sta
teM
pum
alan
gaNo
rth
Wes
tLi
mpo
poNo
rthe
rn
Cape
Mot
or c
ars
and
stat
ion
wag
ons
34
123
12
263
13
379
5 4
80 3
507
5 0
64 3
506
3 5
98 1
284
82
204
71.3
9%
Min
ibus
es 1
320
770
381
243
128
203
231
269
41
3 5
863.
11%
Buse
s, b
us tr
ains
, mid
ibus
es 1
52 7
1 3
6 4
4 3
0 5
0 1
08 4
6 1
6 5
530.
48%
Mot
orcy
cles
, qua
druc
ycle
s, tr
icyc
les
1 2
33 3
85 8
46 2
51 1
78 1
99 1
30 8
6 6
6 3
374
2.93
%
LDV'
s, p
anel
van
s, o
ther
ligh
t loa
d ve
h's
GVM
<=
350
0kg
7 4
34 3
784
2 5
10 1
607
1 0
99 1
988
1 2
76 1
803
507
22
008
19.1
1%
Truc
ks (H
eavy
load
veh
icle
s GV
M >
35
00kg
) 1
015
439
205
184
119
373
144
192
44
2 7
152.
36%
Othe
r sel
f-pr
opel
led
vehi
cles
151
152
96
44
101
55
57
38
17
711
0.62
%
Tota
l sel
f-pr
opel
led
vehi
cles
45
428
17
864
17
453
7 8
53 5
162
7 9
32 5
452
6 0
32 1
975
115
151
% o
f tot
al
tow
ve
hicl
esPr
ovin
cial
% o
f tot
al39
.45%
15.5
1%15
.16%
6.82
%4.
48%
6.89
%4.
73%
5.24
%1.
72%
100.
00%
Cara
vans
338
54
108
61
92
99
79
37
26
894
17.9
8%
Ligh
t loa
d tr
aile
rs G
VM <
= 3
500k
g 1
070
253
548
186
169
273
161
153
81
2 8
9458
.19%
Heav
y lo
ad tr
aile
rs G
VM >
350
0kg
365
149
164
57
96
218
78
32
26
1 1
8523
.83%
Tota
l tra
ilers
1 7
73 4
56 8
20 3
04 3
57 5
90 3
18 2
22 1
33 4
973
Tota
l pro
vinc
ial %
of t
otal
35.6
5%9.
17%
16.4
9%6.
11%
7.18
%11
.86%
6.39
%4.
46%
2.67
%10
0.00
%
All o
ther
and
unk
now
n ve
hicl
es 1
2 9
6 9
9 1
0 1
3 4
6 7
8
Tota
l num
ber
47
213
18
329
18
279
8 1
66 5
528
8 5
32 5
783
6 2
58 2
114
120
202
Prov
inci
al %
of t
otal
39.2
8%15
.25%
15.2
1%6.
79%
4.60
%7.
10%
4.81
%5.
21%
1.76
%10
0.00
%
Sou
rce:
Dep
artm
ent
of T
rans
por
t
Annual Transport Statistics Bulletin 2014 Republic of South Africa 31
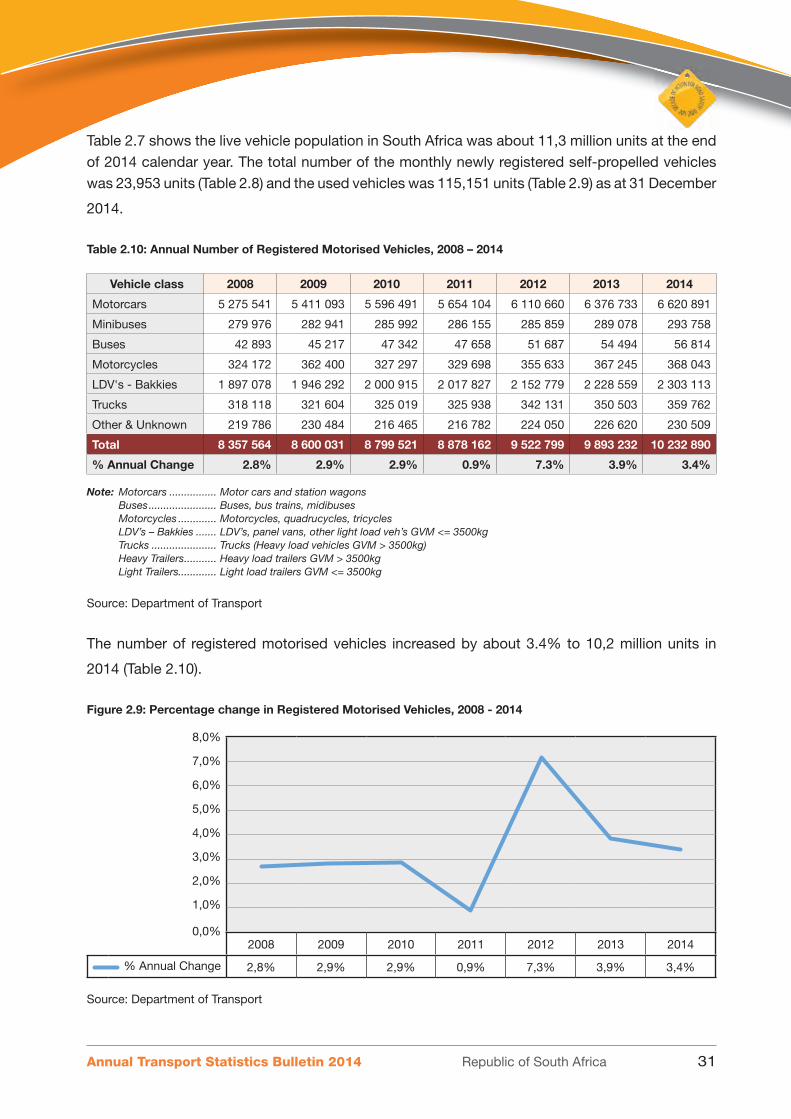
Table 2.7 shows the live vehicle population in South Africa was about 11,3 million units at the end
of 2014 calendar year. The total number of the monthly newly registered self-propelled vehicles
was 23,953 units (Table 2.8) and the used vehicles was 115,151 units (Table 2.9) as at 31 December
2014.
Table 2.10: Annual Number of Registered Motorised Vehicles, 2008 – 2014
Vehicle class 2008 2009 2010 2011 2012 2013 2014
Motorcars 5 275 541 5 411 093 5 596 491 5 654 104 6 110 660 6 376 733 6 620 891
Minibuses 279 976 282 941 285 992 286 155 285 859 289 078 293 758
Buses 42 893 45 217 47 342 47 658 51 687 54 494 56 814
Motorcycles 324 172 362 400 327 297 329 698 355 633 367 245 368 043
LDV's - Bakkies 1 897 078 1 946 292 2 000 915 2 017 827 2 152 779 2 228 559 2 303 113
Trucks 318 118 321 604 325 019 325 938 342 131 350 503 359 762
Other & Unknown 219 786 230 484 216 465 216 782 224 050 226 620 230 509
Total 8 357 564 8 600 031 8 799 521 8 878 162 9 522 799 9 893 232 10 232 890
% Annual Change 2.8% 2.9% 2.9% 0.9% 7.3% 3.9% 3.4%
Note: Motorcars ................ Motor cars and station wagons Buses ....................... Buses, bus trains, midibuses Motorcycles ............. Motorcycles, quadrucycles, tricycles LDV’s – Bakkies ....... LDV’s, panel vans, other light load veh’s GVM <= 3500kg Trucks ...................... Trucks (Heavy load vehicles GVM > 3500kg) Heavy Trailers ........... Heavy load trailers GVM > 3500kg Light Trailers............. Light load trailers GVM <= 3500kg
Source: Department of Transport
The number of registered motorised vehicles increased by about 3.4% to 10,2 million units in
2014 (Table 2.10).
Figure 2.9: Percentage change in Registered Motorised Vehicles, 2008 - 2014
8,0%
7,0%
6,0%
5,0%
4,0%
3,0%
2,0%
1,0%
0,0%2008 2009 2010 2011 2012 2013 2014
% Annual Change 2,8% 2,9% 2,9% 0,9% 7,3% 3,9% 3,4%
Source: Department of Transport

Annual Transport Statistics Bulletin 2014 Republic of South Africa32
Table 2.11: Annual Live Motorised Vehicle Population by Province 2008 – 2014
Province2008 2009 2010 2011 2012 2013 2014
Motorised
Gauteng 3 220 050 3 309 076 3 427 619 3 560 678 3 703 542 3 854 594 3 983 261
KwaZulu-Natal 1 177 105 1 201 536 1 224 821 1 268 984 1 324 340 1 373 628 1 416 799
Western Cape 1 409 741 1 424 024 1 444 466 1 485 018 1 537 211 1 587 523 1 639 107
Eastern Cape 576 015 595 622 611 440 628 529 649 063 666 834 686 757
Free State 447 083 459 991 464 538 478 546 492 826 504 281 515 175
Mpumalanga 496 568 531 682 553 035 585 628 625 163 661 181 694 082
North West 459 311 471 298 442 723 457 286 475 431 491 922 506 049
Limpopo 395 122 423 428 443 570 474 225 507 533 536 770 565 829
Northern Cape 176 572 183 376 187 309 195 094 207 690 216 499 225 831
SOUTH AFRICA 8 357 567 8 600 033 8 799 521 9 133 988 9 522 799 9 893 232 10 232 890
Source: Department of Transport
Gauteng province had the largest share of 38.9% of live motorised vehicle population in 2014,
followed by Western Cape and Kwazulu-Natal with 16% and 13.9% respectively (Table 2.11).
Figure 2.10: Annual Live Motorised Vehicle Population by Province 2008 – 2014
Thou
sand
s
14 000
12 000
10 000
8 000
6 000
4 000
2 000
-2008 2009 2010 2011 2012 2013 2014
SOUTH AFRICA
Source: Department of Transport
Annual Transport Statistics Bulletin 2014 Republic of South Africa 33
Tab
le 2
.12:
Ag
e o
f M
oto
r Ve
hicl
e P
op
ulat
ion,
201
4
Live
Veh
icle
Ca
tego
ry
Ga
uten
gKw
azul
u Na
tal
Wes
tern
Ca
peEa
ster
n Ca
peFr
ee S
tate
Mpu
mal
anga
Nort
h W
est
Lim
popo
Nort
hern
Ca
peSo
uth
Afric
a
Num
ber o
f Veh
icle
s
Heav
y lo
ad
veh(
GVM
>35
00Kg
eq
uip
to d
raw
)
"Fro
m 0
to 3
"
2
5 19
2
1
1 89
3
7 93
1
2 91
1
5 45
2
1
0 84
8
3 84
7
3 88
6
2 16
5
7
4 12
5
"Fro
m 4
to 5
"
4 49
6
1 79
7
1 19
1
78
7
74
4
1 30
7
49
6
64
0
25
7
1
1 71
5
"Abo
ve 5
"
7
6 88
3
2
2 53
1
1
9 18
4
1
0 11
7
1
1 84
7
2
6 15
0
1
3 33
1
1
3 90
4
4 89
0
198
837
Heav
y lo
ad
veh(
GVM
>35
00Kg
, no
t to
draw
)
"Fro
m 0
to 3
"
2
5 09
6
6 32
7
4 18
3
3 64
3
3 48
7
9 22
0
2 93
4
2 84
3
1 37
6
5
9 10
9
"Fro
m 4
to 5
"
3 18
8
1 03
1
74
6
43
2
71
4
1 06
6
48
4
49
9
27
2
8 43
2
"Abo
ve 5
"
4
5 89
9
2
6 38
2
2
2 09
0
1
0 26
8
1
4 17
5
1
8 27
8
7 04
4
8 70
2
5 79
2
158
630
Heav
y pa
ssen
ger
mv
(12
or m
ore
pers
ons)
"Fro
m 0
to 3
"
2
2 20
1
1
0 34
9
6 86
8
5 80
0
2 74
4
7 51
7
4 63
2
6 64
0
1 49
3
6
8 24
4
"Fro
m 4
to 5
"
6 13
6
2 12
8
88
5
1 21
4
59
0
1 73
7
1 15
3
1 70
5
23
8
1
5 78
6
"Abo
ve 5
"
6
0 24
3
3
0 90
8
1
3 28
7
1
1 02
5
6 37
1
1
2 26
6
9 57
3
1
2 13
0
2 31
2
158
115
Ligh
t loa
d ve
hicl
e (G
VM 3
500K
g or
le
ss)
"Fro
m 0
to 3
"
257
161
9
6 00
9
8
3 76
8
4
7 36
6
3
5 85
2
5
3 47
5
3
6 60
5
4
4 82
7
2
0 14
1
675
204
"Fro
m 4
to 5
"
4
2 51
9
1
7 43
7
1
5 71
5
8 88
0
6 36
9
1
0 14
2
6 65
8
8 68
7
3 61
0
120
017
"Abo
ve 5
"
722
801
276
867
311
851
171
690
136
642
180
929
140
021
176
427
7
3 28
0 2
190
508
Ligh
t pas
seng
er
mv(
less
than
12
pers
ons)
"Fro
m 0
to 3
"
759
467
198
243
193
836
7
5 81
9
4
1 21
5
6
7 17
3
4
5 50
1
5
1 59
3
1
9 09
8 1
451
945
"Fro
m 4
to 5
"
107
685
3
4 09
9
3
8 81
5
1
5 15
2
9 74
6
1
4 35
7
1
0 22
8
1
0 20
4
4 20
4
244
490
"Abo
ve 5
" 1
803
772
589
430
819
070
288
078
222
299
267
633
208
693
202
221
8
6 14
0 4
487
336
Mot
orcy
cle
/ M
otor
tricy
cle
/ Qu
adru
cycl
e
"Fro
m 0
to 3
"
5
4 53
9
1
3 42
8
2
7 01
2
6 31
0
6 30
1
6 56
7
4 62
4
3 34
5
2 43
4
124
560
"Fro
m 4
to 5
"
8 42
3
1 93
0
4 87
4
1 35
7
1 22
9
1 18
7
82
9
59
5
51
6
2
0 94
0
"Abo
ve 5
"
7
4 35
5
1
7 44
9
4
6 61
4
1
4 62
3
1
2 26
1
1
1 63
5
8 68
8
5 93
2
4 97
7
196
534
Spec
ial V
ehic
le
"F
rom
0 to
3"
12
531
8
314
7
839
4
099
6
612
6
020
4
509
4
248
2
295
56
467
"Fro
m 4
to 5
"
2 57
6
1 56
1
1 42
0
62
1
1 56
3
1 32
4
1 11
2
92
1
40
3
1
1 50
1
"Abo
ve 5
"
5
5 65
0
2
8 31
9
4
1 44
4
1
5 11
3
3
6 78
7
3
0 62
7
2
6 71
1
1
6 93
0
8 79
5
260
376
Unkn
own
"F
rom
0 to
3"
254
410
309
401
342
354
405
113
157
2
745
"Fro
m 4
to 5
"
20
6
16
2
11
1
15
5
9
5
12
0
11
6
3
6
4
7
1 04
8
"Abo
ve 5
"
2 31
7
1 37
5
2 27
2
1 22
6
1 88
8
44
5
49
6
38
8
61
6
1
1 02
3
Sou
rce:
Dep
artm
ent
of T
rans
por
t

Annual Transport Statistics Bulletin 2014 Republic of South Africa34
Figure 2.11: Age of Motor Vehicle Population 1 – 6, 2014
1. Heavy load veh(GVM>3500Kg equip to draw) 4. Light load vehicle (GVM 3500Kg or less)
2. Heavy load veh(GVM>3500Kg, not to draw) 5. Light passenger mv(less than 12 persons)
3. Heavy passenger mv (12 or more persons) 6. Motorcycle / Motortricycle / Quadrucycle
Source: Department of Transport

Annual Transport Statistics Bulletin 2014 Republic of South Africa 35
2.4 LICENSING INFORMATION
Table 2.13: Number of Learners Licences Issued, as at December 2014
Number of Learners Licenses Issued per Province
GP KZ WC EC FS MP NW LI NC RSA
Category 1 18 470 5 711 15 876 3 201 2 722 2 972 2 053 1 723 1 178 53 906
Category 2 84 473 46 255 88 789 34 230 17 136 10 162 11 876 6 973 6 472 306 366
Category 3 240 010 156 937 86 219 73 007 50 405 93 433 53 714 103 682 23 818 881 225
Total 342 953 208 903 190 884 110 438 70 263 106 567 67 643 112 378 31 468 1 241 497
Total 2013 380 989 203 797 179 902 106 768 69 027 102 866 65 074 110 931 30 824 1 250 178
Year on Year
Change-10.0% 2.5% 6.1% 3.4% 1.8% 3.6% 3.9% 1.3% 2.1% -0.7%
Note: Category 1: motorcycles. Category 2: vehicles (except motorcycles) with tare weight of 3 500 kilograms or less; minibuses, buses and goods vehicles with GVM of 3 500 kg or less; and articulated vehicles with GCM of 3 500 kg or less. Category 3: all vehicles (except motorcycles).
Note: GA=Gauteng, KZN=Kwazulu-Natal, WC=Western Cape, EC= Eastern Cape, FS=Free State, MP=Mpumalanga, LI=Limpopo, NC=Northern Cape
Source: Department of Transport
Table 2.13 provides a summary of learners licenses issued in 2014. There were about 1,2 million
learners licenses issued and mostly were of the category 3 (881,225 units) followed by those of
category 2 (306,366 units).
Figure 2.12: Number of Learners Licences Issued by Category, as at December 2014
Note: Category 1: motorcycles. Category 2: vehicles (except motorcycles) with tare weight of 3 500 kilograms or less; minibuses, buses and goods vehicles with GVM of 3 500 kg or less; and articulated vehicles with GCM of 3 500 kg or less. Category 3: all vehicles (except motorcycles).
Source: Department of Transport
GAUTENG KWAZULU NATAL WESTERN CAPE EASTERN CAPE FREE STATE MPUMALANGA NORTH WEST LIMPOPO NORTHERN CAPE
Category 1 Category 2 Category 3

Annual Transport Statistics Bulletin 2014 Republic of South Africa36
Table 2.14: Number of Driving Licences Issued per Province by Category, as at December 2014
Number of Driving Licences Issued per Province
Category GA KZ WC EC FS MP NW LI NC RSA
A 169 714 58 660 103 716 33 166 25 847 22 274 19 367 14 264 9 231 456 239
A1 44 944 13 075 27 511 9 194 9 091 6 734 6 548 3 891 2 468 123 456
B 896 969 406 554 499 746 199 185 126 254 108 534 103 471 68 058 44 743 2 453 514
C 4 293 4 851 3 927 991 479 2 048 1 629 1 590 410 20 218
C1 996 957 476 161 168 621 147 971 128 495 314 252 163 460 449 651 53 015 2 898 583
EB 1 316 773 577 637 785 969 309 429 176 227 160 835 142 045 108 628 65 133 3 642 676
EC 286 100 155 529 114 721 66 599 75 681 96 157 52 285 85 273 24 235 956 580
EC1 229 283 70 226 50 809 45 798 35 528 52 199 37 307 64 574 11 382 597 106
Total 3 945 033 1 762 693 1 755 020 812 333 577 602 763 033 526 112 795 929 210 617 11 148 372
Total 2013
3 769 370 1 682 844 1 697 300 774 905 559 035 713 739 505 029 741 051 201 773 10 645 046
Year on Year
Change4.7% 4.7% 3.4% 4.8% 3.3% 6.9% 4.2% 7.4% 4.4% 4.7%
Note: Motorcycle (Code A1,A), Car (Code B, EB), Heavy vehicle (Code C, C1, EC, EC1)
Note: GA=Gauteng, KZN=Kwazulu-Natal, WC=Western Cape, EC= Eastern Cape, FS=Free State, MP=Mpumalanga, LI=Limpopo, NC=Northern Cape
Source: Department of Transport
Table 2.14 shows the total number of 11,1 million driver’s licences issued in South Africa in 2014,
and Gauteng accounted for the largest proportion of 35.4% (3,9 million) of driver’s license issued.
According to Figure 2.13, the leading categories it terms of driver’s license issued were EB (33%),
followed C1 (26%) and B (22%).
Figure 2.13: Driving Licences Issued by Category, as at 31 December 2014
Note: Motorcycle (Code A1,A), Car (Code B, EB), Heavy vehicle (Code C, C1, EC, EC1)
Source: Department of Transport

Annual Transport Statistics Bulletin 2014 Republic of South Africa 37
Table 2.15: Annual Number of Driving Licences Issued per Category, 2008 – 2014
Year
Category 2008 2009 2010 2011 2012 2013 2014
A 403 989 413 768 423 023 429 872 437 914 446 772 456 239
A1 121 397 122 192 122 897 123 272 123 356 123 455 123 456
B 1 490 185 1 627 262 1 787 976 1 961 788 2 135 130 2 301 907 2 453 514
C 14 057 14 928 15 881 16 822 18 001 19 067 20 218
C1 1 335 125 1 536 412 1 773 858 2 022 779 2 296 011 2 586 914 2 898 583
EB 3 615 659 3 619 966 3 624 088 3 628 141 3 632 643 3 638 577 3 642 676
EC 870 199 876 629 885 165 896 723 910 885 929 236 956 580
EC1 607 107 605 771 604 466 603 055 601 225 599 118 597 106
Total 8 457 718 8 816 928 9 237 354 9 682 452 10 155 165 10 645 046 11 148 372
% Change 4.0% 4.2% 4.8% 4.8% 4.9% 4.8% 4.7%
Note: Motorcycle (Code A1,A), Car (Code B, EB), Heavy vehicle (Code C, C1, EC, EC1)
Source: Department of Transport
The number of driving licences issued increased by 4.7% to 11,1 million units in 2014 from 10,6
million units in 2013 (Table 2.15).
Figure 2.14: Driving Licences Issued, 2008 – 2014
Source: Department of Transport
Thou
sand
s
12 000
10 000
8 000
6 000
4 000
2 000
02008 2009 2010 2011 2012 2013 2014
Licences 8 457 718 8 816 928 9 237 354 9 682 452 10 155 165 10 645 046 11 148 372

Annual Transport Statistics Bulletin 2014 Republic of South Africa38
Table 2.16: Annual Number of Professional Driving Permits (PrDP’s) Issued, 2008-2014
Year
Category 2008 2009 2010 2011 2012 2013 2014
G 10 764 11 179 11 182 11 670 11 874 11 325 10 754
P 2 705 2 323 1 840 730 24
P G 634 542 730 133 789 771 842 316 899 584 926 624 952 970
D G 554 210 138 121 153 158 170
D P G 104 351 47 109 21 886 25 071 27 871 29 541 32 170
Total 752 916 790 954 824 817 879 908 939 506 967 648 996 064
% Change 8.0% 5.1% 4.3% 6.7% 6.8% 3.0% 2.9%
Note: G = Goods, P = Passengers, DG= Dangerous goods
Source: Department of Transport
The total annual number of professional driving permits (PrDP’s) issued grew by 2.9% to 996,064
units in 2014 from 967,648 units in 2013 (Table 2.16).
Figure 2.15: Annual Number of Professional Driving Permits (PrDP’s) Issued, 2008 – 2014
Source: Department of Transport
Thou
sand
s
1 200
1 000
800
600
400
200
02008 2009 2010 2011 2012 2013 2014
PrDPs 752 916 790 954 824 817 879 908 939 506 967 648 996 064

Annual Transport Statistics Bulletin 2014 Republic of South Africa 39
2.5 ROAD SAFETY
PART A: EASTER 2014Table 2.17 : Traffi c Volumes, 2013 – 2014
Route Site name 2013 2014 % Change
N1 Kranskop plaza 130 942 122 689 -6.3%
N1 Nyl plaza 72 708 72 170 -0.7%
N1 Huguenot plaza 71 850 68 056 -5.3%
N1 Verkeerdevlei 51 238 46 672 -8.9%
N2 Groot Brak 70 043 56 717 -19.0%
N4 Middlelburg 130 803 125 168 -4.3%
N3 De Hoek 110 943 102 452 -7.7%
N3 Wilge 98 427 87 109 -11.5%
N3 N3TC Harrismith WIM 108 797 95 851 -11.9%
N3 Van Reenen 109 823 98 948 -9.9%
N3 Mooi River 133 779 120 734 -9.8%
N3 Marianhill 103 733 94 948 -8.5%
Total 119 309 109 090 -8.6%
Source: Road Transport Management Corporation (RTMC)
The overall decrease in traffi c volumes on national routes during Easter holidays in 2014 was 8.6%
when compared with the same period in 2013. The highest percentage decrease was recorded on
the Groot Brak counting station on the N2 route with 19% decrease.
Figure 2.16: Percentage change in Traffi c Volumes, 2013 - 2014
0,0%
-2,0%
-4,0%
-6,0%
-8,0%
-10,0%
-12,0%
-14,0%
-16,0%
-18,0%
-20,0%
Kra
nsko
p P
laza
Nyl
Pla
za
Hug
ueno
t P
laza
Verk
eerd
evle
i
Gro
ot B
rak
Mid
del
bur
g
De
Hoe
k
Wilg
e
N3
TC H
arris
mith
W
IM
Van
Ree
nen
Moo
i Riv
er
Mar
ian
Hill
Percentage Change
-6,3% -0,7% -5,3% -8,9% -19,0% -4,3% -7,7% -11,5% -11,9% -9,9% -9,8% -8,5%
Source: Road Transport Management Corporation (RTMC)

Annual Transport Statistics Bulletin 2014 Republic of South Africa40
Table 2.18 Number of fatal crashes & fatalities, 2014
Incidents GA KZN WC EC FS MP NW LI NC RSA
Fatal Crashes 25 35 15 20 6 19 9 26 7 162
Fatalities 26 43 16 37 14 37 11 36 9 229
Severity of fatal crashes( Av no. fatalities/ crashes)
0.9 1.2 1.6 1.9 2.7 2 1.6 1.4 1.3 1.5
Note: GA=Gauteng, KZN=Kwazulu-Natal, WC=Western Cape, EC= Eastern Cape, FS=Free State, MP=Mpumalanga, LI=Limpopo, NC=Northern Cape
Source: Road Transport Management Corporation (RTMC)
Table 2.18 shows the number fatal crashes and fatalities were 162 and 229 respectively during
Easter 2014, with the severity rate of 1.5 nationally.
Figure 2.17 Number of fatal crashes & fatalities, 2014
Note: GA=Gauteng, KZN=Kwazulu-Natal, WC=Western Cape, EC= Eastern Cape, FS=Free State, MP=Mpumalanga, LI=Limpopo, NC=Northern Cape
Source: Road Transport Management Corporation (RTMC)
Table 2.19 below show the achievements made by the law enforcement offi cials to improve the
safety of our roads during the Easter period of 2014.
Table 2.19: Law Enforcement – National Achievement, Easter 2014
Achievements Total
Number of vehicles stopped and checked 283 323
Number of notices issued out 43 433
Number of vehicles discontinued 1 094
Number of vehicles impounded 1 457
Number of arrests for drunk and driving 330
Number of arrest for dangerous/negligent driving 10
Number of arrests for others 533
Warrants of arrests 112
Source: Road Transport Management Corporation (RTMC)
454035302520151050
GA KZN WC EC FS MP NW LI NC
Fatal Crashes 25 35 15 20 6 19 9 26 7
Fatalities 26 43 16 37 14 37 11 36 9

Annual Transport Statistics Bulletin 2014 Republic of South Africa 41
PART B: FESTIVE SEASON - 1 Dec 2014 to 11 Jan 2015Table 2.20: Number of fatal crashes & fatalities, 2013/14 - 2014/15
Year GA KZN WC EC FS MP NW LI NC RSA
Fatal crashes
2013/14 252 258 122 179 133 127 81 142 41 1 335
2014/15 220 265 111 189 94 124 89 156 45 1 293
% Change -12.7% 2.7% -9.0% 5.6% -29.3% -2.4% 9.9% 9.9% 9.8% -3.1%
Year GA KZN WC EC FS MP NW LI NC RSA
Fatalities
2013/14 291 309 139 245 166 161 112 198 55 1 677
2014/15 239 310 125 229 140 168 115 199 62 1 587
% Change -17.9% 0.3% -10.1% -6.5% -15.7% 4.3% 2.7% 0.5% 12.7% -5.4%
Source: Road Transport Management Corporation (RTMC)
The Festive season for 2014 i.e. from 1 December 2014 to 11 January 2015, had 1,293 fatal crashes
and was responsible for 1,587 fatalities. Table 2.20 has also shown a percentage decrease in fatal
crashes and fatalities of 3.1% and 5.4% respectively from the previous year’s Festive season.
Figure 2.18: Percentage change in fatal crashes & fatalities, 2013/14 - 2014/15
Source: Road Transport Management Corporation (RTMC)
Fatal Crashes Fatalities

Annual Transport Statistics Bulletin 2014 Republic of South Africa42
Table 2.21: Percentage share of crashes per day of the week, Festive 2014
Day of the week % Contribution
Monday 12
Tuesday 11
Wednesday 11
Thursday 14
Friday 13
Saturday 22
Sunday 16
Total accidents 100
Source: Road Transport Management Corporation (RTMC)
According to Table 2.21, most weekly crashes over the festive period occurs between Thursday
and Sunday. The highest percentage of crashes occurs on Saturdays with 22%, followed by
Sundays and Thursdays with 16% and 14% respectively.
Figure 2.19: Percentage share of crashes per day of the week, Festive 2014
Source: Road Transport Management Corporation (RTMC)
Table 2.22: Percentage share of fatalities per road user group, Festive 2014
Road Users % Contribution
Passengers 38
Pedestrians 35
Drivers 25
Cyclists 2.1
Unknown 0.1
Total Fatalities 100
Source: Road Transport Management Corporation (RTMC)
The largest percentage share of road fatalities recorded are the passengers (38%), followed by
pedestrians (35%) and drivers (25%).
MONDAY TUESDAY WEDNESDAY THURSDAY FRIDAY SATURDAY SUNDAY
1211 11
1413
22
16

Annual Transport Statistics Bulletin 2014 Republic of South Africa 43
Figure 2.20: Percentage share of fatalities per road user group, Festive 2014
Source: Road Transport Management Corporation (RTMC)
Table 2.23: Percentage share of fatalities per Gender & Race, Festive 2014
Gender % Contribution
Males 73
Females 22
Unknown 6
Race % Contribution
Black African 81
White 5
Asian 1
Coloured 7
Other 4
Foreigner 2
Total 100
Source: Road Transport Management Corporation (RTMC)
Table 2.23 show that males have the largest contribution in terms of road fatalities with 73% and
females only accounts for 22%.
According to race categories, 81% of the fatalities recorded are of the Black Africans.

Annual Transport Statistics Bulletin 2014 Republic of South Africa44
Tab
le 2
.24:
Law
enf
orc
emen
t –
Nat
iona
l Ach
ieve
men
t, F
esti
ve 2
014
Act
ivit
ies
EC
FSG
PK
ZN
LIM
MP
(T
rans
po
rt)
MP
(T
raffi
c)
NC
NW
WC
NT
PTo
tal
Num
ber
of v
ehic
les
stop
ped
an
d c
heck
ed57
386
2 10
662
343
23 7
8919
3 93
71
140
64 0
0310
278
39 3
0913
8 70
121
529
614
521
Num
ber
of n
otic
es is
sued
out
6 82
675
619
371
4 82
327
439
-11
362
1 08
34
551
14 4
8540
191
097
Num
ber
of V
TS
Roa
dw
orth
ines
s O
ps
--
75-
1-
17-
1 89
622
-2
011
Num
ber
of v
ehic
les
dis
cont
inue
d12
359
012
033
820
258
1219
253
279
1 90
4
Num
ber
of v
ehic
les
imp
ound
ed10
611
654
9-
638
648
3816
9573
-2
279
Num
ber
of P
ublic
Tr
asp
orta
tion
Not
ices
issu
ed45
8834
223
252
673
-11
191
2 02
0-
3 53
7
Num
ber
of P
ublic
Tra
nsp
ort
Vehi
cle
Pre
Trip
Insp
ectio
n1
592
-25
19-
--
-26
26-
1 68
8
Num
ber
of R
oad
Saf
ety
Aw
aren
ess
and
Ed
u O
ps
12-
--
--
-3
-29
-44
Num
ber
of F
atig
ue
Man
agem
ent
Op
s10
--
--
--
--
5-
15
Num
ber
of K
78 R
oad
blo
cks
cond
ucte
d12
221
7378
982
8313
348
-73
0
Num
ber
of C
heck
poi
nts/
Vehi
cle
Che
ckp
oint
24-
2-
1 94
242
1035
1 02
854
1-
3 62
4
Num
ber
of s
pee
d M
onot
orin
g O
per
atio
ns c
ond
ucte
d43
06
283
261
1 26
9-
4259
728
133
-3
211
Hig
hest
sp
eed
rec
ord
ed/
arre
sts
for
high
sp
eed
134
-78
61
16-
1450
547
71-
1 61
9
Ped
estr
ian
Arr
este
d o
n Fr
ee
way
--
242
--
--
189
21
-1
136
Num
ber
of a
rres
t fo
r d
ange
rous
/neg
ligen
t d
rivin
g-
-26
-1
-1
6-
12-
46
Ove
rload
ing/
Arr
ests
5-
27-
450
514
62
99-
338
Num
ber
of a
rres
ts fo
r d
runk
en d
rivin
g17
511
312
181
-3
3421
256
6070
2
Sou
rce:
Roa
d T
rans
por
t M
anag
emen
t C
orp
orat
ion
(RTM
C)

Annual Transport Statistics Bulletin 2014 Republic of South Africa 45
PART C: CALENDAR YEAR 2014
Table 2.25: Number of unroadworthy vehicles, 2014
Vehicle Type Dec 2013 Dec 2014 % Change
Motorcars 243 306 246 910 1.5%
Minibuses 37 294 36 497 -2.1%
Buses 6 075 6 191 1.9%
Motorcycles 36 667 36 847 0.5%
LDV’s - Bakkies 78 412 81 185 3.5%
Trucks 49 627 50 425 1.6%
Caravans 3 710 3 839 3.5%
Heavy Trailers 19 169 19 839 3.5%
Light Trailers 19 676 21 266 8.1%
Unknown 14 659 15 777 7.6%
All Vehicles 508 595 518 776 2.0%
Source: Road Transport Management Corporation (RTMC)
Figure 2.21: Number of unroadworthy vehicles, 2014
Source: Road Transport Management Corporation (RTMC)
The number of unroadworthy vehicles grew by 2% in the year 2014 from 508,595 units in 2013
to 518,776 units in 2014. Minibuses are the only category which showed some improvement with
regards to unroadworthy vehicles with 2.1% decrease from the previous year (Table 2.25).

Annual Transport Statistics Bulletin 2014 Republic of South Africa46
Table 2.26: Number of unlicensed vehicles, 2014
Vehicle Type Dec 2013 Dec 2014 % Change
Motorcars 217 387 245 430 12.9%
Minibuses 13 302 14 009 5.3%
Buses 1 289 1 303 1.1%
Motorcycles 23 489 26 163 11.4%
LDV’s - Bakkies 66 949 74 200 10.8%
Trucks 9 542 10 162 6.5%
Caravans 2 824 3 177 12.5%
Heavy Trailers 2 853 2 979 4.4%
Light Trailers 27 027 32 115 18.8%
Unknown 6 855 7 511 9.6%
All Vehicles 371 517 417 049 12.3%
Source: Road Transport Management Corporation (RTMC)
Table 2.26 shows that the number of unlicensed vehicles increased by 12.3% to 417,049 units in
2014 from 371,517 units in 2013.
Figure 2.22: Number of unlicensed vehicles, 2014

Annual Transport Statistics Bulletin 2014 Republic of South Africa 47
Table 2.27: Number of fatal crashes & fatalities per province, 2013 – 2014
Year GA KZN WC EC FS MP NW LI NC RSA
Fatal Crashes
2013 2 009 2 190 928 1 164 476 1 158 815 1 129 301 10 170
2014 2 136 2 129 994 1 205 650 1 033 802 1 087 331 10 367
% Change 6.3 -2.8 7.1 3.5 36.6 -10.8 -1.6 -3.7 10.0 1.9
Year GA KZN WC EC FS MP NW LI NC RSA
Fatalities 2013 2 027 2 627 1 065 1 403 541 1 429 994 1 414 344 11 844
2014 2 469 2 641 1 186 1 415 874 1 336 993 1 370 419 12 702
% Change 21.8 0.5 11.4 0.9 61.6 -6.5 -0.1 -3.1 21.8 7.2
Note: GA=Gauteng, KZN=Kwazulu-Natal, WC=Western Cape, EC= Eastern Cape, FS=Free State, MP=Mpumalanga, LI=Limpopo, NC=Northern Cape
Source: Road Transport Management Corporation (RTMC)
South African roads had 10,367 fatal crashes which resulted in 12,702 fatalities in the calendar
year 2014 (Table 2.27). The percentage increase in fatal crashes was 1.9% whereas that of fatalities
was 7.2% when compared 2013.
Figure 2.23: Number of fatal crashes & fatalities per province, 2014
Note: GA=Gauteng), KZN=Kwazulu-Natal, WC=Western Cape, EC= Eastern Cape, FS=Free State, MP=Mpumalanga, LI=Limpopo, NC=Northern Cape
Source: Road Transport Management Corporation (RTMC)

Annual Transport Statistics Bulletin 2014 Republic of South Africa48
Table 2.28: Monthly number of fatal crashes & fatalities, 2013 -2014
Fatal crashes Fatalities
Month 2013 2014 % Change 2013 2014 % Change
Jan 658 688 4.6% 763 900 18.0%
Feb 692 733 5.9% 753 843 12.0%
Mar 952 883 -7.2% 1 070 1 089 1.8%
Apr 848 786 -7.3% 988 998 1.0%
May 772 779 0.9% 882 949 7.6%
Jun 1 038 937 -9.7% 1 262 1 044 -17.3%
Jul 822 949 15.5% 960 1 196 24.6%
Aug 917 1 024 11.7% 1 079 1 307 21.1%
Sep 955 853 -10.7% 1 092 1 063 -2.7%
Oct 724 839 15.9% 826 1 030 24.7%
Nov 829 806 -2.8% 999 936 -6.3%
Dec 963 1 090 13.2% 1 170 1 346 15.0%
Total 10 170 10 367 1.9% 11 844 12 702 7.2%
Source: Road Transport Management Corporation (RTMC)
The highest number of fatal crashes and fatalities were recorded in December 2014 with 1,090
and 12,702 respectively. The total number of fatalities increased by 7.2% to 12 702 in 2014.
Figure 2.24: Monthly number of fatal crashes & fatalities, 2014
Source: Road Transport Management Corporation (RTMC)

Annual Transport Statistics Bulletin 2014 Republic of South Africa 49
Table 2.29: Number of fatalities per road user group & Severity of fatal crashes over 12 months period, 2013 - 2014
Year User Group GA KZN WC EC FS MP NW LI NC RSA
2013
Drivers 670 690 325 400 211 501 361 421 117 3 695
Passengers 465 830 273 479 191 564 348 621 154 3 924
Pedestrians 892 1 107 468 524 138 363 286 372 73 4 225
Total 2 027 2 627 1 065 1 403 541 1 429 994 1 414 344 11 844
2014
Drivers 875 620 360 412 329 434 348 451 153 3 983
Passengers 710 838 338 460 349 533 381 528 157 4 294
Pedestrians 884 1 182 488 543 195 369 264 391 108 4 425
Total 2 469 2 641 1 186 1 415 874 1 336 993 1 370 419 12 702
% Change
Drivers 30.6% -10.1% 10.8% 3.0% 55.9% -13.4% -3.6% 7.1% 30.8% 7.8%
Passengers 52.7% 1.0% 23.8% -4.0% 82.7% -5.5% 9.5% -15.0% 1.9% 9.4%
Pedestrians -0.9% 6.8% 4.3% 3.6% 41.3% 1.7% -7.7% 5.1% 47.9% 4.7%
Total 21.8% 0.5% 11.4% 0.9% 61.6% -6.5% -0.1% -3.1% 21.8% 7.2%
Severity of fatal crashes
Year GA KZN WC EC FS MP NW LI NC RSA
2013 1.01 1.2 1.15 1.21 1.14 1.23 1.22 1.25 1.14 1.16
2014 1.16 1.24 1.19 1.17 1.34 1.29 1.24 1.26 1.26 1.23
% Change 14.6 3.4 3.9 -2.6 18.3 4.8 1.46 0.6 10.5 5.2
Source: Road Transport Management Corporation (RTMC)
Figure 2.25: Fatalities per road user group over 12 months period, 2014
Drivers Passengers Pedestrians
Note: GA=Gauteng, KZN=Kwazulu-Natal, WC=Western Cape, EC= Eastern Cape, FS=Free State, MP=Mpumalanga, LI=Limpopo, NC=Northern Cape
Source: Road Transport Management Corporation (RTMC)

Annual Transport Statistics Bulletin 2014 Republic of South Africa50
Table 2.30: Crash Type nationally, 2014
Crash Types % contribution
Approach at angle 0.9
Crash with pedestrian 0.9
Crash with train 0.9
Fixed object 0.9
Head on 51.4
Head-rear end 5.5
Multiple vehicle crash 11
Sideswipe opp direction 6.4
Sideswipe same direction 1.8
Single vehicle overturned 18.3
T-Bone type crash 0.9
Source: Road Transport Management Corporation (RTMC)
Table 2.30 shows the crash types occurred in South African roads, and the highest share was head on type with 51.4% followed single vehicle overturned type with 18.3%.
Table 2.31 indicates that 42.9% of the Vehicle factors causes crashes are of the tyre bursting, 30% of the road factor are due to wet or slippery road surface and 32.3% of the human causes are when drivers failing to keep control of the motor vehicle.
Table 2.31: Vehicle/Road/Human factors nationally, 2014
Vehicle Factor % contribution
Brakes: Faulty 4.8
Lights: Faulty, not switched on, etc 4.8
Overloading: Cargo/ Passengers 9.5
Tyres: Bursting 42.9
Tyres: Smooth 9.5
Unroadworthy vehicle 14.3
Vehicle maintenance poor/ inadequate 14.3
Road Factors % contribution
Animals: Stray/Wild 10.0
Poor condition of road surface 20.0
Road surface slippery/wet 30.0
Road works 20.0
Sharp bend 20.0
Human Factors % contribution
Disregard: red traffi c light/stop sign/yield sign 4.0
Drive in wrong lane 20.2
Driver fail to keep a proper lookout 3.0
Fail to keep vehicle under control 32.3
Fatigue/ Driver fell asleep 1.0
Intoxicated Driver 5.1
Overtook when unlawful/ unsafe 14.1
Speed too high for circumstances 16.2
Turn in front of oncoming traffi c 2.0
U-turn 2.0

SECTION 3MARITIME

Annual Transport Statistics Bulletin 2014 Republic of South Africa52
Map
B: M
ajor
Por
ts o
f the
Rep
ublic
of S
outh
Afr
ica

Annual Transport Statistics Bulletin 2014 Republic of South Africa 53
3.1
CA
RG
O H
AN
DLE
D A
ND
VE
SS
ELS
’ AR
RIV
ALS
Tab
le 3
.1: B
ulk
Car
go
Han
dle
d (E
xpre
ssed
In M
etri
c To
ns),
2014
JA
NU
AR
Y -
D
EC
EM
BE
R 2
014
RIC
HA
RD
S
BA
YD
UR
BA
NE
AS
T
LON
DO
NN
GQ
UR
AP
OR
T
ELI
ZA
BE
TH
MO
SS
EL
BA
YC
AP
E T
OW
NS
ALD
AN
HA
TO
TAL
BU
LK C
AR
GO
HA
ND
LED
LAN
DE
D
IMP
OR
TS
4 84
1 07
628
058
875
241
354
-
437
122
1 02
3 31
41
856
305
7 29
3 28
943
751
335
CO
AS
TW
ISE
537
993
112
974
705
810
-
743
140
37 3
1949
6 00
2 -
2
633
239
TO
TAL
BU
LK
LAN
DE
D5
379
069
28 1
71 8
4994
7 16
4 -
1
180
262
1 06
0 63
32
352
307
7 29
3 28
946
384
574
SH
IPP
ED
EX
PO
RT
S85
511
030
7 61
4 98
5 -
-
6
126
233
113
696
181
907
56 0
78 3
8915
5 62
6 24
1
CO
AS
TW
ISE
-
1 61
1 87
2 -
-
-
66
2 14
148
9 76
521
4 74
42
978
523
TO
TAL
BU
LK
SH
IPP
ED
85 5
11 0
309
226
858
-
-
6 12
6 23
377
5 83
867
1 67
256
293
133
158
604
764
TR
AN
SH
IPM
EN
T
CA
RG
O-2
16 9
9915
9 10
8 -
-
-
-
35
821
-
-22
070
TO
TAL
BU
LK
HA
ND
LED
90 8
90 0
9937
557
815
947
164
-
7 30
6 49
51
836
471
3 02
3 97
963
586
422
204
967
268
Sou
rce:
Tra
nsne
t N
atio
nal P
orts
Aut
horit
y of
Sou
th A
fric
a (T
NPA
)

Annual Transport Statistics Bulletin 2014 Republic of South Africa54
Tab
le 3
.2: B
reak
Bul
k C
arg
o H
and
led
(Exp
ress
ed In
Met
ric
Tons
), 20
14
JA
NU
AR
Y -
D
EC
EM
BE
R 2
014
RIC
HA
RD
S
BA
YD
UR
BA
NE
AS
T
LON
DO
NN
GQ
UR
AP
OR
T
ELI
ZA
BE
TH
MO
SS
EL
BA
YC
AP
E T
OW
NS
ALD
AN
HA
TO
TAL
BR
EA
KB
ULK
CA
RG
O H
AN
DLE
D
LAN
DE
D
IMP
OR
TS
89 7
884
528
492
385
751
64 9
8879
1 14
5 -
29
8 79
416
6 10
46
325
063
CO
AS
TW
ISE
20 0
1542
132
-
-
1 27
837
822
-3 8
74 -
97
373
TO
TAL
BR
EA
KB
ULK
LA
ND
ED
109
803
4 57
0 62
438
5 75
164
988
792
423
37 8
2229
4 92
016
6 10
46
422
436
SH
IPP
ED
EX
PO
RT
S3
672
232
2 69
9 10
731
1 19
77
608
615
-
146
273
938
581
8 37
6 01
2
CO
AS
TW
ISE
-
87 8
88 -
-
-
15
4 43
8 -
37
572
279
897
TO
TAL
BR
EA
KB
ULK
S
HIP
PE
D3
672
232
2 78
6 99
531
1 19
77
608
615
154
438
146
273
976
153
8 65
5 91
0
TR
AN
SH
IPM
EN
T
CA
RG
O1
459
313
622
-
-
300
-
37 0
57 -
35
2 43
7
TO
TAL
BR
EA
KB
ULK
H
AN
DLE
D3
783
495
7 67
1 24
169
6 94
864
996
1 40
1 33
819
2 26
047
8 24
91
142
257
15 4
30 7
83
Sou
rce:
Tra
nsne
t N
atio
nal P
orts
Aut
horit
y of
Sou
th A
fric
a (T
NPA
)

Annual Transport Statistics Bulletin 2014 Republic of South Africa 55
Tab
le 3
.3: T
ota
l Car
go
Han
dle
d (E
xpre
ssed
In M
etri
c To
ns),
2014
JAN
UA
RY
-
DE
CE
MB
ER
201
4R
ICH
AR
DS
B
AY
DU
RB
AN
EA
ST
LO
ND
ON
NG
QU
RA
PO
RT
E
LIZ
AB
ET
HM
OS
SE
L B
AY
CA
PE
TO
WN
SA
LDA
NH
AT
OTA
L
TO
TAL
CA
RG
O H
AN
DLE
D
LAN
DE
D
IMP
OR
TS
4 93
0 86
432
587
367
627
105
64 9
881
228
268
1 02
3 31
42
155
099
7 45
9 39
350
076
398
CO
AS
TW
ISE
558
008
155
106
705
810
-
744
418
75 1
4149
2 12
9 -
2
730
612
TO
TAL
CA
RG
O
LAN
DE
D5
488
872
32 7
42 4
741
332
915
64 9
881
972
686
1 09
8 45
52
647
227
7 45
9 39
352
807
010
SH
IPP
ED
EX
PO
RT
S89
183
262
10 3
14 0
9331
1 19
77
6 73
4 84
811
3 69
632
8 18
057
016
971
164
002
254
CO
AS
TW
ISE
-
1 69
9 76
0 -
-
-
81
6 57
948
9 76
525
2 31
53
258
420
TO
TAL
CA
RG
O
SH
IPP
ED
89
183
262
12 0
13 8
5331
1 19
77
6 73
4 84
893
0 27
681
7 94
557
269
286
167
260
673
TR
AN
SH
IPM
EN
T
CA
RG
O-2
15 5
4047
2 73
0 -
-
30
0 -
72
878
-
330
367
TO
TAL
CA
RG
O
HA
ND
LED
94 4
56 5
9545
229
056
1 64
4 11
264
996
8 70
7 83
32
028
731
3 53
8 05
064
728
679
220
398
051
Sou
rce:
Tra
nsne
t N
atio
nal P
orts
Aut
horit
y of
Sou
th A
fric
a (T
NPA
)

Annual Transport Statistics Bulletin 2014 Republic of South Africa56
The total cargo handled by South African ports increased by 2.8% to 220 million metric tons in
2014, and Richards Bay had the largest percentage share of 42.9% (Table 3.3).
Figure 3.1: Total Bulk, Break-bulk and Cargo Handled 2014
Source: Transnet National Ports Authority of South Africa (TNPA)
Table 3.4 and Figure 3.2 below depicts the annual bulk handled at South African ports. The annual
bulk increased to approximately 204 million metric tons in 2014 with Richards Bay port continuing
to handle the largest proportion (44%) followed by Saldanha Bay and Durban ports with 31% and
18% respectively.
Table 3.4 Annual Bulk Handled (Metric Tons) in South African Ports, 2008 – 2014
2008 2009 2010 2011 2012 2013 2014
Ports
Richards Bay 80 364 844 73 482 547 81 025 177 81 747 520 84 862 542 90 566 016 90 890 099
Durban 35 104 303 32 777 526 35 404 043 36 966 511 35 985 750 36 906 610 37 557 815
East London 1 201 539 1 371 088 1 210 955 1 283 267 1 020 267 963 144 947 164
Ngqura - - 86 512 43 256 - - -
Port Elizabeth 4 517 673 3 855 104 5 216 816 5 696 791 6 389 563 6 810 068 7 306 495
Mossel Bay 1 926 364 1 697 636 1 805 521 1 892 405 2 273 289 2 264 542 1 836 471
Cape Town 2 865 621 2 610 232 3 221 499 3 321 851 3 824 515 3 257 815 3 023 979
Saldanha Bay 45 825 620 55 895 922 53 130 774 58 169 635 60 505 487 58 219 914 63 586 422
South Africa 171 805 964 171 690 055 181 101 297 189 121 236 194 861 413 199 236 582 204 967 268
% Change 2.3% -0.1% 5.5% 4.4% 3.0% 2.2% 2.9%
Source: Transnet National Ports Authority of South Africa (TNPA)
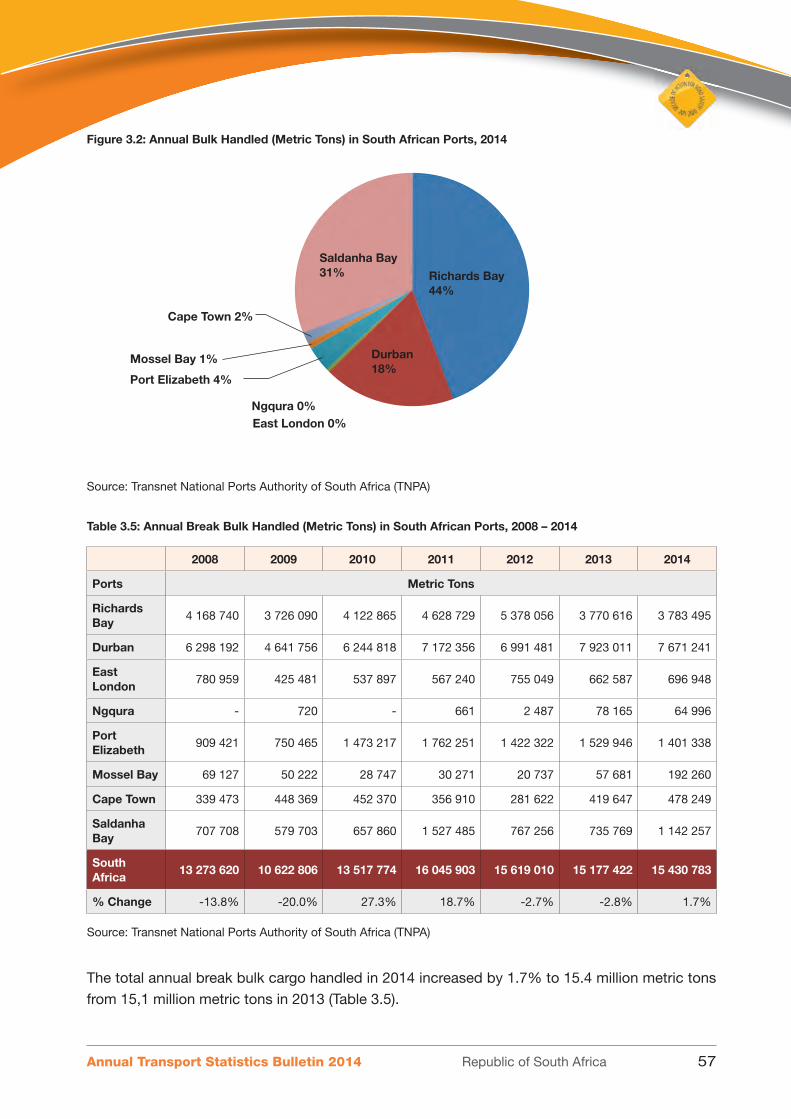
Annual Transport Statistics Bulletin 2014 Republic of South Africa 57
Figure 3.2: Annual Bulk Handled (Metric Tons) in South African Ports, 2014
Source: Transnet National Ports Authority of South Africa (TNPA)
Table 3.5: Annual Break Bulk Handled (Metric Tons) in South African Ports, 2008 – 2014
2008 2009 2010 2011 2012 2013 2014
Ports Metric Tons
Richards Bay
4 168 740 3 726 090 4 122 865 4 628 729 5 378 056 3 770 616 3 783 495
Durban 6 298 192 4 641 756 6 244 818 7 172 356 6 991 481 7 923 011 7 671 241
East London
780 959 425 481 537 897 567 240 755 049 662 587 696 948
Ngqura - 720 - 661 2 487 78 165 64 996
Port Elizabeth
909 421 750 465 1 473 217 1 762 251 1 422 322 1 529 946 1 401 338
Mossel Bay 69 127 50 222 28 747 30 271 20 737 57 681 192 260
Cape Town 339 473 448 369 452 370 356 910 281 622 419 647 478 249
Saldanha Bay
707 708 579 703 657 860 1 527 485 767 256 735 769 1 142 257
South Africa
13 273 620 10 622 806 13 517 774 16 045 903 15 619 010 15 177 422 15 430 783
% Change -13.8% -20.0% 27.3% 18.7% -2.7% -2.8% 1.7%
Source: Transnet National Ports Authority of South Africa (TNPA)
The total annual break bulk cargo handled in 2014 increased by 1.7% to 15.4 million metric tons
from 15,1 million metric tons in 2013 (Table 3.5).
Cape Town 2%
Mossel Bay 1%
Port Elizabeth 4%
Ngqura 0%East London 0%
Saldanha Bay31% Richards Bay
44%
Durban18%

Annual Transport Statistics Bulletin 2014 Republic of South Africa58
Figure 3.3: Annual Break Bulk Handled in South African Ports, 2014
Source: Transnet National Ports Authority of South Africa (TNPA)
Table 3.6: Annual Cargo Handled (Metric Tons) in South African Ports, 2008 – 2014
2008 2009 2010 2011 2012 2013 2014
Ports Metric Tons
Richards Bay
84 533 584 77 631 154 85 148 042 86 376 249 90 240 598 94 505 105 94 456 595
Durban 41 402 495 37 419 282 41 648 861 44 138 867 42 977 231 44 829 622 45 229 056
East London
1 982 498 1 796 569 1 748 852 1 850 507 1 775 316 1 625 732 1 644 112
Ngqura - 720 86 512 43 917 2 487 78 165 64 996
Port Elizabeth
5 427 094 4 605 569 6 690 033 7 459 042 7 811 885 8 420 013 8 707 833
Mossel Bay 1 995 491 1 747 858 1 834 268 1 922 676 2 294 026 2 322 223 2 028 731
Cape Town 3 205 094 3 058 601 3 673 869 3 678 761 4 106 137 3 677 462 3 538 050
Saldanha Bay
46 533 328 56 475 625 53 788 634 59 697 120 61 272 743 58 955 683 64 728 679
South Africa
185 079 584 182 735 378 194 619 071 205 167 139 210 480 423 214 414 004 220 398 051
% Change 1.0% -1.3% 6.5% 5.4% 2.6% 1.9% 2.8%
Source: Transnet National Ports Authority of South Africa (TNPA)
Table 3.6 shows that the annual cargo handled at South Africa ports was up by 2.8% to about 220
million metric tons in 2014. Richards Bay port handled the largest proportion of 43% of the annual
cargo followed by Saldanha Bay and Durban ports with 29% and 20% respectively (Figure 3.4).
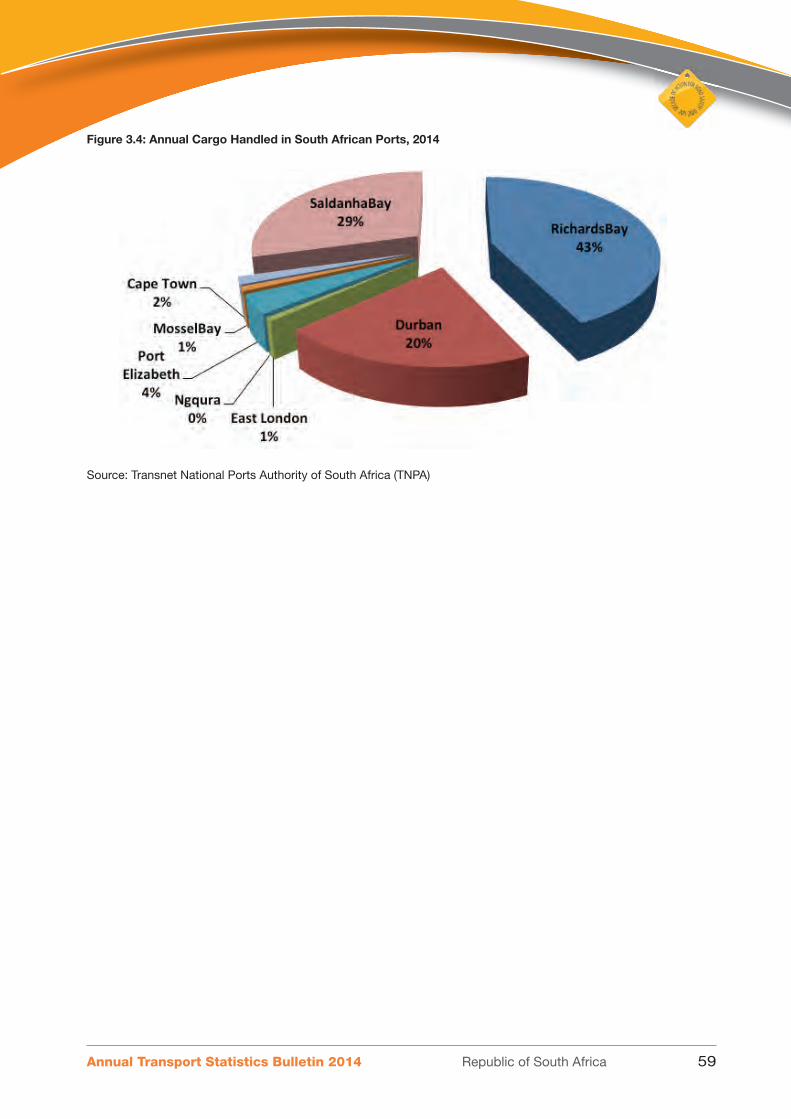
Annual Transport Statistics Bulletin 2014 Republic of South Africa 59
Figure 3.4: Annual Cargo Handled in South African Ports, 2014
Source: Transnet National Ports Authority of South Africa (TNPA)

Annual Transport Statistics Bulletin 2014 Republic of South Africa60
Tab
le 3
.7: T
ota
l Car
go
(Met
ric
Tons
) Im
po
rted
and
Exp
ort
ed t
hro
ugh
So
uth
Afr
ican
Po
rts,
200
8-20
14
R
icha
rds
Bay
Dur
ban
Eas
t Lo
ndo
nN
gq
ura
Po
rt
Eliz
abet
hM
oss
el B
ayC
ape
Tow
nS
ald
anha
B
ayS
.A. P
ort
s%
Cha
nge
IMP
OR
TS
2008
6 12
3 24
230
504
820
494
146
-
567
064
705
466
1 74
1 21
711
301
049
51 4
37 0
0410
.3%
2009
4 67
3 17
727
477
754
1 13
3 45
972
01
447
154
720
122
1 71
5 21
99
729
814
46 8
97 4
19-8
.8%
2010
5 74
4 34
330
860
265
287
072
-
885
174
636
049
1 75
6 32
14
765
201
44 9
34 4
25-4
.2%
2011
5 79
2 36
132
042
546
1 20
8 34
959
92
031
545
812
108
2 19
4 38
54
883
355
48 9
65 2
489.
0%
2012
4 94
7 61
831
374
191
1 23
3 28
42
410
1 89
8 89
21
131
651
2 69
8 77
24
772
422
48 0
59 2
41-1
.9%
2013
5 61
1 24
132
690
285
1 22
7 40
076
953
2 10
5 31
41
392
666
2 54
2 66
14
835
291
50 4
81 8
115.
0%
2014
4 93
0 86
432
587
367
627
105
64 9
881
228
268
1 02
3 31
42
155
099
7 45
9 39
350
076
398
-0.8
%
EX
PO
RT
S
2008
78 0
08 6
328
597
519
625
582
-
3 97
0 36
416
8 42
237
2 99
632
785
311
124
528
826
2.4%
2009
72 9
57 1
329
693
491
663
110
-
3 15
8 35
21
027
736
1 22
3 48
437
308
157
126
031
462
1.2%
2010
78 9
67 5
648
437
391
459
041
-
4 94
6 42
214
9 04
259
8 00
348
036
218
141
593
681
12.3
%
2011
80 5
83 8
8812
096
321
642
158
43 3
185
427
497
1 11
0 56
81
484
376
54 8
13 7
6515
6 20
1 89
110
.3%
2012
85 2
92 9
8011
603
040
542
031
775
912
993
1 16
2 37
51
407
365
56 5
00 3
2116
2 42
1 18
34.
0%
2013
94 5
05 1
0544
829
622
1 62
5 73
278
165
8 42
0 01
32
322
223
3 67
7 46
258
955
683
214
414
004
32.0
%
2014
89 1
83 2
6210
314
093
311
197
76
734
848
113
696
328
180
57 0
16 9
7116
4 00
2 25
4-2
3.5%
Sou
rce:
Tra
nsne
t N
atio
nal P
orts
Aut
horit
y of
Sou
th A
fric
a (T
NPA
)

Annual Transport Statistics Bulletin 2014 Republic of South Africa 61
Table 3.7 shows that imports handled at the South African ports dropped by 0.8% to about 50.1
million tons in 2014 while exports handled dropped by 23.5% to approximately 164 million tons
in the same year.
Figure 3.5: Total Cargo (Metric Tons) Imported and Exported through South African Ports, 2008-2014
Source: Transnet National Ports Authority of South Africa (TNPA)
Thou
sand
s
250 000
200 000
150 000
100 000
50 000
02008 2009 2010 2011 2012 2013 2014
IMPORTS 51 437 004 46 897 419 44 934 425 48 965 248 48 059 241 50 481 811 50 076 398
EXPORTS 124 528 826 126 031 462 141 593 681 156 201 891 162 421 183 214 414 004 164 002 254

Annual Transport Statistics Bulletin 2014 Republic of South Africa62
Tab
le 3
.8: T
ota
l Num
ber
of
Co
ntai
ners
Invo
iced
at
So
uth
Afr
ican
Po
rts
(in 6
M U
nits
TE
U’s
), 20
14
JANU
ARY
- DE
CEM
BER
2014
2013
LAN
DED
SHIP
PED
DEEP
SEA
COAS
TWIS
E TR
ANSH
IPPE
D TO
TAL
LAND
ED
DEEP
SEA
COAS
TWIS
E TR
ANSH
IPPE
D TO
TAL
SHIP
PED
GRAN
D TO
TAL
RIC
HARD
S BA
Y
FUL
L 45
20
282
734
13 2
560
5513
311
14 0
45
EM
PTY
9 29
354
7-9
9 83
116
60
147
313
10 1
44
TOT
AL
9 74
554
727
310
565
13 4
220
202
13 6
2424
189
DUR
BAN
FUL
L 1
003
137
4 46
614
7 43
61
155
039
684
342
12 8
0914
5 31
884
2 46
91
997
508
EM
PTY
129
307
2 49
543
063
174
865
430
120
18 5
5443
283
491
957
666
822
TOT
AL
1 13
2 44
46
961
190
499
1 32
9 90
41
114
462
31 3
6318
8 60
11
334
426
2 66
4 33
0
EAS
T LO
NDON
FUL
L 20
860
00
20 8
601
150
00
1 15
022
010
EM
PTY
440
044
19 8
8716
019
903
19 9
47
TOT
AL
20 9
040
020
904
21 0
3716
021
053
41 9
57
NGQ
URA
FUL
L 97
712
8512
9 40
522
7 20
210
1 16
816
116
050
217
234
444
436
EM
PTY
48 4
7453
973
731
122
744
74 4
0817
563
614
138
197
260
941
TOT
AL
146
186
624
203
136
349
946
175
576
191
179
664
355
431
705
377
POR
T EL
IZAB
ETH
FUL
L 41
319
1 76
546
108
89 1
9231
768
8851
097
82 9
5317
2 14
5
EM
PTY
40 3
0586
017
034
58 1
9911
597
471
17 5
0529
573
87 7
72
TOT
AL
81 6
242
625
63 1
4214
7 39
143
365
559
68 6
0211
2 52
625
9 91
7
CAP
E TO
WN
FUL
L 22
2 81
619
186
48 0
0429
0 00
625
2 12
92
293
50 2
7030
4 69
259
4 69
8
EM
PTY
114
325
11 3
4130
191
155
857
97 4
5112
052
32 4
9914
2 00
229
7 85
9
TOT
AL
337
141
30 5
2778
195
445
863
349
580
14 3
4582
769
446
694
892
557
SAL
DANH
A
FUL
L 91
00
911
00
192
EM
PTY
00
00
00
00
0
TOT
AL
910
091
10
01
92
TOT
AL
FUL
L 1
386
387
25 5
0237
1 23
51
783
124
1 08
3 81
415
206
362
790
1 46
1 81
03
244
934
EM
PTY
341
748
15 7
8216
4 01
052
1 54
063
3 62
931
268
157
048
821
945
1 34
3 48
5
TOT
AL
1 72
8 13
541
284
535
245
2 30
4 66
41
717
443
46 4
7451
9 83
82
283
755
4 58
8 41
9 N
ote:
The
TE
U m
easu
rem
ent
is d
eriv
ed fr
om a
20-
foot
6m
eq
uiva
lent
con
tain
er u
nit;
con
tain
ers
usua
lly h
ave
leng
ths
of 2
0 or
40
feet
- 6
or
12m
.
Sou
rce:
Tra
nsne
t N
atio
nal P
orts
Aut
horit
y of
Sou
th A
fric
a (T
NPA
)

Annual Transport Statistics Bulletin 2014 Republic of South Africa 63
The total number of containers invoiced at South Africa increased to about 4.5 million TEU in
2014 as shown by Tables 3.8 and 3.9. This represents a growth of approximately 6% compared
to 2013.
Table 3.9: Annual Number of Containers Invoiced at South African Ports (in 6M Units TEU’s), 2008-2014
2008 2009 2010 2011 2012 2013 2014
RICHARDS BAY
FULL 5 801 3 147 15 660 9 003 1 027 16 937 14 045
EMPTY 3 549 3 126 7 918 9 537 5 058 12 486 10 144
TOTAL 9 350 6 273 23 578 18 540 4 031 29 423 24 189
DURBAN FULL 1 976 920 1 790 784 1 993 950 1 875 814 1 969 083 2 008 661 1 997 508
EMPTY 665 245 604 391 559 442 789 154 617 803 623 852 666 822
TOTAL 2 642 165 2 395 175 2 553 392 2 511 380 2 586 886 2 632 513 2 664 330
EAST LONDON
FULL 27 177 21 135 28 109 277 158 27 709 24 939 22 010
EMPTY 30 241 19 151 24 847 24 114 24 364 21 652 19 947
TOTAL 57 418 40 286 52 956 54 546 52 073 46 591 41 957
NGQURA FULL - 52 578 204 745 300 751 375 045 506 640 444 436
EMPTY - 16 792 144 066 177 356 185 651 268 199 260 941
TOTAL - 69 370 348 811 472 203 560 696 774 839 705 377
PORT ELIZABETH
FULL 293 877 288 914 208 591 221 640 180 343 189 912 172 145
EMPTY 130 008 152 542 116 621 125 201 71 512 100 051 87 772
TOTAL 423 885 441 456 325 212 346 841 251 855 289 963 259 917
CAPE TOWN
FULL 536 326 964 335 493 673 477 511 576 390 625 803 594 698
EMPTY 231 175 417 717 214 853 231 232 277 009 294 833 297 859
TOTAL 767 501 1 382 052 708 526 698 087 853 399 920 636 892 557
SALDANHA FULL - - - - 129 136 92
EMPTY - - - - - - 0
TOTAL - - - - 129 136 92
TOTAL FULL 2 840 101 3 120 893 2 944 728 3 161 877 3 129 597 3 373 028 3 244 934
EMPTY 1 060 218 1 213 719 1 067 747 1 356 594 1 181 397 1 321 073 1 343 485
TOTAL 3 900 319 4 334 612 4 012 475 4 518 471 4 310 994 4 694 101 4 588 419
% Change 5% 11% -7% 13% 7% 4% 6%
Note: The TEU measurement is derived from a 20-foot 6m equivalent container unit; containers usually have lengths of 20 or 40 feet - 6 or 12m.
Source: Transnet National Ports Authority of South Africa (TNPA)

Annual Transport Statistics Bulletin 2014 Republic of South Africa64
Figure 3.6: Number of Containers Invoiced at South African Ports, 2008 – 2014
Source: Transnet National Ports Authority of South Africa (TNPA)
Thou
sand
s
5 000
4 500
4 000
3 500
3 000
2 500
2 000
1 500
1 000
500
02008 2009 2010 2011 2012 2013 2014
Containers 3 900 319 4 334 612 4 012 475 4 518 471 4 310 994 4 694 101 4 588 419

Annual Transport Statistics Bulletin 2014 Republic of South Africa 65
Table 3.10: Total Number of Vessels Arrived at South African Ports, Jan to Dec 2013
RICHARDS BAY
DURBANEAST
LONDONNGQURA
PORT ELIZABETH
MOSSEL BAY
CAPE TOWN
SALDANHA BAY
TOTAL ALL PORTS
OCEAN GOING:
GENERAL CARGO
Breakbulk/Conv 4 10 1 - - - 9 1 25
General Cargo 181 436 2 23 28 1 205 35 911
All Purpose - - - - - - - - -
TOTAL GENERAL CARGO:
185 446 3 23 28 1 214 36 936
BULK
Bulk Dry 1 392 895 16 7 172 - 191 459 3 132
Bulk Liquid 99 496 10 1 26 61 109 31 833
TOTAL BULK: 1 491 1 391 26 8 198 61 300 490 3 965
CONTAINERS
Container Cellular - - - - - - - - -
Container Non-Cellular
38 1 109 2 477 224 - 798 2 2 650
Reefer 2 72 - - 23 - 81 1 179
TOTAL CONTAINERS:
40 1 181 2 477 247 - 879 3 2 829
TANKERS
Tanker - Oil - - - - - - - - -
Tanker - Chemical
27 70 1 - 1 9 13 - 121
Tanker - LPG 14 22 1 - 12 - 17 - 66
Tanker - Bitumen - - - - - - - - -
TOTAL TANKERS: 41 92 2 - 13 9 30 - 187
PASSENGER VESSELS
12 76 9 - 14 6 47 - 164
CAR / VEHICLE CARRIERS
2 377 85 - 155 - 3 - 622
RO-RO
Load On Roll Off 3 8 - - - - 2 - 13
Roll On Roll Off - 3 - - - - - - 3
TOTAL RO-RO VESSELS:
3 11 - - - - 2 - 16

Annual Transport Statistics Bulletin 2014 Republic of South Africa66
RICHARDS BAY
DURBANEAST
LONDONNGQURA
PORT ELIZABETH
MOSSEL BAY
CAPE TOWN
SALDANHA BAY
TOTAL ALL PORTS
OTHER
Livestock - - 1 - - - - - 1
Unidentifi ed 21 31 - 1 - 3 13 3 72
TOTAL OTHER: 21 31 1 1 - 3 13 3 73
TOTAL OCEAN GOING
1 795 3 605 128 509 655 80 1 488 532 8 792
COASTERS:
Coaster (Bona Fide)
44 142 155 5 183 52 80 - 661
TOTAL COASTWISE:
44 142 155 5 183 52 80 - 661
FOREIGN FISHING VESSELS
16 75 - 1 5 9 420 7 533
SA.TRAWLERS 25 27 2 4 190 613 304 21 1 186
MISCELLANEOUS
Barge 11 3 - - - - 3 - 17
Cable Layer - - - - - - 5 - 5
Dredger 4 1 - 3 - - - - 8
Hopper - - - - - - - - -
Naval Vessels - 7 - - 2 - 21 - 30
Oi Rig - - - - - - 2 1 3
Search & Research
1 24 1 1 18 4 100 1 150
Tug 36 58 4 23 12 412 233 25 803
Yacht 2 3 1 - - - 25 - 31
Other 1 18 - 5 - 32 42 1 99
TOTAL MISCELLANEOUS:
55 114 6 32 32 448 431 28 1 146
TOTAL: 1 935 3 963 291 551 1 065 1 202 2 723 588 12 318
Source: Transnet National Ports Authority of South Africa (TNPA)

Annual Transport Statistics Bulletin 2014 Republic of South Africa 67
Table 3.10 indicates that the total number of vessels arrived in the South African ports in the
calendar year 2014 was 12,318 and which is 2.2% increase as compared to 2013 (Table 3.11).
Table 3.11: Annual Number of Vessel Arrivals at South African Ports, 2007-2013
2008 2009 2010 2011 2012 2013 2014
OCEAN GOING
Total General Cargo 1 388 1 309 1 193 1 079 970 954 936
Total Bulk 2 517 2 985 2 969 2 912 2 916 3 351 833
Total Containers 3 407 3 554 3 249 2 796 2 680 3 016 2 829
Total Tankers 1 161 1 225 979 839 769 558 187
Passenger Vessels 133 182 121 141 141 169 164
Car / Vehicle Carriers 518 474 503 526 568 394 622
Total Ro-Ro Vessels 92 25 - - - 241 16
Total Other 115 81 237 555 184 103 73
TOTAL OCEAN GOING 9 331 9 835 9 251 8 848 8 228 8 786 8 792
COASTERS
Total Coastwise 249 309 509 560 653 667 661
Foreign Fishing Vessels 797 612 508 559 586 590 533
S.A. Trawlers 1 703 1 458 1 069 1 300 756 1 043 1 186
Total Miscellaneous 804 860 810 712 844 968 1 146
TOTAL 12 884 13 074 12 147 11 979 11 067 12 054 12 318
Percentage Change -2.0% 1.5% -7.1% -1.4% -7.6% 8.9% 2.2%
Source: Transnet National Ports Authority of South Africa (TNPA)
Figure 3.7: Annual Number of Vessel Arrivals at South African Ports, 2008-2014
Source: Transnet National Ports Authority of South Africa (TNPA)
13 500
13 000
12 500
12 000
11 500
11 000
10 500
10 0002008 2009 2010 2011 2012 2013 2014
Vessels 12 884 13 074 12 147 11 979 11 067 12 054 12 318

SECTION 4AVIATION
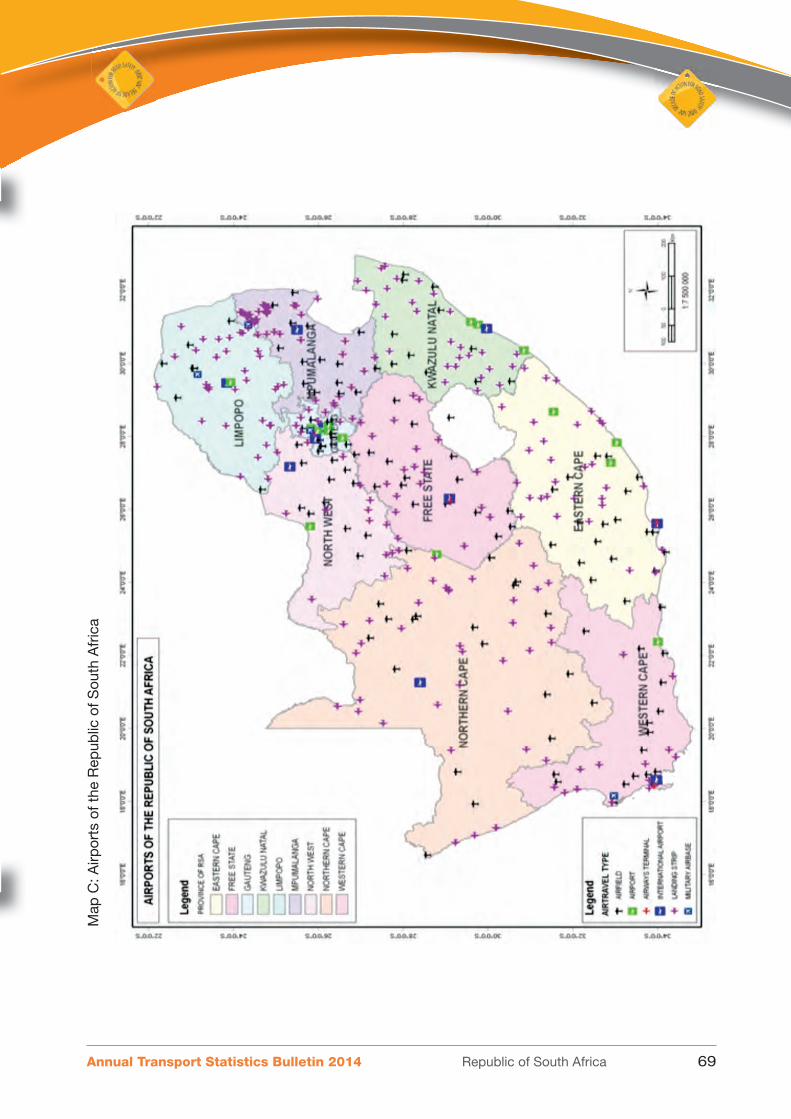
Annual Transport Statistics Bulletin 2014 Republic of South Africa 69
Map
C: A
irpor
ts o
f the
Rep
ublic
of S
outh
Afr
ica

Annual Transport Statistics Bulletin 2014 Republic of South Africa70
4.1
AIR
CR
AFT
RE
GIS
TR
AT
ION
AN
D L
ICE
NS
ING
Tab
le 4
.1: N
umb
er o
f P
ilot
and
Oth
er L
icen
ces
Issu
ed b
y G
end
er, 2
008
– 20
14
Cat
ego
ry20
0820
0920
1020
1120
1220
1320
14
Mal
eFe
mal
eM
ale
Fem
ale
Mal
eFe
mal
eM
ale
Fem
ale
Mal
eFe
mal
eM
ale
Fem
ale
Mal
eFe
mal
e
Aer
op
lane
Lic
ense
Pri
vate
Pilo
t86
373
541
5642
856
525
6955
569
742
106
598
78
Co
mm
erci
al P
ilot
483
4652
549
583
6354
458
528
5360
040
490
64
Air
line
Tran
spo
rt P
ilot
211
1625
828
182
2315
714
183
1415
56
136
12
Tota
l1
557
135
1 32
413
31
193
142
1 22
614
11
266
136
1 49
715
21
224
154
Hel
ico
pte
r Li
cens
e
Pri
vate
Pilo
t20
730
186
1510
615
123
1092
1312
311
374
11
Co
mm
erci
al P
ilot
9914
111
713
013
9015
7211
828
7316
Air
line
Tran
spo
rt P
ilot
25-
433
213
152
281
242
102
Tota
l33
144
340
2525
731
228
2719
225
229
2145
729
Oth
er L
icen
ses
Stu
den
t P
ilot
1 75
820
983
010
459
991
741
118
754
113
1 18
816
476
215
4
Cab
in C
rew
112
467
162
657
189
638
189
794
212
914
162
832
199
812
Mic
ro li
ght
Pilo
t19
26
--
--
--
--
--
Ho
t A
ir B
allo
on
Pilo
t4
-7
14
-3
-2
-1
-3
-
Gyr
op
lane
Pilo
t36
110
--
--
--
--
-
Mai
nten
ance
Eng
inee
rs18
24
134
414
9-
138
211
84
163
812
63
Flig
ht E
ngin
eers
--
1-
5-
6-
2-
2-
3-
Valid
atio
ns24
644
224
3021
632
234
2726
453
230
2922
517
Tota
l2
530
731
1 36
879
61
157
761
1 30
594
11
352
1 08
41
746
1 03
31
318
986
Gra
nd T
ota
l3
261
2 16
41
918
2 24
62
436
2 77
92
304
Per
cent
age
Cha
nge
19.9
-33.
6-1
1.4
17.1
8.5
14.1
-17.
1
Sou
rce:
Sou
th A
fric
an C
ivil
Avi
atio
n A
utho
rity
(SA
CA
A)

Annual Transport Statistics Bulletin 2014 Republic of South Africa 71
Table 4.1 depicts the number of pilot and related licences issued. They decreased by 17% to
2,304 in 2014. Males accounted for 55.5% of the total licenses issued in 2014 (Figure 4.1).
Figure 4.1: Number Pilot and Other Licences issued by Gender, 2008 – 2014
Source: South African Civil Aviation Authority (SACAA)

Annual Transport Statistics Bulletin 2014 Republic of South Africa72
Table 4.2: Number of Civil Registered Aircrafts, 2008 – 2014
Years 2008 2009 2010 2011 2012 2013 2014
Aeroplanes and Helicopters
Aeroplane - 1 piston engine 2 666 2 718 2 770 2 808 2 851 2 898 2 894
Aeroplane - 2 piston engines 755 749 713 710 707 711 716
Aeroplane - 3 piston engines 2 2 2 2 2 2 2
Aeroplane - 4 piston engines 5 5 6 7 8 10 26
Agricultural piston engine 153 154 154 152 153 154 157
Aeroplane – 1 turbo prop engine 108 130 111 112 112 115 120
Aeroplane – 2 turbo prop engines 324 332 354 353 349 341 351
Aeroplane – 4 turbo prop engines 10 9 9 9 8 7 8
Agricultural turbo prop engine 55 54 55 54 54 55 60
Aeroplane – 1 turbo jet engine 26 8 37 39 40 45 45
Aeroplane – 2 turbo jet engines 298 324 344 365 377 381 395
Aeroplane – 3 turbo jet engines 18 15 15 16 18 18 18
Aeroplane - 4 turbo jet engines 48 51 56 54 47 43 40
Helicopter – piston engine 573 606 638 669 671 680 687
Helicopter – 1-turbine engine 349 384 394 375 408 428 436
Helicopter – 2-turbine engines 83 81 79 83 92 92 101
Helicopter – 3-turbine engines 1 1 1 1 1 3 3
Total 5 474 5 623 5 738 5 809 5 898 5 983 6 059
Percentage Change 4.3% 2.7% 2.0% 1.2% 1.5% 1.4% 1.3%
Source: South African Civil Aviation Authority (SACAA)
The number of civil registered aircrafts increased by 1.3% to 6,059 in 2014 from 5,983 in 2013.

Annual Transport Statistics Bulletin 2014 Republic of South Africa 73
Figure 4.2: Annual Number of Civil Registered Aircrafts, 2007 – 2013
Source: South African Civil Aviation Authority (SACAA)
Table 4.3: Number of Sports and Recreational / NTCA Registered Aircrafts, 2008 – 2014
Years 2008 2009 2010 2011 2012 2013 2014
Glider 340 346 352 361 372 387 392
Glider motorised 174 180 185 189 188 190 187
Amateur built aeroplane, I engine 1 188 1 251 1 308 1 345 1 407 1 462 1 530
Amateur built aeroplane, 2 engines 47 51 63 64 66 67 67
NTCA-Production Built- 1 Engine 724 766 799 852 878 897
Amateur built helicopter 75 82 85 86 87 91 93
Amateur built gyrocopter 181 180 188 190 191 198 200
Amateur built Micro-light 2 060 2 089 2 123 2 144 2 172 2 169 2 177
Amateur built gyro glider 9 9 9 8 11 19 18
Amateur built fi xed wing – Turbojet 2 2 2 2 2 2 2
Research aircraft 4 4 4 4 4 4 4
Limited aircraft 163 171 174 178 183 184 186
Hot air balloon 120 125 126 129 132 132 132
Airship 1 1 1 1 1 1 1
Veteran single engine 130 133 143 151 154 155 162
Veteran twin engine - - -
Para-planes 14 14 14 14 14 14 14
Total 4 508 5 362 5 543 5 665 5 836 5 953 6 062
Percentage Change 4.2% 18.9% 3.4% 2.2% 3.0% 2.0% 1.8%
Source: South African Civil Aviation Authority (SACAA)
Table 4.3 shows that the number of sports and recreational aircrafts increased by 1.8% in 2014
to 6,062 from 5,953 in 2013.
6 200
6 100
6 000
5 900
5 800
5 700
5 600
5 500
5 400
5 300
5 200
5 1002008 2009 2010 2011 2012 2013 2014
Civil Registered Aircrafts 5 474 5 623 5 738 5 809 5 898 5 983 6 059

Annual Transport Statistics Bulletin 2014 Republic of South Africa74
Figure 4.3: Annual Number of Sports and Recreational / NTCA Registered Aircrafts, 2007- 2013
Source: South African Civil Aviation Authority (SACAA)
7 000
6 000
5 000
4 000
3 000
2 000
1 000
02008 2009 2010 2011 2012 2013 2014
Sports and Recreational / NTCA Registered Aircrafts
4 508 5 362 5 543 5 665 5 836 5 953 6 062

Annual Transport Statistics Bulletin 2014 Republic of South Africa 75
4.2 AIR TRAFFIC INFORMATION
Table 4.4: Passenger Volumes by Airport, 2008 – 2014
Airport Year
2008 2009 2010 2011 2012 2013 2014
Bloemfontein 411 683 400 814 403 800 437 996 426 672 380 284 367 635
Cape Town 8 077 435 7 723 975 8 107 648 8 436 191 8 505 563 8 348 854 8 636 294
Durban 4 458 715 4 304 729 4 757 800 5 038 231 4 747 224 4 504 929 4 495 974
East London 715 206 675 980 671 895 681 741 663 206 658 363 1 285 074
George 630 385 548 498 527 633 527 633 555 378 560 432 597 637
Kimberley 155 615 130 644 132 756 135 939 153 126 152 667 163 138
OR Tambo 18 501 628 17 444 503 18 383 549 18 922 346 18 681 458 18 792 857 19 031 907
Pilanesberg 8 920 5 869 8 123 2 651 - - -
Port Elizabeth 1 465 429 1 342 861 1 408 754 1 368 334 1 317 698 1 269 634 1 285 074
Upington 50 220 42 522 45 390 51 982 55 319 62 510 72 636
Total 34 475 236 32 620 395 34 447 348 35 603 044 35 105 644 34 730 530 35 935 369
Percentage Change -4.2% -5.4% 5.6% 3.4% -1.4% -1.1% 3.5%
Source: Airports Company of South Africa (ACSA)
Table 4.4 shows that passenger volumes at ACSA airports decreased by 1.1% to 34.7 million in
2013 from 35.1 million in 2012.
Figure 4.4: Annual Number of Passenger Volumes, 2007 – 2013
Source: Airports Company of South Africa (ACSA)

Annual Transport Statistics Bulletin 2014 Republic of South Africa76
Table 4.5: Aircraft Movements by Airport, 2008 – 2014
AirportYear
2008 2009 2010 2011 2012 2013 2014
Bloemfontein 27 035 22 896 18 476 20 144 18 339 14 533 16 200
Cape Town 78 030 93 230 93 607 96 575 91 486 87 388 90 458
Durban 53 562 52 394 54 587 54 940 50 853 49 341 49 761
East London 23 826 35 135 39 557 34 111 29 624 31 136 31 588
George 9 635 42 439 35 352 32 843 37 623 41 672 52 986
Kimberley 12 646 12 106 12 415 12 516 11 949 10 369 12 309
OR Tambo 225 984 203 210 210 686 212 132 203 007 202 750 216 392
Pilanesberg 4 277 3 934 4 023 2 900 - - -
Port Elizabeth 36 425 76 869 74 074 68 387 63 289 67 777 61 938
Upington 5 167 6 706 6 632 7 992 8 161 9 136 9 494
Total 476 587 548 919 549 409 542 540 514 331 514 102 541 126
Percentage Change
5.2% 15.2% 0.1% -1.3% -5.2% 0.0% 5.3%
Source: Airports Company of South Africa (ACSA)
The aircraft movements grew by 5.3% to 541,126 units in 2014 from 514,331 units in 2013, and
also In 2014 OR Tambo had the highest proportion of 40% of the aircraft movements in the South
African airports followed Cape Town and Port Elizabeth with 17% and 11% respectively.
Figure 4.5: Aircraft Movements by Airport, 2014
Source: Airports Company of South Africa (ACSA)

Annual Transport Statistics Bulletin 2014 Republic of South Africa 77
4.3 AIRCRAFT ACCIDENTS AND INCIDENTS
Table 4.6: Aircraft Accidents and Incidents, 2013 – 2014
Accidents
Jan Feb Mar Apr May Jun Jul Aug Sep Oct Nov Dec Total
150
Actual 2013 15 12 10 11 11 10 13 11 13 8 14 13 141
Actual 2014 17 14 11 11 10 7 6 14 10 4 8 17 129
Fatal Accidents
Jan Feb Mar Apr May Jun Jul Aug Sep Oct Nov Dec Total
19
Actual 2013 3 1 1 5 1 3 1 1 1 2 2 1 22
Actual 2014 6 3 1 2 1 0 0 0 5 1 0 2 21
Fatalities
Jan Feb Mar Apr May Jun Jul Aug Sep Oct Nov Dec Total
33
Actual 2013 5 1 2 9 1 5 2 2 2 2 2 2 35
Actual 2014 6 5 3 3 2 0 0 0 8 1 0 3 31
Serious Incidents
Jan Feb Mar Apr May Jun Jul Aug Sep Oct Nov Dec Total
Actual 2013 0 6 6 4 5 6 3 7 9 6 7 8 67
Actual 2014 4 4 3 7 10 6 7 5 9 4 9 5 73
Source: Airports Company of South Africa (ACSA)
Table 4.6 shows the the total number of fatal accidents was 21 in 2014 which contributed to 31
fatalities.
Table 4.7: Aircraft Accidents and Incidents, 2008 – 2014
Type 2008 2009 2010 2011 2012 2013 2014
Accidents 190 127 147 92 120 141 129
Fatal Accidents 33 16 15 16 18 22 21
Fatalities 92 28 24 39 29 35 31
Serious Incidents 40 19 51 59 75 67 73
Source: Airports Company of South Africa (ACSA)
Table 4.7 and Figure 4.6 shows that there is a general decrease in aircraft accidents and fatalities
between 2013 and 2014, however the serious incidents increased by 9% to 73 during the same
period.

Annual Transport Statistics Bulletin 2014 Republic of South Africa78
Figure 4.6: Annual Number of Aircraft Fatal Accidents and Fatalities, 2008 – 2014
Source: Airports Company of South Africa (ACSA)

SECTION 5RAIL

Annual Transport Statistics Bulletin 2014 Republic of South Africa80
MA
P D
: Rep
ublic
of S
outh
Afr
ica
Rai
lway
Net
wor
k

Annual Transport Statistics Bulletin 2014 Republic of South Africa 81
5.1
R
AIL
PA
SS
EN
GE
R IN
FOR
MA
TIO
N
Tab
le 5
.1: M
etro
rail
Rai
l Pas
seng
ers
by
Reg
ion,
201
3 –
2014
2013
Janu
ary
Febr
uary
Mar
chAp
rilM
ayJu
neJu
lyAu
gust
Sept
embe
rOc
tobe
rNo
vem
ber
Dece
mbe
r
Wes
tern
Cap
e14
324
794
16 6
10 2
4716
636
536
16 3
15 1
9817
366
773
13 7
45 2
6815
382
009
17 0
86 4
1715
815
319
17 8
38 2
0716
286
364
12 4
17 5
63
East
ern
Cape
724
089
870
476
857
593
774
123
920
045
734
123
738
407
860
466
760
018
871
264
772
040
503
302
Wits
15 3
77 5
1617
161
085
16 9
15 8
2815
946
141
16 4
70 7
0614
443
361
15 4
88 6
8517
441
867
16 5
18 4
5418
006
805
16 4
80 0
3111
196
058
Tshw
ane
6 14
6 92
46
361
530
6 47
9 23
85
886
828
6 33
3 29
75
305
079
5 75
5 75
16
338
023
6 20
4 61
66
870
007
6 35
5 02
24
406
597
Kwaz
ulu-
Nata
l6
162
690
6 88
7 52
27
104
735
6 70
2 46
07
121
843
6 48
9 23
76
490
847
7 20
4 29
86
622
370
7 28
0 29
56
629
510
5 22
0 65
9
Met
rora
il To
tal
42 7
36 0
1347
890
860
47 9
93 9
3045
624
750
48 2
12 6
6440
717
068
43 8
55 6
9948
931
071
45 9
20 7
7750
866
578
46 5
22 9
6733
744
179
Mon
thly
Av
erag
e45
251
380
2014
Janu
ary
Febr
uary
Mar
chAp
rilM
ayJu
neJu
lyAu
gust
Sept
embe
rOc
tobe
rNo
vem
ber
Dece
mbe
r
Wes
tern
Cap
e14
324
794
16 6
10 2
4716
636
536
15 4
79 7
6315
556
094
14 3
77 8
1014
590
945
14 3
19 1
3014
974
448
16 1
76 0
7514
947
865
11 4
91 2
46
East
ern
Cape
724
089
870
476
857
593
791
020
842
856
774
481
781
006
838
157
833
480
841
020
774
931
530
888
Wits
15 3
77 5
1617
161
085
16 9
15 8
2815
845
782
16 3
61 8
2915
659
348
14 9
62 7
8915
635
627
16 0
41 1
4216
853
961
15 5
80 4
4610
414
303
Tshw
ane
6 14
6 92
46
361
530
6 47
9 23
86
236
133
6 44
5 90
96
157
555
6 29
2 78
86
221
649
6 19
1 03
36
607
612
6 03
0 10
14
159
655
Kwaz
ulu-
Nata
l6
162
690
6 88
7 52
27
104
735
6 46
7 41
66
477
743
6 35
9 96
16
579
845
6 75
5 00
46
843
137
7 26
9 10
46
790
031
5 43
6 49
0
Met
rora
il To
tal
42 7
36 0
1347
890
860
47 9
93 9
3044
820
114
45 6
84 4
3143
329
155
43 2
07 3
7343
769
567
44 8
83 2
4047
747
772
44 1
23 3
7432
032
582
Mon
thly
Av
erag
e44
018
201
Not
e: fi
gure
s re
ceiv
ed in
fi na
ncia
l yea
rs a
nd r
e-ca
lcul
ated
for
cale
ndar
yea
rs.
Sou
rce:
Pas
seng
er R
ail A
genc
y of
Sou
th A
fric
a (P
RA
SA
)

Annual Transport Statistics Bulletin 2014 Republic of South Africa82
Figure 5.1: Metrorail Rail Passenger Volumes, 2011/12 – 2013/14
Source: Passenger Rail Agency of South Africa (PRASA)
Table 5.1 and Figure 5.1 shows the Metrorail passenger volumes from the calendar year 2012
to 2014. The average Metrorail passenger volume per month for the calendar year 2014 was
approximately 44 million passengers.
60 000
50 000
40 000
30 000
20 000
10 000
-
Janu
ary
Febru
ary
Marc
hApril
May
June Ju
ly
Augus
t
Septem
ber
October
November
Decem
ber
2013 20143
Thou
sand
s

Annual Transport Statistics Bulletin 2014 Republic of South Africa 83
Tab
le 5
.2: P
asse
nger
Kilo
met
res
Trav
elle
d b
y R
egio
n, 2
013
– 20
14
2013
‘tho
usan
dsJa
nuar
yFe
brua
ryM
arch
April
May
June
July
Augu
stSe
ptem
ber
Octo
ber
Nove
mbe
rDe
cem
ber
Wes
tern
Cap
e32
9 92
339
8 53
741
3 37
839
7 31
642
3 68
133
0 16
937
4 76
041
6 02
638
5 78
843
5 01
639
8 23
130
4 77
8
East
ern
Cape
17 4
0420
344
19 8
1318
913
22 2
2918
040
18 1
8221
048
18 6
3721
268
19 1
3712
695
Wits
390
025
447
116
444
817
431
070
445
946
398
224
423
767
477
116
455
369
495
501
458
156
315
975
Tshw
ane
156
718
174
811
177
940
176
764
191
411
162
470
175
506
192
175
190
895
211
116
196
983
138
638
Kwaz
ulu-
Nata
l14
0 26
715
7 27
816
2 37
215
9 10
916
7 63
015
4 22
715
6 17
317
1 16
315
8 84
917
3 00
415
8 67
512
8 02
4
Met
rora
il To
tal
1 03
4 33
71
198
087
1 21
8 31
91
183
173
1 25
0 89
71
063
131
1 14
8 38
81
277
528
1 20
9 53
81
335
905
1 23
1 18
290
0 10
9
2014
‘thou
sand
sJa
nuar
yFe
brua
ryM
arch
April
May
June
July
Augu
stSe
ptem
ber
Octo
ber
Nove
mbe
rDe
cem
ber
Wes
tern
Cap
e34
9 40
440
6 80
540
8 67
038
0 66
238
0 60
835
1 18
135
6 39
834
4 18
536
1 31
639
2 38
936
3 14
428
0 26
9
East
ern
Cape
17 8
4921
309
21 2
4219
628
21 0
7419
562
19 6
5420
941
20 7
3721
191
19 4
9513
436
Wits
429
532
474
987
470
982
442
954
456
009
437
258
419
193
434
535
445
020
470
947
435
676
294
270
Tshw
ane
191
009
194
314
201
181
194
651
200
843
193
392
197
237
194
192
193
990
206
775
190
443
133
915
Kwaz
ulu-
Nata
l14
8 21
316
4 12
317
0 42
515
5 50
115
4 85
515
2 36
515
9 90
816
2 10
216
4 37
517
5 48
216
4 12
213
4 28
4
Met
rora
il To
tal
1 13
6 00
51
261
537
1 27
2 50
038
0 66
238
0 60
835
1 18
135
6 39
834
4 18
536
1 31
639
2 38
936
3 14
485
6 17
4
Not
e: fi
gure
s re
ceiv
ed in
fi na
ncia
l yea
rs a
nd r
e-ca
lcul
ated
for
cale
ndar
yea
rs.
Sou
rce:
Pas
seng
er R
ail A
genc
y of
Sou
th A
fric
a (P
RA
SA
)

Annual Transport Statistics Bulletin 2014 Republic of South Africa84
Figure 5.2: Annual Percentage Change on Passenger Kilometres Travelled by Region, 2007/08 to 2013/14.
Source: Passenger Rail Agency of South Africa (PRASA)
The passenger kilometres travelled from April to November 2014 were lower as compared to the
preceding years (Figure 5.2).
Western Cape region passenger kilometres travelled decreased by 5% in 2014, and all other
regions showed an increase with Wits and Eastern Cape region recording highest increases of
6.8% and 3.7% respectively (Table 5.3).
Table 5.3: Monthly percentage change from previous year in Passenger Kilometres Travelled by Region, 2014
2014 Western cape Eastern cape Wits Tshwane Kwazulu-Natal
January 5.9% 2.6% 10.1% 21.9% 5.7%
February 2.1% 4.7% 6.2% 11.2% 4.4%
March -1.1% 7.2% 5.9% 13.1% 5.0%
April -4.2% 3.8% 2.8% 10.1% -2.3%
May -10.2% -5.2% 2.3% 4.9% -7.6%
June 6.4% 8.4% 9.8% 19.0% -1.2%
July -4.9% 8.1% -1.1% 12.4% 2.4%
August -17.3% -0.5% -8.9% 1.0% -5.3%
September -6.3% 11.3% -2.3% 1.6% 3.5%
October -9.8% -0.4% -5.0% -2.1% 1.4%
November -8.8% 1.9% -4.9% -3.3% 3.4%
December -8.0% 5.8% -6.9% -3.4% 4.9%
Total -5.0% 3.7% 0.5% 6.8% 1.0%
Note: fi gures received in fi nancial years and re-calculated for calendar years.
Source: Passenger Rail Agency of South Africa (PRASA)
1 600
1 400
1 200
1 000
800
600
400
200
-
Janu
ary
Febru
ary
Marc
hApril
May
June Ju
ly
Augus
t
Septem
ber
October
November
Decem
ber
2013 20143
Thou
sand
s

Annual Transport Statistics Bulletin 2014 Republic of South Africa 85
5.2 RAIL PERFORMANCE
Table 5.4: Number of Trains ran, 2013 – 2014
Region 2013 2014
Western cape 198 910 200 657
Eastern cape 9 890 10 489
Wits 238 168 242 561
Tshwane 98 125 97 047
Kwazulu-Natal 132 603 126 326
Metrorail Total 677 696 676 847
% Change 4.7% -0.1%
Note: fi gures received in fi nancial years and re-calculated for calendar years.
Source: Passenger Rail Agency of South Africa (PRASA)
Table 5.4 shows that the number of trains ran dropped slightly by 0.1% in 2014 to 676,847 units
from 677,696 in 2013.
Figure 5.3: Number of Trains ran (thousand), 2013 - 2014
Source: Passenger Rail Agency of South Africa (PRASA)

Annual Transport Statistics Bulletin 2014 Republic of South Africa86
Table 5.5: Average Percentage of Trains on Time, 2013 - 2014
Region 2013 2014
Western cape 82.48% 74.67%
Eastern cape 94.26% 91.21%
Wits 83.94% 84.46%
Tshwane 81.76% 86.33%
Kwazulu-Natal 81.07% 73.24%
Metrorail Total 82.85% 81.86%
Note: fi gures received in fi nancial years and re-calculated for calendar years
Source: Passenger Rail Agency of South Africa (PRASA)
Table 5.6: Average Percentage of Trains Delayed, 2013 – 2014
Region 2013 2014
Western cape 17.52% 25.33%
Eastern cape 5.74% 8.79%
Wits 16.06% 15.54%
Tshwane 18.24% 13.67%
Kwazulu-Natal 18.93% 18.42%
Metrorail Total 17.15% 18.14%
Note: fi gures received in fi nancial years and re-calculated for calendar years
Source: Passenger Rail Agency of South Africa (PRASA)
Table 5.7: Average Percentage of Trains Cancelled, 2013 - 2014
Region 2013 2014
Western cape 1.20% 2.77%
Eastern cape 0.22% 0.34%
Wits 4.25% 3.62%
Tshwane 9.63% 6.45%
Kwazulu-Natal 1.43% 1.79%
Metrorail Total 3.59% 3.45%
Note: fi gures received in fi nancial years and re-calculated for calendar years
Source: Passenger Rail Agency of South Africa (PRASA)

Annual Transport Statistics Bulletin 2014 Republic of South Africa 87
The period between 2013 and 2014 at least more that 81% of trains were on time at national level
(Table 5.5). In 2014 about 18% of trains were delayed (Table 5.6) and 3% were cancelled (Table
5.7).
The total number of accidents recorded in the passenger rail operations dropped to 42 units in
2014 from 48 units in 2013 and Gauteng accounted for the highest number of accidents (16) as
indicated in Table 5.8.
Table 5.8: Accidents in Passenger Rail Operations, 2010 – 2014
Region 2010 2011 2012 2013 2014
Western Cape 7 6 10 6 10
Eastern Cape 1 0 2 2 1
KwaZulu Natal 10 9 7 8 9
Gauteng 22 17 20 20 16
Smeyl 7 12 6
Total 40 19 46 48 42
Note: fi gures received in fi nancial years and re-calculated for calendar years
Source: Passenger Rail Agency of South Africa (PRASA)
Figure 5.4: Accidents in Passenger Rail Operations, 2010 – 2014
Accidents
Source: Passenger Rail Agency of South Africa (PRASA)

Annual Transport Statistics Bulletin 2014 Republic of South Africa88
5.3
G
AU
TR
AIN
STA
TIS
TIC
S
Tab
le 5
.9: G
autr
ain
Pas
seng
er F
low
s 20
14
2014
Jan
Feb
Mar
Apr
May
Jun
Jul
Aug
Sep
Oct
Nov
Dec
Tota
l
Trai
n To
tal
1 13
2 00
71
275
433
1 36
1 47
71
216
843
1 26
8 51
61
214
603
1 34
7 13
11
284
603
1 26
7 78
71
352
078
1 21
2 89
51
005
855
14 9
39 2
28
Gene
ral
2014
Jan
Feb
Mar
Apr
May
Jun
Jul
Aug
Sep
Oct
Nov
Dec
Tota
l
Gene
ral P
ax1
005
266
1 13
9 16
91
206
423
1 07
1 31
01
127
786
1 06
8 82
31
198
296
1 13
8 59
81
118
808
1 19
3 32
11
056
298
865
809
13 1
89 9
07
Aver
age
Wee
kday
43 7
0151
755
52 2
8249
266
49 3
5547
341
47 2
5548
179
47 9
2047
594
47 0
0137
080
Aver
age
Wee
kend
8 75
613
008
14 6
1712
296
12 7
9012
201
13 9
2912
683
12 4
9812
333
11 6
2811
292
Airp
ort
2014
Jan
Feb
Mar
Apr
May
Jun
Jul
Aug
Sep
Oct
Nov
Dec
Tota
l
Airp
ort P
ax12
6 74
113
6 26
415
5 05
414
5 53
314
0 73
014
5 78
014
8 83
514
6 00
514
8 97
915
8 75
715
6 59
714
0 04
61
749
321
Aver
age
Wee
kday
4 70
05
443
5 74
85
605
5 20
45
563
5 30
05
421
5 51
65
652
5 95
65
397
Aver
age
Wee
kend
2 80
43
425
3 64
43
550
3 33
23
453
3 36
73
216
3 68
23
595
3 74
72
919
Not
e: fi
gure
s re
ceiv
ed in
fi na
ncia
l yea
rs a
nd r
e-ca
lcul
ated
in fo
r ca
lend
ar y
ears
Sou
rce:
Gau
trai
n M
anag
emen
t A
genc
y
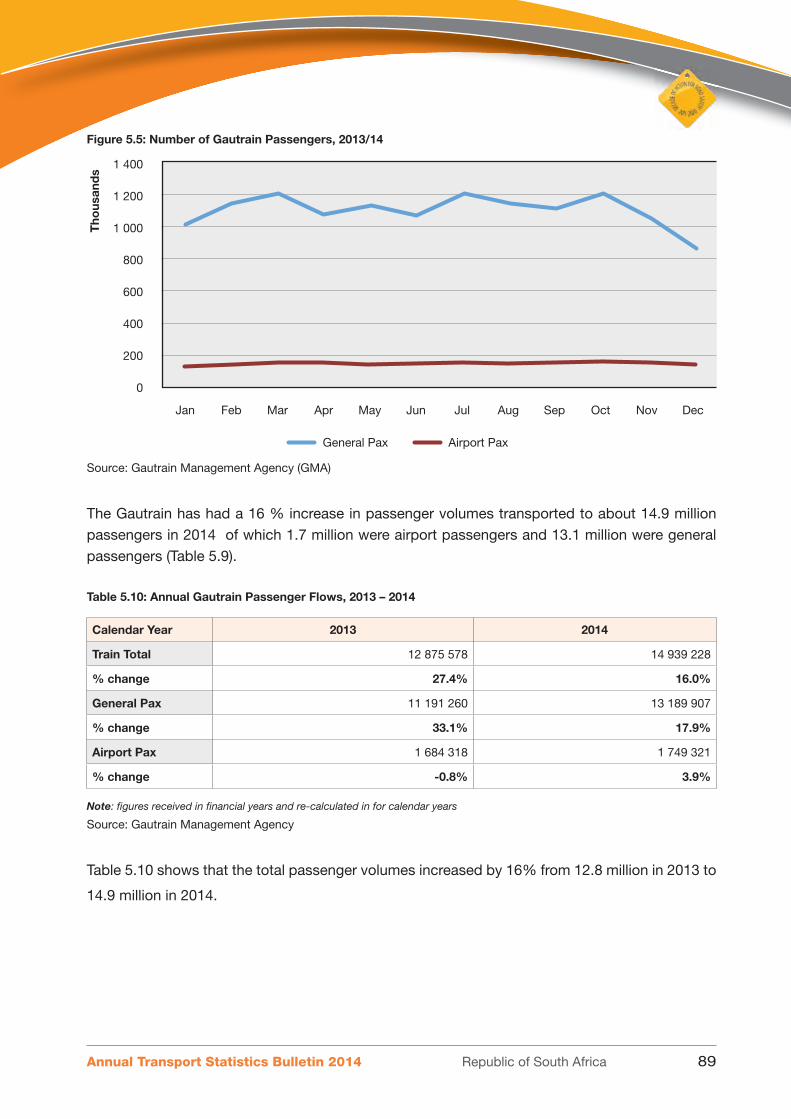
Annual Transport Statistics Bulletin 2014 Republic of South Africa 89
Figure 5.5: Number of Gautrain Passengers, 2013/14
Source: Gautrain Management Agency (GMA)
The Gautrain has had a 16 % increase in passenger volumes transported to about 14.9 million
passengers in 2014 of which 1.7 million were airport passengers and 13.1 million were general
passengers (Table 5.9).
Table 5.10: Annual Gautrain Passenger Flows, 2013 – 2014
Calendar Year 2013 2014
Train Total 12 875 578 14 939 228
% change 27.4% 16.0%
General Pax 11 191 260 13 189 907
% change 33.1% 17.9%
Airport Pax 1 684 318 1 749 321
% change -0.8% 3.9%
Note: fi gures received in fi nancial years and re-calculated in for calendar years
Source: Gautrain Management Agency
Table 5.10 shows that the total passenger volumes increased by 16% from 12.8 million in 2013 to
14.9 million in 2014.
1 400
1 200
1 000
800
600
400
200
0
Tho
usan
ds
Jan Feb Mar Apr May Jun Jul Aug Sep Oct Nov Dec
General Pax Airport Pax

Annual Transport Statistics Bulletin 2014 Republic of South Africa90
105 Annual Transport Statistics Bulletin 2014 Republic of South Africa
Figure 5.6: Annual Passenger Flows, 2013 – 2014
Source: Gautrain Management Agency
!!"!#!"$%&"
!'"!(#"#&)"
!"#$% !"#&%
*+,+-./"0.1"
!"%(2"'!("
!")2#"'$!"
!"#$% !"#&%
34-56-7"0.1"
Figure 5.6: Annual Passenger Flows, 2013 – 2014
Source: Gautrain Management Agency

SECTION 6PIPELINES

Annual Transport Statistics Bulletin 2014 Republic of South Africa92
Map
E: R
epub
lic o
f Sou
th A
fric
a P
ipel
ine
Net
wor
k

Annual Transport Statistics Bulletin 2014 Republic of South Africa 93
6.1 PIPELINES
Table 6.1: Annual Volumes of Petroleum Products Transported, 2009 – 2014
Volumes Unit of
measure2009 2010 2011 2012 2013 2014
Total Petroleum Products
Ml 17 216 17 751 18 025 16 741 15 882 16 583
Percentage change % 1.9% 3.1% 1.5% -7.1% -5.1% 4.4%
Refi ned Ml 10 768 11 480 10 997 10 119 10 432 10 659
Crude Ml 5 172 5 108 5 457 5 171 4 237 4 807
Avtur (Jet Fuel) Ml 1 276 1 163 1 149 1 075 1 005 1 117
Gas million m3 494 455 470 494 472 491
Storage Ml - - - - 857 771
Source: Transnet Pipelines
The total annual volume of Petroleum products in 2014 increased by 4.4% to 16.5 billion litres
from 15.8 billion litres in 2013.
Figure 6.1: Annual Volumes of Petroleum Products Transported (ml), 2009 – 2014
Source: Transnet Pipelines
18 500
18 000
17 500
17 000
16 500
16 000
15 500
15 000
14 5002009 2010 2011 2012 2013 2014
Volumes of Petroleum Products Transported (ml)
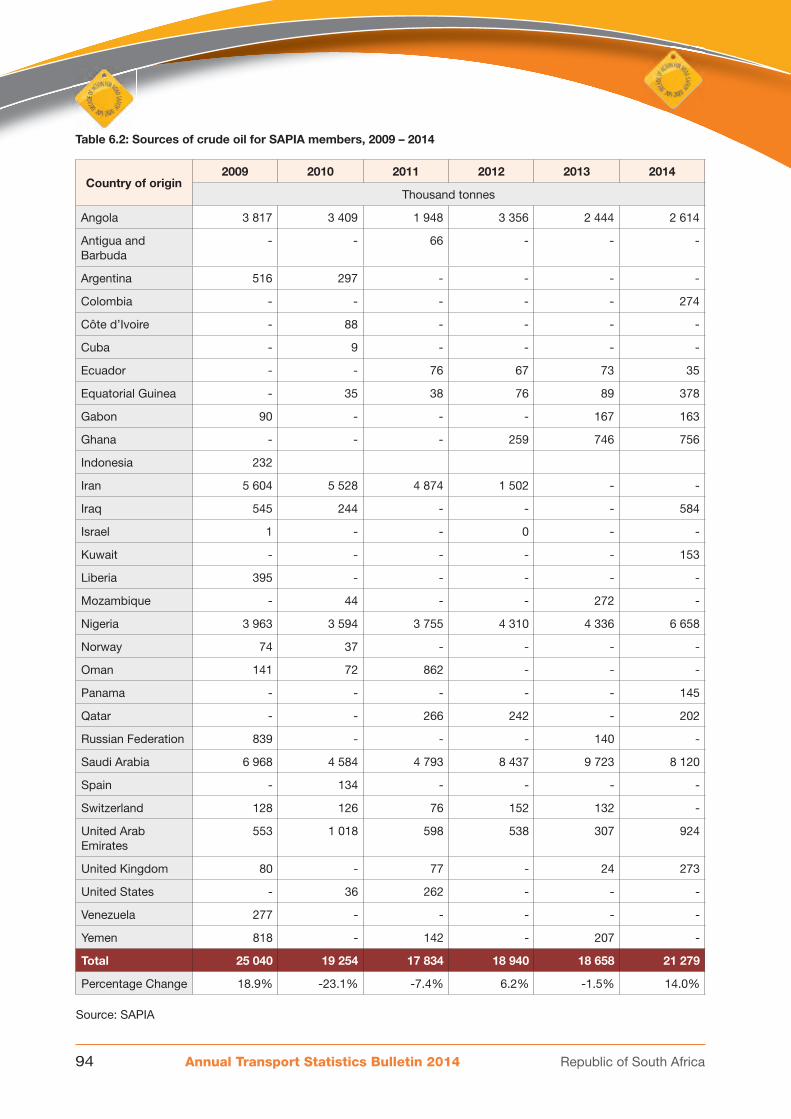
Annual Transport Statistics Bulletin 2014 Republic of South Africa94
Table 6.2: Sources of crude oil for SAPIA members, 2009 – 2014
Country of origin2009 2010 2011 2012 2013 2014
Thousand tonnes
Angola 3 817 3 409 1 948 3 356 2 444 2 614
Antigua and Barbuda
- - 66 - - -
Argentina 516 297 - - - -
Colombia - - - - - 274
Côte d’Ivoire - 88 - - - -
Cuba - 9 - - - -
Ecuador - - 76 67 73 35
Equatorial Guinea - 35 38 76 89 378
Gabon 90 - - - 167 163
Ghana - - - 259 746 756
Indonesia 232
Iran 5 604 5 528 4 874 1 502 - -
Iraq 545 244 - - - 584
Israel 1 - - 0 - -
Kuwait - - - - - 153
Liberia 395 - - - - -
Mozambique - 44 - - 272 -
Nigeria 3 963 3 594 3 755 4 310 4 336 6 658
Norway 74 37 - - - -
Oman 141 72 862 - - -
Panama - - - - - 145
Qatar - - 266 242 - 202
Russian Federation 839 - - - 140 -
Saudi Arabia 6 968 4 584 4 793 8 437 9 723 8 120
Spain - 134 - - - -
Switzerland 128 126 76 152 132 -
United Arab Emirates
553 1 018 598 538 307 924
United Kingdom 80 - 77 - 24 273
United States - 36 262 - - -
Venezuela 277 - - - - -
Yemen 818 - 142 - 207 -
Total 25 040 19 254 17 834 18 940 18 658 21 279
Percentage Change 18.9% -23.1% -7.4% 6.2% -1.5% 14.0% Source: SAPIA

Annual Transport Statistics Bulletin 2014 Republic of South Africa 95
Table 6.2 and Figure 6.2, shows the global crude oil production volumes were 21.2 million tonnes
in 2014, which is an increase of 14% from 18.6 million tonnes in 2013.
Figure 6.2: Sources of crude oil for SAPIA members (Thousand tonnes), 2009 – 2014
30 000
25 000
20 000
15 000
10 000
5 000
02009 2010 2011 2012 2013 2014
Volumes of Crude Oil globally
Source: SAPIA

Annual Transport Statistics Bulletin 2014 Republic of South Africa96
NOTES

NATIONAL DEPARTMENT OF TRANSPORT (DOT)
HEAD OFFICE
POSTAL ADDRESSPRIVATE BAG X193
PRETORIA0001
PHYSICAL ADDRESS
159 STRUBEN STREETFORUM BUILDING
PRETORIA