Embed Size (px)
Citation preview
Iden%fyQualityNeedsU.S. DEPARTMENT OF ENERGY • OFFICE OF ENERGY EFFICIENCY & RENEWABLE ENERGY www.build4scale.org www.build4scale.org
Regula'on,Cer'fica'on,andIndustryStandardsModule6BIden%fyQualityNeeds

Iden%fyQualityNeedsU.S. DEPARTMENT OF ENERGY • OFFICE OF ENERGY EFFICIENCY & RENEWABLE ENERGY www.build4scale.org
2
Mo'va'on
oYourbankruptcymaybeonebigqualityfailureaway!o Itiskeytoestablishyourqualityplanearlyonduringbetates%ngtoavoidtheunexpectedduringscaling
oHowtogetaproductrightthefirst%meandevery%medependsuponacapableprocess
Example:2014GeneralMotorsigni%onswitchrecall.Theactualcostoftheigni%onswitchwasonlyafewcents,butitsqualityfailurewasresponsibleformillionsofvehiclerecallscos%ngbillionsofdollarstothecompany
Whyisthismoduleimportant?

Iden%fyQualityNeedsU.S. DEPARTMENT OF ENERGY • OFFICE OF ENERGY EFFICIENCY & RENEWABLE ENERGY www.build4scale.org
3
Mo'va'on
oVoiceofthecustomer:amarket-researchtechniquethatproducesadetailedsetofcustomerwantsandneeds,organizedintoahierarchicalstructure,andpriori%zedbyrela%veimportanceandsa%sfac%onwithcurrentalterna%ves
oYouneedtoknowwhatothersaredoingtostaycompe%%veinthemarketplace(Thatiscalled“benchmarking”or“reverseengineering”dependinguponthecontext)
Whyisthismoduleimportant?(cont.)

Iden%fyQualityNeedsU.S. DEPARTMENT OF ENERGY • OFFICE OF ENERGY EFFICIENCY & RENEWABLE ENERGY www.build4scale.org
4
ModuleOutline
oLearningobjec%vesoWhatthismoduleaddressesoWheredoesthisfitintheoverallProductDevelopment(PD)process?
oProcesscapabilityanalysis— Determiningcapabilityofyourprocessforscale-up
oSixsigmaprocess-improvementmethodology— NutsandboltsofDefine,Measure,Analyze,ImproveandControl(DMAIC)phaseswithsomeexamplesofqualitytools
oBenchmarkingquality— Voiceofthemarketandunderstandingyourcompe%%on

Iden%fyQualityNeedsU.S. DEPARTMENT OF ENERGY • OFFICE OF ENERGY EFFICIENCY & RENEWABLE ENERGY www.build4scale.org
5
LearningObjec'ves
oLO1.Analyzedatatodetermineprocesscapabili%esoLO2.ApplytheSixSigmaprocesstoqualityproblemsoLO3.Iden%fycri%calqualityneedsthroughuseofbenchmarking

Iden%fyQualityNeedsU.S. DEPARTMENT OF ENERGY • OFFICE OF ENERGY EFFICIENCY & RENEWABLE ENERGY www.build4scale.org
6
WhatThisModuleAddresses
oQualityplanningduringbetates%ngtoensurethatyouhaveacapableprocesstoproduceyourproductwhenyoudosoatscale
oAnextensivediscussionofseveralwaystostudyandanalyzethecapabilityofaproduc%onprocess
oAnexplana%onoftheSixSigmaquality-improvementmethodologyandmetrics
oWhattobenchmarkandhowbenchmarkingcanhelpyoucompareyourproductqualitywiththatofyourcompe%tors
oBusinessprac%cesofyourcompe%tors,andwhatyoucanlearnfromtheirproductsandprocessestoimproveyourcompe%%venessinthemarketplace

Iden%fyQualityNeedsU.S. DEPARTMENT OF ENERGY • OFFICE OF ENERGY EFFICIENCY & RENEWABLE ENERGY www.build4scale.org
7
WhatThisModuleAddresses
oProcesscapabilityanalysiscanbehelpfulthroughouttheproduct-developmentcycleandduringproduct-developmentac%vi%esconductedpriortomanufacturing.Itallowsyoutocomparethevariabilityofyourselectedprocesswithrespecttothedesigntolerances
oTheSixSigmaquality-improvementmethodologyisapackageofqualitytoolsandphilosophies.Itsdata-drivenimprovementcyclecanbeappliedduringanyphaseoftheproduct-developmentcycletoimproveproductqualityandreducecost.Italsoreducesthevariabilityofyourmanufacturingprocess,therebyimprovingitsoverallcapabili%esandefficiency
oUnderstandingyourcustomersandthemarketplaceprovidesthedataneededtomakeinformeddecisionsaboutdesignandmanufacturingstrategies
(cont.)
Iden%fyQualityNeedsU.S. DEPARTMENT OF ENERGY • OFFICE OF ENERGY EFFICIENCY & RENEWABLE ENERGY www.build4scale.org
8
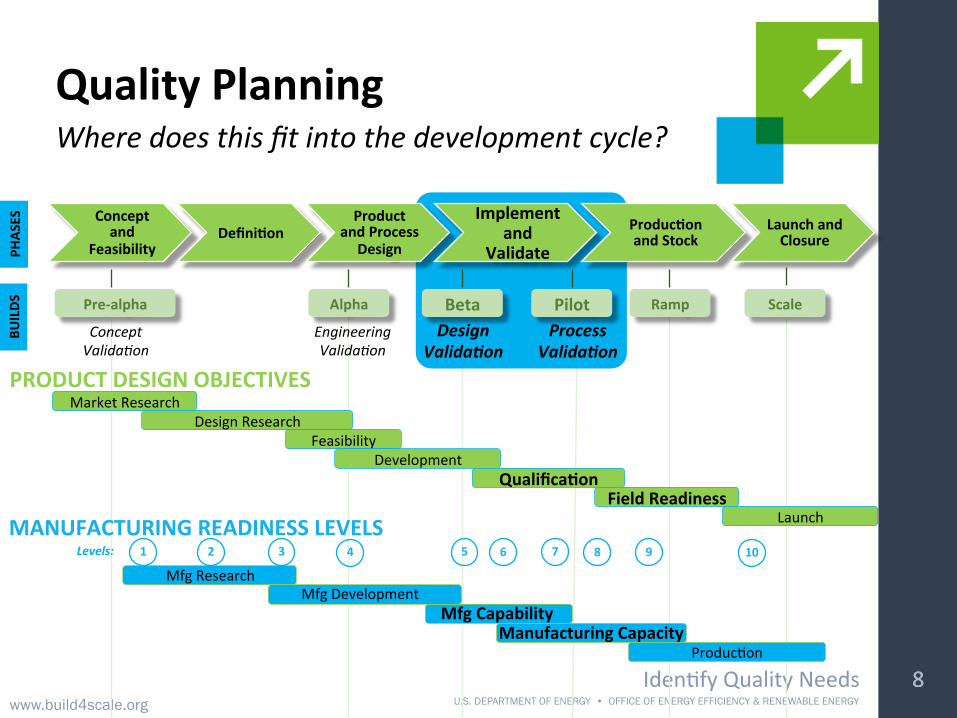
QualityPlanningWheredoesthisfitintothedevelopmentcycle?
Conceptand
FeasibilityDefini'on
ProductandProcess
Design
Implementand
ValidateProduc'onandStock
LaunchandClosure
Pre-alpha Alpha Beta Pilot Ramp Scale
PHAS
ES
BUILDS
EngineeringValidaDon
DesignValida,on
ProcessValida,on
ConceptValidaDon
8
PRODUCTDESIGNOBJECTIVESMarketResearch
DesignResearchFeasibility
DevelopmentQualifica'on
FieldReadinessLaunch
ManufacturingCapacity
MANUFACTURINGREADINESSLEVELSLevels: 109987654321
MfgDevelopmentMfgResearch
MfgCapability
Produc%on

Iden%fyQualityNeedsU.S. DEPARTMENT OF ENERGY • OFFICE OF ENERGY EFFICIENCY & RENEWABLE ENERGY www.build4scale.org
9
ProcessCapability
o Processcapabilityreferstotheabilityofaprocesstoproduceaproductthatmeetsproductsrequirements(alsodefinedasdesignspecifica%ons)
o Ahighlycapableprocessproduceshighvolumeswithfewornodefects—world-classlevelsofprocesscapabilityaremeasuredbypartspermillion(ppm)defectlevels
o Aprocessisdeemed“fullycapable”ifindividualproductunitsconsistentlymeetdesignspecifica%ons
Basics

Iden%fyQualityNeedsU.S. DEPARTMENT OF ENERGY • OFFICE OF ENERGY EFFICIENCY & RENEWABLE ENERGY www.build4scale.org
10
ProcessCapabilityAnalysisData
Processcapabilityanalysisdatausesinclude:o Predic%nghowwelltheprocesswillholdthedesignedtolerances
o Assis%ngproductdevelopersanddesignersinselec%ngormodifyingaprocess
o Assis%nginestablishinganintervalbetweensamplingforprocessmonitoring
o Specifyingperformancerequirementsfornewequipmento Selec%ngavendoro Planningthesequenceofproduc%onprocesseswhenthereisaninterac%veeffectofprocessesontolerances
o Reducingthevariabilityinamanufacturingprocess
Whatitisandhowtouseit

Iden%fyQualityNeedsU.S. DEPARTMENT OF ENERGY • OFFICE OF ENERGY EFFICIENCY & RENEWABLE ENERGY www.build4scale.org
11
o Processmean:Definedastheaverageofthesampledatacollectedfromaprocesswithrespecttothequalitycharacteris%cinques%on
o Thelowercontrollimit(LCL)andtheuppercontrollimit(UCL)accountsfortheprocessvariability
o Targetmean:Itisanaverageoflowerspecifica'onlimit(LSL)andupperspecifica'onlimit(USL)valuesspecifiedinabillofprocess
ProcessCapabilityAnalysisData
Basics
Processmean=Targetmean
LCL UCL

Iden%fyQualityNeedsU.S. DEPARTMENT OF ENERGY • OFFICE OF ENERGY EFFICIENCY & RENEWABLE ENERGY www.build4scale.org
12
o Thegoalistohavebothprocessmeanandtargetmeantomeetatthesamepoint
ProcessCapabilityAnalysisData
Centeredprocesses
Inotherwords,aprocessiscenteredifboththeprocessmean
andthetargetmeancoincideatthe
midpoint
Processmean=Targetmean
LCL UCL

Iden%fyQualityNeedsU.S. DEPARTMENT OF ENERGY • OFFICE OF ENERGY EFFICIENCY & RENEWABLE ENERGY www.build4scale.org
13
ProcessCapabilityAnalysisData
Off-centeredprocesses
Le`off-centeredprocess:Processmeanistothelejofthetargetmean,sotheprocessislikelytoproduceundersizedparts
Rightoff-centeredprocess:Processmeanistotherightofthetargetmean,sotheprocessislikelytoproduceoversizedparts

Iden%fyQualityNeedsU.S. DEPARTMENT OF ENERGY • OFFICE OF ENERGY EFFICIENCY & RENEWABLE ENERGY www.build4scale.org
14
ProcessCapabilityStudies
Problembackground:o Loca%onpinsforwork-holdingdevicesaregroundtoadiameterof12.50mm(approximately½in)withatoleranceof±0.05mm
o Theprocessiscenteredatmean12.50(µ)andthedispersionis0.02mm(σ)a) Whatpercentageoftheproductmustbescrapped,andwhat
percentagecanbereworked?b) Howcantheprocesscenterbechangedtoeliminatethe
scrap?Whatisthereworkpercentage?
Example
12.50±0.05mm
Iden%fyQualityNeedsU.S. DEPARTMENT OF ENERGY • OFFICE OF ENERGY EFFICIENCY & RENEWABLE ENERGY www.build4scale.org
15
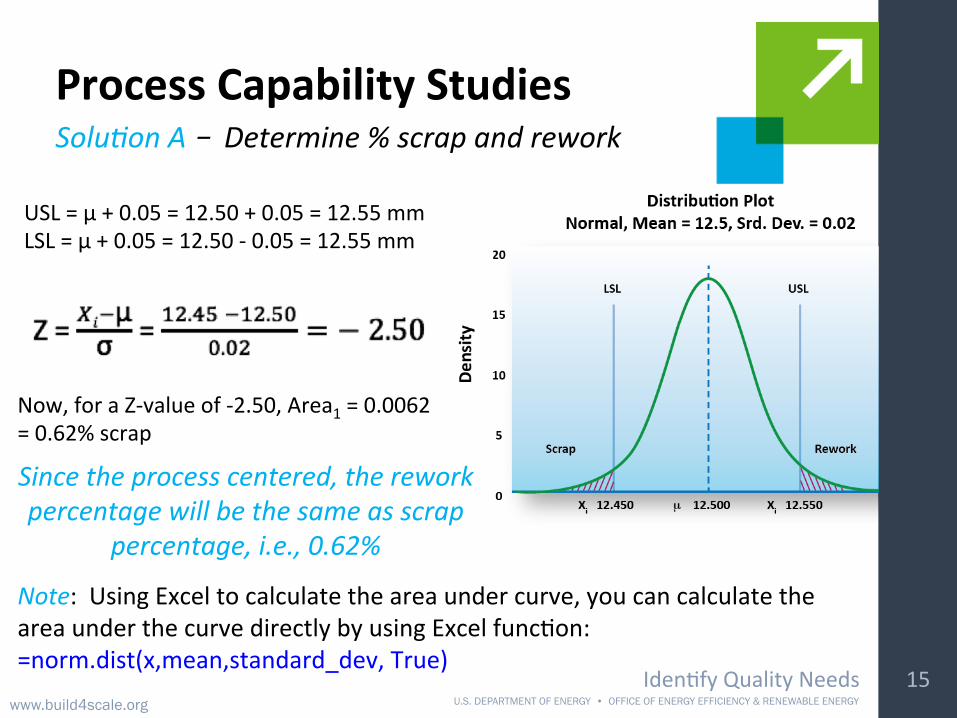
ProcessCapabilityStudiesSoluDonA–Determine%scrapandrework
Note:UsingExceltocalculatetheareaundercurve,youcancalculatetheareaunderthecurvedirectlybyusingExcelfunc%on:=norm.dist(x,mean,standard_dev,True)
Sincetheprocesscentered,thereworkpercentagewillbethesameasscrap
percentage,i.e.,0.62%
USL=μ+0.05=12.50+0.05=12.55mmLSL=μ+0.05=12.50-0.05=12.55mm
Now,foraZ-valueof-2.50,Area1=0.0062=0.62%scrap

Iden%fyQualityNeedsU.S. DEPARTMENT OF ENERGY • OFFICE OF ENERGY EFFICIENCY & RENEWABLE ENERGY www.build4scale.org
16
ProcessCapabilityStudies
Note:Usually,youneedtocalculateZ-scoreforLSL(12.450mm)andUSL(12.550)andthendeterminetheprobabilityseparately.However,sincethisprocessiscentered,youcancalculatetheprobabilityforLSL,andthenusingsymmetry,calculatetheprobabilityforUSL.
SoluDonA–Determine%scrapandrework(cont.)

Iden%fyQualityNeedsU.S. DEPARTMENT OF ENERGY • OFFICE OF ENERGY EFFICIENCY & RENEWABLE ENERGY www.build4scale.org
17
Note:Scrapapartonlywhenitisundersizedbecauseifitisoversizedyoucanreworkittothespecifica%on.ThatmeansareaonthelejoutsideofLSLshouldbezero.Ifweuse0(ornearzero)valueforareaandcalculateZ-score,wegetz=–3.59.Now,plugthisnewZ-valueintogetthenewmean.-3.59=i.e.=12.52mm
Percentageofrework:Z==
So,Area3=0.9332Area2=AreaT-Area3=1.0000–0.9332=0.0668=6.68%Thus,theamountofreworkis6.68%Note:thepercentageofreworkissignificantlyhigherforanoff-centeredprocessthanforthatofthecenteredcaseinsolu%onA
SoluDonB–Eliminatescrap/changeprocesscenterProcessCapabilityStudies

Iden%fyQualityNeedsU.S. DEPARTMENT OF ENERGY • OFFICE OF ENERGY EFFICIENCY & RENEWABLE ENERGY www.build4scale.org
18
ProcessCapabilityIndex
o Mathema%cally,theprocesscapabilityismeasuredbyitsprocesscapabilityindex(Cp),whichisdefinedasfollows:
— LSLandUSLarethelowerandupperspecifica%onlimits,respec%vely
— The6σspreadisthenaturaltoleranceintervaloftheprocess
Basics

Iden%fyQualityNeedsU.S. DEPARTMENT OF ENERGY • OFFICE OF ENERGY EFFICIENCY & RENEWABLE ENERGY www.build4scale.org
19
o Controllimitsrepresenttheprocessspread(variability),whereasspecifica%onlimitsrepresentthedesigntolerancedefinedintheBOP
o Foraprocesstobecapable,controllimitsshouldbewellinsidethespecifica%onlimits
DifferentCapabilityProcessesExamples
LCL=LowerControlLimitUCL=UpperControlLimitLSL=LowerSpecifica%onLimitUSL=UpperSpecifica%onLimit
Acapableprocess
Abarelycapablebutuncertainprocess
Anincapableprocess

Iden%fyQualityNeedsU.S. DEPARTMENT OF ENERGY • OFFICE OF ENERGY EFFICIENCY & RENEWABLE ENERGY www.build4scale.org
20
CpCalcula'ons
o Thequalitycharacteris%c(thedesignspecifica%oninques%on)hasanormaldistribu%on
o Theprocessisinsta%s%calcontrolo Incaseoftwo-sidedspecifica%ons,theprocessmeaniscenteredbetweentheLSLandUSL
o Ifanyoftheaboveassump%onsarenotvalid,Cpwouldnotbeareliablemeasuretodeterminethecapabilityofaprocess
KeyassumpDons

Iden%fyQualityNeedsU.S. DEPARTMENT OF ENERGY • OFFICE OF ENERGY EFFICIENCY & RENEWABLE ENERGY www.build4scale.org
21
ProcessCapabilityIndex
o Asstatedearlier,ifaprocessisnotcenteredthenCpshouldnotbeused
o Theappropriateprocesscapabilityindexforanoff-centeredprocessisCpk,whichisdefinedasfollows:
Off-centeredprocess
),min( puplpk CCC =
σµ3LSLCpl
−=
σµ
3−
=USLCpu
Iden%fyQualityNeedsU.S. DEPARTMENT OF ENERGY • OFFICE OF ENERGY EFFICIENCY & RENEWABLE ENERGY www.build4scale.org
22
ProcessCapabilityIndex
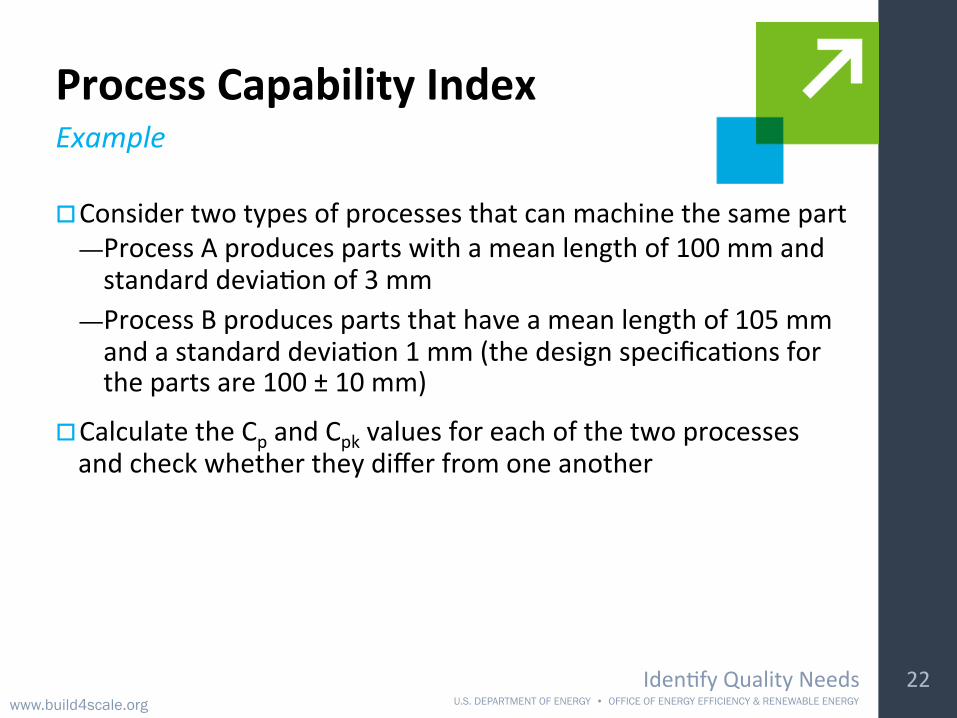
o Considertwotypesofprocessesthatcanmachinethesamepart— ProcessAproducespartswithameanlengthof100mmandstandarddevia%onof3mm
— ProcessBproducespartsthathaveameanlengthof105mmandastandarddevia%on1mm(thedesignspecifica%onsforthepartsare100±10mm)
o CalculatetheCpandCpkvaluesforeachofthetwoprocessesandcheckwhethertheydifferfromoneanother
Example
Iden%fyQualityNeedsU.S. DEPARTMENT OF ENERGY • OFFICE OF ENERGY EFFICIENCY & RENEWABLE ENERGY www.build4scale.org
23
ProcessCapabilityIndex
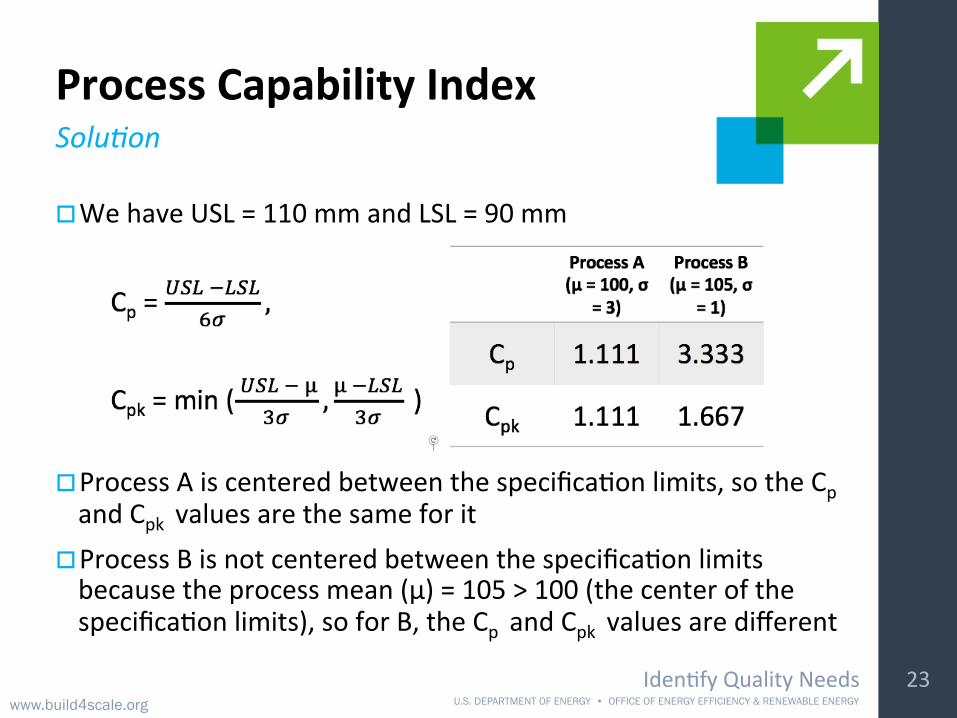
o WehaveUSL=110mmandLSL=90mm
o ProcessAiscenteredbetweenthespecifica%onlimits,sotheCpandCpkvaluesarethesameforit
o ProcessBisnotcenteredbetweenthespecifica%onlimitsbecausetheprocessmean(µ)=105>100(thecenterofthespecifica%onlimits),soforB,theCpandCpkvaluesaredifferent
SoluDon
Iden%fyQualityNeedsU.S. DEPARTMENT OF ENERGY • OFFICE OF ENERGY EFFICIENCY & RENEWABLE ENERGY www.build4scale.org
24
ProcessCapabilityIndex
o TheCpandCpkarebothprocesscapabilityindicesthatpredictthepoten%alcapabilityoftheprocesstomeettherequiredspecifica%ons
o TheCpcomparesthetotalpredictedprocessvaria%on(definedas±3standarddevia%ons)totheallowableprocessvaria%on(specifica%onlimits)
o TheCpkcomparestheactualprocesscenterandspreadtothenominalortargetprocesscenterandspread— Cpkisbasedonthedistancefromtheprocessmeantothenearest,andthereforetheriskiestlimit,sothesmallestvalueisalwaysselected
Summary

Iden%fyQualityNeedsU.S. DEPARTMENT OF ENERGY • OFFICE OF ENERGY EFFICIENCY & RENEWABLE ENERGY www.build4scale.org
25
SixSigma
SixPhases(eachhasaspecificpurposeandisdeliverable):o Defineo Measureo Analyzeo Improveo Control
Methodology
SixSigmaprocessimprovementmethodology=
DMAICmethodology

Iden%fyQualityNeedsU.S. DEPARTMENT OF ENERGY • OFFICE OF ENERGY EFFICIENCY & RENEWABLE ENERGY www.build4scale.org
26
SixSigma
SixSigmametrics:o Defect:anythingoutsideofcustomerspecifica%onsthatispassedontoacustomer
o Defectsperunit(DPU):numberofdefectsdiscovereddividedbynumberofunitsproduced
o Defectspermillionopportuni'es(DPMO):DPU×1,000,000÷opportuni%esforerror
o UseofDPMOallowsustobroadlydefinequalityExample:intheairlineindustry,itcoverseveryopportunityforafailuretomeetcustomerexpecta%onsrightfromini%al%cke%ngun%lbagsarereceivedajercomple%ngthejourneyo Sixsigmamethodologyrepresentsaqualitylevelofatmost3.4DPMO
Basics

Iden%fyQualityNeedsU.S. DEPARTMENT OF ENERGY • OFFICE OF ENERGY EFFICIENCY & RENEWABLE ENERGY www.build4scale.org
27
SixSigma
Purpose:o Establishaclearandcompellingreasonforimprovingtheprocessorproductbasedonthefollowing:— Voiceofcustomer— Stakeholderrequirements— Gapincurrentprocesscapability
Deliverable:o Chargethatincludesthecurrentobservableproblems,goalsfortheproject,andinforma%onthatwillguidetheteam
o Outlineofcustomerexpecta%on/failuredata,performancegap;clearstatementoftheperceivedproblemwrizenusingSMART
Definephase
Specific,Measurable,AXainable,Results-oriented,Timely

Iden%fyQualityNeedsU.S. DEPARTMENT OF ENERGY • OFFICE OF ENERGY EFFICIENCY & RENEWABLE ENERGY www.build4scale.org
28
SixSigma
Purpose:o Tofactuallyunderstandtheproblemo Collec%onofdatawillnarrowtherangeofpoten%alcauseso Uselaterinthe“Analyze”stepDeliverable—Anamendedbusinesscasethatincludes:o Flowchart:an“as-is”processchecksheetfordatacollec%ono Datacollec'on:completedanddisplayedo Costsofthecurrentprocesso Keymetrics:themeasurablequalitystandardso Performancematrix:currentprocessdetailsExamples:processstep,inputs,outputs,keysuccessfactors,performancemeasurement,andstandards/goals
Measurephase

Iden%fyQualityNeedsU.S. DEPARTMENT OF ENERGY • OFFICE OF ENERGY EFFICIENCY & RENEWABLE ENERGY www.build4scale.org
29
AerospaceTankQualityDefectsExample–ChecksheetforidenDfyingdefects
CHECKSHEETDEFECTDATAFOR2002-2003YTD
PartNo:TAX-41Location:BellevueStudyDate:6/5/03 2002 2003Analyst:TCB
Defect 1 2 3 4 5 6 7 8 9 10 11 12 1 2 3 4 5 TotalIncorrectdimensions 13 7 13 1 1 1 36Partsdamaged 1 3 1 2 1 10 3 2 2 7 2 34Machiningproblems 3 3 1 8 3 8 3 29Maskinginsufficient 3 6 4 3 1 17Suppliedpartsrusted 1 1 2 9 13Adhesivefailure 1 1 2 1 1 6Salt-sprayfailure 4 2 6Filmonparts 3 1 1 5Processingoutoforder 2 2 4Wrongpartissued 1 2 3Unfinishedfairing 3 3Misalignedweld 2 2Paintoutoflimits 1 1 2Voidsincasting 1 1 2Delaminatedcomposite 2 2Powderyalodine 1 1Paintdamagedbyetching 1 1Primercansdamaged 1 1Impropertestprocedure 1 1TOTAL 4 5 14 12 5 9 9 6 10 14 20 7 29 7 7 8 2 168
NumberofOccurrences
ListofD
efects

Iden%fyQualityNeedsU.S. DEPARTMENT OF ENERGY • OFFICE OF ENERGY EFFICIENCY & RENEWABLE ENERGY www.build4scale.org
30
SixSigma
Purpose:o Tomakesenseofallthedatagatheredinthe“Measure”phase;andtousethatdatatodiscoverareasofdelay,waste,poorquality,andhighcosts
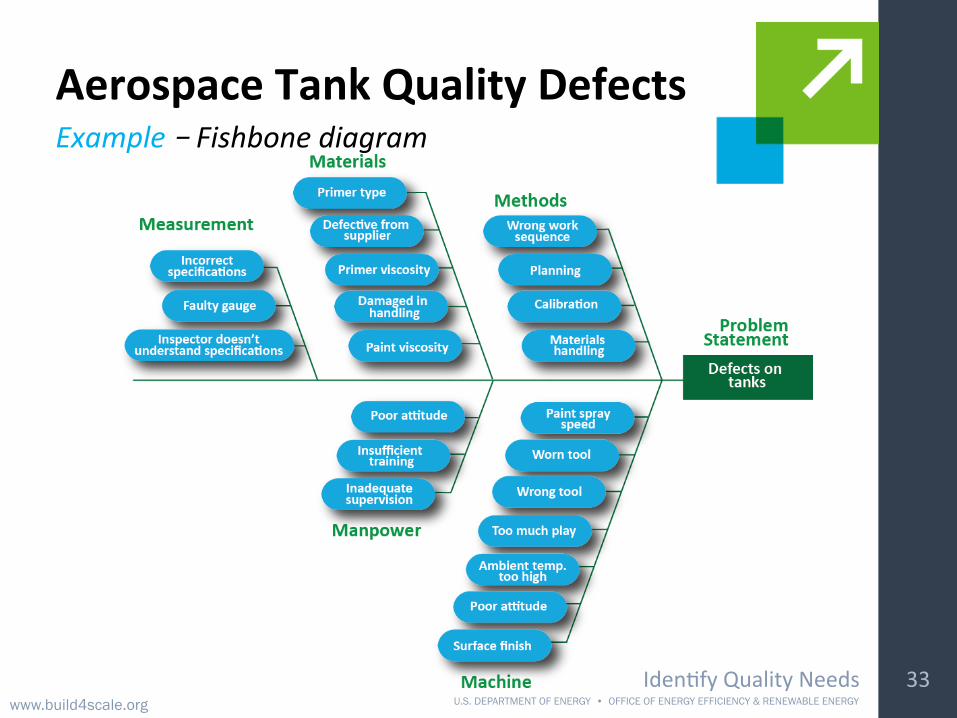
o Toiden%fyandverifytherootcauseofaproblemDeliverable—Anamendedbusinesscasethatincludes:o Listofproblemsthatareresponsibleforthedefectsoccurringinthesystem/processinanIshikawa“fishbone”diagram
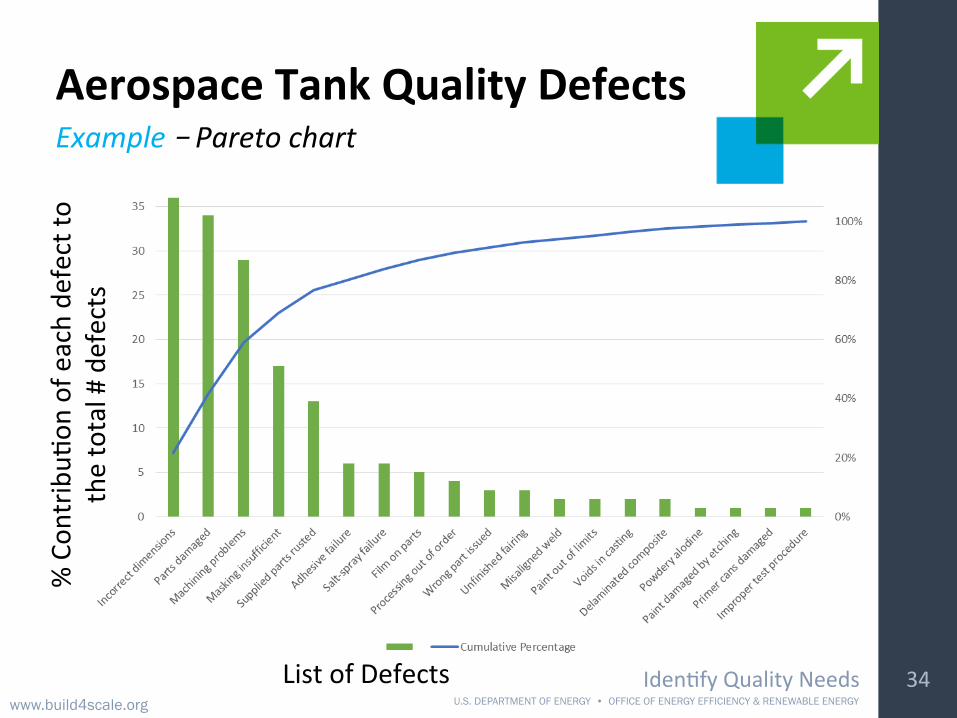
o Rootcauseanalysis(orcauseandeffectanalysis)o Paretochart(chartoffrequency)ofrootcauses
Analyzephase

Iden%fyQualityNeedsU.S. DEPARTMENT OF ENERGY • OFFICE OF ENERGY EFFICIENCY & RENEWABLE ENERGY www.build4scale.org
o Acauseandeffectdiagramisdesignedtohelpworkersfocusonthecausesofaproblemratherthanthesymptoms
o Thediagramlooksliketheskeletonofafish,withtheproblembeingtheheadofthefish,majorcausesbeingtheribs,andminorcausesformingthesmallerbonesoftheribs(Therefore,itisalsoknownas“fishbone”diagram)
o Fishbonediagramsarecreatedduringbrainstormingsessions 31
AnalysisToolsCauseandeffectdiagrambasics
Category Category Category
Category Category Category
Problem(Symptom)
Poten%alCause
Poten%alCause
Poten%alCause
Poten%alCause
Poten%alCause
Poten%alCausePoten%alCause
Poten%alCause
Poten%alCause
Poten%alCause
Poten%alCausePoten%alCause
Poten%alCause
Poten%alCause

Iden%fyQualityNeedsU.S. DEPARTMENT OF ENERGY • OFFICE OF ENERGY EFFICIENCY & RENEWABLE ENERGY www.build4scale.org
32
Cause/Effect(Fishbone)Diagram
1. Statetheproblemclearlyinthe“headofthefish”2. Drawthebackboneandribs— Askthepar%cipantsinthebrainstormingsessiontoiden%fymajorcausesoftheproblemlabeledintheheadofthediagram(Ifpar%cipantshavetroubleiden%fyingmajorproblemcategories,itmaybehelpfultousematerials,machines,people,andmethodsaspossiblebones)
3. Con%nuetofilloutthefishbonediagram,asking“Why?”abouteachproblemorcauseofaproblemun%lthediagramisfilledout—Usually,ittakesnomorethanfivelevelsofquesDoningtogettorootcauses;hence,the“Fivewhys”
4. Viewthediagramandiden%fyrootcauses5. Setgoalstoaddresstherootcauses
Step-by-step
Iden%fyQualityNeedsU.S. DEPARTMENT OF ENERGY • OFFICE OF ENERGY EFFICIENCY & RENEWABLE ENERGY www.build4scale.org
33
AerospaceTankQualityDefectsExample–Fishbonediagram
Iden%fyQualityNeedsU.S. DEPARTMENT OF ENERGY • OFFICE OF ENERGY EFFICIENCY & RENEWABLE ENERGY www.build4scale.org
34
AerospaceTankQualityDefectsExample– Paretochart
ListofDefects
%Con
tribu%
onofe
achde
fectto
thetotal#defects

Iden%fyQualityNeedsU.S. DEPARTMENT OF ENERGY • OFFICE OF ENERGY EFFICIENCY & RENEWABLE ENERGY www.build4scale.org
35
SixSigma
Purpose:o Togenerate,pilot,andimplementviablesolu%onsthataddresstherootcauses—thesolu%on(s)shouldhavethefollowingcharacteris%cs:— Effec%veinperformingcorrec%veac%on— Financiallyfeasibletocreateafavorablecost/benefitposi%on— Acceptablebyotherpartsoftheorganiza%on.
Deliverable—Anamendedbusinesscasethatincludes:o Alterna%vesolu%onsandtheirrelatedcost-benefitanalysis(CBA)o Pilottes%ngofhigh-impact,cost-efficientsolu%onso A“shouldbe”processmap/flowchartandcostmodelbasedonapilot
Improvephase

Iden%fyQualityNeedsU.S. DEPARTMENT OF ENERGY • OFFICE OF ENERGY EFFICIENCY & RENEWABLE ENERGY www.build4scale.org
36
TypesofImprovements
o Simplifica%onofprocesso Changesinstaffingscheduleso Improvedtrainingo Changesinlevelofstaffingo Systemupgradesandreprogrammingo Upgradedequipmento Newmanagementtechniques
Examples-Generic

Iden%fyQualityNeedsU.S. DEPARTMENT OF ENERGY • OFFICE OF ENERGY EFFICIENCY & RENEWABLE ENERGY www.build4scale.org
37
SixSigma
Purpose:o TosustainandcontrolfutureprocessperformanceDeliverable—Anamendedbusinesscasethatincludes:o Adocumentedmeasuringandmonitoringplanformaintainingstandardizedprocessesandprocedures,andreducedcosts
o Adocumentedtransferofownershiptotheprocessownerandmanagementteam
o Whycustomerscanexpectreliabilityandhowtheimprovementwillbesustainedover%me
Controlphase

Iden%fyQualityNeedsU.S. DEPARTMENT OF ENERGY • OFFICE OF ENERGY EFFICIENCY & RENEWABLE ENERGY www.build4scale.org
38
ControlHand-Offs
Documentthefollowing:o Newqualitystandardso Responsibilityand%melineforfullimplementa%ono Methodstomeasurecustomersa%sfac%ono Methodstomeasureprocesscontrolandcapabilityo Expecta%onsforprogressreports

Iden%fyQualityNeedsU.S. DEPARTMENT OF ENERGY • OFFICE OF ENERGY EFFICIENCY & RENEWABLE ENERGY www.build4scale.org
39
Benchmarking
Voiceofthemarket:o Customersarenottheonlysourceofinforma%onaboutthemarket
o Oneofthebestsourcesofinforma%oncanbeothercompanieso Byunderstandingourcompe%tors,webegintounderstandthemarketplacebezerandwhatittakestocompetesuccessfullyinthemarketplace
Quality

Iden%fyQualityNeedsU.S. DEPARTMENT OF ENERGY • OFFICE OF ENERGY EFFICIENCY & RENEWABLE ENERGY www.build4scale.org
40
Benchmarking
o Benchmarkingissharingofinforma%onbetweencompaniessothatbothcanimprove
o Benchmarkingprocessinvolvesmul%pleorganiza%ons,includingabenchmarkthatyouaretryingtofollowforimprovementofyourproductorprocess
o Abenchmarkisanorganiza%onrecognizedforitsexemplaryopera%onalperformance
o TherearemanybenchmarksintheworldincludingToyotaforprocesses,Intelfordesign,Motorolafortraining,ScandinavianAirlinesforservice,andHondaforrapidproductdevelopment
o Par%estobenchmarkingrela%onships:— Theini%atorfirm(you)— Thetargetfirm(benchmark)
Process

Iden%fyQualityNeedsU.S. DEPARTMENT OF ENERGY • OFFICE OF ENERGY EFFICIENCY & RENEWABLE ENERGY www.build4scale.org
41
Benchmarking
Processbenchmarking:o Thegoalistoiden%fyandobservebestprac%cesonbusinessprocesses
Financialbenchmarking:o Thegoalistoperformfinancialanalysisandcomparetheresultsinanefforttoassessyouroverallcompe%%veness
Performancebenchmarking:o Allowsini%atorfirmstoassesstheircompe%%veposi%onbycomparingproductsandserviceswithtargetfirms
Types

Iden%fyQualityNeedsU.S. DEPARTMENT OF ENERGY • OFFICE OF ENERGY EFFICIENCY & RENEWABLE ENERGY www.build4scale.org
42
Benchmarking
Productbenchmarking:o Manyfirmsperformproductbenchmarkingwhendesigningnewproductsorupgradestocurrentproducts(ojenincludesreverseengineering)
Strategicbenchmarking:o Involvesobservinghowotherscompete(thefocusistoiden%fythemixofstrategiesthatmakefirmssuccessfulcompe%tors)
Func'onalbenchmarking:o Involvesacompanyfocusingitsbenchmarkingeffortsonasinglefunc%ontoimprovetheopera%onofthatfunc%on
Types(cont.)

Iden%fyQualityNeedsU.S. DEPARTMENT OF ENERGY • OFFICE OF ENERGY EFFICIENCY & RENEWABLE ENERGY www.build4scale.org
43
BenchmarkingRoadmap
Source:NaDonalAcademiesofScienceshXps://www.nap.edu/read/11344/chapter/5
DetermineWhattoBenchmark(Cri'calSuccessFactors)
DefinetheMetrics
DevelopDataCollec'onMethodology
Ins'tu'onalizeasPartofCon'nuousImprovement
Program
Iden'fyPerformanceandPrac'ceUseGap
CollectData
IntegrateBestPrac'cesintoProjectDeliveryProcesses
DevelopAc'onPlan(SelectPrac'cestoNarrowGap)
Iden'fyReasonsforDeficiencies
(RootCauseforGap)

Iden%fyQualityNeedsU.S. DEPARTMENT OF ENERGY • OFFICE OF ENERGY EFFICIENCY & RENEWABLE ENERGY www.build4scale.org
44
Benchmarking
Selec'oncriteria:o Oncewedeterminewhattobenchmark,thenextstepistoiden%fythebenchmarks
o Theselec%oncriteriaforabenchmarkingpartnerprimarilydependsuponthepurposeofbenchmarking
o Forproductqualityandserviceperformance,usuallyyoubenchmarkagainstdirectcompe%tors
Partners

Iden%fyQualityNeedsU.S. DEPARTMENT OF ENERGY • OFFICE OF ENERGY EFFICIENCY & RENEWABLE ENERGY www.build4scale.org
45
Benchmarking
Forprocessbenchmarking,youcanbenchmarkthefollowingorganiza'ons:o Internalbenchmarking(differentdepartmentsorbusinessunitswithinthesamecompany)
o Compe%torso Companiesinthesameindustrysectorwithsimilarproductandbusinesscharacteris%cs
o Companiesindifferentindustrysectorsbutwithsimilarprocesses(orderplacement,lead%memanagement,customersupportsystems,etc.)
Partners(cont.)
Iden%fyQualityNeedsU.S. DEPARTMENT OF ENERGY • OFFICE OF ENERGY EFFICIENCY & RENEWABLE ENERGY www.build4scale.org
46
References
o Foster,S.T.,QualityManagement.Fijhedi%on,PearsonPublica%ons,2013
o Besterfield,D.H.,QualityImprovement.NinthEdi%on,PearsonPublica%ons,2013
o Montgomery,D.C.,IntroducDontoStaDsDcalQualityControl.Seventhedi%on,WileyPublica%ons,2013

Iden%fyQualityNeedsU.S. DEPARTMENT OF ENERGY • OFFICE OF ENERGY EFFICIENCY & RENEWABLE ENERGY www.build4scale.org
47
ListofAcronyms
o DMAIC–Define-Measure-Analyze-Improve-Controlo MRL–ManufacturingReadinessLevelo PPM–PartsPerMilliono CL–ControlLimito LCL–LowerControlLimito UCL–UpperControlLimito SL–Specifica%onLimito LSL–LowerSpecifica%onLimito USL–UpperSpecifica%onLimit

Iden%fyQualityNeedsU.S. DEPARTMENT OF ENERGY • OFFICE OF ENERGY EFFICIENCY & RENEWABLE ENERGY www.build4scale.org
48
ListofAcronyms
o DPU–DefectsPerUnito DPMO–DefectsPerMillionOpportuni%eso SMART–Specific-Measurable-Azainable-Results-oriented-Timely
o BOP–BillOfProcess

Glossary
Module 6D
Voice of the Customer is a term used in business and Information Technology (through ITIL, for
example) to describe the in-depth process of capturing customer's expectations, preferences
and aversions.
Benchmarking is comparing one's business processes and performance metrics to industry
bests and best practices from other companies.
Process Benchmarking is when the initiating firm focuses its observation and investigation of
business processes with a goal of identifying and observing the best practices from one or more
benchmark firms. Activity analysis will be required where the objective is to benchmark cost
and efficiency; increasingly applied to back-office processes where outsourcing may be a
consideration.
Financial Benchmarking is performing a financial analysis and comparing the results in an effort
to assess your overall competitiveness and productivity.
Performance Benchmarking allows the initiator firm to assess their competitive position by
comparing products and services with those of target firms.
Product Benchmarking is the process of designing new products or upgrades to current ones.
This process can sometimes involve reverse engineering which is taking apart competitors
products to find strengths and weaknesses.
Strategic Benchmarking involves observing how others compete. This type is usually not
industry specific, meaning it is best to look at other industries.
Functional Benchmarking is when a company will focus its benchmarking on a single function
to improve the operation of that particular function.
Six-Sigma is a set of techniques and tools for process improvement.
Pareto Chart is a type of chart that contains both bars and a line graph, where individual values
are represented in descending order by bars, and the cumulative total is represented by the
line.
Defects Per Million Oopportunities (DPMO) is a measure of process performance.

Process Validation is the analysis of data gathered throughout the design and manufacturing of
a product in order to confirm that the process can reliably output products of a determined
standard.
Design Validation is testing aimed at ensuring that a product or system fulfills the defined user
needs and specified requirements, under specified operating conditions.
Process Mean is the average of the sample data collected from a process with respect to the quality characteristic in question
Lower Control Limit (LCL) is the bottom limit in quality control for data points below the control
(average) line in a control chart. Opposite of upper control limit.
Specification Limit are boundaries or parameters that define acceptable performance for a
process expressed as a target limit as well as an upper and lower limit.
Upper Specification Limit (USL)is a value that represents the highest range of a variable. The
upper specification limit is the benchmark below which a product or service performs.
Target Mean is an average of lower specification limit (LSL) and upper specification limit (USL) values specified in a bill of process.
Qualification is either the process of qualifying for an achievement, or a credential attesting to
that achievement.
Field Readiness is the stage of development just prior to final launch. It is time to review the Pilot run and determine if there are any “game stopper” issues.
Manufacturing Capacity is the volume of products or services that can be produced by an
enterprise using current resources. Three commonly used definitions of capacity are as follows:
design capacity, effective capacity & actual output. (Repeat from 2B)
Left Off-Centered Process mean is to the left of the target mean, so the process is likely to
produce undersized parts.
Right Off-Centered Process mean is to the right of the target mean, so the process is likely to
produce oversized parts.
Defect is a physical, aesthetic, or functional attribute of a product or service that exhibits that
the product or service failed to meet one of the desired specification.
Defects Per Unit (DPU) is a metric used in Six Sigma and other process improvement
methodologies. The observed defects per unit value is used to calculate the Defects per Million

Opportunities value for a process, which in turn is used to assess the overall quality of the
process output and to determine areas in which the process can be improved.
Deliverable is a tangible or intangible good or service produced as a result of a project that is
intended to be delivered to a customer (either internal or external)
Flowchart is a type of diagram that represents an algorithm, workflow or process, showing the
steps as boxes of various kinds, and their order by connecting them with arrows.
Data Collection is the process of gathering and measuring information on targeted variables in
an established systematic fashion, which then enables one to answer relevant questions and
evaluate outcomes.
Key metric are the measurable quality standards according to six sigma standards.
Performance Metric also called KPI's (Key Performance Indicators) focuses on how the task is
being performed by measuring performance and if individual goals are being achieved. A widely
used tool to assist in determining these goals is the Balanced Scorecar re the current process
details.
Pareto Chart is a type of chart that contains both bars and a line graph, where individual values
are represented in descending order by bars, and the cumulative total is represented by the
line.
DMAIC – Define-Measure-Analyze-Improve-Control refers to a data-driven improvement cycle
used for improving, optimizing and stabilizing business processes and designs.
MRL – Manufacturing Readiness Level is a measure developed by the United States
Department of Defense (DOD) to assess the maturity of manufacturing readiness, similar to
how technology readiness levels (TRL) are used for technology readiness.
PPM – Parts Per Million is the concentration by volume of one part of a gas (or vapor), or by
weight of a liquid or solid, per million parts of air or liquid.
CL – Control Limit also known as natural process limits, are horizontal lines drawn on a
statistical process control chart, usually at a distance of ±3 standard deviations of the plotted
statistic from the statistic's mean. Control limits are used to detect signals in process data that
indicate that a process is not in control and, therefore, not operating predictably.
LCL – Lower Control Limit is the bottom limit in quality control for data points below the
control (average) line in a control chart. Opposite of upper control limit.

UCL – Upper Control Limit is a value that indicates the highest level of quality acceptable for a
product or service. The upper control limit is used in conjunction with the lower control limit to
create the range of variability for quality specifications, enabling those within the organization
to provide an optimal level of excellence by adhering to the established guidelines.
SL – Specification Limit boundaries or parameters that define acceptable performance for a
process expressed as a target limit as well as an upper and lower limit.
LSL – Lower Specification Limit is the lowest level of process performance or product quality
that is within the acceptable range defined by customer standards and measurements of
defects in the process or product itself.
USL – Upper Specification Limit is a value that represents the highest range of a variable. The
upper specification limit is the benchmark below which a product or service performs.
SMART (specific, measurable, action oriented, reasonable, timely) goal is a written statement that describes what needs to be done to work toward a specific change, ultimately creating success and improvement. Specific – Specific goals are more likely to be achieved than nonspecific goals….. BOP – Bill of Process is a best practices template for production comprised of detailed plans
explaining the manufacturing processes for a particular product. Within these plans resides in-
depth information on machinery, plant resources, equipment layout, configurations, tools, and
instructions. (Repeat from 2A)