Embed Size (px)
Citation preview
Annals of Nuclear Energy 36 (2009) 1560–1573
Contents lists available at ScienceDirect
Annals of Nuclear Energy
journal homepage: www.elsevier .com/locate /anucene
Regulation of nuclear power plants a multi objective approach
Alok Mishra a,*, Mahesh D. Pandey a, Ashok Chauhan b
a Institute for Risk Research, CPH-3381, University of Waterloo, 200 University Avenue West, Waterloo, Ontario, Canadab Nuclear Power Corporation of India Limited, Mumbai 400094, India
a r t i c l e i n f o a b s t r a c t
Article history:Received 16 September 2007Received in revised form 19 July 2009Accepted 21 July 2009Available online 26 August 2009
0306-4549/$ - see front matter � 2009 Elsevier Ltd. Adoi:10.1016/j.anucene.2009.07.014
* Corresponding author. Tel.: +1 713 478 6935; faxE-mail address: [email protected] (A. Mishra).
The regulation of nuclear power plant (NPP) is evolving in a direction to harmonize probabilistic safetycriteria in the near future. The utilities will not only have to demonstrate that they are operating belowa target risk level but also to demonstrate that the unavailability of some of the critical safety systems arebelow a specified level. In order to satisfy the Technical Specification and Maintenance (TS&M) require-ments in a cost effective manner multi-objective optimization of TS&M requirements is of profoundinterest. The constrained multi-objective optimization of the TS&M requirements of a nuclear powerplant (NPP) based on risk and cost gives the pareto-optimal solutions, from which the utility can picksuitable decision variables. The paper presents a multi objective genetic algorithm (GA) technique toinvestigate a trade-off between risk and cost both at the system and the plant level for Loss of CoolantAccident (LOCA) and Main Steam Line Break (MSLB) as initiating events in a NPP.
� 2009 Elsevier Ltd. All rights reserved.
1. Introduction
The probabilistic safety criteria (PSC) has been gaining grounds(IAEA-TECDOC-529, 1989) in several countries and there is anincreasing trend in recent years for the regulators to imposerequirement for a nuclear power plant utility to demonstrate thata particular safety system/function meets a specific reliability goal,apart from the plant as a whole meeting a specified risk level. A pri-mary implication of this approach is that the nuclear regulatoryauthorities tend to use probabilistic safety criteria to evaluate thereliability of specific safety systems and functions to determine ifreliability improvements would be justified. In these cases the pri-mary criteria have been derived from top-level goals relating tocore damage probability or cost/benefit considerations in whichthe benefit is estimated in terms of averted economic losses result-ing from an accident. The requirement of a probabilistic safety cri-terion in a way guarantees the top-level requirement of a limitingcore damage frequency. Thus a nuclear power plant should havelower than a specified level of core damage frequency and addi-tionally some of the critical safety systems should have unavail-ability lower than a specified value.
The development of efficient testing and maintenance strategies(surveillance testing interval, preventive maintenance period, al-lowed outage time and over-haul period of components) has beenaimed at ensuring high levels of system availability, which areimplemented at NPP through Technical Specification and Mainte-nance (TS&M) Requirements. Technical specifications (TSs) definethe limits and conditions for operating NPPs in a manner that is
ll rights reserved.
: +1 519 725 4834.
consistent with the evaluations in the plant’s safety analysis report.The general goal of effective acceptable regulations will be to makerequirements and activities more cost-effective by using the riskinformation to focus better on activities important for risk reduc-tion. The resource versus risk-control effectiveness principles for-mally enter in optimization problems where the cost or theburden is to be minimized simultaneously with the risk or perfor-mance. This relationship applies when TS&M activities (surveil-lance testing interval (STI), allowed outage time (AOT), preventivemaintenance (PM) frequency) are optimized to minimize both thecost and the unavailability of safety-related systems or plant risk,taking TS&M-related parameters as the decision variables.
In the past, normally, the resolution of such a kind of optimiza-tion problem has been limited to focus only on a single parameter(STI, AOT, PM frequency, etc.) and/or adopting a single optimiza-tion criterion (availability, costs, plant risks, etc.) (Painton andCampbell, 1995; Vaurio, 1995; Harunuzzaman and Aldemir,1996; Muñoz et al., 1997; Levitin and Lisnianski, 1999; Martorellet al., 2002; Yang et al., 2000). Thus, though the problems posedare multi-objective in nature but they were solved as a singleobjective problem with constraints. Thus, it is concluded that theearlier models explained as above either lack in considering allthe TS&M parameters as the decision variables or are not devel-oped to adequately address the plant model. Moreover, none ofthe models addressed the probabilistic safety criteria, which islikely to be in force in the new regime of regulations. The decisionmaking in multi-objective optimization problem is always a trickyissue.
In this paper multi-objective optimization problems are solvedboth at the system level (High Pressure Safety Injection System(HPSI), Low Pressure Safety Injection System (LPSI) and Steam
A. Mishra et al. / Annals of Nuclear Energy 36 (2009) 1560–1573 1561
Generator Emergency Cool-Down System (SG-ECD)) for unavail-ability and cost and at the plant level (Loss of Coolant Accident(LOCA) and Main Steam Line Break (MSLB)) for core damage fre-quency and cost. The constrained multi-objective optimizationproblems are solved with an objective to minimize cost and coredamage frequency and to ensure that some of the safety criticalsystems have unavailability below a certain specified level withan objective to meet the probabilistic safety criteria. Two postu-lated initiating events LOCA and MSLB of a PWR plant have beenconsidered for the analysis. The optimization study has been doneto decide the surveillance test interval STI), allowed outage time(AOT), the preventive maintenance (PM) period and the replace-ment/over-haul time of components, such that the risk (CDF dueto the initiating event) and the cost of maintaining the requiredavailability of the systems are optimized. A multi objective geneticalgorithm technique has been used to arrive at the pareto-optimalsolution, for optimizing both risk and cost. The unavailability of theHigh Pressure Safety Injection System, the Low Pressure SafetyInjection System and the Steam Generator Emergency Cool-DownSystem are treated as constrained functions to arrive at a solutionspace which are not only pareto optimal in terms of risk and costbut also satisfies the constraints, meaning restricts the unavailabil-ity of the said safety systems below a target value. A clusteringtechnique with higher-level information is proposed for utilitieschoice of decision space for an optimum cost and risk level.
2. Methodology
Probabilistic Safety Assessment (PSA) of a NPP, both models andmethods, provides a quantitative representation of the risk level ofthe plant through the assessment of the probability of accidentsand their consequences. Some of the factors that influence or are
Multi ObjOptimizatioGenetic Alg
Risk vs.Pareto Optima
Event Tree Analysis
Minima CuGeneratio
Risk Function Formulation
Fig. 1. Overview of
incorporated in this modeling and quantification process are theTS&M requirements. Thus, the PRA risk model structure can beseen as a function of TS&M requirements. Alternatively, it can beseen as a function of the unavailability of the associated safetyfunctions, which, in turn, can be seen as a function of the unavail-ability of the associated systems and components.
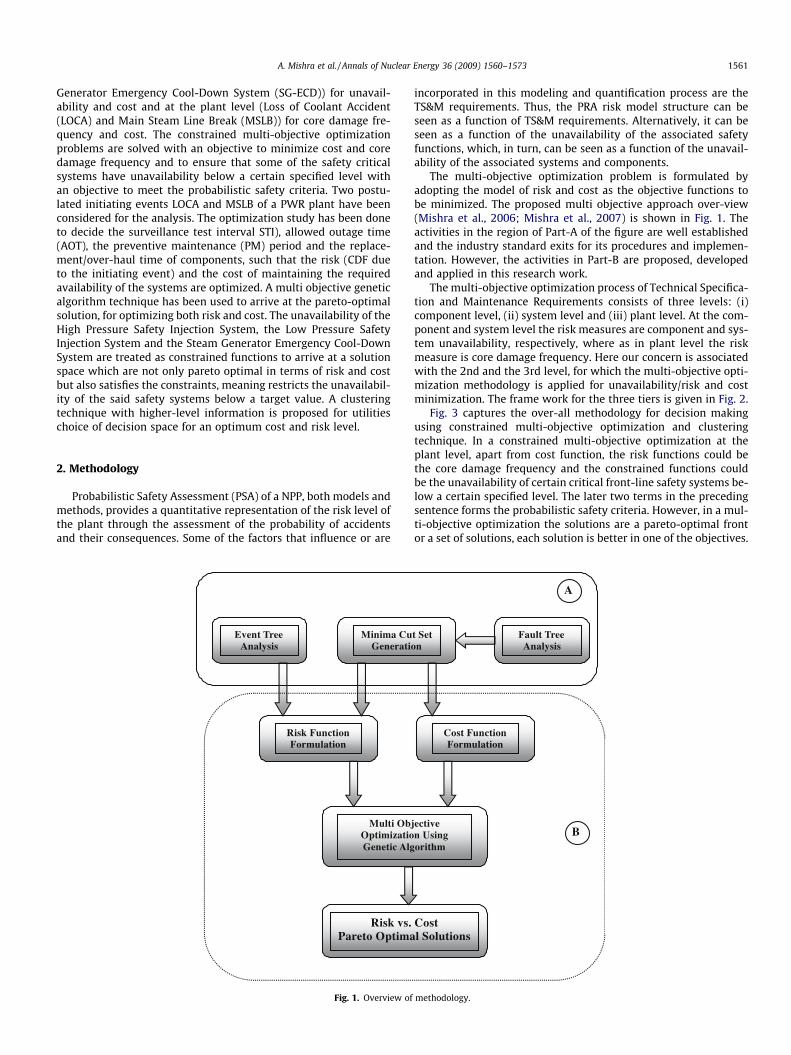
The multi-objective optimization problem is formulated byadopting the model of risk and cost as the objective functions tobe minimized. The proposed multi objective approach over-view(Mishra et al., 2006; Mishra et al., 2007) is shown in Fig. 1. Theactivities in the region of Part-A of the figure are well establishedand the industry standard exits for its procedures and implemen-tation. However, the activities in Part-B are proposed, developedand applied in this research work.
The multi-objective optimization process of Technical Specifica-tion and Maintenance Requirements consists of three levels: (i)component level, (ii) system level and (iii) plant level. At the com-ponent and system level the risk measures are component and sys-tem unavailability, respectively, where as in plant level the riskmeasure is core damage frequency. Here our concern is associatedwith the 2nd and the 3rd level, for which the multi-objective opti-mization methodology is applied for unavailability/risk and costminimization. The frame work for the three tiers is given in Fig. 2.
Fig. 3 captures the over-all methodology for decision makingusing constrained multi-objective optimization and clusteringtechnique. In a constrained multi-objective optimization at theplant level, apart from cost function, the risk functions could bethe core damage frequency and the constrained functions couldbe the unavailability of certain critical front-line safety systems be-low a certain specified level. The later two terms in the precedingsentence forms the probabilistic safety criteria. However, in a mul-ti-objective optimization the solutions are a pareto-optimal frontor a set of solutions, each solution is better in one of the objectives.
ective n Using orithm
Cost l Solutions
t Set n
Fault Tree Analysis
Cost Function Formulation
A
B
methodology.
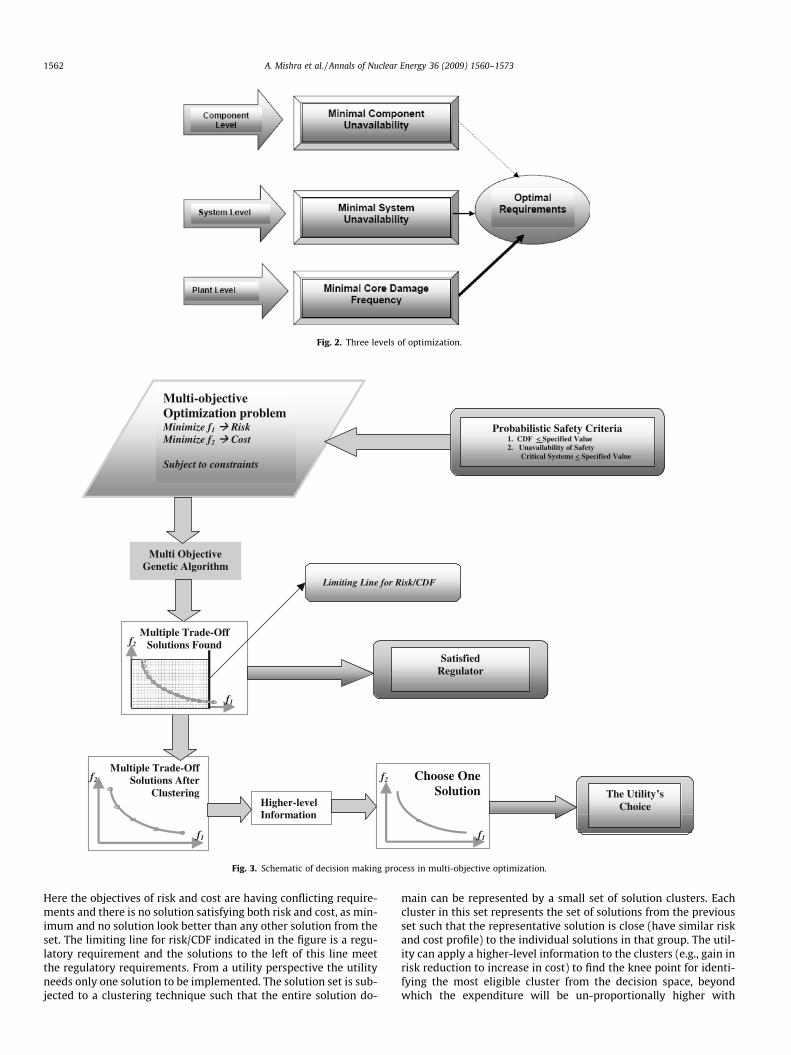
Fig. 2. Three levels of optimization.
Multi-objective Optimization problem Minimize f1 Risk Minimize f2 Cost
Subject to constraints
Multi Objective Genetic Algorithm
Multiple Trade-OffSolutions After
ClusteringHigher-levelInformation
Choose One Solution
Probabilistic Safety Criteria 1. CDF < Specified Value 2. Unavailability of Safety
Critical Systems < Specified Value
Multiple Trade-Off Solutions Found
Satisfied Regulator
The Utility’s Choice
f1
f2
f1
f2
f2
f1
Limiting Line for Risk/CDF
Fig. 3. Schematic of decision making process in multi-objective optimization.
1562 A. Mishra et al. / Annals of Nuclear Energy 36 (2009) 1560–1573
Here the objectives of risk and cost are having conflicting require-ments and there is no solution satisfying both risk and cost, as min-imum and no solution look better than any other solution from theset. The limiting line for risk/CDF indicated in the figure is a regu-latory requirement and the solutions to the left of this line meetthe regulatory requirements. From a utility perspective the utilityneeds only one solution to be implemented. The solution set is sub-jected to a clustering technique such that the entire solution do-
main can be represented by a small set of solution clusters. Eachcluster in this set represents the set of solutions from the previousset such that the representative solution is close (have similar riskand cost profile) to the individual solutions in that group. The util-ity can apply a higher-level information to the clusters (e.g., gain inrisk reduction to increase in cost) to find the knee point for identi-fying the most eligible cluster from the decision space, beyondwhich the expenditure will be un-proportionally higher with
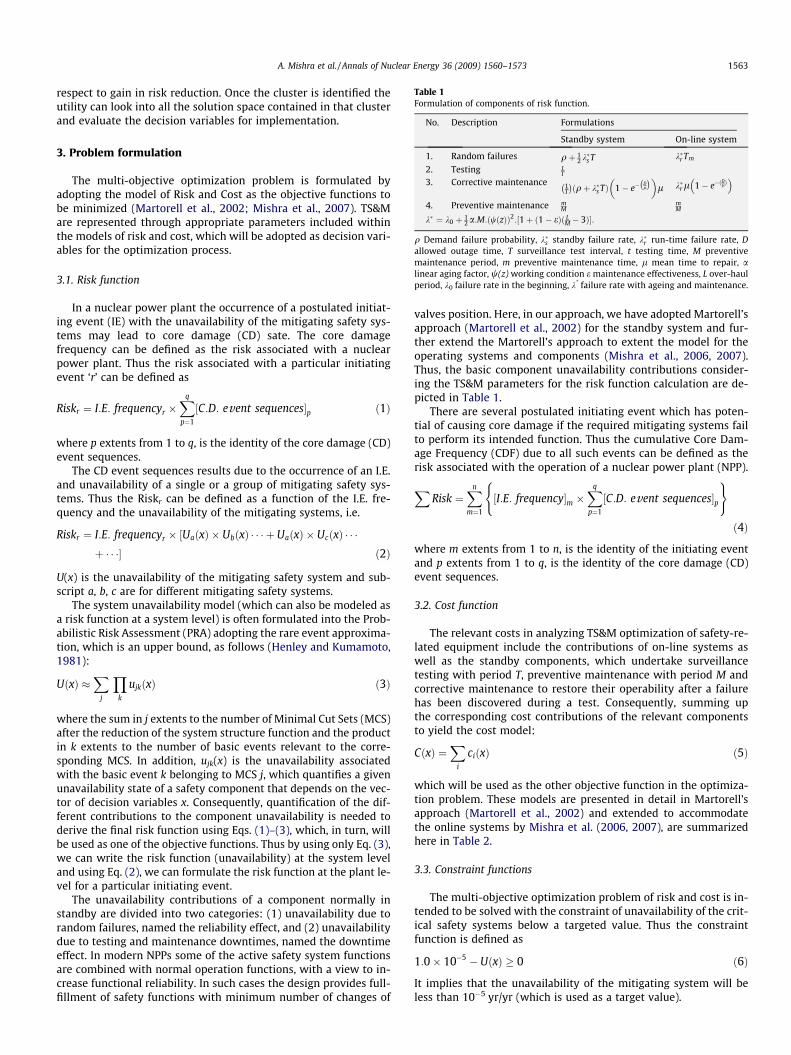
Table 1Formulation of components of risk function.
No. Description Formulations
Standby system On-line system
1. Random failures qþ 12 k�s T k�r Tm
2. Testing tT
3. Corrective maintenance 1T
� �ðqþ k�s TÞ 1� e�
Dl
� �� �l k�r l 1� e�ð
DlÞ
� �4. Preventive maintenance m
MmM
k� ¼ k0 þ 12 a:M:ðwðzÞÞ2:½1þ ð1� eÞð L
M � 3Þ�:
q Demand failure probability, k�s standby failure rate, k�r run-time failure rate, Dallowed outage time, T surveillance test interval, t testing time, M preventivemaintenance period, m preventive maintenance time, l mean time to repair, alinear aging factor, w(z) working condition e maintenance effectiveness, L over-haulperiod, k0 failure rate in the beginning, k* failure rate with ageing and maintenance.
A. Mishra et al. / Annals of Nuclear Energy 36 (2009) 1560–1573 1563
respect to gain in risk reduction. Once the cluster is identified theutility can look into all the solution space contained in that clusterand evaluate the decision variables for implementation.
3. Problem formulation
The multi-objective optimization problem is formulated byadopting the model of Risk and Cost as the objective functions tobe minimized (Martorell et al., 2002; Mishra et al., 2007). TS&Mare represented through appropriate parameters included withinthe models of risk and cost, which will be adopted as decision vari-ables for the optimization process.
3.1. Risk function
In a nuclear power plant the occurrence of a postulated initiat-ing event (IE) with the unavailability of the mitigating safety sys-tems may lead to core damage (CD) sate. The core damagefrequency can be defined as the risk associated with a nuclearpower plant. Thus the risk associated with a particular initiatingevent ‘r’ can be defined as
Riskr ¼ I:E: frequencyr �Xq
p¼1
½C:D: event sequences�p ð1Þ
where p extents from 1 to q, is the identity of the core damage (CD)event sequences.
The CD event sequences results due to the occurrence of an I.E.and unavailability of a single or a group of mitigating safety sys-tems. Thus the Riskr can be defined as a function of the I.E. fre-quency and the unavailability of the mitigating systems, i.e.
Riskr ¼ I:E: frequencyr � ½UaðxÞ � UbðxÞ � � � þ UaðxÞ � UcðxÞ � � �þ � � �� ð2Þ
U(x) is the unavailability of the mitigating safety system and sub-script a, b, c are for different mitigating safety systems.
The system unavailability model (which can also be modeled asa risk function at a system level) is often formulated into the Prob-abilistic Risk Assessment (PRA) adopting the rare event approxima-tion, which is an upper bound, as follows (Henley and Kumamoto,1981):
UðxÞ �X
j
Yk
ujkðxÞ ð3Þ
where the sum in j extents to the number of Minimal Cut Sets (MCS)after the reduction of the system structure function and the productin k extents to the number of basic events relevant to the corre-sponding MCS. In addition, ujk(x) is the unavailability associatedwith the basic event k belonging to MCS j, which quantifies a givenunavailability state of a safety component that depends on the vec-tor of decision variables x. Consequently, quantification of the dif-ferent contributions to the component unavailability is needed toderive the final risk function using Eqs. (1)–(3), which, in turn, willbe used as one of the objective functions. Thus by using only Eq. (3),we can write the risk function (unavailability) at the system leveland using Eq. (2), we can formulate the risk function at the plant le-vel for a particular initiating event.
The unavailability contributions of a component normally instandby are divided into two categories: (1) unavailability due torandom failures, named the reliability effect, and (2) unavailabilitydue to testing and maintenance downtimes, named the downtimeeffect. In modern NPPs some of the active safety system functionsare combined with normal operation functions, with a view to in-crease functional reliability. In such cases the design provides full-fillment of safety functions with minimum number of changes of
valves position. Here, in our approach, we have adopted Martorell’sapproach (Martorell et al., 2002) for the standby system and fur-ther extend the Martorell’s approach to extent the model for theoperating systems and components (Mishra et al., 2006, 2007).Thus, the basic component unavailability contributions consider-ing the TS&M parameters for the risk function calculation are de-picted in Table 1.
There are several postulated initiating event which has poten-tial of causing core damage if the required mitigating systems failto perform its intended function. Thus the cumulative Core Dam-age Frequency (CDF) due to all such events can be defined as therisk associated with the operation of a nuclear power plant (NPP).
XRisk ¼
Xn
m¼1
½I:E: frequency�m �Xq
p¼1
½C:D: event sequences�p
( )
ð4Þ
where m extents from 1 to n, is the identity of the initiating eventand p extents from 1 to q, is the identity of the core damage (CD)event sequences.
3.2. Cost function
The relevant costs in analyzing TS&M optimization of safety-re-lated equipment include the contributions of on-line systems aswell as the standby components, which undertake surveillancetesting with period T, preventive maintenance with period M andcorrective maintenance to restore their operability after a failurehas been discovered during a test. Consequently, summing upthe corresponding cost contributions of the relevant componentsto yield the cost model:
CðxÞ ¼X
i
ciðxÞ ð5Þ
which will be used as the other objective function in the optimiza-tion problem. These models are presented in detail in Martorell’sapproach (Martorell et al., 2002) and extended to accommodatethe online systems by Mishra et al. (2006, 2007), are summarizedhere in Table 2.
3.3. Constraint functions
The multi-objective optimization problem of risk and cost is in-tended to be solved with the constraint of unavailability of the crit-ical safety systems below a targeted value. Thus the constraintfunction is defined as
1:0� 10�5 � UðxÞ � 0 ð6Þ
It implies that the unavailability of the mitigating system will beless than 10�5 yr/yr (which is used as a target value).
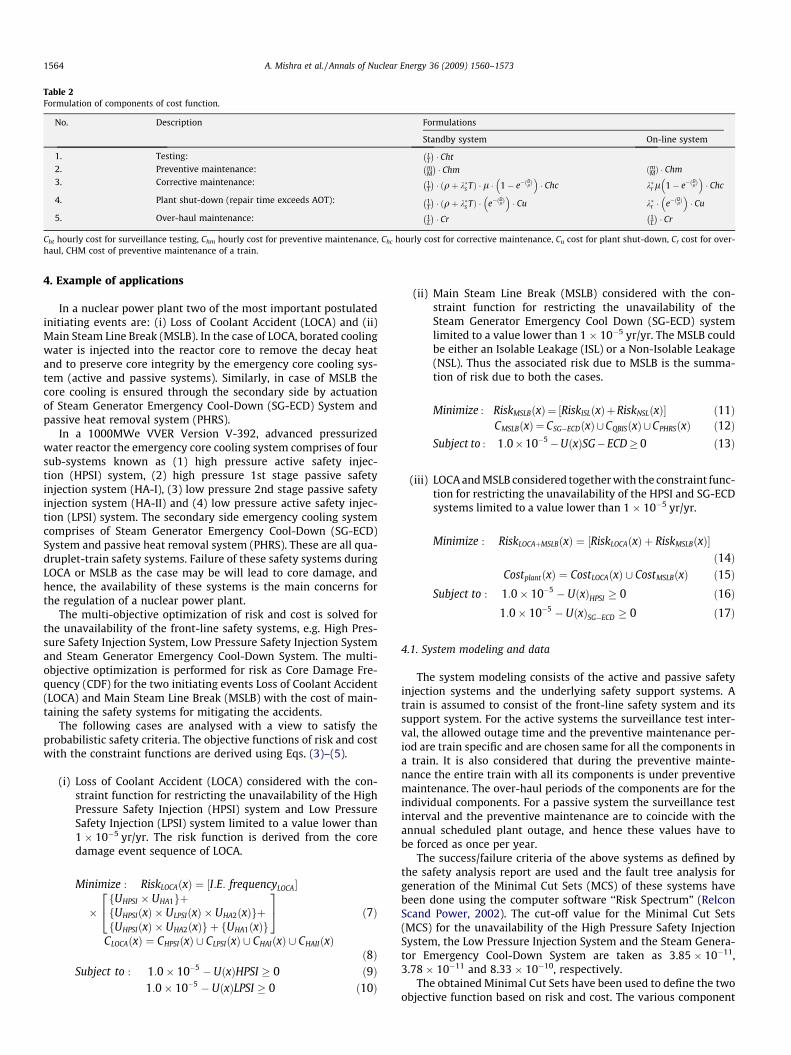
Table 2Formulation of components of cost function.
No. Description Formulations
Standby system On-line system
1. Testing: tT
� �� Cht
2. Preventive maintenance: mM
� �� Chm ðmMÞ � Chm
3. Corrective maintenance: 1T
� �� ðqþ k�s TÞ � l � 1� e�ð
DlÞ
� �� Chc k�r l 1� e�ð
DlÞ
� �� Chc
4. Plant shut-down (repair time exceeds AOT): 1T
� �� ðqþ k�s TÞ � e�ð
DlÞ
� �� Cu k�r � e�ð
DlÞ
� �� Cu
5. Over-haul maintenance: 1L
� �� Cr 1
L
� �� Cr
Cht hourly cost for surveillance testing, Chm hourly cost for preventive maintenance, Chc hourly cost for corrective maintenance, Cu cost for plant shut-down, Cr cost for over-haul, CHM cost of preventive maintenance of a train.
1564 A. Mishra et al. / Annals of Nuclear Energy 36 (2009) 1560–1573
4. Example of applications
In a nuclear power plant two of the most important postulatedinitiating events are: (i) Loss of Coolant Accident (LOCA) and (ii)Main Steam Line Break (MSLB). In the case of LOCA, borated coolingwater is injected into the reactor core to remove the decay heatand to preserve core integrity by the emergency core cooling sys-tem (active and passive systems). Similarly, in case of MSLB thecore cooling is ensured through the secondary side by actuationof Steam Generator Emergency Cool-Down (SG-ECD) System andpassive heat removal system (PHRS).
In a 1000MWe VVER Version V-392, advanced pressurizedwater reactor the emergency core cooling system comprises of foursub-systems known as (1) high pressure active safety injec-tion (HPSI) system, (2) high pressure 1st stage passive safetyinjection system (HA-I), (3) low pressure 2nd stage passive safetyinjection system (HA-II) and (4) low pressure active safety injec-tion (LPSI) system. The secondary side emergency cooling systemcomprises of Steam Generator Emergency Cool-Down (SG-ECD)System and passive heat removal system (PHRS). These are all qua-druplet-train safety systems. Failure of these safety systems duringLOCA or MSLB as the case may be will lead to core damage, andhence, the availability of these systems is the main concerns forthe regulation of a nuclear power plant.
The multi-objective optimization of risk and cost is solved forthe unavailability of the front-line safety systems, e.g. High Pres-sure Safety Injection System, Low Pressure Safety Injection Systemand Steam Generator Emergency Cool-Down System. The multi-objective optimization is performed for risk as Core Damage Fre-quency (CDF) for the two initiating events Loss of Coolant Accident(LOCA) and Main Steam Line Break (MSLB) with the cost of main-taining the safety systems for mitigating the accidents.
The following cases are analysed with a view to satisfy theprobabilistic safety criteria. The objective functions of risk and costwith the constraint functions are derived using Eqs. (3)–(5).
(i) Loss of Coolant Accident (LOCA) considered with the con-straint function for restricting the unavailability of the HighPressure Safety Injection (HPSI) system and Low PressureSafety Injection (LPSI) system limited to a value lower than1 � 10�5 yr/yr. The risk function is derived from the coredamage event sequence of LOCA.
Minimize : RiskLOCAðxÞ ¼ ½I:E: frequencyLOCA�
�fUHPSI � UHA1gþfUHPSIðxÞ � ULPSIðxÞ � UHA2ðxÞgþfUHPSIðxÞ � UHA2ðxÞg þ fUHA1ðxÞg
24
35 ð7Þ
CLOCAðxÞ ¼ CHPSIðxÞ [ CLPSIðxÞ [ CHAIðxÞ [ CHAIIðxÞð8Þ
Subject to : 1:0� 10�5 � UðxÞHPSI � 0 ð9Þ1:0� 10�5 � UðxÞLPSI � 0 ð10Þ
(ii) Main Steam Line Break (MSLB) considered with the con-straint function for restricting the unavailability of theSteam Generator Emergency Cool Down (SG-ECD) systemlimited to a value lower than 1 � 10�5 yr/yr. The MSLB couldbe either an Isolable Leakage (ISL) or a Non-Isolable Leakage(NSL). Thus the associated risk due to MSLB is the summa-tion of risk due to both the cases.
Minimize : RiskMSLBðxÞ ¼ ½RiskISLðxÞþRiskNSLðxÞ� ð11ÞCMSLBðxÞ ¼ CSG�ECDðxÞ[CQBISðxÞ [CPHRSðxÞ ð12Þ
Subject to : 1:0�10�5�UðxÞSG�ECD� 0 ð13Þ
(iii) LOCA and MSLB considered together with the constraint func-tion for restricting the unavailability of the HPSI and SG-ECDsystems limited to a value lower than 1 � 10�5 yr/yr.
Minimize : RiskLOCAþMSLBðxÞ ¼ ½RiskLOCAðxÞ þ RiskMSLBðxÞ�ð14Þ
CostplantðxÞ ¼ CostLOCAðxÞ [ CostMSLBðxÞ ð15ÞSubject to : 1:0� 10�5 � UðxÞHPSI � 0 ð16Þ
1:0� 10�5 � UðxÞSG�ECD � 0 ð17Þ
4.1. System modeling and data
The system modeling consists of the active and passive safetyinjection systems and the underlying safety support systems. Atrain is assumed to consist of the front-line safety system and itssupport system. For the active systems the surveillance test inter-val, the allowed outage time and the preventive maintenance per-iod are train specific and are chosen same for all the components ina train. It is also considered that during the preventive mainte-nance the entire train with all its components is under preventivemaintenance. The over-haul periods of the components are for theindividual components. For a passive system the surveillance testinterval and the preventive maintenance are to coincide with theannual scheduled plant outage, and hence these values have tobe forced as once per year.
The success/failure criteria of the above systems as defined bythe safety analysis report are used and the fault tree analysis forgeneration of the Minimal Cut Sets (MCS) of these systems havebeen done using the computer software ‘‘Risk Spectrum” (RelconScand Power, 2002). The cut-off value for the Minimal Cut Sets(MCS) for the unavailability of the High Pressure Safety InjectionSystem, the Low Pressure Injection System and the Steam Genera-tor Emergency Cool-Down System are taken as 3.85 � 10�11,3.78 � 10�11 and 8.33 � 10�10, respectively.
The obtained Minimal Cut Sets have been used to define the twoobjective function based on risk and cost. The various component
A. Mishra et al. / Annals of Nuclear Energy 36 (2009) 1560–1573 1565
data required for the fault tree analysis are considered as per theProbabilistic Safety Analysis for nuclear power plant guide lines.For considering the effect of ageing for all the components Propor-tional Age Reduction (PAR) model Martorell et al., 2002 is used. Thecomponent unavailability and the cost parameters as required inthe formulations for the risk and cost functions modeling are givenin Martorell et al. (2002) and Mishra et al. (2006).
4.2. Decision variables
Any solution to the optimization problem can be encoded usingthe following array of decision variables: X = {T, D, M, L1�n}. In thisanalysis it is considered that the T, i.e. surveillance test interval, D,i.e. allowed outage time and M, i.e. preventive maintenance period.L1�n is the over-haul time of components in the mitigating front-line systems and support systems. The above decision variablescan be bounded by lower and upper bound to get a solution inthe desired feasible domain. The bounding conditions lower boundand upper bound for the decision variables are considered as fol-lows T(168, 4032), D(72, 720), M(4000, 16,000) and L1�n(8000,80,000), all the above mentioned values are in hours. The currentTS&M requirement for the decision variables are as follows:X = {T = 672, D = 168, M = 8000, L1�n = 32,000}. However, there arepassive safety injection systems which need to be tested and dem-onstrated for functionality at a periodic test interval, but thesetesting can only be performed during the annual outage as it couldaffect the reactor on power operation. For such systems the sur-veillance testing interval is considered as an annual outage main-tenance activity and considered as once in a year activity or asurveillance interval of T = 8000hrs, which is fixed.
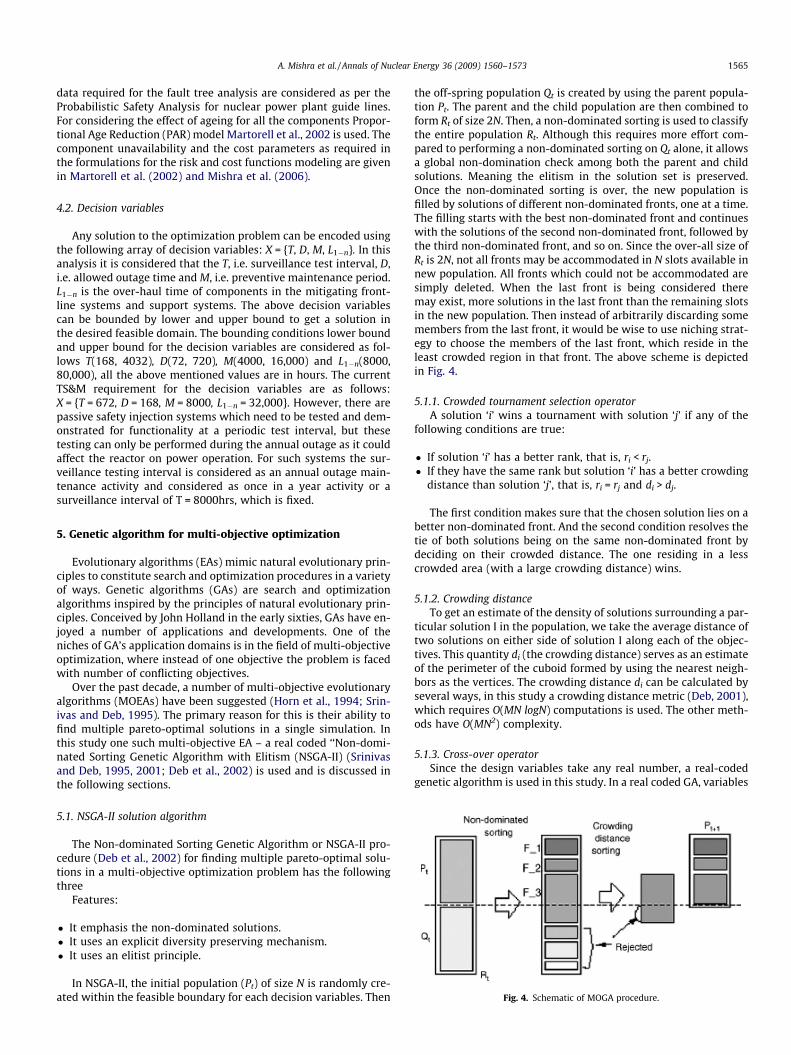
Fig. 4. Schematic of MOGA procedure.
5. Genetic algorithm for multi-objective optimization
Evolutionary algorithms (EAs) mimic natural evolutionary prin-ciples to constitute search and optimization procedures in a varietyof ways. Genetic algorithms (GAs) are search and optimizationalgorithms inspired by the principles of natural evolutionary prin-ciples. Conceived by John Holland in the early sixties, GAs have en-joyed a number of applications and developments. One of theniches of GA’s application domains is in the field of multi-objectiveoptimization, where instead of one objective the problem is facedwith number of conflicting objectives.
Over the past decade, a number of multi-objective evolutionaryalgorithms (MOEAs) have been suggested (Horn et al., 1994; Srin-ivas and Deb, 1995). The primary reason for this is their ability tofind multiple pareto-optimal solutions in a single simulation. Inthis study one such multi-objective EA – a real coded ‘‘Non-domi-nated Sorting Genetic Algorithm with Elitism (NSGA-II) (Srinivasand Deb, 1995, 2001; Deb et al., 2002) is used and is discussed inthe following sections.
5.1. NSGA-II solution algorithm
The Non-dominated Sorting Genetic Algorithm or NSGA-II pro-cedure (Deb et al., 2002) for finding multiple pareto-optimal solu-tions in a multi-objective optimization problem has the followingthree
Features:
It emphasis the non-dominated solutions. It uses an explicit diversity preserving mechanism. It uses an elitist principle.
In NSGA-II, the initial population (Pt) of size N is randomly cre-ated within the feasible boundary for each decision variables. Then
the off-spring population Qt is created by using the parent popula-tion Pt. The parent and the child population are then combined toform Rt of size 2N. Then, a non-dominated sorting is used to classifythe entire population Rt. Although this requires more effort com-pared to performing a non-dominated sorting on Qt alone, it allowsa global non-domination check among both the parent and childsolutions. Meaning the elitism in the solution set is preserved.Once the non-dominated sorting is over, the new population isfilled by solutions of different non-dominated fronts, one at a time.The filling starts with the best non-dominated front and continueswith the solutions of the second non-dominated front, followed bythe third non-dominated front, and so on. Since the over-all size ofRt is 2N, not all fronts may be accommodated in N slots available innew population. All fronts which could not be accommodated aresimply deleted. When the last front is being considered theremay exist, more solutions in the last front than the remaining slotsin the new population. Then instead of arbitrarily discarding somemembers from the last front, it would be wise to use niching strat-egy to choose the members of the last front, which reside in theleast crowded region in that front. The above scheme is depictedin Fig. 4.
5.1.1. Crowded tournament selection operatorA solution ‘i’ wins a tournament with solution ‘j’ if any of the
following conditions are true:
If solution ‘i’ has a better rank, that is, ri < rj. If they have the same rank but solution ‘i’ has a better crowding
distance than solution ‘j’, that is, ri = rj and di > dj.
The first condition makes sure that the chosen solution lies on abetter non-dominated front. And the second condition resolves thetie of both solutions being on the same non-dominated front bydeciding on their crowded distance. The one residing in a lesscrowded area (with a large crowding distance) wins.
5.1.2. Crowding distanceTo get an estimate of the density of solutions surrounding a par-
ticular solution I in the population, we take the average distance oftwo solutions on either side of solution I along each of the objec-tives. This quantity di (the crowding distance) serves as an estimateof the perimeter of the cuboid formed by using the nearest neigh-bors as the vertices. The crowding distance di can be calculated byseveral ways, in this study a crowding distance metric (Deb, 2001),which requires O(MN logN) computations is used. The other meth-ods have O(MN2) complexity.
5.1.3. Cross-over operatorSince the design variables take any real number, a real-coded
genetic algorithm is used in this study. In a real coded GA, variables
1566 A. Mishra et al. / Annals of Nuclear Energy 36 (2009) 1560–1573
are not coded in binary strings instead GA operators are directlyapplied on the real numbers. Although any selection operatorscan be used, specialized cross-over and mutation operators areused to effectively create off-spring solutions from parent solu-tions. In this study, we use Simulated Binary Crossover (SBX) anda parameter-based mutation operator (Deb and Agarwal, 1995).The cross-over rate is fixed at 0.9 and the mutation rate is fixedat 0.01. All the simulations are run for 500 generations.
5.1.4. Constraint tournament selection operatorThe Constraint Tournament Selection Method is a penalty
parameter less constraint handling approach (Deb, 2001; Debet al., 2001). Here, two solutions are picked from the populationand the better solution is chosen. In the presence of constraints,each solution can be either feasible or infeasible. Thus, there maybe at most three situations: (i) both solutions are feasible, (ii)
0
0.5
1
1.5
2
2.5
3
3.5
0 5 10
Unavailability (* 10
Cos
t $/h
r ----
->
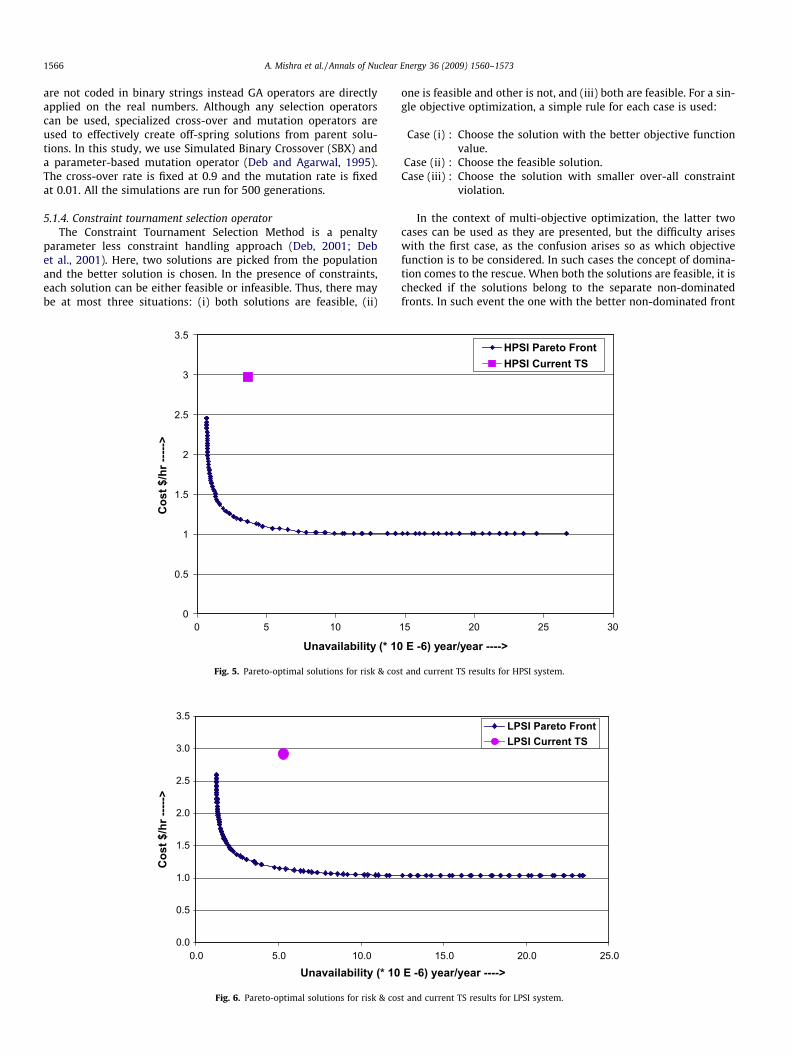
Fig. 5. Pareto-optimal solutions for risk & cos
0.0
0.5
1.0
1.5
2.0
2.5
3.0
3.5
0.0 5.0 10.0
Unavailability (* 10
Cos
t $/h
r ----
->
Fig. 6. Pareto-optimal solutions for risk & cos
one is feasible and other is not, and (iii) both are feasible. For a sin-gle objective optimization, a simple rule for each case is used:
Case (i) : Choose the solution with the better objective functionvalue.
Case (ii) : Choose the feasible solution.Case (iii) : Choose the solution with smaller over-all constraint
violation.
In the context of multi-objective optimization, the latter twocases can be used as they are presented, but the difficulty ariseswith the first case, as the confusion arises so as which objectivefunction is to be considered. In such cases the concept of domina-tion comes to the rescue. When both the solutions are feasible, it ischecked if the solutions belong to the separate non-dominatedfronts. In such event the one with the better non-dominated front
15 20 25 30
E -6) year/year ---->
HPSI Pareto FrontHPSI Current TS
t and current TS results for HPSI system.
15.0 20.0 25.0
E -6) year/year ---->
LPSI Pareto FrontLPSI Current TS
t and current TS results for LPSI system.
A. Mishra et al. / Annals of Nuclear Energy 36 (2009) 1560–1573 1567
is chosen. If they belong to the same non-dominated front then thediversity preservation technique is used to resolve the tie. Sincemaintaining diversity is another goal in multi-objective optimiza-tion, we can choose the one, which belongs to the least crowdedregion in that non-dominated set. Thus the following are the con-strain-domination condition for any two solutions x(i) and x(j).
A solution x(i) is said to be ‘‘constrain-dominate” a solution x(j)
ðor xðiÞ 6 c xðjÞÞ; if any of the following condition are true:
0
0.5
1
1.5
2
2.5
3
3.5
4
4.5
0 5
Unavailability ( * 1
Cos
t $/h
r ----
>
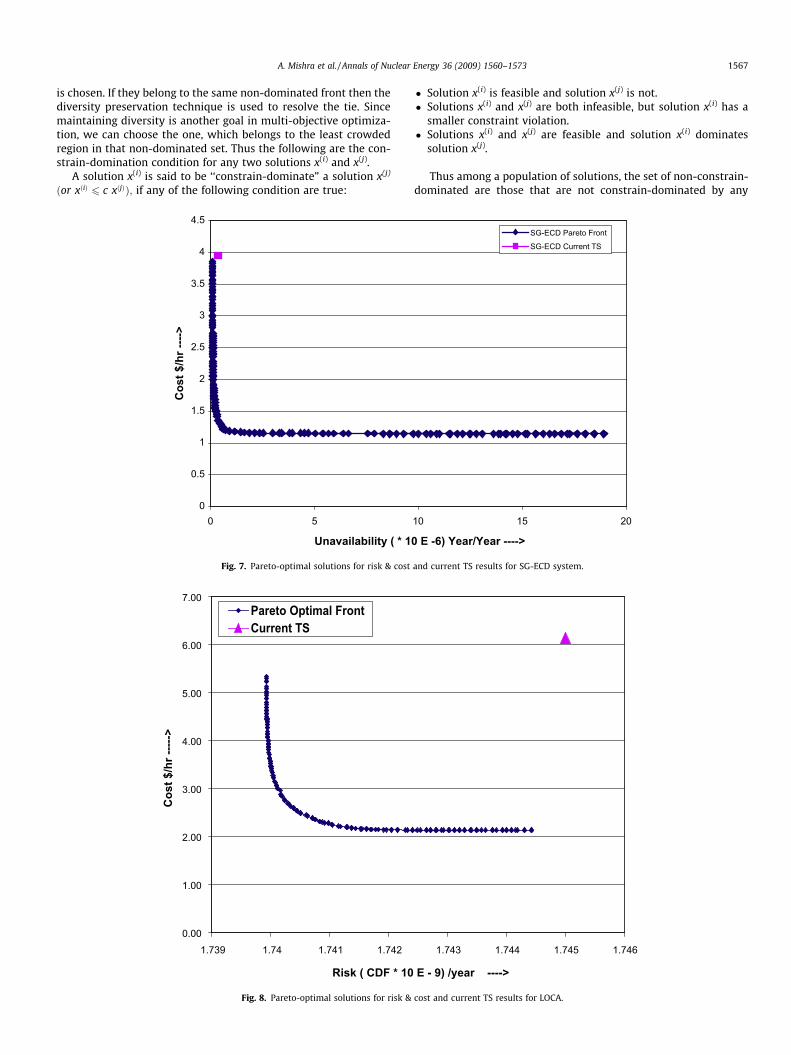
Fig. 7. Pareto-optimal solutions for risk & cost
0.00
1.00
2.00
3.00
4.00
5.00
6.00
7.00
1.739 1.74 1.741 1.742
Risk ( CDF * 10
Cos
t $/h
r ----
->
Pareto Optimal FrontCurrent TS
Fig. 8. Pareto-optimal solutions for risk &
Solution x(i) is feasible and solution x(j) is not. Solutions x(i) and x(j) are both infeasible, but solution x(i) has a
smaller constraint violation. Solutions x(i) and x(j) are feasible and solution x(i) dominates
solution x(j).
Thus among a population of solutions, the set of non-constrain-dominated are those that are not constrain-dominated by any
10 15 20
0 E -6) Year/Year ---->
SG-ECD Pareto Front
SG-ECD Current TS
and current TS results for SG-ECD system.
1.743 1.744 1.745 1.746
E - 9) /year ---->
cost and current TS results for LOCA.
1568 A. Mishra et al. / Annals of Nuclear Energy 36 (2009) 1560–1573
member of the population. By using the definition of constraintdomination, we define the generic constrained tournament selec-tion operator as follows:
Given two solutions x(i) and x(j), choose solution x(i), if any of thefollowing conditions are true.
Solution x(i) belongs to a better non-constrain-dominated set. Solution x(i) and x(j) belong to the same non-constrain-domi-
nated set, but solution x(i) resides in a less crowded region basedon a crowding distance metric.
5.1.5. ClusteringAn important component for all clustering algorithms is the dis-
tance measure between data points. If the components for the datainstance vectors are all in same physical units then it is possiblethat the simple Euclidean distance metric is sufficient to success-fully group similar data instances. In Hierarchical Clustering given
0
1
2
3
4
5
6
0 50 100 150 20Risk ( CDF * 10 E
Cos
t $/h
r ---
--->
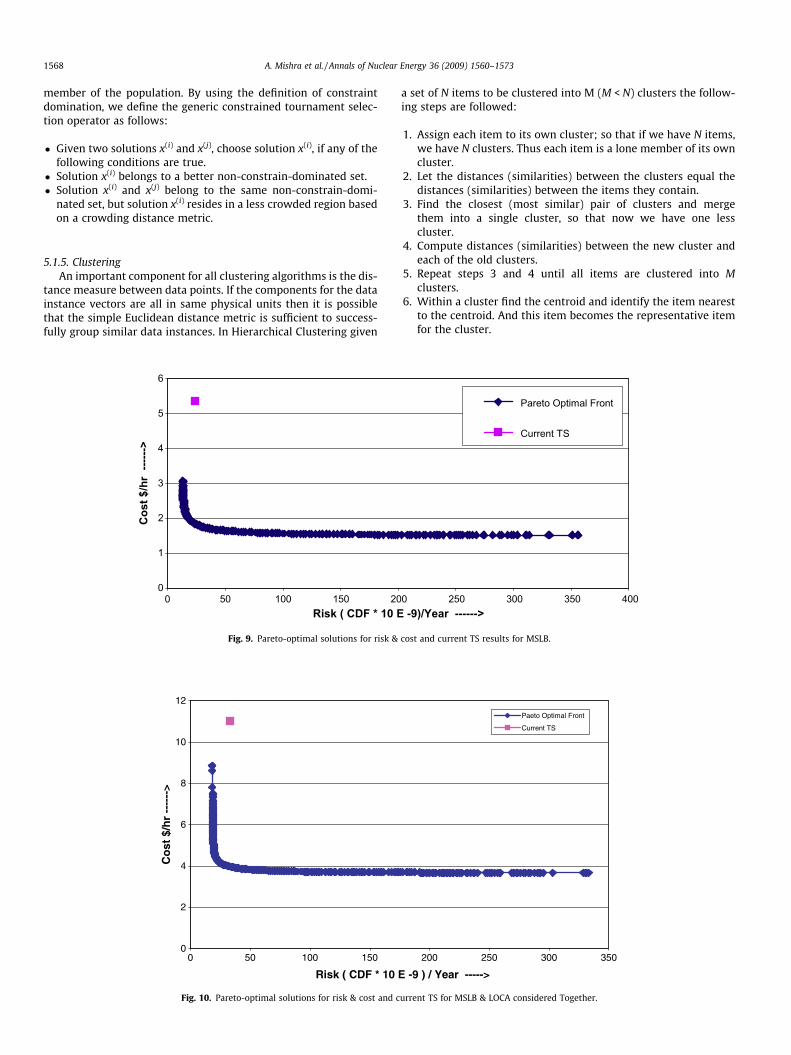
Fig. 9. Pareto-optimal solutions for risk &
0
2
4
6
8
10
12
0 50 100 150
Risk ( CDF * 10
Co
st $
/hr
----
-->
Fig. 10. Pareto-optimal solutions for risk & cost and c
a set of N items to be clustered into M (M < N) clusters the follow-ing steps are followed:
1. Assign each item to its own cluster; so that if we have N items,we have N clusters. Thus each item is a lone member of its owncluster.
2. Let the distances (similarities) between the clusters equal thedistances (similarities) between the items they contain.
3. Find the closest (most similar) pair of clusters and mergethem into a single cluster, so that now we have one lesscluster.
4. Compute distances (similarities) between the new cluster andeach of the old clusters.
5. Repeat steps 3 and 4 until all items are clustered into Mclusters.
6. Within a cluster find the centroid and identify the item nearestto the centroid. And this item becomes the representative itemfor the cluster.
0 250 300 350 400 -9)/Year ------>
Pareto Optimal Front
Current TS
cost and current TS results for MSLB.
200 250 300 350
E -9 ) / Year ----->
Paeto Optimal Front
Current TS
urrent TS for MSLB & LOCA considered Together.
A. Mishra et al. / Annals of Nuclear Energy 36 (2009) 1560–1573 1569
6. Results and discussion
The multi-objective optimization at the system level has beenstudied for the unavailability versus the cost/h of maintainingthe system. The decision variables are the surveillance test interval,the allowed outage time, the preventive maintenance periodand the over-haul time of various components appearing in theMinimal Cut Sets (MCS). The pareto-optimal solution for the activeHPSI system, LPSI systems and SG-ECD are given in Figs. 5–7,respectively.
The implications of the cost and unavailability for meeting thecurrent technical specification requirement are also plotted inthe same figures. From the figures, it is observed that the presentrequirement is very much away from the pareto-optimal front
0
1
2
3
4
5
6
1.74 1.741 1.742 1.743 1.744 1.7
Risk (CDF) per Ye
Co
st $
/hr
---
----
>
Fig. 11. Pareto-optimal solutions for LOCA
0
0.5
1
1.5
2
2.5
3
3.5
4
4.5
5
0 50 100 150 2
Risk (CDF/Yr)
Cos
t $/h
r --
------
>
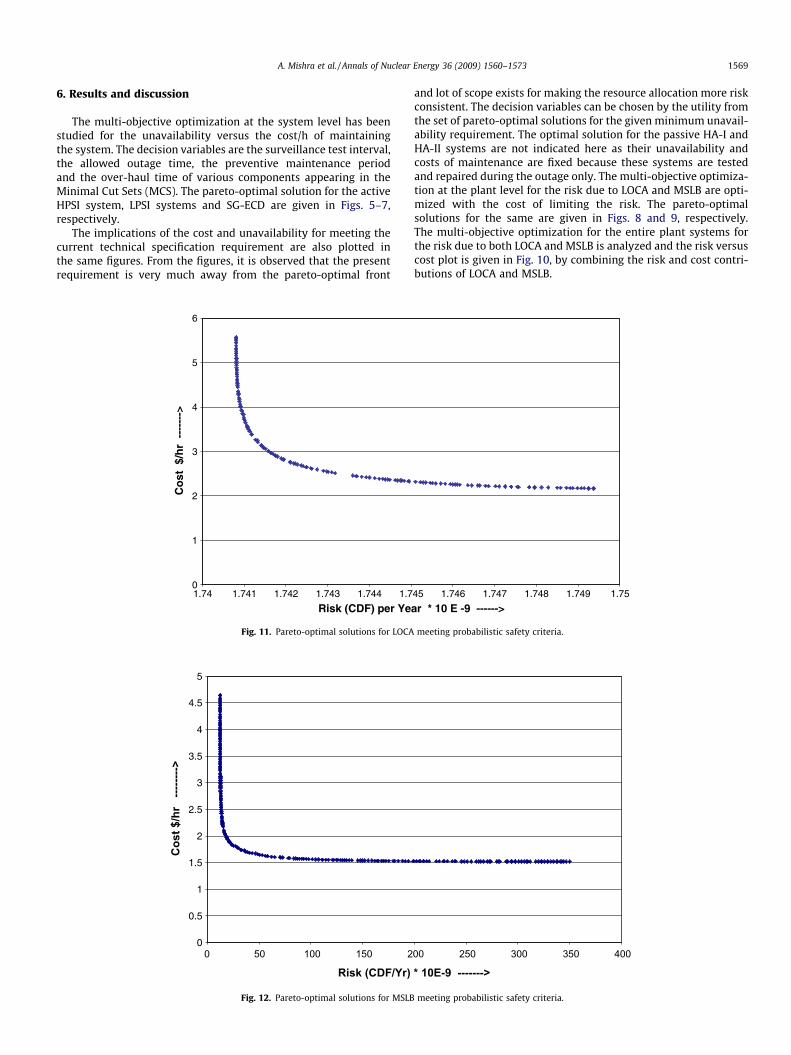
Fig. 12. Pareto-optimal solutions for MSLB
and lot of scope exists for making the resource allocation more riskconsistent. The decision variables can be chosen by the utility fromthe set of pareto-optimal solutions for the given minimum unavail-ability requirement. The optimal solution for the passive HA-I andHA-II systems are not indicated here as their unavailability andcosts of maintenance are fixed because these systems are testedand repaired during the outage only. The multi-objective optimiza-tion at the plant level for the risk due to LOCA and MSLB are opti-mized with the cost of limiting the risk. The pareto-optimalsolutions for the same are given in Figs. 8 and 9, respectively.The multi-objective optimization for the entire plant systems forthe risk due to both LOCA and MSLB is analyzed and the risk versuscost plot is given in Fig. 10, by combining the risk and cost contri-butions of LOCA and MSLB.
45 1.746 1.747 1.748 1.749 1.75
ar * 10 E -9 ------>
meeting probabilistic safety criteria.
00 250 300 350 400
* 10E-9 ------->
meeting probabilistic safety criteria.
0
0.5
1
1.5
2
2.5
3
0 2 4 6 8 10 12 14 16 18 20Unavailability * E-6 yr/yr ------>
Cos
t $/h
r ----
-->
Proposed Solution
Fig. 15. Proposed solutions after clustering for LPSI system.
1570 A. Mishra et al. / Annals of Nuclear Energy 36 (2009) 1560–1573
The implications of the cost and risk for meeting the currenttechnical specification requirement are also plotted in the respec-tive figures. It is seen that though the risk level at the current TSrequirement are maintained at a desired level but there is enoughscope to manage the same risk level at a reduced cost. This clearlyindicates that the current TS requirements are not risk consistentand are far of from the pareto-optimal solutions. Thus, the plant le-vel risk versus cost optimization suggests redistribution of re-sources allocation (decision variables) in terms of STI, AOT, PMfrequency for different systems and over-haul time of equipmentto be risk consistent.
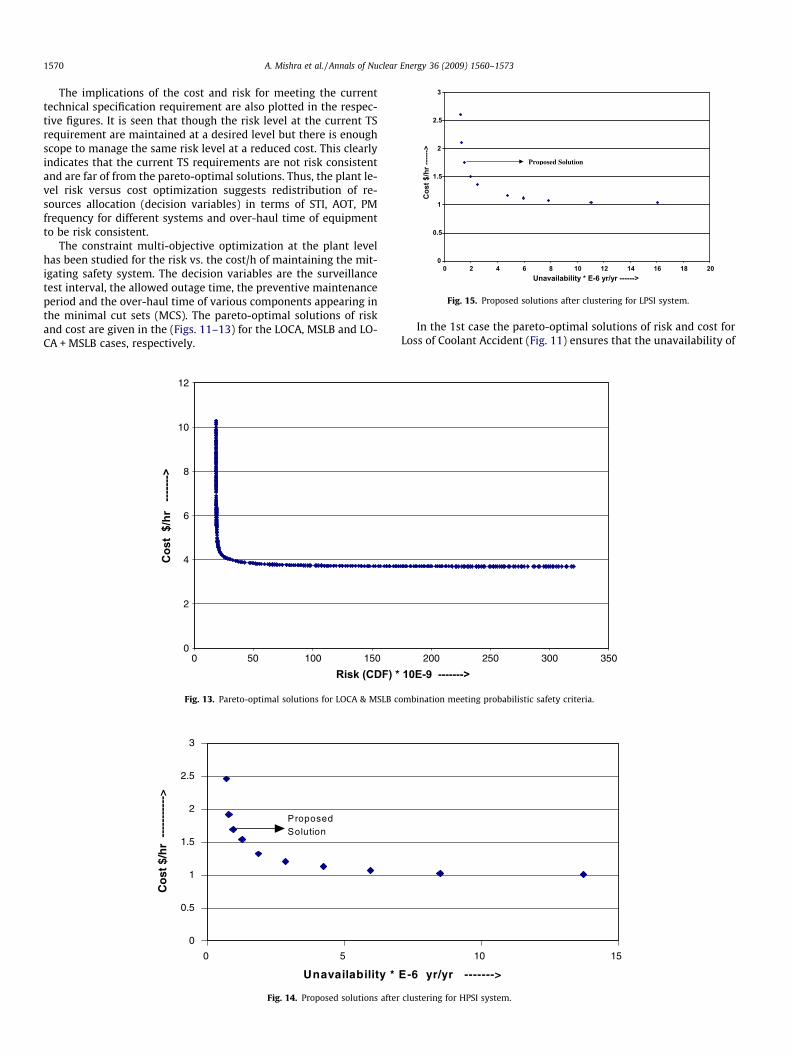
The constraint multi-objective optimization at the plant levelhas been studied for the risk vs. the cost/h of maintaining the mit-igating safety system. The decision variables are the surveillancetest interval, the allowed outage time, the preventive maintenanceperiod and the over-haul time of various components appearing inthe minimal cut sets (MCS). The pareto-optimal solutions of riskand cost are given in the (Figs. 11–13) for the LOCA, MSLB and LO-CA + MSLB cases, respectively.
0
2
4
6
8
10
12
0 50 100 150
Risk (CDF) *
Cos
t $/
hr
------
->
Fig. 13. Pareto-optimal solutions for LOCA & MSLB c
0
0.5
1
1.5
2
2.5
3
0 5
Unavailability *
Co
st $
/hr
---
----
----
>
ProposedSolution
Fig. 14. Proposed solutions after
In the 1st case the pareto-optimal solutions of risk and cost forLoss of Coolant Accident (Fig. 11) ensures that the unavailability of
200 250 300 350
10E-9 ------->
ombination meeting probabilistic safety criteria.
10 15
E-6 yr/yr ------->
clustering for HPSI system.
A. Mishra et al. / Annals of Nuclear Energy 36 (2009) 1560–1573 1571
the high pressure injection (HPSI) system and Low Pressure SafetyInjection System (LPSI) are below 1.0 � 10�5 yr/yr Similarly for the2nd case the pareto-optimal solutions of risk and cost for the MainSteam Line Break Accident (Fig. 12) ensures that the unavailabilityof the Steam generator Emergency Cool Down (SG-ECD) system isbelow 1.0 � 10�5 yr/yr The (Fig. 13) depicts the pareto-optimalsolution of risk and cost for LOCA and MSLB, considered together.It ensures that the unavailability of both HPSI and SG-ECD systemindividually are below 1.0 � 10�5 yr/yr. Thus if we choose a partic-ular cut-off value of core damage frequency the solution space tothe left of that point will give us the alternatives to meet the CDFrequirement as well as meeting the probabilistic safety criteria.
0
0.5
1
1.5
2
2.5
3
3.5
4
4.5
0 5
Unavailability
Co
st (
$/h
r )
---
--->
Proposed Solution
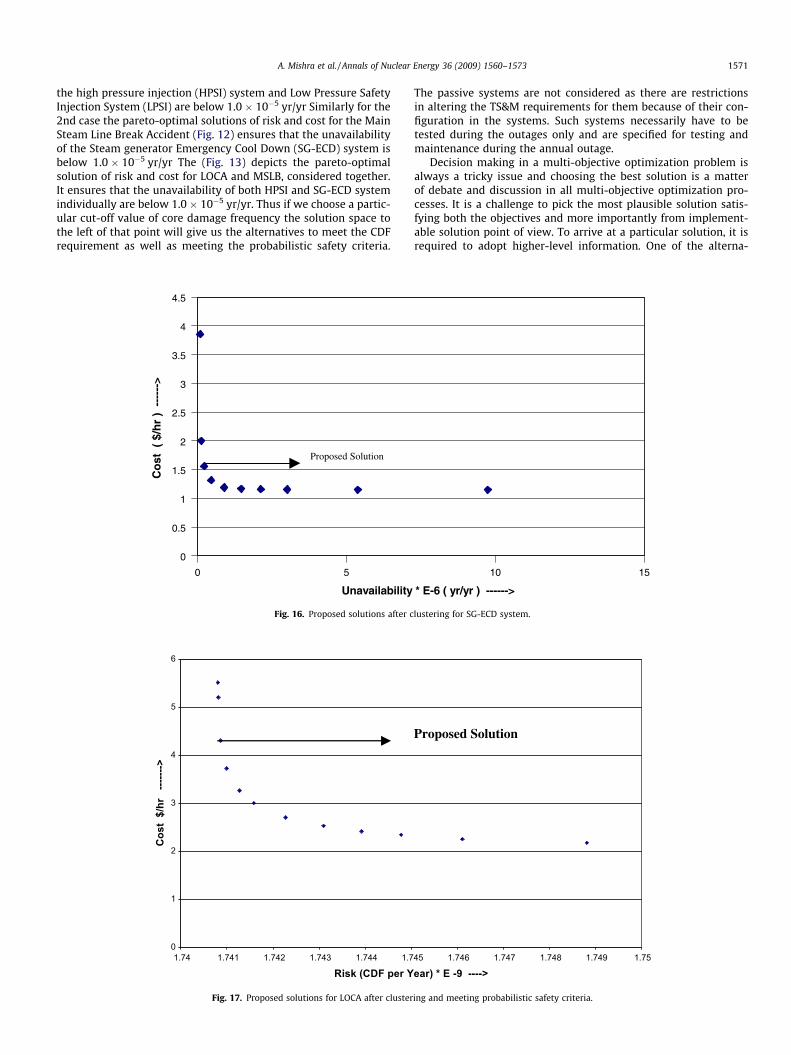
Fig. 16. Proposed solutions after c
0
1
2
3
4
5
6
1.74 1.741 1.742 1.743 1.744 1.7
Risk (CDF per Y
Cos
t $/
hr
------
->
Fig. 17. Proposed solutions for LOCA after cluster
The passive systems are not considered as there are restrictionsin altering the TS&M requirements for them because of their con-figuration in the systems. Such systems necessarily have to betested during the outages only and are specified for testing andmaintenance during the annual outage.
Decision making in a multi-objective optimization problem isalways a tricky issue and choosing the best solution is a matterof debate and discussion in all multi-objective optimization pro-cesses. It is a challenge to pick the most plausible solution satis-fying both the objectives and more importantly from implement-able solution point of view. To arrive at a particular solution, it isrequired to adopt higher-level information. One of the alterna-
10 15
* E-6 ( yr/yr ) ------>
lustering for SG-ECD system.
45 1.746 1.747 1.748 1.749 1.75
ear) * E -9 ---->
Proposed Solution
ing and meeting probabilistic safety criteria.
1572 A. Mishra et al. / Annals of Nuclear Energy 36 (2009) 1560–1573
tives is to look at the knee point where the cost to risk ratio ismarginalized, meaning the increase in cost gives very insignifi-cant benefit in risk reduction. In future the decision space of suchsolutions can be considered for implementation at the utility. Forobtaining solution options for the utility the multi-objective opti-mization solution space obtained in the case of unavailability ofthe front-line safety systems (Figs. 4–6) and plant level con-strained multi-objective optimizations for meeting the probabilis-
0
0.5
1
1.5
2
2.5
3
3.5
4
4.5
5
0 50 100 1
Risk (CDF per Y
Cos
t ($/
hr)
------
-->
Proposed S
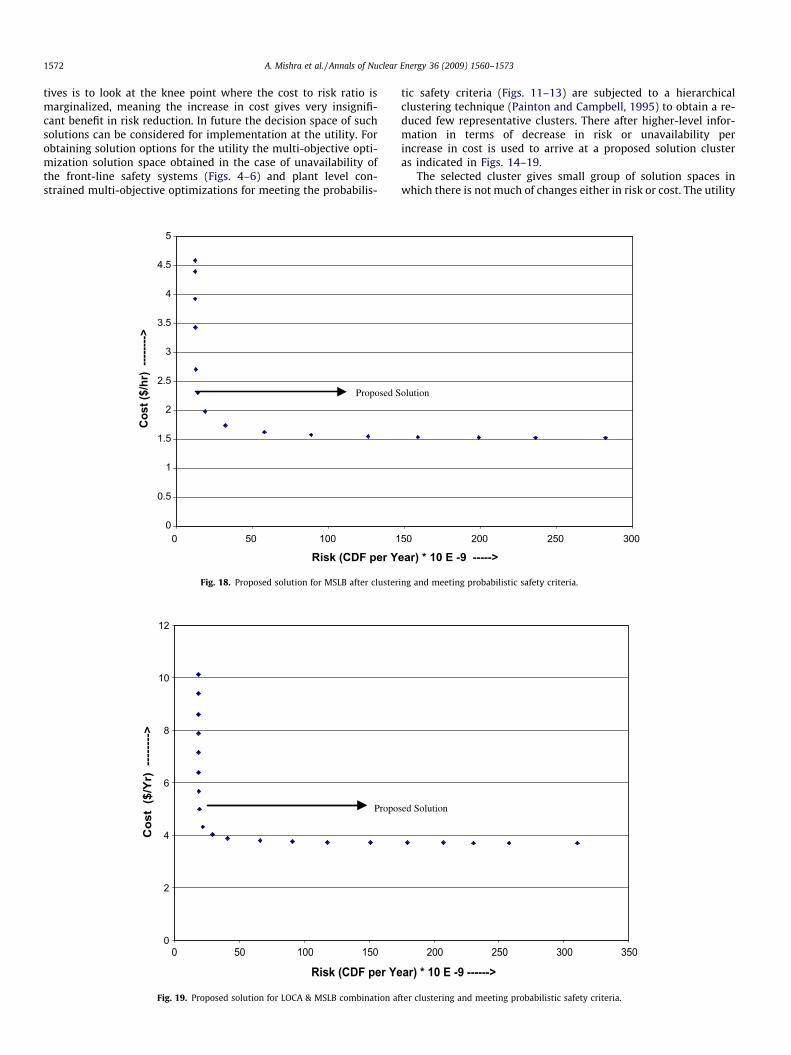
Fig. 18. Proposed solution for MSLB after cluster
0
2
4
6
8
10
12
0 50 100 150
Risk (CDF per Ye
Cos
t ($
/Yr)
---
----
->
Propo
Fig. 19. Proposed solution for LOCA & MSLB combination af
tic safety criteria (Figs. 11–13) are subjected to a hierarchicalclustering technique (Painton and Campbell, 1995) to obtain a re-duced few representative clusters. There after higher-level infor-mation in terms of decrease in risk or unavailability perincrease in cost is used to arrive at a proposed solution clusteras indicated in Figs. 14–19.
The selected cluster gives small group of solution spaces inwhich there is not much of changes either in risk or cost. The utility
50 200 250 300
ear) * 10 E -9 ----->
olution
ing and meeting probabilistic safety criteria.
200 250 300 350
ar) * 10 E -9 ------>
sed Solution
ter clustering and meeting probabilistic safety criteria.
A. Mishra et al. / Annals of Nuclear Energy 36 (2009) 1560–1573 1573
decision makers have the choice to pick the appropriate solutionfrom the small group of solutions in the chosen cluster, best suitingthe utility interest. The investigation like this, as illustrated in thispaper generally compares the impact of two sets of decision vari-ables, i.e. the old TS&M requirements and the new suggested op-tions, on the risk and cost trade off of the NPP. The uncertaintiescould be an issue and have been kept out of scope for the currentstudy. However, both the solutions old and new will have similaruncertainties associated with it. Thus this investigation only dis-cusses a comparative study to improve upon the present risk andcost profile of a nuclear power plant to a optimized risk and costprofile for better safety management.
7. Conclusions
The multi-objective optimization of the TS&M requirements of aNPP based on risk and cost, gives the pareto-optimal solutions,from which the utility can choose suitable decision variables. Inall the cases discussed in the paper, we can see that the risk targetrequirement can be satisfied from regulatory stand point. How-ever, the associated cost is far away from the pareto-optimal solu-tion front. Therefore considerable scope exists to improve the riskand cost concerns of the plant. The paper shows that the TS&Mparameters STI, AOT, PM and the over-haul period for different sys-tems and equipment chosen from the pareto-optimal front willconsistently satisfy the risk target and the resource allocation willbe risk consistent.
The constrained multi-objective optimization is proved to be aneffective tool for meeting the probabilistic safety criteria for theNPPs. The genetic algorithm has proved to be efficient in comput-ing the optimal solutions. The proposed use of clustering techniquewith the higher-level information really focuses the choice of deci-sion to a plausible small set of solutions. The study confirms thevalidity of the use of multi-objective optimization method fordetermining parameters of over-all safety management of the nu-clear power plants.
References
IAEA-TECDOC-529, 1989. Probabilistic safety criteria at the safety function/systemlevel, Vienna.
Painton, L., Campbell, J., 1995. Genetic algorithms in optimization of systemreliability. IEEE Transactions on Reliability 44 (2), 172.
Vaurio, J.K., 1995. Optimization of test and maintenance intervals based on risk andcost. Reliability Engineering & System Safety 49, 23.
Harunuzzaman, M., Aldemir, T., 1996. Optimization of standby safety systemmaintenance schedules in nuclear power plants. Nuclear Technology 113, 354.
Muñoz, A., Martorell, S., Serradell, V., 1997. Numerical absolute and constrainedoptimization of maintenance based on risk and cost criteria using geneticalgorithms. In: Proceedings of Advances in Safety and Reliability, ESREL’97.Lisbon, vol. 3, p. 1749.
Levitin, G., Lisnianski, A., 1999. Join redundancy and maintenance optimization formultistage series-parallel systems. Reliability Engineering & System Safety 64,33.
Martorell, S., Sanchez, A., Carlos, S., Serradell, V., 2002. Simultaneous and multicriteria optimization of TS requirements and maintenance at NPPs. Annals ofNuclear Energy 29, 147–168.
Yang, J., Sung, T., Jin, Y., 2000. Optimization of the surveillance test interval of thesafety systems at the plant level. Nuclear Technology 132, 352.
Henley, J., Kumamoto, H., 1981. Reliability Engineering and Risk Assessment.Printice-Hall, Englewood Cliffs, NJ.
Mishra, A., 2006. Regulation of nuclear power plant a multi-objective approach,Ph.D. Thesis, IIT Bombay.
Mishra, A., Patwardhan, A., Verma, A.K., 2007. Safety management in NPPs using anevolutionary algorithm technique. Nuclear Engineering and Design 237, 1445–1451.
Relcon Scand Power, 2002. Risk Spectrum Manual. Stockholm, Sweden.Horn, J., Nafploltis, N., Goldberg, D.E., 1994. A niched pareto genetic algorithm for
multi-objective optimization. In: Michalewicz, Z. (Ed.), Proceedings of the 1stIEEE Conference on Evolutionary Computation, Piscataway, Newjersy, pp. 82–87 .
Srinivas, N., Deb, K., 1995. Multi-objective function optimization using non-dominated sorting genetic algorithms. Evolutionary Computation 2 (3), 221–248.
Deb, K., 2001. Multiobjective Optimization Using Evolutionary Algorithms. Wiley,Chlchester, UK.
Deb, K., Agarwal, S., Pratap, A., Meyarivan, T., 2002. A fast and elitist multi-objectivegenetic algorithm: NSGA-II. IEEE Transactions on Evolutionary Computation 6(2), 182–197.
Deb, K., Agarwal, R.B., 1995. Simulated binary crossover for continuous searchspace. Complex Systems 9, 115–148.
Deb, K., Pratap, A., Meyarivan, T., 2001. Constrained test problems for multi-objective evolutionary optimization. In: Proceedings of the First InternationalConference on Evolutionary Multi-Criteria Optimizaton (EMO-2001), pp. 284–298.