Embed Size (px)
Citation preview

The author(s) shown below used Federal funds provided by the U.S. Department of Justice and prepared the following final report: Document Title: Reliability Assessment of Current Methods in
Bloodstain Pattern Analysis Author(s): Terry Laber, Paul Kish, Michael Taylor, Glynn
Owens, Nikola Osborne, James Curran Document No.: 247180 Date Received: June 2014 Award Number: 2010-DN-BX-K213 This report has not been published by the U.S. Department of Justice. To provide better customer service, NCJRS has made this Federally-funded grant report available electronically.
Opinions or points of view expressed are those of the author(s) and do not necessarily reflect
the official position or policies of the U.S. Department of Justice.
NIJ Award # 2010-DN-BX-K213
Reliability Assessment of Current Methods in Bloodstain
Pattern Analysis
Final Report for the National Institute of Justice
Award # 2010-DN-BX-K213
Grant Period: 1 October 2010 – 31 March 2014
Principal Investigators:
Terry Laber Minnesota Bureau of Criminal Apprehension 1430 Maryland Avenue East St. Paul, MN 55106 Ph. (651) 492-9910 Fax: (651) 793-2901 [email protected]
Dr. Michael C. Taylor Institute of Environmental Science and Research 27 Creyke Rd, Christchurch 8031 New Zealand Ph. (64) 3 351-6814, Fax (64) 3 351-0046 [email protected]
Paul E. Kish Forensic Consultant & Associates P. O. Box 814, Corning, New York 14830 Ph. (607) 962-8092 Fax: 607-962-2093 [email protected]
Professor G Owens Department of Psychology University of Auckland Private Bag 92019, Auckland New Zealand Ph. (64) 9 373-7599 Fax (64) 9 373 7902 [email protected]
Co-authors: Dr. Nikola Osborne (Research Associate) Institute of Environmental Science and Research 27 Creyke Rd, Christchurch 8031 New Zealand [email protected]
Professor James Curran Department of Statistics University of Auckland Private Bag 92019, Auckland New Zealand Ph. (64) 9 373-7599 Fax (64) 9 373 7902 [email protected]
This document is a research report submitted to the U.S. Department of Justice. This report has not been published by the Department. Opinions or points of view expressed are those of the author(s)
and do not necessarily reflect the official position or policies of the U.S. Department of Justice.
NIJ Award # 2010-DN-BX-K213
ABSTRACT
To date there have been relatively few error rate or validation studies in BPA and none has
investigated the role that contextual information might have on analysts’ conclusions. This
study was designed to produce the first baseline measure of reliability for the major BPA
method of pattern recognition. The approach used was designed to help define the upper limit
of pattern classification reliability by focusing attention on method reliability rather than
analyst competency.
A panel of experienced bloodstain pattern analysts examined over 730 patterns in two phases
of the study, one focussing on three rigid non-absorbent surfaces (painted wood, wallpaper and
chipboard) representing commonly encountered crime scene surfaces and the other on three
fabric surfaces (cotton sweatpants, polyester trousers and demin jeans) representing clothing.
Six different pattern types, blunt force impact spatter, firearms (back and forward) spatter,
cast-off, satellite stains from a drip pattern, transfer and expirated, were used over the two
studies. The extent of available pattern, the nature of the substrate and the type of contextual
information (positive, negative and neutral bias) were varied in a balanced experiment
designed to determine the effect of these variables on pattern classification accuracy. As a
small adjunct to the main focus on pattern recognition, a set of superimposed bloodstains
prepared on non-absorbent rigid surfaces was also included for sequence of events
determinations.
Where a bloodstain pattern classification was made, either by choosing a single pattern or by
nominating more than one, 13.1% of these classifications did not include the correct pattern
type for the rigid surfaces and 23.4% for fabric surfaces. These can be considered the first
approximations of overall error rates for the pattern classification method. Some patterns
were more reliably classified than others. In particular the error rate was 4% for expirated
patterns on rigid surfaces and 8% for impact patterns on fabric surfaces. The highest rates of
misclassification were 59% for satellite stains from a drip pattern on fabric surfaces and 19% for
impact patterns on rigid surfaces. Generally speaking where the pattern was more difficult to
This document is a research report submitted to the U.S. Department of Justice. This report has not been published by the Department. Opinions or points of view expressed are those of the author(s)
and do not necessarily reflect the official position or policies of the U.S. Department of Justice.
NIJ Award # 2010-DN-BX-K213
recognise (e.g. less pattern available or a patterned substrate), analysts became more
conservative in their judgment, choosing the inconclusive option.
Study results showed that where a scenario was offered that deliberately pointed analysts
towards the correct classification, the proportion of misclassifications that resulted was
significantly lower (8% rigid surfaces, 14% fabric surfaces) than that observed for patterns with
neutral scenarios (11% rigid surfaces, 26% fabric surfaces). This is an example of the well-
known phenomenon of confirmation bias. Where a scenario was offered that deliberately
pointed analysts towards an incorrect classification, the proportion of misclassifications that
resulted was significantly higher (20% rigid surfaces, 30% fabric surfaces) than that observed for
patterns with neutral scenarios (11% rigid surfaces, 26% fabric surfaces).
The supplementary study on superimposed patterns showed that, for the current sequencing
methods, the chances of incorrectly concluding the order of deposition in a spatter/transfer
pattern combination is approximately 12% where spatter stains are deposited on top of
transfer stains and 17% for the reverse sequence.
The implications for practitioners and agencies involved in BPA are discussed.
This document is a research report submitted to the U.S. Department of Justice. This report has not been published by the Department. Opinions or points of view expressed are those of the author(s)
and do not necessarily reflect the official position or policies of the U.S. Department of Justice.
NIJ Award # 2010-DN-BX-K213
TABLE OF CONTENTS
EXECUTIVE SUMMARY .................................................................................................................... 1
Introduction................................................................................................................................. 1
Phase 1 The Reliability of Pattern Classification for Bloodstain Patterns on Rigid non-
absorbent Surfaces ...................................................................................................................... 2
Methods ................................................................................................................................... 2
Results and Discussion ............................................................................................................. 4
Phase 2 The Reliability of Pattern Classification for Bloodstain Patterns on Fabric Surfaces .... 7
Methods ................................................................................................................................... 7
Results and Discussion ............................................................................................................. 8
Supplementary Study: The Reliability of Bloodstain Pattern Sequencing ............................. 11
Introduction ........................................................................................................................... 11
Methods ................................................................................................................................. 11
Results and Discussion ........................................................................................................... 12
Conclusions................................................................................................................................ 13
MAIN BODY OF TECHNICAL REPORT ............................................................................................. 14
INTRODUCTION ............................................................................................................................. 14
Statement of the Problem......................................................................................................... 14
Literature Review ...................................................................................................................... 17
Research Hypothesis and Strategy ............................................................................................ 20
PHASE 1 The Reliability of Pattern Classification for Bloodstain Patterns on Rigid Non-absorbent
Surfaces ......................................................................................................................................... 22
Methods .................................................................................................................................... 22
Participants ............................................................................................................................ 22
This document is a research report submitted to the U.S. Department of Justice. This report has not been published by the Department. Opinions or points of view expressed are those of the author(s)
and do not necessarily reflect the official position or policies of the U.S. Department of Justice.
NIJ Award # 2010-DN-BX-K213
Materials ................................................................................................................................ 22
Survey Procedure................................................................................................................... 28
Error rate determination ....................................................................................................... 29
Overall pattern classification performance ........................................................................... 30
Results and Discussion .............................................................................................................. 31
Overall Pattern Classification Accuracy ................................................................................. 31
Effect of Pattern Type ............................................................................................................ 32
Effect of Extent ...................................................................................................................... 36
Effect of Substrate ................................................................................................................. 38
Effect of Context .................................................................................................................... 39
PHASE 2 The Reliability of Pattern Classification for Bloodstain Patterns on Fabric Surfaces ..... 43
Methods .................................................................................................................................... 43
Participants ............................................................................................................................ 43
Materials ................................................................................................................................ 43
Survey Procedure................................................................................................................... 47
Error rate determination ....................................................................................................... 48
Overall pattern classification performance ........................................................................... 48
Results and Discussion .............................................................................................................. 48
Overall Pattern Classification Accuracy ................................................................................. 48
Effect of Pattern Type ............................................................................................................ 50
Effect of Extent ...................................................................................................................... 53
Effect of Substrate ................................................................................................................. 55
Effect of Context .................................................................................................................... 56
SUPPLEMENTARY STUDY: The Reliability of Bloodstain Pattern Sequencing .............................. 60
This document is a research report submitted to the U.S. Department of Justice. This report has not been published by the Department. Opinions or points of view expressed are those of the author(s)
and do not necessarily reflect the official position or policies of the U.S. Department of Justice.
NIJ Award # 2010-DN-BX-K213
Introduction............................................................................................................................... 60
Methods .................................................................................................................................... 61
Results and Discussion .............................................................................................................. 62
CONCLUSIONS ............................................................................................................................... 68
Discussion of findings ................................................................................................................ 68
Implications for policy and practice .......................................................................................... 71
Implications for further research .............................................................................................. 72
REFERENCES .................................................................................................................................. 73
DISSEMINATION OF RESEARCH FINDINGS .................................................................................... 75
APPENDIX 1 PARTICIPANT GENERAL INSTRUCTIONS .............................................................. 76
This document is a research report submitted to the U.S. Department of Justice. This report has not been published by the Department. Opinions or points of view expressed are those of the author(s)
and do not necessarily reflect the official position or policies of the U.S. Department of Justice.
NIJ Award # 2010-DN-BX-K213 1
EXECUTIVE SUMMARY
Introduction
Bloodstain Pattern Analysis (BPA) has been used in criminal investigations since the 1800s. Like
many other disciplines from the early days of forensic science, its use and acceptance occurred
without rigorous validation. Like other forensic practitioners, bloodstain pattern analysts are
grappling with the problem of assessing the reliability of the methodology they use. At this
time very little is known about this beyond the instincts of experienced instructors and
investigators who have observed the reproducibility of bloodstain patterns over many crime
scenes and practical sessions in the classroom.
It is well known that different bloodletting mechanisms can give rise to bloodstain patterns that
possess similar or indistinguishable characteristics. Furthermore, at times, a pattern might only
comprise one, or a small number of stains, meaning an analyst must decide if he/she has
sufficient data to make a reliable classification. In addition, the surface characteristics of the
substrate on which the bloodstain is created, whether a hard smooth surface or an absorbent
fabric, might add another level of complexity to the pattern recognition task.
One other compounding problem may also exist. Bloodstain patterns are analysed in the
context of a case with the objective to assist with the reconstruction of events. This means that
once the pattern is classified its relevance to the case investigation is considered. These two
processes (pattern recognition and reconstruction) frequently overlap. This is not helped by
the fact that, at present, there isn’t a rigorous protocol for BPA that distinguishes the two
processes. This means that at an early stage of the analysis, additional case-specific
information, such as medical findings, case circumstances and even witness testimony may be
considered during the analyst’s interpretation. This has the potential to introduce bias into the
pattern recognition process.
To date there have been relatively few published error rate or validation studies in BPA and
none has investigated the role that contextual information might have on analysts’ conclusions.
This document is a research report submitted to the U.S. Department of Justice. This report has not been published by the Department. Opinions or points of view expressed are those of the author(s)
and do not necessarily reflect the official position or policies of the U.S. Department of Justice.
NIJ Award # 2010-DN-BX-K213 2
This study was designed to produce the first baseline measure of reliability for the major BPA
method of pattern recognition.
The strategy adopted was to assemble a panel of experienced bloodstain pattern analysts and
ask them to classify a series of patterns covering a range of pattern types. The patterns
included stains made under a variety of conditions relevant to a crime scene and included some
sets of stains produced under ‘ideal’ conditions. The type of pattern, extent of available
pattern, the nature of the substrate and the type of contextual information were varied in a
balanced experiment designed to determine the effect of these variables on pattern
classification accuracy. The approach used here was designed to help define the upper limit of
pattern classification reliability by focusing attention on method reliability rather than analyst
competency.
The study was conducted in two phases. In Phase 1 bloodstain patterns on non-absorbent rigid
surfaces were analysed. This phase was designed to be relevant to the use of BPA at a crime
scene. In Phase 2 absorbent fabric surfaces were used. The phase was designed to replicate, in
part, the use of BPA in the laboratory, where bloodstained clothing is frequently analysed.
As a small adjunct to the main focus on pattern recognition, a survey of superimposed
bloodstains prepared on non-absorbent rigid surfaces was also included. This was designed to
give a preliminary assessment of the effectiveness of bloodstain pattern sequencing methods.
Phase 1 The Reliability of Pattern Classification for Bloodstain Patterns on
Rigid non-absorbent Surfaces
Methods
Participants were 27 invited bloodstain pattern analysts from North America, Australasia, and
Europe. All were invited based on their experience and standing within the BPA community,
and were required to meet the following three criteria; 1) must have completed at least 80
This document is a research report submitted to the U.S. Department of Justice. This report has not been published by the Department. Opinions or points of view expressed are those of the author(s)
and do not necessarily reflect the official position or policies of the U.S. Department of Justice.
NIJ Award # 2010-DN-BX-K213 3
hours training in BPA, 2) must have been active in BPA casework for a minimum of five years,
and 3) must be qualified by a court as an expert in BPA and have provided expert testimony.
Bloodstain patterns representing four different common pattern types; blunt force impact
spatter, firearms (back and forward) spatter, cast-off pattern, and expirated blood pattern were
prepared. Patterns were created on 16 inch x 16 inch (40 cm x 40 cm) hard surface targets,
mounted on a vertical surface.
Blunt force impact spatter patterns were produced by the impact of a hammer on a pool of
blood containing 1 – 6 drops of blood. Cast-off patterns were created from the swinging of a
blood-covered wrench or a small bloodied knife, swung towards and across the target surfaces.
Expirated patterns were created by an experimenter blowing air gently through blood-covered
lips or by coughing a small volume of blood from the mouth onto nearby vertical target
surfaces. Firearms-related bloodstain patterns were created by shooting a .22 calibre bullet
though a blood soaked sponge. Backspatter or forward spatter was collected on vertically
positioned targets.
In addition to the four pattern types, there were two manipulated variables related to pattern
construction. These were the substrate that the pattern was created on, and the extent of the
pattern that was produced on each target.
Patterns were made on three different hard-surface substrates, designed to represent varying
levels of anticipated identification difficulty: paint, wallpaper, and chipboard.
There were three levels of pattern extent; minimum, medium, and maximum. Category
membership was determined by an approximation of the total number of stains in the pattern,
and the number of stains larger than 1 mm in diameter.
A final variable manipulated the context that accompanied each target pattern. The contextual
information was presented in the form of a short vignette, giving background information
about how the bloodstain pattern was found and what was known about the case. The
scenario either contained information that supported the correct answer (positive), was
This document is a research report submitted to the U.S. Department of Justice. This report has not been published by the Department. Opinions or points of view expressed are those of the author(s)
and do not necessarily reflect the official position or policies of the U.S. Department of Justice.
NIJ Award # 2010-DN-BX-K213 4
misleading towards a particular incorrect answer (negative), or contained no directional
information (neutral).
Analysts who consented to be part of the study were informed that the aim of the study was
not to test competency, but rather the reliability of BPA methodology. Furthermore, they were
informed that all responses would remain anonymous and could in no way be linked to any
specific analyst.
Each analyst received 15 or 16 targets, and a response sheet for each target. The response
sheet comprised two main parts. In Part 1 analysts were required to choose one pattern from a
set of pattern types based on standard SWGSTAIN terminology: This part was designed to give
an assessment of analysts’ confidence in making a singular decision. In Part 2 analysts could
select any number of patterns from the same list. This part was designed to assess how precise
analysts are able to be. In both parts analysts could select an “inconclusive” option.
In Part 1 we chose to determine an error rate based on the proportion of incorrect conclusions.
In Part 2 an error was deemed to have occurred when the analyst failed to identify the correct
pattern within their set of multiple answers given for a particular pattern. To provide some
overall assessment of the performance of pattern classification, a second scoring system scaled
participants’ responses as a function of both accuracy and precision. This scale rewarded
reduced ambiguity in all responses. This method was referred to as the Accuracy Precision (AP)
score. AP scores could range from plus 4 (a single correct classification) to minus 4 (four or
more nominated patterns, none of which included the true pattern). A fitted fully saturated
model was fitted to the data using linear regression. This was followed by a close to balanced
4-way analysis of variance.
Results and Discussion
Overall Pattern Classification Accuracy
Twenty seven analysts made judgements on 15-16 target patterns each, yielding 413 unique
assessments. When constrained to a single pattern response in Part 1, over half of the
This document is a research report submitted to the U.S. Department of Justice. This report has not been published by the Department. Opinions or points of view expressed are those of the author(s)
and do not necessarily reflect the official position or policies of the U.S. Department of Justice.
NIJ Award # 2010-DN-BX-K213 5
responses recorded as inconclusive. In those cases where a classification was made, there was
close to a 50% success rate.
The rate of inconclusive responses dropped to 17% in Part 2. Despite being allowed to select
any number of pattern classifications, 13% of these classifications did not include the correct
pattern type. Overall, the average AP score per sample was 1.71. The linear regression model
showed the main effects were all highly significant (p < 0.001).
Effect of Pattern Type
Analysts were prepared to give one unambiguous classification for 38% of the cast-off patterns.
This was followed in order by expirated (33%), impact (28%), and firearms-related spatter
(17%). When examining the proportion of correct and incorrect judgements for the single
responses, the higher degree of confidence in classifying cast-off and expirated patterns
appeared justified.
When both single and multiple classifications were considered, the effect of pattern type on the
frequency of correct, incorrect, and inconclusive responses was still significant (p =0.028). This
was mainly due to the success in identifying expirated patterns (81% success rate compared to
64 – 69% for the remaining types). The error rate across these pattern types was 4% for
expirated, 14% for cast-off, 16% for firearms-related spatter and 19% for impact, giving rise to
the overall error rate of 13% noted above.
Further support for the conclusion that expirated patterns are particularly easily identifiable
was seen in the average AP scores for each pattern type. On average, analysts were the most
accurate and precise when making judgements on expirated patterns, and the least for
judgements about firearms patterns. The coefficient for pattern type in the linear regression
model was significant (p < 0.001).
Effect of Extent
There was a significant overall difference in the frequency of correct, incorrect, and
inconclusive responses as a function of pattern extent (p < .0001). As might be expected,
This document is a research report submitted to the U.S. Department of Justice. This report has not been published by the Department. Opinions or points of view expressed are those of the author(s)
and do not necessarily reflect the official position or policies of the U.S. Department of Justice.
NIJ Award # 2010-DN-BX-K213 6
analysts’ accuracy improved as the amount of pattern (essentially the number of stains present
on the target) increased.
Although the amount of pattern available influenced analysts’ correct and inconclusive
decisions, the rate of making incorrect judgements was very similar. Analysts made fewer
correct decisions and more inconclusive decisions on patterns that contained only minimum
extent. This trend was reversed when the patterns had maximum extent.
AP scores for each pattern extent confirmed the conclusion that patterns with a minimal
number of stains in them were not classified as accurately or unambiguously as the more stain-
abundant patterns. The pattern extent coefficient in the linear regression model was significant
(p < 0.001).
Effect of Substrate
There was a significant overall difference in the frequency of correct, incorrect, and
inconclusive responses as a function of substrate (p < .0001). As expected, the plain white-
painted surface was the best surface for making correct pattern classifications and the more
“difficult” surfaces gave rise to fewer correct classifications. As observed in the pattern extent
effect, the drop in accuracy was matched by an increase in inconclusive responses rather than
erroneous ones.
AP scores for each pattern substrate confirmed the conclusion that patterns on the patterned
chipboard were not classified as accurately and unambiguously as the other two surfaces. The
coefficient for substrate in the linear regression model was significant (p < 0.001).
Effect of Context
There was a significant overall difference in the number of correct, incorrect, and inconclusive
responses as a function of context (p =0.015).
When a positive context was presented, participants were more likely to make a correct
decision than when the context was neutral, with the overall error rate dropping significantly
from 11% (neutral context) to 8%. They were also less likely to make an inconclusive decision.
This document is a research report submitted to the U.S. Department of Justice. This report has not been published by the Department. Opinions or points of view expressed are those of the author(s)
and do not necessarily reflect the official position or policies of the U.S. Department of Justice.
NIJ Award # 2010-DN-BX-K213 7
The result for positively-biasing context is an example of the well-known phenomenon of
confirmation bias.
It is also evident that a negative context influenced participants’ decision-making. Participants
were incorrect more often when there was a negative context, relative to when there was a
positive or neutral context, with the overall error rate increasing significantly from 11% (neutral
context) to 20%. They were also less likely to make an inconclusive decision.
Average AP scores for each type of added contextual bias confirmed the conclusion that added
bias influenced the conclusions of pattern classification in the direction of the bias. The
coefficient for context in the linear regression model was significant (p < 0.001).
Phase 2 The Reliability of Pattern Classification for Bloodstain Patterns on
Fabric Surfaces
Methods
Participants were 30 invited bloodstain pattern analysts from North America, Australasia, and
Europe and were invited on the same basis as for Phase 1 of this study.
Bloodstain patterns comprised five different pattern types; blunt force impact spatter, cast-off,
expirated, satellite stains from a drip pattern, and transfer were prepared. These pattern types
were chosen to represent those typically encountered on fabric surfaces in casework. Patterns
were created on the upper region of pairs of men’s trousers which were worn by one of the
experimenters during pattern creation. Two levels of pattern extent were used in this phase,
‘maximum’ and ‘minimum’.
Blunt force impact spatter patterns were created using the impact of a hammer on one drop of
blood (minimum extent) or eight drops (maximum extent). Cast-off patterns were created by
the swinging of blood covered fingers of a gloved hand. One finger was coated with blood to
make the minimum extent patterns while three bloodied fingers were used for maximum
extent patterns. Expirated patterns were created by an experimenter gently blowing air
This document is a research report submitted to the U.S. Department of Justice. This report has not been published by the Department. Opinions or points of view expressed are those of the author(s)
and do not necessarily reflect the official position or policies of the U.S. Department of Justice.
NIJ Award # 2010-DN-BX-K213 8
through blood-covered lips (minimum extent pattern), or by coughing blood from the mouth
(maximum extent pattern). Drip patterns were created by dripping consecutive drops of blood
in the same position on a table in close proximity to an experimenter, wearing the target
trousers. Three blood drops were used to create the minimum extent pattern, and 12 for the
maximum extent. Transfer patterns were created by contact between a bloodstained wig and
the target trousers. To create a minimum extent pattern the wig was touched briefly and
lightly against the thigh area of the target trousers. For the maximum extent pattern the wig
was touched firmly and for slightly longer.
Patterns were made on three different fabric-surface substrates chosen based on three
common types of trousers; polyester dress pants, blue denim jeans and grey cotton
sweatpants.
A final variable manipulated the context that accompanied each target pattern. This was done
in a similar manner to Phase 1.
The procedure for engaging participants was essentially the same as for Phase 1. Each analyst
received 12 - 15 targets, and a response sheet corresponding to each target. The response
sheet comprised two main parts with the same instructions and the same set of pattern types
as used for Phase 1, with the addition of satellite stains as a choice. The remaining aspects of
the procedure and the methods of determining error rate followed those used for Phase 1.
Results and Discussion
Overall Pattern Classification Accuracy
Thirty analysts made judgements on 12 - 15 target patterns each, yielding 321 unique
assessments. When constrained to a single pattern response in Part 1, over half of the
responses recorded as inconclusive. In those cases where a classification was made, there was
a 64% success rate. This was a higher success rate than the hard surfaces in Phase 1.
The rate of inconclusive responses dropped to 14% in Part 2. Despite being allowed to select
any number of pattern classifications, 23% of these classifications did not include the correct
This document is a research report submitted to the U.S. Department of Justice. This report has not been published by the Department. Opinions or points of view expressed are those of the author(s)
and do not necessarily reflect the official position or policies of the U.S. Department of Justice.
NIJ Award # 2010-DN-BX-K213 9
pattern type. This was a higher error rate than for hard surfaces. Overall the average AP score
per sample was 1.30. This was lower than that observed in Phase 1, probably reflecting the
additional difficulty in classifying patterns on fabric surfaces. The linear regression model
showed the effects of pattern type, pattern extent and context were all highly significant (p <
0.001). The effect of substrate, however, was not significant at the 95% confidence level.
Effect of Pattern Type
Analysts were prepared to give one unambiguous classification for 51% of the cast-off patterns.
This was followed in order by drip (48%), transfer (31%), expirated (24%) and impact (18%).
However, unlike the results observed for hard surfaces, the confidence analysts had in
unambiguously classify patterns on fabric was not well correlated with the accuracy of
classification.
When both single and multiple classifications are considered, the effect of pattern type on the
frequency of correct, incorrect, and inconclusive responses was significant (p < 0.001). This was
mainly due to a lack of success in identifying satellite stains from drip patterns. The error rate
across these pattern types was 8% for impact, 14% for cast-off, 16% for expirated, 18% for
transfer and 59% for drip patterns, giving rise to the overall error rate of 23% noted above.
Further support for the conclusion that cast-off patterns are most easily identifiable and
satellite stains from drip patterns are the most problematic was evident in the average AP
scores for each pattern type. The coefficient for pattern type in the linear regression model
was significant (p < 0.001).
Effect of Extent
There was a significant overall difference in the frequency of correct, incorrect, and
inconclusive responses for the maximum extent patterns compared with the minimum extent
ones (p < .0001). As might be expected, analysts’ accuracy improved as the amount of pattern
increased.
The AP scores for the two pattern extents confirmed the conclusion that patterns with a
minimal number of stains in them were not classified as accurately or unambiguously as the
This document is a research report submitted to the U.S. Department of Justice. This report has not been published by the Department. Opinions or points of view expressed are those of the author(s)
and do not necessarily reflect the official position or policies of the U.S. Department of Justice.
NIJ Award # 2010-DN-BX-K213 10
more stain-abundant patterns. The pattern extent coefficient in the linear regression model
was significant (p < 0.001).
Effect of Substrate
There was an apparent improvement in the accuracy of classifying patterns on the sweat pants
but this was not statistically significant (p = 0.130).
The AP scores for each pattern substrate confirmed the conclusion that there was little
difference in the accuracy and precision of classifying patterns on the three fabric surfaces
chosen. The coefficient for substrate in the linear regression model was not significant (p
=0.183).
Effect of Context
There was a significant overall difference in the number of correct, incorrect, and inconclusive
responses as a function of context (p =0.003).
When a positive context was presented, participants were more likely to make a correct
decision than when the context was neutral, with the overall error rate dropping significantly
from 26% (neutral context) to 14%. They were also less likely to make an inconclusive decision.
This was also an example of confirmation bias. The overall error rate for positively-biased
contexts was higher than that for the rigid surfaces in Phase 1.
It is also evident that a negative context influenced participants’ decision-making. Participants
were incorrect more often when there was a negative context, relative to when there was a
positive or neutral context, with the overall error rate increasing significantly from 26% (neutral
context) to 30%. In contrast to the equivalent comparison in Phase 1, they were also more
likely to make an inconclusive decision.
The average AP scores for each type of added contextual bias confirmed the conclusion that
added bias apparently influenced the conclusions of pattern classification in the direction of the
bias. The coefficient for context in the linear regression model was significant (p < 0.001).
This document is a research report submitted to the U.S. Department of Justice. This report has not been published by the Department. Opinions or points of view expressed are those of the author(s)
and do not necessarily reflect the official position or policies of the U.S. Department of Justice.
NIJ Award # 2010-DN-BX-K213 11
Supplementary Study: The Reliability of Bloodstain Pattern Sequencing
Introduction
It is common for bloodstain patterns at crime scenes to be superimposed. The order in which
such patterns are deposited can sometimes be valuable evidence of the timing of the events
that took place. Despite the value of this type of evidence, there have been few published
studies made of bloodstain pattern sequencing and no standardized methods have emerged.
The objective of this supplementary study was to formally assess the reliability of current
methods for establishing the sequence of superimposed patterns where the first pattern
deposited has completely dried.
Methods
Two commonly encountered pattern types were selected for this study, namely spatter and
transfer. A total of 112 bloodstain patterns comprising superimposed transfer and spatter
stains were prepared, half of which were spatter stains superimposed on transfer stains and
half were transfer stains on spatter. The materials used were those described in Phase 1.
Transfer stains were created by drawing a blood-soaked cotton glove across the target surface,
giving a swipe pattern showing four fingers. Spatter stains were created by using a hammer to
strike one drop of blood. Bloodstains forming the first applied pattern were allowed to dry
thoroughly before the second pattern was superimposed.
There were two manipulated variables relating to pattern construction, namely pattern extent
(amount of spatter) and target substrate. These variables were identical to those described in
Phase 1.
Each analyst received a unique set of 3 or 4 sequencing targets and were informed that each
had both a transfer and a spatter pattern on it. They were asked to determine the sequence
these two patterns have been applied in or indicate that they could not reach a conclusion.
This document is a research report submitted to the U.S. Department of Justice. This report has not been published by the Department. Opinions or points of view expressed are those of the author(s)
and do not necessarily reflect the official position or policies of the U.S. Department of Justice.
NIJ Award # 2010-DN-BX-K213 12
Results and Discussion
104 survey responses were received, comprising 50 combinations of spatter stains
superimposed on transfer stains and 54 transfer stains on spatter. Of the 104 conclusions
given, over half (52.9%) were recorded as inconclusive, 32.7% correctly assigned the sequence
and 14.4% gave an incorrect interpretation.
Where spatter stains were deposited on top of transfer stains, 48% of the patterns were
correctly sequenced, whereas for the reverse sequence this figure dropped to 19%. There was
a corresponding increase in the proportion of inconclusive responses from 40% to 65%.
These results appear to show that when spatter stains are deposited on transfer stains, analysts
were more willing to give a conclusion, and those conclusions are more likely to be correct. For
those targets that analysts were prepared to make an interpretation, 80% were correct when
the pattern was spatter on transfer, but only 53% were correct if the transfer followed the
spatter. The difference in response between the two pattern combinations was statistically
significant (p = 0.004).
Overall, the effect of substrate on correct responses was not significant (p = 0.581). The
number of incorrect conclusions increased and the number of inconclusive responses
decreased slightly, as the extent of spatter increased, in both spatter on transfer and transfer
on spatter combinations. So for example, those targets that had a spatter pattern with many
stains (i.e., maximum extent) overlaid with a transfer pattern gave the highest number of
incorrect interpretations. The overall effect of pattern extent was significant (p = 0.046).
Because the bloodstains in this study were allowed to dry completely between the two
depositions, there were no perimeter stain effects to give clues as to the order of deposition. In
the absence of this, it is possible that the analysts’ attention was drawn to the intensity of the
individual stains, with the more intense stains reckoned to be the more recent of the two
depositions.
This document is a research report submitted to the U.S. Department of Justice. This report has not been published by the Department. Opinions or points of view expressed are those of the author(s)
and do not necessarily reflect the official position or policies of the U.S. Department of Justice.
NIJ Award # 2010-DN-BX-K213 13
Conclusions
The results of this study provide the first approximations of overall error rates for the pattern
classification method in BPA. This has been shown to be dependent on the pattern type, the
amount of available pattern and the substrate. Generally speaking where the pattern was
more difficult to recognise, analysts became more conservative in their judgment, which is
what the court would expect from a reliable method.
Study results showed that where a scenario was offered that deliberately pointed analysts
towards the correct classification, the proportion of misclassifications that resulted was
significantly lower than that observed for patterns with neutral scenarios. This is an example of
the well-known phenomenon of confirmation bias. Where a scenario was offered that
deliberately pointed analysts towards an incorrect classification, the proportion of
misclassifications that resulted was significantly higher than that observed for patterns with
neutral scenarios.
It seems prudent for practitioners and agencies to take steps to minimise the effects of
contextual information in the practice of BPA. It would also be advantageous for the BPA
community to agree on a standard methodology for the analysis of bloodstain patterns which
includes a better distinction between classification and reconstruction and relies less on
mechanistic descriptions of patterns. It is recommended that these steps be under-pinned by
further research into an understanding the cognitive steps taken by BPA analysts during pattern
classification and the development of objective methods to classify patterns.
This document is a research report submitted to the U.S. Department of Justice. This report has not been published by the Department. Opinions or points of view expressed are those of the author(s)
and do not necessarily reflect the official position or policies of the U.S. Department of Justice.
NIJ Award # 2010-DN-BX-K213 14
MAIN BODY OF TECHNICAL REPORT
INTRODUCTION
Statement of the Problem
Bloodstains are a common by-product of violent crime and analysis of these stains is a vital part
of a crime scene investigation. Despite the fact that DNA analysis can now routinely identity
the individuals that have bled at a scene, other important questions can remain unanswered.
For example, it is not uncommon for a suspect to claim that the blood found on his clothing was
deposited when he was trying to aid the victim. In these situations understanding the
mechanism by which the stains were deposited onto an article of clothing could be more telling
than knowing from whom the blood originated. This is where the analysis of bloodstain
patterns can often give valuable clues as to how the blood came to be where it was found,
hence the emergence of Bloodstain Pattern Analysis (BPA) as a vital tool for forensic
investigators.
Although the dynamics of the formation of a bloodstain pattern appear to be infinitely variable
it is nevertheless true that bloodstain patterns have reproducible characteristics that allow a
connection to be made between the distribution of bloodstains and the underlying mechanism
of their formation. Thus, at the heart of BPA is the recognition and classification of the
bloodstain pattern.
In the past few years there have been several high profile homicide trials in which bloodstain
pattern analysts have found themselves at the center of controversial arguments relating to the
explanation of the mechanisms that produce very small bloodstains on clothing (e.g. R v Jenkins,
London Court of Appeal 1999, Indiana v Camm, Indiana Supreme Court 2009). At the center of
these controversies is the observation that different mechanisms can produce bloodstain
patterns that apparently do not have significant individual characteristics to distinguish how the
This document is a research report submitted to the U.S. Department of Justice. This report has not been published by the Department. Opinions or points of view expressed are those of the author(s)
and do not necessarily reflect the official position or policies of the U.S. Department of Justice.
NIJ Award # 2010-DN-BX-K213 15
pattern was produced. For example Impact1, Expiration2 and Transfer3 patterns [1] can all
feature small bloodstains and can be confused with one another, especially on fabric.
BPA has been used in criminal investigations since the 1800s. Like many other disciplines from
the early days of forensic science, its use and acceptance occurred without rigorous validation.
The Scientific Working Group on Bloodstain Pattern Analysis (SWGSTAIN) has published a paper
on the validation of new procedures [2] and is making valuable progress in setting new
standards for training and education, terminology and quality assurance for the discipline.
However like other forensic practitioners, bloodstain pattern analysts are grappling with the
problem of assessing the reliability of the methodology they use. At this time very little is
known about this beyond the instincts of experienced instructors and investigators who have
observed the reproducibility of bloodstain patterns over many crime scenes and practical
sessions in the classroom. While such experience has served as the main basis for assessing the
reliability of bloodstain pattern analysis testimony in the past, the courts now rightly demand
much more.
No scientific method is without error or uncertainty and bloodstain pattern analysis is no
exception. Even a casual perusal of responses to quality assurance testing programs, such as
the bloodstain pattern analysis trials produced by Collaborative Testing Services, shows that
there are some significant differences in pattern classification conclusions reached by trained
BPA investigators.
It is well known that different bloodletting mechanisms can give rise to bloodstain patterns that
possess similar or indistinguishable characteristics. Furthermore, at times, a pattern might only
comprise one, or a small number of stains, meaning an analyst must decide if he/she has
sufficient data to make a reliable classification. In addition, the surface characteristics of the
substrate on which the bloodstain is created, whether a hard smooth surface or an absorbent
fabric, might add another level of complexity to the pattern recognition task.
1 An impact pattern is a bloodstain pattern resulting from an object striking liquid blood.
2 An expirated pattern is a bloodstain pattern resulting from blood forced by airflow out of the nose, mouth, or a
wound. 3 A transfer stain is a bloodstain resulting from contact between a blood-bearing surface and another surface.
This document is a research report submitted to the U.S. Department of Justice. This report has not been published by the Department. Opinions or points of view expressed are those of the author(s)
and do not necessarily reflect the official position or policies of the U.S. Department of Justice.
NIJ Award # 2010-DN-BX-K213 16
Although the size and distribution of individual bloodstains are often measured, pattern
recognition methods rely primarily on a qualitative assessment of the appearance of the
pattern. It is essential therefore that these methods are well understood, their reliability is
demonstrable and that any pattern evidence proffered can be supported by statements that
guide the courts in their assessment of the extent of that reliability.
One other compounding problem may also exist. Bloodstain patterns are analysed in the
context of a case with the objective to assist with the reconstruction of events. This means that
once the pattern is classified its relevance to the case investigation is considered. These two
processes (pattern recognition and reconstruction) frequently overlap. This is not helped by
the fact that, at present, there isn’t a rigorous protocol for BPA that distinguishes the two
processes. This means that at an early stage of the analysis, additional case-specific
information, such as medical findings, case circumstances and even witness testimony may be
considered during the analyst’s interpretation. This has the potential to introduce bias into the
pattern recognition process.
One of the complications for any study of method reliability is the variability in the methods
used. At this time there is no discipline standard in the methodology employed by bloodstain
pattern analysts. Two suggestions have been made to meet this need [3, 4], but so far there
has been no significant effort made to establish these or any other approaches as standards. In
fact it is possible that some bloodstain pattern analysts would struggle to articulate the
methodology they employ.
It is against this backdrop that the present study has been constructed. Testing the reliability of
bloodstain pattern analysis methods is not a straightforward task. For example it is generally
impossible to know with certainty the ‘true’ mechanistic cause of a bloodstain pattern at a
crime scene. For this reason, procedures to test method reliability are limited to artificially-
created scenarios for which the ‘true answer’ can be known. This approach has the risk of
underestimating identification errors because some of the dynamics present in a real case
investigation are lacking. For example, factors such as the expectations of other stakeholders in
This document is a research report submitted to the U.S. Department of Justice. This report has not been published by the Department. Opinions or points of view expressed are those of the author(s)
and do not necessarily reflect the official position or policies of the U.S. Department of Justice.
NIJ Award # 2010-DN-BX-K213 17
the investigation and the knowledge that the outcome of the analyst’s findings could influence
the life or liberty of a defendant are not easily simulated in an artificially created scenario.
Despite these difficulties it is nevertheless important to take steps towards understanding this
reliability. This study was designed to do that.
Literature Review
To date there have been relatively few published error rate or validation studies in BPA. De
Forest, et al., discussed the error associated with determining the impact angles of airborne
droplets [5]. They attributed a 5 degree margin of error in this determination to droplet
oscillations while in flight or droplet expansion when striking the surface. Gestring, et al.,
showed that this error drastically increased as the stain became more circular and was
dependent on the substrate on which the stain was produced [6].
Laturnus has surveyed the measurement of individual bloodstains [7]. This study was the first
systematic attempt to evaluate accuracy and methodology used in making this determination.
In addition to using different tools to evaluate the stains, the participants also had divergent
methods of measuring stain length.
Carter has developed validated methods for determining areas of origin for blood spatter using
the computer software program BackTrack [8-10].
With the requirements of the Daubert criteria [11] in mind, Meneses, Kish, and Gestring sought
to evaluate the error rate for the first step of BPA, namely basic pattern recognition [12]. Since
examiner competency and method error rate are linked, this preliminary study evaluated how
often trained examiners were able to successfully identify bloodstain patterns. This was
accomplished through the use of a web-based survey tool. Ten basic bloodstain patterns were
created on cardboard substrates. Participants were shown pictures of the bloodstain patterns
and asked to describe the mechanism that created the pattern.
This document is a research report submitted to the U.S. Department of Justice. This report has not been published by the Department. Opinions or points of view expressed are those of the author(s)
and do not necessarily reflect the official position or policies of the U.S. Department of Justice.
NIJ Award # 2010-DN-BX-K213 18
The survey was taken by 92 self-identified experts and 65 control group members of equivalent
educational background. Overall the experts correctly identified the pattern type 97% of the
time, while the control group only got it right 21% of the time.
While this is a promising start, this research had some limitations that need to be overcome in
future studies. As an example, the web delivery system limited the resolution of images it
would accept to 150 kb. This forced the researchers to select patterns that could be adequately
represented with the limited resolution of the study. Furthermore there was no attempt to
investigate the role that contextual information might have on analysts’ conclusions.
Fabrics are among the most complex surfaces when it comes to characterizing bloodstain
patterns and their causes. It is well known that characteristics of the surface have a significant
effect on the formation of bloodstains on fabric [13, 14]. Most of the research in the area of
bloodstains on fabric has been focused on this effect [15-22].
Few studies have addressed the question of how to distinguish pattern types on fabric,
particularly when those patterns are dominated by small stains. Karger, et al., [18] used small
blood drops (0.1 -10 L) to generate a series of transfer stains on a variety of fabrics. These
were compared to a series of drip stains4 and spatter stains5 of similar size generated on the
same fabrics. Their results showed that transfer stains had a tendency to impregnate the
weave of the fabric whereas the drip and spattered droplets remained on the surface of the
weave.
Karger concluded that the dynamic characteristics seen in drip and spattered bloodstains will
never be reproduced in transfer bloodstains. Therefore, in most cases transfer stains can be
differentiated from drip and spatter stains by their lack of dynamic characteristics, though the
ability to differentiate between transfer and spatter bloodstains becomes more difficult with
smaller stains and fabrics with rougher or irregular surfaces.
4 A drip stain is a bloodstain that formed as the result of a falling drop that formed due to gravity.
5 A spatter stain is a bloodstain resulting from a blood drop dispersed through the air due to an external force
applied to a source of liquid blood.
This document is a research report submitted to the U.S. Department of Justice. This report has not been published by the Department. Opinions or points of view expressed are those of the author(s)
and do not necessarily reflect the official position or policies of the U.S. Department of Justice.
NIJ Award # 2010-DN-BX-K213 19
However Karger’s study did not appear to consider bloodstains less than 2 mm in size created
by relatively high velocity droplets, which are common in spatter patterns. Furthermore the
transfer stains were created by contact with some pressure, which might explain the observed
extra penetration of the blood into the fabric.
With the exception of Karger’s work, there appears to be a general consensus that the
difference in appearance between bloodstains caused by an impact event and those caused by
contact transfer is due to the level of penetration of the blood into weave of the fabric [13, 14,
23, 24]. The momentum of spatter causes the blood to be projected into the weave, whereas
with transfer stains, the blood tends to remain in the upper weave of the fabric. Despite these
studies no clearly articulated and validated method to distinguish transfer and spatter patterns
has emerged.
Physical aspects of bloodstain pattern formation may not be the only source of error in
bloodstain pattern identification. In particular, a considerable body of research over several
decades has demonstrated that evaluations and assessments may be influenced by contextual
and other cues which may set up particular expectations on the part of the investigator. It is
important to note that the effects of such expectations are not trivial, with one meta-analysis of
345 studies indicating a mean effect size of 0.33 [25]. Recognition of the role of such
expectancy effects has led to the widespread use of approaches such as the so-called “double-
blind” experiment, in which neither participant nor experimenter is aware of the specific
conditions generating any single datum point [26]. In the applied setting, however, it may be
difficult or impossible for an investigator to remain totally blind to contextual cues. It is
important, therefore, to assess the extent to which these may potentially have an impact on
the results obtained.
Investigating the role of context in forensic evidence interpretation is a relatively new area of
study, but the results so far provide genuine cause for concern. In particular, research has
shown that fingerprint experts can be influenced by contextual information that suggests a pair
of fingerprints are from the same or a different source [27, 28]. In other studies, even more
subtle contextual information presented alongside fingerprint pairs, such as images depicting
This document is a research report submitted to the U.S. Department of Justice. This report has not been published by the Department. Opinions or points of view expressed are those of the author(s)
and do not necessarily reflect the official position or policies of the U.S. Department of Justice.
NIJ Award # 2010-DN-BX-K213 20
violent and graphic crimes, increased the number of match decisions made [29, 30]. It is
important to note that in these studies, participants were only vulnerable to the influence of
context when the information they were making judgements on was ambiguous. That is, the
fingerprint pairs did not contain enough information to make a clear decision. To date no
equivalent study has been conducted on the role of contextual information in bloodstain
pattern analysis.
Research Hypothesis and Strategy
The research hypothesis at the heart of this study was:
“Pattern recognition in BPA is a reliable method when used by fully competent analysts”.
The study was designed to produce the first baseline measure of reliability for the major BPA
method of pattern recognition.
The strategy adopted was to assemble a panel of experienced bloodstain pattern analysts and
ask them to classify a series of patterns covering a range of pattern types. The patterns
included stains made under a variety of conditions relevant to a crime scene and included some
sets of stains produced under ‘ideal’ conditions, that is to say patterns produced to provide the
maximum chance of accurate classification. While it is acknowledged that training and
experience are important ingredients in the accurate conclusions reached by forensic analysts,
the approach used here was designed to help define the upper limit of pattern classification
reliability by focusing attention on method reliability rather than analyst competency.
The type of pattern, extent of available pattern, the nature of the substrate and the type of
contextual information were varied in a balanced experiment designed to determine the effect
of these variables on pattern classification accuracy.
The study was conducted in two phases. In Phase 1 bloodstain patterns on non-absorbent rigid
surfaces were analysed. This phase was designed to be relevant to the use of BPA at a crime
scene. In Phase 2 absorbent fabric surfaces were used. The phase was designed to replicate, in
part, the use of BPA in the laboratory, where bloodstained clothing is frequently analysed.
This document is a research report submitted to the U.S. Department of Justice. This report has not been published by the Department. Opinions or points of view expressed are those of the author(s)
and do not necessarily reflect the official position or policies of the U.S. Department of Justice.
NIJ Award # 2010-DN-BX-K213 21
As a small adjunct to the main focus on pattern recognition, a survey of superimposed
bloodstains prepared on non-absorbent rigid surfaces was also included. This was designed to
give a preliminary assessment of the effectiveness of bloodstain pattern sequencing methods.
This document is a research report submitted to the U.S. Department of Justice. This report has not been published by the Department. Opinions or points of view expressed are those of the author(s)
and do not necessarily reflect the official position or policies of the U.S. Department of Justice.
NIJ Award # 2010-DN-BX-K213 22
PHASE 1 The Reliability of Pattern Classification for Bloodstain Patterns on Rigid Non-absorbent Surfaces
Methods
Participants
Participants consisted of 27 bloodstain pattern analysts from North America, Australasia, and
Europe. All were invited based on their experience and standing within the BPA community,
and were required to meet the following three criteria; 1) must have completed at least 80
hours training in BPA, 2) must have been active in BPA casework for a minimum of five years,
and 3) must be qualified by a court as an expert in BPA and have provided expert testimony.
Materials
Bloodstain patterns.
Bloodstain patterns comprising four different pattern types; blunt force impact spatter,
firearms (back and forward) spatter6, cast-off pattern7, and expirated blood pattern were
prepared. These pattern types were chosen to reflect the potential for overlap in pattern
characteristics between pattern types, which can be problematic for bloodstain analysts, and
were designed to represent those typically encountered at crime scenes. As a further attempt
to represent the variability found in crime scenes, two methods were used to create each
pattern type.
Cast-off and blunt force impact spatter targets were made with fresh human blood, donated by
project volunteers. Blood was drawn into tubes containing EDTA anticoagulant and was used
within seven days of drawing. Blood for the firearms spatter was purchased from Memorial
6 Firearms-related spatter in the context of this report refers to bloodstain patterns associated with a gunshot,
either backspatter or forward spatter. A backspatter pattern is a bloodstain pattern resulting from blood drops that travelled in the opposite direction of the external force applied; associated with an entrance wound created by a projectile. A forward spatter pattern is a bloodstain pattern resulting from blood drops that traveled in the same direction as the impact force. 7 A cast-off pattern is a bloodstain pattern resulting from blood drops released from an object due to its motion.
This document is a research report submitted to the U.S. Department of Justice. This report has not been published by the Department. Opinions or points of view expressed are those of the author(s)
and do not necessarily reflect the official position or policies of the U.S. Department of Justice.
NIJ Award # 2010-DN-BX-K213 23
Blood Center, 737 Pelham Boulevard, Saint Paul, MN 55114, and was used within 30 days of
drawing. Blood for the expirated patterns was drawn from an experimenter on the same day it
was used, and was used unrefrigerated.
Patterns were created in a controlled laboratory setting at the Minnesota Bureau of Criminal
Apprehension (BCA) Laboratory. They were created on 16 inch x 16 inch (40 cm x 40 cm) hard
surface targets, mounted on a vertical surface. Completed targets were coated with a clear
lacquer to prevent deterioration and to assist with biohazard safety. This meant that no
chemical tests to identify blood or saliva were possible. Participants were expected to assume
that any visible red-brown stains were indeed bloodstains.
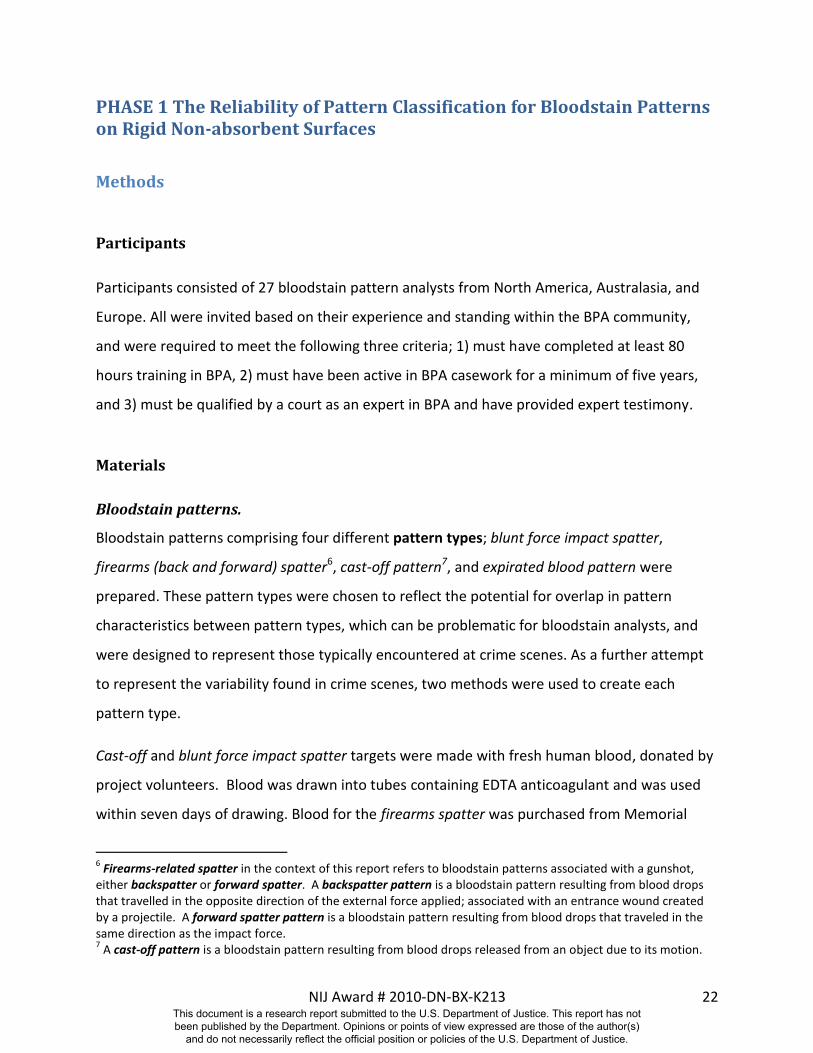
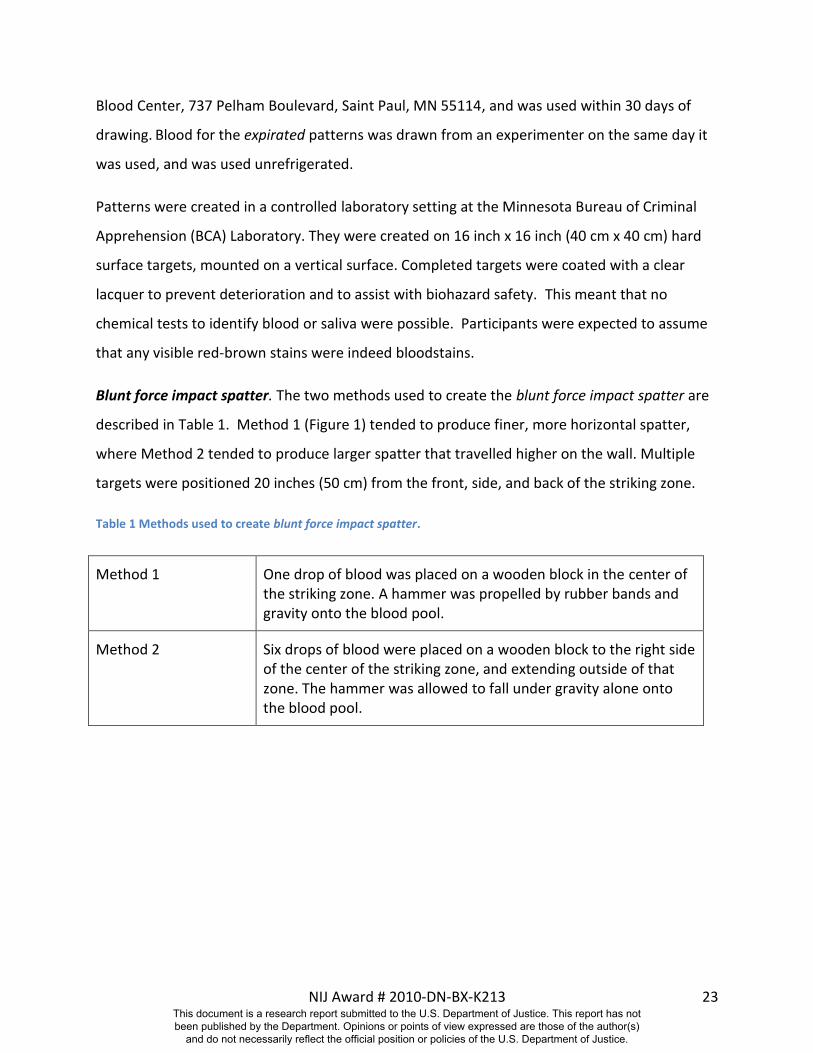
Blunt force impact spatter. The two methods used to create the blunt force impact spatter are
described in Table 1. Method 1 (Figure 1) tended to produce finer, more horizontal spatter,
where Method 2 tended to produce larger spatter that travelled higher on the wall. Multiple
targets were positioned 20 inches (50 cm) from the front, side, and back of the striking zone.
Table 1 Methods used to create blunt force impact spatter.
Method 1 One drop of blood was placed on a wooden block in the center of the striking zone. A hammer was propelled by rubber bands and gravity onto the blood pool.
Method 2 Six drops of blood were placed on a wooden block to the right side of the center of the striking zone, and extending outside of that zone. The hammer was allowed to fall under gravity alone onto the blood pool.
This document is a research report submitted to the U.S. Department of Justice. This report has not been published by the Department. Opinions or points of view expressed are those of the author(s)
and do not necessarily reflect the official position or policies of the U.S. Department of Justice.
NIJ Award # 2010-DN-BX-K213 24
Figure 1 Hammer set to be propelled by rubber band on to a wooden block to create blunt force impact spatter (Method 1).
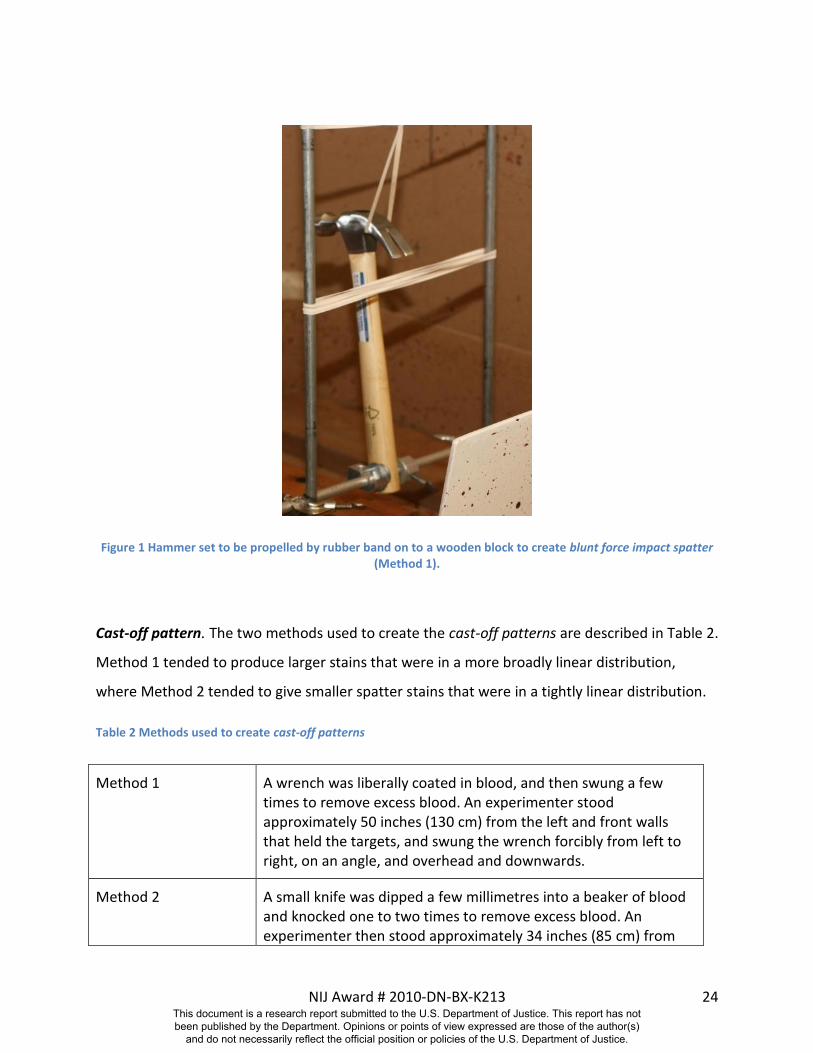
Cast-off pattern. The two methods used to create the cast-off patterns are described in Table 2.
Method 1 tended to produce larger stains that were in a more broadly linear distribution,
where Method 2 tended to give smaller spatter stains that were in a tightly linear distribution.
Table 2 Methods used to create cast-off patterns
Method 1 A wrench was liberally coated in blood, and then swung a few times to remove excess blood. An experimenter stood approximately 50 inches (130 cm) from the left and front walls that held the targets, and swung the wrench forcibly from left to right, on an angle, and overhead and downwards.
Method 2 A small knife was dipped a few millimetres into a beaker of blood and knocked one to two times to remove excess blood. An experimenter then stood approximately 34 inches (85 cm) from
This document is a research report submitted to the U.S. Department of Justice. This report has not been published by the Department. Opinions or points of view expressed are those of the author(s)
and do not necessarily reflect the official position or policies of the U.S. Department of Justice.
NIJ Award # 2010-DN-BX-K213 25
the left wall, and 50 inches (130 cm) from the front wall, and swung the knife forcibly towards the targets.
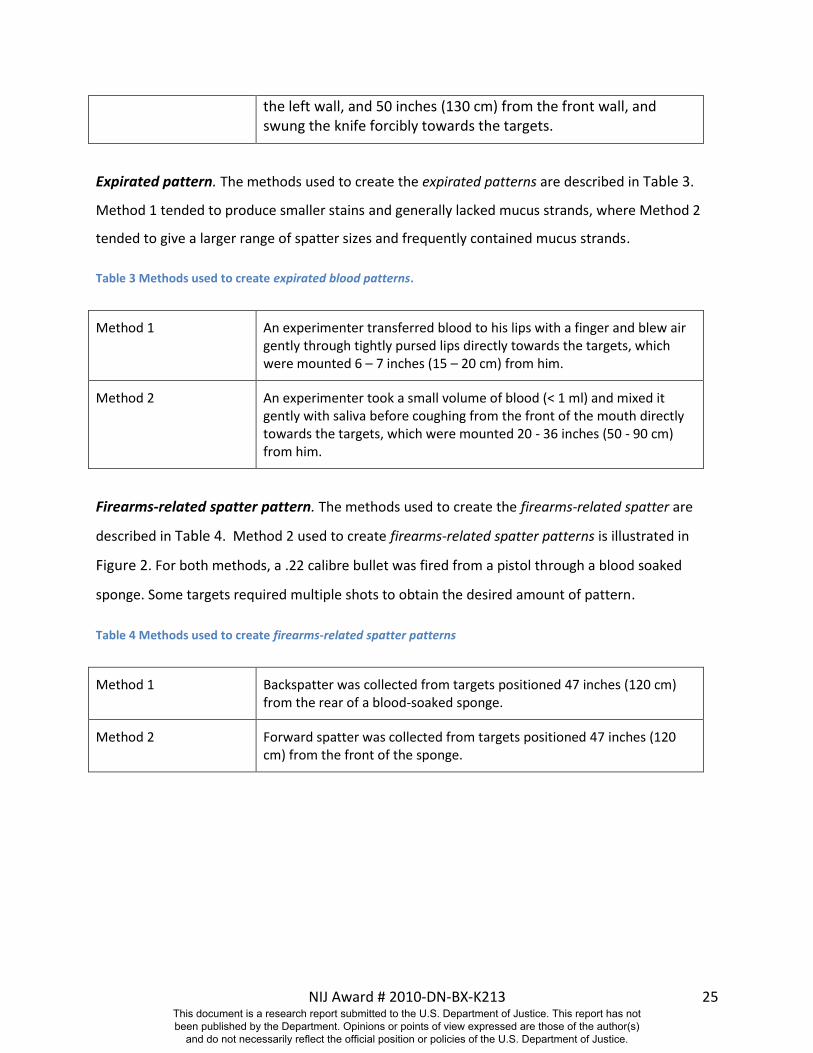
Expirated pattern. The methods used to create the expirated patterns are described in Table 3.
Method 1 tended to produce smaller stains and generally lacked mucus strands, where Method 2
tended to give a larger range of spatter sizes and frequently contained mucus strands.
Table 3 Methods used to create expirated blood patterns.
Method 1 An experimenter transferred blood to his lips with a finger and blew air gently through tightly pursed lips directly towards the targets, which were mounted 6 – 7 inches (15 – 20 cm) from him.
Method 2 An experimenter took a small volume of blood (< 1 ml) and mixed it gently with saliva before coughing from the front of the mouth directly towards the targets, which were mounted 20 - 36 inches (50 - 90 cm) from him.
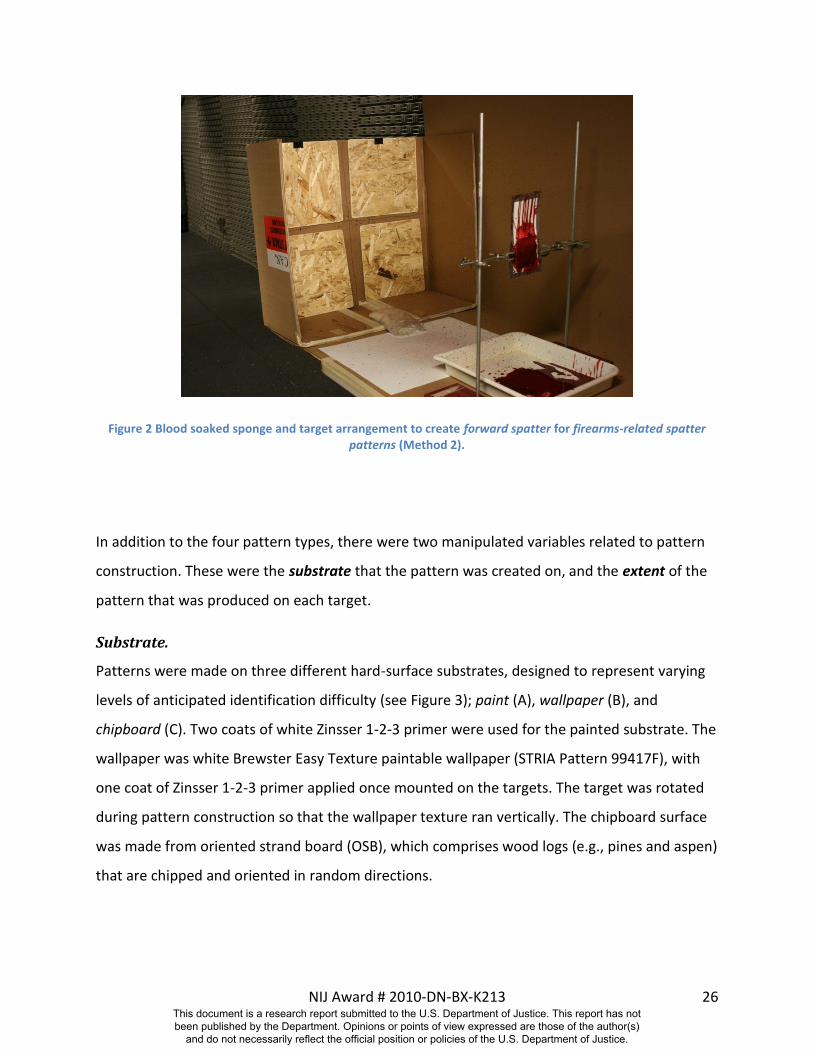
Firearms-related spatter pattern. The methods used to create the firearms-related spatter are
described in Table 4. Method 2 used to create firearms-related spatter patterns is illustrated in
Figure 2. For both methods, a .22 calibre bullet was fired from a pistol through a blood soaked
sponge. Some targets required multiple shots to obtain the desired amount of pattern.
Table 4 Methods used to create firearms-related spatter patterns
Method 1 Backspatter was collected from targets positioned 47 inches (120 cm) from the rear of a blood-soaked sponge.
Method 2 Forward spatter was collected from targets positioned 47 inches (120 cm) from the front of the sponge.
This document is a research report submitted to the U.S. Department of Justice. This report has not been published by the Department. Opinions or points of view expressed are those of the author(s)
and do not necessarily reflect the official position or policies of the U.S. Department of Justice.
NIJ Award # 2010-DN-BX-K213 26
Figure 2 Blood soaked sponge and target arrangement to create forward spatter for firearms-related spatter patterns (Method 2).
In addition to the four pattern types, there were two manipulated variables related to pattern
construction. These were the substrate that the pattern was created on, and the extent of the
pattern that was produced on each target.
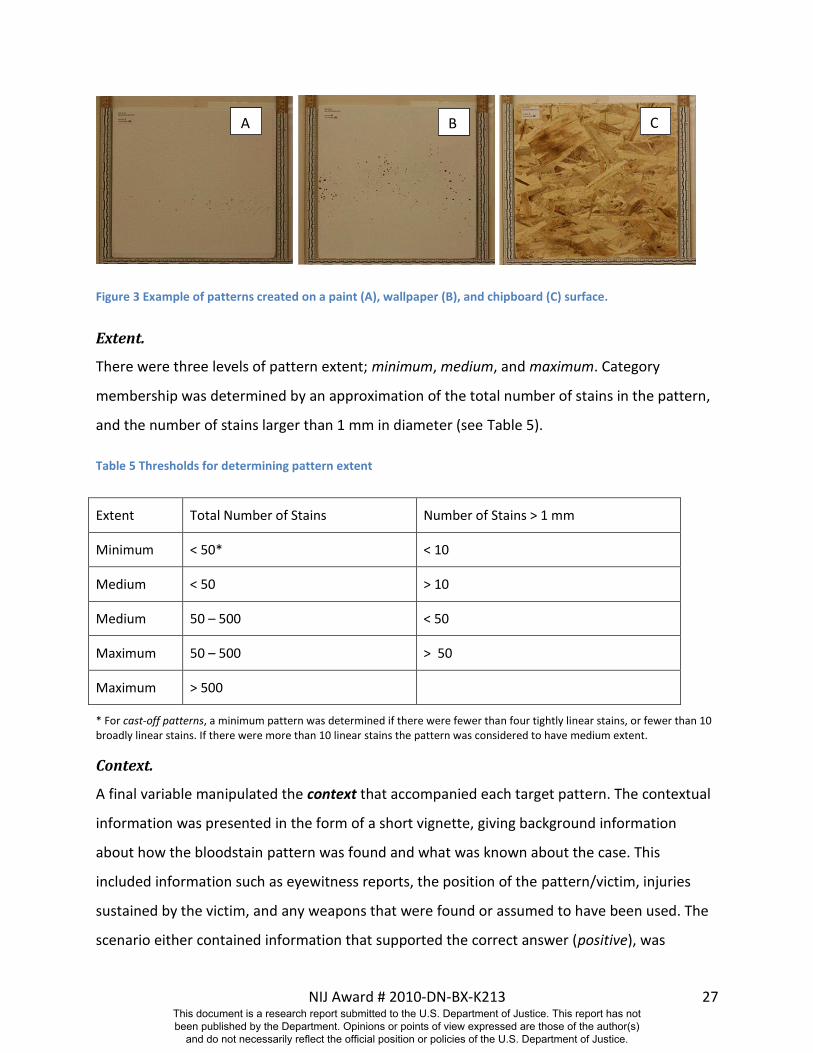
Substrate.
Patterns were made on three different hard-surface substrates, designed to represent varying
levels of anticipated identification difficulty (see Figure 3); paint (A), wallpaper (B), and
chipboard (C). Two coats of white Zinsser 1-2-3 primer were used for the painted substrate. The
wallpaper was white Brewster Easy Texture paintable wallpaper (STRIA Pattern 99417F), with
one coat of Zinsser 1-2-3 primer applied once mounted on the targets. The target was rotated
during pattern construction so that the wallpaper texture ran vertically. The chipboard surface
was made from oriented strand board (OSB), which comprises wood logs (e.g., pines and aspen)
that are chipped and oriented in random directions.
This document is a research report submitted to the U.S. Department of Justice. This report has not been published by the Department. Opinions or points of view expressed are those of the author(s)
and do not necessarily reflect the official position or policies of the U.S. Department of Justice.
NIJ Award # 2010-DN-BX-K213 27
Figure 3 Example of patterns created on a paint (A), wallpaper (B), and chipboard (C) surface.
Extent.
There were three levels of pattern extent; minimum, medium, and maximum. Category
membership was determined by an approximation of the total number of stains in the pattern,
and the number of stains larger than 1 mm in diameter (see Table 5).
Table 5 Thresholds for determining pattern extent
Extent Total Number of Stains Number of Stains > 1 mm
Minimum < 50* < 10
Medium < 50 > 10
Medium 50 – 500 < 50
Maximum 50 – 500 > 50
Maximum > 500
* For cast-off patterns, a minimum pattern was determined if there were fewer than four tightly linear stains, or fewer than 10 broadly linear stains. If there were more than 10 linear stains the pattern was considered to have medium extent.
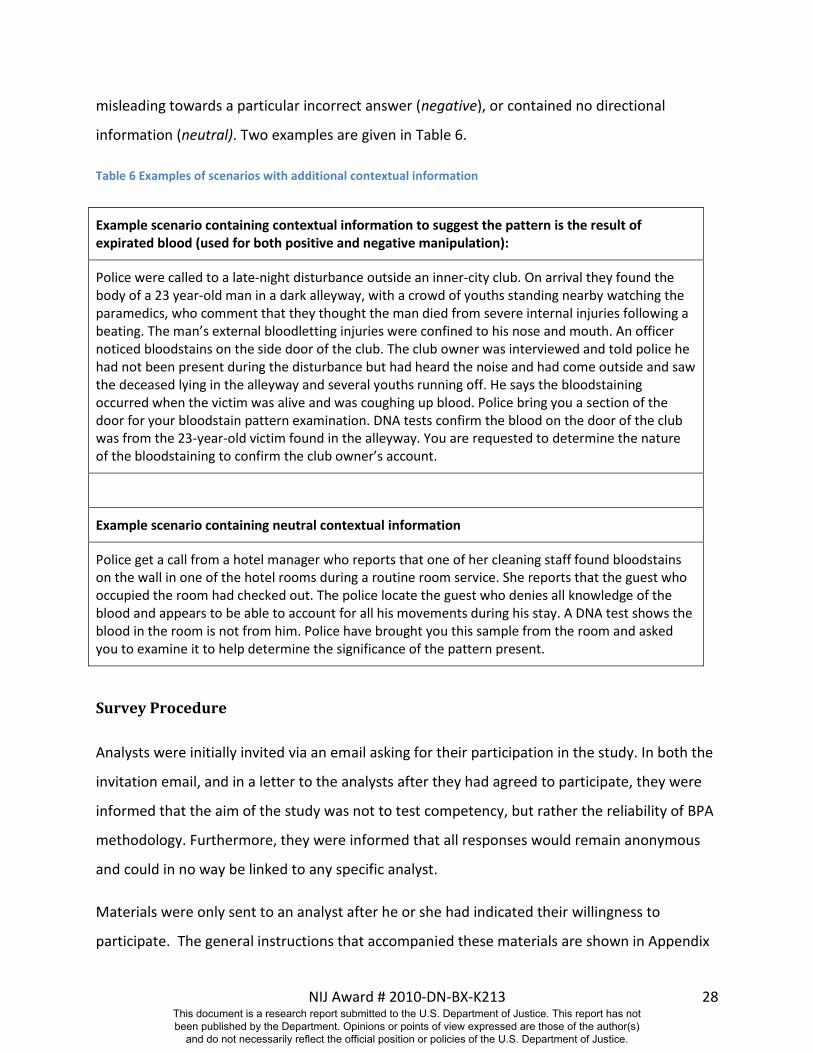
Context.
A final variable manipulated the context that accompanied each target pattern. The contextual
information was presented in the form of a short vignette, giving background information
about how the bloodstain pattern was found and what was known about the case. This
included information such as eyewitness reports, the position of the pattern/victim, injuries
sustained by the victim, and any weapons that were found or assumed to have been used. The
scenario either contained information that supported the correct answer (positive), was
A B C
This document is a research report submitted to the U.S. Department of Justice. This report has not been published by the Department. Opinions or points of view expressed are those of the author(s)
and do not necessarily reflect the official position or policies of the U.S. Department of Justice.
NIJ Award # 2010-DN-BX-K213 28
misleading towards a particular incorrect answer (negative), or contained no directional
information (neutral). Two examples are given in Table 6.
Table 6 Examples of scenarios with additional contextual information
Example scenario containing contextual information to suggest the pattern is the result of expirated blood (used for both positive and negative manipulation):
Police were called to a late-night disturbance outside an inner-city club. On arrival they found the body of a 23 year-old man in a dark alleyway, with a crowd of youths standing nearby watching the paramedics, who comment that they thought the man died from severe internal injuries following a beating. The man’s external bloodletting injuries were confined to his nose and mouth. An officer noticed bloodstains on the side door of the club. The club owner was interviewed and told police he had not been present during the disturbance but had heard the noise and had come outside and saw the deceased lying in the alleyway and several youths running off. He says the bloodstaining occurred when the victim was alive and was coughing up blood. Police bring you a section of the door for your bloodstain pattern examination. DNA tests confirm the blood on the door of the club was from the 23-year-old victim found in the alleyway. You are requested to determine the nature of the bloodstaining to confirm the club owner’s account.
Example scenario containing neutral contextual information
Police get a call from a hotel manager who reports that one of her cleaning staff found bloodstains on the wall in one of the hotel rooms during a routine room service. She reports that the guest who occupied the room had checked out. The police locate the guest who denies all knowledge of the blood and appears to be able to account for all his movements during his stay. A DNA test shows the blood in the room is not from him. Police have brought you this sample from the room and asked you to examine it to help determine the significance of the pattern present.
Survey Procedure
Analysts were initially invited via an email asking for their participation in the study. In both the
invitation email, and in a letter to the analysts after they had agreed to participate, they were
informed that the aim of the study was not to test competency, but rather the reliability of BPA
methodology. Furthermore, they were informed that all responses would remain anonymous
and could in no way be linked to any specific analyst.
Materials were only sent to an analyst after he or she had indicated their willingness to
participate. The general instructions that accompanied these materials are shown in Appendix
This document is a research report submitted to the U.S. Department of Justice. This report has not been published by the Department. Opinions or points of view expressed are those of the author(s)
and do not necessarily reflect the official position or policies of the U.S. Department of Justice.
NIJ Award # 2010-DN-BX-K213 29
1. Each analyst received 15 or 16 targets, and a response sheet for each target. A number was
placed at the top of each target; this identified which target corresponded to each response
sheet, and indicated the pattern alignment during pattern construction.
The response sheet comprised two main parts. Part 1 stated:
“To assist investigators with the early stages of their enquiries you have been asked for your assessment as to the pattern type that best describes the pattern you have observed on the sample target.”
Analysts were then required to choose one of the following patterns (based on standard
SWGSTAIN terminology [1]: cast-off, drip trail, impact, saturation, splash, transfer, drip,
expiration, pool, spatter from gunshot trauma (forward or back spatter), swipe, insect stain,
drip stain, flow, projected (e.g., arterial), wipe, or indicate that they “can’t identify one best
pattern.” This part was designed to give an assessment of analysts’ confidence in making a
singular decision.
Part 2 stated:
“You are now preparing your final report for investigators, which could end up being presented in court. Please give your opinion as to the pattern type or types that could account for the stains on the sample target.”
From the same list of patterns, analysts could now select any number of patterns, or indicate
that “I can’t state that any of the above patterns would account for the stains on the sample
target.” This part was designed to assess how precise analysts are able to be.
After completing both parts for each target, analysts emailed or posted their responses to an
independent third party. All materials and responses were returned to experimenters via the
third party to ensure they remained anonymous.
Error Rate Determination
The calculation of error rates for a method such as pattern recognition is not straight-forward.
In Part 1, where only a single answer was required, we chose to determine an error rate based
on the proportion of incorrect conclusions.
This document is a research report submitted to the U.S. Department of Justice. This report has not been published by the Department. Opinions or points of view expressed are those of the author(s)
and do not necessarily reflect the official position or policies of the U.S. Department of Justice.
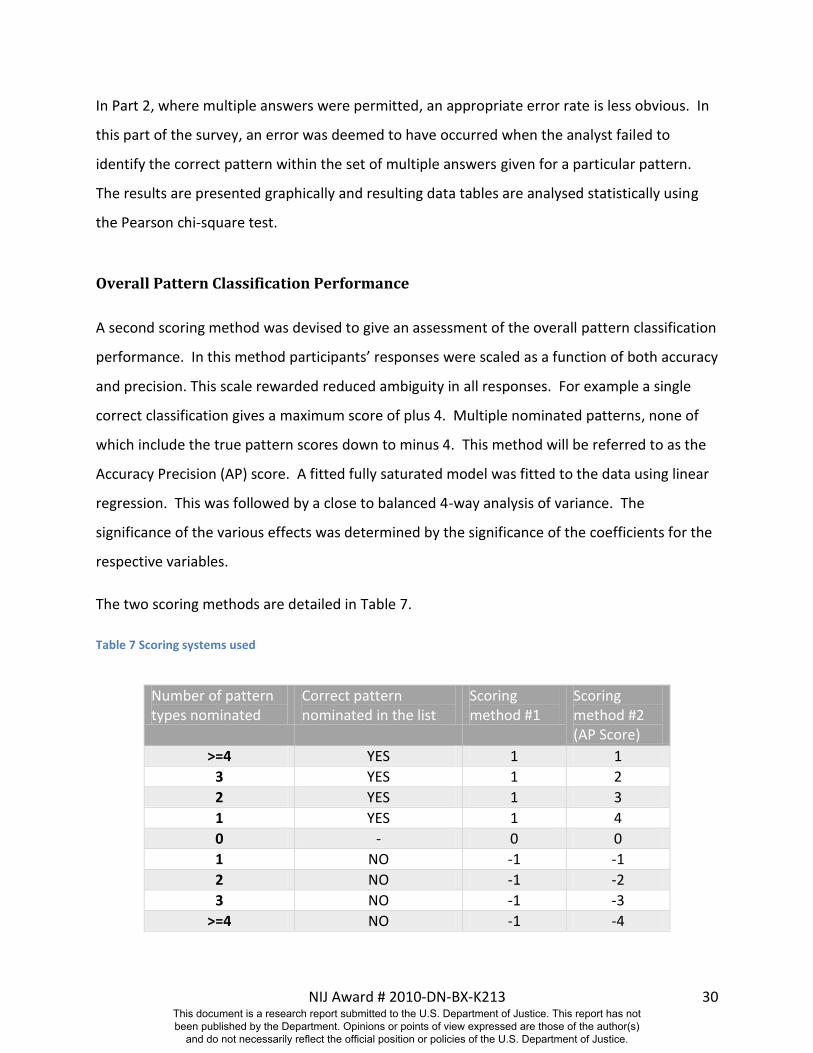
NIJ Award # 2010-DN-BX-K213 30
In Part 2, where multiple answers were permitted, an appropriate error rate is less obvious. In
this part of the survey, an error was deemed to have occurred when the analyst failed to
identify the correct pattern within the set of multiple answers given for a particular pattern.
The results are presented graphically and resulting data tables are analysed statistically using
the Pearson chi-square test.
Overall Pattern Classification Performance
A second scoring method was devised to give an assessment of the overall pattern classification
performance. In this method participants’ responses were scaled as a function of both accuracy
and precision. This scale rewarded reduced ambiguity in all responses. For example a single
correct classification gives a maximum score of plus 4. Multiple nominated patterns, none of
which include the true pattern scores down to minus 4. This method will be referred to as the
Accuracy Precision (AP) score. A fitted fully saturated model was fitted to the data using linear
regression. This was followed by a close to balanced 4-way analysis of variance. The
significance of the various effects was determined by the significance of the coefficients for the
respective variables.
The two scoring methods are detailed in Table 7.
Table 7 Scoring systems used
Number of pattern types nominated
Correct pattern nominated in the list
Scoring method #1
Scoring method #2 (AP Score)
>=4 YES 1 1
3 YES 1 2
2 YES 1 3
1 YES 1 4
0 - 0 0
1 NO -1 -1
2 NO -1 -2
3 NO -1 -3
>=4 NO -1 -4
This document is a research report submitted to the U.S. Department of Justice. This report has not been published by the Department. Opinions or points of view expressed are those of the author(s)
and do not necessarily reflect the official position or policies of the U.S. Department of Justice.
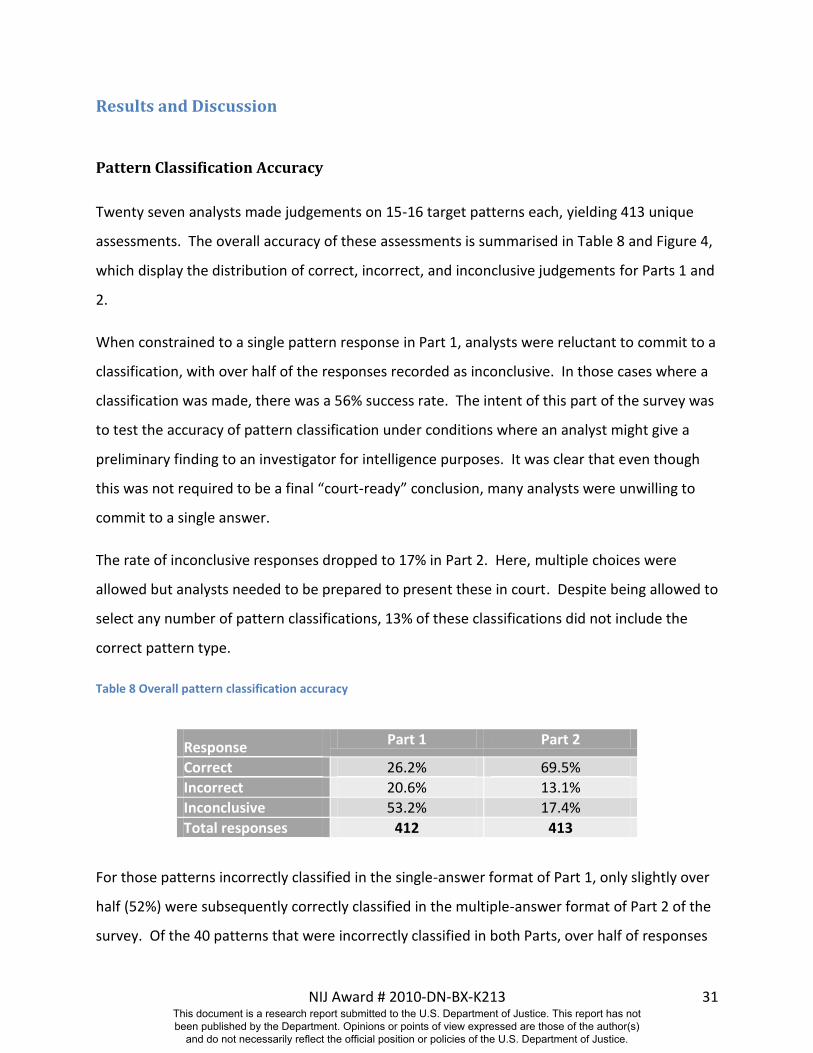
NIJ Award # 2010-DN-BX-K213 31
Results and Discussion
Pattern Classification Accuracy
Twenty seven analysts made judgements on 15-16 target patterns each, yielding 413 unique
assessments. The overall accuracy of these assessments is summarised in Table 8 and Figure 4,
which display the distribution of correct, incorrect, and inconclusive judgements for Parts 1 and
2.
When constrained to a single pattern response in Part 1, analysts were reluctant to commit to a
classification, with over half of the responses recorded as inconclusive. In those cases where a
classification was made, there was a 56% success rate. The intent of this part of the survey was
to test the accuracy of pattern classification under conditions where an analyst might give a
preliminary finding to an investigator for intelligence purposes. It was clear that even though
this was not required to be a final “court-ready” conclusion, many analysts were unwilling to
commit to a single answer.
The rate of inconclusive responses dropped to 17% in Part 2. Here, multiple choices were
allowed but analysts needed to be prepared to present these in court. Despite being allowed to
select any number of pattern classifications, 13% of these classifications did not include the
correct pattern type.
Table 8 Overall pattern classification accuracy
Response Part 1 Part 2
Correct 26.2% 69.5%
Incorrect 20.6% 13.1%
Inconclusive 53.2% 17.4%
Total responses 412 413
For those patterns incorrectly classified in the single-answer format of Part 1, only slightly over
half (52%) were subsequently correctly classified in the multiple-answer format of Part 2 of the
survey. Of the 40 patterns that were incorrectly classified in both Parts, over half of responses
This document is a research report submitted to the U.S. Department of Justice. This report has not been published by the Department. Opinions or points of view expressed are those of the author(s)
and do not necessarily reflect the official position or policies of the U.S. Department of Justice.
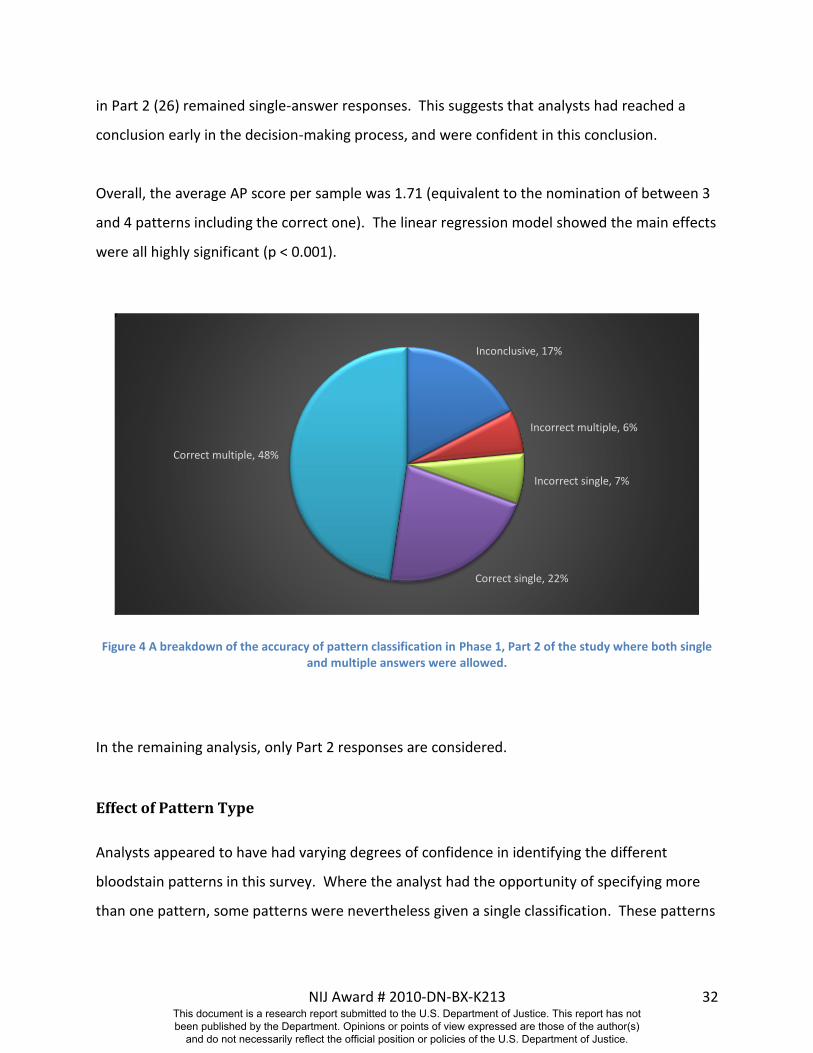
NIJ Award # 2010-DN-BX-K213 32
in Part 2 (26) remained single-answer responses. This suggests that analysts had reached a
conclusion early in the decision-making process, and were confident in this conclusion.
Overall, the average AP score per sample was 1.71 (equivalent to the nomination of between 3
and 4 patterns including the correct one). The linear regression model showed the main effects
were all highly significant (p < 0.001).
Figure 4 A breakdown of the accuracy of pattern classification in Phase 1, Part 2 of the study where both single and multiple answers were allowed.
In the remaining analysis, only Part 2 responses are considered.
Effect of Pattern Type
Analysts appeared to have had varying degrees of confidence in identifying the different
bloodstain patterns in this survey. Where the analyst had the opportunity of specifying more
than one pattern, some patterns were nevertheless given a single classification. These patterns
Inconclusive, 17%
Incorrect multiple, 6%
Incorrect single, 7%
Correct single, 22%
Correct multiple, 48%
This document is a research report submitted to the U.S. Department of Justice. This report has not been published by the Department. Opinions or points of view expressed are those of the author(s)
and do not necessarily reflect the official position or policies of the U.S. Department of Justice.
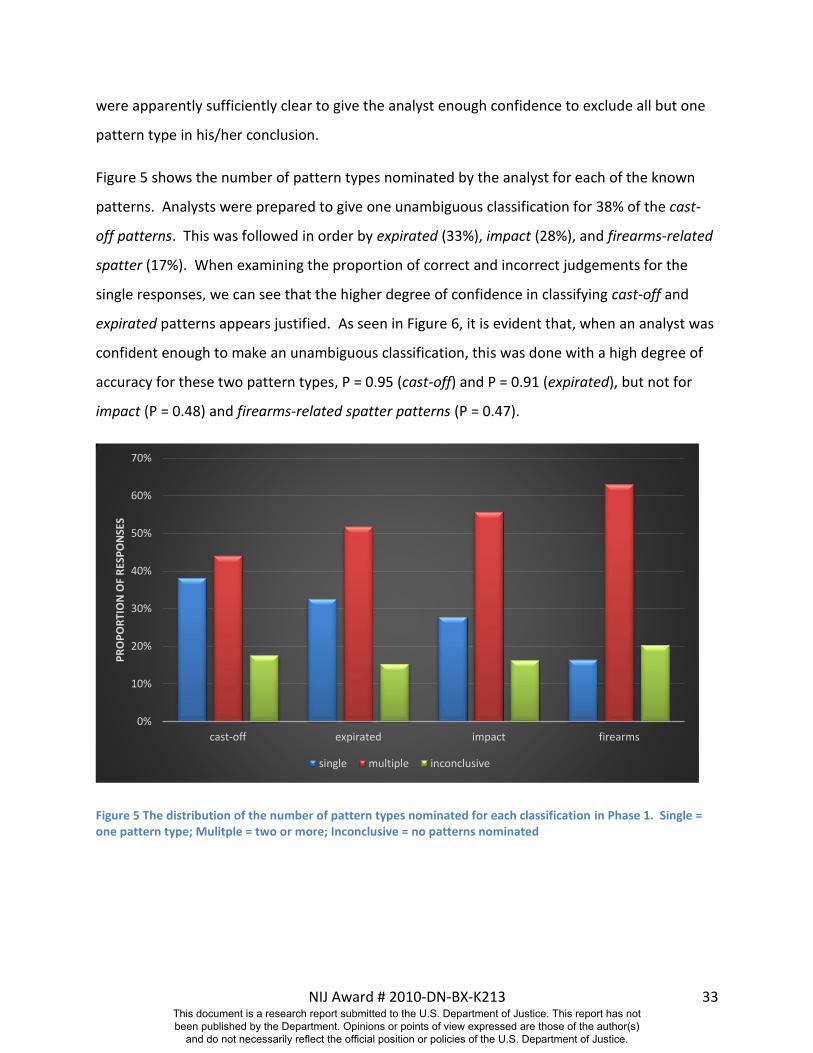
NIJ Award # 2010-DN-BX-K213 33
were apparently sufficiently clear to give the analyst enough confidence to exclude all but one
pattern type in his/her conclusion.
Figure 5 shows the number of pattern types nominated by the analyst for each of the known
patterns. Analysts were prepared to give one unambiguous classification for 38% of the cast-
off patterns. This was followed in order by expirated (33%), impact (28%), and firearms-related
spatter (17%). When examining the proportion of correct and incorrect judgements for the
single responses, we can see that the higher degree of confidence in classifying cast-off and
expirated patterns appears justified. As seen in Figure 6, it is evident that, when an analyst was
confident enough to make an unambiguous classification, this was done with a high degree of
accuracy for these two pattern types, P = 0.95 (cast-off) and P = 0.91 (expirated), but not for
impact (P = 0.48) and firearms-related spatter patterns (P = 0.47).
Figure 5 The distribution of the number of pattern types nominated for each classification in Phase 1. Single = one pattern type; Mulitple = two or more; Inconclusive = no patterns nominated
0%
10%
20%
30%
40%
50%
60%
70%
cast-off expirated impact firearms
PR
OP
OR
TIO
N O
F R
ESP
ON
SES
single multiple inconclusive
This document is a research report submitted to the U.S. Department of Justice. This report has not been published by the Department. Opinions or points of view expressed are those of the author(s)
and do not necessarily reflect the official position or policies of the U.S. Department of Justice.
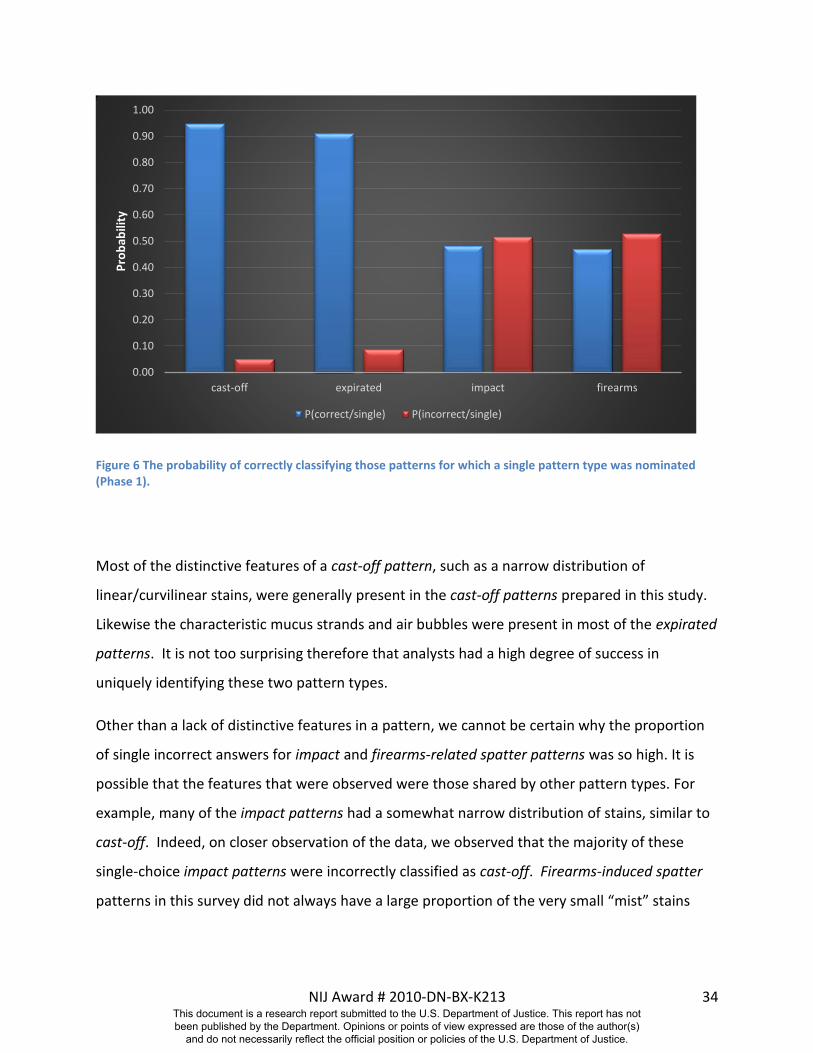
NIJ Award # 2010-DN-BX-K213 34
Figure 6 The probability of correctly classifying those patterns for which a single pattern type was nominated (Phase 1).
Most of the distinctive features of a cast-off pattern, such as a narrow distribution of
linear/curvilinear stains, were generally present in the cast-off patterns prepared in this study.
Likewise the characteristic mucus strands and air bubbles were present in most of the expirated
patterns. It is not too surprising therefore that analysts had a high degree of success in
uniquely identifying these two pattern types.
Other than a lack of distinctive features in a pattern, we cannot be certain why the proportion
of single incorrect answers for impact and firearms-related spatter patterns was so high. It is
possible that the features that were observed were those shared by other pattern types. For
example, many of the impact patterns had a somewhat narrow distribution of stains, similar to
cast-off. Indeed, on closer observation of the data, we observed that the majority of these
single-choice impact patterns were incorrectly classified as cast-off. Firearms-induced spatter
patterns in this survey did not always have a large proportion of the very small “mist” stains
0.00
0.10
0.20
0.30
0.40
0.50
0.60
0.70
0.80
0.90
1.00
cast-off expirated impact firearms
Pro
bab
ility
P(correct/single) P(incorrect/single)
This document is a research report submitted to the U.S. Department of Justice. This report has not been published by the Department. Opinions or points of view expressed are those of the author(s)
and do not necessarily reflect the official position or policies of the U.S. Department of Justice.
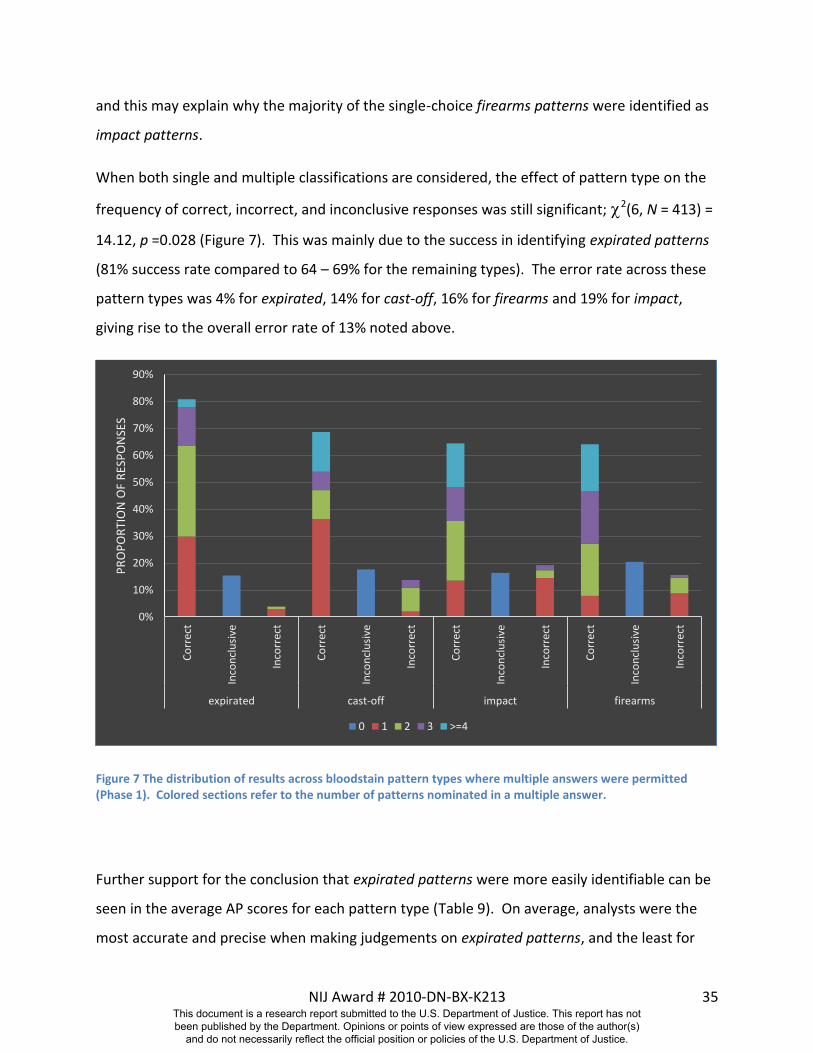
NIJ Award # 2010-DN-BX-K213 35
and this may explain why the majority of the single-choice firearms patterns were identified as
impact patterns.
When both single and multiple classifications are considered, the effect of pattern type on the
frequency of correct, incorrect, and inconclusive responses was still significant; 2(6, N = 413) =
14.12, p =0.028 (Figure 7). This was mainly due to the success in identifying expirated patterns
(81% success rate compared to 64 – 69% for the remaining types). The error rate across these
pattern types was 4% for expirated, 14% for cast-off, 16% for firearms and 19% for impact,
giving rise to the overall error rate of 13% noted above.
Figure 7 The distribution of results across bloodstain pattern types where multiple answers were permitted (Phase 1). Colored sections refer to the number of patterns nominated in a multiple answer.
Further support for the conclusion that expirated patterns were more easily identifiable can be
seen in the average AP scores for each pattern type (Table 9). On average, analysts were the
most accurate and precise when making judgements on expirated patterns, and the least for
0%
10%
20%
30%
40%
50%
60%
70%
80%
90%
Co
rrec
t
Inco
ncl
usi
ve
Inco
rrec
t
Co
rrec
t
Inco
ncl
usi
ve
Inco
rrec
t
Co
rrec
t
Inco
ncl
usi
ve
Inco
rrec
t
Co
rrec
t
Inco
ncl
usi
ve
Inco
rrec
t
expirated cast-off impact firearms
PR
OP
OR
TIO
N O
F R
ESP
ON
SES
0 1 2 3 >=4
This document is a research report submitted to the U.S. Department of Justice. This report has not been published by the Department. Opinions or points of view expressed are those of the author(s)
and do not necessarily reflect the official position or policies of the U.S. Department of Justice.
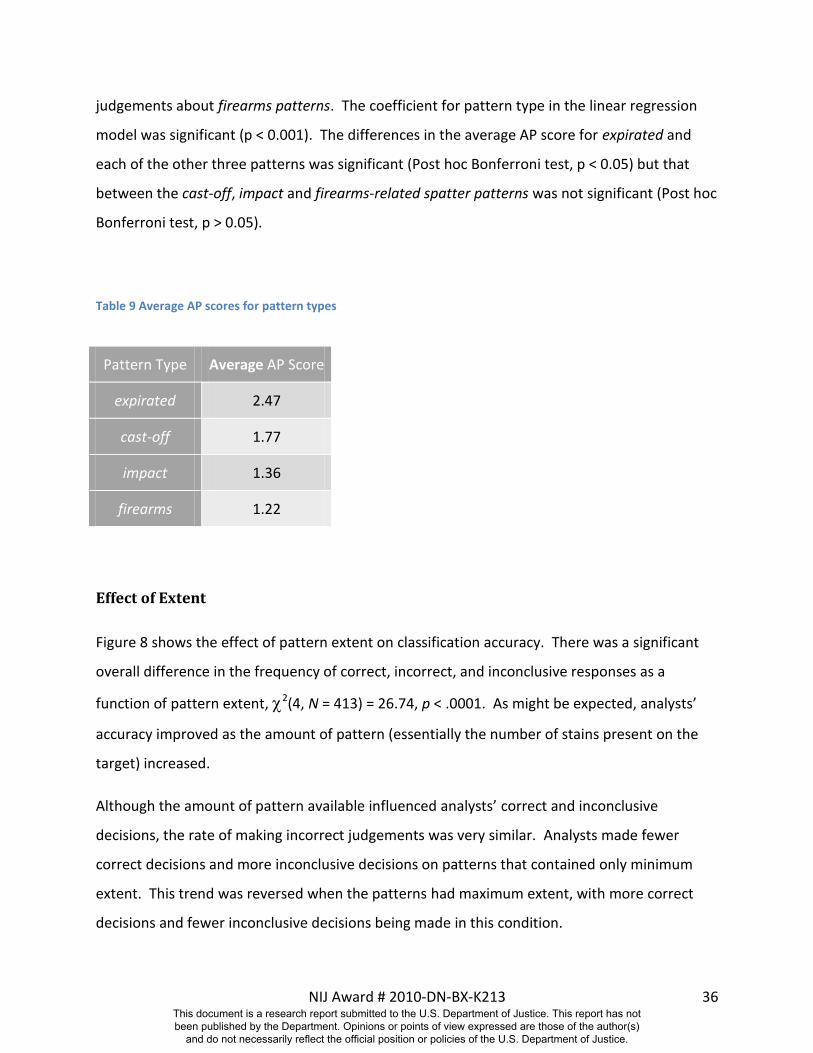
NIJ Award # 2010-DN-BX-K213 36
judgements about firearms patterns. The coefficient for pattern type in the linear regression
model was significant (p < 0.001). The differences in the average AP score for expirated and
each of the other three patterns was significant (Post hoc Bonferroni test, p < 0.05) but that
between the cast-off, impact and firearms-related spatter patterns was not significant (Post hoc
Bonferroni test, p > 0.05).
Table 9 Average AP scores for pattern types
Pattern Type Average AP Score
expirated 2.47
cast-off 1.77
impact 1.36
firearms 1.22
Effect of Extent
Figure 8 shows the effect of pattern extent on classification accuracy. There was a significant
overall difference in the frequency of correct, incorrect, and inconclusive responses as a
function of pattern extent, 2(4, N = 413) = 26.74, p < .0001. As might be expected, analysts’
accuracy improved as the amount of pattern (essentially the number of stains present on the
target) increased.
Although the amount of pattern available influenced analysts’ correct and inconclusive
decisions, the rate of making incorrect judgements was very similar. Analysts made fewer
correct decisions and more inconclusive decisions on patterns that contained only minimum
extent. This trend was reversed when the patterns had maximum extent, with more correct
decisions and fewer inconclusive decisions being made in this condition.
This document is a research report submitted to the U.S. Department of Justice. This report has not been published by the Department. Opinions or points of view expressed are those of the author(s)
and do not necessarily reflect the official position or policies of the U.S. Department of Justice.
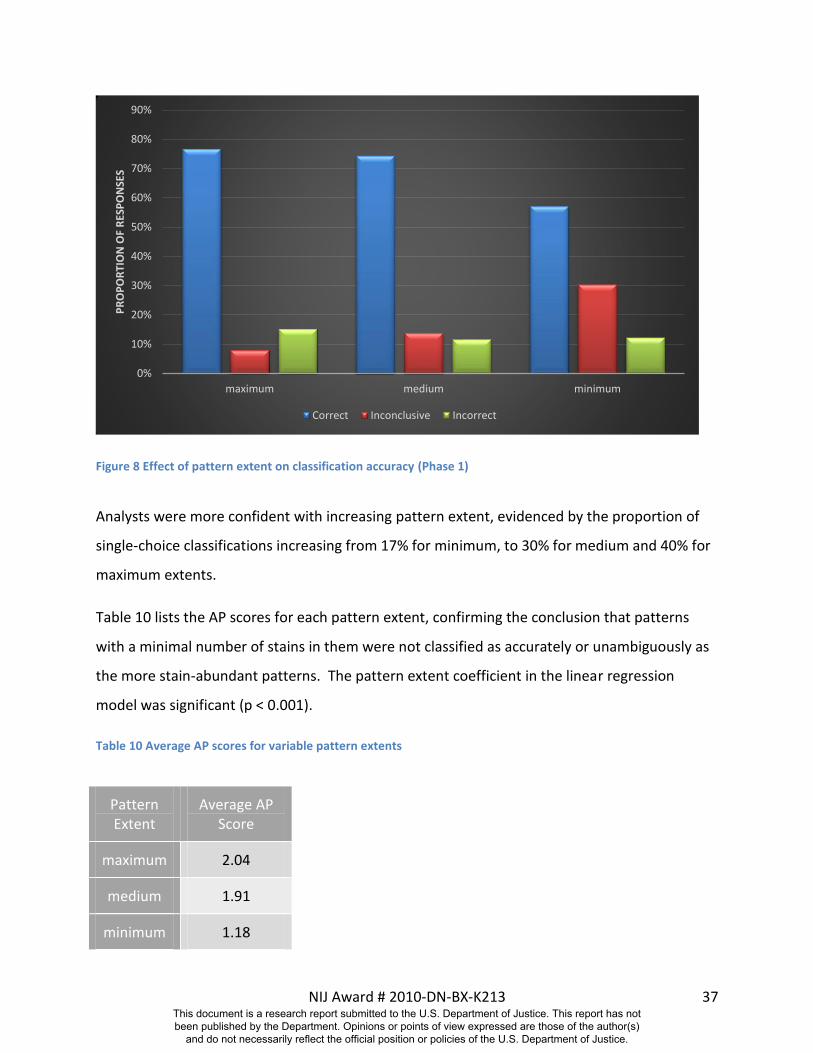
NIJ Award # 2010-DN-BX-K213 37
Figure 8 Effect of pattern extent on classification accuracy (Phase 1)
Analysts were more confident with increasing pattern extent, evidenced by the proportion of
single-choice classifications increasing from 17% for minimum, to 30% for medium and 40% for
maximum extents.
Table 10 lists the AP scores for each pattern extent, confirming the conclusion that patterns
with a minimal number of stains in them were not classified as accurately or unambiguously as
the more stain-abundant patterns. The pattern extent coefficient in the linear regression
model was significant (p < 0.001).
Table 10 Average AP scores for variable pattern extents
Pattern Extent
Average AP Score
maximum 2.04
medium 1.91
minimum 1.18
0%
10%
20%
30%
40%
50%
60%
70%
80%
90%
maximum medium minimum
PR
OP
OR
TIO
N O
F R
ESP
ON
SES
Correct Inconclusive Incorrect
This document is a research report submitted to the U.S. Department of Justice. This report has not been published by the Department. Opinions or points of view expressed are those of the author(s)
and do not necessarily reflect the official position or policies of the U.S. Department of Justice.
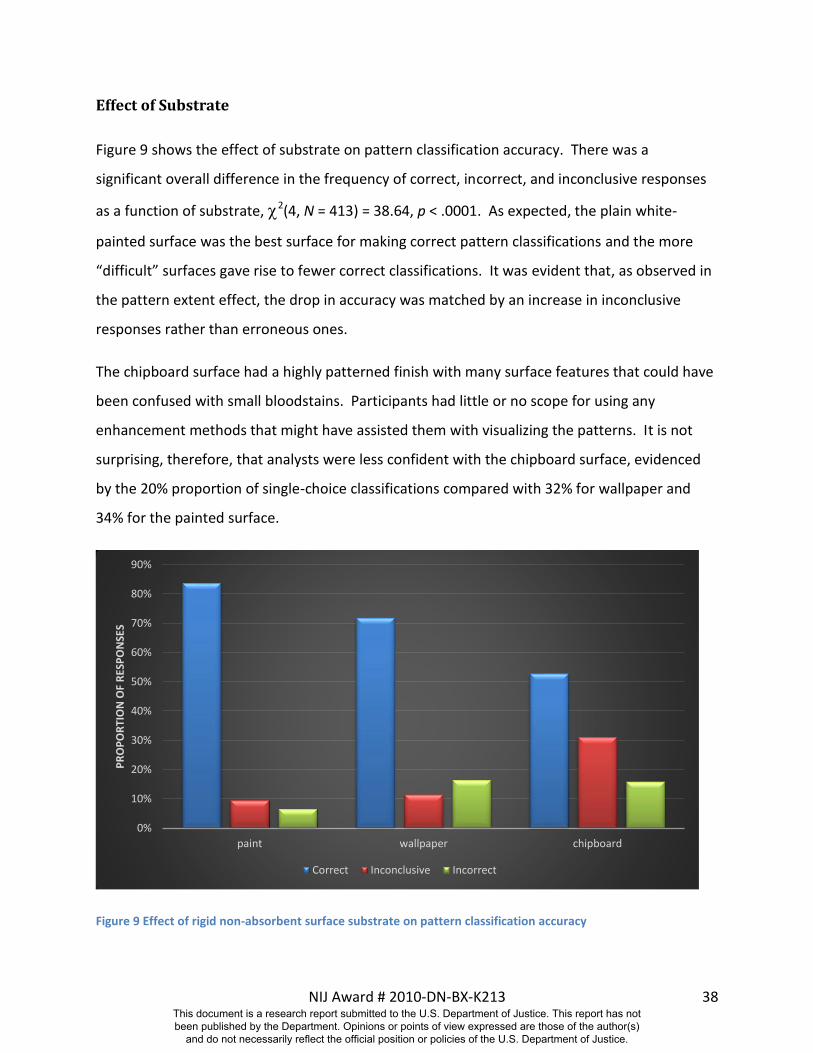
NIJ Award # 2010-DN-BX-K213 38
Effect of Substrate
Figure 9 shows the effect of substrate on pattern classification accuracy. There was a
significant overall difference in the frequency of correct, incorrect, and inconclusive responses
as a function of substrate, 2(4, N = 413) = 38.64, p < .0001. As expected, the plain white-
painted surface was the best surface for making correct pattern classifications and the more
“difficult” surfaces gave rise to fewer correct classifications. It was evident that, as observed in
the pattern extent effect, the drop in accuracy was matched by an increase in inconclusive
responses rather than erroneous ones.
The chipboard surface had a highly patterned finish with many surface features that could have
been confused with small bloodstains. Participants had little or no scope for using any
enhancement methods that might have assisted them with visualizing the patterns. It is not
surprising, therefore, that analysts were less confident with the chipboard surface, evidenced
by the 20% proportion of single-choice classifications compared with 32% for wallpaper and
34% for the painted surface.
Figure 9 Effect of rigid non-absorbent surface substrate on pattern classification accuracy
0%
10%
20%
30%
40%
50%
60%
70%
80%
90%
paint wallpaper chipboard
PR
OP
OR
TIO
N O
F R
ESP
ON
SES
Correct Inconclusive Incorrect
This document is a research report submitted to the U.S. Department of Justice. This report has not been published by the Department. Opinions or points of view expressed are those of the author(s)
and do not necessarily reflect the official position or policies of the U.S. Department of Justice.
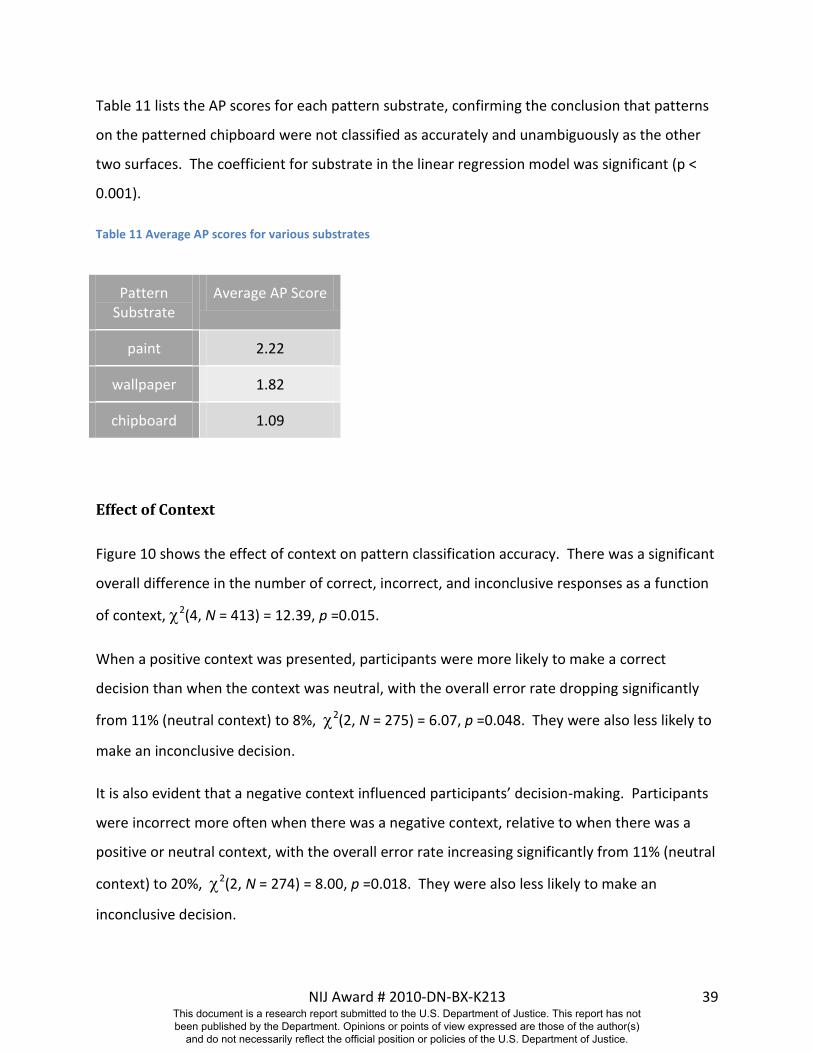
NIJ Award # 2010-DN-BX-K213 39
Table 11 lists the AP scores for each pattern substrate, confirming the conclusion that patterns
on the patterned chipboard were not classified as accurately and unambiguously as the other
two surfaces. The coefficient for substrate in the linear regression model was significant (p <
0.001).
Table 11 Average AP scores for various substrates
Pattern Substrate
Average AP Score
paint 2.22
wallpaper 1.82
chipboard 1.09
Effect of Context
Figure 10 shows the effect of context on pattern classification accuracy. There was a significant
overall difference in the number of correct, incorrect, and inconclusive responses as a function
of context, 2(4, N = 413) = 12.39, p =0.015.
When a positive context was presented, participants were more likely to make a correct
decision than when the context was neutral, with the overall error rate dropping significantly
from 11% (neutral context) to 8%, 2(2, N = 275) = 6.07, p =0.048. They were also less likely to
make an inconclusive decision.
It is also evident that a negative context influenced participants’ decision-making. Participants
were incorrect more often when there was a negative context, relative to when there was a
positive or neutral context, with the overall error rate increasing significantly from 11% (neutral
context) to 20%, 2(2, N = 274) = 8.00, p =0.018. They were also less likely to make an
inconclusive decision.
This document is a research report submitted to the U.S. Department of Justice. This report has not been published by the Department. Opinions or points of view expressed are those of the author(s)
and do not necessarily reflect the official position or policies of the U.S. Department of Justice.
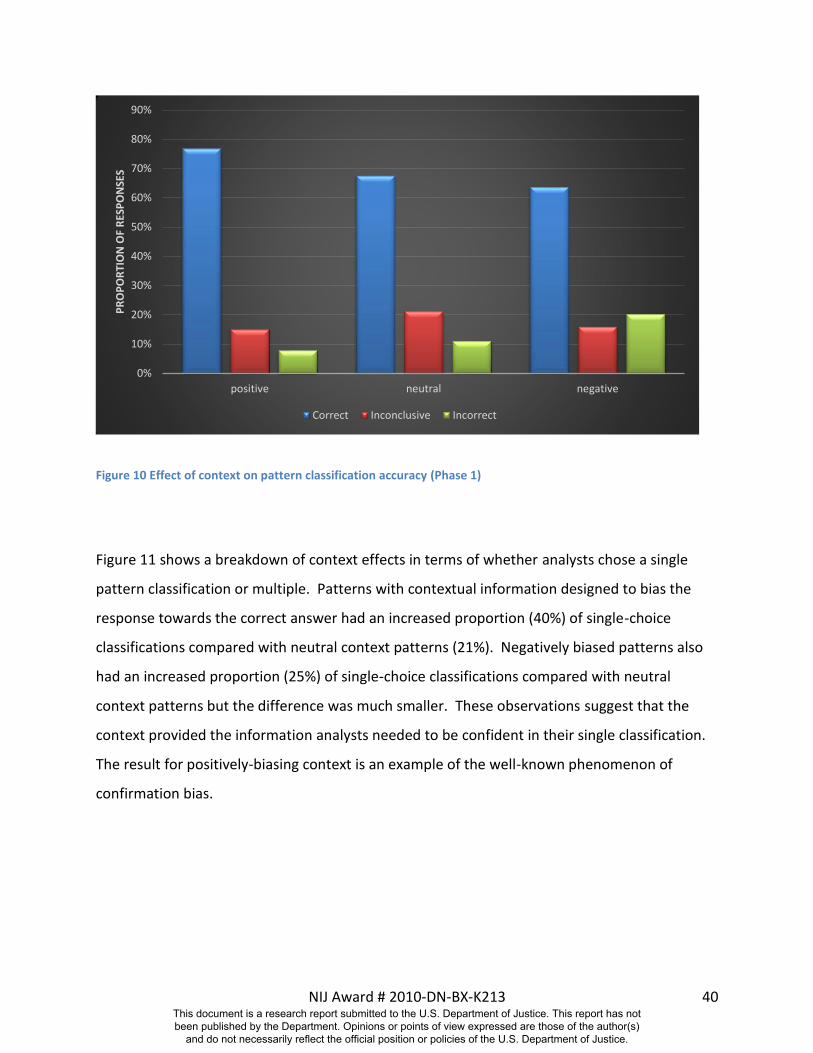
NIJ Award # 2010-DN-BX-K213 40
Figure 10 Effect of context on pattern classification accuracy (Phase 1)
Figure 11 shows a breakdown of context effects in terms of whether analysts chose a single
pattern classification or multiple. Patterns with contextual information designed to bias the
response towards the correct answer had an increased proportion (40%) of single-choice
classifications compared with neutral context patterns (21%). Negatively biased patterns also
had an increased proportion (25%) of single-choice classifications compared with neutral
context patterns but the difference was much smaller. These observations suggest that the
context provided the information analysts needed to be confident in their single classification.
The result for positively-biasing context is an example of the well-known phenomenon of
confirmation bias.
0%
10%
20%
30%
40%
50%
60%
70%
80%
90%
positive neutral negative
PR
OP
OR
TIO
N O
F R
ESP
ON
SES
Correct Inconclusive Incorrect
This document is a research report submitted to the U.S. Department of Justice. This report has not been published by the Department. Opinions or points of view expressed are those of the author(s)
and do not necessarily reflect the official position or policies of the U.S. Department of Justice.
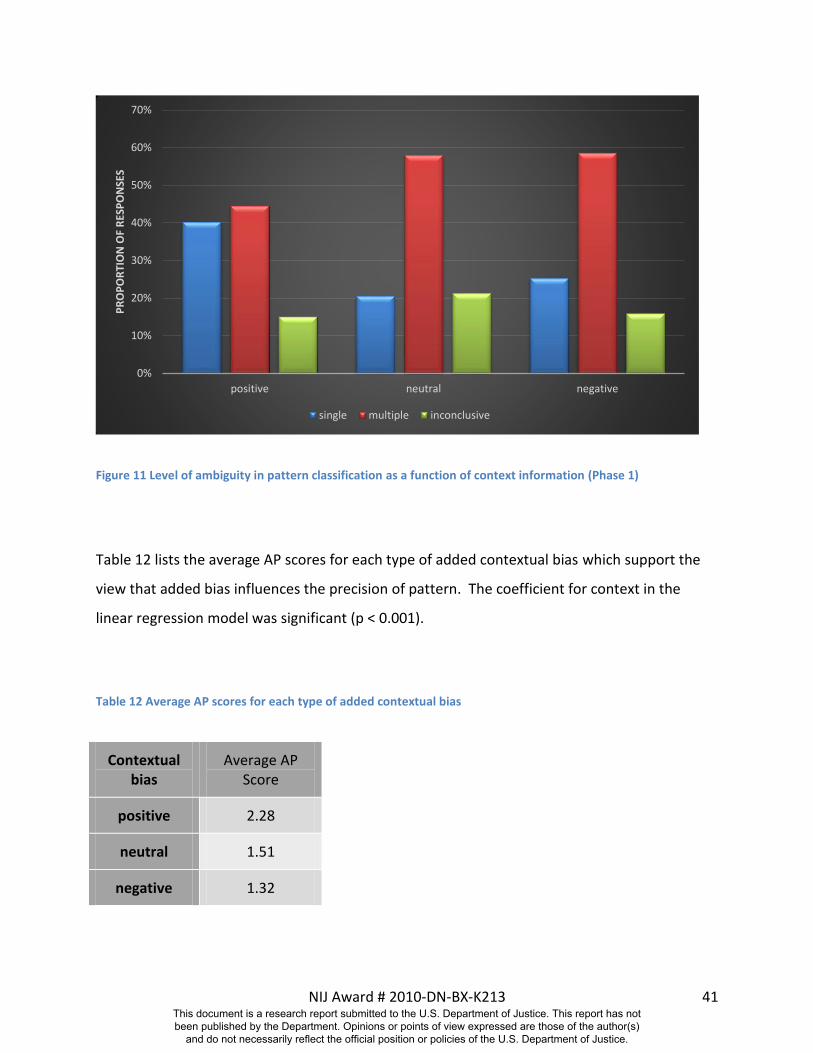
NIJ Award # 2010-DN-BX-K213 41
Figure 11 Level of ambiguity in pattern classification as a function of context information (Phase 1)
Table 12 lists the average AP scores for each type of added contextual bias which support the
view that added bias influences the precision of pattern. The coefficient for context in the
linear regression model was significant (p < 0.001).
Table 12 Average AP scores for each type of added contextual bias
Contextual bias
Average AP Score
positive 2.28
neutral 1.51
negative 1.32
0%
10%
20%
30%
40%
50%
60%
70%
positive neutral negative
PR
OP
OR
TIO
N O
F R
ESP
ON
SES
single multiple inconclusive
This document is a research report submitted to the U.S. Department of Justice. This report has not been published by the Department. Opinions or points of view expressed are those of the author(s)
and do not necessarily reflect the official position or policies of the U.S. Department of Justice.

NIJ Award # 2010-DN-BX-K213 42
Looking specifically at the influence of positive and negative bias separately, the difference in
the average AP score for positive-biased and neutral contexts was significant (Post hoc
Bonferroni test, p < 0.05) but that between negative-biased and neutral samples was not
significant (Post hoc Bonferroni test, p > 0.05). In other words, whilst negative bias has
decreased accuracy significantly, precision hasn’t been affected to the same degree.
This document is a research report submitted to the U.S. Department of Justice. This report has not been published by the Department. Opinions or points of view expressed are those of the author(s)
and do not necessarily reflect the official position or policies of the U.S. Department of Justice.
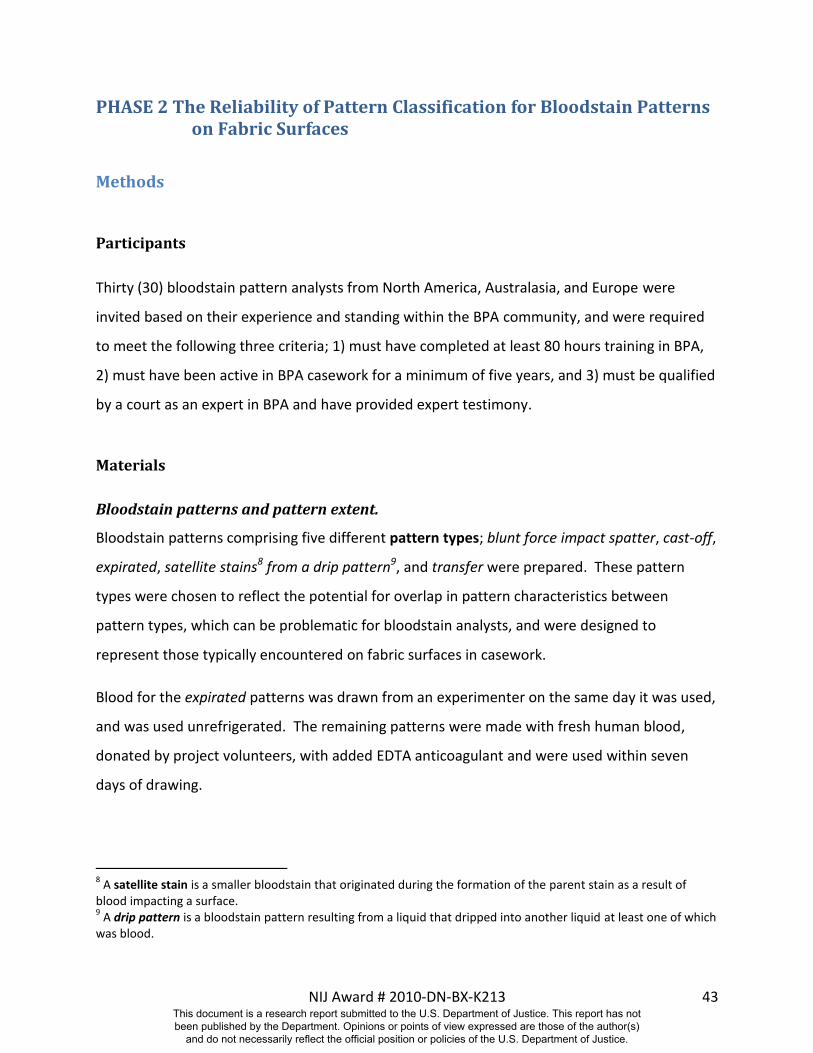
NIJ Award # 2010-DN-BX-K213 43
PHASE 2 The Reliability of Pattern Classification for Bloodstain Patterns on Fabric Surfaces
Methods
Participants
Thirty (30) bloodstain pattern analysts from North America, Australasia, and Europe were
invited based on their experience and standing within the BPA community, and were required
to meet the following three criteria; 1) must have completed at least 80 hours training in BPA,
2) must have been active in BPA casework for a minimum of five years, and 3) must be qualified
by a court as an expert in BPA and have provided expert testimony.
Materials
Bloodstain patterns and pattern extent.
Bloodstain patterns comprising five different pattern types; blunt force impact spatter, cast-off,
expirated, satellite stains8 from a drip pattern9, and transfer were prepared. These pattern
types were chosen to reflect the potential for overlap in pattern characteristics between
pattern types, which can be problematic for bloodstain analysts, and were designed to
represent those typically encountered on fabric surfaces in casework.
Blood for the expirated patterns was drawn from an experimenter on the same day it was used,
and was used unrefrigerated. The remaining patterns were made with fresh human blood,
donated by project volunteers, with added EDTA anticoagulant and were used within seven
days of drawing.
8 A satellite stain is a smaller bloodstain that originated during the formation of the parent stain as a result of
blood impacting a surface. 9 A drip pattern is a bloodstain pattern resulting from a liquid that dripped into another liquid at least one of which
was blood.
This document is a research report submitted to the U.S. Department of Justice. This report has not been published by the Department. Opinions or points of view expressed are those of the author(s)
and do not necessarily reflect the official position or policies of the U.S. Department of Justice.
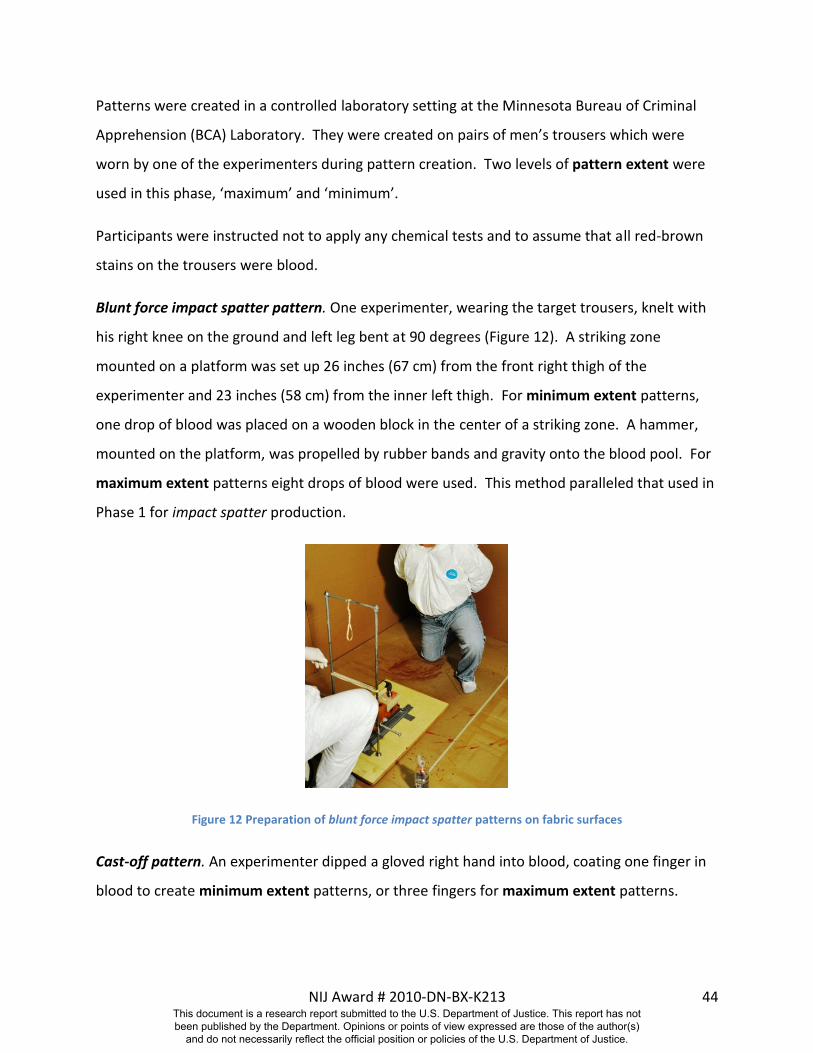
NIJ Award # 2010-DN-BX-K213 44
Patterns were created in a controlled laboratory setting at the Minnesota Bureau of Criminal
Apprehension (BCA) Laboratory. They were created on pairs of men’s trousers which were
worn by one of the experimenters during pattern creation. Two levels of pattern extent were
used in this phase, ‘maximum’ and ‘minimum’.
Participants were instructed not to apply any chemical tests and to assume that all red-brown
stains on the trousers were blood.
Blunt force impact spatter pattern. One experimenter, wearing the target trousers, knelt with
his right knee on the ground and left leg bent at 90 degrees (Figure 12). A striking zone
mounted on a platform was set up 26 inches (67 cm) from the front right thigh of the
experimenter and 23 inches (58 cm) from the inner left thigh. For minimum extent patterns,
one drop of blood was placed on a wooden block in the center of a striking zone. A hammer,
mounted on the platform, was propelled by rubber bands and gravity onto the blood pool. For
maximum extent patterns eight drops of blood were used. This method paralleled that used in
Phase 1 for impact spatter production.
Figure 12 Preparation of blunt force impact spatter patterns on fabric surfaces
Cast-off pattern. An experimenter dipped a gloved right hand into blood, coating one finger in
blood to create minimum extent patterns, or three fingers for maximum extent patterns.
This document is a research report submitted to the U.S. Department of Justice. This report has not been published by the Department. Opinions or points of view expressed are those of the author(s)
and do not necessarily reflect the official position or policies of the U.S. Department of Justice.
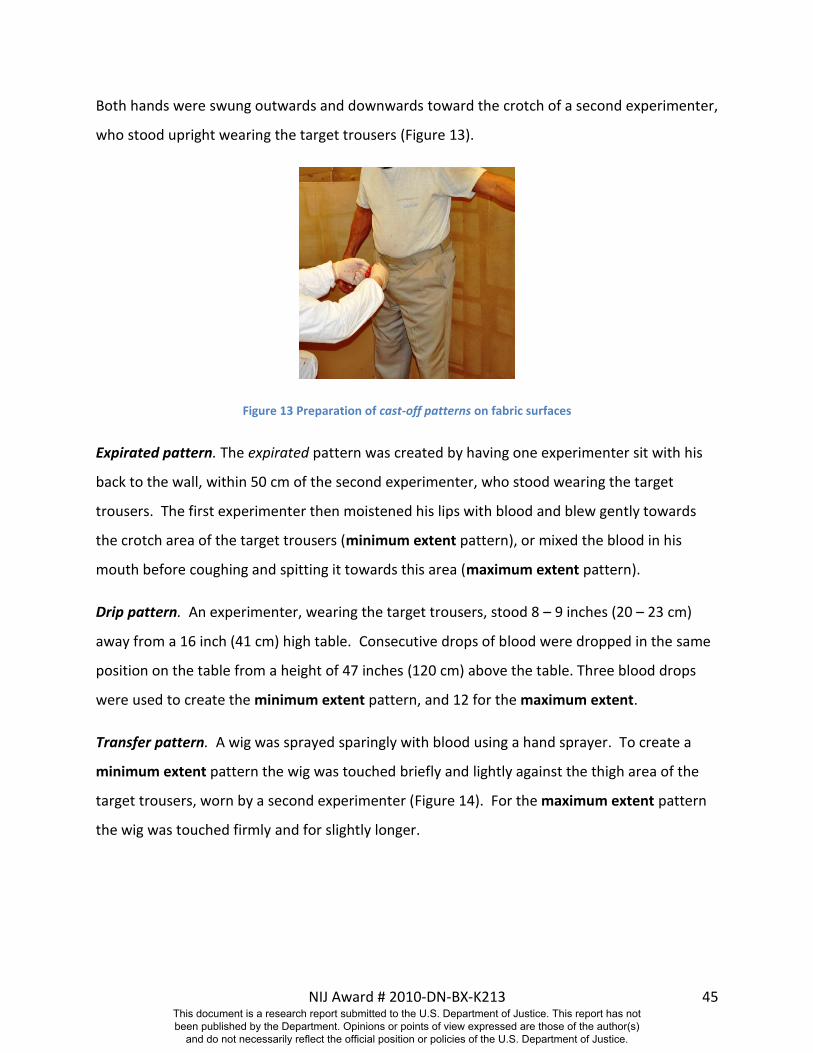
NIJ Award # 2010-DN-BX-K213 45
Both hands were swung outwards and downwards toward the crotch of a second experimenter,
who stood upright wearing the target trousers (Figure 13).
Figure 13 Preparation of cast-off patterns on fabric surfaces
Expirated pattern. The expirated pattern was created by having one experimenter sit with his
back to the wall, within 50 cm of the second experimenter, who stood wearing the target
trousers. The first experimenter then moistened his lips with blood and blew gently towards
the crotch area of the target trousers (minimum extent pattern), or mixed the blood in his
mouth before coughing and spitting it towards this area (maximum extent pattern).
Drip pattern. An experimenter, wearing the target trousers, stood 8 – 9 inches (20 – 23 cm)
away from a 16 inch (41 cm) high table. Consecutive drops of blood were dropped in the same
position on the table from a height of 47 inches (120 cm) above the table. Three blood drops
were used to create the minimum extent pattern, and 12 for the maximum extent.
Transfer pattern. A wig was sprayed sparingly with blood using a hand sprayer. To create a
minimum extent pattern the wig was touched briefly and lightly against the thigh area of the
target trousers, worn by a second experimenter (Figure 14). For the maximum extent pattern
the wig was touched firmly and for slightly longer.
This document is a research report submitted to the U.S. Department of Justice. This report has not been published by the Department. Opinions or points of view expressed are those of the author(s)
and do not necessarily reflect the official position or policies of the U.S. Department of Justice.
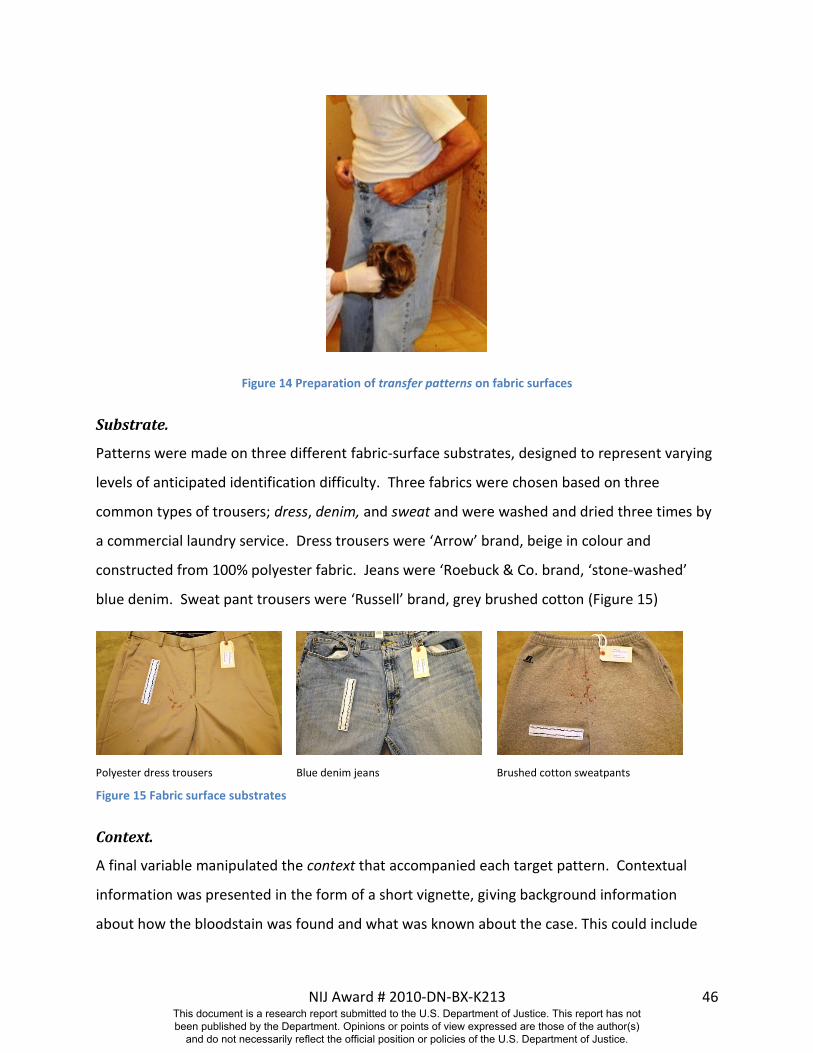
NIJ Award # 2010-DN-BX-K213 46
Figure 14 Preparation of transfer patterns on fabric surfaces
Substrate.
Patterns were made on three different fabric-surface substrates, designed to represent varying
levels of anticipated identification difficulty. Three fabrics were chosen based on three
common types of trousers; dress, denim, and sweat and were washed and dried three times by
a commercial laundry service. Dress trousers were ‘Arrow’ brand, beige in colour and
constructed from 100% polyester fabric. Jeans were ‘Roebuck & Co. brand, ‘stone-washed’
blue denim. Sweat pant trousers were ‘Russell’ brand, grey brushed cotton (Figure 15)
Polyester dress trousers Blue denim jeans Brushed cotton sweatpants
Figure 15 Fabric surface substrates
Context.
A final variable manipulated the context that accompanied each target pattern. Contextual
information was presented in the form of a short vignette, giving background information
about how the bloodstain was found and what was known about the case. This could include
This document is a research report submitted to the U.S. Department of Justice. This report has not been published by the Department. Opinions or points of view expressed are those of the author(s)
and do not necessarily reflect the official position or policies of the U.S. Department of Justice.
NIJ Award # 2010-DN-BX-K213 47
information such as eyewitness reports, the position of the stain/victim, injuries sustained by
the victim, or any weapons that were found or assumed to have been used. The scenario either
contained information that supported the correct answer (positive), was misleading (negative),
or contained no directional information (neutral).
Table 13 Examples of scenarios with additional contextual information
Example scenario containing contextual information to suggest the pattern is the result of expirated blood (used for both positive and negative manipulation):
Larry, his eight year old daughter and several friends are leaving a pub after an end of the season soccer party. All but the young daughter are very intoxicated. Larry says he sees someone lying in the car park and he rushes to the person to see if he is alright. Upon reaching the man, Larry notices he is having difficulty breathing due to blood which was emanating from his nose and mouth, so he puts him on his side to clear his airways. Eventually the injured man’s friends show up and they accuse Larry of being responsible for punching the man in the face. The police arrive and question everyone. Unfortunately, those who were in the vicinity at the time were too drunk to make any reliable statements as to what happened. However the daughter was able to confirm her dad’s account of what happened. The police see blood spatter on the man’s trousers and seize them for bloodstain pattern analysis. DNA shows the blood on the trousers is that of the injured man.
Example scenario containing neutral contextual information
A local Salvation Army store manager called the police when one of his employees discovered apparent blood on a recently donated pair of trousers. The police have DNA tests done on the pants and the blood matches that of a person in missing persons DNA databank. Wearer DNA produces a DNA profile that matches a male sex offender who has not yet been located. Therefore, the trousers were submitted to the laboratory for analysis. Police want to know how the blood got on the trousers. Your interpretation is sought.
Survey Procedure
The procedure for engaging participants was the same as for Phase 1. Many of the participants
in Phase 1 also participated in Phase 2. The general instructions that accompanied the test
materials are shown in Appendix 1. Each analyst received 12 - 15 targets, and a response sheet
This document is a research report submitted to the U.S. Department of Justice. This report has not been published by the Department. Opinions or points of view expressed are those of the author(s)
and do not necessarily reflect the official position or policies of the U.S. Department of Justice.
NIJ Award # 2010-DN-BX-K213 48
corresponding to each target. A number was placed on a label that was attached to each at the
top of each pair of trousers.
The response sheet comprised two main parts with the same instructions and the same set of
pattern types as used for Phase 1, with the addition of satellite stains as a choice. The
remaining aspects of the procedure followed that used for Phase 1.
Error Rate Determination
The method of determining error rate were identical to that used in Phase 1. For both scoring
systems, the choice of either drip pattern or satellite stains was consider a correct answer for
target surfaces prepared with drip patterns.
Overall Pattern Classification Performance
The method of determining the overall pattern classification performance using the “AP score”
was identical to that used in Phase 1.
Results and Discussion
Pattern Classification Accuracy
Thirty analysts made judgements on 12 - 15 target patterns each, yielding 321 unique
assessments. The overall accuracy of these assessments is summarised in Table 14 and Figure
16, which display the distribution of correct, incorrect, and inconclusive judgements for Parts 1
and 2.
When constrained to a single pattern response in Part 1, analysts were reluctant to commit to a
classification, with over half of the responses recorded as inconclusive. In those cases where a
classification was made, there was a 64% success rate. This was a higher success rate than the
hard surfaces in Phase 1. The intent of this part of the survey was to test the accuracy of
pattern classification under conditions where an analyst might give a preliminary finding to an
This document is a research report submitted to the U.S. Department of Justice. This report has not been published by the Department. Opinions or points of view expressed are those of the author(s)
and do not necessarily reflect the official position or policies of the U.S. Department of Justice.
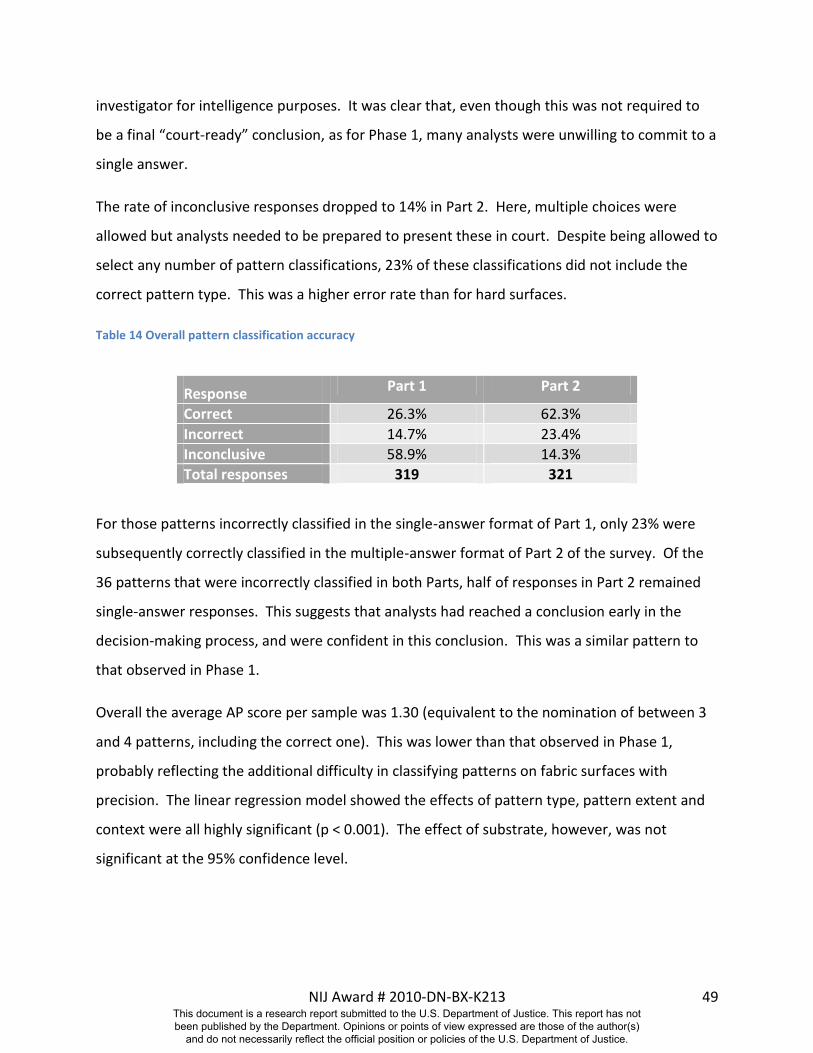
NIJ Award # 2010-DN-BX-K213 49
investigator for intelligence purposes. It was clear that, even though this was not required to
be a final “court-ready” conclusion, as for Phase 1, many analysts were unwilling to commit to a
single answer.
The rate of inconclusive responses dropped to 14% in Part 2. Here, multiple choices were
allowed but analysts needed to be prepared to present these in court. Despite being allowed to
select any number of pattern classifications, 23% of these classifications did not include the
correct pattern type. This was a higher error rate than for hard surfaces.
Table 14 Overall pattern classification accuracy
Response Part 1 Part 2
Correct 26.3% 62.3%
Incorrect 14.7% 23.4%
Inconclusive 58.9% 14.3%
Total responses 319 321
For those patterns incorrectly classified in the single-answer format of Part 1, only 23% were
subsequently correctly classified in the multiple-answer format of Part 2 of the survey. Of the
36 patterns that were incorrectly classified in both Parts, half of responses in Part 2 remained
single-answer responses. This suggests that analysts had reached a conclusion early in the
decision-making process, and were confident in this conclusion. This was a similar pattern to
that observed in Phase 1.
Overall the average AP score per sample was 1.30 (equivalent to the nomination of between 3
and 4 patterns, including the correct one). This was lower than that observed in Phase 1,
probably reflecting the additional difficulty in classifying patterns on fabric surfaces with
precision. The linear regression model showed the effects of pattern type, pattern extent and
context were all highly significant (p < 0.001). The effect of substrate, however, was not
significant at the 95% confidence level.
This document is a research report submitted to the U.S. Department of Justice. This report has not been published by the Department. Opinions or points of view expressed are those of the author(s)
and do not necessarily reflect the official position or policies of the U.S. Department of Justice.
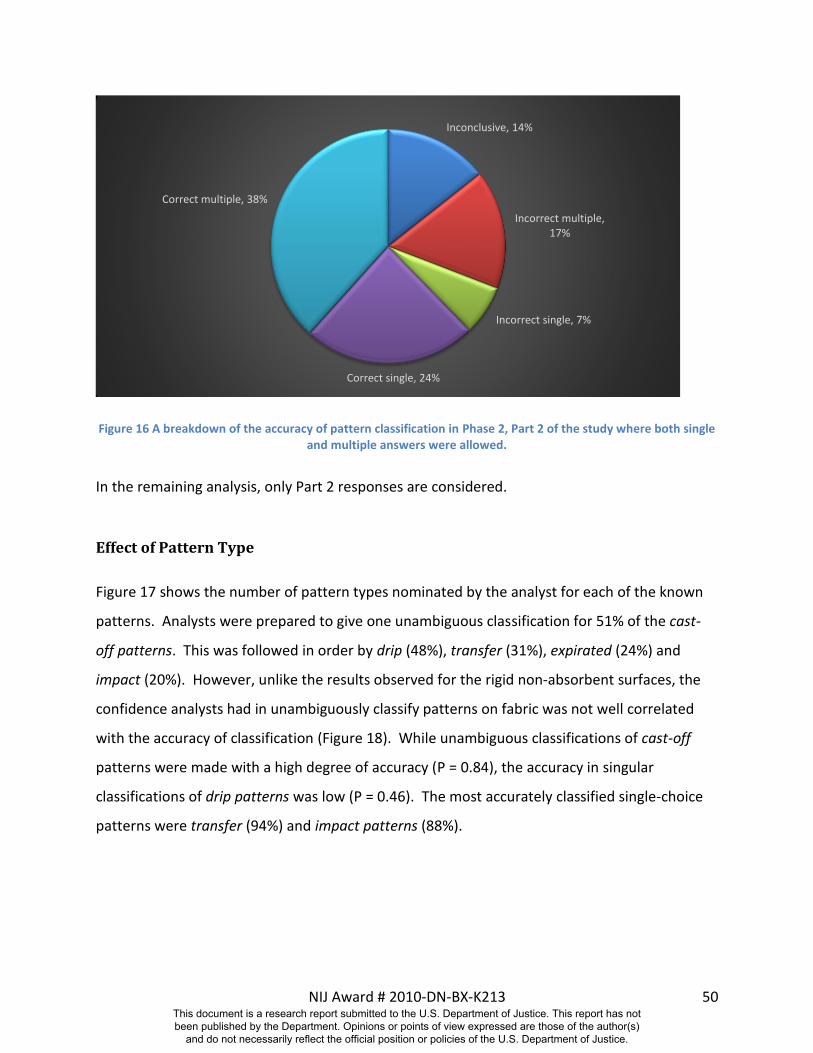
NIJ Award # 2010-DN-BX-K213 50
Figure 16 A breakdown of the accuracy of pattern classification in Phase 2, Part 2 of the study where both single and multiple answers were allowed.
In the remaining analysis, only Part 2 responses are considered.
Effect of Pattern Type
Figure 17 shows the number of pattern types nominated by the analyst for each of the known
patterns. Analysts were prepared to give one unambiguous classification for 51% of the cast-
off patterns. This was followed in order by drip (48%), transfer (31%), expirated (24%) and
impact (20%). However, unlike the results observed for the rigid non-absorbent surfaces, the
confidence analysts had in unambiguously classify patterns on fabric was not well correlated
with the accuracy of classification (Figure 18). While unambiguous classifications of cast-off
patterns were made with a high degree of accuracy (P = 0.84), the accuracy in singular
classifications of drip patterns was low (P = 0.46). The most accurately classified single-choice
patterns were transfer (94%) and impact patterns (88%).
Inconclusive, 14%
Incorrect multiple, 17%
Incorrect single, 7%
Correct single, 24%
Correct multiple, 38%
This document is a research report submitted to the U.S. Department of Justice. This report has not been published by the Department. Opinions or points of view expressed are those of the author(s)
and do not necessarily reflect the official position or policies of the U.S. Department of Justice.
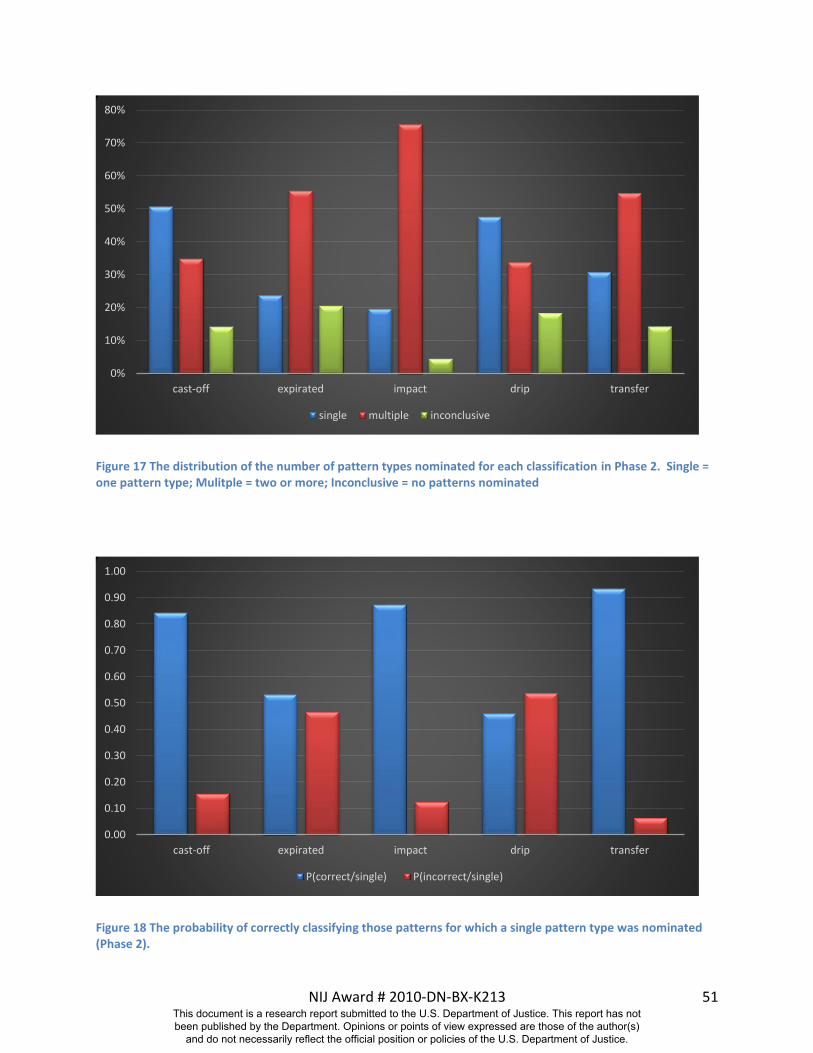
NIJ Award # 2010-DN-BX-K213 51
Figure 17 The distribution of the number of pattern types nominated for each classification in Phase 2. Single = one pattern type; Mulitple = two or more; Inconclusive = no patterns nominated
Figure 18 The probability of correctly classifying those patterns for which a single pattern type was nominated (Phase 2).
0%
10%
20%
30%
40%
50%
60%
70%
80%
cast-off expirated impact drip transfer
single multiple inconclusive
0.00
0.10
0.20
0.30
0.40
0.50
0.60
0.70
0.80
0.90
1.00
cast-off expirated impact drip transfer
P(correct/single) P(incorrect/single)
This document is a research report submitted to the U.S. Department of Justice. This report has not been published by the Department. Opinions or points of view expressed are those of the author(s)
and do not necessarily reflect the official position or policies of the U.S. Department of Justice.
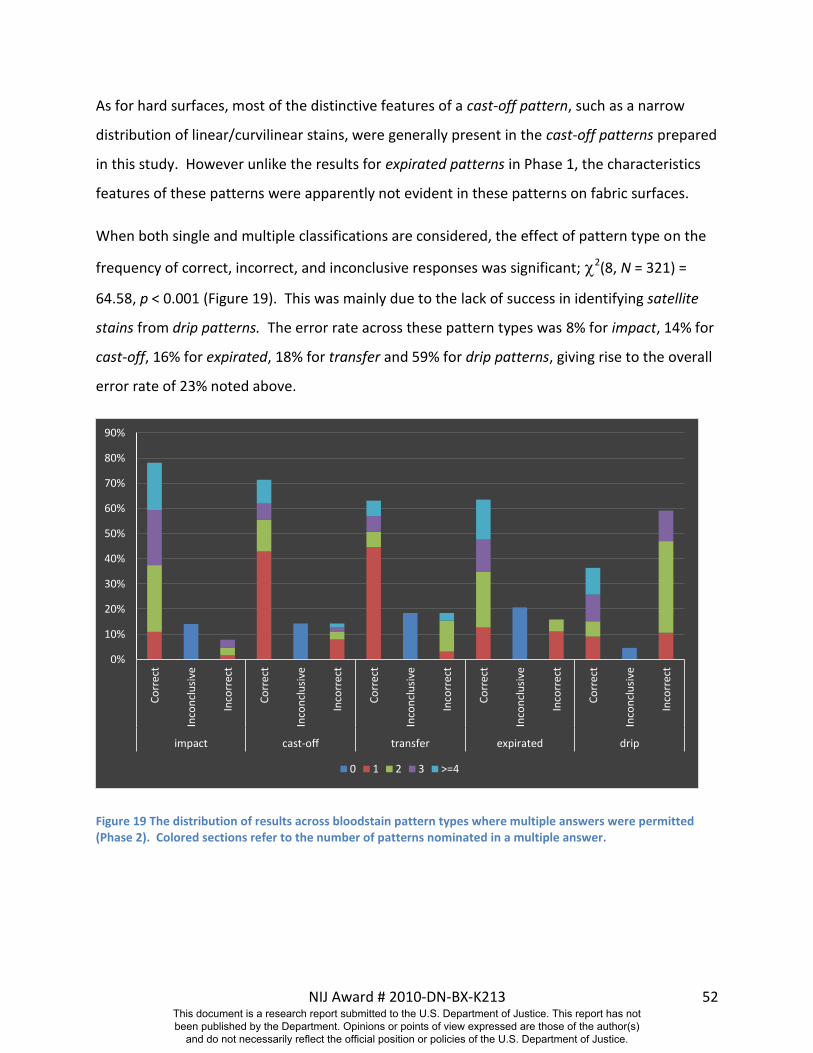
NIJ Award # 2010-DN-BX-K213 52
As for hard surfaces, most of the distinctive features of a cast-off pattern, such as a narrow
distribution of linear/curvilinear stains, were generally present in the cast-off patterns prepared
in this study. However unlike the results for expirated patterns in Phase 1, the characteristics
features of these patterns were apparently not evident in these patterns on fabric surfaces.
When both single and multiple classifications are considered, the effect of pattern type on the
frequency of correct, incorrect, and inconclusive responses was significant; 2(8, N = 321) =
64.58, p < 0.001 (Figure 19). This was mainly due to the lack of success in identifying satellite
stains from drip patterns. The error rate across these pattern types was 8% for impact, 14% for
cast-off, 16% for expirated, 18% for transfer and 59% for drip patterns, giving rise to the overall
error rate of 23% noted above.
Figure 19 The distribution of results across bloodstain pattern types where multiple answers were permitted (Phase 2). Colored sections refer to the number of patterns nominated in a multiple answer.
0%
10%
20%
30%
40%
50%
60%
70%
80%
90%
Co
rrec
t
Inco
ncl
usi
ve
Inco
rrec
t
Co
rrec
t
Inco
ncl
usi
ve
Inco
rrec
t
Co
rrec
t
Inco
ncl
usi
ve
Inco
rrec
t
Co
rrec
t
Inco
ncl
usi
ve
Inco
rrec
t
Co
rrec
t
Inco
ncl
usi
ve
Inco
rrec
t
impact cast-off transfer expirated drip
0 1 2 3 >=4
This document is a research report submitted to the U.S. Department of Justice. This report has not been published by the Department. Opinions or points of view expressed are those of the author(s)
and do not necessarily reflect the official position or policies of the U.S. Department of Justice.
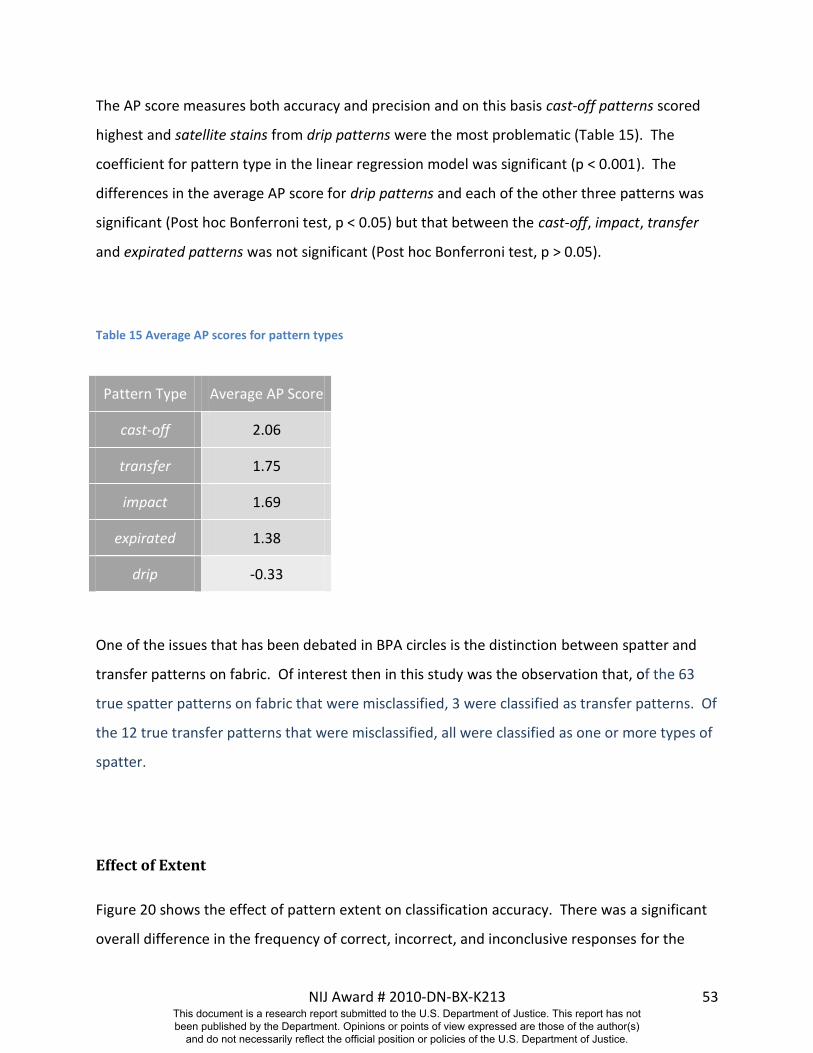
NIJ Award # 2010-DN-BX-K213 53
The AP score measures both accuracy and precision and on this basis cast-off patterns scored
highest and satellite stains from drip patterns were the most problematic (Table 15). The
coefficient for pattern type in the linear regression model was significant (p < 0.001). The
differences in the average AP score for drip patterns and each of the other three patterns was
significant (Post hoc Bonferroni test, p < 0.05) but that between the cast-off, impact, transfer
and expirated patterns was not significant (Post hoc Bonferroni test, p > 0.05).
Table 15 Average AP scores for pattern types
Pattern Type Average AP Score
cast-off 2.06
transfer 1.75
impact 1.69
expirated 1.38
drip -0.33
One of the issues that has been debated in BPA circles is the distinction between spatter and
transfer patterns on fabric. Of interest then in this study was the observation that, of the 63
true spatter patterns on fabric that were misclassified, 3 were classified as transfer patterns. Of
the 12 true transfer patterns that were misclassified, all were classified as one or more types of
spatter.
Effect of Extent
Figure 20 shows the effect of pattern extent on classification accuracy. There was a significant
overall difference in the frequency of correct, incorrect, and inconclusive responses for the
This document is a research report submitted to the U.S. Department of Justice. This report has not been published by the Department. Opinions or points of view expressed are those of the author(s)
and do not necessarily reflect the official position or policies of the U.S. Department of Justice.
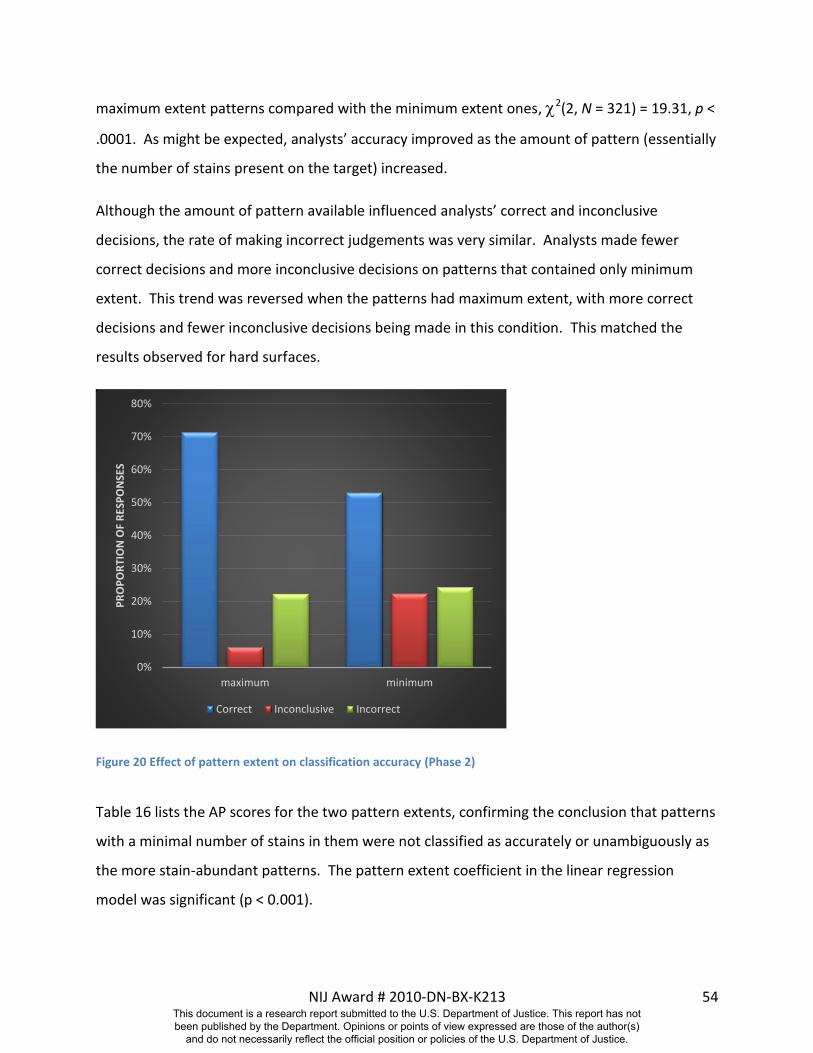
NIJ Award # 2010-DN-BX-K213 54
maximum extent patterns compared with the minimum extent ones, 2(2, N = 321) = 19.31, p <
.0001. As might be expected, analysts’ accuracy improved as the amount of pattern (essentially
the number of stains present on the target) increased.
Although the amount of pattern available influenced analysts’ correct and inconclusive
decisions, the rate of making incorrect judgements was very similar. Analysts made fewer
correct decisions and more inconclusive decisions on patterns that contained only minimum
extent. This trend was reversed when the patterns had maximum extent, with more correct
decisions and fewer inconclusive decisions being made in this condition. This matched the
results observed for hard surfaces.
Figure 20 Effect of pattern extent on classification accuracy (Phase 2)
Table 16 lists the AP scores for the two pattern extents, confirming the conclusion that patterns
with a minimal number of stains in them were not classified as accurately or unambiguously as
the more stain-abundant patterns. The pattern extent coefficient in the linear regression
model was significant (p < 0.001).
0%
10%
20%
30%
40%
50%
60%
70%
80%
maximum minimum
PR
OP
OR
TIO
N O
F R
ESP
ON
SES
Correct Inconclusive Incorrect
This document is a research report submitted to the U.S. Department of Justice. This report has not been published by the Department. Opinions or points of view expressed are those of the author(s)
and do not necessarily reflect the official position or policies of the U.S. Department of Justice.
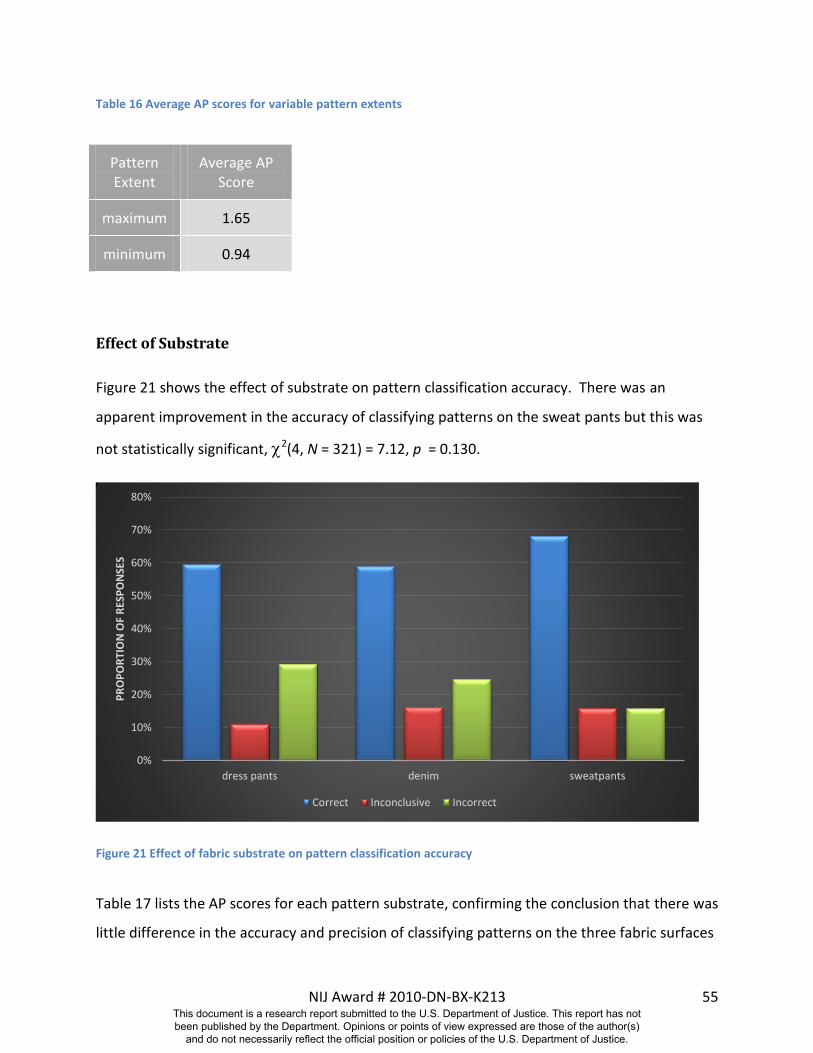
NIJ Award # 2010-DN-BX-K213 55
Table 16 Average AP scores for variable pattern extents
Pattern Extent
Average AP Score
maximum 1.65
minimum 0.94
Effect of Substrate
Figure 21 shows the effect of substrate on pattern classification accuracy. There was an
apparent improvement in the accuracy of classifying patterns on the sweat pants but this was
not statistically significant, 2(4, N = 321) = 7.12, p = 0.130.
Figure 21 Effect of fabric substrate on pattern classification accuracy
Table 17 lists the AP scores for each pattern substrate, confirming the conclusion that there was
little difference in the accuracy and precision of classifying patterns on the three fabric surfaces
0%
10%
20%
30%
40%
50%
60%
70%
80%
dress pants denim sweatpants
PR
OP
OR
TIO
N O
F R
ESP
ON
SES
Correct Inconclusive Incorrect
This document is a research report submitted to the U.S. Department of Justice. This report has not been published by the Department. Opinions or points of view expressed are those of the author(s)
and do not necessarily reflect the official position or policies of the U.S. Department of Justice.
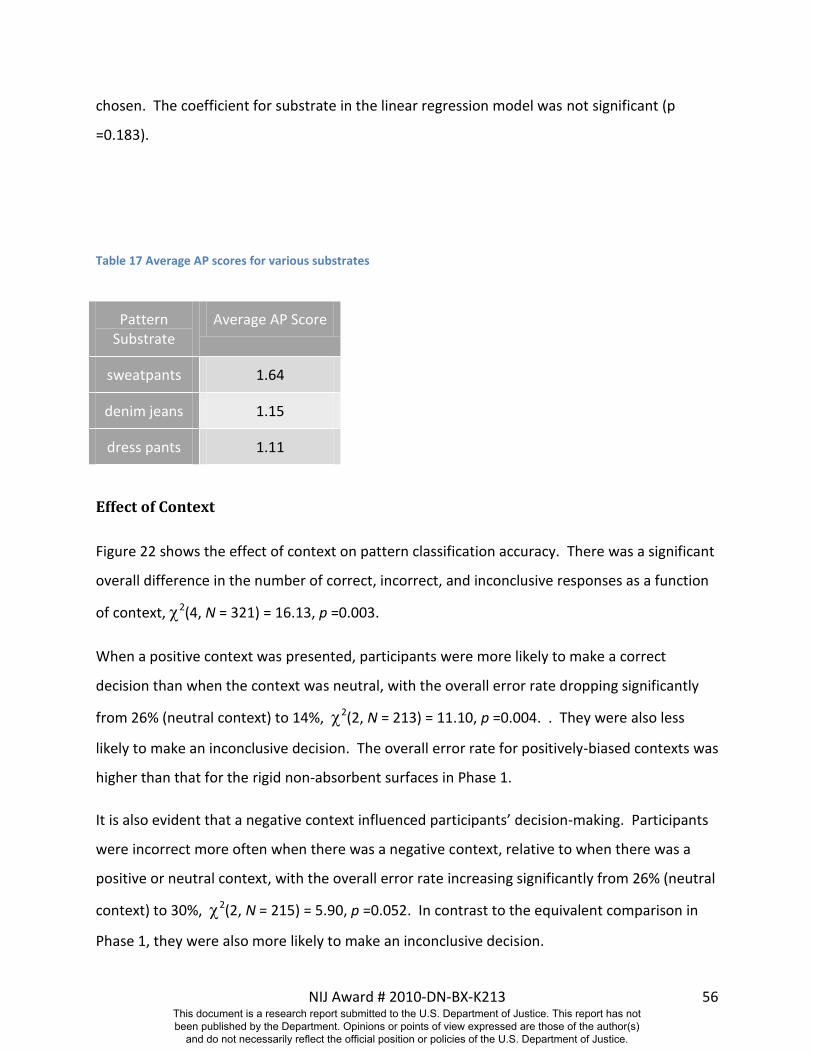
NIJ Award # 2010-DN-BX-K213 56
chosen. The coefficient for substrate in the linear regression model was not significant (p
=0.183).
Table 17 Average AP scores for various substrates
Pattern Substrate
Average AP Score
sweatpants 1.64
denim jeans 1.15
dress pants 1.11
Effect of Context
Figure 22 shows the effect of context on pattern classification accuracy. There was a significant
overall difference in the number of correct, incorrect, and inconclusive responses as a function
of context, 2(4, N = 321) = 16.13, p =0.003.
When a positive context was presented, participants were more likely to make a correct
decision than when the context was neutral, with the overall error rate dropping significantly
from 26% (neutral context) to 14%, 2(2, N = 213) = 11.10, p =0.004. . They were also less
likely to make an inconclusive decision. The overall error rate for positively-biased contexts was
higher than that for the rigid non-absorbent surfaces in Phase 1.
It is also evident that a negative context influenced participants’ decision-making. Participants
were incorrect more often when there was a negative context, relative to when there was a
positive or neutral context, with the overall error rate increasing significantly from 26% (neutral
context) to 30%, 2(2, N = 215) = 5.90, p =0.052. In contrast to the equivalent comparison in
Phase 1, they were also more likely to make an inconclusive decision.
This document is a research report submitted to the U.S. Department of Justice. This report has not been published by the Department. Opinions or points of view expressed are those of the author(s)
and do not necessarily reflect the official position or policies of the U.S. Department of Justice.
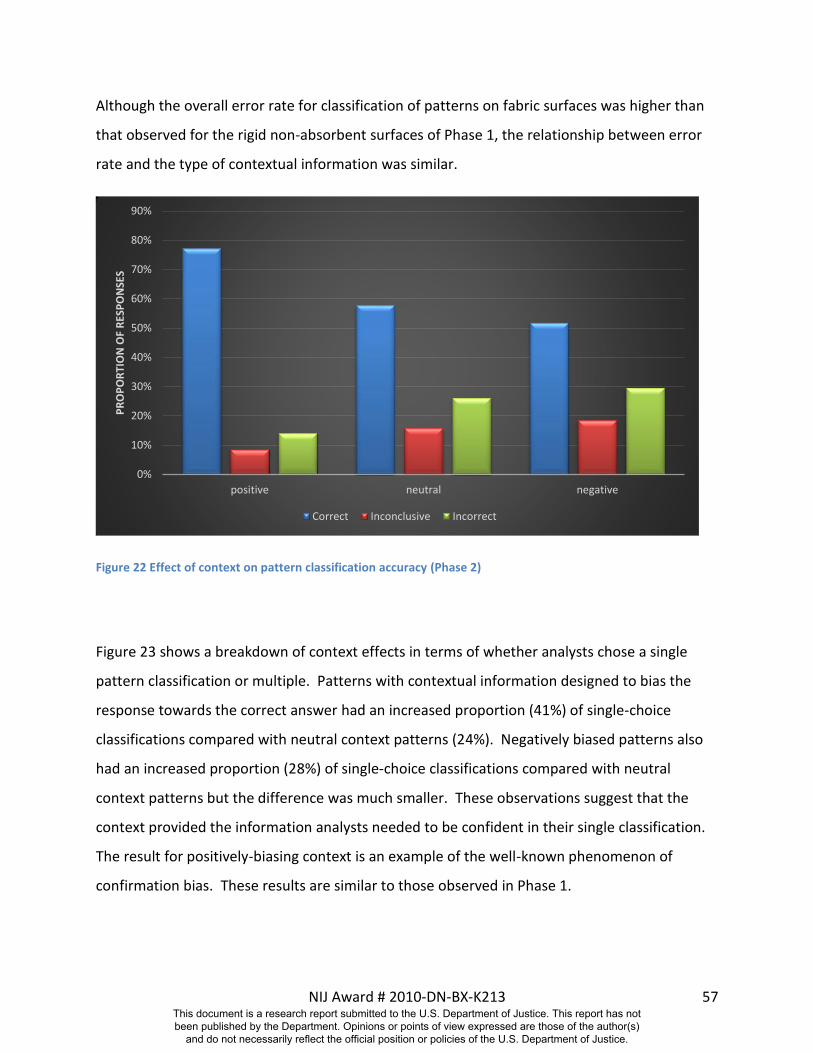
NIJ Award # 2010-DN-BX-K213 57
Although the overall error rate for classification of patterns on fabric surfaces was higher than
that observed for the rigid non-absorbent surfaces of Phase 1, the relationship between error
rate and the type of contextual information was similar.
Figure 22 Effect of context on pattern classification accuracy (Phase 2)
Figure 23 shows a breakdown of context effects in terms of whether analysts chose a single
pattern classification or multiple. Patterns with contextual information designed to bias the
response towards the correct answer had an increased proportion (41%) of single-choice
classifications compared with neutral context patterns (24%). Negatively biased patterns also
had an increased proportion (28%) of single-choice classifications compared with neutral
context patterns but the difference was much smaller. These observations suggest that the
context provided the information analysts needed to be confident in their single classification.
The result for positively-biasing context is an example of the well-known phenomenon of
confirmation bias. These results are similar to those observed in Phase 1.
0%
10%
20%
30%
40%
50%
60%
70%
80%
90%
positive neutral negative
PR
OP
OR
TIO
N O
F R
ESP
ON
SES
Correct Inconclusive Incorrect
This document is a research report submitted to the U.S. Department of Justice. This report has not been published by the Department. Opinions or points of view expressed are those of the author(s)
and do not necessarily reflect the official position or policies of the U.S. Department of Justice.
NIJ Award # 2010-DN-BX-K213 58
Figure 23 Level of ambiguity in pattern classification as a function of context information (Phase 2)
Table 18 lists the average AP scores for each type of added contextual bias which support the
view that added bias influences the precision of pattern classification. The coefficient for
context in the linear regression model was significant (p < 0.001).
Table 18 Average AP scores for each type of added contextual bias
Contextual bias
Average AP Score
positive 2.07
neutral 0.98
negative 0.86
0%
10%
20%
30%
40%
50%
60%
70%
positive neutral negative
single multiple inconclusive
This document is a research report submitted to the U.S. Department of Justice. This report has not been published by the Department. Opinions or points of view expressed are those of the author(s)
and do not necessarily reflect the official position or policies of the U.S. Department of Justice.
NIJ Award # 2010-DN-BX-K213 59
Looking specifically at the influence of positive and negative bias separately, the difference in
the average AP score for positive-biased and neutral contexts was significant (Post hoc
Bonferroni test, p < 0.05) but that between negative-biased and neutral samples was not
significant (Post hoc Bonferroni test, p > 0.05). In other words, while negative bias has
decreased accuracy significantly, precision hasn’t been affected to the same degree. This
matches the results for the patterns on hard surfaces (Phase 1).
This document is a research report submitted to the U.S. Department of Justice. This report has not been published by the Department. Opinions or points of view expressed are those of the author(s)
and do not necessarily reflect the official position or policies of the U.S. Department of Justice.
NIJ Award # 2010-DN-BX-K213 60
SUPPLEMENTARY STUDY: The Reliability of Bloodstain Pattern Sequencing
Introduction
It is common for bloodstain patterns at crime scenes to be superimposed. The order in which
such patterns are deposited can sometimes be valuable evidence of the timing of the events
that took place [31]. The observation, for example, that a bloodied shoeprint impression has
spatter stains from a beaten victim on top of the impression indicates that those stains
occurred after the shoeprint impression was made. This information would be highly relevant
if, for example, the defendant claimed he arrived at the scene after the victim had been beaten.
Despite the value of this type of evidence, there have been few published studies made of
bloodstain pattern sequencing and no standardized methods have emerged.
Determining the sequence of events from bloodstain patterns frequently involves altered
patterns. For example, the presence of perimeter stains10 in a pattern is evidence that more
than one event took place with a lapse of time between them. If blood is initially dripped onto
a surface and subsequently wiped prior to complete drying, a perimeter ring of staining results,
providing evidence of the sequence of events. If one pattern dries before the second is
superimposed11, however, sequencing becomes more difficult. Hurley and Pex [32] concluded
that it was difficult to distinguish a dried spatter pattern overlaid by a bloodied shoe impression
from a combination of patterns in the reverse sequence. They recommended particular caution
when attempting to determine such a sequence from photographs. While these authors
produced photographs to illustrate their conclusions no controlled experiments were
presented.
The objective of this supplementary study was to formally assess the reliability of current
methods for establishing the sequence of superimposed patterns where the first pattern
deposited has completely dried.
10
A perimeter stain is an altered stain that consists of the peripheral characteristics of the original stain. 11
In the context of this paper a superimposed pattern is the deposition of that pattern on top of an existing pattern
This document is a research report submitted to the U.S. Department of Justice. This report has not been published by the Department. Opinions or points of view expressed are those of the author(s)
and do not necessarily reflect the official position or policies of the U.S. Department of Justice.
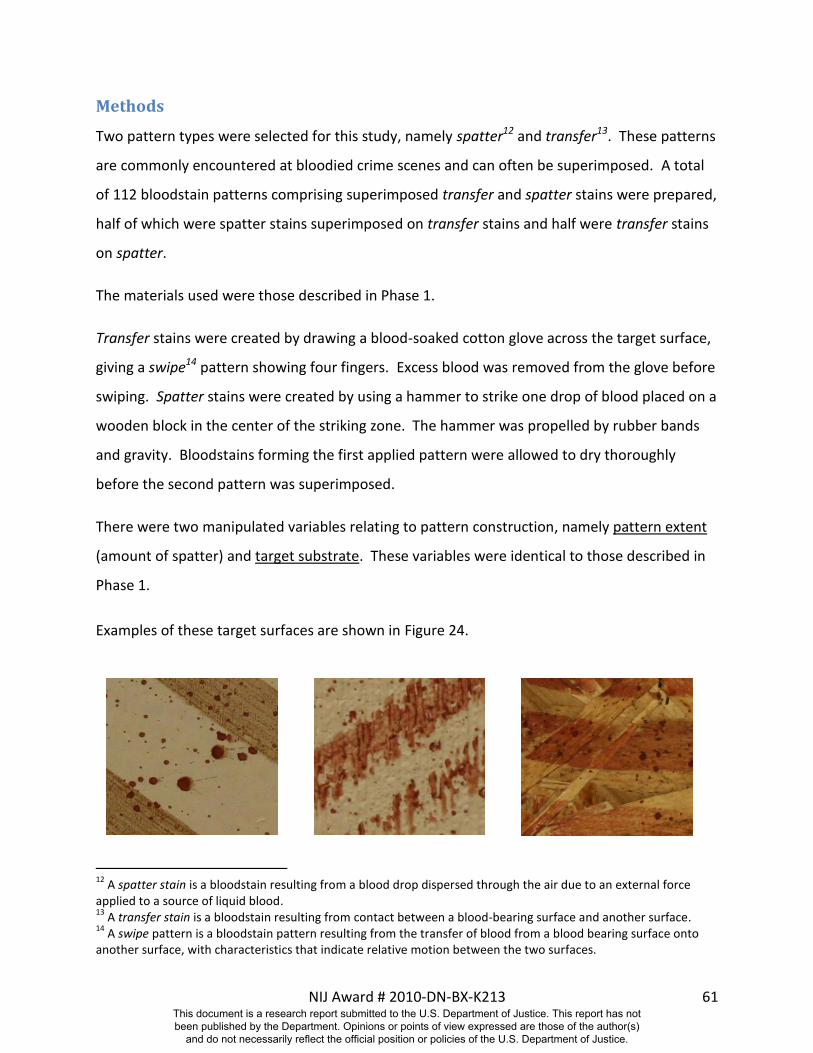
NIJ Award # 2010-DN-BX-K213 61
Methods
Two pattern types were selected for this study, namely spatter12 and transfer13. These patterns
are commonly encountered at bloodied crime scenes and can often be superimposed. A total
of 112 bloodstain patterns comprising superimposed transfer and spatter stains were prepared,
half of which were spatter stains superimposed on transfer stains and half were transfer stains
on spatter.
The materials used were those described in Phase 1.
Transfer stains were created by drawing a blood-soaked cotton glove across the target surface,
giving a swipe14 pattern showing four fingers. Excess blood was removed from the glove before
swiping. Spatter stains were created by using a hammer to strike one drop of blood placed on a
wooden block in the center of the striking zone. The hammer was propelled by rubber bands
and gravity. Bloodstains forming the first applied pattern were allowed to dry thoroughly
before the second pattern was superimposed.
There were two manipulated variables relating to pattern construction, namely pattern extent
(amount of spatter) and target substrate. These variables were identical to those described in
Phase 1.
Examples of these target surfaces are shown in Figure 24.
12
A spatter stain is a bloodstain resulting from a blood drop dispersed through the air due to an external force applied to a source of liquid blood. 13
A transfer stain is a bloodstain resulting from contact between a blood-bearing surface and another surface. 14
A swipe pattern is a bloodstain pattern resulting from the transfer of blood from a blood bearing surface onto another surface, with characteristics that indicate relative motion between the two surfaces.
This document is a research report submitted to the U.S. Department of Justice. This report has not been published by the Department. Opinions or points of view expressed are those of the author(s)
and do not necessarily reflect the official position or policies of the U.S. Department of Justice.
NIJ Award # 2010-DN-BX-K213 62
A B C
Figure 24 Example of patterns created on a paint (A), wallpaper (B), and chipboard (C) surfaces
Each analyst received a unique set of 3 or 4 sequencing targets and a response sheet for each
target. A number was placed at the top of each target. This identified which target
corresponded to each response sheet and indicated the pattern alignment during pattern
construction. The response sheet stated: “This sample has both a transfer and a spatter pattern
on it. You are asked to determine the sequence these two patterns have been applied in.
Please choose ONE of the following:
Spatter first followed by transfer
Transfer first followed by spatter
I cannot determine which pattern occurred first”
Each possible variable combination (sequence order X substrate X extent) was replicated a
minimum of 5 times. As was the case for Phase 1 of this study, all targets were coated with a
clear lacquer for the protection of the bloodstain pattern. This was not expected to have any
effect on the performance of the sequencing analysis, but this was not tested.
Results and Discussion
Of the 112 samples distributed to participants, responses to 104 were received. These
comprised 50 combinations of spatter stains superimposed on transfer stains and 54 transfer
stains on spatter. Of the 104 conclusions given, over half (52.9%) were recorded as
inconclusive, 32.7% correctly assigned the sequence and 14.4% gave an incorrect
interpretation.
Figure 25 shows a breakdown according to the original pattern combination presented. It is
apparent from these results that there was a marked difference in the response of analysts to
the two pattern sequences they were presented with. Where spatter stains were deposited on
top of transfer stains, 12% of the patterns were incorrectly sequenced, whereas for the reverse
This document is a research report submitted to the U.S. Department of Justice. This report has not been published by the Department. Opinions or points of view expressed are those of the author(s)
and do not necessarily reflect the official position or policies of the U.S. Department of Justice.
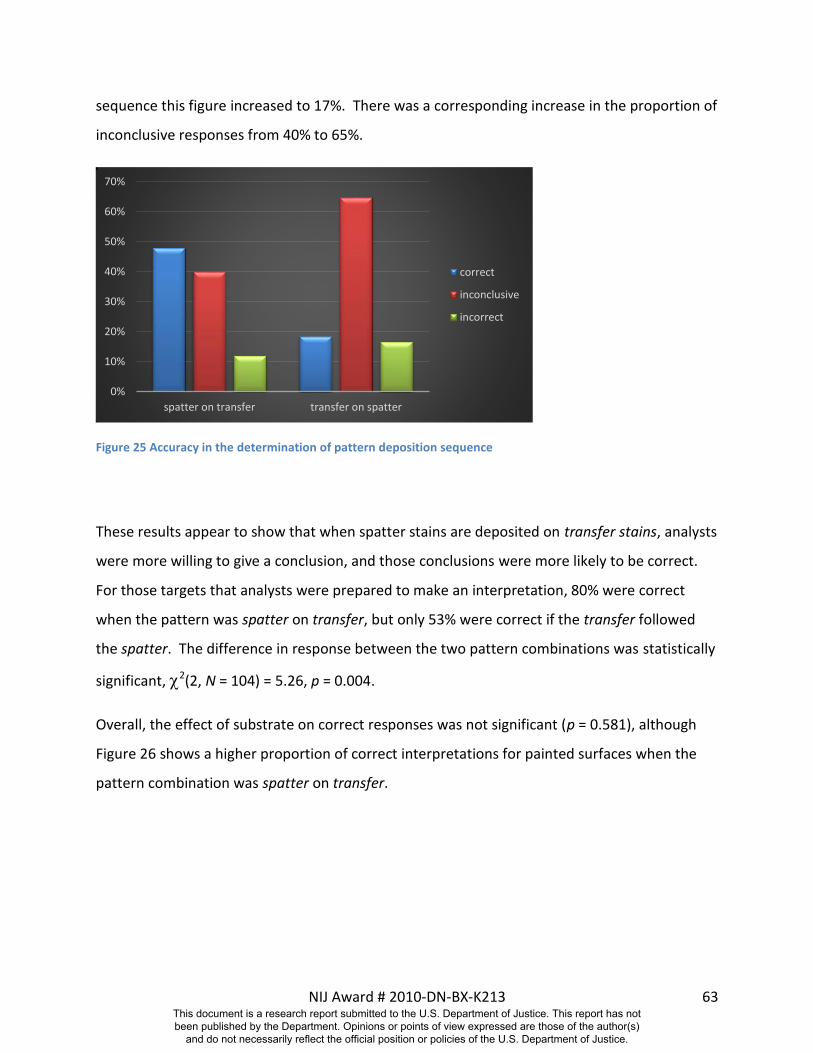
NIJ Award # 2010-DN-BX-K213 63
sequence this figure increased to 17%. There was a corresponding increase in the proportion of
inconclusive responses from 40% to 65%.
Figure 25 Accuracy in the determination of pattern deposition sequence
These results appear to show that when spatter stains are deposited on transfer stains, analysts
were more willing to give a conclusion, and those conclusions were more likely to be correct.
For those targets that analysts were prepared to make an interpretation, 80% were correct
when the pattern was spatter on transfer, but only 53% were correct if the transfer followed
the spatter. The difference in response between the two pattern combinations was statistically
significant, 2(2, N = 104) = 5.26, p = 0.004.
Overall, the effect of substrate on correct responses was not significant (p = 0.581), although
Figure 26 shows a higher proportion of correct interpretations for painted surfaces when the
pattern combination was spatter on transfer.
0%
10%
20%
30%
40%
50%
60%
70%
spatter on transfer transfer on spatter
correct
inconclusive
incorrect
This document is a research report submitted to the U.S. Department of Justice. This report has not been published by the Department. Opinions or points of view expressed are those of the author(s)
and do not necessarily reflect the official position or policies of the U.S. Department of Justice.
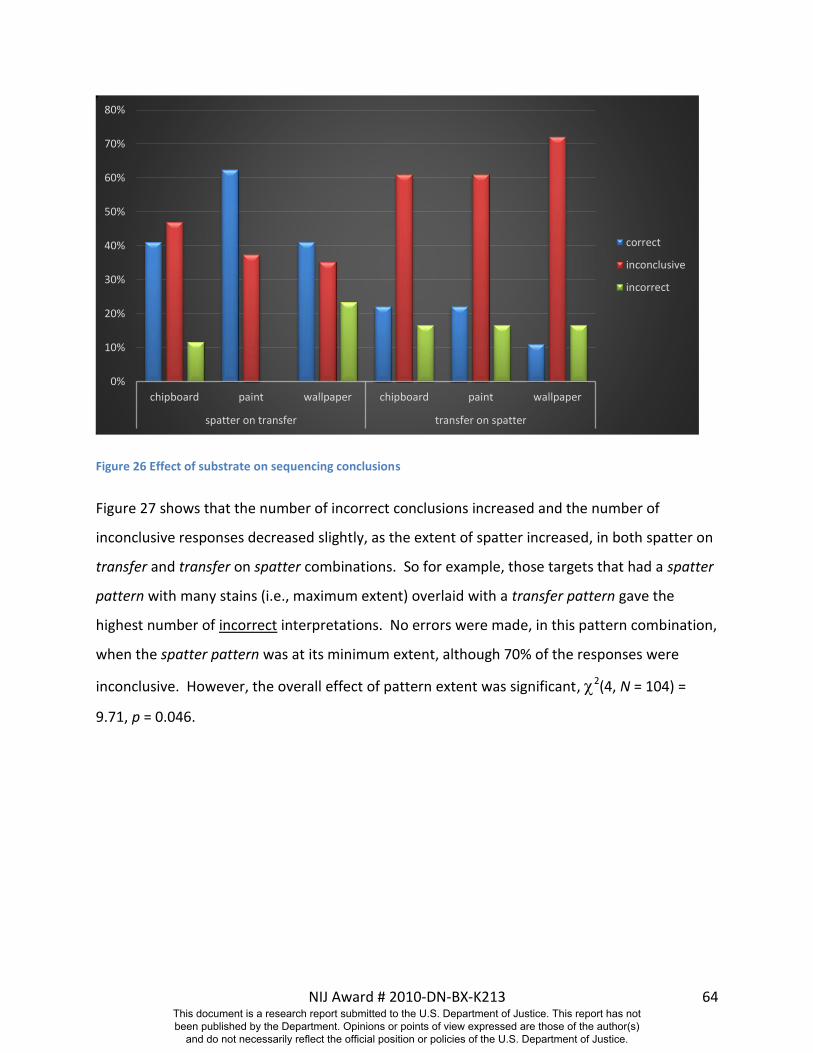
NIJ Award # 2010-DN-BX-K213 64
Figure 26 Effect of substrate on sequencing conclusions
Figure 27 shows that the number of incorrect conclusions increased and the number of
inconclusive responses decreased slightly, as the extent of spatter increased, in both spatter on
transfer and transfer on spatter combinations. So for example, those targets that had a spatter
pattern with many stains (i.e., maximum extent) overlaid with a transfer pattern gave the
highest number of incorrect interpretations. No errors were made, in this pattern combination,
when the spatter pattern was at its minimum extent, although 70% of the responses were
inconclusive. However, the overall effect of pattern extent was significant, 2(4, N = 104) =
9.71, p = 0.046.
0%
10%
20%
30%
40%
50%
60%
70%
80%
chipboard paint wallpaper chipboard paint wallpaper
spatter on transfer transfer on spatter
correct
inconclusive
incorrect
This document is a research report submitted to the U.S. Department of Justice. This report has not been published by the Department. Opinions or points of view expressed are those of the author(s)
and do not necessarily reflect the official position or policies of the U.S. Department of Justice.
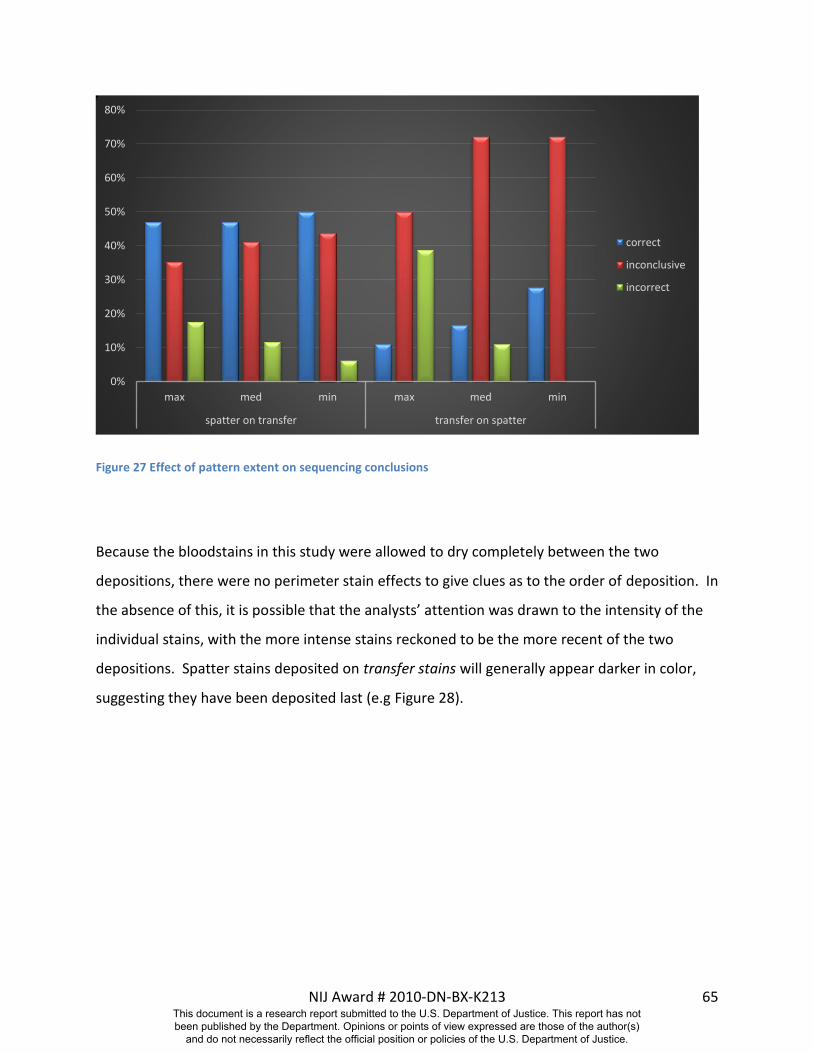
NIJ Award # 2010-DN-BX-K213 65
Figure 27 Effect of pattern extent on sequencing conclusions
Because the bloodstains in this study were allowed to dry completely between the two
depositions, there were no perimeter stain effects to give clues as to the order of deposition. In
the absence of this, it is possible that the analysts’ attention was drawn to the intensity of the
individual stains, with the more intense stains reckoned to be the more recent of the two
depositions. Spatter stains deposited on transfer stains will generally appear darker in color,
suggesting they have been deposited last (e.g Figure 28).
0%
10%
20%
30%
40%
50%
60%
70%
80%
max med min max med min
spatter on transfer transfer on spatter
correct
inconclusive
incorrect
This document is a research report submitted to the U.S. Department of Justice. This report has not been published by the Department. Opinions or points of view expressed are those of the author(s)
and do not necessarily reflect the official position or policies of the U.S. Department of Justice.
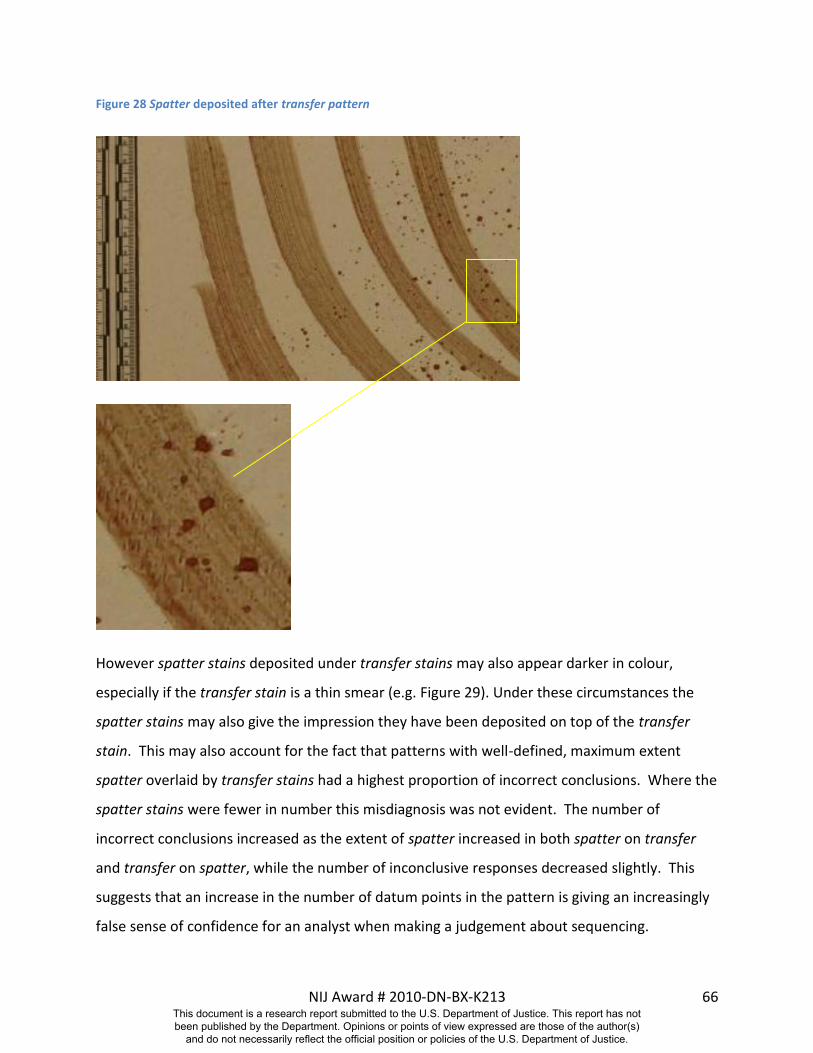
NIJ Award # 2010-DN-BX-K213 66
Figure 28 Spatter deposited after transfer pattern
However spatter stains deposited under transfer stains may also appear darker in colour,
especially if the transfer stain is a thin smear (e.g. Figure 29). Under these circumstances the
spatter stains may also give the impression they have been deposited on top of the transfer
stain. This may also account for the fact that patterns with well-defined, maximum extent
spatter overlaid by transfer stains had a highest proportion of incorrect conclusions. Where the
spatter stains were fewer in number this misdiagnosis was not evident. The number of
incorrect conclusions increased as the extent of spatter increased in both spatter on transfer
and transfer on spatter, while the number of inconclusive responses decreased slightly. This
suggests that an increase in the number of datum points in the pattern is giving an increasingly
false sense of confidence for an analyst when making a judgement about sequencing.
This document is a research report submitted to the U.S. Department of Justice. This report has not been published by the Department. Opinions or points of view expressed are those of the author(s)
and do not necessarily reflect the official position or policies of the U.S. Department of Justice.
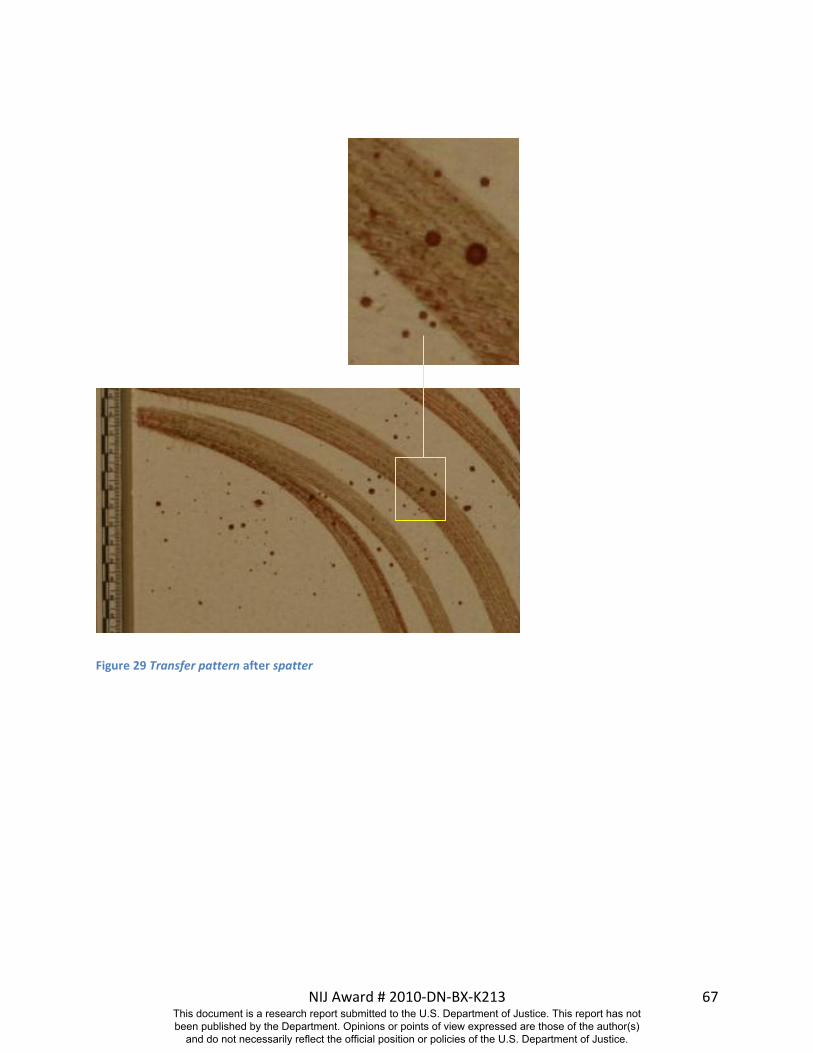
NIJ Award # 2010-DN-BX-K213 67
Figure 29 Transfer pattern after spatter
This document is a research report submitted to the U.S. Department of Justice. This report has not been published by the Department. Opinions or points of view expressed are those of the author(s)
and do not necessarily reflect the official position or policies of the U.S. Department of Justice.
NIJ Award # 2010-DN-BX-K213 68
CONCLUSIONS
Discussion of Findings
The purpose of this study was to assess the accuracy of the current methods used by analysts in
the classification of bloodstain patterns. To do this well-trained and highly experienced
analysts examined over 730 patterns in two phases of the study, one focussing on rigid non-
absorbent surfaces representing surfaces frequently encountered at crime scenes and the other
on fabric surfaces representing clothing. Six different pattern types were used over the two
studies. The extent of available pattern, the nature of the substrate and the type of contextual
information were varied in a balanced experiment designed to determine the effect of these
variables on pattern classification accuracy.
In Part 2 of each phase analysts were required to classify the pattern to a standard required for
court. To do this they were allowed to select one or more pattern classifications that they
determined could not be excluded. Within the chosen range of conditions, the overall rate of
inconclusive answers was 17.4% for rigid surfaces and 14.3% for fabric surfaces. This gives
some measure of the difficulty in the interpretation of the patterns created in this study.
Where a classification was made, either by choosing a single pattern or by nominating more
than one, 13.1% of these classifications did not include the correct pattern type for the rigid
surfaces and 23.4% for fabric surfaces. These can be considered the first approximations of
overall error rates for the pattern classification method.
Some patterns were more reliably classified than others. In particular the error rate was 4% for
expirated patterns on rigid surfaces and 8% for impact patterns on fabric surfaces. The
characteristic features of expirated patterns (e.g. mucus strands and air bubbles) were generally
evident on the rigid non-absorbent surface targets, making these patterns more recognisable,
but apparently less evident on fabric. It is not clear why analysts had more success identifying
impact patterns on fabric surfaces. It is possible that whenever the pattern comprised a
number of small spatter stains (the majority of samples in the survey) analysts decided that
impact spatter simply could not be excluded.
This document is a research report submitted to the U.S. Department of Justice. This report has not been published by the Department. Opinions or points of view expressed are those of the author(s)
and do not necessarily reflect the official position or policies of the U.S. Department of Justice.
NIJ Award # 2010-DN-BX-K213 69
The highest rates of misclassification were 59% for satellite stains from a drip pattern on fabric
surfaces and 19% for impact patterns on rigid surfaces. The identification of drip patterns often
relies on the presence of a central 'parent' stain on a horizontal surface with associated satellite
stains. When evaluating drip patterns in a classroom or crime scene setting analysts most often
have the parent stain associated with the drip pattern making identification relatively easy. In
clothing examinations, the parent stain is most often not present because it is on some object
the clothing was adjacent to and left at the scene. Given the absence of a 'parent' stain in the
patterns created in this phase of the study, it is possible that analysts decided to exclude this
pattern type.
Many of the impact patterns on the rigid non-absorbent surfaces had a somewhat narrow
distribution of stains, similar to cast-off. This may account for the higher error rate for this
pattern type in Phase 1.
Cast-off patterns were generally moderately accurately classified in both phases (14%),
presumably because most of the distinctive features of a cast-off pattern, such as a narrow
distribution of linear/curvilinear stains, were generally present in the cast-off patterns prepared
in this study.
Looking more closely at the other variables we used in this study, it is evident that where the
amount of available pattern was limited or the substrate made stain visualisation more difficult
(e.g. chipboard) the proportion of correctly classified patterns was less. However the reduction
in classification accuracy was generally accompanied by an increase in the proportion of
inconclusive responses. So where the pattern was more difficult to recognise, analysts became
more conservative in their judgment, which is what the court would expect from a reliable
method.
The error rates estimated from this study are based, in part, on the chosen conditions for the
various variables used in the presentation of samples for analysis. These were designed to be a
fair representation of real casework but remain a subjective judgement of the experimenters.
The conditions included the use of a coating of laquer on the rigid surfaces and removing the
requirement to perform any chemical tests on the bloodstains. Firearms spatter did not
This document is a research report submitted to the U.S. Department of Justice. This report has not been published by the Department. Opinions or points of view expressed are those of the author(s)
and do not necessarily reflect the official position or policies of the U.S. Department of Justice.
NIJ Award # 2010-DN-BX-K213 70
contain any other trace evidence that could be utilized to assist with pattern classification.
These conditions were not expected to lead to erroneous classifications but it is possible they
contributed to a lowering of the AP score.
An alternative baseline measure of error rate might be considered on the basis of the
combinations of variables that gave rise to the lowest overall error, across all pattern types, in
the absence of contextual effects. For the rigid surfaces the lowest error rate was 6.7% (with
only two misclassifications made). This occurred for the white-painted surfaces over all pattern
extents. For the fabric surfaces, the lowest error rate was 12.1% (with four misclassifications
made). This occurred for the grey sweatpants, over all pattern extents.
Of particular interest in this study was whether contextual information had any effect on
classification decisions. Study results showed that where a scenario was offered that
deliberately pointed analysts towards the correct classification, the proportion of
misclassifications that resulted was significantly lower (8% rigid surfaces, 14% fabric surfaces)
than that observed for patterns with neutral scenarios (11% rigid surfaces, 26% fabric surfaces).
This is an example of the well-known phenomenon of confirmation bias and reveals a
vulnerability to contextual effects that justifies further investigation.
Of more concern is the potential for this vulnerability to bias translating into misclassifications.
Where a scenario was offered that deliberately pointed analysts towards an incorrect
classification, the proportion of misclassifications that resulted was significantly higher (20%
rigid surfaces, 30% fabric surfaces) than that observed for patterns with neutral scenarios (11%
rigid surfaces, 26% fabric surfaces).
So this study has produced evidence that analysts use contextual information in making pattern
classification and this information can influence their accuracy. This highlights the fact that the
boundary between pattern recognition and crime scene reconstruction is often blurred. This is
not helped by the fact that, at present, there isn’t a rigorous protocol for BPA that distinguishes
the two processes. This means that at the stage of pattern classification, additional case-
specific information, such as medical findings, case circumstances and even witness testimony
is being allowed to factor into analyst’s interpretations. This problem is further compounded
This document is a research report submitted to the U.S. Department of Justice. This report has not been published by the Department. Opinions or points of view expressed are those of the author(s)
and do not necessarily reflect the official position or policies of the U.S. Department of Justice.
NIJ Award # 2010-DN-BX-K213 71
by the fact that current pattern classifications used in BPA are described in terms of pattern
formation mechanisms, which actually makes them components of a reconstruction theory,
rather than a summary of pattern characteristics.
The supplementary study on superimposed patterns showed that, for the current sequencing
methods, the chances of incorrectly concluding the order of deposition in a spatter/transfer
pattern combination is approximately 12% where spatter stains are deposited on top of
transfer stains and 17% for the reverse sequence. This test was done in the absence of
perimeter stain effects.
Implications for Policy and Practice
One significant implication of this study is the inference that contextual information is being
integrated into pattern classification decisions. The assumption made here is that this is not a
competency issue, given that the participants in this study were all experienced bloodstain
pattern analysts. However it is known in cognitive science that experts can in fact be more
susceptible to bias. The assumption made in this study could therefore be profitably tested.
Regardless of this it seems prudent for practitioners and agencies to take steps to minimise the
effects of contextual information. The practicalities of this may vary from agency to agency and
may not be straight-forward, as many analysts are immersed in an investigation in ways that
make it difficult to control the flow of information. However opportunities for improvement
may be available, such as via the peer review system, where information control might be
easier. It would seem advantageous for the BPA community to agree on a standard
methodology for the analysis of bloodstain patterns which includes a better distinction
between classification and reconstruction and relies less on mechanistic descriptions of
patterns.
We suspect that many bloodstain pattern analysts do not attempt to determine the sequence
of deposition of bloodstain patterns. For those who do, it would be worth reflecting on the
results of this study. No defined methodology was prescribed for the sequencing analysis in
this study and it is possible that a reliable methodology exists or could be developed. Either
way it is incumbent on analysts to validate and publish their method and seek peer review.
This document is a research report submitted to the U.S. Department of Justice. This report has not been published by the Department. Opinions or points of view expressed are those of the author(s)
and do not necessarily reflect the official position or policies of the U.S. Department of Justice.
NIJ Award # 2010-DN-BX-K213 72
Implications for Further Research
It is acknowledged that a study of this sort has limitations, not the least of which is the fact that
analysts were not making decisions in the reality of a courtroom situation. For the first time
however a useful baseline has been established for the expected error rate in bloodstain
pattern classification, the most widely used of the various BPA methods. Inevitably a number
of questions have arisen which are worthy of further research. These include:
• How are pattern classification decisions made?
• Can we establish a minimum set of characteristics that must be observed before a “reliable” classification can be made?
• What is an acceptable error rate for BPA?
• What type of contextual information is the most influential?
• What contextual information is legitimate and helpful?
• What would a standardised methodology that minimises the potential for bias look like?
• Is there a way of more reliably determining pattern deposition sequence?
This document is a research report submitted to the U.S. Department of Justice. This report has not been published by the Department. Opinions or points of view expressed are those of the author(s)
and do not necessarily reflect the official position or policies of the U.S. Department of Justice.
NIJ Award # 2010-DN-BX-K213 73
REFERENCES
1. SWGSTAIN, Recommended Terminology. Forensic Science Communications, 2009. 11(2). 2. Scientific Working Group on Bloodstain Pattern Analysis (SWGSTAIN), Guidelines for the
Validation of New Procedures in Bloodstain Pattern Analysis. http://www.swgstain.org/. 3. Gardner, R.M., Defining a Methodology for Bloodstain Pattern Analysis. Journal of
Forensic Identification, 2006. 56(4): p. 549-557. 4. Saviano, J., Articulating a Concise Scientific Methodology for Bloodstain Pattern Analysis.
Journal of Forensic Identification, 2005. 55(4): p. 461-470. 5. De Forest, R., R.E. Gaensslen, and H.C. Lee, Forensic Science: An Introduction to
Criminalistics. McGraw-Hill Series in Criminology & Criminal Justice. 1983, USA: McGraw-Hill Companies. 512.
6. Gestring, B., I. Ristenbatt, R, P. Buffolino, and R. Shaler, An Assessment of Trigonometric Methods for Calculation of Angle of Incidence for Blood Droplets and Bullets, in 51st annual meeting of the American Academy of Forensic Sciences. 1999: Orlando, FL.
7. Laturnus, P., Measurement Survey. International Association of Bloodstain Pattern Analysts News, 1994. 10(3): p. 14-32.
8. Carter, A.L., The Directional Analysis of Bloodstain Patterns: Theory and Experimental Validation. Journal of the Canadian Society of Forensic Science, 2001. 34(4): p. 173-189.
9. Carter, A.L., Further Validation of the BackTrack TM Computer Program for Bloodstain Pattern Analysis - Precision and Accuracy. International Association of Bloodstain Pattern Analysts News, 2005. 21(3): p. 15-22.
10. Carter, A.L., J. Forsythe-Erman, V. Hawkes, M. Illes, P. Laturnus, G. Lefebvre, C. Stewart, and B. Yamashita, Validation of the BackTrackTM Suite of Programs for Bloodstain Pattern Analysis. Journal of Forensic Identification, 2006. 56(2): p. 242-254.
11. Daubert et al. v Merrell Dow Pharmaceuticals Inc. 1993, United States Supreme Court. 12. Meneses, B.N., P.E. Kish, and B.J. Gestring, A Preliminary Study of the Error Rate
Associated with Bloodstain Pattern Analysis, in 61st Annual Meeting of the American Academy of Forensic Sciences. 2009: Denver, CO.
13. James, S.H., P.E. Kish, and T.P. Sutton, Principles of Bloodstain Pattern Analysis: Theory and Practice. 1st ed. 2005, Boca Raton, Fla: CRC Press. 532.
14. Bevel, T. and R.M. Gardner, Bloodstain Pattern Analysis: With an Introduction to Crime Scene Reconstruction 3rd Ed. Third ed. 2008, Boca Raton: CRC Press. 440.
15. White, B., Bloodstain Patterns on Fabrics: The Effect of Drop Volume, Dropping Height and Impact Angle. Journal of the Canadian Society of Forensic Science, 1986. 19(1): p. 3-36.
16. Slemko, J.A., Bloodstains on Fabric: The Effects of Droplet Velocity and Fabric Composition. International Association of Bloodstain Pattern Analysts News, 2003. 19(4): p. 3-11.
17. Balthazard, V., R. Piedlievre, H. Desoille, and L. DeRobert, Etude des gouttes de sang projete (Study of projected drops of blood), in Annual Medecine Legale Criminol Police Science Toxicology. 1939, 22nd Congress of Forensic Medicine: Paris, France. p. 265-323.
This document is a research report submitted to the U.S. Department of Justice. This report has not been published by the Department. Opinions or points of view expressed are those of the author(s)
and do not necessarily reflect the official position or policies of the U.S. Department of Justice.
NIJ Award # 2010-DN-BX-K213 74
18. Karger, B., S.P. Rand, and B. Brinkmann, Experimental Bloodstains on Fabric from Contact and from Droplets. International Journal of Legal Medicine, 1998. 111(1): p. 17-21.
19. Messler, H., Untersuchungen über den Einfluß textiler Spurenträger auf die Blutspur, in Faculty of Forensic Medicine. 1980, Köln University.
20. Madea, B., W. Sander, B. Brinkmann, and S. Rand, Morphologische Blutspurenanalyse Am Histologischen Schnitt. Beitrage zur Gerichtlichen Medizin, 1986. 44: p. 81-85.
21. Messler, H., G. Berghaus, and G. Dotzauer, Der Einfluß textiltechnischer Größen eines Spurenträgers auf das Erscheinungsbild einer Blutspur. Kriminalistik und forensische Wissenschaften, 1981. 44: p. 125-137.
22. Brinkmann, B., Madea, B., Rand, S., Charakterisierung von Mikroblutspuren (Charactistics of micro-bloodstains). Zeitschrift fur Rechtsmedizin, 1985. 94(3): p. 237-244.
23. van Stratton, M.J. and T.J. Griffin, Examination of Bloodstained Clothing, in Rocky Mountain Association of Bloodstain Pattern Analysts. 2002.
24. Raymond, T., Crime Scene Reconstruction from Bloodstains. Australian Journal of Forensic Sciences, 1997. 29(2): p. 69-78.
25. Rosenthal, R. and D.B. Rubin, Interpersonal expectancy effects: the first 345 studies. Behavioral and Brain Sciences, 1978. 3: p. 377-386.
26. Myers, A. and C.H. Hansen, Experimental Psychology. 4th ed. 1997, California: Brooks/Cole.
27. Dror, I.E., D. Charlton, and A.E. Péron, Contextual information renders experts vulnerable to making erroneous identifications. Forensic Science International, 2006. 156: p. 74-78.
28. Dror, I.E. and D. Charlton, Why experts make errors. Journal of Forensic Identification, 2006. 56: p. 600-616.
29. Dror, I.E., A.E. Péron, S.-L. Hind, and D. Charlton, When emotions get the better of us: The effect of contextual top-down processing on matching fingerprints. Applied Cognitive Psychology, 2005. 19: p. 799-809.
30. Osborne, N. and R. Zajac, An imperfect match? Emotional context influences fingerprint decisions. Applied Cognitive Psychology, under review.
31. Kish, P.E., T.P. Sutton, and S.H. James, Principles of Bloodstain Pattern Analysis: Theory and Practice 3ed. 2005, Boca Raton: CRC Press. 576.
32. Hurley, N.M. and J.O. Pex, Sequencing of Bloody Shoe Impressions by Blood Spatter and Blood Droplet Drying Times. International Association of Bloodstain Pattern Analysts News, 1990. 6(4): p. 1-8.
This document is a research report submitted to the U.S. Department of Justice. This report has not been published by the Department. Opinions or points of view expressed are those of the author(s)
and do not necessarily reflect the official position or policies of the U.S. Department of Justice.
NIJ Award # 2010-DN-BX-K213 75
DISSEMINATION OF RESEARCH FINDINGS
Conference Presentation:
N. Osborne, Taylor, M C, Kish, P E , Laber, T L, Owens, G, Reliability Measures for Current
Methods in Bloodstain Pattern Analysis, IABPA Training Conference, San Diego, 1 – 4 October,
2013
Published Paper:
Terry L. Laber, Michael C. Taylor, Paul E. Kish, The Reliability of Current Methods of Sequencing
Bloodstain Patterns, Journal of Bloodstain Pattern Analysis (2014), 30(1): 3 – 10.
This document is a research report submitted to the U.S. Department of Justice. This report has not been published by the Department. Opinions or points of view expressed are those of the author(s)
and do not necessarily reflect the official position or policies of the U.S. Department of Justice.
NIJ Award # 2010-DN-BX-K213 76
APPENDIX 1 PARTICIPANT GENERAL INSTRUCTIONS
Phase 1:
Enclosed are 15 or 16 ‘Classification Samples’ for you to inspect. Each of these samples has one pattern on it. The samples are wooden squares of three different types, chipboard, wallpaper and a plain painted surface.
All patterns were made on vertical targets and each target has a unique number. Each target has your analyst number on it. The location of the target label indicates the top of the target. If the target label becomes detached the target number can be found written on the back of the target.
Targets were prepared with human blood and should be treated with standard laboratory safety procedures. Each target has been coated with a clear lacquer to prevent deterioration and assist with biohazard safety. If there is a black cross marked on any stain this stain is an artefact and should not be considered.
Phase 2:
Enclosed are 12 ‘Classification Samples’ for you to inspect. Each of these samples has one pattern on it. The samples are pairs of trousers of three different types: denim jeans, polyester dress pants and cotton sweatpants. Each pair has a unique number. Each pair has your analyst number on it. Targets were prepared with human blood and should be treated with standard laboratory safety procedures. This is an assessment of pattern recognition methods only so no additional chemical tests are required. All red-brown stains on the trousers should be assumed to be blood.
Phases 1 & 2:
In the survey you will be presented with a set of pattern types and two questions.
(1) You will first be asked to choose the pattern type that best represents the pattern in the sample. This is to give the investigators an early indication of what pattern you think is present. You must choose only one pattern type in this question or indicate that you cannot select one best pattern type.
(2) You will then be asked to choose those pattern type(s) that you consider could account for the stains on the sample target. This is to show what you would include in a court report. To answer this question, you may choose one pattern type, in which case your answer should be the same as for part (1), or more than one type.
Each sample has a scenario with it because we recognize that bloodstain pattern classification is usually done with the benefit of additional contextual information. We have done our best to create realistic scenarios, indeed many are based on real cases. There may be some for which you feel there should be more information, but we would ask that you consider these on the basis of what is provided and treat them with the same care you would a answer you would give in court. The SWGSTAIN BPA terminology list is included with this letter. We would ask that you use terms according to the definitions in this list.
Phase 1:
This document is a research report submitted to the U.S. Department of Justice. This report has not been published by the Department. Opinions or points of view expressed are those of the author(s)
and do not necessarily reflect the official position or policies of the U.S. Department of Justice.

NIJ Award # 2010-DN-BX-K213 77
In addition we have sent you 3 or 4 ‘Sequencing samples’ that have two patterns on them, namely a transfer pattern and a spatter pattern. We would like you to determine the sequence of application of these two patterns. There are no scenarios for these samples. Your answer should be what you would be prepared to testify to in court.
…
Finally if you have any questions about the survey these can be addressed to …
This document is a research report submitted to the U.S. Department of Justice. This report has not been published by the Department. Opinions or points of view expressed are those of the author(s)
and do not necessarily reflect the official position or policies of the U.S. Department of Justice.