Embed Size (px)
Citation preview

Reliability Testing and Data Analysis of an 1657CCGA (Ceramic Column Grid Array) Package with Lead-Free Solder Paste on Lead-Free PCBs (Printed Circuit Boards)
IEEE ECTC June 4, 2004, Las Vegas, Nevada

Study Objectives• To perform temperature cycling test and statistical analysis of
an 1657CCGA package on PCBs with HASL(Hot-Air Solder Leveling)-SnCu, NiAu (Electroless Ni and Immersion Au), and OSP (Organic Solderability Preservative) finishes.
• For a given confidence level, determine the population mean, true characteristic life, and true Weibull slope of the 1657CCGA solder joints.
• To determine the confidence for comparing the quality (mean life) of the 1657CCGA solder joints on PCBs with different surface finishes.
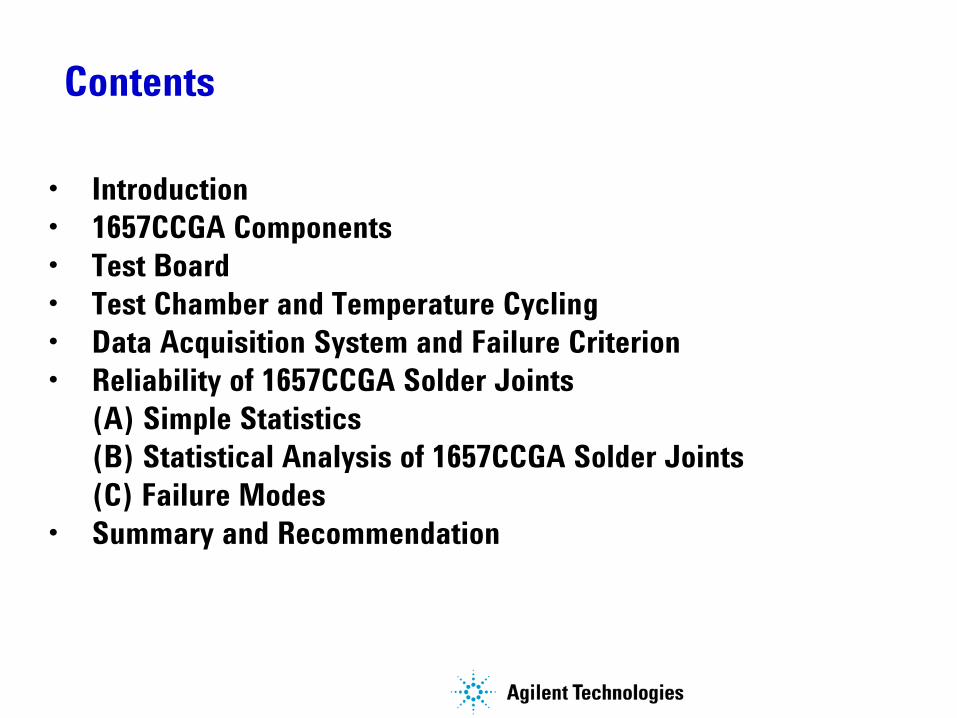
Contents
• Introduction• 1657CCGA Components• Test Board• Test Chamber and Temperature Cycling• Data Acquisition System and Failure Criterion• Reliability of 1657CCGA Solder Joints
(A) Simple Statistics(B) Statistical Analysis of 1657CCGA Solder Joints(C) Failure Modes
• Summary and Recommendation
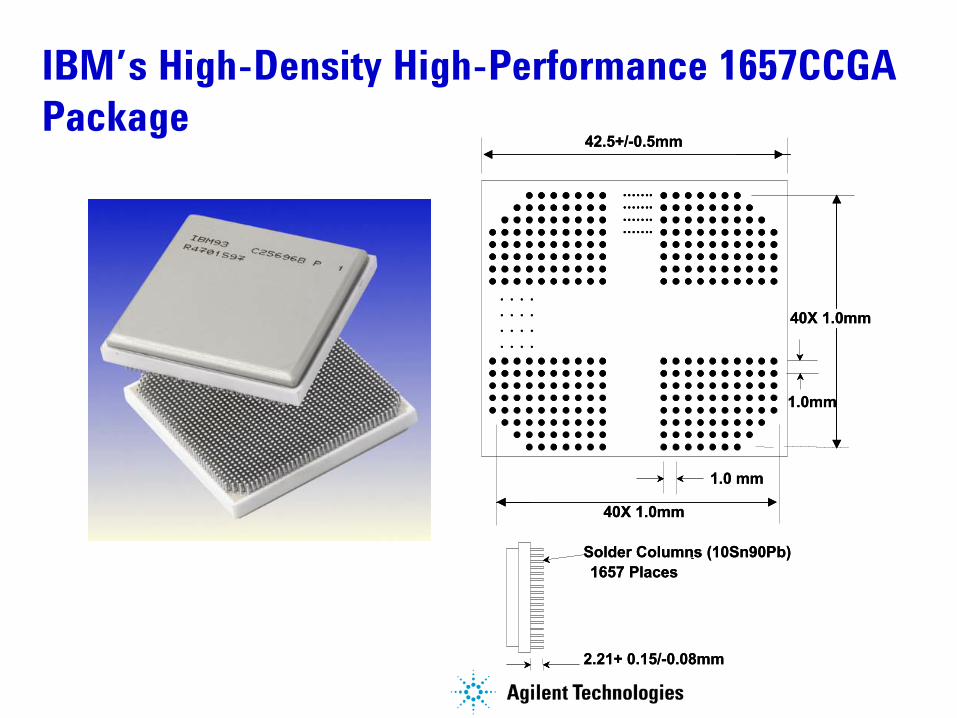
…….…….…….…….
. . . .
. . . .
. . . .
. . . .
40X 1.0mm
1.0 mm
1.0mm
40X 1.0mm
2.21+ 0.15/-0.08mm
Solder Columns (10Sn90Pb)-1657 Places
42.5+/-0.5mm
…….…….…….…….
…….…….…….…….
. . . .
. . . .
. . . .
. . . .
40X 1.0mm
1.0 mm
1.0mm
40X 1.0mm
2.21+ 0.15/-0.08mm
Solder Columns (10Sn90Pb)-1657 Places
42.5+/-0.5mm
IBM’s High-Density High-Performance 1657CCGA Package

Test Board with 1657-Pin Ceramic Column Grid Array (CCGA) Packages
CCGASolder Pastes:
Sn37Pb
Sn3.9Ag0.6Cu
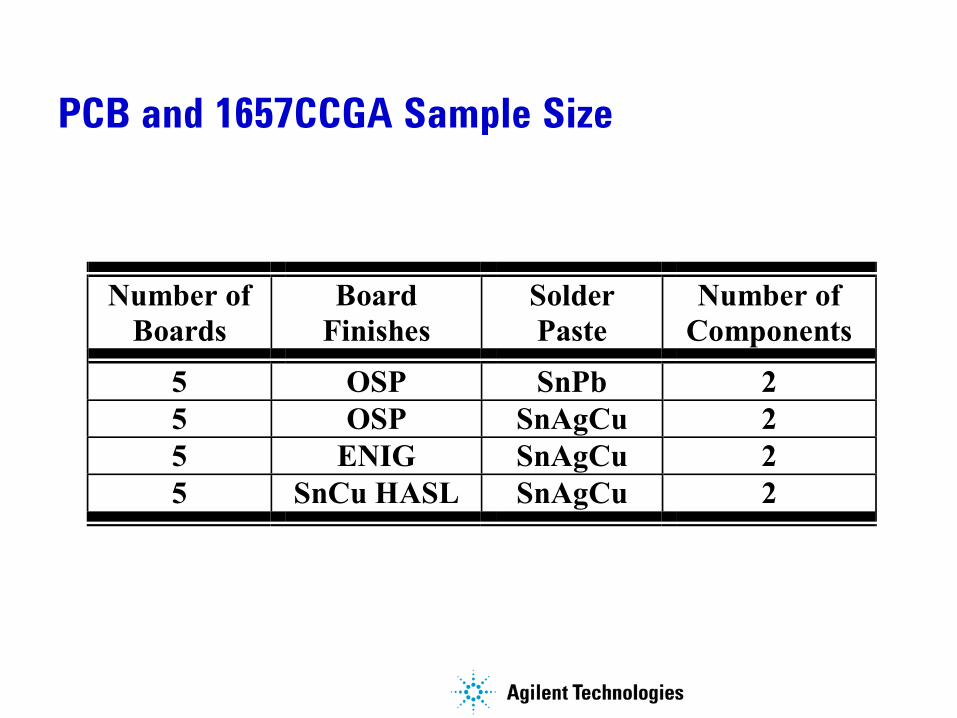
Table 1 PCB and package sample size details
Number of Boards
Board Finishes
Solder Paste
Number of Components
5 OSP SnPb 2 5 OSP SnAgCu 2 5 ENIG SnAgCu 2 5 SnCu HASL SnAgCu 2
PCB and 1657CCGA Sample Size

5 (Air)1 42
3
DOOR5 (Air)
1 42
3
DOOR-20
0
20
40
60
80
100
120
140
1 15 29 43 57 71 85 99 113
127
141
155
169
183
197
TC 5
-20
0
20
40
60
80
100
120
1 14 27 40 53 66 79 92 105
118
131
144
157
170
183
196
TC 1
-20
0
20
40
60
80
100
120
1 14 27 40 53 66 79 92 105
118
131
144
157
170
183
196
TC 2
-20
0
20
40
60
80
100
120
1 14 27 40 53 66 79 92 105
118
131
144
157
170
183
196
TC 3
-20
0
20
40
60
80
100
120
1 15 29 43 57 71 85 99 113
127
141
155
169
183
197
TC 4
Test Boards in Thermal Cycling Chamber (top-view) and Thermal Couples’ Locations
In Air
On Board Location 2 Location 4
Location 3

Table 2 1657CCGA thermal cycling test results (0 to 100oC, 40 min.) Solder Paste
SnCu HASL PCB
ENIG (NiAu) PCB
OSP (Entek) PCB
1771 2423 2128 1945 2521 2480 2111 2568 2620 2276 2682 2722 2394 3009 2826 2581 3513 2899 2611 2972 2652 3045 2688 3118
SnAgCu
3009 3200
2303 3451 3537 3555
NA NA 3684 3694 3851 4404 4507
SnPb
4595
1657CCGA Test Results (0 to 100oC, 40 min.)

The reliability of solder joints of a particular package on a PCB is defined as the probability that the solder joints will perform their intended function for a specified period of time, under a given operating condition, without failure.
Numerically, reliability is the percent of survivors,
R(t)=1 – F(t)
R(t) is the reliability (survival) function F(t) is the cumulative distribution function (CDF), representing the percentage of failures.
Reliability

Order Statistics (Ranking)
Gzzj
jnnn
zznnznzz
jnj
nnn
=−−
+−⋅⋅⋅−−
⋅⋅⋅−−−
−−−−−
+−−
−−
11
221
)1()!1(
)1()1(
)1(!2
)1()1()1(1
j = the failure order numbern = number of samplesG = required rankingz = the percent rank of the jth value in n
Median rank ~ (j - 0.3)/(n + 0.4)

1000.00 4000.00
0.50
1.00
5.00
10.00
50.00
90.00
99.90
0.10
Cycle-to-Failure
Perc
ent F
aile
d
AgilentJohn Lau
β1=6.7507, η1=2567.2951, ρ=0.9895β2=10.0634, η2=2785.5916, ρ=0.9756β3=5.2681, η3=2258.5570, ρ=0.9819
90% Confidence Intervals
1000.00 4000.00
0.50
1.00
5.00
10.00
50.00
90.00
99.90
0.10
Cycle-to-Failure
Perc
ent F
aile
d
AgilentJohn Lau
β1=6.7507, η1=2567.2951, ρ=0.9895β2=10.0634, η2=2785.5916, ρ=0.9756β3=5.2681, η3=2258.5570, ρ=0.9819
90% Confidence Intervals
1657CCGA with SnAgCu Paste on HASL-SnCu PCB (90% Confidence)
5% Rank
95% Rank

SnAgCu pasteon HASL PCB
SnAgCu pasteon NiAu PCB
SnAgCu pasteon OSP PCB
SnPb pasteon OSP PCB
Sample 2397 3179 2793 3760
MeanLife (µ),
cycle
Percent failedat mean
46.72 47.61 45.75 47.66
Population µ at90% confidence
2069≤µ≤2552 2655≤µ≤3497 2492≤µ≤3017 3107≤µ≤4267
Character-istic Life (θ),
Sample 2567 3447 2950 4082
cycle True θ (cycle) at90% confidence
2259≤µ≤2786 2984≤µ≤3673 2677≤µ≤3127 3461≤µ≤4500
Sample 6.75 5.39 8.99 5.29
WeibullSlope (β)
β error (%) at90% confidence
37 47 37 37
True β at90% confidence
4.25≤β≤9.25 2.86≤β≤7.92 5.66≤β≤12.32 3.33≤β≤7.25
Mean Life, Characteristic Life, and Weibull Slope of the 1657CCGA Solder Columns with SnAgCu and SnPb Solder Pastes on Various PCBs (90% Confidence Intervals)

1000.00 5000.00
0.50
1.00
5.00
10.00
50.00
90.00
0.10 Cycle-to-Failure
Perc
ent F
aile
d
AgilentJohn Lau
β1=5.3884, η1=3447.4178, ρ=0.8391β2=8.8795, η2=3672.6538, ρ=0.7896β3=3.7353, η3=2983.9305, ρ=0.8774
90% Confidence intervals
1000.00 5000.00
0.50
1.00
5.00
10.00
50.00
90.00
0.10 Cycle-to-Failure
Perc
ent F
aile
d
AgilentJohn Lau
β1=5.3884, η1=3447.4178, ρ=0.8391β2=8.8795, η2=3672.6538, ρ=0.7896β3=3.7353, η3=2983.9305, ρ=0.8774
90% Confidence intervals
1657CCGA with SnAgCu Paste on NiAu PCB (90% Confidence)
95% Rank
5% Rank

1000.00 4000.00
0.50
1.00
5.00
10.00
50.00
90.00
99.90
0.10
Cycle-to-Failure
Perc
ent F
aile
d
AgilentJohn Lau
β1=8.9868, η1=2949.6500, ρ=0.9898β2=13.7211, η2=3127.2752, ρ=0.9996
β3=6.8698, η3=2676.8694, ρ=0.9622
90% Confidence Intervals
1000.00 4000.00
0.50
1.00
5.00
10.00
50.00
90.00
99.90
0.10
Cycle-to-Failure
Perc
ent F
aile
d
AgilentJohn Lau
β1=8.9868, η1=2949.6500, ρ=0.9898β2=13.7211, η2=3127.2752, ρ=0.9996
β3=6.8698, η3=2676.8694, ρ=0.9622
90% Confidence Intervals
1657CCGA with SnAgCu Paste on OSP PCB (90% Confidence)
95% Rank
5% Rank

SnAgCu pasteon HASL PCB
SnAgCu pasteon NiAu PCB
SnAgCu pasteon OSP PCB
SnPb pasteon OSP PCB
Sample 2397 3179 2793 3760
MeanLife (µ),
cycle
Percent failedat mean
46.72 47.61 45.75 47.66
Population µ at90% confidence
2069≤µ≤2552 2655≤µ≤3497 2492≤µ≤3017 3107≤µ≤4267
Character-istic Life (θ),
Sample 2567 3447 2950 4082
cycle True θ (cycle) at90% confidence
2259≤µ≤2786 2984≤µ≤3673 2677≤µ≤3127 3461≤µ≤4500
Sample 6.75 5.39 8.99 5.29
WeibullSlope (β)
β error (%) at90% confidence
37 47 37 37
True β at90% confidence
4.25≤β≤9.25 2.86≤β≤7.92 5.66≤β≤12.32 3.33≤β≤7.25
Mean Life, Characteristic Life, and Weibull Slope of the 1657CCGA Solder Columns with SnAgCu and SnPb Solder Pastes on Various PCBs (90% Confidence Intervals)

Weibull Slope Error (E)
p = .2316419b1 = .31938153b2 = -.356563782b3 = 1.781477937b4 = -1.821255978b5 = 1.330274429|ε(x)| < 7.5x10⁻⁸
2)1(
21 2
2
2
CdteNE
t +=∫ ∞−
−
π
)())((121 5
54
43
32
21
22
2
xtbtbtbtbtbxZdteNE
t
επ
+++++−=∫ ∞−
−
2
2
21)(
x
exZ−
=π px
t+
=1
1
N = number of failures C = the required confidence level

1000.00 5000.001.00
5.00
10.00
50.00
90.00
99.00
Cycle-to-Failure
Perc
ent F
aile
d
AgilentJohn Lau
β1=6.7507, η1=2567.2951, ρ=0.9895β2=5.3884, η2=3447.4178, ρ=0.8391β3=8.9868, η3=2949.6500, ρ=0.9898
HASL
OSPNiAu
1000.00 5000.001.00
5.00
10.00
50.00
90.00
99.00
Cycle-to-Failure
Perc
ent F
aile
d
AgilentJohn Lau
β1=6.7507, η1=2567.2951, ρ=0.9895β2=5.3884, η2=3447.4178, ρ=0.8391β3=8.9868, η3=2949.6500, ρ=0.9898
HASL
OSPNiAu
1657CCGA with SnAgCu Paste on HASL, NiAu, and OSP PCBs (Median Rank)

Confidence Level (P) for Comparing the Quality (Mean Life) of Two Sets of Solder Joints
P
−+
=
11log1log1
17/405
12.605.41
11
+
+
−=t
q
[ ]12
11Ω+Ω
−+=
ρρTt )1)(1( 21 −−= rrT
1)/11()/21(
12
11 −
+Γ+Γ
=Ωββ
1)/11()/21(
22
22 −
+Γ+Γ
=Ωββ
1
2
µµ
ρ =
µ1 and µ2 are the sample mean lives, β1 and β2 are the sample Weibull slopes, r1 and r2 are the number of failures, respectively, of sample 1 and sample 2. T is called the total degrees of freedom.

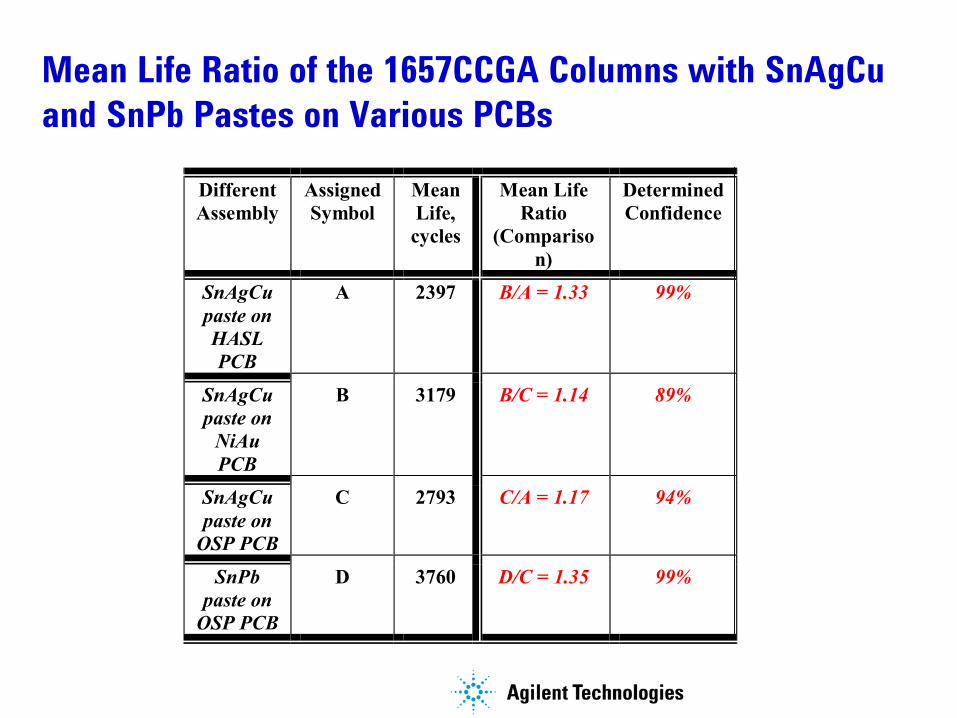
Different Assembly
Assigned Symbol
Mean Life,
cycles
Mean Life Ratio
(Comparison)
Determined Confidence
SnAgCu paste on HASL PCB
A 2397 B/A = 1.33 99%
SnAgCu paste on
NiAu PCB
B 3179 B/C = 1.14 89%
SnAgCu paste on
OSP PCB
C 2793 C/A = 1.17 94%
SnPb paste on
OSP PCB
D 3760 D/C = 1.35 99%
Mean Life Ratio of the 1657CCGA Columns with SnAgCu and SnPb Pastes on Various PCBs

1000.00 6000.00
0.50
1.00
5.00
10.00
50.00
90.00
99.90
0.10
Cycle-to-Failure
Perc
ent F
aile
d
AgilentJohn Lau
β1=5.2918, η1=4082.0640, ρ=0.9359β2=8.1566, η2=4499.8153, ρ=0.9542β3=4.0308, η3=3461.0468, ρ=0.9065
90% Confidence Intervals
1000.00 6000.00
0.50
1.00
5.00
10.00
50.00
90.00
99.90
0.10
Cycle-to-Failure
Perc
ent F
aile
d
AgilentJohn Lau
β1=5.2918, η1=4082.0640, ρ=0.9359β2=8.1566, η2=4499.8153, ρ=0.9542β3=4.0308, η3=3461.0468, ρ=0.9065
90% Confidence Intervals
1657CCGA with SnPb Paste on OSP PCB (90%Confidence)
5% Rank
95% Rank

1000.00 10000.001.00
5.00
10.00
50.00
90.00
99.00
Cycle-to-Failure
Perc
ent F
aile
d
AgilentJohn Lau
β1=5.2918, η1=4082.0640, ρ=0.9359
β2=8.9868, η2=2949.6500, ρ=0.9898
SnAaste
SnPb aste
SnPb
SnAgCu
1000.00 10000.001.00
5.00
10.00
50.00
90.00
99.00
Cycle-to-Failure
Perc
ent F
aile
d
AgilentJohn Lau
β1=5.2918, η1=4082.0640, ρ=0.9359
β2=8.9868, η2=2949.6500, ρ=0.9898
SnAaste
SnPb aste
SnPb
SnAgCu
1657CCGA with SnAgCu and SnPb Pastes on OSP PCB (Median Rank)
Different Assembly
Assigned Symbol
Mean Life,
cycles
Mean Life Ratio
(Comparison)
Determined Confidence
SnAgCu paste on HASL PCB
A 2397 B/A = 1.33 99%
SnAgCu paste on
NiAu PCB
B 3179 B/C = 1.14 89%
SnAgCu paste on
OSP PCB
C 2793 C/A = 1.17 94%
SnPb paste on
OSP PCB
D 3760 D/C = 1.35 99%
Mean Life Ratio of the 1657CCGA Columns with SnAgCu and SnPb Pastes on Various PCBs

Cross Section of the Failed Columns
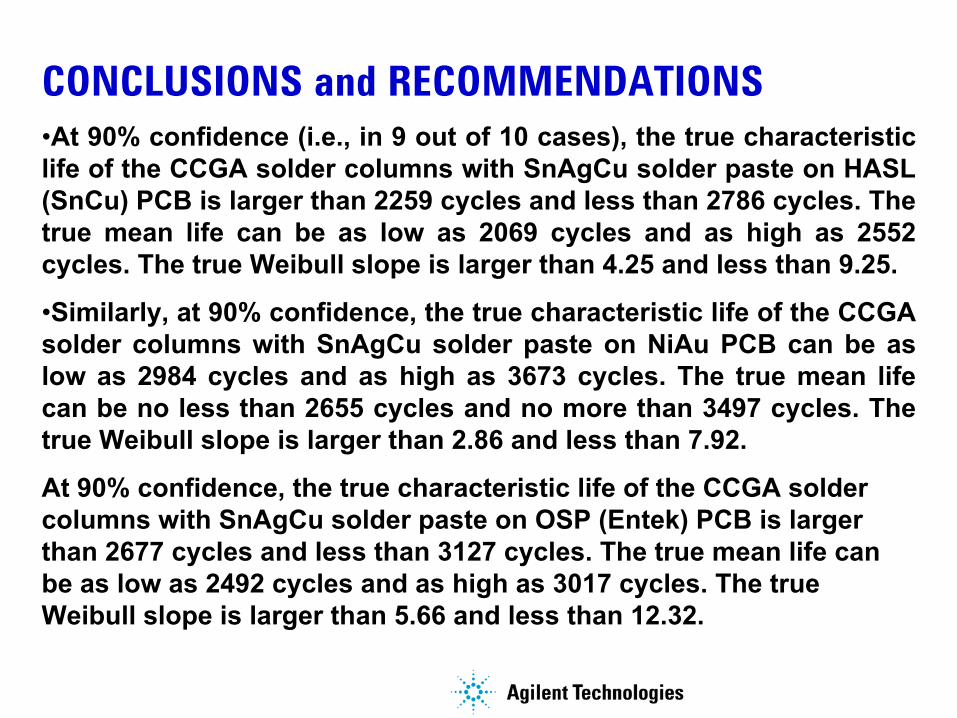
CONCLUSIONS and RECOMMENDATIONS•At 90% confidence (i.e., in 9 out of 10 cases), the true characteristic life of the CCGA solder columns with SnAgCu solder paste on HASL (SnCu) PCB is larger than 2259 cycles and less than 2786 cycles. The true mean life can be as low as 2069 cycles and as high as 2552 cycles. The true Weibull slope is larger than 4.25 and less than 9.25.
•Similarly, at 90% confidence, the true characteristic life of the CCGA solder columns with SnAgCu solder paste on NiAu PCB can be as low as 2984 cycles and as high as 3673 cycles. The true mean life can be no less than 2655 cycles and no more than 3497 cycles. The true Weibull slope is larger than 2.86 and less than 7.92.
At 90% confidence, the true characteristic life of the CCGA solder columns with SnAgCu solder paste on OSP (Entek) PCB is larger than 2677 cycles and less than 3127 cycles. The true mean life can be as low as 2492 cycles and as high as 3017 cycles. The trueWeibull slope is larger than 5.66 and less than 12.32.

CONCLUSIONS and RECOMMENDATIONS•At 90% confidence, the true characteristic life of the CCGA solder columns with SnPb solder paste on OSP (Entek) PCB is larger than 3461 cycles and less than 4500 cycles. The true mean life can be as low as 3107 cycles and as high as 4267 cycles. The true Weibull slope is larger than 3.33 and less than 7.25.
•The quality (mean life) of the CCGA solder columns (with SnAgCusolder paste) on the NiAu PCB is better than that on the OSP with 89% confidence and that on the SnCu HASL with 99% confidence.
•In 94 out of 100 cases, the quality of the CCGA solder columns (withSnAgCu solder paste) on the OSP PCB is better than that on the SnCuHASL PCB.
•The quality of the CCGA solder columns with SnPb solder paste on OSP PCB is better than those with SnAgCu solder paste. This agreed very well with finite element simulation results reported elsewhere.
•More thermal cycling tests and finite element simulations should be done on lead-free assemblies with different dwell times.