Embed Size (px)
Citation preview
Remarkable photocytotoxicity of curcumin in HeLa cells in visible
light and arresting its degradation on oxovanadium(IV) complex
formation†
Samya Banerjee, a
Puja Prasad, a Akhtar Hussain, ,
a Imran Khan,
b Paturu Kondaiah,*
b
and Akhil R. Chakravarty*a
a Department of Inorganic and Physical Chemistry, Indian Institute of Science and
b Department
of Molecular Reproduction, Development and Genetics, Indian Institute of Science, Bangalore
560012, India. E-mail: [email protected]
Electronic Supplementary Information (ESI)
Electronic Supplementary Material (ESI) for Chemical CommunicationsThis journal is © The Royal Society of Chemistry 2012
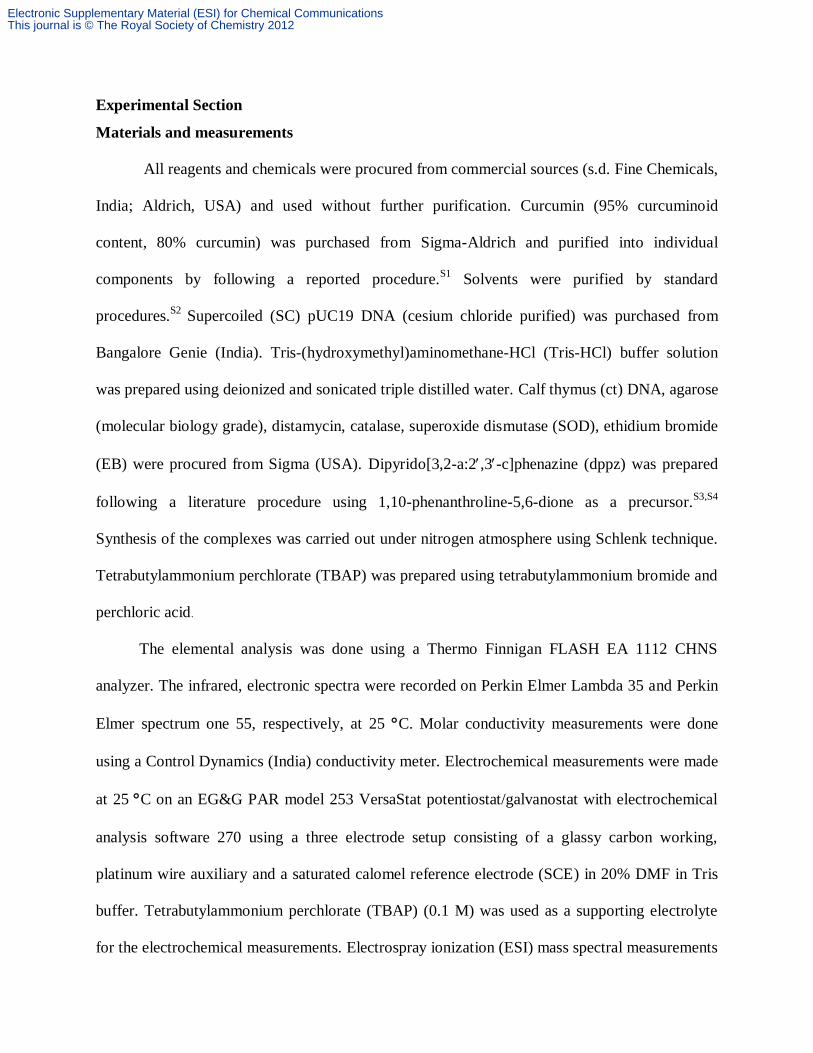
Experimental Section
Materials and measurements
All reagents and chemicals were procured from commercial sources (s.d. Fine Chemicals,
India; Aldrich, USA) and used without further purification. Curcumin (95% curcuminoid
content, 80% curcumin) was purchased from Sigma-Aldrich and purified into individual
components by following a reported procedure.S1
Solvents were purified by standard
procedures.S2
Supercoiled (SC) pUC19 DNA (cesium chloride purified) was purchased from
Bangalore Genie (India). Tris-(hydroxymethyl)aminomethane-HCl (Tris-HCl) buffer solution
was prepared using deionized and sonicated triple distilled water. Calf thymus (ct) DNA, agarose
(molecular biology grade), distamycin, catalase, superoxide dismutase (SOD), ethidium bromide
(EB) were procured from Sigma (USA). Dipyrido[3,2-a:2,3-c]phenazine (dppz) was prepared
following a literature procedure using 1,10-phenanthroline-5,6-dione as a precursor.S3,S4
Synthesis of the complexes was carried out under nitrogen atmosphere using Schlenk technique.
Tetrabutylammonium perchlorate (TBAP) was prepared using tetrabutylammonium bromide and
perchloric acid.
The elemental analysis was done using a Thermo Finnigan FLASH EA 1112 CHNS
analyzer. The infrared, electronic spectra were recorded on Perkin Elmer Lambda 35 and Perkin
Elmer spectrum one 55, respectively, at 25 C. Molar conductivity measurements were done
using a Control Dynamics (India) conductivity meter. Electrochemical measurements were made
at 25 C on an EG&G PAR model 253 VersaStat potentiostat/galvanostat with electrochemical
analysis software 270 using a three electrode setup consisting of a glassy carbon working,
platinum wire auxiliary and a saturated calomel reference electrode (SCE) in 20% DMF in Tris
buffer. Tetrabutylammonium perchlorate (TBAP) (0.1 M) was used as a supporting electrolyte
for the electrochemical measurements. Electrospray ionization (ESI) mass spectral measurements
Electronic Supplementary Material (ESI) for Chemical CommunicationsThis journal is © The Royal Society of Chemistry 2012
were made using Bruker Daltonics make Esquire 300 Plus ESI model. The NMR spectra were
recorded using Bruker Avance 400 (400 MHz) NMR spectrometer. Room temperature magnetic
moment of the DMSO-d6 solutions of the oxovanadium(IV) complexes containing 1% TMS
(v/v) as the internal reference was obtained by a solution NMR method with a Bruker AMX-400
NMR spectrometer.S5
Fluorescence microscopic investigations were carried out on Leica DM IL
microscope with integrated Leica DFC400 camera and IL50 image software. Confocal
microscopy was done using confocal scanning electron microscope (Leica, TCS SP5 DM6000).
Flow cytometric analysis was performed using FACS Calibur (Becton Dickinson (BD) cell
analyzer) at FL2 channel (595 nm).
Preparation of [VO(cur)(phen)Cl] (1) and [VO(cur)(dppz)Cl] (2):
Vanadyl sulfate (0.16 g, 1.0 mmol) and barium chloride (0.25 g, 1.0 mmol) together were
dissolved in 15 ml of EtOH and 3 ml of water. The mixture was then stirred at room temperature
for 1.5 h under inert atmosphere of nitrogen using Schlenk technique. The mixture was filtered
using celite to remove white barium sulfate precipitate. The blue filtrate was deaerated and then
saturated with nitrogen. An ethanolic solution (3 ml) of the corresponding phenanthroline base
(0.19 g, phen; 0.28 g, dppz, (1.0 mmol)) was added to the filtrate. A deep greenish solution was
formed after stirring the mixture for 20 min. To this mixture was then added the deaerated
ethanol solution (25 ml) of curcumin (Hcur, 0.36 g, 1.0 mmol) previously neutralized with Et3N
(0.10 g, 1.0 mmol). The complex was precipitated out after stirring for 1 h. The precipitate was
then filtered, isolated and washed with ethanol, THF and chloroform and finally dried in vacuum
over P4O10 [Yield: ~87% (1) and ~74% (2)].
Electronic Supplementary Material (ESI) for Chemical CommunicationsThis journal is © The Royal Society of Chemistry 2012
Characterization data
Complex 1: Anal. Calcd for C33H27N2ClO7V: C, 60.98; H, 4.19; N, 4.31. Found: C,
60.79; H, 4.26; N, 4.21. ESI-MS in CH3CN: m/z 614.1257 [M-Cl]+. IR data/ cm
-1: 3064 w, 1590
s, 1491 vs, 1420 s, 1381 m, 1276 s, 1152 m, 1122 m, 1035 w, 966 m, 840 m, 720 m, 555 w, 460
w (vs, very strong; s, strong; m, medium; w, weak). UV-visible in 10% DMF [max/nm (/ dm3
mol-1
cm-1
)]: 721 (54), 453 sh (33000), 434 (35600), 265 (30400). M = 104 S m2 M
-1 in 10%
aqueous DMF at 25 ºC. µeff, µB at 298 K: 1.67.
Complex 2: Anal. Calcd for C39H29N4ClO7V: C, 62.28; H, 3.89; N, 7.45. Found: C,
62.41; H, 3.77; N, 7.42. ESI-MS in CH3CN: m/z 716.49 [M-Cl]+, IR data/ cm
-1: 3070 w, 1587 s,
1490 vs, 1422 s, 1377 m, 1279 s, 1154 m, 1117 m, 1031 w, 968 m, 810 m, 723 m, 558 w, 463 w,
435 m. UV-visible in 10% DMF [max/nm (/ dm3 mol
-1 cm
-1)]: 731 (64), 454 sh (38600), 434
(43900), 382 (25600), 361 (20300), 268 (46600). M = 96 S m2 M
-1 in 10% aqueous DMF at 25
ºC. µeff, µB at 298 K: 1.61.
Solubility and stability
The complexes showed good solubility in DMF and DMSO and moderate solubility in
water, methanol, ethanol and acetonitrile. They had poor solubility in hydrocarbons. The
complexes were found to be stable in the monocationic form due to dissociation of the chloride
and the solution stability of the cationic species was ascertained from the ESI-MS and the molar
conductivity data.
X-ray crystallographic procedures
The crystal structure of complex 1 was obtained by single crystal X-ray diffraction
method. Crystals were obtained from slow evaporation of an acetonitrile solution of the complex.
Electronic Supplementary Material (ESI) for Chemical CommunicationsThis journal is © The Royal Society of Chemistry 2012
Crystal mounting was done on glass fibre with epoxy cement. All geometric and intensity data
were collected at low temperature using an automated Bruker SMART APEX CCD
diffractometer equipped with a fine focus 1.75 kW sealed tube Mo-K X-ray source ( = 0.71073
Å) with increasing (width of 0.3 per frame) at a scan speed of 5 sec per frame. Intensity data,
collected using -2 scan mode, were corrected for Lorentz–polarization effects and for
absorption.S6
The structure was solved and refined using SHELXL97S7
present in the WinGx suit
of programs (Version 1.63.04a).S8
All non-hydrogen positions were initially located in the
difference Fourier maps, and for the final refinement, the hydrogen atoms were placed in
geometrically ideal positions and refined in the riding mode. Final refinement included atomic
positions for all the atoms, anisotropic thermal parameters for all the non-hydrogen atoms and
isotropic thermal parameters for all the hydrogen atoms. The electron density contributions from
the highly disordered solvent molecules were removed using the SQUEEZE routine
(PLATON).S9
EADP restraint was used on the atoms C25 and C27 in order to avoid eccentric
thermal ellipsoids. Perspective view of the molecule was obtained by ORTEP.S10
Selected bond
distances and angles in the complex are provided in Table S1.
Cell cytotoxicity assay
The photocytotoxicity of the complexes 1, 2 and curcumin was studied using 3-(4,5-
dimethylthiazol-2-yl)-2,5-diphenyltetrazolium bromide (MTT) assay which is based on the
ability of mitochondrial dehydrogenases of viable cells to cleave the tetrazolium rings of MTT
forming dark purple membrane impermeable crystals of formazan that could be quantified from
spectral measurement in DMSO.S11
Approximately, 8000 cells of human cervical cancer HeLa
cells were plated in 96 wells culture plate in Dulbecco’s Modified Eagle Medium (DMEM)
containing 10% FBS and after 24 h of incubation at 37 °C in CO2 incubator. The stock solution
Electronic Supplementary Material (ESI) for Chemical CommunicationsThis journal is © The Royal Society of Chemistry 2012
of the complexes 1, 2 and curcumin that was prepared in DMSO was first diluted in culture
medium to the desired concentration and then added to the 96 well plates. The quantity of
DMSO was kept constant at 1% for all tests. Then cells were incubated for 4 h in dark. The
medium that was subsequently replaced with PBS was photo-irradiated with visible light (400-
700 nm) for 1 h using a Luzchem Photoreactor (Model LZC-1, Ontario, Canada) fitted with
Sylvania make 8 fluorescent white tubes with a fluence rate of 2.4 mW cm-2
to provide a total
dose of 10 J cm-2
. After photoexposure, PBS was removed and replaced with DMEM-FBS and
incubation was continued for further 20 h in dark. After the incubation period, 20 μL of 5 mg
mL-1
of MTT was added to each well and incubated for an additional 3 h. The culture medium
was finally discarded and 200 μL of DMSO was added to dissolve the formazan crystals and its
absorbance at 595 nm was measured using a BIORAD ELISA plate reader. Cytotoxicity of 1, 2
and curcumin was measured as the percentage ratio of the absorbance of the treated cells to the
untreated controls. The IC50 values were determined by nonlinear regression analysis (GraphPad
Prism).
DNA fragmentation analysis by agarose gel electrophoresis
DNA fragmentation analysis was conducted to confirm the apoptotic mechanism induced
by curcumin, 1 and 2 for cell death. Briefly 0.3x10⁶ cells were taken in each 60 mm dish. It was
grown for 24 h and later treated with 1 (15 μM), 2 (5 μM) and curcumin (10 μM) incubated for 4
h in dark. One dish containing the complex or curcumin was exposed to light for 1 h and again
the cells were left to grow for 4 h along with its dark control in another dish. After 4 h, cells were
trypsinized, washed with DPBS and re-suspended in 0.4 ml of lysis buffer (10 mM Tris-HCl; pH,
8.0, 20 mM EDTA, 0.2% triton-X 100) with an incubation of 20 min on ice. Lysed cells were
Electronic Supplementary Material (ESI) for Chemical CommunicationsThis journal is © The Royal Society of Chemistry 2012
centrifuged for 20 min at 13000 rpm and their supernatant (which had soluble chromosomal
DNAs including both high molecular weight DNA and nucleosomal DNA fragments) was
collected. Phenol chloroform was performed to remove the protein present. Later supernatant
was precipitated with 1/10 volume of 3M sodium acetate (pH, 5.8) and 2 volume of ethanol at
20 °C for overnight. DNA pellet was washed with 70% alcohol and re-suspended in Tris-EDTA
(pH 8) containing RNAse (100 µg/ml RNAse) followed by incubation at 37 °C for 2 hrs. DNA
samples were resolved on 1.5% agarose gel at 80 V for approximately 2 h and photographed
under UV light.
Confocal studies: uptake and localization
Uptake of fluorescent complexes 1, 2 and curcumin into the cell was visualized using a confocal
scanning electron microscope (Zeiss, LSM510 apocromat). HeLa cells were grown on glass
cover slips in each 12 well plates at a seeding density of 50,000 cells in 1.5 ml of culture medium
for 24 h. Cells were then treated with the complex for 2 h, and 4 h in dark. Cells were fixed and
permeabilized with chilled methanol for 5 min at -20 °C. Methanol was subsequently removed
followed by washing with 1X PBS. It was later incubated with propidium iodide (1 mg/ml) to
stain the nucleus for 2 min and visualized under a confocal scanning electron microscope.
DNA binding methods
Absorption titration
DNA binding experiments were done in Tris-HCl/NaCl buffer (5 mM Tris-HCl, 5 mM
NaCl, pH 7.2) using DMF solution of the complexes. Calf thymus (ct) DNA (ca. 350 M NP) in
this buffer medium gave a ratio of UV absorbance at 260 and 280 nm of ca. 1.9:1 indicating that
the DNA is apparently free from protein. The concentration of ct-DNA was estimated from its
absorption intensity at 260 nm with a known molar extinction coefficient value () of 6600 M-1
Electronic Supplementary Material (ESI) for Chemical CommunicationsThis journal is © The Royal Society of Chemistry 2012
cm-1
.S12
Absorption titration experiments were made by varying the concentration of the ct-DNA
while keeping the metal complex concentration constant. Due correction was made for the
absorbance of ct-DNA itself. Each spectrum was recorded after equilibration of the sample for 5
min. The intrinsic equilibrium binding constant (Kb) and the binding site size (s) of the
complexes to ct-DNA were obtained by McGhee-von Hippel (MvH) method using the
expression of Bard et al. by monitoring the change of the absorption intensity of the spectral
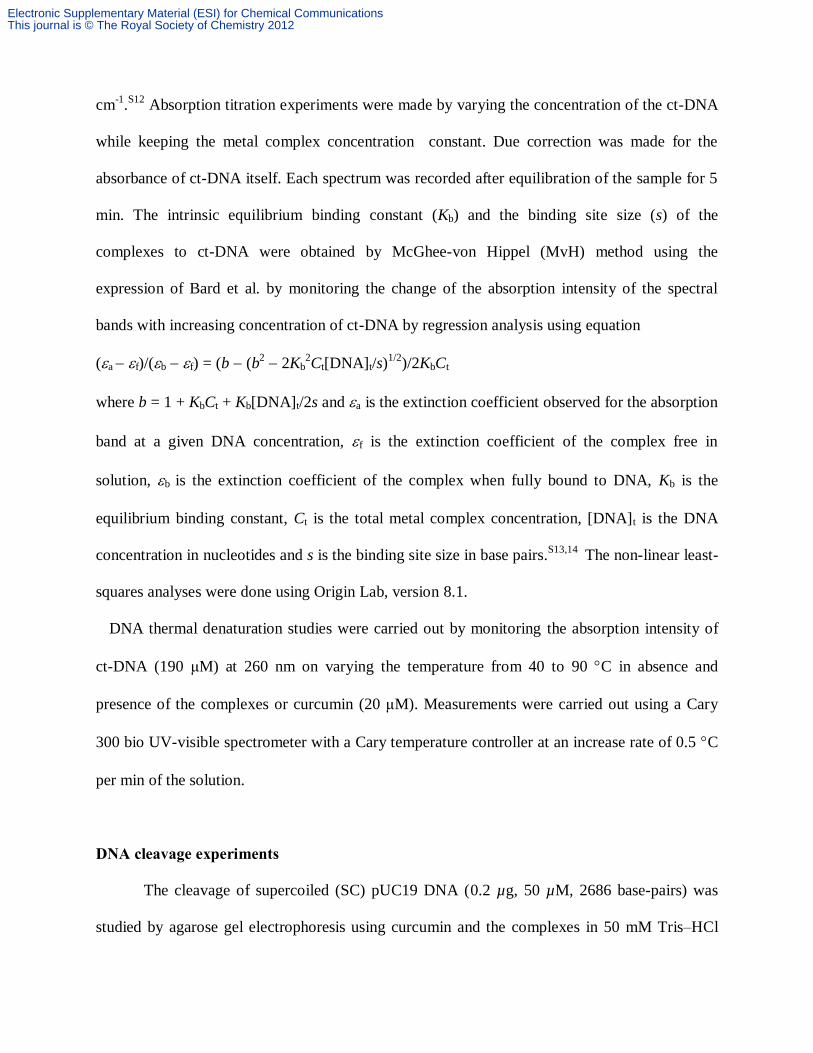
bands with increasing concentration of ct-DNA by regression analysis using equation
(a f)/(b f) = (b (b2 2Kb
2Ct[DNA]t/s)
1/2)/2KbCt
where b = 1 + KbCt + Kb[DNA]t/2s and a is the extinction coefficient observed for the absorption
band at a given DNA concentration, f is the extinction coefficient of the complex free in
solution, b is the extinction coefficient of the complex when fully bound to DNA, Kb is the
equilibrium binding constant, Ct is the total metal complex concentration, [DNA]t is the DNA
concentration in nucleotides and s is the binding site size in base pairs.S13,14
The non-linear least-
squares analyses were done using Origin Lab, version 8.1.
DNA thermal denaturation studies were carried out by monitoring the absorption intensity of
ct-DNA (190 μM) at 260 nm on varying the temperature from 40 to 90 C in absence and
presence of the complexes or curcumin (20 μM). Measurements were carried out using a Cary
300 bio UV-visible spectrometer with a Cary temperature controller at an increase rate of 0.5 C
per min of the solution.
DNA cleavage experiments
The cleavage of supercoiled (SC) pUC19 DNA (0.2 µg, 50 µM, 2686 base-pairs) was
studied by agarose gel electrophoresis using curcumin and the complexes in 50 mM Tris–HCl
Electronic Supplementary Material (ESI) for Chemical CommunicationsThis journal is © The Royal Society of Chemistry 2012
buffer (pH 7.2) and 50 mM NaCl containing 10% DMF. The photo-induced DNA cleavage
reactions were carried out under illuminated conditions using a diode laser of 785 nm
wavelength (Model: LQC785-100C from Newport Corporation with LD module, continuous-
wave (CW) circular beam). The laser power was 100 mW, measured using Spectra Physics CW
Laser Power Meter (Model 407A). Before light exposure, each sample was incubated for 1.0 h at
37 C and analyzed for the photo-cleaved products by gel electrophoresis method as described
earlier by us.S15
The mechanistic studies were carried out using different additives (NaN3, 0.5
mM; DMSO, 4 µL; KI, 0.5 mM; catalase, 4 units; SOD, 4 units). For the D2O experiment, this
solvent was used for dilution of the sample up to 20 µL final volume. The samples after
incubation in a dark chamber were added to the loading buffer containing 0.25% bromophenol
blue, 0.25% xylene cyanol, 30% glycerol (3 L) and the solution was finally loaded on 1%
agarose gel containing 1.0 g/mL ethidium bromide (EB). Electrophoresis was carried out in a
dark chamber for 2.0 h at 60 V in TAE (Tris-acetate EDTA) buffer. Bands were visualized by
UV light and photographed. The extent of DNA cleavage was measured from the intensities of
the bands using UVITEC Gel Documentation System. Due corrections were made for the low
level of nicked circular (NC) form present in the original supercoiled (SC) DNA sample and for
the low affinity of EB binding to SC compared to NC and linear forms of DNA.S16
The
concentrations of the complexes and additives corresponded to that in the 20 L final volume of
the sample using Tris buffer. The observed error in measuring the band intensities was ~5%.
References
(S1) O. Vajragupta, P. Boonchoong and L. Berliner, J. Free Rad. Res., 2004, 38, 303-314.
Electronic Supplementary Material (ESI) for Chemical CommunicationsThis journal is © The Royal Society of Chemistry 2012
(S2) D. D. Perrin, W. L. F. Armarego and D. R. Perrin, Purification of Laboratory Chemicals;
Pergamon Press: Oxford, 1980.
(S3) J. G. Collins, A. D. Sleeman, J. R. Aldrich-Wright, I. Greguric and T. W. Hambley, Inorg.
Chem., 1998, 37, 3133-3141.
(S4) E. Amouyal, A. Homsi, J.-C. Chambron and J.-P. Sauvage, J. Chem. Soc. Dalton Trans.,
1990, 1841-1845.
(S5) (a) D. F. Evans, J. Chem. Soc. 1959, 2003-2005. (b) D. F. Evans and T. A. James, J. Chem.
Soc. Dalton Trans. 1979, 723-726.
(S6) N. Walker and D. Stuart, Acta Crystallogr., 1983, A39, 158-166.
(S7) G. M. Sheldrick, SHELX-97, Programs for Crystal Structure Solution and Refinement;
University of Göttingen, Göttingen, Germany, 1997.
(S8) J. L. Farrugia, J. Appl. Crystallogr., 1999, 32, 837-838.
(S9) A. L. Spek, PLATON. A Multipurpose Crystallographic Tool, Utrecht University, the
Netherlands, 2002.
(S10) C. K. Johnson, ORTEP, Report ORNL-5138; Oak Ridge National Laboratory: Oak Ridge,
TN, 1976.
(S11) T. Mosmann, J. Immunol. Methods., 1983, 65, 55-63.
(S12) (a) S. P. Foxon, C. Metcalfe, H. Adams, M. Webb and J. A. Thomas, Inorg. Chem., 2007,
46, 409-416. (b) M. E. Reichmann, S. A. Rice, C. A. Thomas and P. Doty, J. Am. Chem. Soc.,
1954, 76, 3047-3053.
(S13) J. D. McGhee and P. H. von Hippel, J. Mol. Biol., 1974, 86, 469-489.
(S14) M. T. Carter, M. Rodriguez and A. J. Bard, J. Am. Chem. Soc., 1989, 111, 8901-8911.
(S15) S. Saha, R. Majumdar, M. Roy, R. R. Dighe and A. R. Chakravarty, Inorg. Chem., 2009,
48, 2652-2663.
Electronic Supplementary Material (ESI) for Chemical CommunicationsThis journal is © The Royal Society of Chemistry 2012
(S16) J. Bernadou, G. Pratviel, F. Bennis, M. Girardet and B. Meunier, Biochemistry. 1989, 28,
7268-7275.
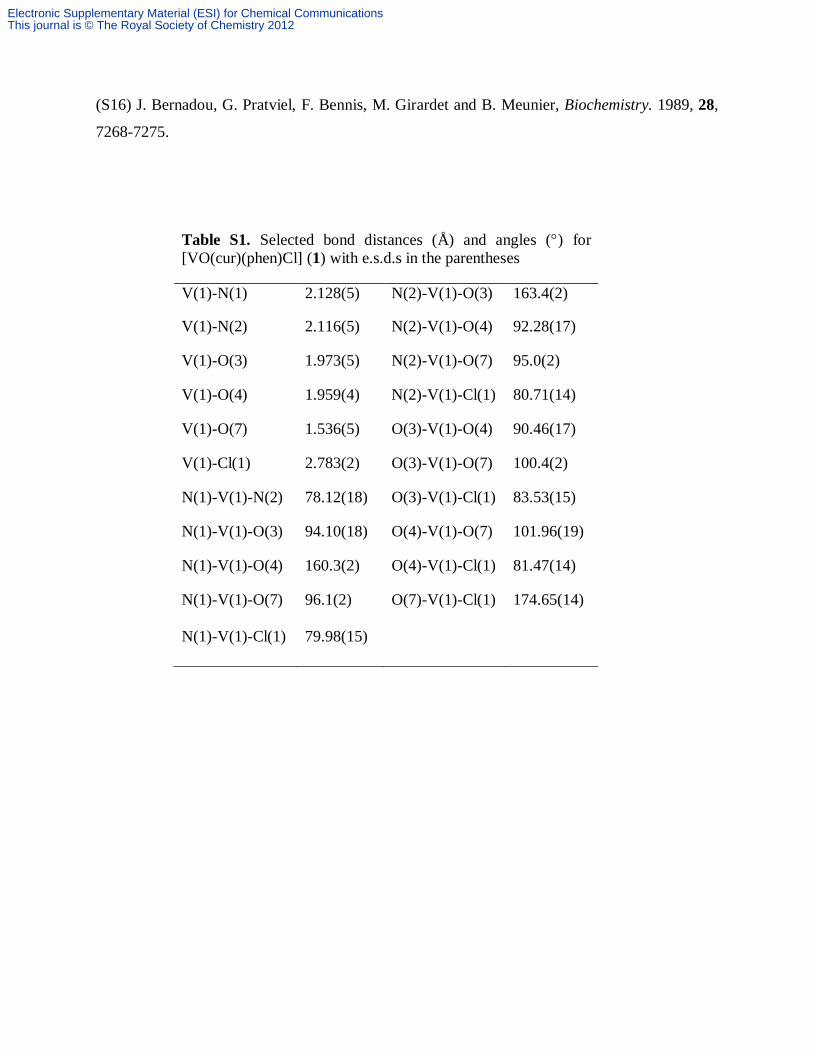
Table S1. Selected bond distances (Å) and angles () for
[VO(cur)(phen)Cl] (1) with e.s.d.s in the parentheses
V(1)-N(1) 2.128(5) N(2)-V(1)-O(3) 163.4(2)
V(1)-N(2) 2.116(5) N(2)-V(1)-O(4) 92.28(17)
V(1)-O(3) 1.973(5) N(2)-V(1)-O(7) 95.0(2)
V(1)-O(4) 1.959(4) N(2)-V(1)-Cl(1) 80.71(14)
V(1)-O(7) 1.536(5) O(3)-V(1)-O(4) 90.46(17)
V(1)-Cl(1) 2.783(2) O(3)-V(1)-O(7) 100.4(2)
N(1)-V(1)-N(2) 78.12(18) O(3)-V(1)-Cl(1) 83.53(15)
N(1)-V(1)-O(3) 94.10(18) O(4)-V(1)-O(7) 101.96(19)
N(1)-V(1)-O(4) 160.3(2) O(4)-V(1)-Cl(1) 81.47(14)
N(1)-V(1)-O(7) 96.1(2)
O(7)-V(1)-Cl(1) 174.65(14)
N(1)-V(1)-Cl(1) 79.98(15)
Electronic Supplementary Material (ESI) for Chemical CommunicationsThis journal is © The Royal Society of Chemistry 2012
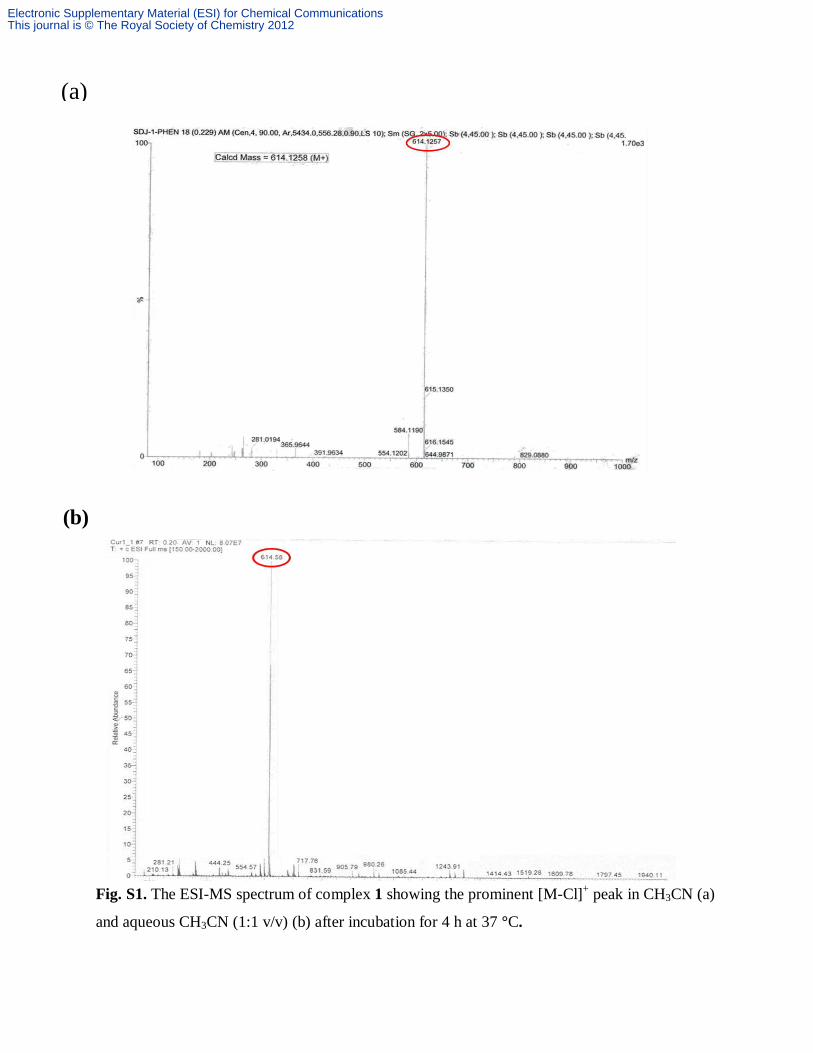
Fig. S1. The ESI-MS spectrum of complex 1 showing the prominent [M-Cl]+ peak in CH3CN (a)
and aqueous CH3CN (1:1 v/v) (b) after incubation for 4 h at 37 °C.
(a)
(b)
Electronic Supplementary Material (ESI) for Chemical CommunicationsThis journal is © The Royal Society of Chemistry 2012
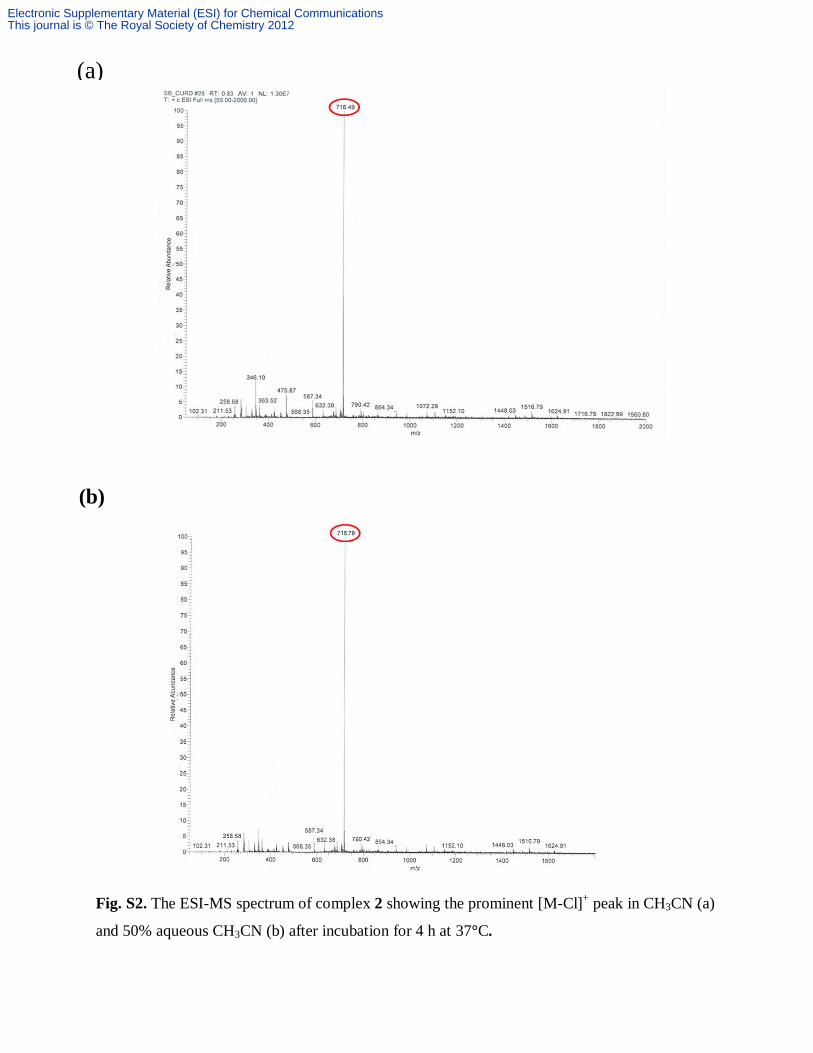
Fig. S2. The ESI-MS spectrum of complex 2 showing the prominent [M-Cl]+ peak in CH3CN (a)
and 50% aqueous CH3CN (b) after incubation for 4 h at 37°C.
(b)
(a)
Electronic Supplementary Material (ESI) for Chemical CommunicationsThis journal is © The Royal Society of Chemistry 2012
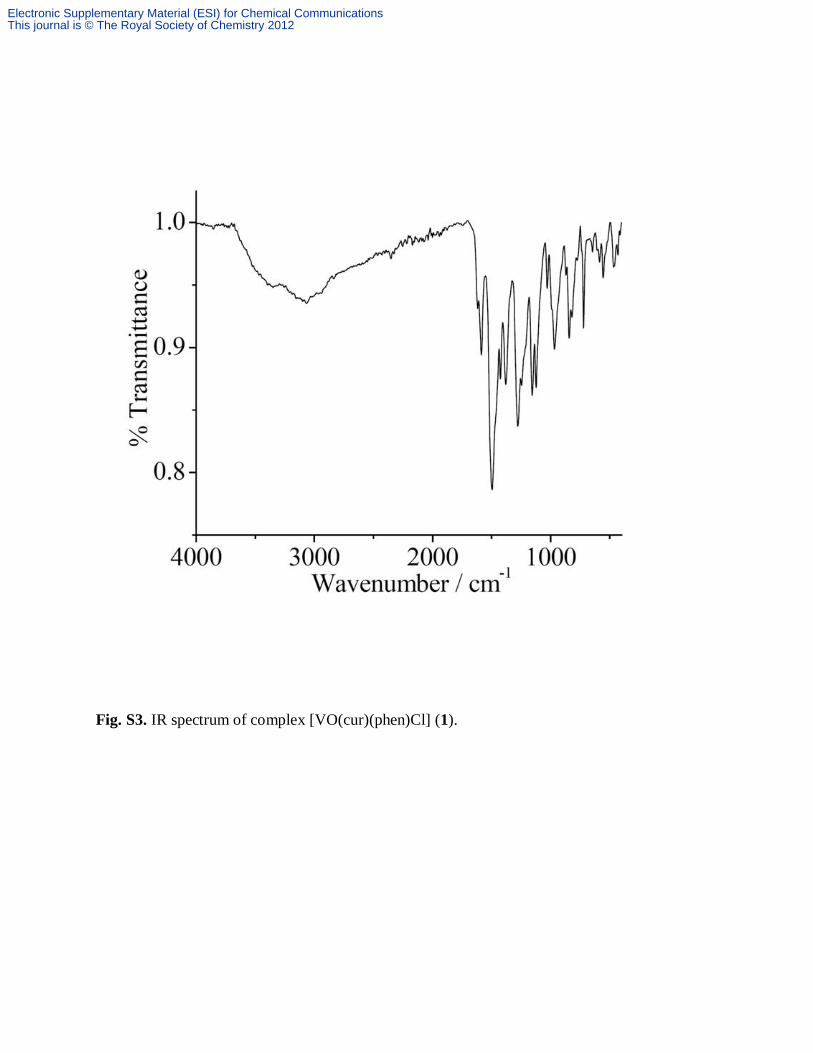
Fig. S3. IR spectrum of complex [VO(cur)(phen)Cl] (1).
Electronic Supplementary Material (ESI) for Chemical CommunicationsThis journal is © The Royal Society of Chemistry 2012
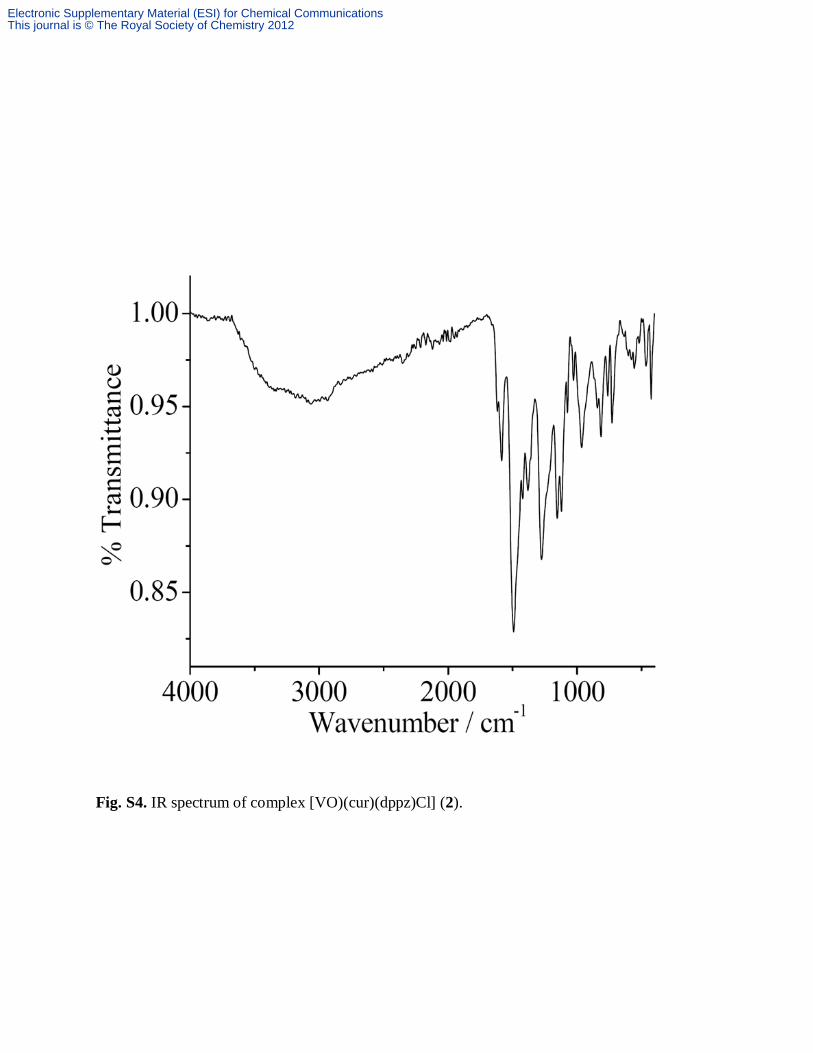
Fig. S4. IR spectrum of complex [VO)(cur)(dppz)Cl] (2).
Electronic Supplementary Material (ESI) for Chemical CommunicationsThis journal is © The Royal Society of Chemistry 2012
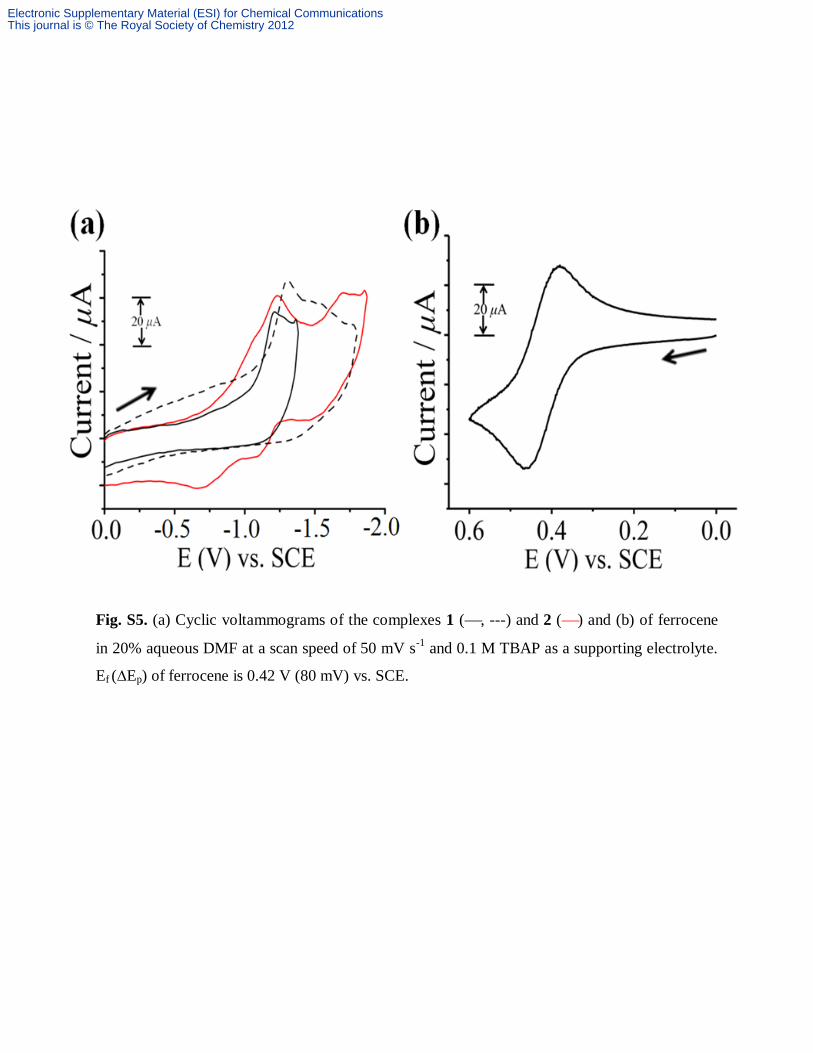
Fig. S5. (a) Cyclic voltammograms of the complexes 1 (, ---) and 2 () and (b) of ferrocene
in 20% aqueous DMF at a scan speed of 50 mV s-1
and 0.1 M TBAP as a supporting electrolyte.
Ef (∆Ep) of ferrocene is 0.42 V (80 mV) vs. SCE.
Electronic Supplementary Material (ESI) for Chemical CommunicationsThis journal is © The Royal Society of Chemistry 2012
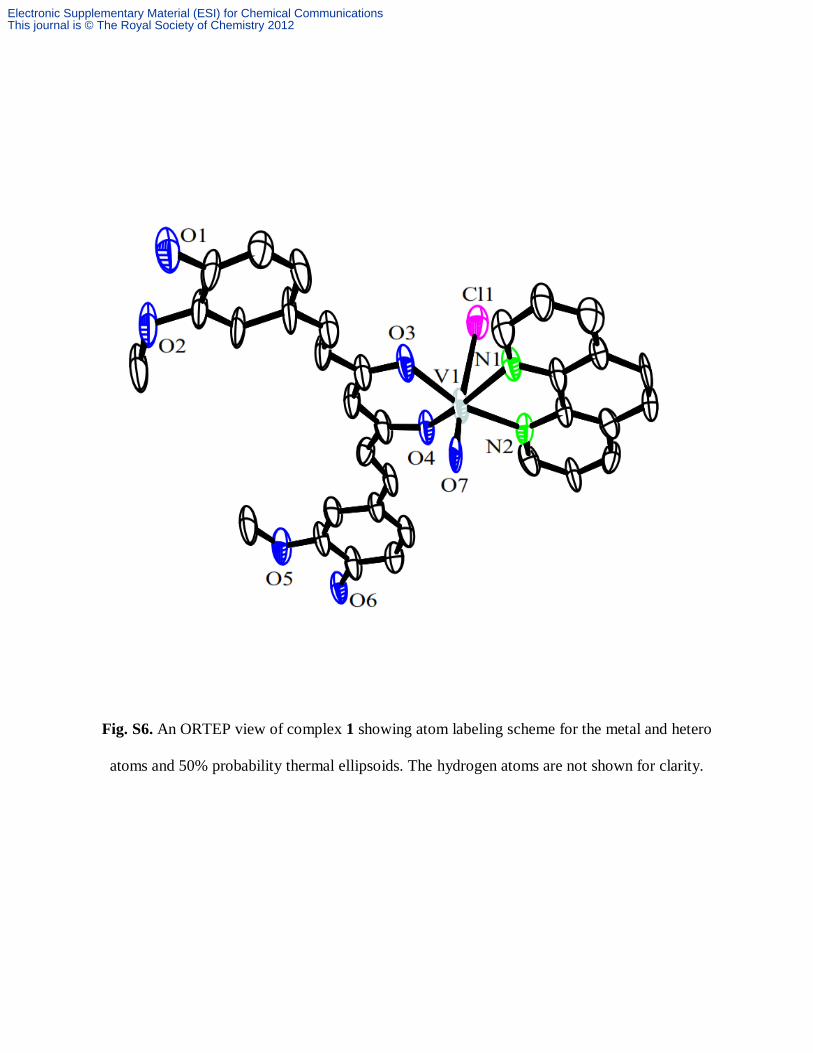
Fig. S6. An ORTEP view of complex 1 showing atom labeling scheme for the metal and hetero
atoms and 50% probability thermal ellipsoids. The hydrogen atoms are not shown for clarity.
Electronic Supplementary Material (ESI) for Chemical CommunicationsThis journal is © The Royal Society of Chemistry 2012
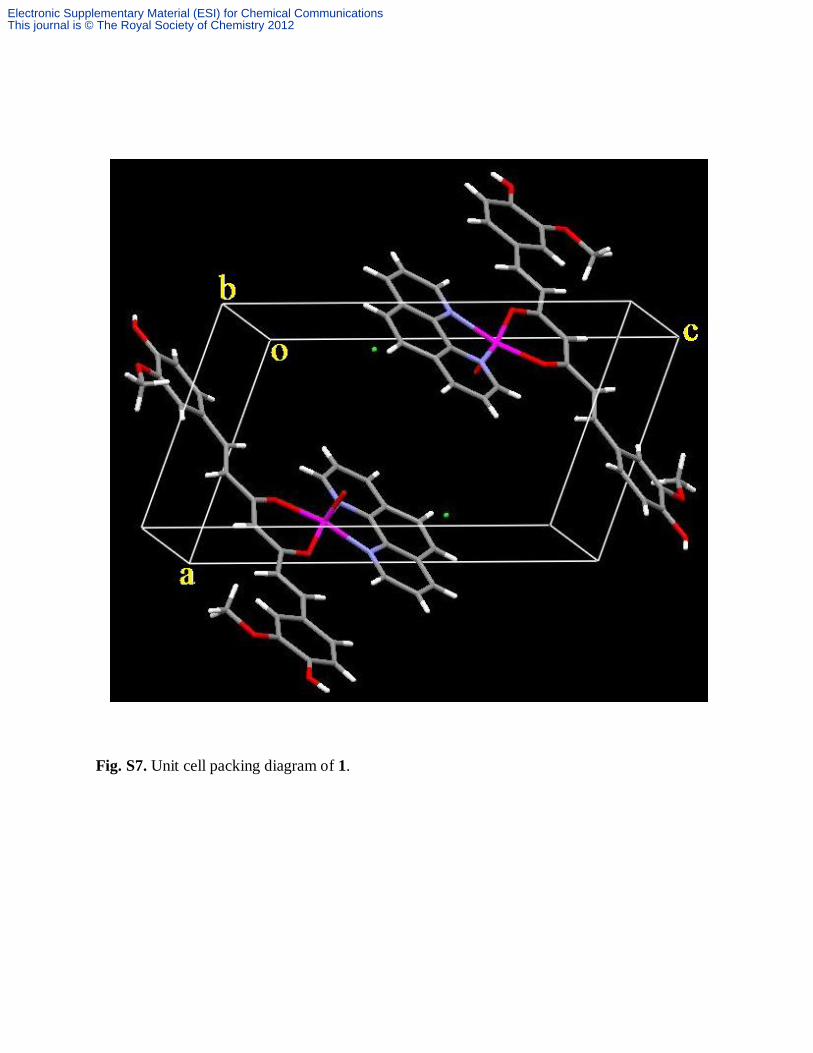
Fig. S7. Unit cell packing diagram of 1.
Electronic Supplementary Material (ESI) for Chemical CommunicationsThis journal is © The Royal Society of Chemistry 2012
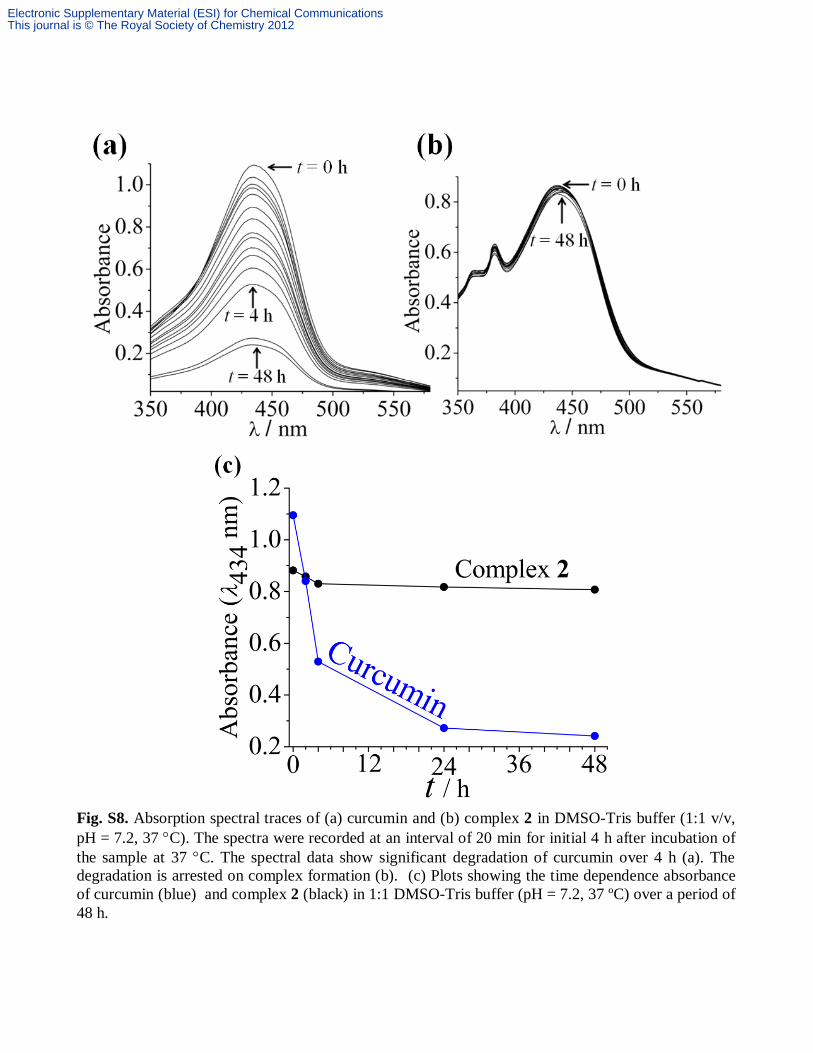
Fig. S8. Absorption spectral traces of (a) curcumin and (b) complex 2 in DMSO-Tris buffer (1:1 v/v,
pH = 7.2, 37 C). The spectra were recorded at an interval of 20 min for initial 4 h after incubation of
the sample at 37 C. The spectral data show significant degradation of curcumin over 4 h (a). The
degradation is arrested on complex formation (b). (c) Plots showing the time dependence absorbance
of curcumin (blue) and complex 2 (black) in 1:1 DMSO-Tris buffer (pH = 7.2, 37 ºC) over a period of
48 h.
Electronic Supplementary Material (ESI) for Chemical CommunicationsThis journal is © The Royal Society of Chemistry 2012
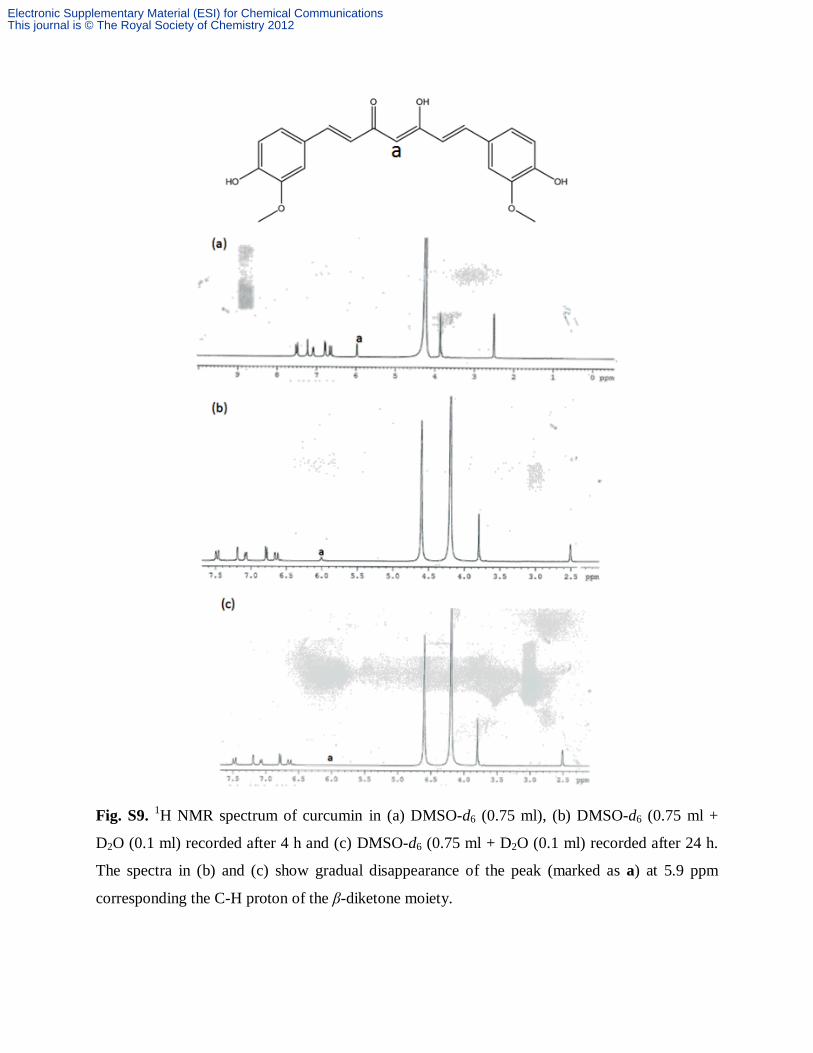
Fig. S9. 1H NMR spectrum of curcumin in (a) DMSO-d6 (0.75 ml), (b) DMSO-d6 (0.75 ml +
D2O (0.1 ml) recorded after 4 h and (c) DMSO-d6 (0.75 ml + D2O (0.1 ml) recorded after 24 h.
The spectra in (b) and (c) show gradual disappearance of the peak (marked as a) at 5.9 ppm
corresponding the C-H proton of the β-diketone moiety.
Electronic Supplementary Material (ESI) for Chemical CommunicationsThis journal is © The Royal Society of Chemistry 2012
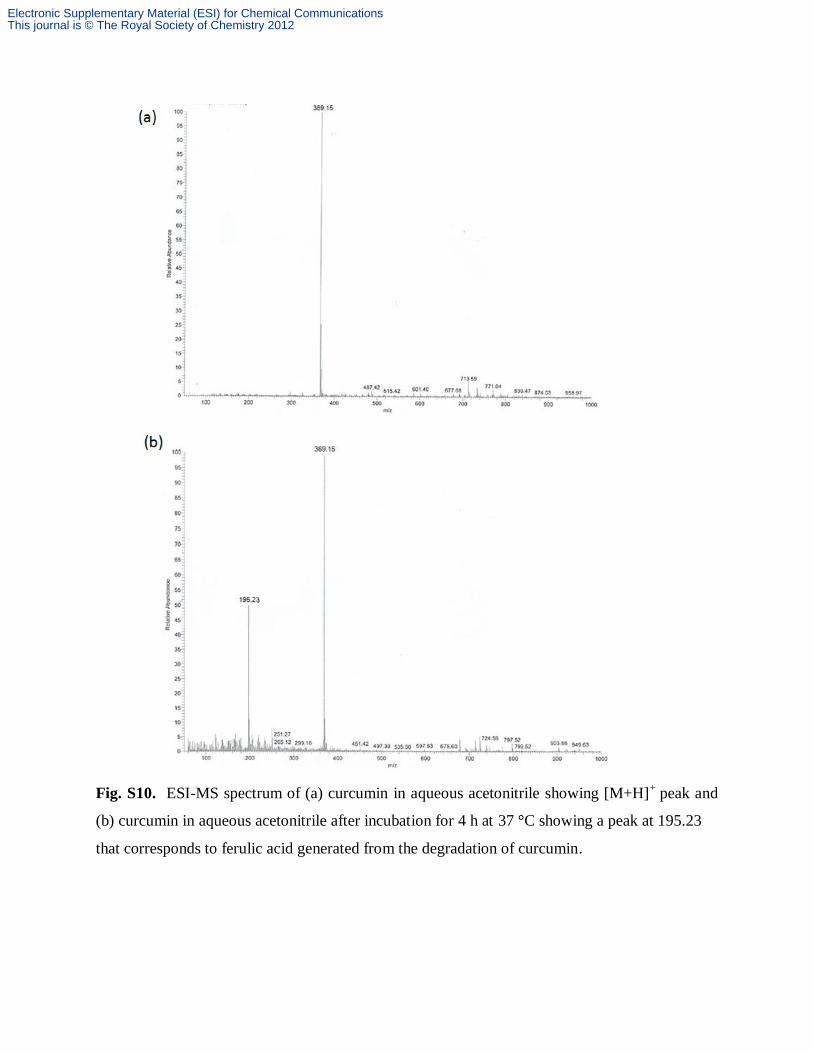
Fig. S10. ESI-MS spectrum of (a) curcumin in aqueous acetonitrile showing [M+H]+
peak and
(b) curcumin in aqueous acetonitrile after incubation for 4 h at 37 °C showing a peak at 195.23
that corresponds to ferulic acid generated from the degradation of curcumin.
Electronic Supplementary Material (ESI) for Chemical CommunicationsThis journal is © The Royal Society of Chemistry 2012
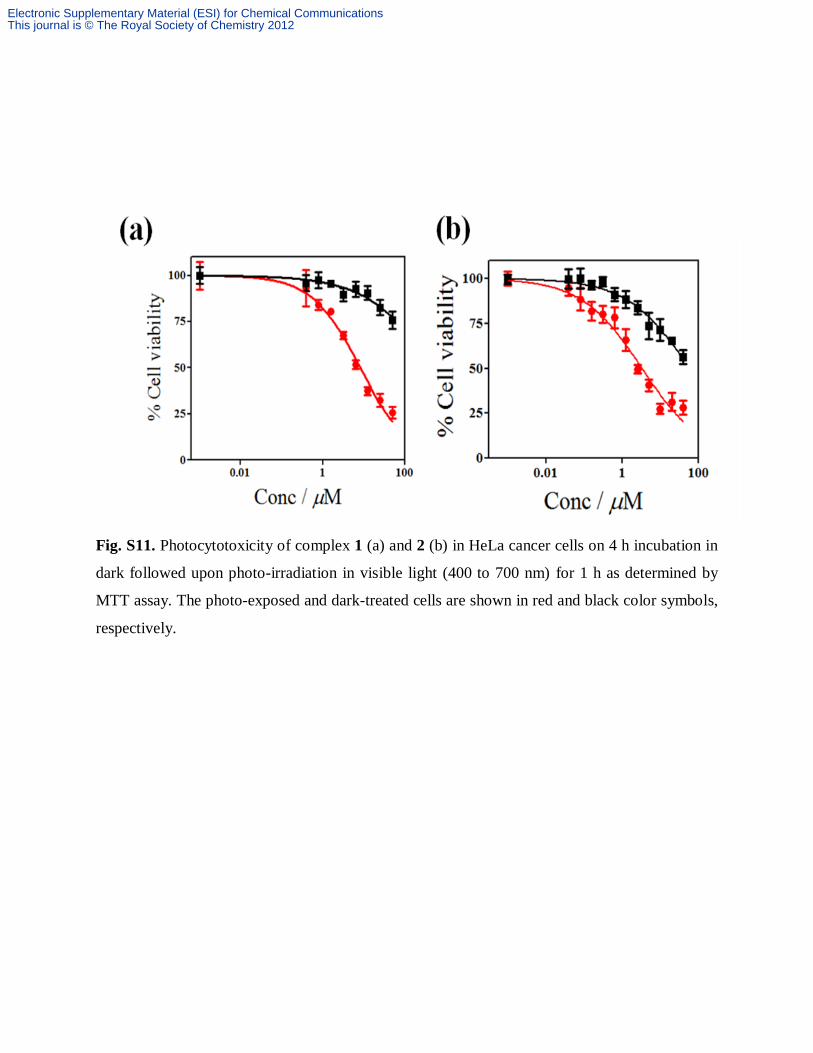
Fig. S11. Photocytotoxicity of complex 1 (a) and 2 (b) in HeLa cancer cells on 4 h incubation in
dark followed upon photo-irradiation in visible light (400 to 700 nm) for 1 h as determined by
MTT assay. The photo-exposed and dark-treated cells are shown in red and black color symbols,
respectively.
Electronic Supplementary Material (ESI) for Chemical CommunicationsThis journal is © The Royal Society of Chemistry 2012
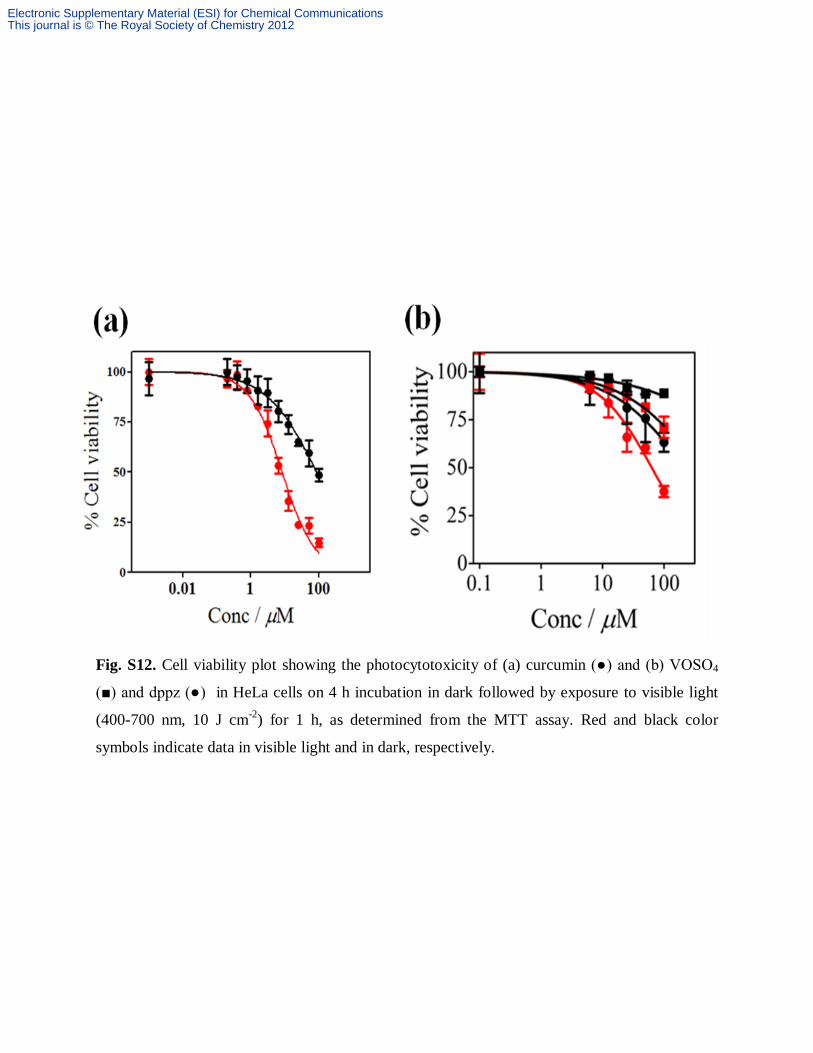
Fig. S12. Cell viability plot showing the photocytotoxicity of (a) curcumin (●) and (b) VOSO4
(■) and dppz (●) in HeLa cells on 4 h incubation in dark followed by exposure to visible light
(400-700 nm, 10 J cm-2
) for 1 h, as determined from the MTT assay. Red and black color
symbols indicate data in visible light and in dark, respectively.
Electronic Supplementary Material (ESI) for Chemical CommunicationsThis journal is © The Royal Society of Chemistry 2012
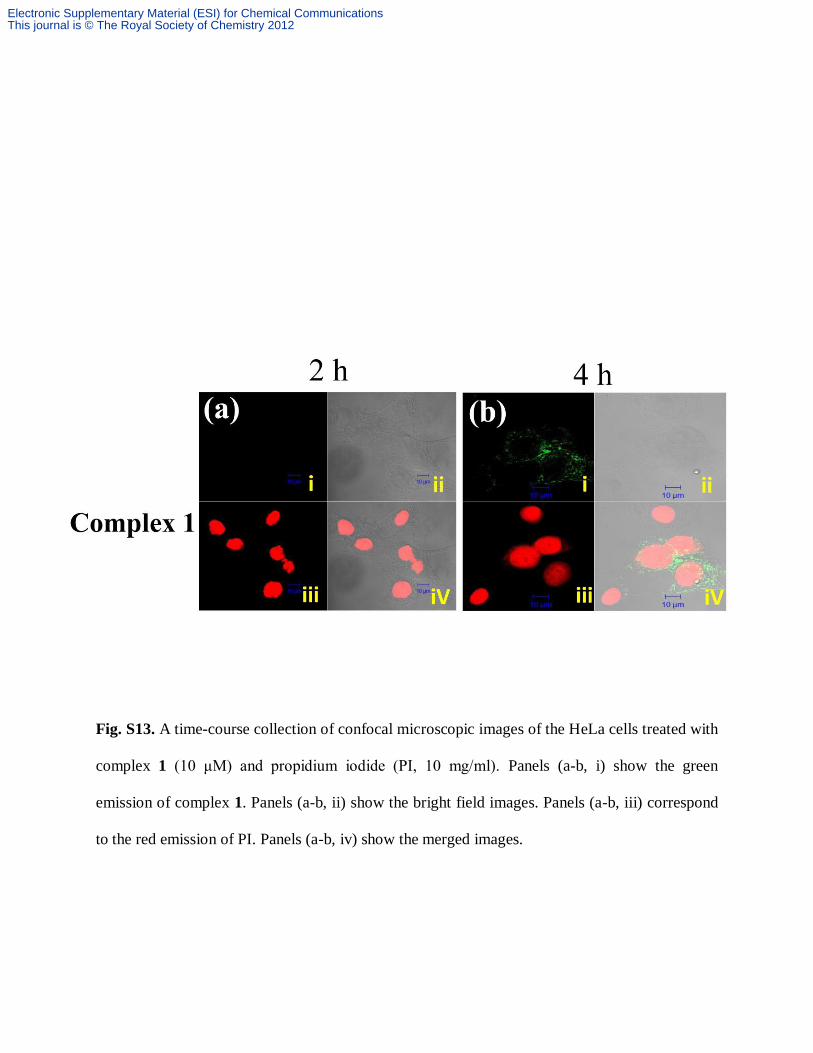
Fig. S13. A time-course collection of confocal microscopic images of the HeLa cells treated with
complex 1 (10 μM) and propidium iodide (PI, 10 mg/ml). Panels (a-b, i) show the green
emission of complex 1. Panels (a-b, ii) show the bright field images. Panels (a-b, iii) correspond
to the red emission of PI. Panels (a-b, iv) show the merged images.
Electronic Supplementary Material (ESI) for Chemical CommunicationsThis journal is © The Royal Society of Chemistry 2012
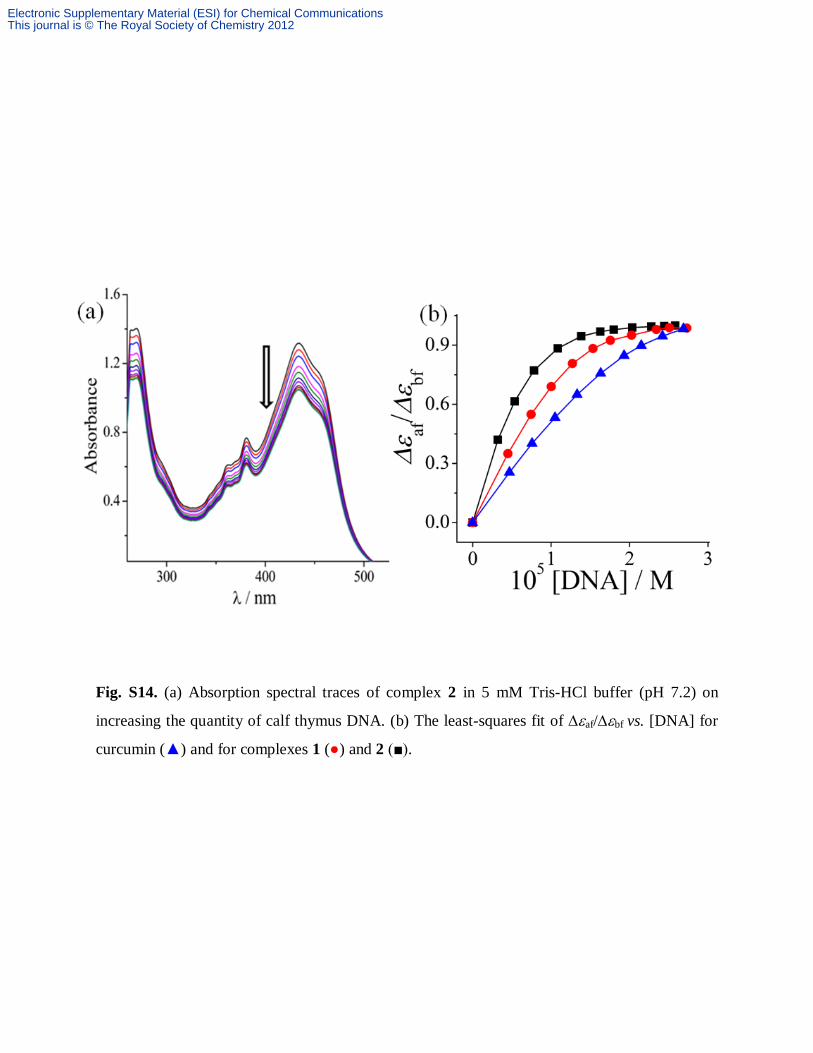
Fig. S14. (a) Absorption spectral traces of complex 2 in 5 mM Tris-HCl buffer (pH 7.2) on
increasing the quantity of calf thymus DNA. (b) The least-squares fit of af/bf vs. [DNA] for
curcumin (▲) and for complexes 1 (●) and 2 (■).
Electronic Supplementary Material (ESI) for Chemical CommunicationsThis journal is © The Royal Society of Chemistry 2012
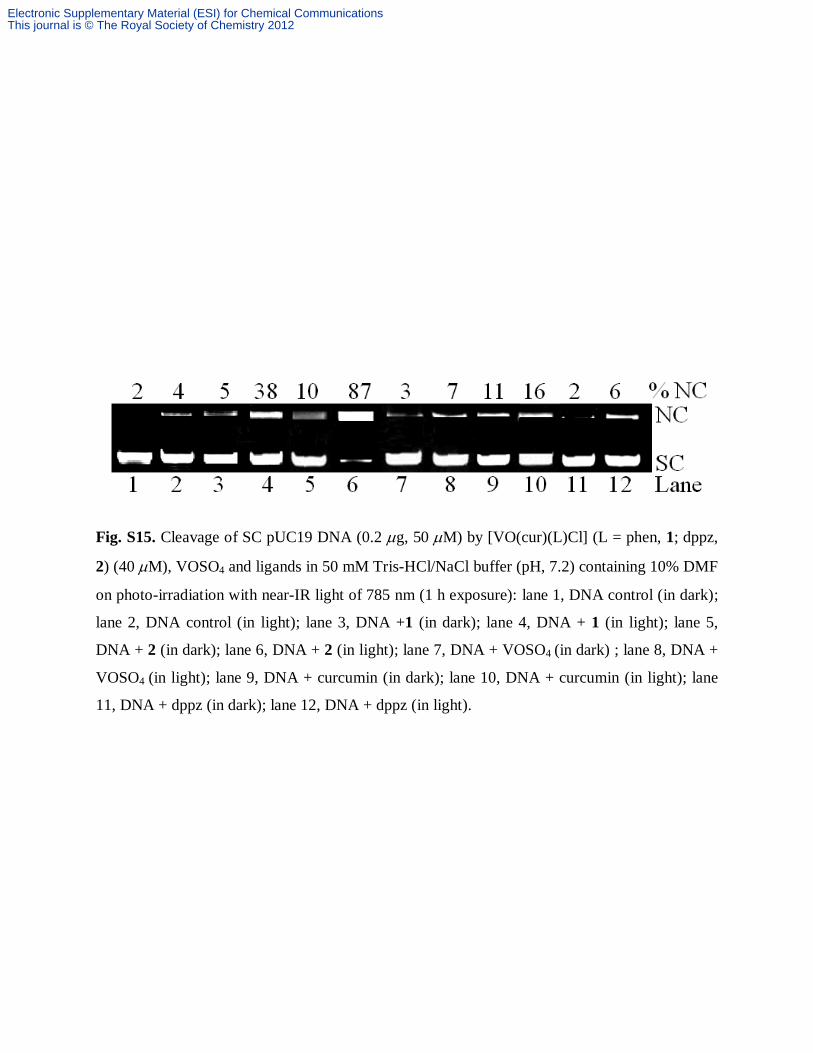
Fig. S15. Cleavage of SC pUC19 DNA (0.2 g, 50 M) by [VO(cur)(L)Cl] (L = phen, 1; dppz,
2) (40 M), VOSO4 and ligands in 50 mM Tris-HCl/NaCl buffer (pH, 7.2) containing 10% DMF
on photo-irradiation with near-IR light of 785 nm (1 h exposure): lane 1, DNA control (in dark);
lane 2, DNA control (in light); lane 3, DNA +1 (in dark); lane 4, DNA + 1 (in light); lane 5,
DNA + 2 (in dark); lane 6, DNA + 2 (in light); lane 7, DNA + VOSO4 (in dark) ; lane 8, DNA +
VOSO4 (in light); lane 9, DNA + curcumin (in dark); lane 10, DNA + curcumin (in light); lane
11, DNA + dppz (in dark); lane 12, DNA + dppz (in light).
Electronic Supplementary Material (ESI) for Chemical CommunicationsThis journal is © The Royal Society of Chemistry 2012