Embed Size (px)
Citation preview

Remote Sensing of Solar Wind Velocity Remote Sensing of Solar Wind Velocity Applying IPS Technique using MEXARTApplying IPS Technique using MEXART
Mejía-Ambriz J.,Mejía-Ambriz J.,González-Esparza J.,González-Esparza J.,Romero-Hernández E.Romero-Hernández E.
Jackson B. V.,Jackson B. V.,Tokumaru M.,Tokumaru M.,Yu H.S.Yu H.S.
MEXART
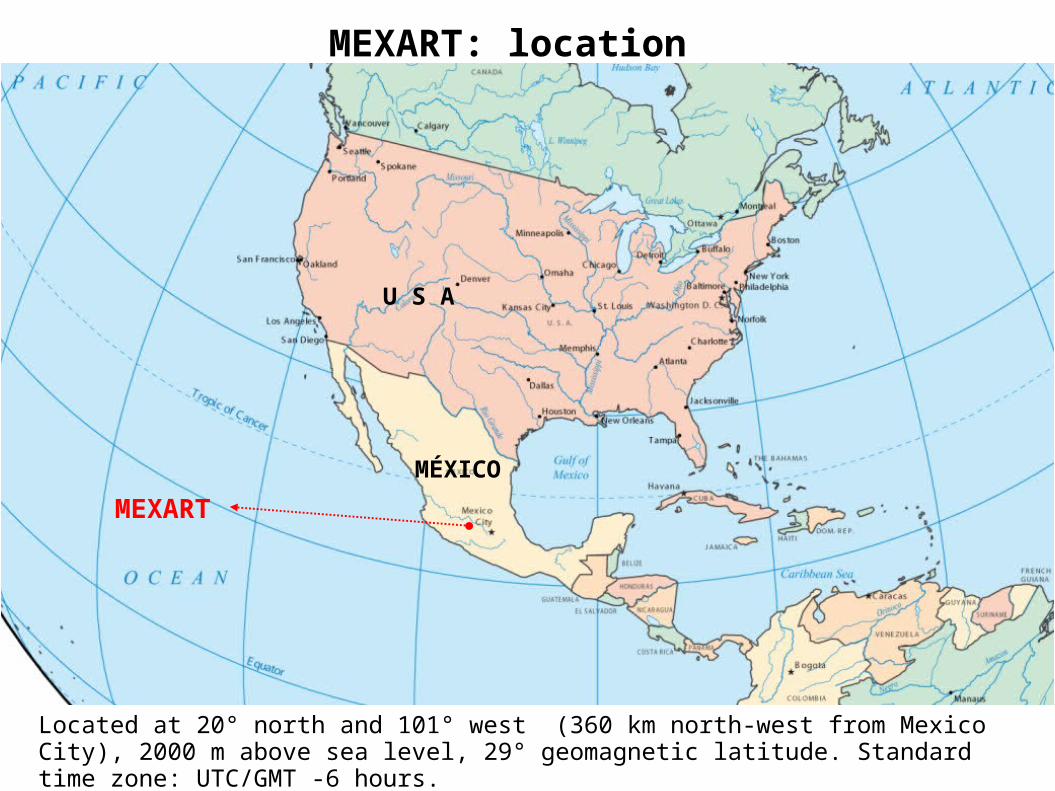
MEXART: location
Located at 20° north and 101° west (360 km north-west from Mexico City), 2000 m above sea level, 29° geomagnetic latitude. Standard time zone: UTC/GMT -6 hours.
U S A
MÉXICO

MEXART: the array
beams
The array is currently working with half of the total area (32 lines of 64 dipoles each). A Butler Matrix displays a radiation pattern of 16 beams at different declinations in the north-south plane, each beam has FWHM=1° in the east-west direction.
• A meridional transit radio telescope dedicated to Interplanetary Scintillation (IPS) observations. • An array of 4096 full wavelength dipoles (64 E-W lines with 64 dipoles). • A collecting area of 9800 m2. • The operation frequency is 140 MHz, bandwidth receiver 2 MHz. http://www.mexart.unam.mx.

time
FLUX
4 minutes
E W
width =1°
Radio sources record
East-west beam pattern and lateral lobes. The beam is fixed at the local zenith.
A source is shown on its east-west trajectory across the beam.
The signal is received from the source, and recorded at a sampling rate of 50/sec (receiver constant = 47 ms).

on-source flux
off-source
Interplanetary scintillation (IPS)
Radio signals from compact radio sources (< 1 arcsec) are scattered by solar wind irregularities. The turbulence spectrum of irregularities decreases as R^{-4}. For quiet solar wind, IPS measurements are often associated with properties of the solar wind at the closest approach of the line of sight to the Sun (when R=p).
R
= VcosΘ
The scattering produces a moving diffraction pattern at Earth, observed as amplitude fluctuations.
Flux amplitude fluctuations from 3C48 observed by MEXART.

Remote sensing by IPS: basic idea.
IPS allows us to determinate solar wind properties away from the ecliptic plane (point P). γ is the heliocentric angle.
Remote sensing in the inner heliosphereIPS coverage
Example of a 3-D reconstruction of solar-wind velocities using IPS observations of STELab. Only the low velocities are shown (Jackson, et al., Sol. Phys. 2010.) (previous talk).

A model of the power spectra of density fluctuations
To calculate solar wind velocities by using a single station IPS, we use a theoretical power spectrum: an integration of scattering layers along the line of sight (z) at the radio source (Manoharan & Ananthakrishnan, MNRAS, 1990). The power spectrum depends on: λ, ε, v, Θ, α (isotropic medium).
Frequency of intensity fluctuations
Diffractive function (Fresnel function)
Visibility function
of the sourceHeliocentric
distance at the region of IPS (point P)
Wave number of solar wind irregularities
Wave number component in the direction of solar wind projection is related to the frequency of scintillation f Turbulence
spectrum follows a potential law
α ≈ 3.5 ± 0.5

Examples of normalized (log-log) theoretical power spectra with different conditions.
For these cases:Solar wind velocity = 400 km/s
ε=30°α=3.3θ=width of the source.
θ=0.0, 140 MHz and 327 MHz.
Θ=0.25'',140 MHz and 327 MHz.
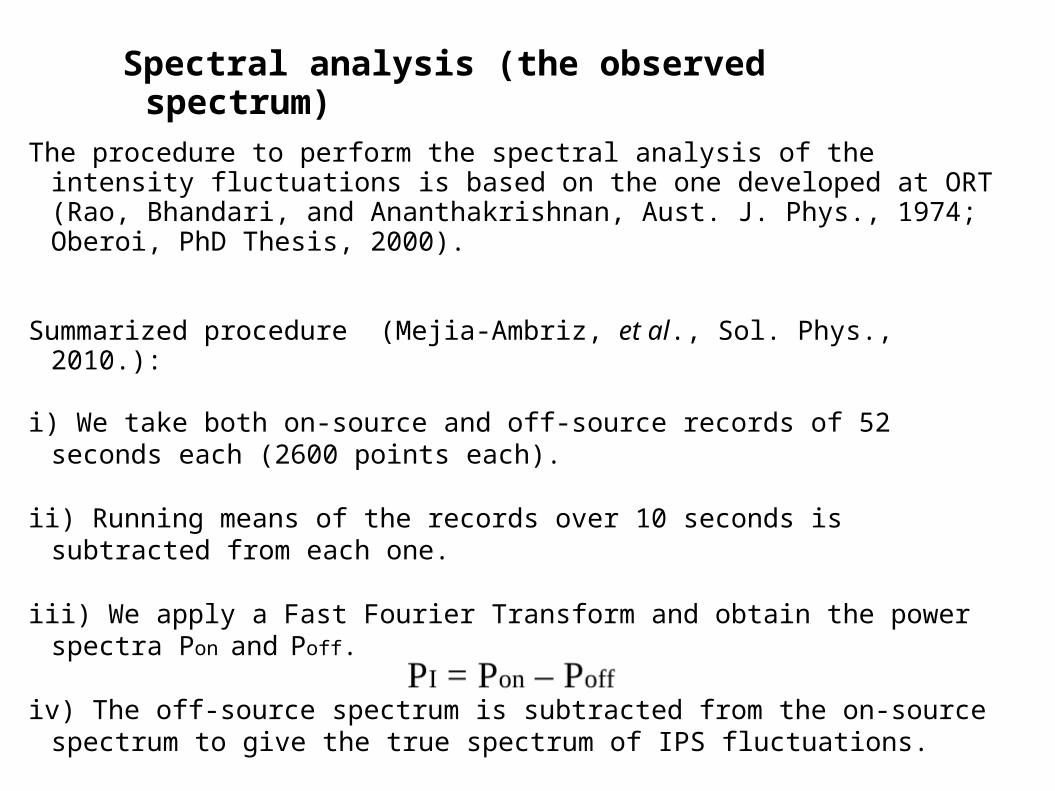
The procedure to perform the spectral analysis of the intensity fluctuations is based on the one developed at ORT (Rao, Bhandari, and Ananthakrishnan, Aust. J. Phys., 1974; Oberoi, PhD Thesis, 2000).
Summarized procedure (Mejia-Ambriz, et al., Sol. Phys., 2010.):
i) We take both on-source and off-source records of 52 seconds each (2600 points each).
ii) Running means of the records over 10 seconds is subtracted from each one.
iii) We apply a Fast Fourier Transform and obtain the power spectra Pon and Poff.
iv) The off-source spectrum is subtracted from the on-source spectrum to give the true spectrum of IPS fluctuations.
Spectral analysis (the observed spectrum)

solar wind velocity obtained by fitting the model to the observed power spectra
IPS power spectrum for the quasar 3C298. Best fitting (minimum chi-square) for 3 degrees of freedom: α, θ and v. The angular width of this source at a nearby frequency (151 MHz) is θ = 0.4'' (Duffett-Smitt & Readhead, MONRAS, 1976).
Model fitting
Observed
α = 3.0 θ = 0.35'' v = 350 ± 8.5 km/s

α = 4.0 θ = 0.25'' v = 640 ± 28.5 km/s
α = 4.0 θ = 0.25'' v = 430 ± 15.8 km/s
source width 140 MHz width 151.5 MHz
3C48 0.25'' 0.25''
3C298 0.35'' 0.4''
Angular width comparison at a near frequency (a great difference is not expected)
solar wind velocity obtained by fitting the model to the observed power spectra
IPS power spectra of the quasar 3C48. Best fits (minimum chi square) for 3 degrees of freedom: α, θ and v. Both cases report θ=0.25'' and α = 4.0. The angular width of this source at a nearby frequency (151 MHz) is θ=0.25'' (Duffett-Smitt & Readhead, 1976).

Comparison of velocities with STELab
4 antennas of The Solar Terrestrial Environment Laboratory (STELab) in Japan are dedicated to IPS. The system determines solar wind speeds by measuring the time lags of the diffraction patterns propagating between separate stations (Tokumaru, M. et al., Rad. Sci., 2011).
The difference in longitude between MEXART (~100° W) an STELab (~140° E) results inmeridian transits of sources observed with a difference of at least ~8 or ~16 hours.
A comparison of previous MEXART 3C48 velocity observations with those from STELab:
INSTRUMENT YYMMDD UT DIST (AU) VELOCITY km/s
STEL 090421 2.67 0.37 672 ± 4
STEL 090422 2.60 0.37 NO OBS.
MEXART 090422 18.40 0.37 640 ± 28.5
STEL 090423 2.54 0.37 643 ± 2
STEL 120508 1.40 0.42 382 ± 10
MEXART 120508 17.27 0.43 430 ± 15.8
STEL 120509 1.33 0.43 424 ± 22

View from an observer at Earth.
Sun is in the center.
Concentric circles are elongations: 45=0.7AU 90=1AU.
Small circles represent positions of observed sources.
2-D solar wind velocity sky maps: IPS tomography program

View from an observer at Earth.
Sun is in the center.
Concentric circles are elongations: 45=0.7AU 90=1AU.
Small circles represents positions of observed sources.
2-D solar wind velocity sky maps: IPS tomography program

View from an observer at Earth.
Sun is in the center.
Concentric circles are elongations: 45=0.7AU 90=1AU.
Small circles represents positions of observed sources.
2-D solar wind velocity sky maps: IPS tomography program

View from an observer at Earth.
Sun is in the center.
Concentric circles are elongations: 45=0.7AU 90=1AU.
Small circles represents positions of observed sources.
2-D solar wind velocity sky maps: IPS tomography program

View from an observer at Earth.
Sun is in the center.
Concentric circles are elongations: 45=0.7AU 90=1AU.
Small circles represents positions of observed sources.
2-D solar wind velocity sky maps: IPS tomography program

View from an observer at Earth.
Sun is in the center.
Concentric circles are elongations: 45=0.7AU 90=1AU.
Small circles represents positions of observed sources.
2-D solar wind velocity sky maps: IPS tomography program

View from an observer at Earth.
Sun is in the center.
Concentric circles are elongations: 45=0.7AU 90=1AU.
Small circles represents positions of observed sources.
2-D solar wind velocity sky maps: IPS tomography program

View from an observer at Earth.
Sun is in the center.
Concentric circles are elongations: 45=0.7AU 90=1AU.
Small circles represents positions of observed sources.
2-D solar wind velocity sky maps: IPS tomography program

View from an observer at Earth.
Sun is in the center.
Concentric circles are elongations: 45=0.7AU 90=1AU.
Small circles represents positions of observed sources.
2-D solar wind velocity sky maps: IPS tomography program
Summary and comments
We present the first remote sensing of solar wind velocities utilizing IPS observations at 140 MHz with MEXART.
'Quasi-simultaneous' observations of MEXART and STELab allow us to compare solar wind velocities between these instruments. Very similar speeds have been found for the sources analyzed to date.
Angular widths of the quasars 3C48 and 3C298, obtained with MEXART's IPS observations at 140 MHz give sizes in agreement with those reported at 151.5 MHz.
Solar wind velocities obtained by MEXART can be incorporated into the tomography program with the weighting appropriate for this radio frequency. In this way observations in Japan’s night time (where no observations of sources with STELab are available at elongations near the Sun) can be complemented with meridional transit observations from MEXART.
Observations before Dec 2010 used a quarter of the total MEXART's array. We are now employing an additional amount of the collecting area and the signal to noise ratio has been improved by ~30%.

Thank you
![azhdotorg.files.wordpress.com · Web viewPROFIL INONESIA. IPS. ismail - [2010] home. IPS. PROFIL INONESIA. PROFIL INONESIA. IPS. ismail - [2010] home. IPS. IPS. ismail - [2010]](https://img.pdfslide.net/doc/110x75/5ff341f8f34dcd44de5dc7b6/web-view-profil-inonesia-ips-ismail-2010-home-ips-profil-inonesia-profil.jpg)