Embed Size (px)
Citation preview
2016 Cardiovascular Provider Compensation and Production Survey
RepoRt:
MedAxioM CARdioVASCULAR PRoVideR CoMPeNSATioN & PRodUCTioN SURVeY – 2016 2
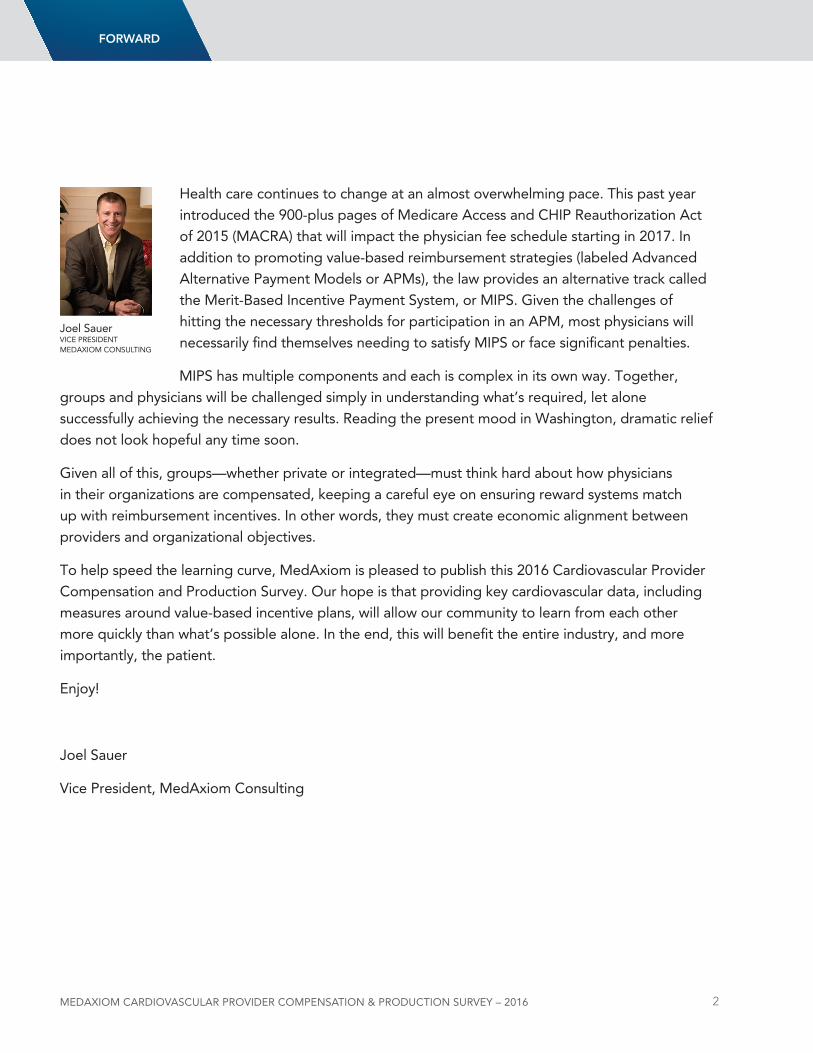
Health care continues to change at an almost overwhelming pace. This past year introduced the 900-plus pages of Medicare Access and CHIP Reauthorization Act of 2015 (MACRA) that will impact the physician fee schedule starting in 2017. In addition to promoting value-based reimbursement strategies (labeled Advanced Alternative Payment Models or APMs), the law provides an alternative track called the Merit-Based Incentive Payment System, or MIPS. Given the challenges of hitting the necessary thresholds for participation in an APM, most physicians will necessarily find themselves needing to satisfy MIPS or face significant penalties.
MIPS has multiple components and each is complex in its own way. Together, groups and physicians will be challenged simply in understanding what’s required, let alone successfully achieving the necessary results. Reading the present mood in Washington, dramatic relief does not look hopeful any time soon.
Given all of this, groups—whether private or integrated—must think hard about how physicians in their organizations are compensated, keeping a careful eye on ensuring reward systems match up with reimbursement incentives. In other words, they must create economic alignment between providers and organizational objectives.
To help speed the learning curve, MedAxiom is pleased to publish this 2016 Cardiovascular Provider Compensation and Production Survey. Our hope is that providing key cardiovascular data, including measures around value-based incentive plans, will allow our community to learn from each other more quickly than what’s possible alone. In the end, this will benefit the entire industry, and more importantly, the patient.
Enjoy!
Joel Sauer
Vice President, MedAxiom Consulting
FoRWARD
Joel SauerVICE PRESIdEnTMEdAxIOM COnSulTInG
MedAxioM CARdioVASCULAR PRoVideR CoMPeNSATioN & PRodUCTioN SURVeY – 2016 3
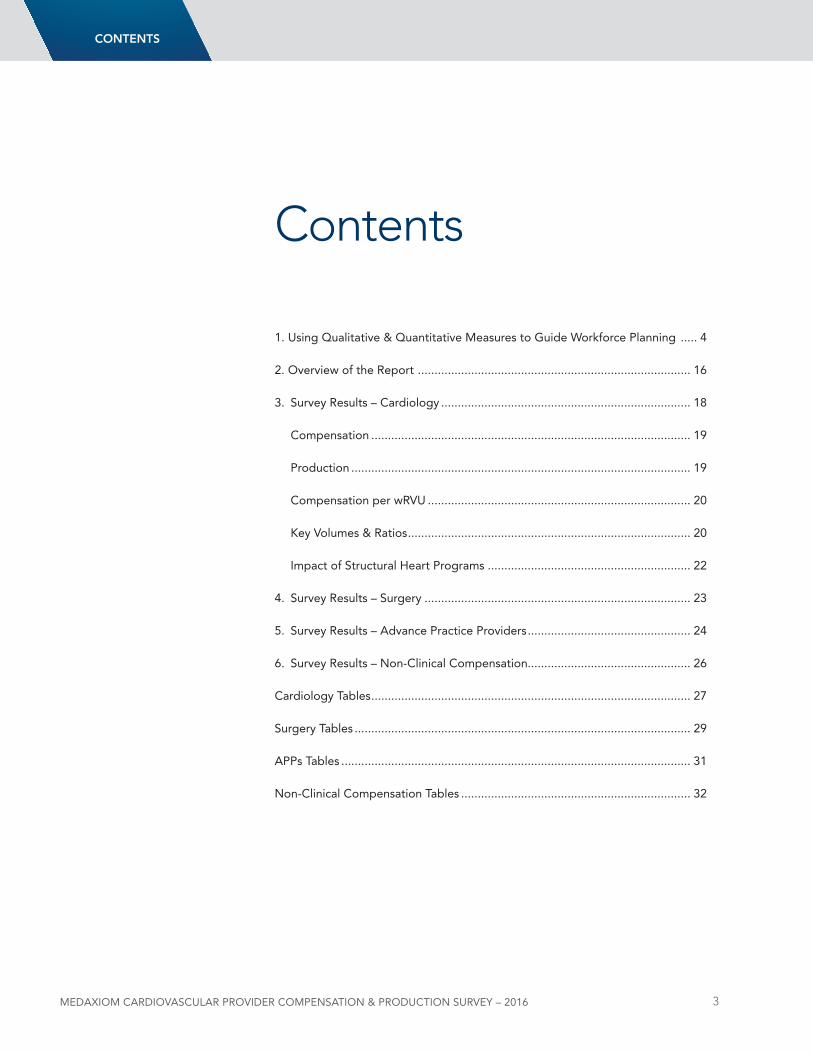
1. using Qualitative & Quantitative Measures to Guide Workforce Planning ..... 4
2. Overview of the Report .................................................................................. 16
3. Survey Results – Cardiology ........................................................................... 18
Compensation ................................................................................................ 19
Production ...................................................................................................... 19
Compensation per wRVu ............................................................................... 20
Key Volumes & Ratios ..................................................................................... 20
Impact of Structural Heart Programs ............................................................. 22
4. Survey Results – Surgery ................................................................................ 23
5. Survey Results – Advance Practice Providers ................................................. 24
6. Survey Results – non-Clinical Compensation................................................. 26
Cardiology Tables ................................................................................................ 27
Surgery Tables ..................................................................................................... 29
APPs Tables ......................................................................................................... 31
non-Clinical Compensation Tables ..................................................................... 32
Contents
Contents

MedAxioM CARdioVASCULAR PRoVideR CoMPeNSATioN & PRodUCTioN SURVeY – 2016 4
Every year—like clockwork—the conversation among physicians at MedAxiom’s conferences turns to an aging cardiovascular workforce and how to deal with physicians leaving call. This year was no exception and no small wonder, as this is a very dicey and potentially divisive topic.
This article is intended to provide organizations with a roadmap to both anticipate and plan for current and future physician needs. The content will look not only at physician slow-down and call cutbacks, but also at creating a comprehensive plan for moving your entire cardiovascular program forward. It will cover:
1. Current state of the cardiovascular workforce and an overview of workforce planning
2. Qualitative measures that are necessary to guide the planning process
3. Quantitative measures to zero in on specific needs
1. Using Qualitative & Quantitative Measures to Guide Workforce Planning
WoRkFoRCe plAnning
MedAxioM CARdioVASCULAR PRoVideR CoMPeNSATioN & PRodUCTioN SURVeY – 2016 5
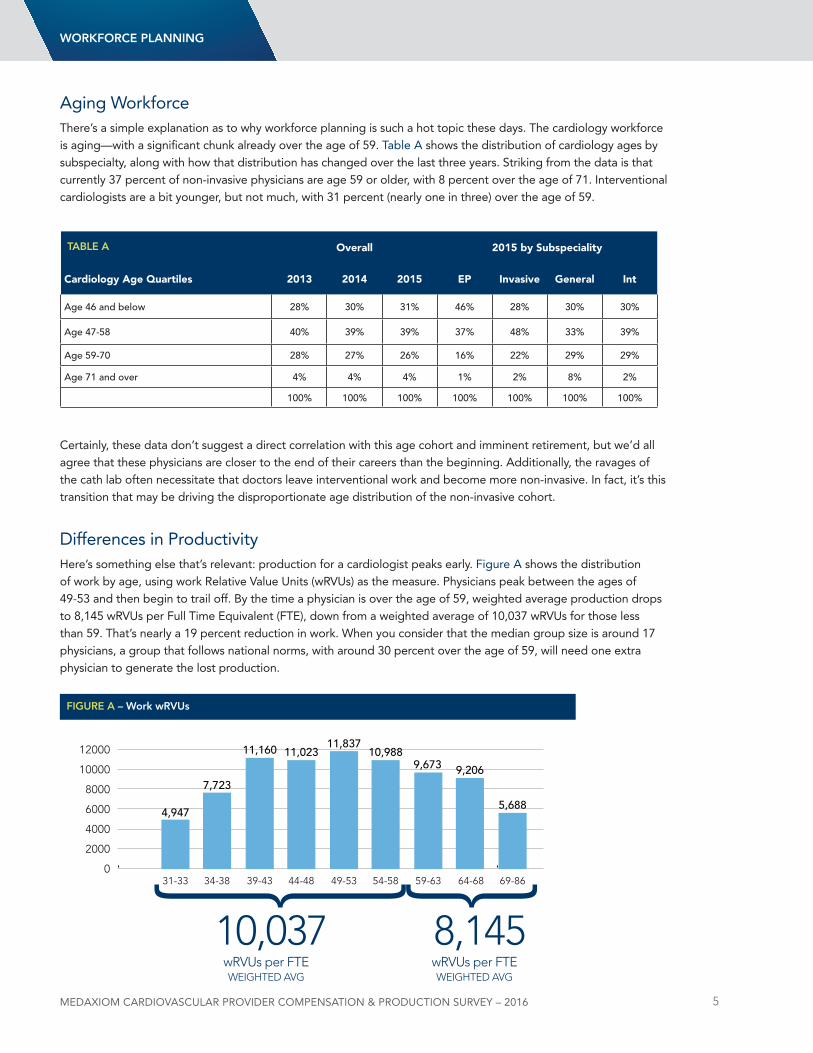
Aging WorkforceThere’s a simple explanation as to why workforce planning is such a hot topic these days. The cardiology workforce is aging—with a significant chunk already over the age of 59. Table A shows the distribution of cardiology ages by subspecialty, along with how that distribution has changed over the last three years. Striking from the data is that currently 37 percent of non-invasive physicians are age 59 or older, with 8 percent over the age of 71. Interventional cardiologists are a bit younger, but not much, with 31 percent (nearly one in three) over the age of 59.
Certainly, these data don’t suggest a direct correlation with this age cohort and imminent retirement, but we’d all agree that these physicians are closer to the end of their careers than the beginning. Additionally, the ravages of the cath lab often necessitate that doctors leave interventional work and become more non-invasive. In fact, it’s this transition that may be driving the disproportionate age distribution of the non-invasive cohort.
differences in ProductivityHere’s something else that’s relevant: production for a cardiologist peaks early. Figure A shows the distribution of work by age, using work Relative Value units (wRVus) as the measure. Physicians peak between the ages of 49-53 and then begin to trail off. By the time a physician is over the age of 59, weighted average production drops to 8,145 wRVus per Full Time Equivalent (FTE), down from a weighted average of 10,037 wRVus for those less than 59. That’s nearly a 19 percent reduction in work. When you consider that the median group size is around 17 physicians, a group that follows national norms, with around 30 percent over the age of 59, will need one extra physician to generate the lost production.
WoRkFoRCe plAnning
31-33 34-38 39-43 44-48 49-53 54-58 59-63 64-68 69-860
2000
4000
6000
8000
10000
12000
4,947
7,723
11,160 11,02311,837
10,9889,673 9,206
5,688
FigURe A – Work wRVUs
Overall 2015 by Subspeciality
Cardiology Age Quartiles 2013 2014 2015 EP Invasive General Int
Age 46 and below 28% 30% 31% 46% 28% 30% 30%
Age 47-58 40% 39% 39% 37% 48% 33% 39%
Age 59-70 28% 27% 26% 16% 22% 29% 29%
Age 71 and over 4% 4% 4% 1% 2% 8% 2%
100% 100% 100% 100% 100% 100% 100%
tABle A
8,14510,037wRVUs per FTEwRVUs per FTEWEIGHTED AVGWEIGHTED AVG
MedAxioM CARdioVASCULAR PRoVideR CoMPeNSATioN & PRodUCTioN SURVeY – 2016 6
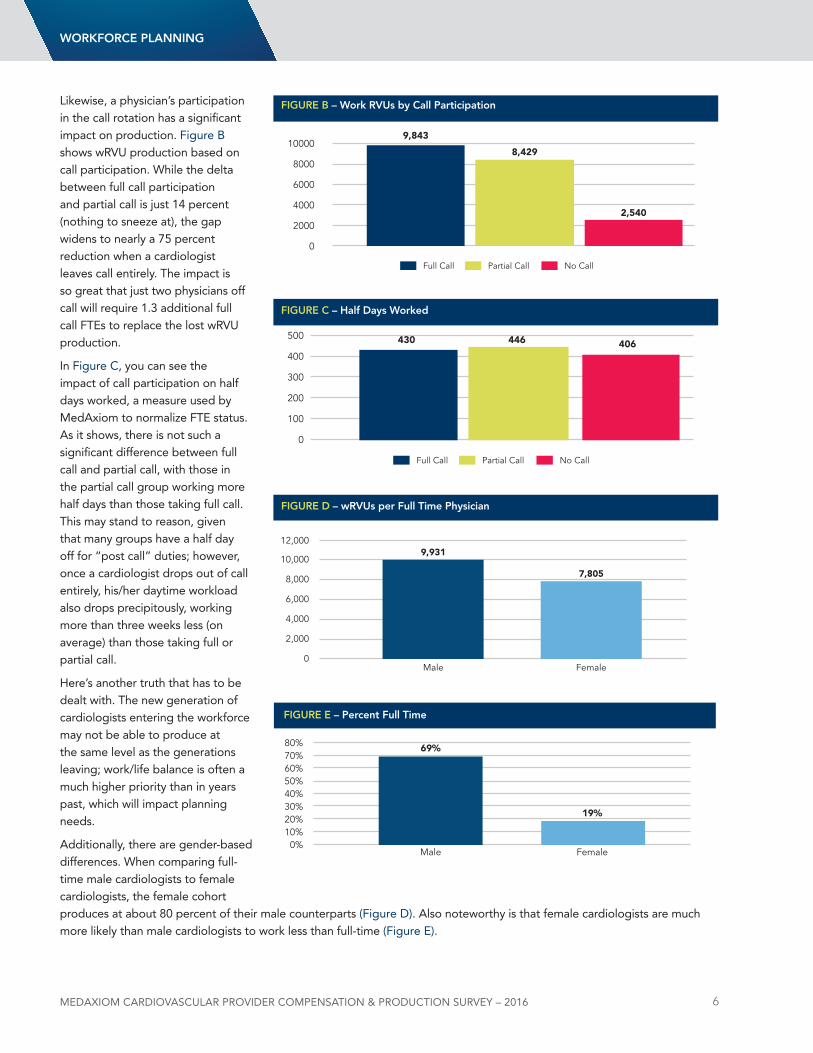
likewise, a physician’s participation in the call rotation has a significant impact on production. Figure B shows wRVu production based on call participation. While the delta between full call participation and partial call is just 14 percent (nothing to sneeze at), the gap widens to nearly a 75 percent reduction when a cardiologist leaves call entirely. The impact is so great that just two physicians off call will require 1.3 additional full call FTEs to replace the lost wRVu production.
In Figure C, you can see the impact of call participation on half days worked, a measure used by MedAxiom to normalize FTE status. As it shows, there is not such a significant difference between full call and partial call, with those in the partial call group working more half days than those taking full call. This may stand to reason, given that many groups have a half day off for “post call” duties; however, once a cardiologist drops out of call entirely, his/her daytime workload also drops precipitously, working more than three weeks less (on average) than those taking full or partial call.
Here’s another truth that has to be dealt with. The new generation of cardiologists entering the workforce may not be able to produce at the same level as the generations leaving; work/life balance is often a much higher priority than in years past, which will impact planning needs.
Additionally, there are gender-based differences. When comparing full-time male cardiologists to female cardiologists, the female cohort produces at about 80 percent of their male counterparts (Figure d). Also noteworthy is that female cardiologists are much more likely than male cardiologists to work less than full-time (Figure E).
Full Call
9,843
8,429
2,540
0
2000
4000
6000
8000
10000
Partial Call No Call
FigURe B – Work RVUs by Call participation
Full Call
430 446 406
0
100
200
300
400
500
Partial Call No Call
FigURe C – Half Days Worked
0
2,000
4,000
6,000
8,000
10,000
12,000
Male Female
9,931
7,805
FigURe D – wRVUs per Full time physician
FemaleMale0%
10%20%30%40%50%60%70%80%
19%
69%
FigURe e – percent Full time
WoRkFoRCe plAnning

MedAxioM CARdioVASCULAR PRoVideR CoMPeNSATioN & PRodUCTioN SURVeY – 2016 7
It’s not the scope of this article to go into the reasons for these differences (although it should be noted that full-time female cardiologists also earn less than their male counterparts); rather to point out the need to consider the gender mix for planning purposes.
Workforce Planning OverviewFirst and foremost, the workforce planning process should focus on driving organizational objectives; more specifically, the cardiovascular objectives or strategy and, when integrated, how that strategy fits into the broader organizational strategy. If you don’t have organizational objectives, get them. Otherwise, you’re simply rearranging deck chairs. You know the rest.
Although we don’t know exactly what the new value economy will look like, we do know it will push our workforce in several key ways. First, we’re being asked to take care of populations—even before they get sick—instead of just the acutely ill. Second, we’re being judged not only on our volumes (the old currency), but also on outcomes, service and cost. This Triple Aim will have major ramifications on how we staff, when compared to years gone by. The old paradigm of a physician and a patient in a one-to-one relationship simply won’t work—and even if it could, it’s too expensive for anyone to afford. Part of this service focus is around access, not just for in-person office visits, but beyond the office. Third, the value economy is pushing deeper sub-specialization in cardiology, which will also impact who and what we look for in the future.
Given all this, our workforce development needs to consider the entire clinical team (care team), not simply focus on the physicians. This includes advanced practice providers (nPs, PAs), nurses and medical assistants. Gone are the days when our planning is as simple as “We’re too busy, let’s recruit a physician,” or “dr. Jones just left/retired, let’s recruit a physician in the same sub-specialty.” In today’s environment, we must take a more analyzed and forward-thinking approach to workforce planning.
WoRkFoRCe plAnning

MedAxioM CARdioVASCULAR PRoVideR CoMPeNSATioN & PRodUCTioN SURVeY – 2016 8
Workforce AssessmentsThe first step in any workforce assessment, whether related to providers or any other employees in the organization, is a review of the mission and/or vision statement. Why does our organization exist and what are we trying to achieve? Our workforce then should be engineered to drive this vision. Absent this overarching goal, we’re simply reacting to what happens to us and letting the outside environment create a plan. never a good idea.
In addition, most organizations (regardless of ownership model) create a strategic plan around their vision, with very specific tactics defined to guide the enterprise during the next two to five years. If you are part of a larger, integrated entity, then I hope this plan boils down specifically to the cardiovascular service line to provide granular focus. If such a detailed strategy plan does not exist, I strongly encourage you get one. Our workforce plans should be consciously designed around achieving these longer-term objectives.
For instance, if there’s a particular area within your primary or secondary services that has been identified as a significant potential growth opportunity, you will need to understand the staffing impact that going after this market will require.
understand and Agree on Expectations for WorkThis may seem simple on the surface, but it actually has many different layers of complexity. Work is very specific to each group’s culture and values, so expectations need to be established internally. let’s examine some of the more significant components of work.
Probably the most obvious and often wrangled-with area of work assessment is around individual productivity. This can be measured by wRVus, patient encounters, time value units, or myriad other methodologies. Some groups reconcile work differences with their compensation distribution, however, for planning purposes, we need to have a handle on what can be expected from each provider. That will drive some of the quantitative measures discussed below.
For instance, if a group determines that work is appropriately measured by wRVus, what is our expectation for production? Is it less than the median, the median, or 75th percentile? If the measurement is encounters, do we have the same expectations across all sub-specialties? Answering these questions formally provides key performance expectations that are invaluable when forecasting workforce needs.
In today’s value-oriented reimbursement economy, many groups are wrestling with the question of sub-specialization. Who should be doing what? This question may be asked in response to a perceived or real skill gap, or in response to market forces.
Workforce planning should drive organizational objectives.
no single data point will give you the answers, so look at multiple levels and vet with a broad constituent base.
Population management is coming with an unknown bolus of patients (the non-acute), so when planning, consider not only the volumes of today, but those of tomorrow.
When performing workforce planning, consider the entire care team, not just the physicians or even providers.
The aging workforce and its impact on production and call participation are real and have to be dealt with, hopefully in advance of a crisis.
Workforce Planning Reminders
WoRkFoRCe plAnning
MedAxioM CARdioVASCULAR PRoVideR CoMPeNSATioN & PRodUCTioN SURVeY – 2016 9
For instance, heart failure has become a major focus for cardiology practices, driven, in part, by substantial reimbursement risk. When looking at workforce needs, we need to understand whether our program will be moving to deeper sub-specialization, such as automated referrals for heart failure patients to a standardized heart failure clinic. This migration would not only impact our physician needs, but also our recruitment and development of Advanced Practice Providers (APPs) and other care team members.
likewise, in an effort to promote efficiency and consolidate volumes, some programs are moving to have all invasive procedures performed by interventional physicians. This, too, has an impact on physician needs, but also impacts another important qualitative area: call coverage. As part of the planning process, groups need to define the minimum requirements necessary for appropriate night and weekend call coverage, both from an interventional (STEMI) and general perspective. Included in this conversation is not just what the clinic needs are, but what physician expectations are for call frequency, from a lifestyle and sustainability viewpoint.
If You don’t Know, AskGiven the impact age distribution can have on work, it is important to understand your own internal demographics. Creating an age distribution and work comparison grid will be covered in Part 3 of my blog (on quantitative measures). For qualitative measures, it’s important to understand our provider’s future plans. Who plans to cut back or retire in the near future?
WoRkFoRCe plAnning
Below are a few major questions to consider when creating a physician slow-down path. (For simplicity, I’ll include cutbacks from call and/or clinical duties in these discussions.)
1. Will the option for slow-down be available to all physicians, or only to those who meet certain requirements? For instance, many groups include a “seniority” provision, where slow-down is only available to those who have provided some minimum years of service to the group, or where age plus group seniority has to exceed a certain threshold. My former group, for instance, had a “Rule of 70” in which age plus years of service had to exceed 70, before a physician was even eligible to request a slow-down.
2. is there a maximum number of physicians who can be in slow-down mode? This metric is obviously very dependent on group size and will change over time, so it needs some vigilance from leadership; however, allowing one or two physicians to cut back may be absorbable by a median-sized group. That policy suddenly becomes untenable, though, if the number swells. Putting limits in place prospectively can avert a lot of group tension.
3. How long can a physician remain in slow-down mode? Putting limits on the amount of time a physician can be in part-time status is often overlooked by groups—and is very related to item two above. If we allow physicians to have reduced schedules indefinitely, it can impede our ability to appropriately recruit and will constipate other physicians’ ability to cut back as they reach eligibility. From conversations on the MedAxiom listserv related to this topic, it appears the “sweet spot” for this limit is two years. After two years, many groups provide themselves the option to discontinue allowing a reduced schedule. In other words, the physician either returns to full-time status (often including call), or must retire completely.
4. How will slow-down impact compensation? There are two major buckets with respect to compensation discussions: clinical duties and call. In most groups, call is multi-faceted, with interventional duties (including STEMI coverage) and general call. Weeknights and weekends, too, are often segregated. Although there is no right answer for the value of call—this is a very group-centric calculation—data from the MedAxiom listserv shows that an aggregate call is valued at 20 to 50 percent of total cardiology compensation within our membership. Additionally, most groups remove physicians who have entered an abbreviated clinical schedule from the normal distribution plan and put them on a compensation plan unique to their particular arrangement. This is sometimes a fixed salary, a straightforward “per wRVu” plan, shift-based, or myriad other arrangements. The key is to have a prospective understanding of the economic impact of a reduced schedule.
MedAxioM CARdioVASCULAR PRoVideR CoMPeNSATioN & PRodUCTioN SURVeY – 2016 10
The easiest way to find out this information is simply to ask. For larger groups, this can be accomplished through anonymous polls or surveys. For smaller groups, it can be accomplished through interviews. Although the results of these assessments are never exact (not because providers aren’t truthful, but because personal plans may not be solid), they do provide directional data that’s useful for longer-term needs.
Call and Physician Slow-downAt each of its annual meetings, MedAxiom hosts a physician breakfast each morning prior to the start of the agenda. This is a forum for doctors to get together and candidly discuss items specific to their profession. Every year, physician slow-down becomes a dominant theme.
It’s not a big surprise, given the age distribution and how much pressure slow-down can have on a group. For instance, in a group of 15 (our median-sized practice), if two physicians come off call, but continue to carry full-time day schedules, this can push a huge call burden to the remaining doctors. At the same time, there’s not enough daytime work to justify recruiting, unless everyone’s comfortable with the corresponding pay cuts. Further, who tend to be the first physicians to request reduced schedules? Our founders. This gets into all sorts of dialogue on sweat equity, loyalty, intangible value, etc. Get the tension?
Given this, as part of the planning process, groups are strongly encouraged to have formal slow-down plans. The worst time to create these plans is after someone has made a request to cut back or come off call. At that point, it inevitably becomes a more personal discussion, rather than a philosophical one. Regardless of timing, however, it’s important that a formal process is in place. Even the most thoughtful policies will be challenged by real life, so build some flexibility into your rules.
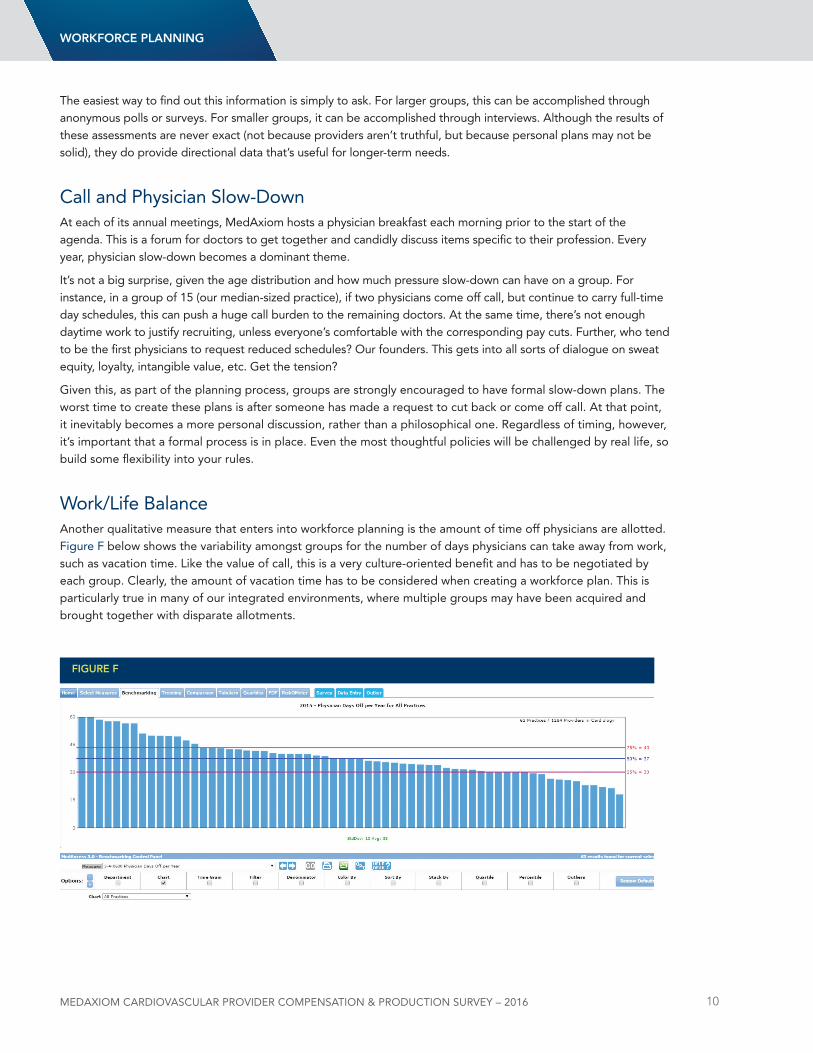
Work/life BalanceAnother qualitative measure that enters into workforce planning is the amount of time off physicians are allotted. Figure F below shows the variability amongst groups for the number of days physicians can take away from work, such as vacation time. like the value of call, this is a very culture-oriented benefit and has to be negotiated by each group. Clearly, the amount of vacation time has to be considered when creating a workforce plan. This is particularly true in many of our integrated environments, where multiple groups may have been acquired and brought together with disparate allotments.
FigURe F
WoRkFoRCe plAnning
MedAxioM CARdioVASCULAR PRoVideR CoMPeNSATioN & PRodUCTioN SURVeY – 2016 11
Quantitative MetricsWorkforce planning requires a review of both qualitative measures (culture, expectations, future plans, strategy, etc.) and quantitative metrics. This latter group includes specific data we can generate around demand, capacity, role needs and future projections that will impact our workforce.
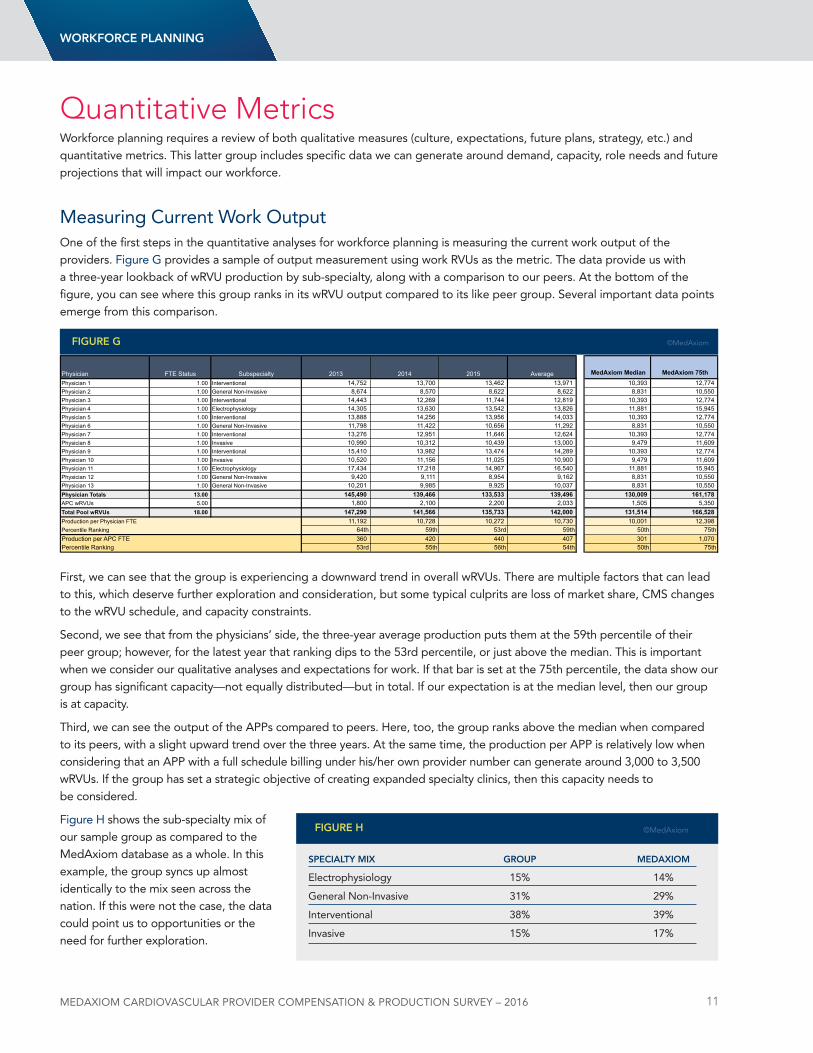
Measuring Current Work OutputOne of the first steps in the quantitative analyses for workforce planning is measuring the current work output of the providers. Figure G provides a sample of output measurement using work RVus as the metric. The data provide us with a three-year lookback of wRVu production by sub-specialty, along with a comparison to our peers. At the bottom of the figure, you can see where this group ranks in its wRVu output compared to its like peer group. Several important data points emerge from this comparison.
First, we can see that the group is experiencing a downward trend in overall wRVus. There are multiple factors that can lead to this, which deserve further exploration and consideration, but some typical culprits are loss of market share, CMS changes to the wRVu schedule, and capacity constraints.
Second, we see that from the physicians’ side, the three-year average production puts them at the 59th percentile of their peer group; however, for the latest year that ranking dips to the 53rd percentile, or just above the median. This is important when we consider our qualitative analyses and expectations for work. If that bar is set at the 75th percentile, the data show our group has significant capacity—not equally distributed—but in total. If our expectation is at the median level, then our group is at capacity.
Third, we can see the output of the APPs compared to peers. Here, too, the group ranks above the median when compared to its peers, with a slight upward trend over the three years. At the same time, the production per APP is relatively low when considering that an APP with a full schedule billing under his/her own provider number can generate around 3,000 to 3,500 wRVus. If the group has set a strategic objective of creating expanded specialty clinics, then this capacity needs to be considered.
Figure H shows the sub-specialty mix of our sample group as compared to the MedAxiom database as a whole. In this example, the group syncs up almost identically to the mix seen across the nation. If this were not the case, the data could point us to opportunities or the need for further exploration.
Physician FTE Status Subspecialty 2013 2014 2015 Average MedAxiom Median MedAxiom 75th Physician 1 1.00 Interventional 14,752 13,700 13,462 13,971 10,393 12,774 Physician 2 1.00 General Non-Invasive 8,674 8,570 8,622 8,622 8,831 10,550 Physician 3 1.00 Interventional 14,443 12,269 11,744 12,819 10,393 12,774 Physician 4 1.00 Electrophysiology 14,305 13,630 13,542 13,826 11,881 15,945 Physician 5 1.00 Interventional 13,888 14,256 13,956 14,033 10,393 12,774 Physician 6 1.00 General Non-Invasive 11,798 11,422 10,656 11,292 8,831 10,550 Physician 7 1.00 Interventional 13,276 12,951 11,646 12,624 10,393 12,774 Physician 8 1.00 Invasive 10,990 10,312 10,439 13,000 9,479 11,609 Physician 9 1.00 Interventional 15,410 13,982 13,474 14,289 10,393 12,774 Physician 10 1.00 Invasive 10,520 11,156 11,025 10,900 9,479 11,609 Physician 11 1.00 Electrophysiology 17,434 17,218 14,967 16,540 11,881 15,945 Physician 12 1.00 General Non-Invasive 9,420 9,111 8,954 9,162 8,831 10,550 Physician 13 1.00 General Non-Invasive 10,201 9,985 9,925 10,037 8,831 10,550 Physician Totals 13.00 145,490 139,466 133,533 139,496 130,009 161,178 APC wRVUs 5.00 1,800 2,100 2,200 2,033 1,505 5,350 Total Pool wRVUs 18.00 147,290 141,566 135,733 142,000 131,514 166,528 Production per Physician FTE 11,192 10,728 10,272 10,730 10,001 12,398 Percentile Ranking 64th 59th 53rd 59th 50th 75thProduction per APC FTE 360 420 440 407 301 1,070 Percentile Ranking 53rd 55th 56th 54th 50th 75th
FigURe g ©MedAxiom
WoRkFoRCe plAnning
speCiAltY MiX gRoUp MeDAXioM
Electrophysiology 15% 14%
General non-Invasive 31% 29%
Interventional 38% 39%
Invasive 15% 17%
FigURe H ©MedAxiom
MedAxioM CARdioVASCULAR PRoVideR CoMPeNSATioN & PRodUCTioN SURVeY – 2016 12
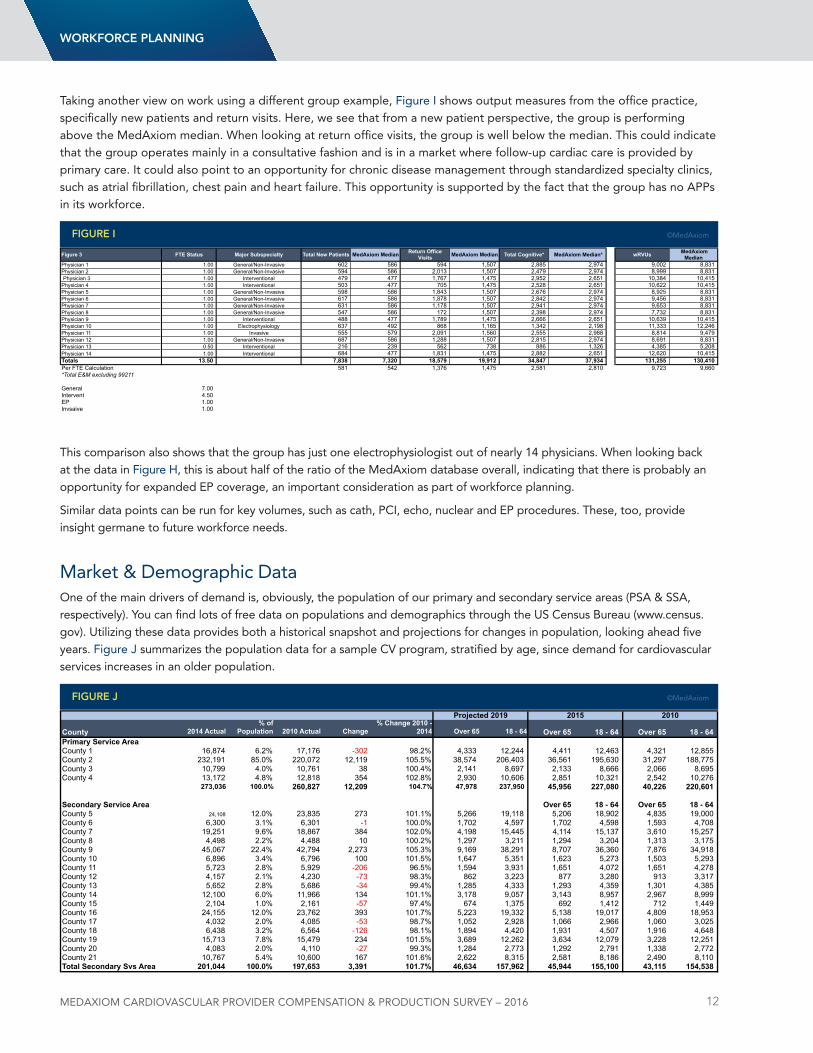
Taking another view on work using a different group example, Figure I shows output measures from the office practice, specifically new patients and return visits. Here, we see that from a new patient perspective, the group is performing above the MedAxiom median. When looking at return office visits, the group is well below the median. This could indicate that the group operates mainly in a consultative fashion and is in a market where follow-up cardiac care is provided by primary care. It could also point to an opportunity for chronic disease management through standardized specialty clinics, such as atrial fibrillation, chest pain and heart failure. This opportunity is supported by the fact that the group has no APPs in its workforce.
This comparison also shows that the group has just one electrophysiologist out of nearly 14 physicians. When looking back at the data in Figure H, this is about half of the ratio of the MedAxiom database overall, indicating that there is probably an opportunity for expanded EP coverage, an important consideration as part of workforce planning.
Similar data points can be run for key volumes, such as cath, PCI, echo, nuclear and EP procedures. These, too, provide insight germane to future workforce needs.
Market & demographic dataOne of the main drivers of demand is, obviously, the population of our primary and secondary service areas (PSA & SSA, respectively). You can find lots of free data on populations and demographics through the uS Census Bureau (www.census.gov). utilizing these data provides both a historical snapshot and projections for changes in population, looking ahead five years. Figure J summarizes the population data for a sample CV program, stratified by age, since demand for cardiovascular services increases in an older population.
WoRkFoRCe plAnning
Figure 3 FTE Status Major Subspecialty Total New Patients MedAxiom Median Return Office Visits MedAxiom Median Total Cognitive* MedAxiom Median* wRVUs MedAxiom
Median Physician 1 1.00 General/Non-Invasive 602 586 594 1,507 2,885 2,974 9,002 8,831 Physician 2 1.00 General/Non-Invasive 594 586 2,013 1,507 2,479 2,974 8,999 8,831 Physician 3 1.00 Interventional 479 477 1,767 1,475 2,952 2,651 10,384 10,415
Physician 4 1.00 Interventional 503 477 705 1,475 2,528 2,651 10,622 10,415 Physician 5 1.00 General/Non-Invasive 598 586 1,843 1,507 2,676 2,974 8,925 8,831 Physician 6 1.00 General/Non-Invasive 617 586 1,878 1,507 2,842 2,974 9,456 8,831 Physician 7 1.00 General/Non-Invasive 631 586 1,178 1,507 2,941 2,974 9,653 8,831 Physician 8 1.00 General/Non-Invasive 547 586 172 1,507 2,398 2,974 7,732 8,831 Physician 9 1.00 Interventional 488 477 1,789 1,475 2,666 2,651 10,639 10,415 Physician 10 1.00 Electrophysiology 637 492 868 1,165 1,342 2,198 11,333 12,246 Physician 11 1.00 Invasive 555 579 2,091 1,560 2,555 2,988 8,814 9,479 Physician 12 1.00 General/Non-Invasive 687 586 1,288 1,507 2,815 2,974 8,691 8,831 Physician 13 0.50 Interventional 216 239 562 738 886 1,326 4,385 5,208 Physician 14 1.00 Interventional 684 477 1,831 1,475 2,882 2,651 12,620 10,415 Totals 13.50 7,838 7,320 18,579 19,912 34,847 37,934 131,255 130,410 Per FTE Calculation 581 542 1,376 1,475 2,581 2,810 9,723 9,660 *Total E&M excluding 99211
General 7.00 Intervent 4.50 EP 1.00 Invsaive 1.00
FigURe i ©MedAxiom
County 2014 Actual% of
Population 2010 Actual Change% Change 2010 -
2014 Over 65 18 - 64 Over 65 18 - 64 Over 65 18 - 64Primary Service AreaCounty 1 16,874 6.2% 17,176 -302 98.2% 4,333 12,244 4,411 12,463 4,321 12,855 County 2 232,191 85.0% 220,072 12,119 105.5% 38,574 206,403 36,561 195,630 31,297 188,775 County 3 10,799 4.0% 10,761 38 100.4% 2,141 8,697 2,133 8,666 2,066 8,695 County 4 13,172 4.8% 12,818 354 102.8% 2,930 10,606 2,851 10,321 2,542 10,276
273,036 100.0% 260,827 12,209 104.7% 47,978 237,950 45,956 227,080 40,226 220,601
Secondary Service Area Over 65 18 - 64 Over 65 18 - 64County 5 24,108 12.0% 23,835 273 101.1% 5,266 19,118 5,206 18,902 4,835 19,000 County 6 6,300 3.1% 6,301 -1 100.0% 1,702 4,597 1,702 4,598 1,593 4,708 County 7 19,251 9.6% 18,867 384 102.0% 4,198 15,445 4,114 15,137 3,610 15,257 County 8 4,498 2.2% 4,488 10 100.2% 1,297 3,211 1,294 3,204 1,313 3,175 County 9 45,067 22.4% 42,794 2,273 105.3% 9,169 38,291 8,707 36,360 7,876 34,918 County 10 6,896 3.4% 6,796 100 101.5% 1,647 5,351 1,623 5,273 1,503 5,293 County 11 5,723 2.8% 5,929 -206 96.5% 1,594 3,931 1,651 4,072 1,651 4,278 County 12 4,157 2.1% 4,230 -73 98.3% 862 3,223 877 3,280 913 3,317 County 13 5,652 2.8% 5,686 -34 99.4% 1,285 4,333 1,293 4,359 1,301 4,385 County 14 12,100 6.0% 11,966 134 101.1% 3,178 9,057 3,143 8,957 2,967 8,999 County 15 2,104 1.0% 2,161 -57 97.4% 674 1,375 692 1,412 712 1,449 County 16 24,155 12.0% 23,762 393 101.7% 5,223 19,332 5,138 19,017 4,809 18,953 County 17 4,032 2.0% 4,085 -53 98.7% 1,052 2,928 1,066 2,966 1,060 3,025 County 18 6,438 3.2% 6,564 -126 98.1% 1,894 4,420 1,931 4,507 1,916 4,648 County 19 15,713 7.8% 15,479 234 101.5% 3,689 12,262 3,634 12,079 3,228 12,251 County 20 4,083 2.0% 4,110 -27 99.3% 1,284 2,773 1,292 2,791 1,338 2,772 County 21 10,767 5.4% 10,600 167 101.6% 2,622 8,315 2,581 8,186 2,490 8,110 Total Secondary Svs Area 201,044 100.0% 197,653 3,391 101.7% 46,634 157,962 45,944 155,100 43,115 154,538
Projected 2019 2015 2010
FigURe J ©MedAxiom
MedAxioM CARdioVASCULAR PRoVideR CoMPeNSATioN & PRodUCTioN SURVeY – 2016 13
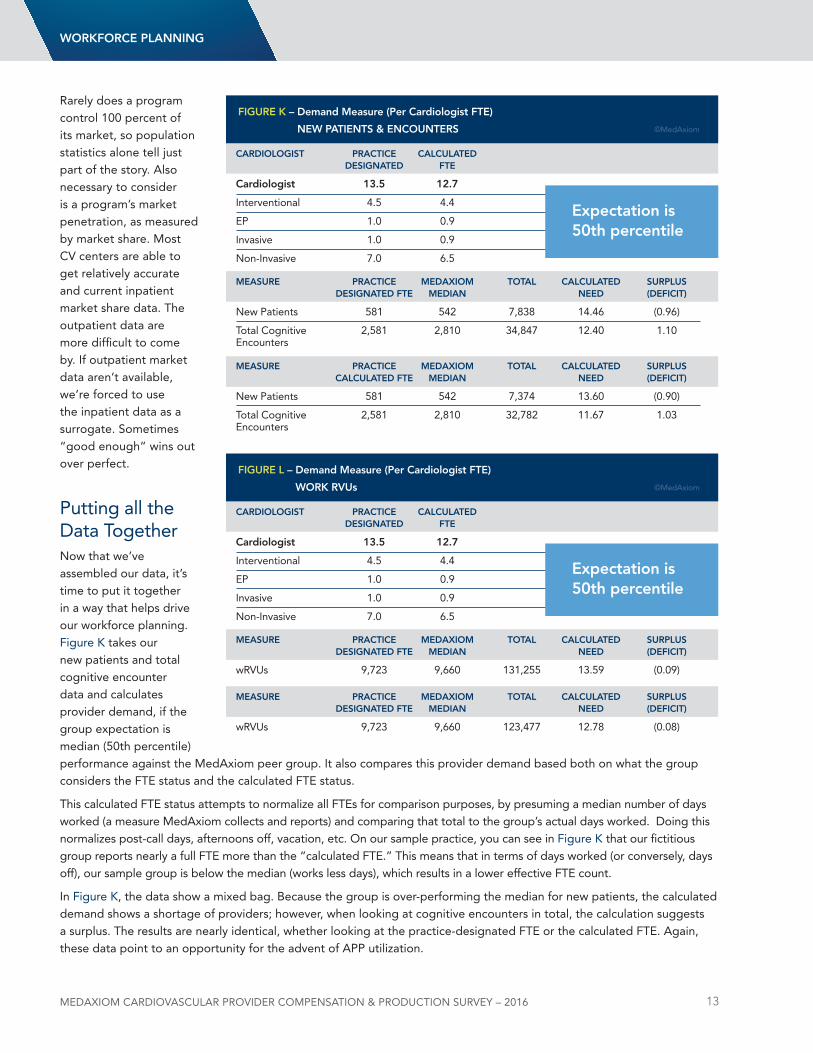
Rarely does a program control 100 percent of its market, so population statistics alone tell just part of the story. Also necessary to consider is a program’s market penetration, as measured by market share. Most CV centers are able to get relatively accurate and current inpatient market share data. The outpatient data are more difficult to come by. If outpatient market data aren’t available, we’re forced to use the inpatient data as a surrogate. Sometimes “good enough” wins out over perfect.
Putting all the data Togethernow that we’ve assembled our data, it’s time to put it together in a way that helps drive our workforce planning. Figure K takes our new patients and total cognitive encounter data and calculates provider demand, if the group expectation is median (50th percentile) performance against the MedAxiom peer group. It also compares this provider demand based both on what the group considers the FTE status and the calculated FTE status.
This calculated FTE status attempts to normalize all FTEs for comparison purposes, by presuming a median number of days worked (a measure MedAxiom collects and reports) and comparing that total to the group’s actual days worked. doing this normalizes post-call days, afternoons off, vacation, etc. On our sample practice, you can see in Figure K that our fictitious group reports nearly a full FTE more than the “calculated FTE.” This means that in terms of days worked (or conversely, days off), our sample group is below the median (works less days), which results in a lower effective FTE count.
In Figure K, the data show a mixed bag. Because the group is over-performing the median for new patients, the calculated demand shows a shortage of providers; however, when looking at cognitive encounters in total, the calculation suggests a surplus. The results are nearly identical, whether looking at the practice-designated FTE or the calculated FTE. Again, these data point to an opportunity for the advent of APP utilization.
CARDiologist pRACtiCe CAlCUlAteD DesignAteD Fte
Cardiologist 13.5 12.7
Interventional 4.5 4.4
EP 1.0 0.9
Invasive 1.0 0.9
non-Invasive 7.0 6.5
MeAsURe pRACtiCe MeDAXioM totAl CAlCUlAteD sURplUs DesignAteD Fte MeDiAn neeD (DeFiCit)
new Patients 581 542 7,838 14.46 (0.96)
Total Cognitive 2,581 2,810 34,847 12.40 1.10Encounters
MeAsURe pRACtiCe MeDAXioM totAl CAlCUlAteD sURplUs CAlCUlAteD Fte MeDiAn neeD (DeFiCit)
new Patients 581 542 7,374 13.60 (0.90)
Total Cognitive 2,581 2,810 32,782 11.67 1.03Encounters
FigURe k – Demand Measure (per Cardiologist Fte)
neW pAtients & enCoUnteRs ©MedAxiom
expectation is 50th percentile
WoRkFoRCe plAnning
CARDiologist pRACtiCe CAlCUlAteD DesignAteD Fte
Cardiologist 13.5 12.7
Interventional 4.5 4.4
EP 1.0 0.9
Invasive 1.0 0.9
non-Invasive 7.0 6.5
MeAsURe pRACtiCe MeDAXioM totAl CAlCUlAteD sURplUs DesignAteD Fte MeDiAn neeD (DeFiCit)
wRVus 9,723 9,660 131,255 13.59 (0.09)
MeAsURe pRACtiCe MeDAXioM totAl CAlCUlAteD sURplUs DesignAteD Fte MeDiAn neeD (DeFiCit)
wRVus 9,723 9,660 123,477 12.78 (0.08)
FigURe l – Demand Measure (per Cardiologist Fte)
WoRk RVUs ©MedAxiom
expectation is 50th percentile
MedAxioM CARdioVASCULAR PRoVideR CoMPeNSATioN & PRodUCTioN SURVeY – 2016 14
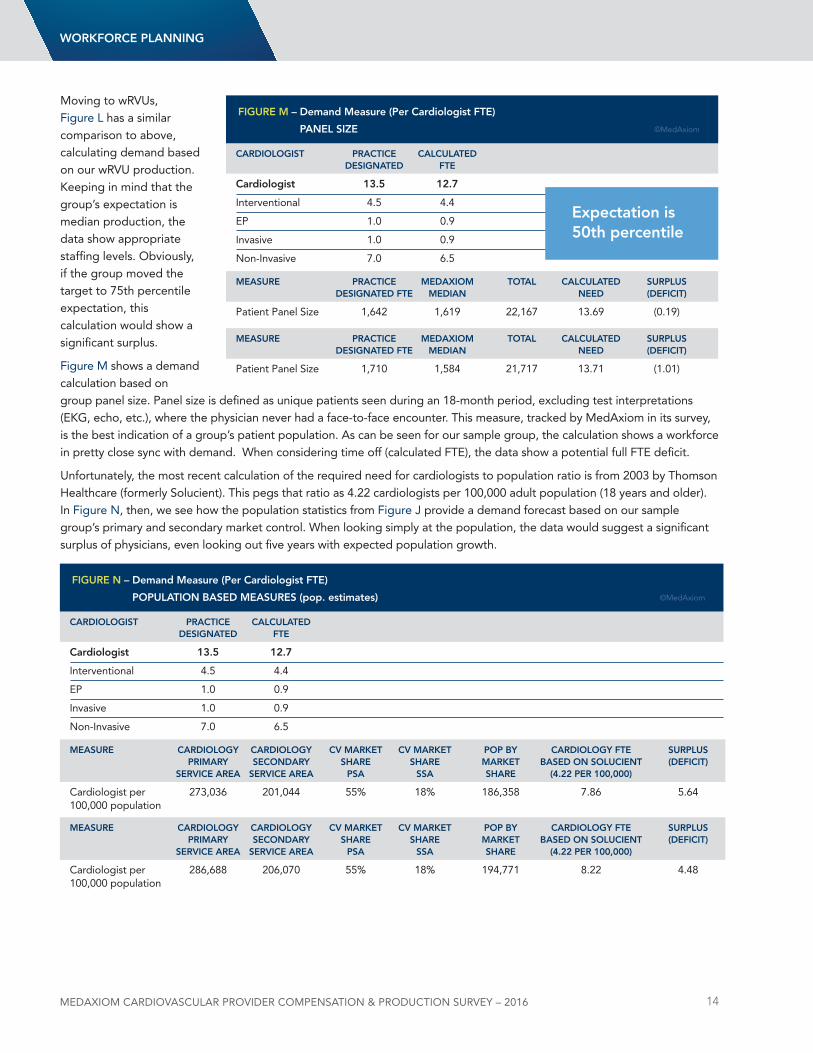
Moving to wRVus, Figure l has a similar comparison to above, calculating demand based on our wRVu production. Keeping in mind that the group’s expectation is median production, the data show appropriate staffing levels. Obviously, if the group moved the target to 75th percentile expectation, this calculation would show a significant surplus.
Figure M shows a demand calculation based on group panel size. Panel size is defined as unique patients seen during an 18-month period, excluding test interpretations (EKG, echo, etc.), where the physician never had a face-to-face encounter. This measure, tracked by MedAxiom in its survey, is the best indication of a group’s patient population. As can be seen for our sample group, the calculation shows a workforce in pretty close sync with demand. When considering time off (calculated FTE), the data show a potential full FTE deficit.
unfortunately, the most recent calculation of the required need for cardiologists to population ratio is from 2003 by Thomson Healthcare (formerly Solucient). This pegs that ratio as 4.22 cardiologists per 100,000 adult population (18 years and older). In Figure n, then, we see how the population statistics from Figure J provide a demand forecast based on our sample group’s primary and secondary market control. When looking simply at the population, the data would suggest a significant surplus of physicians, even looking out five years with expected population growth.
WoRkFoRCe plAnning
CARDiologist pRACtiCe CAlCUlAteD DesignAteD Fte
Cardiologist 13.5 12.7
Interventional 4.5 4.4
EP 1.0 0.9
Invasive 1.0 0.9
non-Invasive 7.0 6.5
MeAsURe pRACtiCe MeDAXioM totAl CAlCUlAteD sURplUs DesignAteD Fte MeDiAn neeD (DeFiCit)
Patient Panel Size 1,642 1,619 22,167 13.69 (0.19)
MeAsURe pRACtiCe MeDAXioM totAl CAlCUlAteD sURplUs DesignAteD Fte MeDiAn neeD (DeFiCit)
Patient Panel Size 1,710 1,584 21,717 13.71 (1.01)
FigURe M – Demand Measure (per Cardiologist Fte)
pAnel siZe ©MedAxiom
expectation is 50th percentile
CARDiologist pRACtiCe CAlCUlAteD DesignAteD Fte
Cardiologist 13.5 12.7
Interventional 4.5 4.4
EP 1.0 0.9
Invasive 1.0 0.9
non-Invasive 7.0 6.5
MeAsURe CARDiologY CARDiologY CV MARket CV MARket pop BY CARDiologY Fte sURplUs pRiMARY seConDARY sHARe sHARe MARket BAseD on solUCient (DeFiCit) seRViCe AReA seRViCe AReA psA ssA sHARe (4.22 peR 100,000)
Cardiologist per 273,036 201,044 55% 18% 186,358 7.86 5.64 100,000 population
MeAsURe CARDiologY CARDiologY CV MARket CV MARket pop BY CARDiologY Fte sURplUs pRiMARY seConDARY sHARe sHARe MARket BAseD on solUCient (DeFiCit) seRViCe AReA seRViCe AReA psA ssA sHARe (4.22 peR 100,000)
Cardiologist per 286,688 206,070 55% 18% 194,771 8.22 4.48 100,000 population
FigURe n – Demand Measure (per Cardiologist Fte)
popUlAtion BAseD MeAsURes (pop. estimates) ©MedAxiom
MedAxioM CARdioVASCULAR PRoVideR CoMPeNSATioN & PRodUCTioN SURVeY – 2016 15
In addition to all the patient demand indicators is the simple calculation of physician roles that need to be filled. Obviously, these roles need to be carefully scrutinized by leadership and must match up with our strategic and organizational objectives; presuming their necessity, these roles need to be considered in our workforce planning. Figure O shows the coverage needs (roles) for our sample group of 14 cardiologists (13.5 FTEs). Here, you can see that in order to fill all the slots, our group has just enough physician workforce to get by. At high demand times, the group will simply have to leave some roles uncovered.
SummaryWith the passage of MACRA and other radical changes to Medicare reimbursement, groups cannot simply focus on volume as part of its workforce planning. Careful attention needs to be given to the new value economy and the impact this transition will have on our care team globally. The entire conversation needs to take place within the context of an organization’s overall strategic plan and its specific objectives.
Given this, it is no longer sufficient to simply consider workforce when a provider leaves or cuts back. We must create a plan that anticipates the future and our desired plan. To do this, we need both qualitative and quantitative data, looking at multiple perspectives and considering the entire care team, not just our physicians. For groups facing imminent physician slow-downs or retirements, it is wise to have a plan in place that spells out the rules for such schedule changes and the economic impact that follows. It is far better to create the plans in advance, so the decisions can be made without the bias of the person asking.
lastly, our future physician workforce will not look or act the same as it has historically. This isn’t bad or good, it just is. The new generation will have different expectations for work capacity, life balance, family responsibilities and professional job duties. This, too, needs to be part of the future plan algorithm—unless the plan is to simply turn out the lights.
WoRkFoRCe plAnning
seRViCe AVeRAge loW HigH
Cath labs 2.5 2.0 3.0
Outreach 4.3 4.0 4.5
Main Office 4.0 3.0 5.0
Testing Supervision 0.5 – 1.0
Vacation/Out 2.5 2.0 3.0
total Ftes 13.8 11.0 16.5
FigURe o ©MedAxiom
Illustrations: lee Sauer
MedAxioM CARdioVASCULAR PRoVideR CoMPeNSATioN & PRodUCTioN SURVeY – 2016 16
MethodologyEach year MedAxiom surveys its membership on financial, staffing, productivity, compensation metrics, and a number of demographic measures such as location, size of practice, ownership model, physician subspecialties, and so on. data is submitted through online data entry and via direct exports from the practice management system.
Member submissions are processed in MedAxiom’s data warehouse and compiled into over 800 measures for member analysis. Members then use MedAxiom’s proprietary Business Intelligence tool, called MedAxcess, to perform many different types of analyses. MedAxiom also extracts its own data to create reports for the membership, partnering organizations, and the public.
The physician compensation and production data provided in this report was collected over the 2008-2015 timeframe. It has also been filtered to only include full-time physicians.
MedAxiom data Integrity: The Vetting Process MedAxiom realized long ago the importance of well-vetted data and how errant information can destroy the value of a data set. With this recognition, MedAxiom now goes above and beyond in its pursuit of data integrity. The fact-checking process begins with an automated comparison of self-reported RVus to those calculated by MedAxiom based on the CPT upload provided by our members. If there is a discrepancy of 1% percent or greater, a more thorough review of the data is triggered. Additionally, data manually entered online immediately shows the operator a trend for comparison to the previous year. This provides an instant review if there are large differences from year to year.
Once data is loaded into our MedAxcess database, some of the critical measures relating to Full Time Equivalent physicians and mid-level providers, as well as some elements of financial information, are verified to make sure that they are in alignment with the statistical norms of the rest of the database. A set of limits defined by a team of cardiology administration experts is the key to this step. All data points are examined against their own same-practice historical trend and against the practice’s peer set to determine if the data point is outside a reasonable range. If a data point is determined to be an outlier, it is excluded from the data set until the practice is contacted and the data point can be verified. Once confirmed or corrected, the data point is allowed back into the data set where it can be viewed by other members in a de-identified fashion.
data verified this way is included in the overall calculations such as percentiles, mean, median, and standard deviation. All submitted data goes through a rigorous process that relies on cross-checking, computer-automated vetting and review by human eyes, with follow-up phone calls and emails to data submitters when there are questionable results.
Having the right measures and high data integrity is what makes MedAxiom’s data the most trusted data in the cardiovascular industry.
2. Overview of the Report
MedAxiom goes above and beyond in its pursuit of data integrity.
oVeRVieW
MedAxioM CARdioVASCULAR PRoVideR CoMPeNSATioN & PRodUCTioN SURVeY – 2016 17
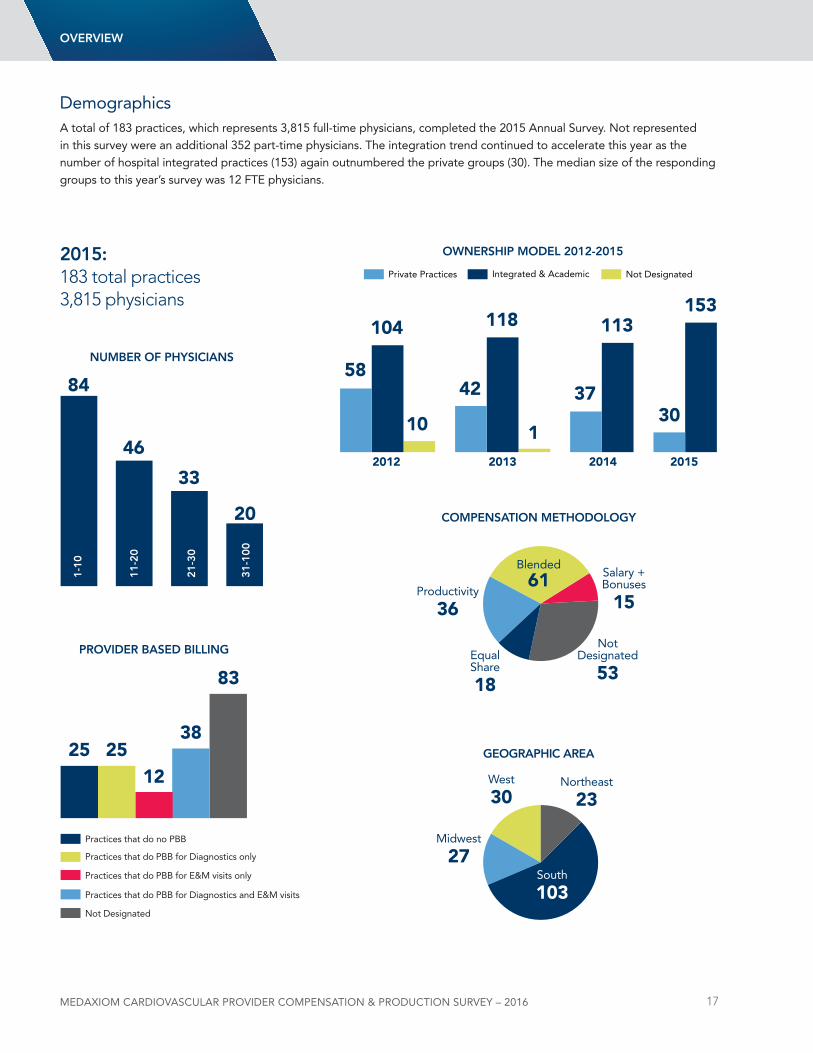
demographicsA total of 183 practices, which represents 3,815 full-time physicians, completed the 2015 Annual Survey. not represented in this survey were an additional 352 part-time physicians. The integration trend continued to accelerate this year as the number of hospital integrated practices (153) again outnumbered the private groups (30). The median size of the responding groups to this year’s survey was 12 FTE physicians.
2015:183 total practices3,815 physicians
nUMBeR oF pHYsiCiAns
pRoViDeR BAseD Billing
84
25 2512
38
83
46
33
20
oWneRsHip MoDel 2012-2015
5842 37
1
104 118 113153
3010
2012 2013 2014 2015
CoMpensAtion MetHoDologY
Blended
61
notdesignated
53
Salary +Bonuses
15Productivity
36
Equal Share
18
geogRApHiC AReA
South
103
northeast
23West
30
Midwest
27
oVeRVieW
MedAxioM CARdioVASCULAR PRoVideR CoMPeNSATioN & PRodUCTioN SURVeY – 2016 18
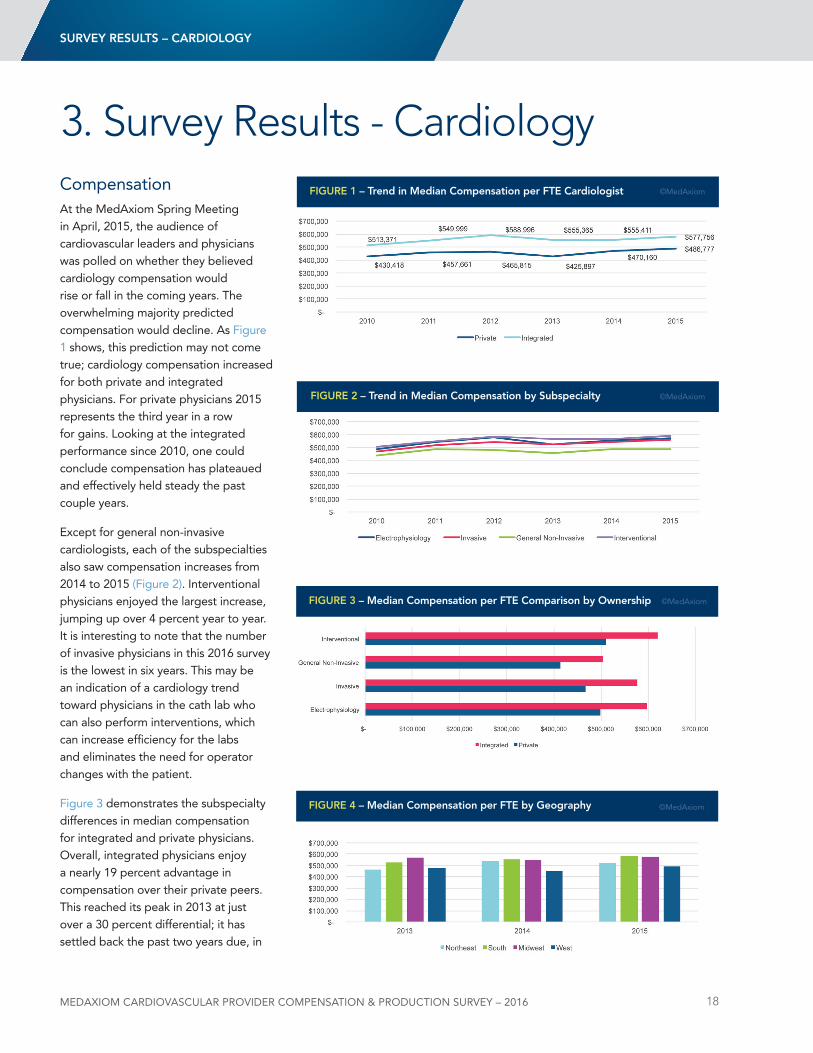
CompensationAt the MedAxiom Spring Meeting in April, 2015, the audience of cardiovascular leaders and physicians was polled on whether they believed cardiology compensation would rise or fall in the coming years. The overwhelming majority predicted compensation would decline. As Figure 1 shows, this prediction may not come true; cardiology compensation increased for both private and integrated physicians. For private physicians 2015 represents the third year in a row for gains. looking at the integrated performance since 2010, one could conclude compensation has plateaued and effectively held steady the past couple years.
Except for general non-invasive cardiologists, each of the subspecialties also saw compensation increases from 2014 to 2015 (Figure 2). Interventional physicians enjoyed the largest increase, jumping up over 4 percent year to year. It is interesting to note that the number of invasive physicians in this 2016 survey is the lowest in six years. This may be an indication of a cardiology trend toward physicians in the cath lab who can also perform interventions, which can increase efficiency for the labs and eliminates the need for operator changes with the patient.
Figure 3 demonstrates the subspecialty differences in median compensation for integrated and private physicians. Overall, integrated physicians enjoy a nearly 19 percent advantage in compensation over their private peers. This reached its peak in 2013 at just over a 30 percent differential; it has settled back the past two years due, in
sURVeY ResUlts – CARDiologY
3. Survey Results - Cardiology
FigURe 2 – trend in Median Compensation by subspecialty ©MedAxiom
FigURe 1 – trend in Median Compensation per Fte Cardiologist ©MedAxiom
FigURe 3 – Median Compensation per Fte Comparison by ownership ©MedAxiom
FigURe 4 – Median Compensation per Fte by geography ©MedAxiom
MedAxioM CARdioVASCULAR PRoVideR CoMPeNSATioN & PRodUCTioN SURVeY – 2016 19
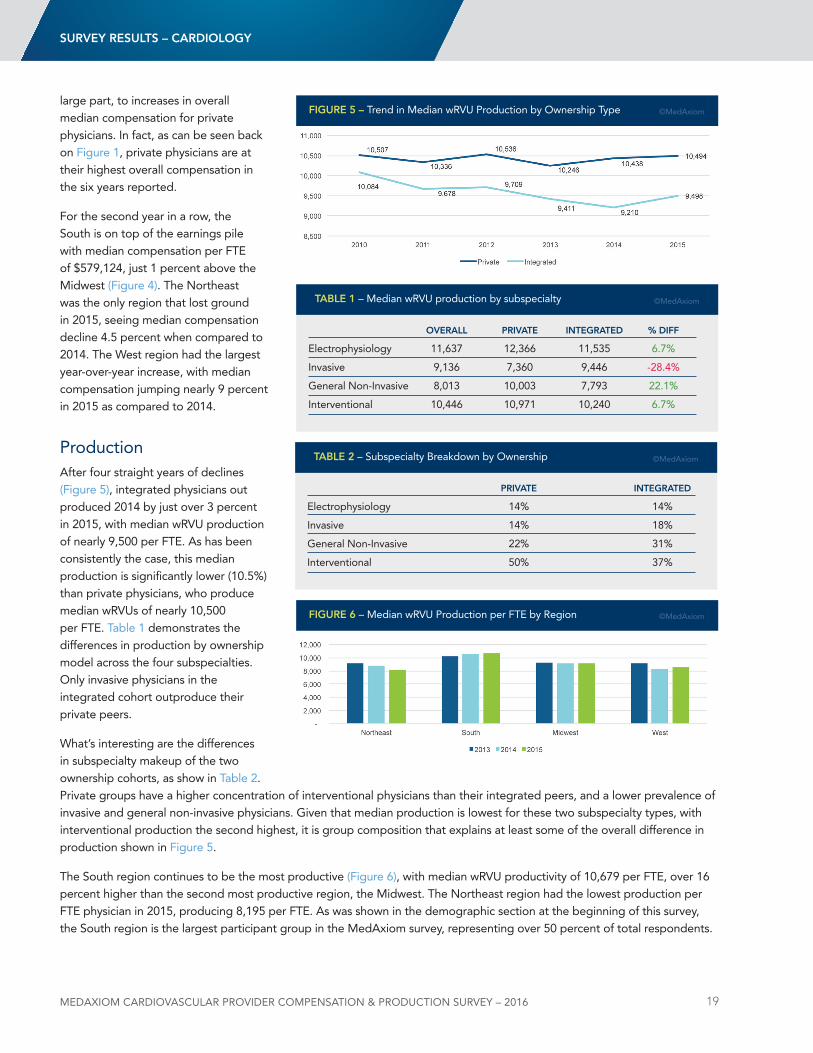
large part, to increases in overall median compensation for private physicians. In fact, as can be seen back on Figure 1, private physicians are at their highest overall compensation in the six years reported.
For the second year in a row, the South is on top of the earnings pile with median compensation per FTE of $579,124, just 1 percent above the Midwest (Figure 4). The northeast was the only region that lost ground in 2015, seeing median compensation decline 4.5 percent when compared to 2014. The West region had the largest year-over-year increase, with median compensation jumping nearly 9 percent in 2015 as compared to 2014.
ProductionAfter four straight years of declines (Figure 5), integrated physicians out produced 2014 by just over 3 percent in 2015, with median wRVu production of nearly 9,500 per FTE. As has been consistently the case, this median production is significantly lower (10.5%) than private physicians, who produce median wRVus of nearly 10,500 per FTE. Table 1 demonstrates the differences in production by ownership model across the four subspecialties. Only invasive physicians in the integrated cohort outproduce their private peers.
What’s interesting are the differences in subspecialty makeup of the two ownership cohorts, as show in Table 2. Private groups have a higher concentration of interventional physicians than their integrated peers, and a lower prevalence of invasive and general non-invasive physicians. Given that median production is lowest for these two subspecialty types, with interventional production the second highest, it is group composition that explains at least some of the overall difference in production shown in Figure 5.
The South region continues to be the most productive (Figure 6), with median wRVu productivity of 10,679 per FTE, over 16 percent higher than the second most productive region, the Midwest. The northeast region had the lowest production per FTE physician in 2015, producing 8,195 per FTE. As was shown in the demographic section at the beginning of this survey, the South region is the largest participant group in the MedAxiom survey, representing over 50 percent of total respondents.
FigURe 5 – Trend in Median wRVu Production by Ownership Type ©MedAxiom
oVeRAll pRiVAte integRAteD % DiFF
Electrophysiology 11,637 12,366 11,535 6.7%
Invasive 9,136 7,360 9,446 -28.4%
General non-Invasive 8,013 10,003 7,793 22.1%
Interventional 10,446 10,971 10,240 6.7%
tABle 1 – Median wRVu production by subspecialty ©MedAxiom
sURVeY ResUlts – CARDiologY
pRiVAte integRAteD
Electrophysiology 14% 14%
Invasive 14% 18%
General non-Invasive 22% 31%
Interventional 50% 37%
tABle 2 – Subspecialty Breakdown by Ownership ©MedAxiom
FigURe 6 – Median wRVu Production per FTE by Region ©MedAxiom
MedAxioM CARdioVASCULAR PRoVideR CoMPeNSATioN & PRodUCTioN SURVeY – 2016 20
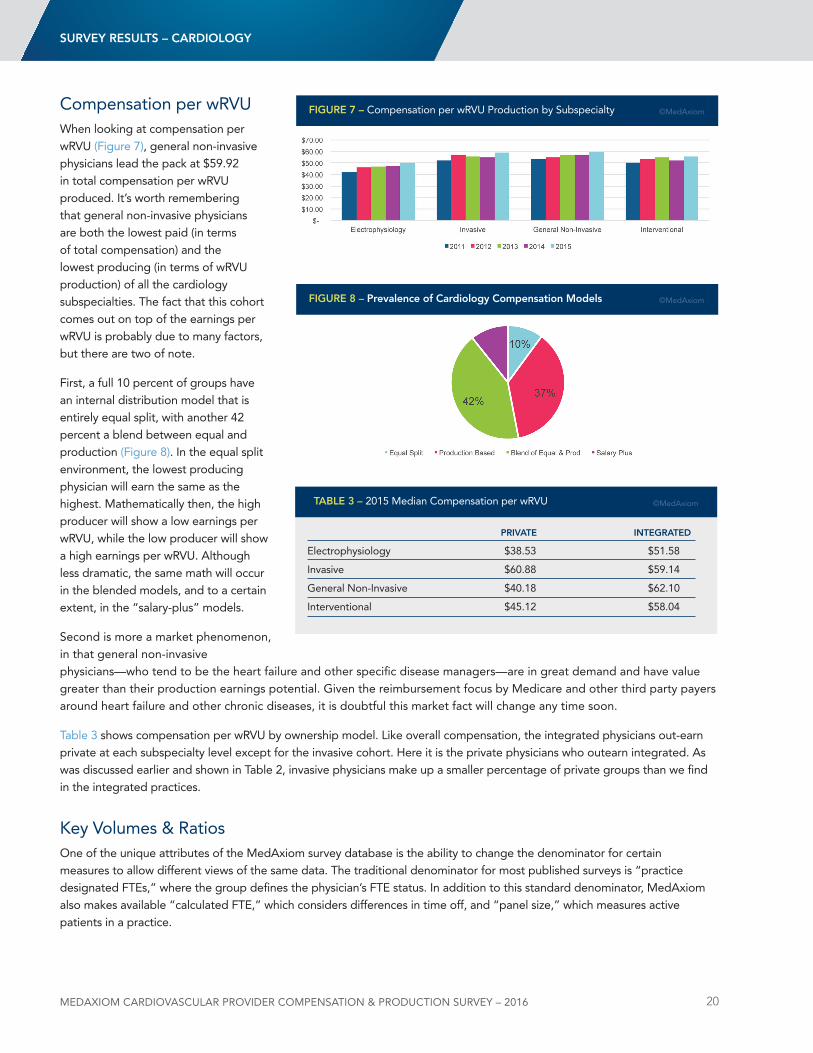
Compensation per wRVuWhen looking at compensation per wRVu (Figure 7), general non-invasive physicians lead the pack at $59.92 in total compensation per wRVu produced. It’s worth remembering that general non-invasive physicians are both the lowest paid (in terms of total compensation) and the lowest producing (in terms of wRVu production) of all the cardiology subspecialties. The fact that this cohort comes out on top of the earnings per wRVu is probably due to many factors, but there are two of note.
First, a full 10 percent of groups have an internal distribution model that is entirely equal split, with another 42 percent a blend between equal and production (Figure 8). In the equal split environment, the lowest producing physician will earn the same as the highest. Mathematically then, the high producer will show a low earnings per wRVu, while the low producer will show a high earnings per wRVu. Although less dramatic, the same math will occur in the blended models, and to a certain extent, in the “salary-plus” models.
Second is more a market phenomenon, in that general non-invasive physicians—who tend to be the heart failure and other specific disease managers—are in great demand and have value greater than their production earnings potential. Given the reimbursement focus by Medicare and other third party payers around heart failure and other chronic diseases, it is doubtful this market fact will change any time soon.
Table 3 shows compensation per wRVu by ownership model. like overall compensation, the integrated physicians out-earn private at each subspecialty level except for the invasive cohort. Here it is the private physicians who outearn integrated. As was discussed earlier and shown in Table 2, invasive physicians make up a smaller percentage of private groups than we find in the integrated practices.
Key Volumes & RatiosOne of the unique attributes of the MedAxiom survey database is the ability to change the denominator for certain measures to allow different views of the same data. The traditional denominator for most published surveys is “practice designated FTEs,” where the group defines the physician’s FTE status. In addition to this standard denominator, MedAxiom also makes available “calculated FTE,” which considers differences in time off, and “panel size,” which measures active patients in a practice.
FigURe 7 – Compensation per wRVu Production by Subspecialty ©MedAxiom
FigURe 8 – prevalence of Cardiology Compensation Models ©MedAxiom
sURVeY ResUlts – CARDiologY
pRiVAte integRAteD
Electrophysiology $38.53 $51.58
Invasive $60.88 $59.14
General non-Invasive $40.18 $62.10
Interventional $45.12 $58.04
tABle 3 – 2015 Median Compensation per wRVu ©MedAxiom
MedAxioM CARdioVASCULAR PRoVideR CoMPeNSATioN & PRodUCTioN SURVeY – 2016 21
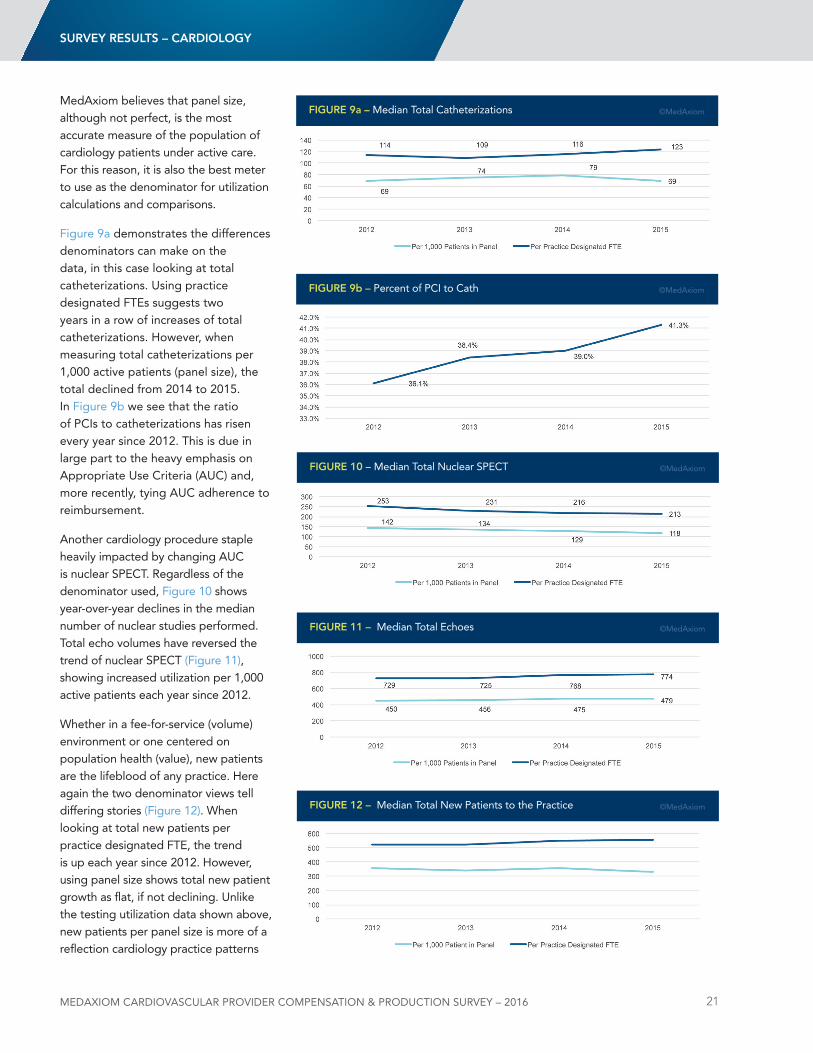
MedAxiom believes that panel size, although not perfect, is the most accurate measure of the population of cardiology patients under active care. For this reason, it is also the best meter to use as the denominator for utilization calculations and comparisons.
Figure 9a demonstrates the differences denominators can make on the data, in this case looking at total catheterizations. using practice designated FTEs suggests two years in a row of increases of total catheterizations. However, when measuring total catheterizations per 1,000 active patients (panel size), the total declined from 2014 to 2015. In Figure 9b we see that the ratio of PCIs to catheterizations has risen every year since 2012. This is due in large part to the heavy emphasis on Appropriate use Criteria (AuC) and, more recently, tying AuC adherence to reimbursement.
Another cardiology procedure staple heavily impacted by changing AuC is nuclear SPECT. Regardless of the denominator used, Figure 10 shows year-over-year declines in the median number of nuclear studies performed. Total echo volumes have reversed the trend of nuclear SPECT (Figure 11), showing increased utilization per 1,000 active patients each year since 2012.
Whether in a fee-for-service (volume) environment or one centered on population health (value), new patients are the lifeblood of any practice. Here again the two denominator views tell differing stories (Figure 12). When looking at total new patients per practice designated FTE, the trend is up each year since 2012. However, using panel size shows total new patient growth as flat, if not declining. unlike the testing utilization data shown above, new patients per panel size is more of a reflection cardiology practice patterns
FigURe 9a – Median Total Catheterizations ©MedAxiom
FigURe 9b – Percent of PCI to Cath ©MedAxiom
sURVeY ResUlts – CARDiologY
FigURe 10 – Median Total nuclear SPECT ©MedAxiom
FigURe 11 – Median Total Echoes ©MedAxiom
FigURe 12 – Median Total new Patients to the Practice ©MedAxiom
MedAxioM CARdioVASCULAR PRoVideR CoMPeNSATioN & PRodUCTioN SURVeY – 2016 22
than the raw number of new patients seen. looking at total new patients per 1,000 active patients is impacted by how frequently a group sees patients back (return visits) or is managing chronic conditions versus sending them back to primary care for such services.
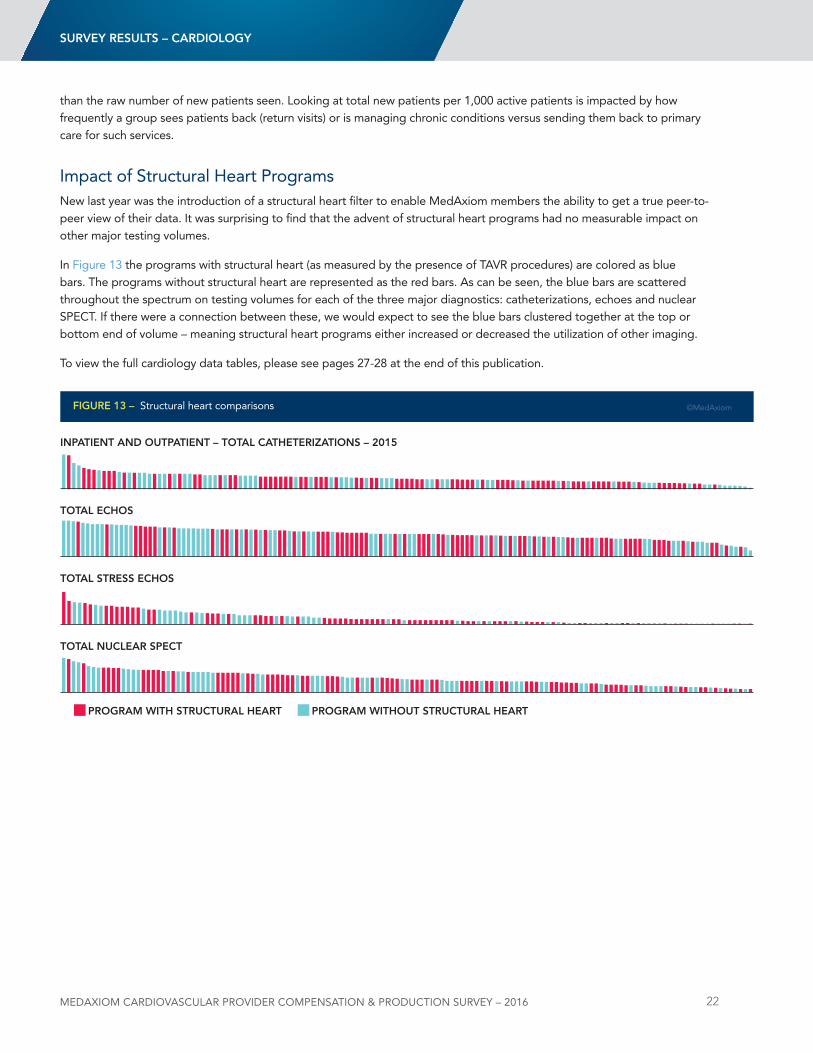
Impact of Structural Heart Programsnew last year was the introduction of a structural heart filter to enable MedAxiom members the ability to get a true peer-to-peer view of their data. It was surprising to find that the advent of structural heart programs had no measurable impact on other major testing volumes.
In Figure 13 the programs with structural heart (as measured by the presence of TAVR procedures) are colored as blue bars. The programs without structural heart are represented as the red bars. As can be seen, the blue bars are scattered throughout the spectrum on testing volumes for each of the three major diagnostics: catheterizations, echoes and nuclear SPECT. If there were a connection between these, we would expect to see the blue bars clustered together at the top or bottom end of volume – meaning structural heart programs either increased or decreased the utilization of other imaging.
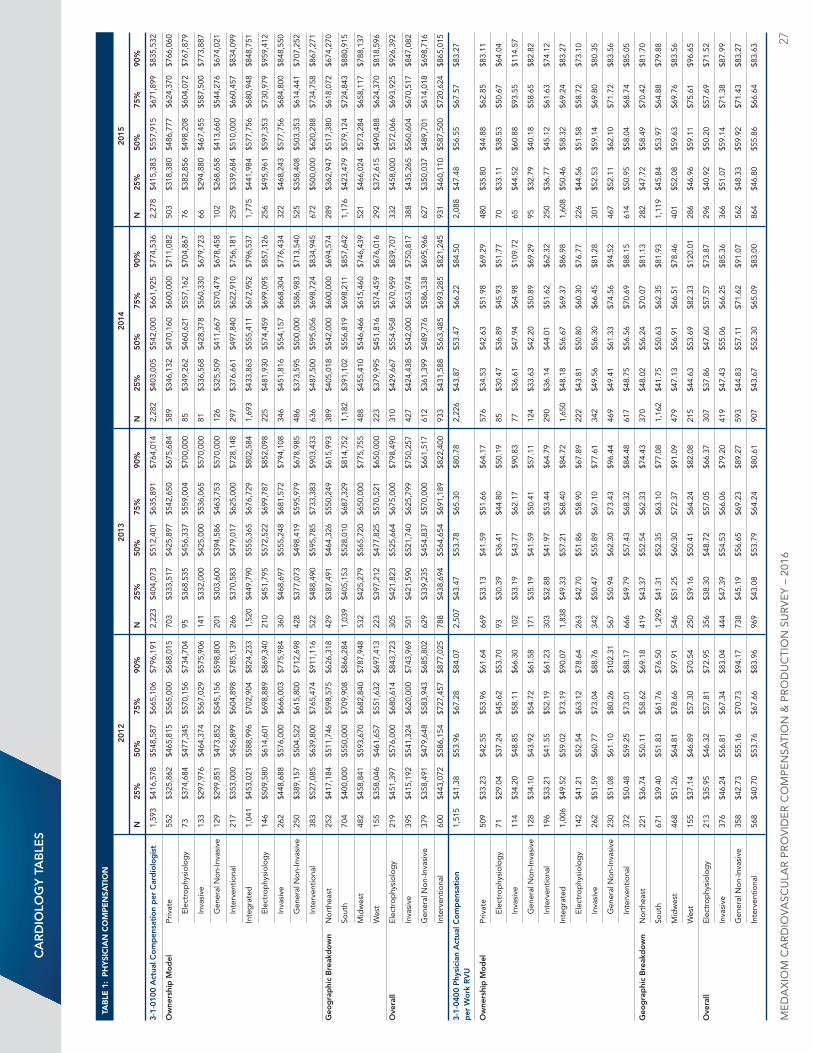
To view the full cardiology data tables, please see pages 27-28 at the end of this publication.
sURVeY ResUlts – CARDiologY
FigURe 13 – Structural heart comparisons ©MedAxiom
MedAxioM CARdioVASCULAR PRoVideR CoMPeNSATioN & PRodUCTioN SURVeY – 2016 23
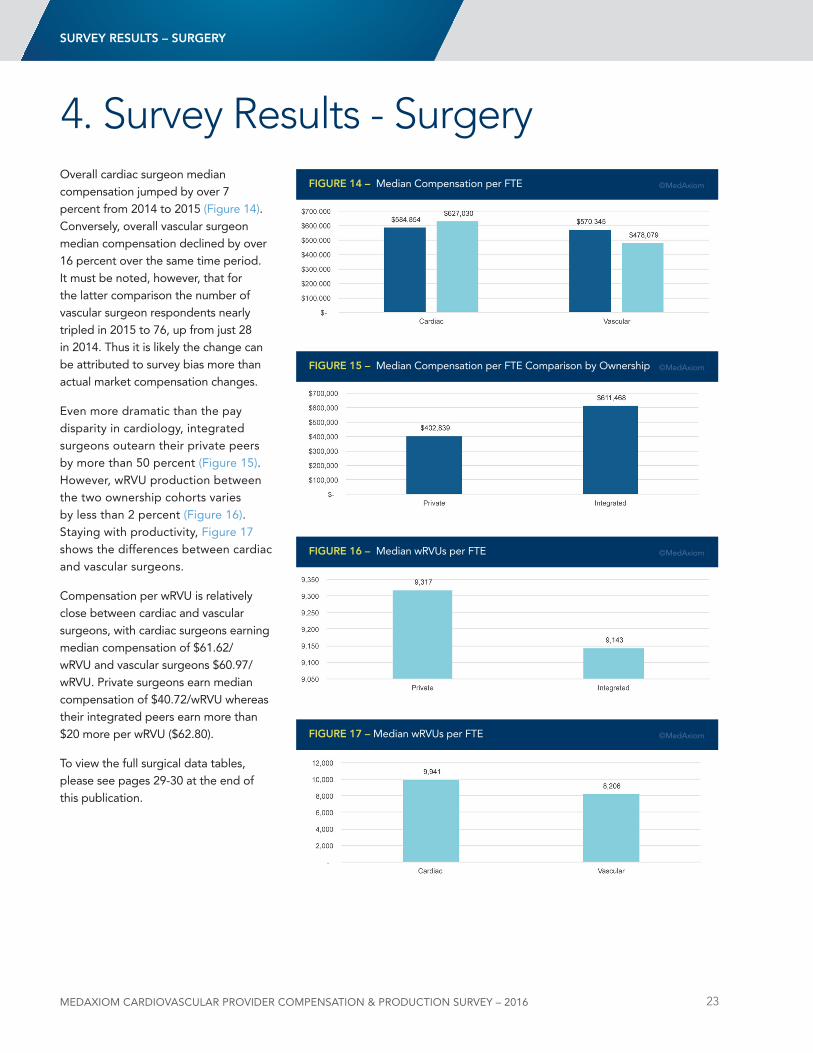
Overall cardiac surgeon median compensation jumped by over 7 percent from 2014 to 2015 (Figure 14). Conversely, overall vascular surgeon median compensation declined by over 16 percent over the same time period. It must be noted, however, that for the latter comparison the number of vascular surgeon respondents nearly tripled in 2015 to 76, up from just 28 in 2014. Thus it is likely the change can be attributed to survey bias more than actual market compensation changes.
Even more dramatic than the pay disparity in cardiology, integrated surgeons outearn their private peers by more than 50 percent (Figure 15). However, wRVu production between the two ownership cohorts varies by less than 2 percent (Figure 16). Staying with productivity, Figure 17 shows the differences between cardiac and vascular surgeons.
Compensation per wRVu is relatively close between cardiac and vascular surgeons, with cardiac surgeons earning median compensation of $61.62/wRVu and vascular surgeons $60.97/wRVu. Private surgeons earn median compensation of $40.72/wRVu whereas their integrated peers earn more than $20 more per wRVu ($62.80).
To view the full surgical data tables, please see pages 29-30 at the end of this publication.
4. Survey Results - SurgeryFigURe 14 – Median Compensation per FTE ©MedAxiom
FigURe 15 – Median Compensation per FTE Comparison by Ownership ©MedAxiom
FigURe 16 – Median wRVus per FTE ©MedAxiom
FigURe 17 – Median wRVus per FTE ©MedAxiom
sURVeY ResUlts – sURgeRY
MedAxioM CARdioVASCULAR PRoVideR CoMPeNSATioN & PRodUCTioN SURVeY – 2016 24
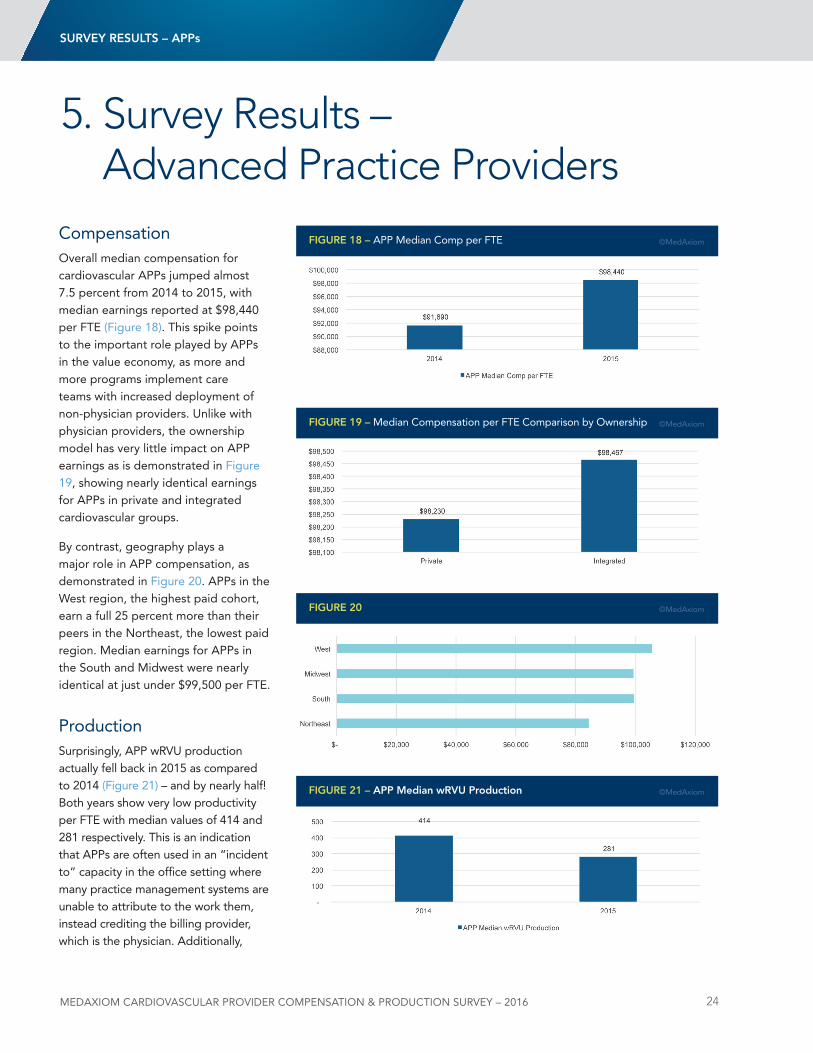
CompensationOverall median compensation for cardiovascular APPs jumped almost 7.5 percent from 2014 to 2015, with median earnings reported at $98,440 per FTE (Figure 18). This spike points to the important role played by APPs in the value economy, as more and more programs implement care teams with increased deployment of non-physician providers. unlike with physician providers, the ownership model has very little impact on APP earnings as is demonstrated in Figure 19, showing nearly identical earnings for APPs in private and integrated cardiovascular groups.
By contrast, geography plays a major role in APP compensation, as demonstrated in Figure 20. APPs in the West region, the highest paid cohort, earn a full 25 percent more than their peers in the northeast, the lowest paid region. Median earnings for APPs in the South and Midwest were nearly identical at just under $99,500 per FTE.
ProductionSurprisingly, APP wRVu production actually fell back in 2015 as compared to 2014 (Figure 21) – and by nearly half! Both years show very low productivity per FTE with median values of 414 and 281 respectively. This is an indication that APPs are often used in an “incident to” capacity in the office setting where many practice management systems are unable to attribute to the work them, instead crediting the billing provider, which is the physician. Additionally,
5. Survey Results – Advanced Practice Providers
FigURe 18 – APP Median Comp per FTE ©MedAxiom
FigURe 19 – Median Compensation per FTE Comparison by Ownership ©MedAxiom
FigURe 20 ©MedAxiom
FigURe 21 – App Median wRVU production ©MedAxiom
sURVeY ResUlts – Apps
MedAxioM CARdioVASCULAR PRoVideR CoMPeNSATioN & PRodUCTioN SURVeY – 2016 25
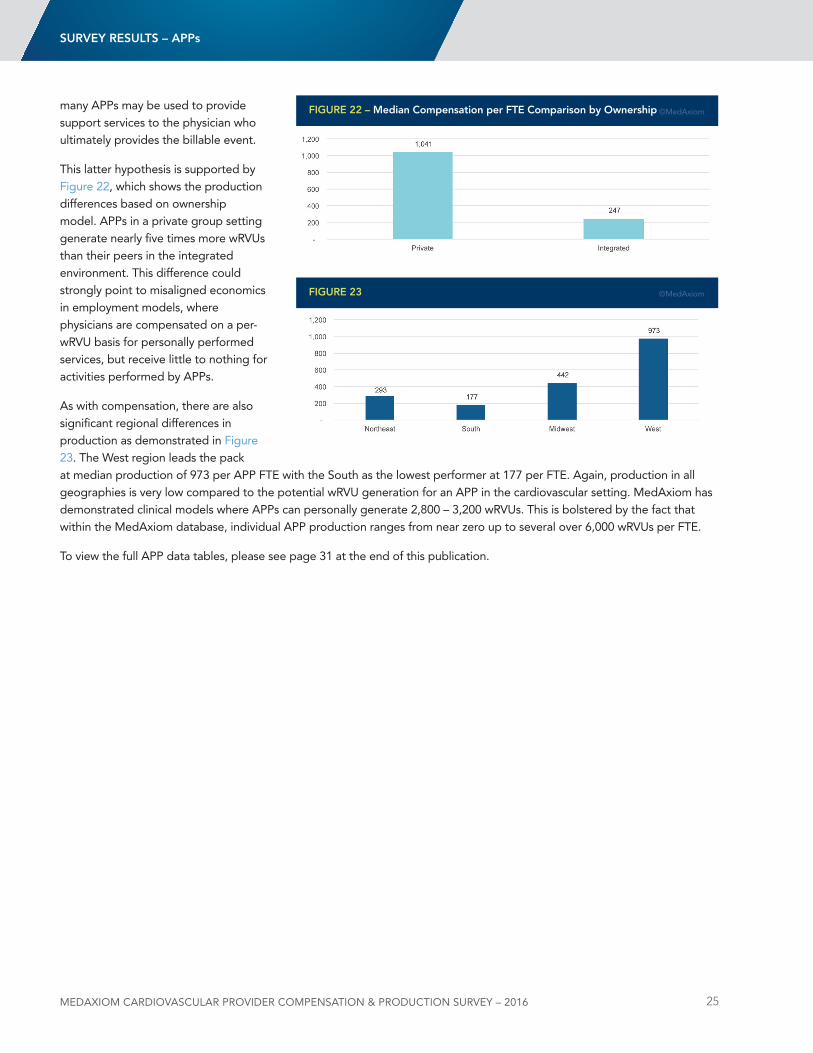
many APPs may be used to provide support services to the physician who ultimately provides the billable event.
This latter hypothesis is supported by Figure 22, which shows the production differences based on ownership model. APPs in a private group setting generate nearly five times more wRVus than their peers in the integrated environment. This difference could strongly point to misaligned economics in employment models, where physicians are compensated on a per-wRVu basis for personally performed services, but receive little to nothing for activities performed by APPs.
As with compensation, there are also significant regional differences in production as demonstrated in Figure 23. The West region leads the pack at median production of 973 per APP FTE with the South as the lowest performer at 177 per FTE. Again, production in all geographies is very low compared to the potential wRVu generation for an APP in the cardiovascular setting. MedAxiom has demonstrated clinical models where APPs can personally generate 2,800 – 3,200 wRVus. This is bolstered by the fact that within the MedAxiom database, individual APP production ranges from near zero up to several over 6,000 wRVus per FTE.
To view the full APP data tables, please see page 31 at the end of this publication.
FigURe 22 – Median Compensation per Fte Comparison by ownership ©MedAxiom
FigURe 23 ©MedAxiom
sURVeY ResUlts – Apps
MedAxioM CARdioVASCULAR PRoVideR CoMPeNSATioN & PRodUCTioN SURVeY – 2016 26
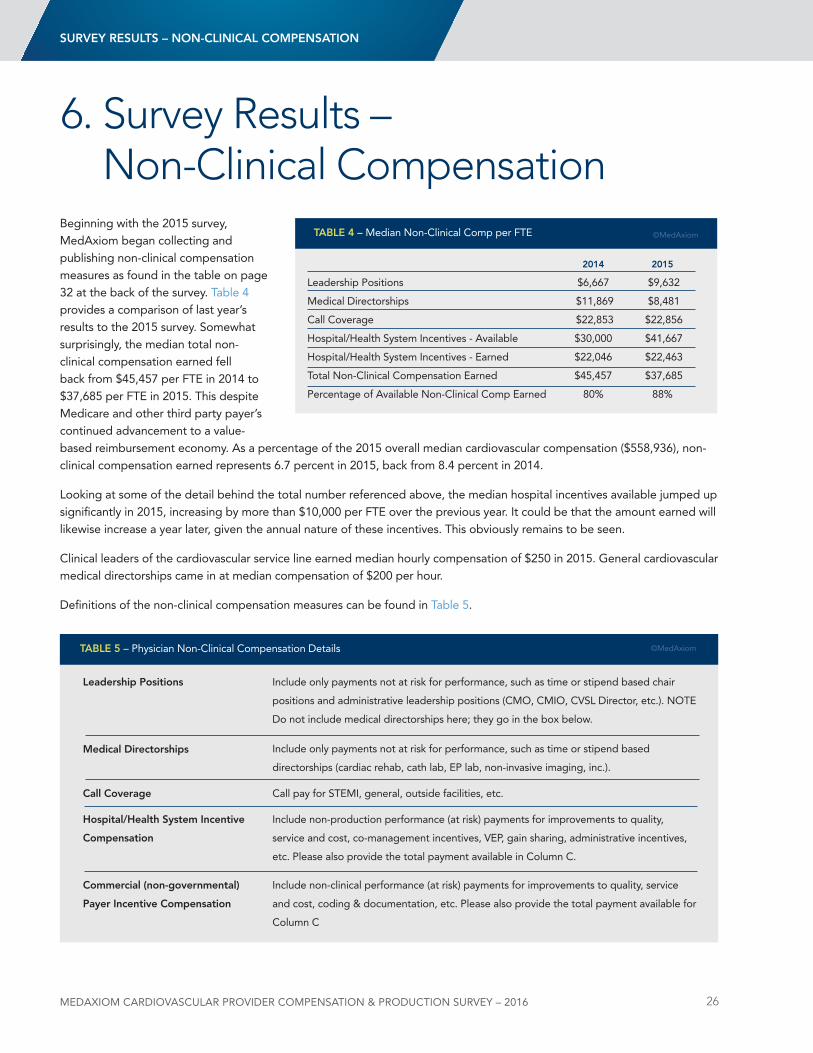
Beginning with the 2015 survey, MedAxiom began collecting and publishing non-clinical compensation measures as found in the table on page 32 at the back of the survey. Table 4 provides a comparison of last year’s results to the 2015 survey. Somewhat surprisingly, the median total non-clinical compensation earned fell back from $45,457 per FTE in 2014 to $37,685 per FTE in 2015. This despite Medicare and other third party payer’s continued advancement to a value-based reimbursement economy. As a percentage of the 2015 overall median cardiovascular compensation ($558,936), non-clinical compensation earned represents 6.7 percent in 2015, back from 8.4 percent in 2014.
looking at some of the detail behind the total number referenced above, the median hospital incentives available jumped up significantly in 2015, increasing by more than $10,000 per FTE over the previous year. It could be that the amount earned will likewise increase a year later, given the annual nature of these incentives. This obviously remains to be seen.
Clinical leaders of the cardiovascular service line earned median hourly compensation of $250 in 2015. General cardiovascular medical directorships came in at median compensation of $200 per hour.
definitions of the non-clinical compensation measures can be found in Table 5.
6. Survey Results – Non-Clinical Compensation
2014 2015
leadership Positions $6,667 $9,632
Medical directorships $11,869 $8,481
Call Coverage $22,853 $22,856
Hospital/Health System Incentives - Available $30,000 $41,667
Hospital/Health System Incentives - Earned $22,046 $22,463
Total non-Clinical Compensation Earned $45,457 $37,685
Percentage of Available non-Clinical Comp Earned 80% 88%
tABle 4 – Median non-Clinical Comp per FTE ©MedAxiom
tABle 5 – Physician non-Clinical Compensation details
Call pay for STEMI, general, outside facilities, etc.Call Coverage
Include only payments not at risk for performance, such as time or stipend based chair
positions and administrative leadership positions (CMO, CMIO, CVSl director, etc.). nOTE
do not include medical directorships here; they go in the box below.
leadership positions
Include only payments not at risk for performance, such as time or stipend based
directorships (cardiac rehab, cath lab, EP lab, non-invasive imaging, inc.).
Medical Directorships
Include non-production performance (at risk) payments for improvements to quality,
service and cost, co-management incentives, VEP, gain sharing, administrative incentives,
etc. Please also provide the total payment available in Column C.
Hospital/Health system incentive
Compensation
Include non-clinical performance (at risk) payments for improvements to quality, service
and cost, coding & documentation, etc. Please also provide the total payment available for
Column C
Commercial (non-governmental)
payer incentive Compensation
©MedAxiom
sURVeY ResUlts – non-CliniCAl CoMpensAtion
CA
RD
iolo
gY
tA
Ble
s
TAb
lE 1
: P
hy
SIC
IAn
CO
mP
En
SATI
On
20
12
2013
20
14
2015
n
25
%
50%
75
%
90%
n
25
%
50%
75
%
90%
n
25
%
50%
75
%
90%
n
25
%
50%
75
%
90%
3-1-
0100
Act
ual C
om
pen
sati
on
per
Car
dio
log
ist
1,59
3 $4
16,5
78
$548
,587
$6
65,1
06
$796
,191
2,
223
$404
,073
$5
12,4
01
$635
,891
$7
64,0
14
2,28
2 $4
03,0
05
$542
,000
$6
61,9
25
$774
,536
2,
278
$415
,383
$5
57,9
15
$671
,899
$8
35,5
32
ow
ners
hip
Mo
del
Pr
ivat
e 55
2 $3
25,8
62
$465
,815
$5
65,0
00
$688
,015
70
3 $3
33,5
17
$425
,897
$5
42,6
50
$675
,684
58
9 $3
46,1
32
$470
,160
$6
00,0
00
$711
,082
50
3 $3
18,3
80
$486
,777
$6
24,3
70
$766
,060
Elec
trop
hysi
olog
y 73
$3
74,6
84
$477
,345
$5
70,1
56
$734
,704
95
$3
68,5
35
$456
,337
$5
59,0
04
$700
,000
85
$3
49,2
62
$460
,621
$5
57,1
62
$704
,867
76
$3
82,8
56
$498
,208
$6
04,0
72
$767
,879
Inva
sive
13
3 $2
97,9
76
$464
,374
$5
67,0
29
$575
,906
14
1 $3
32,0
00
$425
,000
$5
36,0
65
$570
,000
81
$3
36,5
68
$428
,378
$5
60,3
30
$679
,723
66
$2
94,8
80
$467
,455
$5
87,5
00
$773
,887
Gen
eral
non
-Inva
sive
12
9 $2
99,8
51
$473
,852
$5
45,1
56
$598
,800
20
1 $3
03,6
00
$394
,586
$4
63,7
53
$570
,000
12
6 $3
25,5
09
$411
,667
$5
70,4
79
$678
,458
10
2 $2
68,6
58
$413
,660
$5
44,2
76
$674
,021
Inte
rven
tiona
l 21
7 $3
53,0
00
$456
,899
$6
04,8
98
$785
,139
26
6 $3
70,5
83
$479
,017
$6
25,0
00
$728
,148
29
7 $3
76,6
61
$497
,840
$6
22,9
10
$756
,181
25
9 $3
39,6
84
$510
,000
$6
60,4
57
$834
,099
In
teg
rate
d
1,04
1 $4
53,0
21
$588
,996
$7
02,9
04
$824
,233
1,
520
$449
,790
$5
55,3
65
$676
,729
$8
02,5
84
1,69
3 $4
33,8
63
$555
,411
$6
72,9
52
$796
,537
1,
775
$441
,984
$5
77,7
56
$680
,948
$8
48,7
51
Elec
trop
hysi
olog
y 14
6 $5
09,5
80
$614
,601
$6
98,8
89
$869
,340
21
0 $4
51,7
95
$572
,522
$6
99,7
87
$852
,098
22
5 $4
81,9
30
$574
,459
$6
99,0
95
$857
,126
25
6 $4
95,9
61
$597
,353
$7
30,9
79
$959
,412
Inva
sive
26
2 $4
48,6
88
$576
,000
$6
66,0
03
$775
,984
36
0 $4
68,6
97
$555
,248
$6
81,5
72
$794
,108
34
6 $4
51,8
16
$554
,157
$6
68,3
04
$776
,434
32
2 $4
68,2
43
$577
,756
$6
84,8
00
$848
,550
Gen
eral
non
-Inva
sive
25
0 $3
89,1
57
$504
,522
$6
15,8
00
$712
,698
42
8 $3
77,0
73
$498
,419
$5
95,9
79
$678
,985
48
6 $3
73,5
95
$500
,000
$5
86,9
83
$713
,540
52
5 $3
58,4
08
$503
,353
$6
14,4
41
$707
,252
Inte
rven
tiona
l 38
3 $5
27,0
85
$639
,800
$7
65,4
74
$911
,116
52
2 $4
88,4
90
$595
,785
$7
33,3
83
$903
,433
63
6 $4
87,5
00
$595
,056
$6
98,7
24
$834
,945
67
2 $5
00,0
00
$620
,288
$7
34,7
58
$867
,271
geo
gra
phi
c B
reak
do
wn
nor
thea
st
252
$417
,184
$5
11,7
46
$598
,575
$6
26,3
18
429
$387
,491
$4
64,3
26
$550
,249
$6
15,9
93
389
$405
,018
$5
42,0
00
$600
,000
$6
94,5
74
289
$362
,947
$5
17,3
80
$618
,072
$6
74,2
70
So
uth
704
$400
,000
$5
50,0
00
$709
,908
$8
66,2
84
1,03
9 $4
05,1
53
$528
,010
$6
87,3
29
$814
,752
1,
182
$391
,102
$5
56,8
19
$698
,211
$8
57,6
42
1,17
6 $4
23,4
79
$579
,124
$7
24,8
43
$880
,915
M
idw
est
482
$458
,841
$5
93,6
70
$682
,840
$7
87,9
48
532
$425
,279
$5
65,7
20
$650
,000
$7
75,7
55
488
$455
,410
$5
46,4
66
$615
,460
$7
46,4
39
521
$466
,024
$5
73,2
84
$658
,117
$7
88,1
37
W
est
155
$358
,046
$4
61,6
57
$551
,632
$6
97,4
13
223
$397
,212
$4
77,8
25
$570
,521
$6
50,0
00
223
$379
,995
$4
51,8
16
$574
,459
$6
76,0
16
292
$372
,615
$4
90,4
88
$624
,370
$8
18,5
96
ove
rall
El
ectr
ophy
siol
ogy
219
$451
,397
$5
76,0
00
$680
,614
$8
43,7
23
305
$421
,823
$5
25,6
64
$675
,000
$7
98,4
90
310
$429
,667
$5
54,9
58
$670
,959
$8
39,7
07
332
$458
,000
$5
72,0
66
$693
,925
$9
26,3
92
In
vasi
ve
395
$415
,192
$5
41,3
24
$620
,000
$7
43,9
69
501
$421
,590
$5
21,7
40
$625
,799
$7
50,2
57
427
$424
,438
$5
42,0
00
$653
,974
$7
50,8
17
388
$435
,265
$5
60,6
04
$670
,517
$8
47,0
82
G
ener
al n
on-In
vasi
ve
379
$358
,491
$4
79,6
48
$583
,943
$6
85,8
02
629
$339
,235
$4
54,8
37
$570
,000
$6
61,5
17
612
$361
,399
$4
89,7
76
$586
,338
$6
95,9
66
627
$350
,037
$4
89,7
01
$614
,018
$6
98,7
16
In
terv
entio
nal
600
$443
,072
$5
86,1
54
$727
,457
$8
77,0
25
788
$438
,694
$5
64,6
54
$691
,189
$8
22,4
00
933
$431
,588
$5
63,4
85
$693
,285
$8
21,2
45
931
$460
,110
$5
87,5
00
$720
,624
$8
65,0
15
3-1-
0400
phy
sici
an A
ctua
l Co
mp
ensa
tio
n
1,51
5 $4
1.38
$5
3.96
$6
7.28
$8
4.07
2,
507
$43.
47
$53.
78
$65.
30
$80.
78
2,22
6 $4
3.87
$5
3.47
$6
6.22
$8
4.50
2,
088
$47.
48
$56.
55
$67.
57
$83.
27
per
Wo
rk R
VU
ow
ners
hip
Mo
del
Pr
ivat
e 50
9 $3
3.23
$4
2.55
$5
3.96
$6
1.64
66
9 $3
3.13
$4
1.59
$5
1.66
$6
4.17
57
6 $3
4.53
$4
2.63
$5
1.98
$6
9.29
48
0 $3
5.80
$4
4.88
$6
2.85
$8
3.11
Elec
trop
hysi
olog
y 71
$2
9.04
$3
7.24
$4
5.62
$5
3.70
93
$3
0.39
$3
6.41
$4
4.80
$5
0.19
85
$3
0.47
$3
6.89
$4
5.93
$5
1.77
70
$3
3.11
$3
8.53
$5
0.67
$6
4.04
Inva
sive
11
4 $3
4.20
$4
8.85
$5
8.11
$6
6.30
10
2 $3
3.19
$4
3.77
$6
2.17
$9
0.83
77
$3
6.61
$4
7.94
$6
4.98
$1
09.7
2 65
$4
4.52
$6
0.88
$9
3.55
$1
14.5
7
Gen
eral
non
-Inva
sive
12
8 $3
4.10
$4
3.92
$5
4.72
$6
1.58
17
1 $3
5.19
$4
1.59
$5
0.41
$5
7.11
12
4 $3
3.63
$4
2.20
$5
0.89
$6
9.29
95
$3
2.79
$4
0.18
$5
8.65
$8
2.82
Inte
rven
tiona
l 19
6 $3
3.21
$4
1.55
$5
2.19
$6
1.23
30
3 $3
2.88
$4
1.97
$5
3.44
$6
4.79
29
0 $3
6.14
$4
4.01
$5
1.62
$6
2.32
25
0 $3
6.77
$4
5.12
$6
1.63
$7
4.12
In
teg
rate
d
1,00
6 $4
9.52
$5
9.02
$7
3.19
$9
0.07
1,
838
$49.
33
$57.
21
$68.
40
$84.
72
1,65
0 $4
8.18
$5
6.67
$6
9.37
$8
6.98
1,
608
$50.
46
$58.
32
$69.
24
$83.
27
Elec
trop
hysi
olog
y 14
2 $4
1.21
$5
2.54
$6
3.12
$7
8.64
26
3 $4
2.70
$5
1.86
$5
8.90
$6
7.89
22
2 $4
3.81
$5
0.80
$6
0.30
$7
6.77
22
6 $4
4.56
$5
1.58
$5
8.72
$7
3.10
Inva
sive
26
2 $5
1.59
$6
0.77
$7
3.04
$8
8.76
34
2 $5
0.47
$5
5.89
$6
7.10
$7
7.61
34
2 $4
9.56
$5
6.30
$6
6.45
$8
1.28
30
1 $5
2.53
$5
9.14
$6
9.80
$8
0.35
Gen
eral
non
-Inva
sive
23
0 $5
1.08
$6
1.10
$8
0.26
$1
02.3
1 56
7 $5
0.94
$6
2.30
$7
3.43
$9
6.44
46
9 $4
9.41
$6
1.33
$7
4.56
$9
4.52
46
7 $5
2.11
$6
2.10
$7
1.72
$8
3.56
Inte
rven
tiona
l 37
2 $5
0.48
$5
9.25
$7
3.01
$8
8.17
66
6 $4
9.79
$5
7.43
$6
8.32
$8
4.48
61
7 $4
8.75
$5
6.56
$7
0.69
$8
8.15
61
4 $5
0.95
$5
8.04
$6
8.74
$8
5.05
geo
gra
phi
c B
reak
do
wn
nor
thea
st
221
$36.
74
$50.
11
$58.
62
$69.
18
419
$43.
37
$52.
54
$62.
33
$74.
43
370
$48.
02
$56.
24
$70.
07
$81.
13
282
$47.
72
$58.
49
$70.
42
$81.
70
So
uth
671
$39.
40
$51.
83
$61.
76
$76.
50
1,29
2 $4
1.31
$5
2.35
$6
3.10
$7
7.08
1,
162
$41.
75
$50.
63
$62.
35
$81.
93
1,11
9 $4
5.84
$5
3.97
$6
4.88
$7
9.88
M
idw
est
468
$51.
26
$64.
81
$78.
66
$97.
91
546
$51.
25
$60.
30
$72.
37
$91.
09
479
$47.
13
$56.
91
$66.
51
$78.
46
401
$52.
08
$59.
63
$69.
76
$83.
56
W
est
155
$37.
14
$46.
89
$57.
30
$70.
54
250
$39.
16
$50.
41
$64.
24
$82.
08
215
$44.
63
$53.
69
$82.
33
$120
.01
286
$46.
96
$59.
11
$75.
61
$96.
65
ove
rall
El
ectr
ophy
siol
ogy
213
$35.
95
$46.
32
$57.
81
$72.
95
356
$38.
30
$48.
72
$57.
05
$66.
37
307
$37.
86
$47.
60
$57.
57
$73.
87
296
$40.
92
$50.
20
$57.
69
$71.
52
In
vasi
ve
376
$46.
24
$56.
81
$67.
34
$83.
04
444
$47.
39
$54.
53
$66.
06
$79.
20
419
$47.
43
$55.
06
$66.
25
$85.
36
366
$51.
07
$59.
14
$71.
38
$87.
99
G
ener
al n
on-In
vasi
ve
358
$42.
73
$55.
16
$70.
73
$94.
17
738
$45.
19
$56.
65
$69.
23
$89.
27
593
$44.
83
$57.
11
$71.
62
$91.
07
562
$48.
33
$59.
92
$71.
43
$83.
27
In
terv
entio
nal
568
$40.
70
$53.
76
$67.
66
$83.
96
969
$43.
08
$53.
79
$64.
24
$80.
61
907
$43.
67
$52.
30
$65.
09
$83.
00
864
$46.
80
$55.
86
$66.
64
$83.
63
ME
dA
xIO
M C
AR
dIO
VASC
ulA
R P
RO
VId
ER
CO
MP
En
SATI
On
& P
RO
du
CTI
On
Su
RV
EY
– 2
016
27
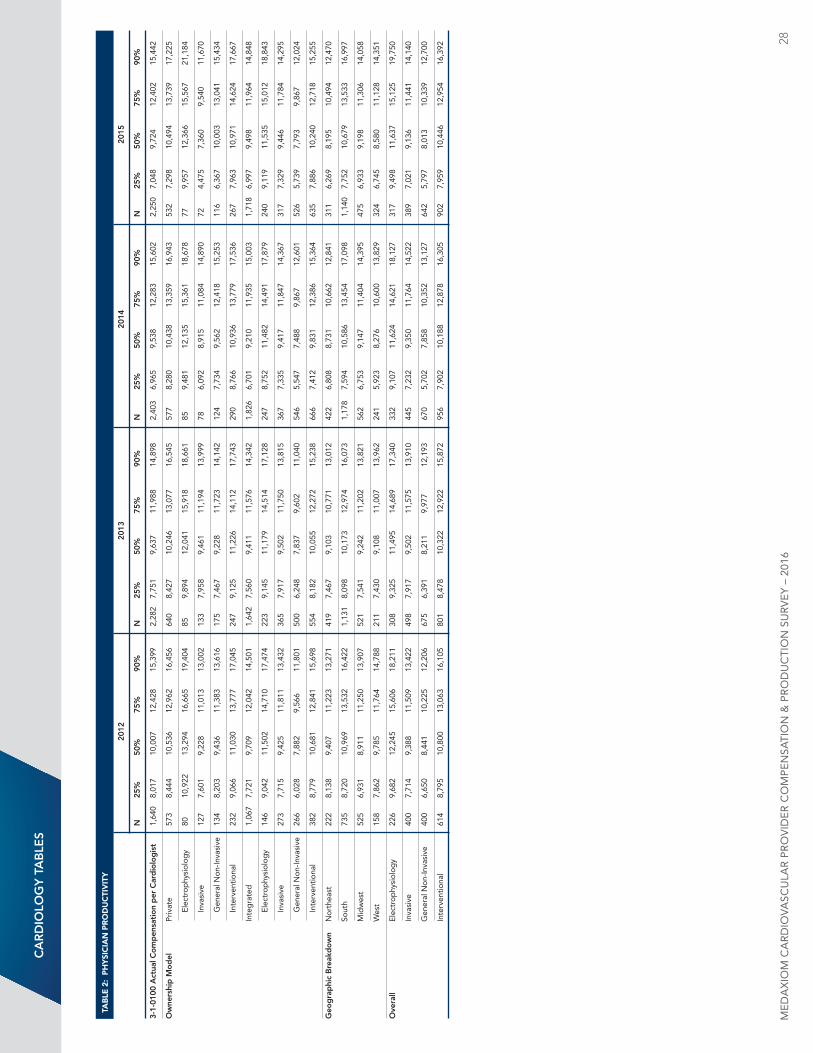
TAb
lE 2
: P
hy
SIC
IAn
Pr
Od
uC
TIv
ITy
20
12
2013
20
14
2015
n
25
%
50%
75
%
90%
n
25
%
50%
75
%
90%
n
25
%
50%
75
%
90%
n
25
%
50%
75
%
90%
3-1-
0100
Act
ual C
om
pen
sati
on
per
Car
dio
log
ist
1,64
0 8,
017
10,0
07
12,4
28
15,3
99
2,28
2 7,
751
9,63
7 11
,988
14
,898
2,
403
6,96
5 9,
538
12,2
83
15,6
02
2,25
0 7,
048
9,72
4 12
,402
15
,442
ow
ners
hip
Mo
del
Pr
ivat
e 57
3 8,
444
10,5
36
12,9
62
16,4
56
640
8,42
7 10
,246
13
,077
16
,545
57
7 8,
280
10,4
38
13,3
59
16,9
43
532
7,29
8 10
,494
13
,739
17
,225
Elec
trop
hysi
olog
y 80
10
,922
13
,294
16
,665
19
,404
85
9,
894
12,0
41
15,9
18
18,6
61
85
9,48
1 12
,135
15
,361
18
,678
77
9,
957
12,3
66
15,5
67
21,1
84
Inva
sive
12
7 7,
601
9,22
8 11
,013
13
,002
13
3 7,
958
9,46
1 11
,194
13
,999
78
6,
092
8,91
5 11
,084
14
,890
72
4,
475
7,36
0 9,
540
11,6
70
Gen
eral
non
-Inva
sive
13
4 8,
203
9,43
6 11
,383
13
,616
17
5 7,
467
9,22
8 11
,723
14
,142
12
4 7,
734
9,56
2 12
,418
15
,253
11
6 6,
367
10,0
03
13,0
41
15,4
34
Inte
rven
tiona
l 23
2 9,
066
11,0
30
13,7
77
17,0
45
247
9,12
5 11
,226
14
,112
17
,743
29
0 8,
766
10,9
36
13,7
79
17,5
36
267
7,96
3 10
,971
14
,624
17
,667
In
teg
rate
d
1,06
7 7,
721
9,70
9 12
,042
14
,501
1,
642
7,56
0 9,
411
11,5
76
14,3
42
1,82
6 6,
701
9,21
0 11
,935
15
,003
1,
718
6,99
7 9,
498
11,9
64
14,8
48
Elec
trop
hysi
olog
y 14
6 9,
042
11,5
02
14,7
10
17,4
74
223
9,14
5 11
,179
14
,514
17
,128
24
7 8,
752
11,4
82
14,4
91
17,8
79
240
9,11
9 11
,535
15
,012
18
,843
Inva
sive
27
3 7,
715
9,42
5 11
,811
13
,432
36
5 7,
917
9,50
2 11
,750
13
,815
36
7 7,
335
9,41
7 11
,847
14
,367
31
7 7,
329
9,44
6 11
,784
14
,295
Gen
eral
non
-Inva
sive
26
6 6,
028
7,88
2 9,
566
11,8
01
500
6,24
8 7,
837
9,60
2 11
,040
54
6 5,
547
7,48
8 9,
867
12,6
01
526
5,73
9 7,
793
9,86
7 12
,024
Inte
rven
tiona
l 38
2 8,
779
10,6
81
12,8
41
15,6
98
554
8,18
2 10
,055
12
,272
15
,238
66
6 7,
412
9,83
1 12
,386
15
,364
63
5 7,
886
10,2
40
12,7
18
15,2
55
geo
gra
phi
c B
reak
do
wn
nor
thea
st
222
8,13
8 9,
407
11,2
23
13,2
71
419
7,46
7 9,
103
10,7
71
13,0
12
422
6,80
8 8,
731
10,6
62
12,8
41
311
6,26
9 8,
195
10,4
94
12,4
70
So
uth
735
8,72
0 10
,969
13
,532
16
,422
1,
131
8,09
8 10
,173
12
,974
16
,073
1,
178
7,59
4 10
,586
13
,454
17
,098
1,
140
7,75
2 10
,679
13
,533
16
,997
M
idw
est
525
6,93
1 8,
911
11,2
50
13,9
07
521
7,54
1 9,
242
11,2
02
13,8
21
562
6,75
3 9,
147
11,4
04
14,3
95
475
6,93
3 9,
198
11,3
06
14,0
58
W
est
158
7,86
2 9,
785
11,7
64
14,7
88
211
7,43
0 9,
108
11,0
07
13,9
62
241
5,92
3 8,
276
10,6
00
13,8
29
324
6,74
5 8,
580
11,1
28
14,3
51
ove
rall
El
ectr
ophy
siol
ogy
226
9,68
2 12
,245
15
,606
18
,211
30
8 9,
325
11,4
95
14,6
89
17,3
40
332
9,10
7 11
,624
14
,621
18
,127
31
7 9,
498
11,6
37
15,1
25
19,7
50
In
vasi
ve
400
7,71
4 9,
388
11,5
09
13,4
22
498
7,91
7 9,
502
11,5
75
13,9
10
445
7,23
2 9,
350
11,7
64
14,5
22
389
7,02
1 9,
136
11,4
41
14,1
40
G
ener
al n
on-In
vasi
ve
400
6,65
0 8,
441
10,2
25
12,2
06
675
6,39
1 8,
211
9,97
7 12
,193
67
0 5,
702
7,85
8 10
,352
13
,127
64
2 5,
797
8,01
3 10
,339
12
,700
In
terv
entio
nal
614
8,79
5 10
,800
13
,063
16
,105
80
1 8,
478
10,3
22
12,9
22
15,8
72
956
7,90
2 10
,188
12
,878
16
,305
90
2 7,
959
10,4
46
12,9
54
16,3
92
CA
RD
iolo
gY
tA
Ble
s
ME
dA
xIO
M C
AR
dIO
VASC
ulA
R P
RO
VId
ER
CO
MP
En
SATI
On
& P
RO
du
CTI
On
Su
RV
EY
– 2
016
28
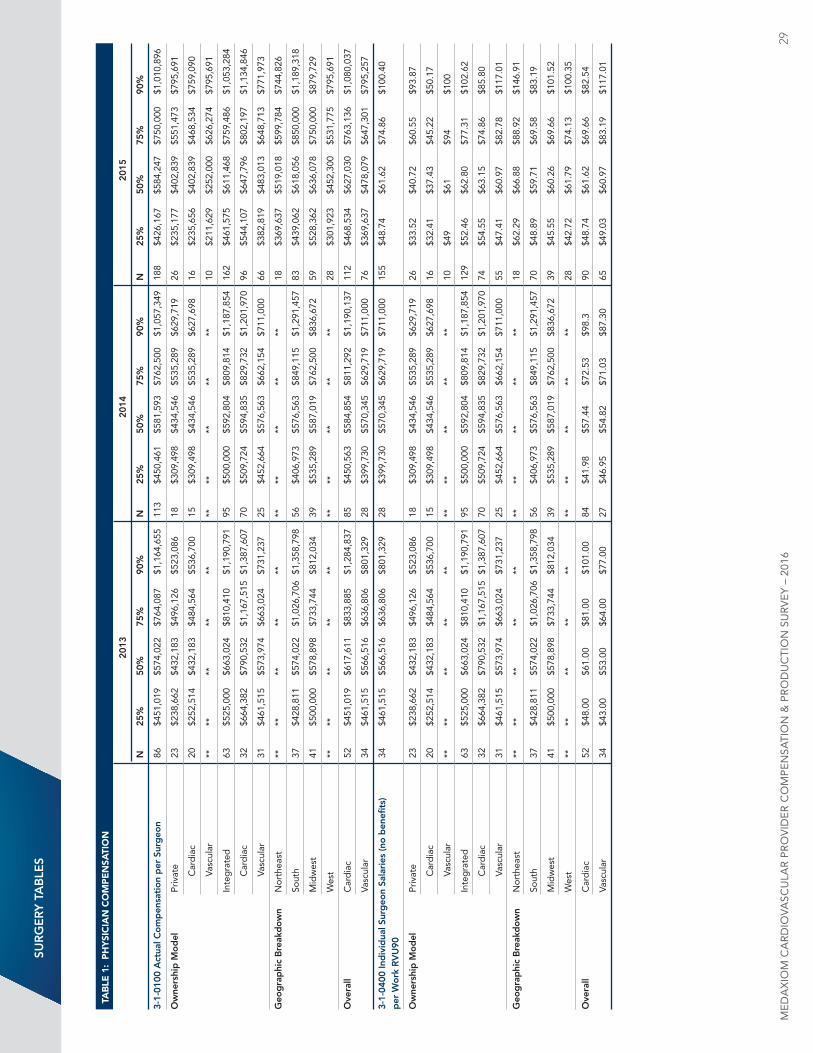
sUR
ge
RY
tA
Ble
s
TAb
lE 1
: P
hy
SIC
IAn
CO
mP
En
SATI
On
20
13
2014
20
15
n
25
%
50%
75
%
90%
n
25
%
50%
75
%
90%
n
25
%
50%
75
%
90%
3-1-
0100
Act
ual C
om
pen
sati
on
per
sur
geo
n 86
$4
51,0
19
$574
,022
$7
64,0
87
$1,1
64,6
55
113
$450
,461
$5
81,5
93
$762
,500
$1
,057
,349
18
8 $4
26,1
67
$584
,247
$7
50,0
00
$1,0
10,8
96
ow
ners
hip
Mo
del
Pr
ivat
e 23
$2
38,6
62
$432
,183
$4
96,1
26
$523
,086
18
$3
09,4
98
$434
,546
$5
35,2
89
$629
,719
26
$2
35,1
77
$402
,839
$5
51,4
73
$795
,691
Car
dia
c 20
$2
52,5
14
$432
,183
$4
84,5
64
$536
,700
15
$3
09,4
98
$434
,546
$5
35,2
89
$627
,698
16
$2
35,6
56
$402
,839
$4
68,5
34
$759
,090
Vasc
ular
**
**
**
**
**
**
**
**
**
**
10
$2
11,6
29
$252
,000
$6
26,2
74
$795
,691
In
teg
rate
d
63
$525
,000
$6
63,0
24
$810
,410
$1
,190
,791
95
$5
00,0
00
$592
,804
$8
09,8
14
$1,1
87,8
54
162
$461
,575
$6
11,4
68
$759
,486
$1
,053
,284
Car
dia
c 32
$6
64,3
82
$790
,532
$1
,167
,515
$1
,387
,607
70
$5
09,7
24
$594
,835
$8
29,7
32
$1,2
01,9
70
96
$544
,107
$6
47,7
96
$802
,197
$1
,134
,846
Vasc
ular
31
$4
61,5
15
$573
,974
$6
63,0
24
$731
,237
25
$4
52,6
64
$576
,563
$6
62,1
54
$711
,000
66
$3
82,8
19
$483
,013
$6
48,7
13
$771
,973
geo
gra
phi
c B
reak
do
wn
nor
thea
st
**
**
**
**
**
**
**
**
**
**
18
$369
,637
$5
19,0
18
$599
,784
$7
44,8
26
So
uth
37
$428
,811
$5
74,0
22
$1,0
26,7
06
$1,3
58,7
98
56
$406
,973
$5
76,5
63
$849
,115
$1
,291
,457
83
$4
39,0
62
$618
,056
$8
50,0
00
$1,1
89,3
18
M
idw
est
41
$500
,000
$5
78,8
98
$733
,744
$8
12,0
34
39
$535
,289
$5
87,0
19
$762
,500
$8
36,6
72
59
$528
,362
$6
36,0
78
$750
,000
$8
79,7
29
W
est
**
**
**
**
**
**
**
**
**
**
28
$301
,923
$4
52,3
00
$531
,775
$7
95,6
91
ove
rall
Car
dia
c 52
$4
51,0
19
$617
,611
$8
33,8
85
$1,2
84,8
37
85
$450
,563
$5
84,8
54
$811
,292
$1
,190
,137
11
2 $4
68,5
34
$627
,030
$7
63,1
36
$1,0
80,0
37
Va
scul
ar
34
$461
,515
$5
66,5
16
$636
,806
$8
01,3
29
28
$399
,730
$5
70,3
45
$629
,719
$7
11,0
00
76
$369
,637
$4
78,0
79
$647
,301
$7
95,2
57
3-1-
0400
ind
ivid
ual s
urg
eon
sala
ries
(no
ben
efits
) 34
$4
61,5
15
$566
,516
$6
36,8
06
$801
,329
28
$3
99,7
30
$570
,345
$6
29,7
19
$711
,000
15
5 $4
8.74
$6
1.62
$7
4.86
$1
00.4
0p
er W
ork
RV
U90
ow
ners
hip
Mo
del
Pr
ivat
e 23
$2
38,6
62
$432
,183
$4
96,1
26
$523
,086
18
$3
09,4
98
$434
,546
$5
35,2
89
$629
,719
26
$3
3.52
$4
0.72
$6
0.55
$9
3.87
Car
dia
c 20
$2
52,5
14
$432
,183
$4
84,5
64
$536
,700
15
$3
09,4
98
$434
,546
$5
35,2
89
$627
,698
16
$3
2.41
$3
7.43
$4
5.22
$5
0.17
Vasc
ular
**
**
**
**
**
**
**
**
**
**
10
$4
9 $6
1 $9
4 $1
00
In
teg
rate
d
63
$525
,000
$6
63,0
24
$810
,410
$1
,190
,791
95
$5
00,0
00
$592
,804
$8
09,8
14
$1,1
87,8
54
129
$52.
46
$62.
80
$77.
31
$102
.62
Car
dia
c 32
$6
64,3
82
$790
,532
$1
,167
,515
$1
,387
,607
70
$5
09,7
24
$594
,835
$8
29,7
32
$1,2
01,9
70
74
$54.
55
$63.
15
$74.
86
$85.
80
Vasc
ular
31
$4
61,5
15
$573
,974
$6
63,0
24
$731
,237
25
$4
52,6
64
$576
,563
$6
62,1
54
$711
,000
55
$4
7.41
$6
0.97
$8
2.78
$1
17.0
1
geo
gra
phi
c B
reak
do
wn
nor
thea
st
**
**
**
**
**
**
**
**
**
**
18
$62.
29
$66.
88
$88.
92
$146
.91
So
uth
37
$428
,811
$5
74,0
22
$1,0
26,7
06
$1,3
58,7
98
56
$406
,973
$5
76,5
63
$849
,115
$1
,291
,457
70
$4
8.89
$5
9.71
$6
9.58
$8
3.19
M
idw
est
41
$500
,000
$5
78,8
98
$733
,744
$8
12,0
34
39
$535
,289
$5
87,0
19
$762
,500
$8
36,6
72
39
$45.
55
$60.
26
$69.
66
$101
.52
W
est
**
**
**
**
**
**
**
**
**
**
28
$42.
72
$61.
79
$74.
13
$100
.35
ove
rall
Car
dia
c 52
$4
8.00
$6
1.00
$8
1.00
$1
01.0
0 84
$4
1.98
$5
7.44
$7
2.53
$9
8.3
90
$48.
74
$61.
62
$69.
66
$82.
54
Va
scul
ar
34
$43.
00
$53.
00
$64.
00
$77.
00
27
$46.
95
$54.
82
$71.
03
$87.
30
65
$49.
03
$60.
97
$83.
19
$117
.01
ME
dA
xIO
M C
AR
dIO
VASC
ulA
R P
RO
VId
ER
CO
MP
En
SATI
On
& P
RO
du
CTI
On
Su
RV
EY
– 2
016
29
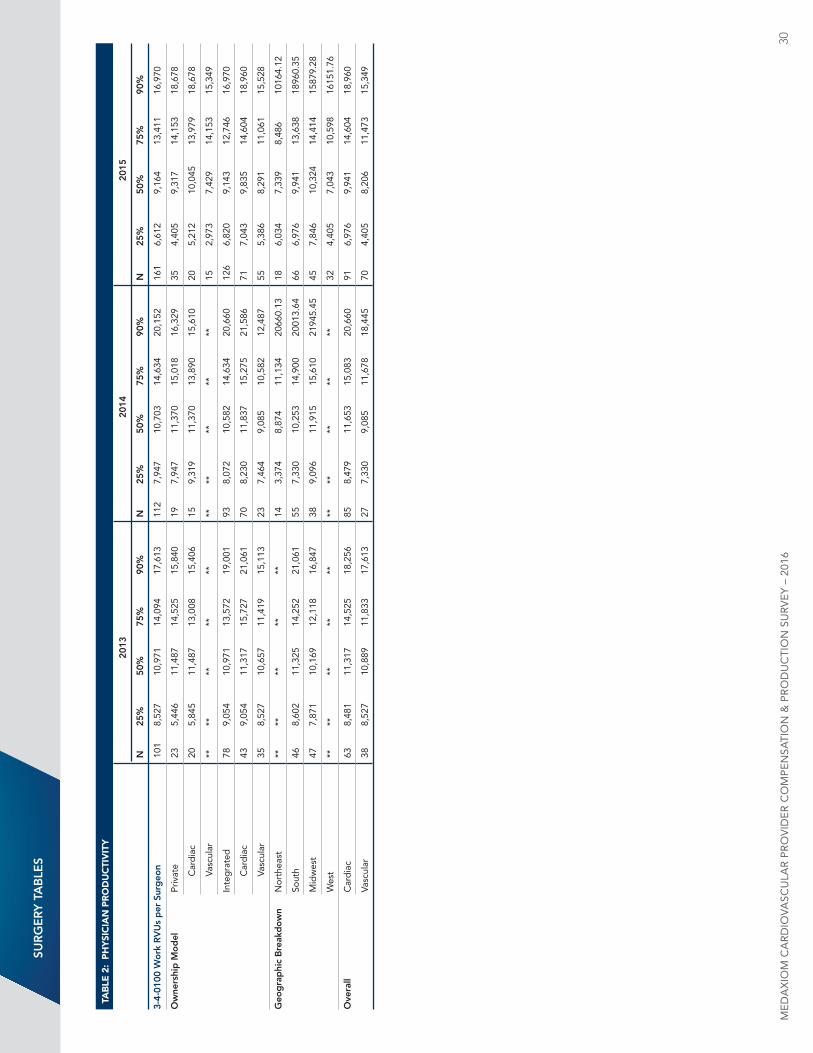
sUR
ge
RY
tA
Ble
s
TAb
lE 2
: P
hy
SIC
IAn
Pr
Od
uC
TIv
ITy
20
13
2014
20
15
n
25
%
50%
75
%
90%
n
25
%
50%
75
%
90%
n
25
%
50%
75
%
90%
3-4-
0100
Wo
rk R
VU
s p
er s
urg
eon
101
8,52
7 10
,971
14
,094
17
,613
11
2 7,
947
10,7
03
14,6
34
20,1
52
161
6,61
2 9,
164
13,4
11
16,9
70
ow
ners
hip
Mo
del
Pr
ivat
e 23
5,
446
11,4
87
14,5
25
15,8
40
19
7,94
7 11
,370
15
,018
16
,329
35
4,
405
9,31
7 14
,153
18
,678
Car
dia
c 20
5,
845
11,4
87
13,0
08
15,4
06
15
9,31
9 11
,370
13
,890
15
,610
20
5,
212
10,0
45
13,9
79
18,6
78
Vasc
ular
**
**
**
**
**
**
**
**
**
**
15
2,
973
7,42
9 14
,153
15
,349
In
teg
rate
d
78
9,05
4 10
,971
13
,572
19
,001
93
8,
072
10,5
82
14,6
34
20,6
60
126
6,82
0 9,
143
12,7
46
16,9
70
Car
dia
c 43
9,
054
11,3
17
15,7
27
21,0
61
70
8,23
0 11
,837
15
,275
21
,586
71
7,
043
9,83
5 14
,604
18
,960
Vasc
ular
35
8,
527
10,6
57
11,4
19
15,1
13
23
7,46
4 9,
085
10,5
82
12,4
87
55
5,38
6 8,
291
11,0
61
15,5
28
geo
gra
phi
c B
reak
do
wn
nor
thea
st
**
**
**
**
**
14
3,37
4 8,
874
11,1
34
2066
0.13
18
6,
034
7,33
9 8,
486
1016
4.12
So
uth
46
8,60
2 11
,325
14
,252
21
,061
55
7,
330
10,2
53
14,9
00
2001
3.64
66
6,
976
9,94
1 13
,638
18
960.
35
M
idw
est
47
7,87
1 10
,169
12
,118
16
,847
38
9,
096
11,9
15
15,6
10
2194
5.45
45
7,
846
10,3
24
14,4
14
1587
9.28
W
est
**
**
**
**
**
**
**
**
**
**
32
4,40
5 7,
043
10,5
98
1615
1.76
ove
rall
Car
dia
c 63
8,
481
11,3
17
14,5
25
18,2
56
85
8,47
9 11
,653
15
,083
20
,660
91
6,
976
9,94
1 14
,604
18
,960
Va
scul
ar
38
8,52
7 10
,889
11
,833
17
,613
27
7,
330
9,08
5 11
,678
18
,445
70
4,
405
8,20
6 11
,473
15
,349
ME
dA
xIO
M C
AR
dIO
VASC
ulA
R P
RO
VId
ER
CO
MP
En
SATI
On
& P
RO
du
CTI
On
Su
RV
EY
– 2
016
30
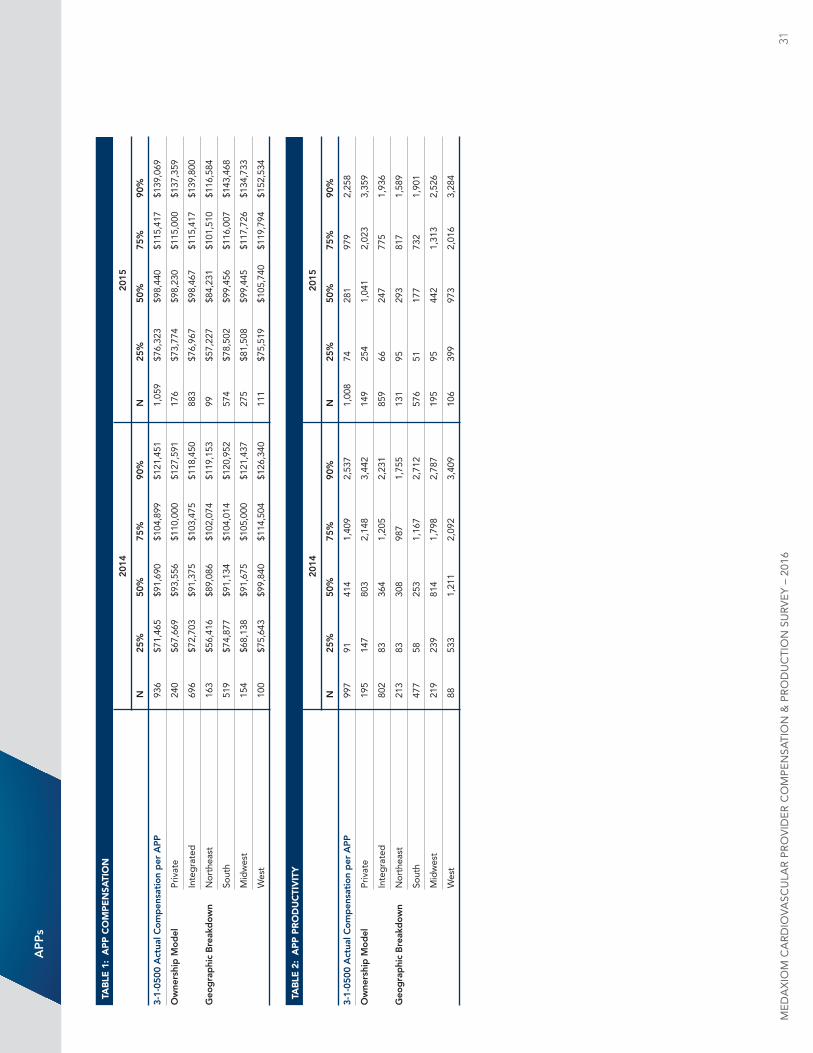
Ap
ps
TAb
lE 1
: A
PP
CO
mP
En
SATI
On
20
14
2015
n
25
%
50%
75
%
90%
n
25
%
50%
75
%
90%
3-1-
0500
Act
ual C
om
pen
sati
on
per
Ap
p
936
$71,
465
$91,
690
$104
,899
$1
21,4
51
1,05
9 $7
6,32
3 $9
8,44
0 $1
15,4
17
$139
,069
ow
ners
hip
Mo
del
Pr
ivat
e 24
0 $6
7,66
9 $9
3,55
6 $1
10,0
00
$127
,591
17
6 $7
3,77
4 $9
8,23
0 $1
15,0
00
$137
,359
In
teg
rate
d
696
$72,
703
$91,
375
$103
,475
$1
18,4
50
883
$76,
967
$98,
467
$115
,417
$1
39,8
00
geo
gra
phi
c B
reak
do
wn
nor
thea
st
163
$56,
416
$89,
086
$102
,074
$1
19,1
53
99
$57,
227
$84,
231
$101
,510
$1
16,5
84
So
uth
519
$74,
877
$91,
134
$104
,014
$1
20,9
52
574
$78,
502
$99,
456
$116
,007
$1
43,4
68
M
idw
est
154
$68,
138
$91,
675
$105
,000
$1
21,4
37
275
$81,
508
$99,
445
$117
,726
$1
34,7
33
W
est
100
$75,
643
$99,
840
$114
,504
$1
26,3
40
111
$75,
519
$105
,740
$1
19,7
94
$152
,534
TAb
lE 2
: A
PP
Pr
Od
uC
TIv
ITy
20
14
2015
n
25
%
50%
75
%
90%
n
25
%
50%
75
%
90%
3-1-
0500
Act
ual C
om
pen
sati
on
per
Ap
p
997
91
414
1,40
9 2,
537
1,00
8 74
28
1 97
9 2,
258
ow
ners
hip
Mo
del
Pr
ivat
e 19
5 14
7 80
3 2,
148
3,44
2 14
9 25
4 1,
041
2,02
3 3,
359
In
teg
rate
d
802
83
364
1,20
5 2,
231
859
66
247
775
1,93
6
geo
gra
phi
c B
reak
do
wn
nor
thea
st
213
83
308
987
1,75
5 13
1 95
29
3 81
7 1,
589
So
uth
477
58
253
1,16
7 2,
712
576
51
177
732
1,90
1
M
idw
est
219
239
814
1,79
8 2,
787
195
95
442
1,31
3 2,
526
W
est
88
533
1,21
1 2,
092
3,40
9 10
6 39
9 97
3 2,
016
3,28
4
ME
dA
xIO
M C
AR
dIO
VASC
ulA
R P
RO
VId
ER
CO
MP
En
SATI
On
& P
RO
du
CTI
On
Su
RV
EY
– 2
016
31
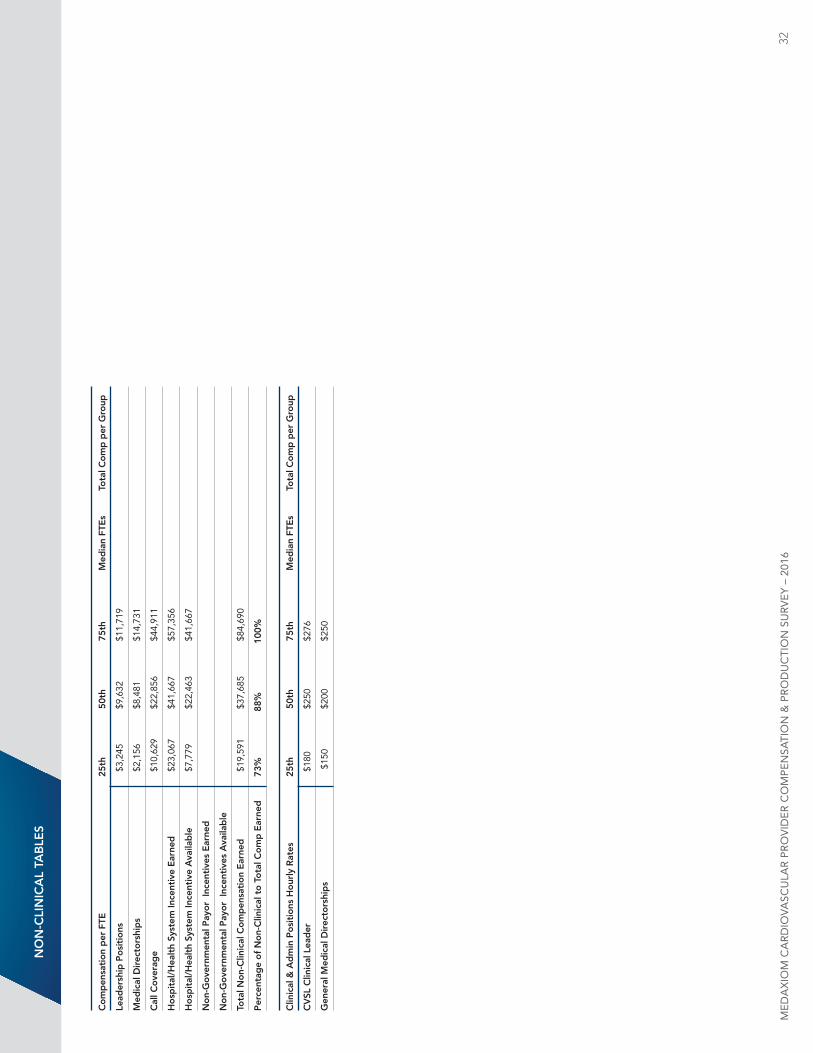
no
n-C
lin
iCA
l tA
Ble
s
Co
mp
ensa
tio
n p
er F
te
25th
5
0th
7
5th
M
edia
n Ft
es
t
ota
l Co
mp
per
gro
up
lead
ersh
ip p
osi
tio
ns
$3,
245
$
9,63
2
$11
,719
Med
ical
Dir
ecto
rshi
ps
$2,
156
$
8,48
1
$14
,731
Cal
l Co
vera
ge
$10
,629
$
22,8
56
$44
,911
Ho
spit
al/H
ealt
h sy
stem
ince
ntiv
e e
arne
d
$23
,067
$
41,6
67
$57
,356
Ho
spit
al/H
ealt
h sy
stem
ince
ntiv
e A
vaila
ble
$
7,77
9
$22
,463
$
41,6
67
no
n-g
ove
rnm
enta
l pay
or
ince
ntiv
es e
arne
d
no
n-g
ove
rnm
enta
l pay
or
ince
ntiv
es A
vaila
ble
tota
l no
n-C
linic
al C
om
pen
sati
on
ear
ned
$
19,5
91
$37
,685
$
84,6
90
per
cent
age
of
no
n-C
linic
al t
o t
ota
l Co
mp
ear
ned
73
%
88%
10
0%
Clin
ical
& A
dm
in p
osi
tio
ns H
our
ly R
ates
25
th
50t
h
75t
h
Med
ian
Fte
s
to
tal C
om
p p
er g
roup
CV
sl C
linic
al l
ead
er
$18
0
$25
0
$27
6
gen
eral
Med
ical
Dir
ecto
rshi
ps
$1
50
$20
0
$25
0
ME
dA
xIO
M C
AR
dIO
VASC
ulA
R P
RO
VId
ER
CO
MP
En
SATI
On
& P
RO
du
CTI
On
Su
RV
EY
– 2
016
32

Corporate office2050 Kings Circle Southneptune Beach, Fl 32266904.249.1880Fax 904.249.1604
Membershiplori WalshVP– [email protected]
Joel SauerVice [email protected]
Vickie Moon Executive [email protected]
JOIN US AT MeDAXioM.CoM