Embed Size (px)
Citation preview

SAP Disclosure ManagementDocument Version: 10.0 SP08 - 2014-03-13
Report Builder Help

Table of Contents1 Getting Started . . . . . . . . . . . . . . . . . . . . . . . . . . . . . . . . . . . . . . . . . . . . . . . . . . . . . . . . . . . . . . . 51.1 Overview . . . . . . . . . . . . . . . . . . . . . . . . . . . . . . . . . . . . . . . . . . . . . . . . . . . . . . . . . . . . . . . . . . . . . 51.2 Features. . . . . . . . . . . . . . . . . . . . . . . . . . . . . . . . . . . . . . . . . . . . . . . . . . . . . . . . . . . . . . . . . . . . . . 51.3 Compliance with XBRL Specifications . . . . . . . . . . . . . . . . . . . . . . . . . . . . . . . . . . . . . . . . . . . . . . . . .71.4 Intended Users. . . . . . . . . . . . . . . . . . . . . . . . . . . . . . . . . . . . . . . . . . . . . . . . . . . . . . . . . . . . . . . . . 71.5 XBRL Fundamentals. . . . . . . . . . . . . . . . . . . . . . . . . . . . . . . . . . . . . . . . . . . . . . . . . . . . . . . . . . . . . 7
1.5.1 XBRL Validation . . . . . . . . . . . . . . . . . . . . . . . . . . . . . . . . . . . . . . . . . . . . . . . . . . . . . . . . . 81.5.2 XBRL Framework. . . . . . . . . . . . . . . . . . . . . . . . . . . . . . . . . . . . . . . . . . . . . . . . . . . . . . . . 91.5.3 XBRL Taxonomy. . . . . . . . . . . . . . . . . . . . . . . . . . . . . . . . . . . . . . . . . . . . . . . . . . . . . . . . . 91.5.4 XBRL Instances. . . . . . . . . . . . . . . . . . . . . . . . . . . . . . . . . . . . . . . . . . . . . . . . . . . . . . . . . 11
2 Using Report Builder. . . . . . . . . . . . . . . . . . . . . . . . . . . . . . . . . . . . . . . . . . . . . . . . . . . . . . . . . . . 122.1 Exploring Report Builder. . . . . . . . . . . . . . . . . . . . . . . . . . . . . . . . . . . . . . . . . . . . . . . . . . . . . . . . . . 13
2.1.1 Report Builder Toolbar. . . . . . . . . . . . . . . . . . . . . . . . . . . . . . . . . . . . . . . . . . . . . . . . . . . . 142.1.2 Report Builder Icons. . . . . . . . . . . . . . . . . . . . . . . . . . . . . . . . . . . . . . . . . . . . . . . . . . . . . .152.1.3 UBmatrix Tab. . . . . . . . . . . . . . . . . . . . . . . . . . . . . . . . . . . . . . . . . . . . . . . . . . . . . . . . . . 162.1.4 Taxonomy Pane. . . . . . . . . . . . . . . . . . . . . . . . . . . . . . . . . . . . . . . . . . . . . . . . . . . . . . . . 222.1.5 Details Pane. . . . . . . . . . . . . . . . . . . . . . . . . . . . . . . . . . . . . . . . . . . . . . . . . . . . . . . . . . . 272.1.6 About Palette. . . . . . . . . . . . . . . . . . . . . . . . . . . . . . . . . . . . . . . . . . . . . . . . . . . . . . . . . . 35
2.2 Exploring Word Mapper . . . . . . . . . . . . . . . . . . . . . . . . . . . . . . . . . . . . . . . . . . . . . . . . . . . . . . . . . . 382.2.1 Word Mapper Menus. . . . . . . . . . . . . . . . . . . . . . . . . . . . . . . . . . . . . . . . . . . . . . . . . . . . . 392.2.2 Word Mapper Icons . . . . . . . . . . . . . . . . . . . . . . . . . . . . . . . . . . . . . . . . . . . . . . . . . . . . . .392.2.3 Mapping Properties Pane in Word Mapper . . . . . . . . . . . . . . . . . . . . . . . . . . . . . . . . . . . . . 402.2.4 Microsoft Word Pane in Word Mapper. . . . . . . . . . . . . . . . . . . . . . . . . . . . . . . . . . . . . . . . . 412.2.5 Taxonomy View Pane in Word Mapper . . . . . . . . . . . . . . . . . . . . . . . . . . . . . . . . . . . . . . . . 422.2.6 Units Pane in Word Mapper. . . . . . . . . . . . . . . . . . . . . . . . . . . . . . . . . . . . . . . . . . . . . . . . 422.2.7 My Patterns Pane in Word Mapper . . . . . . . . . . . . . . . . . . . . . . . . . . . . . . . . . . . . . . . . . . . 432.2.8 Contexts Pane in Word Mapper . . . . . . . . . . . . . . . . . . . . . . . . . . . . . . . . . . . . . . . . . . . . . 442.2.9 Using the Word Mapper Content Control . . . . . . . . . . . . . . . . . . . . . . . . . . . . . . . . . . . . . . .442.2.10 Changing User Preferences for Word Mapper . . . . . . . . . . . . . . . . . . . . . . . . . . . . . . . . . . . 452.2.11 Customization of the Word Mapper Interface . . . . . . . . . . . . . . . . . . . . . . . . . . . . . . . . . . . 45
2.3 What is a Report Builder template? . . . . . . . . . . . . . . . . . . . . . . . . . . . . . . . . . . . . . . . . . . . . . . . . . .482.3.1 Report Builder Metadata in Excel . . . . . . . . . . . . . . . . . . . . . . . . . . . . . . . . . . . . . . . . . . . . 49
2.4 Customize Your Report Builder Workspace . . . . . . . . . . . . . . . . . . . . . . . . . . . . . . . . . . . . . . . . . . . .502.4.1 Preferences Settings (User Preferences). . . . . . . . . . . . . . . . . . . . . . . . . . . . . . . . . . . . . . . 522.4.2 Configure Network Settings . . . . . . . . . . . . . . . . . . . . . . . . . . . . . . . . . . . . . . . . . . . . . . . . 562.4.3 User Account Control (UAC) Settings . . . . . . . . . . . . . . . . . . . . . . . . . . . . . . . . . . . . . . . . . 632.4.4 Real Time Settings. . . . . . . . . . . . . . . . . . . . . . . . . . . . . . . . . . . . . . . . . . . . . . . . . . . . . . .64
2.5 Load Taxonomy Overview. . . . . . . . . . . . . . . . . . . . . . . . . . . . . . . . . . . . . . . . . . . . . . . . . . . . . . . . 66
2 © 2014 SAP AG or an SAP affiliate company. All rights reserved.Report Builder HelpTable of Contents
2.5.1 Load a Taxonomy. . . . . . . . . . . . . . . . . . . . . . . . . . . . . . . . . . . . . . . . . . . . . . . . . . . . . . . 672.5.2 Loading a Taxonomy from a Local Directory . . . . . . . . . . . . . . . . . . . . . . . . . . . . . . . . . . . . 682.5.3 Loading a Taxonomy from the Web . . . . . . . . . . . . . . . . . . . . . . . . . . . . . . . . . . . . . . . . . . 682.5.4 Loading a Taxonomy from WebDAV . . . . . . . . . . . . . . . . . . . . . . . . . . . . . . . . . . . . . . . . . . 692.5.5 Loading Multiple Taxonomies . . . . . . . . . . . . . . . . . . . . . . . . . . . . . . . . . . . . . . . . . . . . . . .702.5.6 Reset the Taxonomy Reference . . . . . . . . . . . . . . . . . . . . . . . . . . . . . . . . . . . . . . . . . . . . . 70
2.6 Currency Codes . . . . . . . . . . . . . . . . . . . . . . . . . . . . . . . . . . . . . . . . . . . . . . . . . . . . . . . . . . . . . . . 722.7 Validation. . . . . . . . . . . . . . . . . . . . . . . . . . . . . . . . . . . . . . . . . . . . . . . . . . . . . . . . . . . . . . . . . . . . 722.8 Mapping Concepts. . . . . . . . . . . . . . . . . . . . . . . . . . . . . . . . . . . . . . . . . . . . . . . . . . . . . . . . . . . . . .73
2.8.1 Filtering the Taxonomy View . . . . . . . . . . . . . . . . . . . . . . . . . . . . . . . . . . . . . . . . . . . . . . . 752.8.2 Mapping Reportable Taxonomy Elements . . . . . . . . . . . . . . . . . . . . . . . . . . . . . . . . . . . . . . 752.8.3 Find the Data Type and Period Type of a Reportable Concept . . . . . . . . . . . . . . . . . . . . . . . . 762.8.4 Tuples . . . . . . . . . . . . . . . . . . . . . . . . . . . . . . . . . . . . . . . . . . . . . . . . . . . . . . . . . . . . . . . 772.8.5 QNames. . . . . . . . . . . . . . . . . . . . . . . . . . . . . . . . . . . . . . . . . . . . . . . . . . . . . . . . . . . . . . 78
2.9 Instances. . . . . . . . . . . . . . . . . . . . . . . . . . . . . . . . . . . . . . . . . . . . . . . . . . . . . . . . . . . . . . . . . . . . 792.9.1 Instance. . . . . . . . . . . . . . . . . . . . . . . . . . . . . . . . . . . . . . . . . . . . . . . . . . . . . . . . . . . . . . 792.9.2 Using the Instance Editor . . . . . . . . . . . . . . . . . . . . . . . . . . . . . . . . . . . . . . . . . . . . . . . . . 802.9.3 Instance Reports . . . . . . . . . . . . . . . . . . . . . . . . . . . . . . . . . . . . . . . . . . . . . . . . . . . . . . . 822.9.4 Importing an XBRL Instance Document . . . . . . . . . . . . . . . . . . . . . . . . . . . . . . . . . . . . . . . 83
2.10 Contextual Information . . . . . . . . . . . . . . . . . . . . . . . . . . . . . . . . . . . . . . . . . . . . . . . . . . . . . . . . . . 862.10.1 Contexts . . . . . . . . . . . . . . . . . . . . . . . . . . . . . . . . . . . . . . . . . . . . . . . . . . . . . . . . . . . . . 862.10.2 Units and Unit Patterns . . . . . . . . . . . . . . . . . . . . . . . . . . . . . . . . . . . . . . . . . . . . . . . . . . . 932.10.3 Footnotes . . . . . . . . . . . . . . . . . . . . . . . . . . . . . . . . . . . . . . . . . . . . . . . . . . . . . . . . . . . . 1012.10.4 Dimensions . . . . . . . . . . . . . . . . . . . . . . . . . . . . . . . . . . . . . . . . . . . . . . . . . . . . . . . . . . .1072.10.5 Scenarios and Segments . . . . . . . . . . . . . . . . . . . . . . . . . . . . . . . . . . . . . . . . . . . . . . . . . 110
2.11 About Mapping . . . . . . . . . . . . . . . . . . . . . . . . . . . . . . . . . . . . . . . . . . . . . . . . . . . . . . . . . . . . . . . 1122.11.1 Mapping Workflow . . . . . . . . . . . . . . . . . . . . . . . . . . . . . . . . . . . . . . . . . . . . . . . . . . . . . . 1132.11.2 Organize your Mapping Project . . . . . . . . . . . . . . . . . . . . . . . . . . . . . . . . . . . . . . . . . . . . . 1162.11.3 Mapping in Microsoft Office Excel . . . . . . . . . . . . . . . . . . . . . . . . . . . . . . . . . . . . . . . . . . . 1172.11.4 Mapping in Microsoft Office Word . . . . . . . . . . . . . . . . . . . . . . . . . . . . . . . . . . . . . . . . . . . 164
2.12 Import External Data. . . . . . . . . . . . . . . . . . . . . . . . . . . . . . . . . . . . . . . . . . . . . . . . . . . . . . . . . . . 1682.12.1 Link to an External Data Source . . . . . . . . . . . . . . . . . . . . . . . . . . . . . . . . . . . . . . . . . . . . 169
2.13 Reports. . . . . . . . . . . . . . . . . . . . . . . . . . . . . . . . . . . . . . . . . . . . . . . . . . . . . . . . . . . . . . . . . . . . . 1702.13.1 Save Reports. . . . . . . . . . . . . . . . . . . . . . . . . . . . . . . . . . . . . . . . . . . . . . . . . . . . . . . . . . 1712.13.2 Print Reports. . . . . . . . . . . . . . . . . . . . . . . . . . . . . . . . . . . . . . . . . . . . . . . . . . . . . . . . . . 1712.13.3 Customize Reports. . . . . . . . . . . . . . . . . . . . . . . . . . . . . . . . . . . . . . . . . . . . . . . . . . . . . . 1712.13.4 Localize Reports. . . . . . . . . . . . . . . . . . . . . . . . . . . . . . . . . . . . . . . . . . . . . . . . . . . . . . . 1732.13.5 Preview. . . . . . . . . . . . . . . . . . . . . . . . . . . . . . . . . . . . . . . . . . . . . . . . . . . . . . . . . . . . . . 1742.13.6 Report Validation. . . . . . . . . . . . . . . . . . . . . . . . . . . . . . . . . . . . . . . . . . . . . . . . . . . . . . . 1762.13.7 Templates, Reports, and Log Files . . . . . . . . . . . . . . . . . . . . . . . . . . . . . . . . . . . . . . . . . . .1832.13.8 Save XBRL Instance Documents and Reports. . . . . . . . . . . . . . . . . . . . . . . . . . . . . . . . . . . 184
Report Builder HelpTable of Contents © 2014 SAP AG or an SAP affiliate company. All rights reserved. 3

2.13.9 Logs. . . . . . . . . . . . . . . . . . . . . . . . . . . . . . . . . . . . . . . . . . . . . . . . . . . . . . . . . . . . . . . . 1882.14 Tools. . . . . . . . . . . . . . . . . . . . . . . . . . . . . . . . . . . . . . . . . . . . . . . . . . . . . . . . . . . . . . . . . . . . . . 192
2.14.1 Manage Rules Overview. . . . . . . . . . . . . . . . . . . . . . . . . . . . . . . . . . . . . . . . . . . . . . . . . . 193
3 EDGAR Filer Support . . . . . . . . . . . . . . . . . . . . . . . . . . . . . . . . . . . . . . . . . . . . . . . . . . . . . . . . . 2063.1 EDGAR Workspace Settings . . . . . . . . . . . . . . . . . . . . . . . . . . . . . . . . . . . . . . . . . . . . . . . . . . . . . 2063.2 EDGAR Filer Manual Validation . . . . . . . . . . . . . . . . . . . . . . . . . . . . . . . . . . . . . . . . . . . . . . . . . . . .2073.3 Setting EDGAR Filer Manual Validation Input Parameters . . . . . . . . . . . . . . . . . . . . . . . . . . . . . . . . . 2083.4 Running EDGAR Filer Manual Validation . . . . . . . . . . . . . . . . . . . . . . . . . . . . . . . . . . . . . . . . . . . . . 2093.5 Reading an EDGAR Filer Manual Validation Report . . . . . . . . . . . . . . . . . . . . . . . . . . . . . . . . . . . . . . 2103.6 Preview an EDGAR Filing. . . . . . . . . . . . . . . . . . . . . . . . . . . . . . . . . . . . . . . . . . . . . . . . . . . . . . . . . 211
4 inline XBRL Support . . . . . . . . . . . . . . . . . . . . . . . . . . . . . . . . . . . . . . . . . . . . . . . . . . . . . . . . . . 2134.1 Save an inline XBRL Report. . . . . . . . . . . . . . . . . . . . . . . . . . . . . . . . . . . . . . . . . . . . . . . . . . . . . . . 2144.2 HTML Fragments . . . . . . . . . . . . . . . . . . . . . . . . . . . . . . . . . . . . . . . . . . . . . . . . . . . . . . . . . . . . . 2154.3 inline XBRL Sample . . . . . . . . . . . . . . . . . . . . . . . . . . . . . . . . . . . . . . . . . . . . . . . . . . . . . . . . . . . . 2164.4 inline XBRL Resources . . . . . . . . . . . . . . . . . . . . . . . . . . . . . . . . . . . . . . . . . . . . . . . . . . . . . . . . . . 2184.5 inline XBRL FAQ . . . . . . . . . . . . . . . . . . . . . . . . . . . . . . . . . . . . . . . . . . . . . . . . . . . . . . . . . . . . . . 218
5 Important Disclaimers on Legal Aspects. . . . . . . . . . . . . . . . . . . . . . . . . . . . . . . . . . . . . . . . . . . 220
4 © 2014 SAP AG or an SAP affiliate company. All rights reserved.Report Builder HelpTable of Contents

1 Getting Started This section provides basic knowledge on Report Builder product and the XBRL technology.
This section comprises information on the following topics:
● Overview [page 5]● Features [page 5]● Compliance with XBRL Specifications [page 7]● Intended Users [page 7]● XBRL Fundamentals [page 7]
1.1 Overview
Report Builder is an application that facilitates creating, interacting with, and validating XBRL documents. Whether you are preparing your company's financial statements, consolidating financial data, or managing your yearly budgeting process, Report Builder makes business reporting smarter and simpler.
Report Builder can easily be integrated with manual or automated workflows. Report Builder leverages the familiar user interface of Microsoft Office products, enabling users to easily prepare, import, review, and analyze XBRL data. Preparers can assemble data using Microsoft Excel and Microsoft Word.
Integrators can automate the workflow programmatically using the Report Builder API.
Report Builder comes with the industry-leading XBRL processor, Processing Engine, so your validated XBRL documents are guaranteed to comply with the XBRL specifications and the business rules in the associated taxonomy.
Related Information
Using Report Builder [page 12]Intended Users [page 7]Features [page 5]
1.2 Features
Report Builder offers a rich set of features that extend the capabilities of Microsoft Excel and Microsoft Word for creating and editing XBRL-enabled financial reports that are fully compliant with the current XBRL.org specifications.
Report Builder features include:
Report Builder HelpGetting Started © 2014 SAP AG or an SAP affiliate company. All rights reserved. 5
● Load, view, validate, and map XBRL taxonomies● Generate or import XBRL instance documents● Validate and edit XBRL instance documents● View, search, and filter details about loaded XBRL taxonomies● Generate reports using predefined templates and XSLT scripts for:
○ Validation reports showing XML and XBRL results from the embedded XBRL processing engine○ XBRL formula trace reports that validate instance data based on your selections from an expandable
library of business rules○ Calculation trace reports that identify mathematical errors in a financial report
● Mapping reports for tuples, mapped or unmapped data, incomplete or duplicate mappings, and mapping definitions
● Mapping file that captures mappings that can be imported to XBRL-enabled unmapped workbooks● EDGAR Filer support:
○ Built-in EDGAR files manual validation○ Built-in SEC interactive data previewer for XBRL instances that reference US GAAP or IFRS taxonomies
● Easy-to-use drag and drop capability for mapping reportable concepts, tuples, contexts, units of measure, footnotes, QNames in Microsoft Excel 2007 and Microsoft Excel 2010
● Importing and mapping text and numeric data in linked Microsoft Word 2007 and Microsoft Word 2010 documents
● Inline XBRL (iXBRL) support● Importing mapping file or XBRL instance document● Bulk update to revise all occurrences of multiple contexts in a Report Builder template● Attaching or managing rules from a library of cataloged business rules (XBRL Formula 1.0)● Password-protecting Report Builder template to protect mappings● Localizing Report Builder● Customizing the Report Builder workspace:
○ Color scheme○ Default company identifiers and branding○ Data synchronization, granular validation, tooltips○ Logging○ Messaging○ Proxy server○ Web caching○ Work offline
● API to automate instance validation and integrate with other applications and existing workflows
Related Information
Overview [page 5]Exploring Report Builder [page 13]Exploring Word Mapper [page 38]
6 © 2014 SAP AG or an SAP affiliate company. All rights reserved.Report Builder Help
Getting Started
1.3 Compliance with XBRL Specifications
Report Builder's integrated processing engine provides compliant XBRL 2.1, XBRL Dimension, XBRL Formula 1.0, and XBRL Generic Linkbase Processors; these capabilities qualify it as a compliant XBRL processor that is fully conformant to the following XBRL.org specifications:
● XBRL 2.1● XBRL Dimensions 1.0● XBRL Dimension Aggregation 1.0 (implemented with Internal Working Draft 2005)● Financial Reporting Taxonomies Architecture (FRTA) 1.0● XBRL Formula 1.0● Function Registry● XBRL Generic Linkbase● XBRL Link Role Registry
The processing engine is also fully conformant to the following XBRL.org test suites:
● XBRL 2.1● XBRL Formula 1.0● XBRL Dimensions 1.0● XBRL Dimension Aggregation 1.0● Financial Reporting Taxonomies Architecture (FRTA) 1.0● XBRL Generic Linkbase
NoteUpdates and additions to published XBRL.org specifications and XBRL.org conformance test cases may lead to changes in XBRL Processor validation results.
1.4 Intended Users
Report Builder is designed to assist:
● Data Modelers who are tasked with creating and circulating Report Builder templates for capturing data● Report Submitters who are tasked with filling in data and submitting reports using report templates● Business Managers who are tasked with collating, consolidating, and analyzing data from various submitters
1.5 XBRL Fundamentals
Extensible Business Reporting Language (XBRL) defines a syntax for business reporting specifications to ensure that transmitted documents (a call report, financial statement, loan application, or a tax return) comply with business rules.
Report Builder HelpGetting Started © 2014 SAP AG or an SAP affiliate company. All rights reserved. 7
Data integration is one of the greatest challenges and opportunities that organizations face today. XBRL is all about integrating data, processes, and people across and beyond your organization while providing you with the ability to leverage your existing IT investments. XBRL enables you to have the flexibility to adapt quickly to changing business conditions. XBRL delivers intelligent data integration by automating the creation, validation, exchange, analysis, and reporting of business information.
With XBRL, your ability to convert report data from multiple systems, groups, and parties is significantly improved. XBRL solutions provide an open platform that supports the entire network of interrelated business reporting activities. As applications increase their utilization of XBRL, opportunities to leverage XBRL will expand exponentially, and XBRL can play a significant role in every aspect of global business reporting.
Related Information
Compliance with XBRL Specifications [page 7]XBRL Validation [page 8]XBRL Framework [page 9]XBRL Taxonomy [page 9]XBRL Instances [page 11]
1.5.1 XBRL Validation
Report Builder performs consistency checks and provides the following automated XML and XBRL validation to improve the quality of financial reports:
● Granular validation validates a cell as it is being mapped or edited, see Granular Validation [page 65].● Taxonomy validation identifies any errors in the loaded taxonomy. You can validate the loaded taxonomy at
any time. For more information, see Taxonomy Validation Tab [page 35].● Report validation validates the XML and XBRL in an XBRL instance, with optional validation checks for the
following error types:
○ Arithmetic errors for mapped facts, see Reports: Calculation Trace [page 178]○ Consistency errors based on business rules that you define, see Reports: XBRL Formula Trace [page
180]
For more information, see Report Validation [page 176].
The XBRL US white paper, Avoiding Common Errors in XBRL Creation, describes common consistency errors that can be handled by XBRL validation, for example:
● Value required to be reported when another value is reported● Value should be zero or not disclosed if another value is not reported● Required value not reported
8 © 2014 SAP AG or an SAP affiliate company. All rights reserved.Report Builder Help
Getting Started
Related Information
Compliance with XBRL Specifications [page 7]
1.5.2 XBRL Framework
Extensible Business Reporting Language (XBRL) defines a syntax, in which a business fact can be reported as the value of a well-defined reporting concept within a particular context.
Let's assume, for example, that the value of land in the year 2009 is 100 (thousand) U.S. Dollars, where:
● Concept = Land● Context = 2009 (year)● Fact value = 100 (thousand U.S. Dollars)
The XBRL framework splits business reporting information into two components:
● XBRL instance documents: Contain the facts being reported● XBRL taxonomies: Define the concepts being communicated by the facts
The combination of an XBRL instance and its supporting taxonomies and additional linkbases constitute an XBRL business report.
Report Builder incorporates the XBRL framework and facilitates business report generation.
Related Information
XBRL Taxonomy [page 9]XBRL Instances [page 11]
1.5.3 XBRL Taxonomy
An XBRL taxonomy is a description and classification system for the contents of financial statements and other business reporting documents.
For financial reporting, XBRL taxonomies contain the financial and non-financial concepts that must be presented in financial statements or the explanatory disclosures. XBRL instances contain the fact values being reported and XBRL taxonomies define the concepts being communicated by the facts.
An XBRL taxonomy contains definitions and relationships that can be classified as either a Taxonomy Concept or a Taxonomy Linkbase.
Report Builder HelpGetting Started © 2014 SAP AG or an SAP affiliate company. All rights reserved. 9
Taxonomy Concept
In XBRL terminology, a concept is the definition of a reporting term.
In a taxonomy schema, a concept has a name and a type, where type defines the data type allowed for facts, which are measured according to the concept definition.
For example, a cash concept would typically have a monetary type. This declares that when cash is reported, its value will be monetary.
NoteAn XBRL instance document contains details about data types. For example, for monetary data type it is Euros, Dollars (US, Australian), or some other currency. For precision and decimals it is reported in millions, or thousands.
In contrast, an <accountingPoliciesNote> concept would typically have a string type so that, when the <accountingPoliciesNote> is reported in an XBRL instance, its value will be interpreted as a string of characters.
Taxonomy Linkbase
A linkbase is a collection of extended links that further document the meaning of concepts in a taxonomy by expressing relationships between concepts and by relating concepts to their documentation:
● Definition, calculation, and presentation linkbases express the relationships between taxonomy concepts.● Label and reference linkbases express relationships between concepts and their documentation.● Formula linkbases can be used to express and enforce business rules that pertain to the concepts and
reported values.
Working with Taxonomies in Report Builder
Report Builder enables you to explore interrelationships between various concepts defined in a taxonomy and provides an interface for viewing all five extended link types. For more information, see the following topics:
● Exploring Report Builder [page 13] describes the Report Builder user interface.● Preferences Settings (User Preferences) [page 52] shows you how to set the default behaviors in Report
Builder.● Taxonomy Pane [page 22] shows you how to use Report Builder to view different aspects of a taxonomy.● About Mapping [page 112] shows you how to use Report Builder to start building an XBRL-enabled Report
Builder template.
10 © 2014 SAP AG or an SAP affiliate company. All rights reserved.Report Builder Help
Getting Started

Related Information
Formula Input Parameters [page 201]Views [page 55]Presentation View [page 23]Calculation View [page 24]Definition View [page 25]
1.5.4 XBRL Instances
An XBRL instance contains a collection of fact values for the concepts that are defined in one or more XBRL taxonomies. In addition to the data (fact values), an XBRL instance document also contains references to the taxonomy and the contextual information necessary for interpreting each fact value. For numeric facts, the XBRL instance also documents measurement accuracy and measurement units.
For example, a fact in an XBRL instance document contains numeric data: 5,000,000, together with the context (cash flow), reporting period (the year ending 21 December 2009), the currency (US dollars) and other details, such as reporting entity (company name and entity identifier).
The combination of an XBRL instance together with its supporting taxonomies and linkbases constitutes an XBRL business report.
Report Builder HelpGetting Started © 2014 SAP AG or an SAP affiliate company. All rights reserved. 11

2 Using Report BuilderReport Builder is a Microsoft Office add-in that enables you to associate, map, and validate XBRL in Microsoft Office 2007 or Microsoft Office 2010.
The Report Builder graphical user interface extends the capabilities of an Microsoft Excel workbook and displays details about XBRL taxonomy items mapped or loaded in the current Excel workbook, including the ability to map facts and contextual details in a linked Microsoft Word document. Built-in features support XBRL validation and enable you to generate and validate XBRL instance data.
Report Builder saves metadata about an XBRL taxonomy, mapped taxonomy elements, and contextual information as custom properties in an Excel workbook. The metadata and mapping information represents an XBRL-enabled workbook, or Report Builder template, that can be used to generate a valid XBRL instance document from financial data in a mapped workbook.
The intended users of a Report Builder template can use an XBRL-enabled workbook:
● as an input form to collect or view financial data, including numeric or non-numeric data from linked external sources (including Microsoft Word documents)
● to assemble, generate, and validate, and save an XBRL instance document from financial data in a workbook● to retrieve, view, edit, and save XBRL instance data from XBRL instance documents● as the source for exporting a Mappings Report that can be imported to transform unmapped Excel reports
into XBRL-enabled financial data● to catalog and run a library of business rules to validate or analyze reported data● to validate a taxonomy or extension taxonomy● to generate custom reports for all of the above
To learn more about Report Builder or to start using a particular feature or function, see:
What is a Report Builder template? [page 48] Shows the metadata (elements and properties) that transform an unmapped Microsoft Excel into an XBRL-enabled Report Builder.
Customize Your Report Builder Workspace [page 50] Define the environment for Report Builder: set preferences and default values, network options, web cache and taxonomy locations.
Exploring Report Builder [page 13] Overview and references for Report Builder screens, icons, and toolbars.
Exploring Word Mapper [page 38] Overview and references for Word Mapper screens, icons, and panes.
About Mapping [page 112] Overview of mapping a spreadsheet report with taxonomy elements and related contextual items.
Mapping Reports [page 156] Reports that show workbook mappings and help you assess completeness and accuracy.
Instance Editor Tab [page 31] View and revise mapped facts in a sortable grid.
12 © 2014 SAP AG or an SAP affiliate company. All rights reserved.Report Builder Help
Using Report Builder

Import External Data [page 168] Load fact data, mapping information, or contextual definitions from other files.
Report Validation [page 176] Run and review validation reports for mapped facts or an imported XBRL instance document.
Validation [page 72] Set or view built-in validation options and warnings for a taxonomy, for mapped cells, and for calculation and rules based reports.
Preview [page 174] Preview mapped data prior to saving as an XBRL instance document.
Save XBRL Instance Documents and Reports [page 184]
Save validated mapped fact data as an XBRL instance document or inline XBRL instance report.
Related Information
Intended Users [page 7]EDGAR Filer Support [page 206]
2.1 Exploring Report BuilderReport Builder provides XBRL functionality as a flexible and easily-configured add-on to Microsoft Excel and Microsoft Word.
The UBmatrix tab on the Microsoft Excel ribbon and the tabbed interface provides intuitive access to functionality and makes features and settings easy to find and use. Report Builder is an extension to the standard menus in Microsoft Excel or Microsoft Word for adding XBRL to your workbooks and documents.
Frequently used Report Builder functions can be added to the Quick Access toolbar, and keyboard shortcuts provide access to Report Builder features. XBRL metadata associated with mappings is saved in the workbook and can be automatically saved in a mapping file. The mapping file can be imported into similarly-formatted workbooks to XBRL-enable the financial report.
The Report Builder graphical user interface is a floating window that can be resized or minimized within the window of an open Microsoft Excel workbook.
Pause over Report Builder Icons [page 15] icons or mapped cells to view descriptions or detailed information in a tooltip. You can view and drill down into the loaded taxonomies from Report Builder:
● The Taxonomy Views [page 22] shows hierarchical relationships defined in the loaded taxonomies or taxonomy linkbases.
● The Details Pane [page 27] shows details about the loaded taxonomies, selected taxonomy element, and taxonomy mappings. Some attributes of mapped taxonomy elements can be edited from the Details pane.
Both panes are scrollable and offer views or tabs that can be resized to display the taxonomy information you want to see. The toolbar provides access for changing views of the taxonomies, viewing contextual information
Report Builder HelpUsing Report Builder © 2014 SAP AG or an SAP affiliate company. All rights reserved. 13

that is related to but not defined in the loaded taxonomies, viewing mapped cells, or opening secondary floating windows for user preferences. Secondary windows can be moved and resized outside and independent of the Excel window.
When you open a mapped workbook, import a mappings report, or Load Taxonomy Overview [page 66], the Report Builder window shows the associated XBRL taxonomy. If you load more than one taxonomy, Report Builder displays the XBRL taxonomy details for those taxonomies.
Report Builder adds options to the right-click context menu in Microsoft Excel for viewing mappings associated with a cell, and adds a UBmatrix Tab [page 16] to the Microsoft Excel ribbon.
Related Information
About Palette [page 35]Preferences Settings (User Preferences) [page 52]Report Builder Icons [page 15]UBmatrix Tab [page 16]Exploring Word Mapper [page 38]
2.1.1 Report Builder Toolbar
The Report Builder user interface makes it easy for you to add or edit XBRL mappings in a Microsoft Excel workbook.
Report Builder mapping functions are organized in task-oriented tabs. Toolbars and right-click context menus provide shortcuts to mapping functions. Options enable you to show or hide icon names, context and unit definitions, and validation warnings or exceptions for individual cells as you add mappings.
The Report Builder toolbar provides instant access to concept relationships defined in the current taxonomy, to contextual information in your libraries and in the current workbook, to preferences for Report Builder default values or default behavior, and for viewing or editing mappings and fact data in the current workbook.
NoteTo view the name of an icon on the Report Builder toolbar, click an icon to select it and then pause the pointer over it.
Icon Name Functionality
Home Show the default taxonomy relationship view.
Palette Open a tabbed palette for defining, mapping, or editing contextual information in the workbook or in your library.
Preferences Open tabbed preferences for setting default values and default behaviors for Report Builder.
14 © 2014 SAP AG or an SAP affiliate company. All rights reserved.Report Builder Help
Using Report Builder
Icon Name Functionality
Taxonomy View Display taxonomy elements based on the relationships defined in the taxonomy linkbases (presentation, calculation, definition, and schema).
Taxonomy Hierarchy View Show or hide a hierarchical view of the schema and linkbase files in the DTS. When enabled, two additional taxonomy tabs are available:
● Taxonomy Details shows details about the selected schema or linkbase file
● Taxonomy Validation validates the taxonomy and shows any errors
Arcroles Show or hide the arcroles available in the current taxonomy relationship view.
Expand/Hide All Show or hide all the child elements and nodes for the current relationship view of the taxonomy.
Filter View Toggle to restrict the taxonomy view to elements in a selected linkbase or schema node.
View Incomplete Mappings Toggle to outline all partially mapped cells in the workbook.
Related Information
Exploring Report Builder [page 13]Report Builder Icons [page 15]Contextual Information [page 86]
2.1.2 Report Builder Icons
The Report Builder user interface makes it easy for you to add or edit XBRL mappings in a Microsoft Excel workbook.
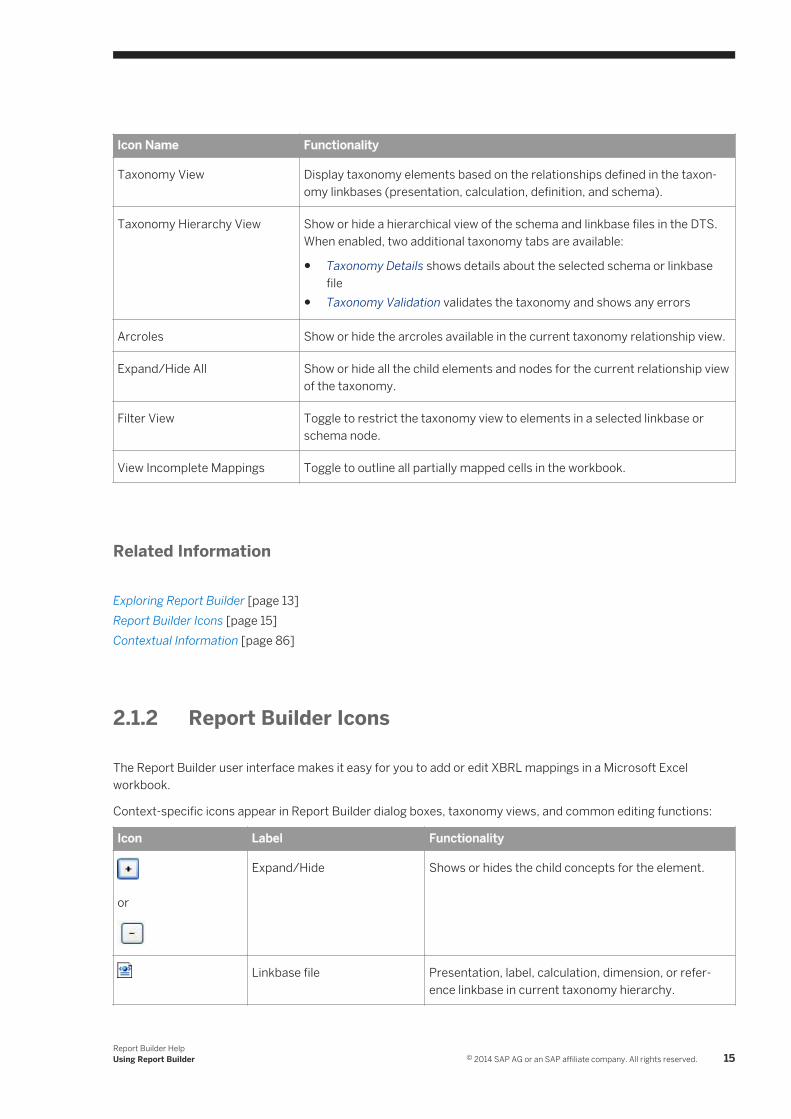
Context-specific icons appear in Report Builder dialog boxes, taxonomy views, and common editing functions:
Icon Label Functionality
or
Expand/Hide Shows or hides the child concepts for the element.
Linkbase file Presentation, label, calculation, dimension, or reference linkbase in current taxonomy hierarchy.
Report Builder HelpUsing Report Builder © 2014 SAP AG or an SAP affiliate company. All rights reserved. 15

Icon Label Functionality
Taxonomy (schema) file Schema in current taxonomy hierarchy.
-- Scrolls left or right for additional tabs in the Details pane or UBmatrix tab.
Dimension (Explicit or Typed) An equation that provides a dimensional information for a concept in a taxonomy.
Footnote A defined but unmapped footnote.
New Opens a context-specific dialog box for creating a new footnote, context, unit or other element for a taxonomy or instance.
Edit Opens a dialog box to change the definition or attributes of the currently selected element in a taxonomy or instance.
Delete Deletes the currently selected item (pattern, unit, context, footnote) from the palette. Deleting a unit or context removes the mappings for it from the workbook.
Ellipsis/Continue Opens a secondary dialog box for selecting content for a field.
Bulk Update Update the contexts in the current spreadsheet.
Search Search options the current taxonomy.
Related Information
Import External Data [page 168]Instance Reports [page 82]Contextual Information [page 86]Exploring Report Builder [page 13]
2.1.3 UBmatrix Tab
Report Builder adds a UBmatrix tab to the Microsoft Excel ribbon. From the UBmatrix tab, you can quickly access Report Builder functions.
When you open a new workbook, the following Report Builder tasks are available:
16 © 2014 SAP AG or an SAP affiliate company. All rights reserved.Report Builder Help
Using Report Builder
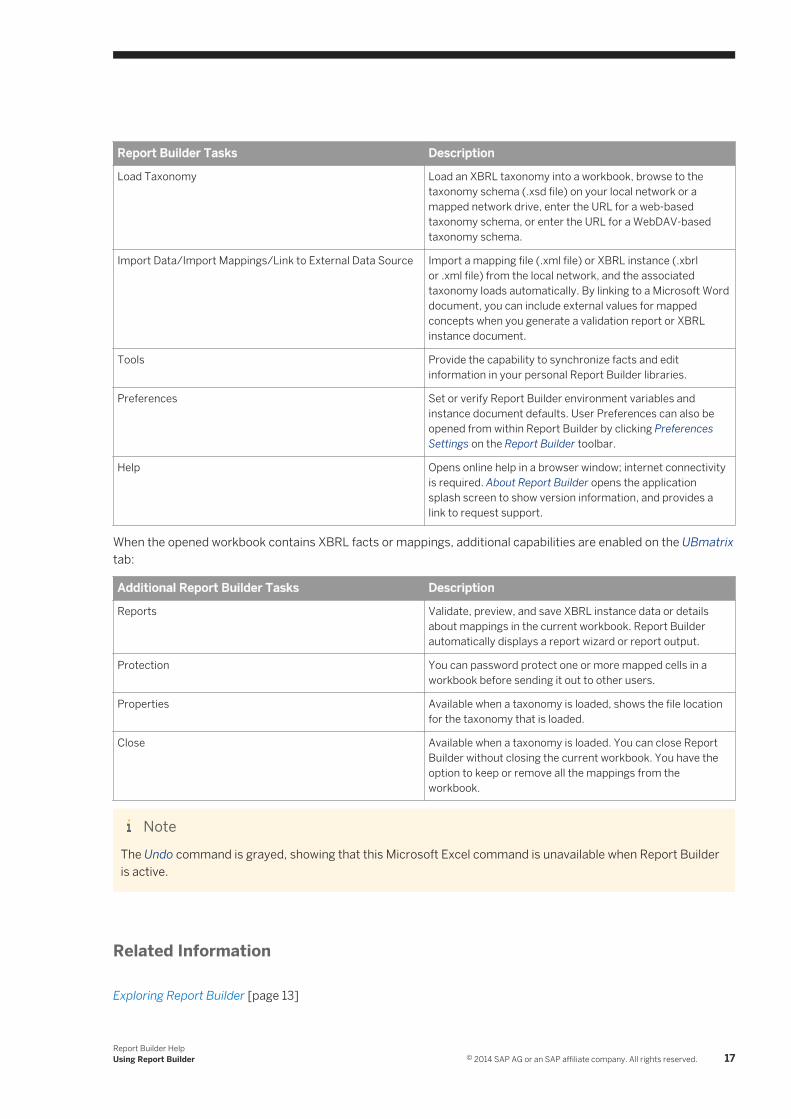
Report Builder Tasks Description
Load Taxonomy Load an XBRL taxonomy into a workbook, browse to the taxonomy schema (.xsd file) on your local network or a mapped network drive, enter the URL for a web-based taxonomy schema, or enter the URL for a WebDAV-based taxonomy schema.
Import Data/Import Mappings/Link to External Data Source Import a mapping file (.xml file) or XBRL instance (.xbrl or .xml file) from the local network, and the associated taxonomy loads automatically. By linking to a Microsoft Word document, you can include external values for mapped concepts when you generate a validation report or XBRL instance document.
Tools Provide the capability to synchronize facts and edit information in your personal Report Builder libraries.
Preferences Set or verify Report Builder environment variables and instance document defaults. User Preferences can also be opened from within Report Builder by clicking Preferences Settings on the Report Builder toolbar.
Help Opens online help in a browser window; internet connectivity is required. About Report Builder opens the application splash screen to show version information, and provides a link to request support.
When the opened workbook contains XBRL facts or mappings, additional capabilities are enabled on the UBmatrix tab:
Additional Report Builder Tasks Description
Reports Validate, preview, and save XBRL instance data or details about mappings in the current workbook. Report Builder automatically displays a report wizard or report output.
Protection You can password protect one or more mapped cells in a workbook before sending it out to other users.
Properties Available when a taxonomy is loaded, shows the file location for the taxonomy that is loaded.
Close Available when a taxonomy is loaded. You can close Report Builder without closing the current workbook. You have the option to keep or remove all the mappings from the workbook.
NoteThe Undo command is grayed, showing that this Microsoft Excel command is unavailable when Report Builder is active.
Related Information
Exploring Report Builder [page 13]
Report Builder HelpUsing Report Builder © 2014 SAP AG or an SAP affiliate company. All rights reserved. 17
2.1.3.1 Protecting a Report Builder Template
A fully-mapped Report Builder template can be locked to restrict access to certain features of Report Builder.
Protect a Report Builder template to prevent a particular user role from accessing certain features in the current Report Builder template. For example, you can disable users from opening or changing one or more taxonomy views in Microsoft Excel.
To protect an open Report Builder template, proceed as follows:
1. In the UBmatrix tab, click Protection and then click Protect Template.2. In the Protect Template dialog box, click the Protect Template option.3. Optionally, enter a password. Passwords are case sensitive.
NoteIf you lose or forget the password, it cannot be recovered.
4. Expand the tree view and click to select the Report Builder features you want to hide or lock. One or more items must be selected in order to protect the current template.
5. Click OK .
Related Information
About Mapping [page 112]What is a Report Builder template? [page 48]
2.1.3.2 Undo
If Report Builder is inactive, the Undo feature in Microsoft Excel is available; when a taxonomy is loaded, Report Builder disables the Undo feature to support data synchronization.
You can set Report Builder inactive in the following ways:
● Manage whether a taxonomy loads when you open a mapped workbook. Set your preferences so that you control if and when a taxonomy loads.
● Close Report Builder. Use the Close group to save or discard mapping information in the current workbook or use Detach and Close Report Builder to delete all mappings and close the current workbook.
● Reset whether Report Builder is available as a COM add-in at startup. For more information, see Managing Report Builder as a COM Add-in [page 20].
Related Information
Synchronization [page 119]
18 © 2014 SAP AG or an SAP affiliate company. All rights reserved.Report Builder Help
Using Report Builder
Global Update [page 125]
2.1.3.3 File Properties
The File Properties dialog box is a read-only display of the file name and location for the currently loaded taxonomy.
● Name: the filename of the currently loaded taxonomy schema● Location: the fully qualified filename or web address of the currently loaded taxonomy schema● <Size>: the file size
When a mappings report is imported, the schema location and target namespace in the mappings report are compared with the taxonomy schema location for the loaded taxonomy (visible from File Properties) and the target namespace in that file.
If the taxonomy identifiers in an imported Instance and mappings report conflict, Report Builder prompts you to locate the correct schema. Use the File Properties to identify the location of the loaded taxonomy, and to reconcile the following elements by editing the files in a text editor:
● Target namespace - the taxonomy <URI >● Schema location● Target namespace prefix
Related Information
Importing an XBRL Instance Document [page 83]Import Mappings Report [page 136]UBmatrix Tab [page 16]
2.1.3.4 Close Report Builder
Use the Close group tab on the Report Builder toolbar to save or discard mapping information in the current Microsoft Excel workbook. Use Detach and Close Report Builder to delete all mappings and close the current workbook.
To close Report Builder without closing the workbook
1. In the Close group, click Close Report Builder.2. To save your changes, click No and save the Microsoft Excel workbook first and then repeat this process.
If you do not want to save mapping changes, click Yes.3. Report Builder closes, and the workbook remains open.4. To verify that the mappings are available, close Microsoft Excel, and then reopen the saved workbook in
Microsoft Excel.
Report Builder HelpUsing Report Builder © 2014 SAP AG or an SAP affiliate company. All rights reserved. 19
5. Click to select a mapped cell, then right-click and select View Mappings .6. Existing mappings for the cell display as values for Concept Name, Context ID , and Unit Id .
2.1.3.5 Managing Report Builder as a COM Add-in
Report Builder is a COM Add-in to Microsoft Office. During installation, Report Builder creates a UBmatrix tab on the Microsoft Office ribbon and a UBmatrix menu on the Add-Ins tab, both designed to help you quickly find the commands that you need to complete a task. The Report Builder application does not display until a taxonomy is loaded.
Typically configured, when you open a mapped workbook, Report Builder automatically initializes and loads the associated taxonomy. For an unmapped workbook, Report Builder set up functions are available through the UBmatrix tab in the Microsoft Excel tab and the UBmatrix menu in the Microsoft Excel Add-Ins tab.
If the UBmatrix tab or menu is not visible when you open Microsoft Excel, use one or more of the following procedures to enable the Report Builder add-in:
● Enabling Report Builder as an Add-In [page 20]● Setting the Microsoft Office Trusted Location [page 21]● Revising User Account Control Settings to Enable Add-Ins [page 21]
RememberThese procedures may require administrator privileges. If you are unable to complete a procedure, check with your network administrator for additional information.
Related Information
Enable or Disable Automated Global Update [page 126]
2.1.3.5.1 Enabling Report Builder as an Add-In
If the Report Builder COM add-in was unloaded by an abnormal shutdown of Microsoft Excel, use this procedure to re-enable the add-in.
To enable the Report Builder add-in for Microsoft Excel:
1. From Microsoft Excel, click the Microsoft Office button, and then click Excel Options.2. In the Excel Options dialog box, click Add-Ins .3. To locate the Report Builder mscoree.dll CIN Add-in, sort the add-ins list by name, location, or type.
4. If mscoree.dll is in the Inactive Application Add-ins or Disabled Application Add-ins list, enable it as follows:
a) In the Manage list, click COM Add-ins, and then click Go.b) In the COM Add-Ins dialog box, select the check box for Report Builder, and then click OK.
20 © 2014 SAP AG or an SAP affiliate company. All rights reserved.Report Builder Help
Using Report Builder
5. If mscoree.dll is not listed as an add-in, Report Builder may be disabled. To enable a disabled COM Add-in as follows:a) In the Excel Options dialog box, in the Manage list, click Disabled Items, and then click Go.b) In the Disabled Items list box, click Addin: EDGAR Online UBmatrix Report Builder (mscoree.dll), and then
click Enable.6. In the Excel Options dialog box, click OK, and then restart Microsoft Excel.
Report Builder ( mscoree.dll) should load at startup.
To change the default behavior of Report Builder, see Views tab under Preferences Settings (User Preferences) [page 52].
2.1.3.5.2 Setting the Microsoft Office Trusted Location
Trust settings for Microsoft Office may be blocking Report Builder files from opening. To revise the trust settings when Report Builder templates do not open, use the following procedure.
1. In an open Microsoft Excel workbook, click the Microsoft Office button, and then click Excel Options.2. In the Excel Options dialog box, click Trust Center, and then under Microsoft Office Excel Trust Center, click
Trust Center Settings .3. In the Trust Center dialog box, click Trusted Locations, and then click a column to sort the trusted locations
list by path or description to locate Report Builder Microsoft Office Edition.4. Select Report Builder, and then click Modify.
If Report Builder does not appear, click Add new location .5. In the Microsoft Office Trusted Location dialog box, browse to or enter the path for the Report Builder
installation (typically C:\Program Files (x86)\UBmatrix\UBmatrix Report Builder Microsoft Office Edition).
6. If subfolders of this location shall also be trusted, select the checkbox, optionally add a description, and then click OK.
7. In the Trust Center dialog box (Windows 7) or the Trust Center Add-ins dialog box, click Trusted Locations , clear both options, and then click OK twice to close the dialog boxes.
8. Restart Microsoft Excel, and then click the UBmatrix tab on the Microsoft Excel ribbon.
To open the Report Builder application, open a mapped workbook or load a taxonomy .
2.1.3.5.3 Revising User Account Control Settings to Enable Add-Ins
NoteIf a dialog box notifies you that access is denied, check with your network administrator for additional information.
For Microsoft Windows Vista and Microsoft Windows 7, you may need to enable Add-ins for Microsoft Office applications under User Account Control Settings.
Report Builder HelpUsing Report Builder © 2014 SAP AG or an SAP affiliate company. All rights reserved. 21
1. Open Control Panel , click User Accounts, and then click Manage Change User Account Control settings.
○ For Windows Vista, set the User Account Control to ON, and then click OK.○ For Windows 7, in the User Account Control Settings dialog box, move the slider bar to the lowest
notification setting, and then click OK.2. If asked to verify that you want to make changes to this setting, click Yes.
2.1.4 Taxonomy Pane
Report Builder can display different relational views of a taxonomy, based on the schemas and linkbases that are in the loaded DTS. A given view displays the concepts and their relationships as defined in the respective taxonomy linkbase type:
● Presentation View [page 23]● Calculation View [page 24]● Definition View [page 25]● Schema View [page 25]
The Taxonomy pane shows the elements that are defined in the taxonomy based on the selected view. You can also customize the hierarchical content that displays using additional toolbar buttons to show an expanded, condensed, or filtered view of the taxonomy elements. You can filter any view to show or hide the elements and relationships that are defined in a particular linkbase type. Other options enable you to view and validate the taxonomy based on the definitions of arc roles, parent-child, and summation item relationships in a linkbase or schema.
The Taxonomy pane, or taxonomy, view shows the taxonomy schema files and linkbase files that comprise the discoverable taxonomy set (DTS).
Only the concepts that are used in the linkbase definition for a view display in Report Builder. For example, a taxonomy may define a dozen items, but if the presentation linkbase only uses three of those items, then the presentation view does not show the other nine items. If a taxonomy does not have a presentation linkbase, then no taxonomy elements appear in the presentation view.
Related Information
Filter View [page 26]Arcroles - Concept Relationships [page 26]
2.1.4.1 Taxonomy Views
The Taxonomy pane shows the relationships between elements in the taxonomy or taxonomies that make up the discoverable taxonomy set (DTS), and the Report Builder toolbar shows relationship views that are defined in the DTS. When you have loaded more than one taxonomy, the top-level node of the DTS will be Temp , a reminder that you have more than one taxonomy associated with the workbook.
22 © 2014 SAP AG or an SAP affiliate company. All rights reserved.Report Builder Help
Using Report Builder
The default relationship view for Report Builder shows presentation relationships between elements in the loaded taxonomy using the Standard Labels for element names. You can set your preferred view of taxonomy relationships and labels in Preferences Settings on the Views tab.
In a taxonomy definition, standard labels may use concatenations, shorthand, or terse terms. If you are working with a taxonomy that supports multiple languages or that contains more than one name (Label Role) for an element, you can set the language and label role to use familiar terms. Talk to your taxonomy designer to define additional labels that are more explanatory or specific to your company.
Each view can be expanded or collapsed by selecting or clearing the Expand All checkbox on the Report Builder toolbar. Within a view, individual nodes can be expanded or collapsed by clicking the + or - next to a node, and you can show or hide parts of the taxonomy by filtering.
You can set the text color for mappable (non-abstract) and unmappable (abstract) elements in taxonomy views by setting taxonomy colors in the Preferences Settings on the User Enviroment tab.
To learn more about a particular view, see:
● Presentation View [page 23]● Calculation View [page 24]● Definition View [page 25]● Schema View [page 25]● Filter View [page 26]
NoteThe order and availability of concepts in a given view are based on the taxonomy definition.
The tabbed lower pane provides detailed information about the items in the Taxonomy pane. For more information, see Details Pane [page 27] and About Palette [page 35].
Related Information
Filter View [page 26]Arcroles - Concept Relationships [page 26]Exploring Report Builder [page 13]Preferences Settings (User Preferences) [page 52]
2.1.4.2 Presentation View
The Presentation view displays taxonomy items (labels and concepts) in a logical hierarchy.
In this view, concepts and labels in a taxonomy are organized logically for ease of comprehension. Presentation views are typically used for generating a report.
For example, when generating your company's income statement, you may want to include all operational costs. The operational costs may include expenses associated with Marketing and Distribution, Research and Development, etc.
Report Builder HelpUsing Report Builder © 2014 SAP AG or an SAP affiliate company. All rights reserved. 23

In the Presentation view, all operational costs can be grouped under the header Operating Expenses.
The Presentation view can be displayed by clicking .
NoteThe concepts in the Presentation view display different colored text. This color coding in Report Builder helps you identify mappable concepts (Non Abstract Elements) from distinguish abstract concepts, which cannot be mapped. For more information, see the User Environment [page 54] tab in Preferences Settings (User Preferences) [page 52].
Related Information
Taxonomy Pane [page 22]
2.1.4.3 Calculation View
The Calculation view lists the concepts participating in a calculation. In a Calculation view, only the taxonomy items that are in a summation item relationship display.
Open the Calculation view by clicking .
If you have loaded multiple taxonomies, the initial calculation view will be different from the one shown above. Instead, a temporary file name will be displayed. If you expand that item, you will see all the files associated with the discoverable taxonomy set (DTS).
You can continue to expand these nodes to see the elements of the taxonomies and all other functionality will be the same as if you had a single taxonomy associated with the workbook.
ExampleIn the example below, the arc roles in the Calculation view are Summation-item roles; thus, Assets Current is the sum of four child elements:
● CashAndCashEquivalentsAtCarryingValue● ShortTermInvestments● AccountsNotesAndLoansReceivableNetCurrent● OtherAssetsCurrentextended
To copy an element name and the applicable role, or relationship, right-click and click Copy Concept . Each child concept has a summation item relationship to AssetsCurrent in the taxonomy hierarchy.
24 © 2014 SAP AG or an SAP affiliate company. All rights reserved.Report Builder Help
Using Report Builder

Related Information
Taxonomy Pane [page 22]Details Pane [page 27]
2.1.4.4 Definition View
The Definition view shows hierarchical relationships other than calculation relationships that are defined in the taxonomy.
Concept elements in a dimensional hypercube are called primary items. A hypercube contains dimensions, dimension domains, and domain members. In the following example, the Dimension-domain elements are shown; the primary items for Hypercube-dimensions are abstract and therefore are not mappable.
Click Arcroles to view the arc role relationships defined in a particular view of the taxonomy (default is to show all arc roles). The definition linkbase for this taxonomy defines the dimensions. This definition view shows the Dimension-domain relationships.
Related Information
Arcroles - Concept Relationships [page 26]Views [page 55]Dimensions [page 107]
2.1.4.5 Schema View
The Schema view displays a flat, alphabetical list of reportable concepts in a taxonomy.
Exceptions to the flat list of simple concepts in a schema view are typed dimensions, explicit dimensions, and tuples.
Some business facts can only be understood when presented together ; for example, manager's name and title.
The Schema View displays the definition of the tuples in a taxonomy. In the taxonomy hierarchical view, concepts
that are parent tuples are denoted by icon . The tuple items, or tuple children appear beneath but are not indented.
In the following example, the concepts <Additional Information> and <Company Details> are tuples.<Company Details> is a nested tuple because it is an element of <Additional Information>.
Report Builder HelpUsing Report Builder © 2014 SAP AG or an SAP affiliate company. All rights reserved. 25
Related Information
Exploring Report Builder [page 13]Tuples [page 77]Dimensions [page 107]
2.1.4.6 Filter View
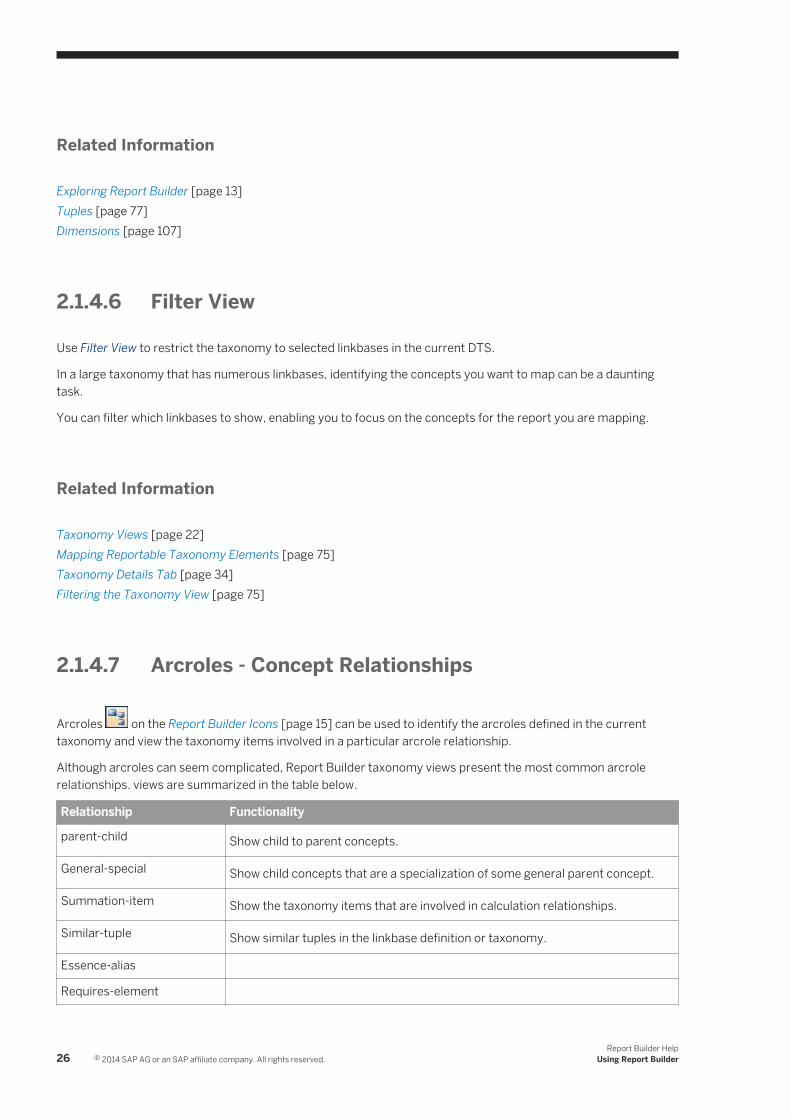
Use Filter View to restrict the taxonomy to selected linkbases in the current DTS.
In a large taxonomy that has numerous linkbases, identifying the concepts you want to map can be a daunting task.
You can filter which linkbases to show, enabling you to focus on the concepts for the report you are mapping.
Related Information
Taxonomy Views [page 22]Mapping Reportable Taxonomy Elements [page 75]Taxonomy Details Tab [page 34]Filtering the Taxonomy View [page 75]
2.1.4.7 Arcroles - Concept Relationships
Arcroles on the Report Builder Icons [page 15] can be used to identify the arcroles defined in the current taxonomy and view the taxonomy items involved in a particular arcrole relationship.
Although arcroles can seem complicated, Report Builder taxonomy views present the most common arcrole relationships. views are summarized in the table below.
Relationship Functionality
parent-child Show child to parent concepts.
General-special Show child concepts that are a specialization of some general parent concept.
Summation-item Show the taxonomy items that are involved in calculation relationships.
Similar-tuple Show similar tuples in the linkbase definition or taxonomy.
Essence-alias
Requires-element
26 © 2014 SAP AG or an SAP affiliate company. All rights reserved.Report Builder Help
Using Report Builder

Relationship Functionality
Hypercube-dimension
Domain-member
Dimension-default
(Show all arc roles) Displays the taxonomy items involved in arcrole relationships that can be viewed in the selected Report Builder taxonomy view.
● Presentation View: displays taxonomy elements based on the Parent-child arcrole relationships defined in the taxonomy.
● Calculation View: displays the taxonomy elements involved in Summation-item arcroles relationships defined in the taxonomy.
● Definition View: displays the taxonomy items that are involved in the following arcrole definitions:
○ Dimensional (hypercubes)○ General-special○ Requires-element
This definition view shows the taxonomy elements involved in three types of dimensional relationships: hypercube-dimension, dimension-domain, and domain-member.
● Schema View: shows the dimensions, scenarios, and tuples defined in the DTS.
Related Information
UBmatrix Tab [page 16]Taxonomy Views [page 22]
2.1.5 Details Pane
The lower pane of Report Builder displays details about the taxonomy or taxonomy element shown in the Taxonomy pane.
Taxonomy details are displayed on the following tabs, which offer views of the taxonomy or imported or mapped facts:
● The Element Details tab displays attributes for the element selected in the Taxonomy View.● The Search tab returns the elements in the current taxonomy based on specified name or label criteria. Use
the search tab to find a concept you want to map.● The Instance Editor tab displays XBRL attributes and mapping details for fact data imported or mapped in the
current workbook. Use the instance editor to view, sort, or edit mapped fact data.● The Dimensions tab is available for taxonomies that have dimensions. Use this tab to view, edit, or define
dimensions that are mapped for the current DTS.● The Taxonomy Details tab (displayed only when Taxonomy Hierarchy View is enabled) shows details about the
selected taxonomy schema (.xsd file) in the DTS.
Report Builder HelpUsing Report Builder © 2014 SAP AG or an SAP affiliate company. All rights reserved. 27
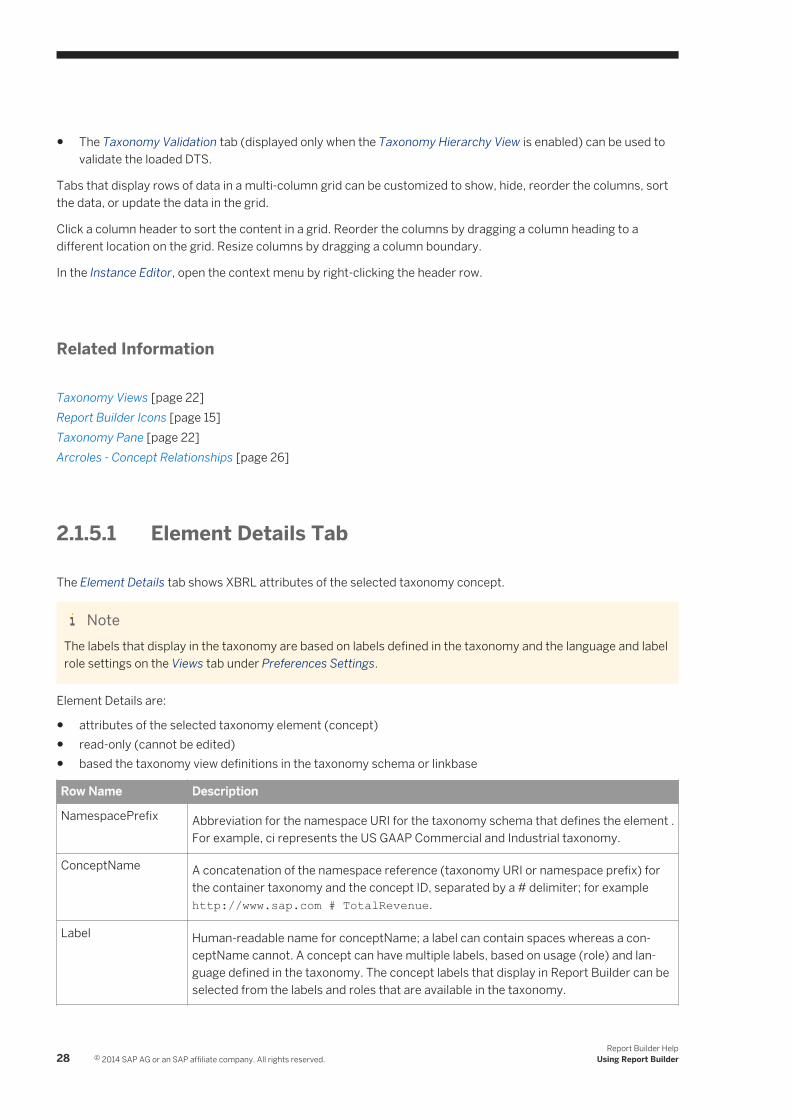
● The Taxonomy Validation tab (displayed only when the Taxonomy Hierarchy View is enabled) can be used to validate the loaded DTS.
Tabs that display rows of data in a multi-column grid can be customized to show, hide, reorder the columns, sort the data, or update the data in the grid.
Click a column header to sort the content in a grid. Reorder the columns by dragging a column heading to a different location on the grid. Resize columns by dragging a column boundary.
In the Instance Editor, open the context menu by right-clicking the header row.
Related Information
Taxonomy Views [page 22]Report Builder Icons [page 15]Taxonomy Pane [page 22]Arcroles - Concept Relationships [page 26]
2.1.5.1 Element Details Tab
The Element Details tab shows XBRL attributes of the selected taxonomy concept.
NoteThe labels that display in the taxonomy are based on labels defined in the taxonomy and the language and label role settings on the Views tab under Preferences Settings.
Element Details are:
● attributes of the selected taxonomy element (concept)● read-only (cannot be edited)● based the taxonomy view definitions in the taxonomy schema or linkbase
Row Name Description
NamespacePrefix Abbreviation for the namespace URI for the taxonomy schema that defines the element . For example, ci represents the US GAAP Commercial and Industrial taxonomy.
ConceptName A concatenation of the namespace reference (taxonomy URI or namespace prefix) for the container taxonomy and the concept ID, separated by a # delimiter; for example http://www.sap.com # TotalRevenue.
Label Human-readable name for conceptName; a label can contain spaces whereas a conceptName cannot. A concept can have multiple labels, based on usage (role) and language defined in the taxonomy. The concept labels that display in Report Builder can be selected from the labels and roles that are available in the taxonomy.
28 © 2014 SAP AG or an SAP affiliate company. All rights reserved.Report Builder Help
Using Report Builder
Row Name Description
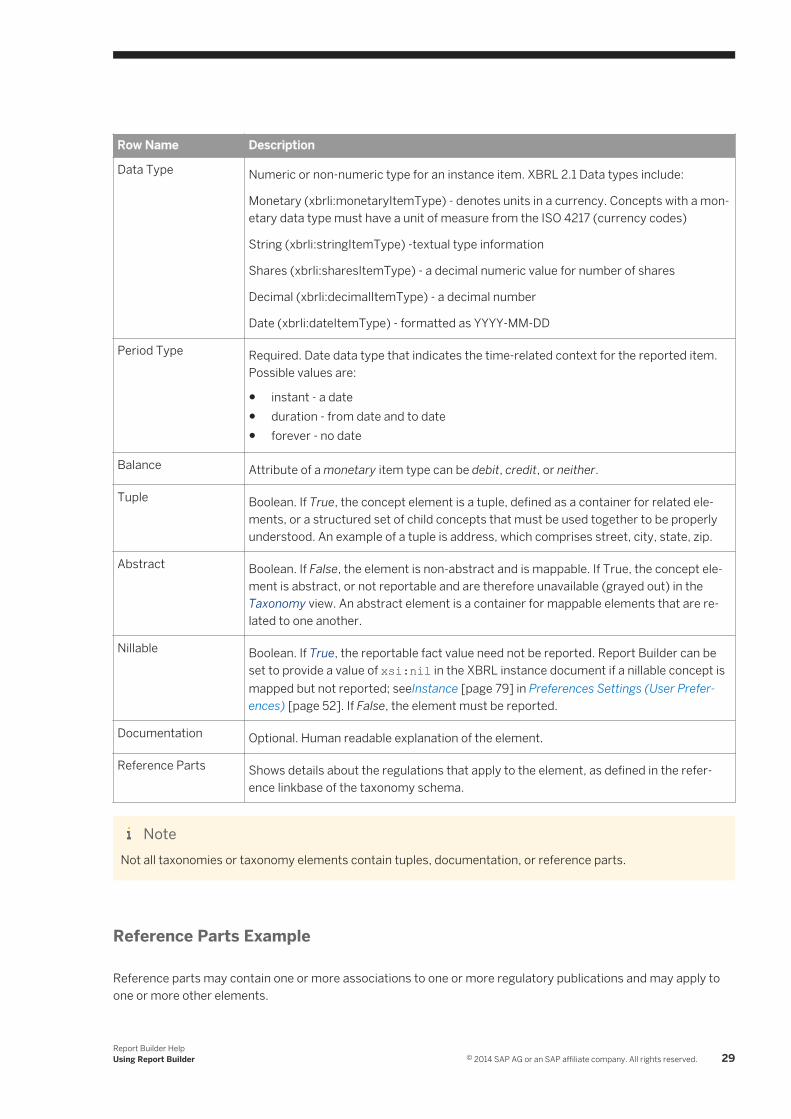
Data Type Numeric or non-numeric type for an instance item. XBRL 2.1 Data types include:
Monetary (xbrli:monetaryItemType) - denotes units in a currency. Concepts with a monetary data type must have a unit of measure from the ISO 4217 (currency codes)
String (xbrli:stringItemType) -textual type information
Shares (xbrli:sharesItemType) - a decimal numeric value for number of shares
Decimal (xbrli:decimalItemType) - a decimal number
Date (xbrli:dateItemType) - formatted as YYYY-MM-DD
Period Type Required. Date data type that indicates the time-related context for the reported item. Possible values are:
● instant - a date● duration - from date and to date● forever - no date
Balance Attribute of a monetary item type can be debit, credit, or neither.
Tuple Boolean. If True, the concept element is a tuple, defined as a container for related elements, or a structured set of child concepts that must be used together to be properly understood. An example of a tuple is address, which comprises street, city, state, zip.
Abstract Boolean. If False, the element is non-abstract and is mappable. If True, the concept element is abstract, or not reportable and are therefore unavailable (grayed out) in the Taxonomy view. An abstract element is a container for mappable elements that are related to one another.
Nillable Boolean. If True, the reportable fact value need not be reported. Report Builder can be set to provide a value of xsi:nil in the XBRL instance document if a nillable concept is mapped but not reported; seeInstance [page 79] in Preferences Settings (User Preferences) [page 52]. If False, the element must be reported.
Documentation Optional. Human readable explanation of the element.
Reference Parts Shows details about the regulations that apply to the element, as defined in the reference linkbase of the taxonomy schema.
NoteNot all taxonomies or taxonomy elements contain tuples, documentation, or reference parts.
Reference Parts Example
Reference parts may contain one or more associations to one or more regulatory publications and may apply to one or more other elements.
Report Builder HelpUsing Report Builder © 2014 SAP AG or an SAP affiliate company. All rights reserved. 29

The Reference Parts dialog box displays the references that apply to the selected element. Reference parts identify the name, number, and publisher of the reference, and may include identifiers for Subparagraph, Article, Paragraph.
To display reference parts
For each element, click .
If no reference parts are defined, Report Builder displays a notification that no reference parts are defined.
If reference parts are defined, Report Builder displays the roles and references. To view detailed values for a reference, click to expand the role.
NoteReference parts do not necessarily have inheritance definitions in the taxonomy hierarchy.
Related Information
Taxonomy Views [page 22]Search Tab [page 30]Preferences Settings (User Preferences) [page 52]About Palette [page 35]Taxonomy Pane [page 22]
2.1.5.2 Search Tab
Use the Search tab to search for a taxonomy element based on a few characters in the name or label. You can search for the element based on whether it is or is not in the selected branch of the taxonomy.
Search Options
The Search toolbar has options for refining the search criteria:
● Element Listing or Location● Element Title● Title Text Wording
30 © 2014 SAP AG or an SAP affiliate company. All rights reserved.Report Builder Help
Using Report Builder
Element Listing/Location
Limit the search to elements in a particular area of the DTS.
● All Elements searches all elements in the DTS.● Elements Not in Relationship View searches elements that are not in the taxonomy view.. Report Builder
ignores elements in the current view, but searches elements that are available in other views.● Elements in Selected Subtree searches elements in the selected node of the current view or filtered view.
Element Title
search in the element name or search in the element label.
● Name searches for the string in element names.● Label searches for the string in element labels.
Title Text/Wording
Search for an element that starts with or contains a character or string. Use this search option to search for a partial phrase.
● Begins searches the entire DTS for a word or phrase that begins with the supplied character or text string.● Contains searches the entire DTS for elements with the supplied character or text string.
Related Information
Mapping a Concept from a Search [page 121]Mapping Concepts [page 73]Taxonomy Views [page 22]Filter View [page 26]
2.1.5.3 Instance Editor Tab
The Instance Editor tab shows details about the taxonomy elements that are mapped in the workbook or reported in an imported instance document. Each row, or record, is a reported fact in an XBRL instance document. More than a dozen fact characteristics that are saved as metadata in an XBRL instance document can be viewed from the Instance Editor tab. Some metadata can be updated in the Instance Editor.
Report Builder HelpUsing Report Builder © 2014 SAP AG or an SAP affiliate company. All rights reserved. 31
NoteReport Builder automatically highlights the corresponding mapped cell and taxonomy concept when for a
selected row in Instance Editor, click on the Report Builder toolbar, and then click the Real Time Settings tab and enable synchronization.
Manual Refresh
Report Builder automatically synchronizes revisions to data in the Instance Editor and in the workbook. Manual Refresh is a preference setting on the Real Time Settings [page 64] tab can suppress the automatic update; when Manual Refresh is set, right-click in the Instance Editor grid and click Update to populate or update with data mapped in the workbook.
Instance Editor Columns
Data in the Instance Editor can be sorted or rearranged to suit your needs. See Using the Instance Editor [page 80] to customize your view.
Column Name Description
Standard Label Concept name and namespace prefix from the container taxonomy.
Reference The worksheet and cell address of a mapped concept. View-only.
IsTuple View-only Boolean.
FactValue The contents in the reference location. To edit a fact value, click the field or the corresponding cell in the workbook.
Context Ascribes a time frame for the reporting period, a data type, and entity information to the cell data. To edit the context, click the field and select a different context.
Unit The Unit ID that is mapped to the fact. To assign a different unit, click the field and select a unit from the list.
Decimals Decimal value assigned to the fact: view-only.
Precision The precision value of the fact: view-only.
Effective Value View-only calculated value. The reported fact value after the decimal/precision and scale has been applied to the fact value.
IsNil View-only Boolean. True if the fact value is nillable.
32 © 2014 SAP AG or an SAP affiliate company. All rights reserved.Report Builder Help
Using Report Builder
Column Name Description
IsComputed View-only Boolean. True if the fact value is computed from other concepts. If true, FactValue cannot be edited.
Footnote Ad hoc information about the fact.
Fullname URI for the concept.
Scale Scale expresses a power of 10. Debit concepts have - scale; credit uses + scale. Numeric fact values are multiplied by the scale attribute when saved in an XBRL instance. For example, a fact value of 45 with a scale of 6, or 10^6 is reported as 45000000. A fact value of 45 with a scale of -3, or 10^-3 is reported as .045.
DataType View-only attribute as defined in the DTS.
NoteFor duplicate mappings, only one reference displays in the Instance Editor. To synchronize values in Report Builder the values in the workbook, right-click any column header in the Instance Editor and select Update.
Related Information
Create a Footnote [page 102]Unit Pattern Tab [page 36]Contexts Tab [page 36]Preview an XBRL Instance Document [page 175]
2.1.5.4 Dimensions Tab
Report Builder supports using both explicit and typed dimensions. Two Dimensions tabs display different information about dimensions:
● Details Pane● Palette
For more information, see Dimensions Overview [page 108].
Dimensions Tab in Taxonomy Details Pane
The Dimensions tab on the taxonomy Details pane shows the dimension type, dimension name, and dimension member that is mapped to a concept or block of concepts. This view enables you to update the items that are mapped to a dimension.
Report Builder HelpUsing Report Builder © 2014 SAP AG or an SAP affiliate company. All rights reserved. 33
Dimensions Tab in Palette
The Dimensions tab in the Palette displays the explicit (denoted by icon E) and typed (denoted by icon T) dimensions available in the taxonomy, and the domain and domain members in a hierarchical view.
Related Information
Scenarios and Segments [page 110]Explicit and Typed Dimensions [page 109]Mapping a Typed Dimension [page 149]Mapping Explicit Dimensions [page 150]Viewing and Editing Mapped Dimensions [page 110]
2.1.5.5 Taxonomy Details Tab
The Taxonomy Details tab can help you verify the file location and namespace prefix for concept definitions. You can also verify the namespace identifier and linkbases related to taxonomy schema files.
The Taxonomy Details tab also pinpoints the linkbase or schema file that contains formula definitions.
NoteThe base taxonomy and its referenced taxonomies is referred to as the Discoverable Taxonomy Set (DTS). Although you can only load one taxonomy into Report Builder, as shown above, loading an extension taxonomy will automatically load referenced taxonomies and linkbases.
The Taxonomy Details tab displays the following metadata for the schema or linkbase file that is selected in the taxonomy view:
● <NameSpacePrefix>: the name (usually a shorter version) of the taxonomy.● <NameSpaceIdentifier>: the URL (defined when the taxonomy was created) by which the taxonomy can
be accessed.● <FullFilepath>: the location where the selected file is stored● <Type>: indicates whether the selected file is a taxonomy or a linkbase.● <Concept Count>: the number of concepts in the selected file.● <Tuple Count>: the number of tuples in the selected file.● <Hypercube Count>: the number of XBRL dimensional hypercubes in the selected file.● <Formula Count>: the number of formulas in the selected file.
Related Information
Taxonomy Pane [page 22]
34 © 2014 SAP AG or an SAP affiliate company. All rights reserved.Report Builder Help
Using Report Builder
2.1.5.6 Taxonomy Validation Tab
The Taxonomy Validation tab is available when the Taxonomy Hierarchy view is active. Use this tab to validate the current taxonomy or discoverable taxonomy set (DTS).
1. Open a Report Builder template and load the referenced taxonomy, or load a taxonomy into a Microsoft Excel workbook.
2. On the Report Builder toolbar, click to open the Taxonomy Hierarchy view.
3. On the Details pane, click the Taxonomy Validation tab, and then click .
Report Builder displays a success or fail validation status message.4. Click OK to close the message. If the validation fails, Report Builder displays the warnings and errors in the
Taxonomy Validation tab.5. To view the text for an error or warning in a tooltip, click a row and pause the pointer over the message. To
save the messages, select all the rows, open a text editor and paste the message(s). Taxonomy validation errors must be addressed by the taxonomy author.
Schema validation errors may also occur in report validation if references to taxonomy files cannot be resolved.
Related Information
Taxonomy Details Tab [page 34]Report Validation [page 176]Report Builder Toolbar [page 14]
2.1.6 About Palette
Use the Palette to view, define, edit, delete, or map contextual information for taxonomy concepts.
Palette tabs include:
● Defining a Context [page 88]● Unit Pattern Tab [page 36]● Footnotes Tab [page 102]● Dimensions
Contexts, unit patterns, and footnotes that you create are saved in the Report Builder application so that you can reuse them. Dimensions are defined in a taxonomy; however, mapped dimensions have additional attributes that tie them to a mapped context. Mapped contextual items are also saved in the workbook. Report Builder displays contextual informaton that you define and mapped contextual information in separate panes. You may want to review details about each tab prior to mapping.
NoteBefore you start mapping cells, it is advisable to define or import contexts.
Report Builder HelpUsing Report Builder © 2014 SAP AG or an SAP affiliate company. All rights reserved. 35
Related Information
Contextual Information [page 86]Exploring Report Builder [page 13]About Mapping [page 112]
2.1.6.1 Contexts Tab
The Contexts tab is used to define, edit, delete, and view contexts, which provide detailed information about reporting periods.
The Contexts tab shows the contexts that you defined, the contexts you imported, or the contexts that are mapped in the current workbook.
Report Builder helps you define, edit, and delete contexts, map contexts in a workbook, and globally update the contexts that are mapped.
Defining a Context [page 88]
Editing a Context [page 90]
Deleting a Context [page 91]
Import Contexts [page 91]
Bulk Update - Updating Contexts [page 92]
Related Information
Incomplete Mapping Report [page 157]Full Mapping Report [page 160]
2.1.6.2 Unit Pattern Tab
Report Builder helps you define the units and decimal or precision pairs for numeric facts. Because XBRL supports combinations of a broad range of units and permits many combinations for unit definitions, Report Builder provides a library for storing unit patterns that you use repeatedly as unit patterns that are in a personal My Patterns library. Unit patterns can be mapped as units in any workbook that you open in Report Builder. You may also import units to map in the workbook.
A unit pattern consists of a unit of measurement and the decimal or precision of the value.
The currency codes available in Report Builder are defined in the CurrencyCodes.xml file located in the ..\RBMEresources\System folder.
36 © 2014 SAP AG or an SAP affiliate company. All rights reserved.Report Builder Help
Using Report Builder

NoteXBRL data types differ from the number formats in Microsoft Excel. Microsoft Excel number formats are not used in Report Builder.
To view the Unit Patterns tab, click Palette in the Report Builder toolbar. The Unit Patterns tab has two panes that identify unit definitions in the workbook and unit pattern definitions in your library:
● The Currently In Use pane displays the units that are mapped or loaded (imported) in the open workbook.● The My Patterns pane displays the unit patterns that you have defined and saved in your personal library.
NoteFor more information about XBRL instance documents, see XBRL Fundamentals [page 7]. For additional procedures that are specific to instance documents in Report Builder, see Instances [page 79].
Mapping a unit pattern to a cell adds two attributes to the concept that is mapped to that cell:
● <Unit ID>● <Decimals or Precision>
You can add, modify, or remove unit patterns in My Patterns without affecting the unit patterns that are defined in a Report Builder template, the open workbook, or the instance document. You can also set the default settings for decimal and precision in Report Builder.
For more information on how to define and map units and precision/decimal attributes in a Report Builder template on the Unit Patterns tab, see Units and Unit Patterns [page 93].
Related Information
Incomplete Mapping Report [page 157]Full Mapping Report [page 160]
2.1.6.3 Dimensions Tab
Report Builder supports using both explicit and typed dimensions. Two Dimensions tabs display different information about dimensions:
● Details Pane● Palette
For more information, see Dimensions Overview [page 108].
Report Builder HelpUsing Report Builder © 2014 SAP AG or an SAP affiliate company. All rights reserved. 37

Dimensions Tab in Taxonomy Details Pane
The Dimensions tab on the taxonomy Details pane shows the dimension type, dimension name, and dimension member that is mapped to a concept or block of concepts. This view enables you to update the items that are mapped to a dimension.
Dimensions Tab in Palette
The Dimensions tab in the Palette displays the explicit (denoted by icon E) and typed (denoted by icon T) dimensions available in the taxonomy, and the domain and domain members in a hierarchical view.
Related Information
Scenarios and Segments [page 110]Explicit and Typed Dimensions [page 109]Mapping a Typed Dimension [page 149]Mapping Explicit Dimensions [page 150]Viewing and Editing Mapped Dimensions [page 110]
2.2 Exploring Word Mapper
The Report Builder Microsoft Word Mapper user interface makes it easy for you to add or edit XBRL mappings in a Microsoft Word document that has been attached to a mapped Microsoft Excel workbook. After you link a Microsoft Word document to your mapped Microsoft Excel workbook, you can map the facts in the Microsoft Word document. By default, Word Mapper opens with the following panes displayed:
● Mapping Properties Pane in Word Mapper [page 40]● Microsoft Word Pane in Word Mapper [page 41]● Taxonomy View Pane in Word Mapper [page 42]● Units Pane in Word Mapper [page 42]● My Patterns Pane in Word Mapper [page 43]● Contexts Pane in Word Mapper [page 44]
After mapping, Word Mapper frames each mapped fact in a Content Control, which provides a context menu so you can take actions specific to that fact. For more information, see Using the Word Mapper Content Control [page 44].
38 © 2014 SAP AG or an SAP affiliate company. All rights reserved.Report Builder Help
Using Report Builder

2.2.1 Word Mapper Menus
The Report Builder Word Mapper File menu provides save and exit and close (without saving) command access.
The Report Builder Word Mapper View menu provides mapping highlight color (on/off) command access.
Related Information
Exploring Word Mapper [page 38]Changing User Preferences for Word Mapper [page 45]
2.2.2 Word Mapper Icons
Many icons appear in the Word Mapper interface, primarily in the taxonomy presentation view. There are two groupings of icons, one of concept types and one of concept data types.
Concept type
Icon Label Functionality
Dimension A dimension-based concept
Hypercube A hypercube-based concept
Line item A line item-based concept
Member A member, default member, or domain member (usually only used in dimension view)
Tuple A tuple-based concept
Concept data type
Icon Label Functionality
Abstract A grouping of non-reportable, intangible concepts
Report Builder HelpUsing Report Builder © 2014 SAP AG or an SAP affiliate company. All rights reserved. 39

Icon Label Functionality
Base 64 A base 64-based concept
Boolean A Boolean concept
Byte A single byte-based concept
Date and date/time A date or date/time-based concept
Decimal A decimal-based concept
Extended Link A grouping under a single label
Fraction A fraction-based concept
Hexadecimal A hexadecimal-based concept
Integer An integer-based concept
Monetary A monetary concept
Other Other
Pure A pure concept
Qname A q-name
Shares Shares
String A string-based concept
Time A time-based concept
Token A token-based concept
Related Information
Exploring Word Mapper [page 38]Changing User Preferences for Word Mapper [page 45]Customization of the Word Mapper Interface [page 45]
2.2.3 Mapping Properties Pane in Word Mapper
The Mapping Properties pane displays the concepts that have been mapped. The Mapping Properties pane only shows the mappings associated with the selected text. If you have not mapped a context to the text, no context is displayed in the Mapping Properties pane.
40 © 2014 SAP AG or an SAP affiliate company. All rights reserved.Report Builder Help
Using Report Builder

The fields shown in the Mapping Properties pane include the following:
Table 1: Mapping PropertiesRow Name Description
NamespacePrefix NamespacePrefix Abbreviation for the namespace URI for the taxonomy schema that defines the element . For example, ci represents the US GAAP Commercial and Industrial taxonomy.
Concept Name A concatenation of the namespace reference (taxonomy URI or namespace prefix) for the container taxonomy and the concept ID, separated by a # delimiter; for example http://www.sap.com # TotalRevenue.
Unit Unit measurement for monetary, shares, or decimal values.
Context A context contains information about the reporting entity, the type and range of the reporting period, and additional scenario and/or organizational segment dimensions that collectively give meaning to reported business facts.
For more information, see Contexts [page 86].
Fact Value This is the actual data mapped in the fact.
Decimal/Precision A decimal-place value (-100 to +100, or INF) or a precision value (0 to 9, or INF).
Related Information
Exploring Word Mapper [page 38]Mapping Facts in Microsoft Word [page 167]Changing or Deleting the Mapping of a Fact in Microsoft Word [page 167]
2.2.4 Microsoft Word Pane in Word Mapper
Report Builder opens an instance of Microsoft Word to enable the features of Report Builder Word Mapper. The Microsoft Word pane's interface is carefully tailored to provide only the functionality that is needed in Report Builder Word Mapper, so you might find it slightly different from the regular Microsoft Word interface.
Report Builder HelpUsing Report Builder © 2014 SAP AG or an SAP affiliate company. All rights reserved. 41

NoteThe appearance of the Microsoft Word pane in Report Builder Word Mapper might differ slightly from that shown in this online Help or other Report Builder documentation. Report Builder currently supports Microsoft Word 2007 and Microsoft Word 2010.
For more information about how to use the Word Mapper interface, see Mapping in Microsoft Office Word [page 164].
Related Information
Exploring Word Mapper [page 38]Using the Word Mapper Content Control [page 44]Customization of the Word Mapper Interface [page 45]
2.2.5 Taxonomy View Pane in Word Mapper
The Taxonomy View currently displays the Presentation View of taxonomy items (concepts) in a logical hierarchy. These items can then be mapped onto facts in your Microsoft Word document using Report Builder Microsoft Word Mapper.
The icons used in the Taxonomy View indicate the datatype for each concept in the taxonomy. You can double-click on concepts listed in the Taxonomy View to map them to facts in the Microsoft Word document. Drag and drop tagging is not available in Word Mapper.
In Report Builder Microsoft Word Mapper, presentation view is the default, which cannot be changed.
Related Information
Word Mapper Icons [page 39]Customization of the Word Mapper Interface [page 45]
2.2.6 Units Pane in Word Mapper
You can use Report Builder to import or create units and decimal or precision pairs for numeric facts. These units are available in Report Builder Word Mapper.
A unit consists of a unit of measurement and the decimal or precision of the value. This unit measurement gives contextual meaning to the fact being mapped. Only numeric facts have units of measurement.
Mapping a unit to a fact adds two attributes to the concept that is mapped to that fact:
42 © 2014 SAP AG or an SAP affiliate company. All rights reserved.Report Builder Help
Using Report Builder

● Unit ID● Decimals or precision
The fields visible in the Units tab include:
● ID - Short, unique identifier for the unit● Description - Longer phrase describing the usage for the unit● Decimal/Precision- Number of decimal places or significant units for the unit
When you create a new unit pattern in Report Builder using Microsoft Excel, you will specify more information for the pattern than is displayed on the tab in Word Mapper. You cannot create unit patterns in Word Mapper.
Related Information
Unit Pattern Tab [page 36]Import Units [page 99]Exploring Word Mapper [page 38]Customization of the Word Mapper Interface [page 45]Mapping in Microsoft Office Word [page 164]Mapping Facts in Microsoft Word [page 167]
2.2.7 My Patterns Pane in Word Mapper
You can use Report Builder to define the units and decimal or precision pairs for numeric facts. Because XBRL supports combinations of a broad range of units, and permits many combinations for unit definitions, Report Builder provides a library for storing unit patterns that you use repeatedly as unit patterns in a personal My Patterns library. These unit patterns are available in both Report Builder in Microsoft Excel and in Microsoft Word in Word Mapper.
A unit pattern consists of a unit of measurement and the decimal or precision of the value. Mapping a unit pattern to a fact adds two attributes to the concept that is mapped to that fact:
● Unit ID● Decimals or precision
After mapping a unit pattern to a fact, the Units tab shows the pattern as one in use, and you can select it from that tab to apply to other facts.
The fields visible in the My Patterns tab include:
● Name - "Friendly" name of the unit pattern● ID - Short, unique identifier for the unit pattern● Description - Longer phrase describing the usage for the unit pattern● Decimal/Precision - Number of decimal places or significant units for the unit pattern
When you create a new unit pattern in Report Builder using Microsoft Excel, you will specify more information for the pattern than is displayed on the tab in Word Mapper.
Report Builder HelpUsing Report Builder © 2014 SAP AG or an SAP affiliate company. All rights reserved. 43
Related Information
Unit Pattern Tab [page 36]Defining a Unit Pattern [page 95]Exploring Word Mapper [page 38]Customization of the Word Mapper Interface [page 45]Mapping in Microsoft Office Word [page 164]
2.2.8 Contexts Pane in Word Mapper
The Contexts pane is used to view and select contexts, which provide contextual information about the reporting entity and periods.
The Contexts pane shows the contexts that you have defined using Report Builder in Microsoft Excel, the contexts imported, or the contexts that are mapped in the current workbook in Report Builder. Contexts cannot be created or edited in Word Mapper.
Related Information
Customization of the Word Mapper Interface [page 45]Contexts Tab [page 36]Mapping in Microsoft Office Word [page 164]
2.2.9 Using the Word Mapper Content Control
After mapping, Report Builder Word Mapper frames each mapped fact in a Content Control which provides a context menu so you can take actions specific to that fact.
1. Map content as desired.For more information, see Mapping Facts in Microsoft Word [page 167].
2. Do one of the following:
○ Single-click a mapped fact.The Content Control frame appears around the fact and the relevant mappings are displayed in the Mapping Properties pane.
○ Right-click a mapped fact.The Content Control frame appeara around the fact and a menu opens.From the Content Control menu, select Delete Context, Delete Unit, Delete Mapping, or View Mapping, as desired.
44 © 2014 SAP AG or an SAP affiliate company. All rights reserved.Report Builder Help
Using Report Builder

Related Information
Exploring Word Mapper [page 38]Mapping Properties Pane in Word Mapper [page 40]Changing or Deleting the Mapping of a Fact in Microsoft Word [page 167]
2.2.10 Changing User Preferences for Word Mapper
User preferences allow you to highlight mapped facts (by default) in Microsoft Excel and Microsoft Word.
1. From the View menu, select Mapping Highlight Color.2. Select On or Off.
After turning Mapping Highlight Color off, facts might be harder to identify but the Content Control frame still helps you manage facts.
Related Information
Exploring Word Mapper [page 38]Customization of the Word Mapper Interface [page 45]
2.2.11 Customization of the Word Mapper Interface
Report Builder Word Mapper allows customization of the interface to suit your needs. Here are the options available to you in the Word Mapper interface:
● Move - Moves the pane to a different part of the Word Mapper window.● Float - Undocks the pane from the Word Mapper interface; it can then be moved anywhere on your computer
desktop.● Dock - Fastens the pane to the Word Mapper interface once more at a position of your choosing.● Tabbed - Stacks two or more panes in a single location of your choosing; their names appear on tabs at the
edge of the pane so you can click on the one you want to use.● Auto Hide - Causes the pane to slide out of the way when another pane is selected. Its name is still displayed
on a tab at the edge of the Word Mapper interface; hover your mouse over the tab to use this pane again.● Hide - Minimizes the selected pane.
The default Word Mapper panes can be reorganized or hidden to suit your preferences and convenience.
Related Information
Exploring Word Mapper [page 38]
Report Builder HelpUsing Report Builder © 2014 SAP AG or an SAP affiliate company. All rights reserved. 45

Mapping in Microsoft Office Word [page 164]
2.2.11.1 Moving a Pane in Word Mapper
Moving a pane to a new location in Word Mapper is a simple matter of drag and drop.
1. Click the header bar of the pane you want to move.2. Drag the header bar to the new position for the pane. While you are moving the pane to its new location, a
guide diamond is displayed in the center of your screen. You can use this control to allow Microsoft Windows to determine to best placement for the pane in any one of the five screen areas represented by the guide diamond.
3. If the move would cause the moved pane to overlap one that is already open, a plus sign appears in the header bar. When you drop the moved pane onto another one, a new tab is created in that pane.For example, after dragging the Mapping Properties pane to the Context pane, the interface creates two tabs in this pane and the newer pane is placed on top.
Related Information
Exploring Word Mapper [page 38]Customization of the Word Mapper Interface [page 45]Tabbing Panes in Word Mapper [page 46]Floating and Docking Panes in Word Mapper [page 47]Hiding and Auto Hiding Panes in Word Mapper [page 48]
2.2.11.2 Tabbing Panes in Word Mapper
By default, the Word Mapper interface is set to display the attached Microsoft Word document in a larger window with the other elements arranged around it in smaller panes. You might prefer to have fewer windows with tabs that you can switch between to access the units and other items.
1. Select the header of a Word Mapper pane that you want to combine with the window to its right. For example, to cause Mapping Properties to be tabbed with the main Microsoft Word document pane, right-click the header of Mapping Properties.
2. From the menu, select Tabbed.The selected tab is merged with the window to the right of it. You can access either pane by clicking its tab.
46 © 2014 SAP AG or an SAP affiliate company. All rights reserved.Report Builder Help
Using Report Builder
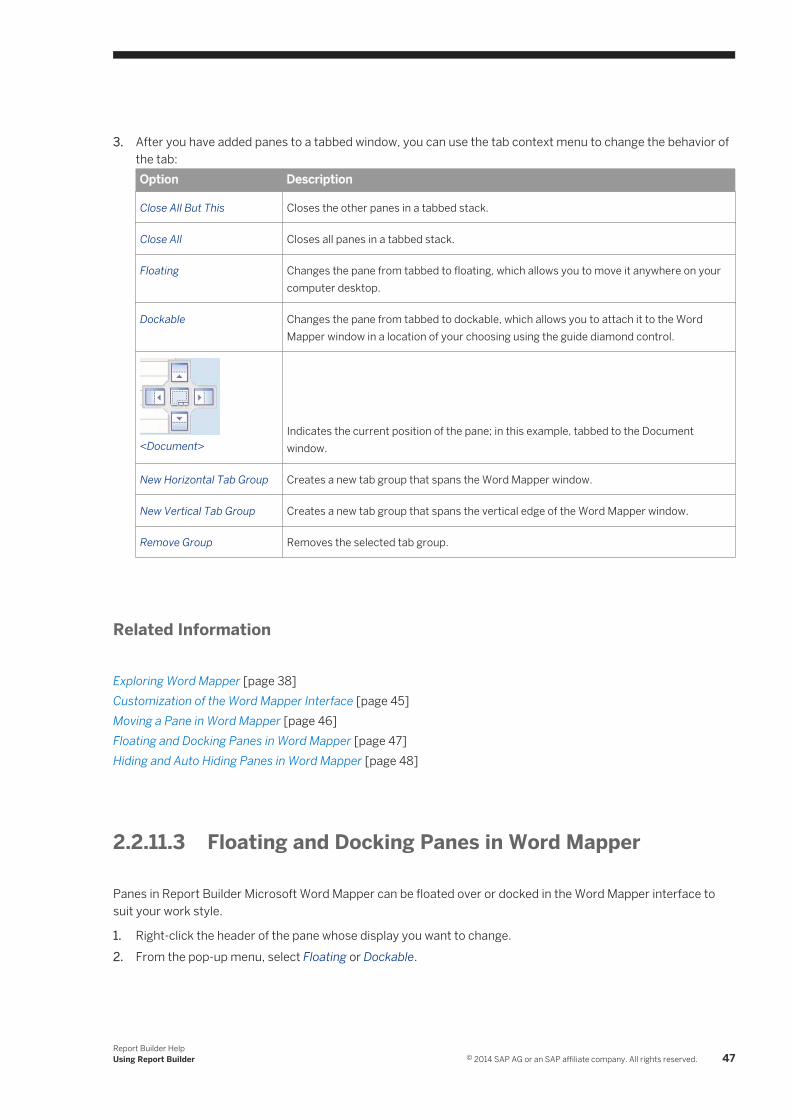
3. After you have added panes to a tabbed window, you can use the tab context menu to change the behavior of the tab:Option Description
Close All But This Closes the other panes in a tabbed stack.
Close All Closes all panes in a tabbed stack.
Floating Changes the pane from tabbed to floating, which allows you to move it anywhere on your computer desktop.
Dockable Changes the pane from tabbed to dockable, which allows you to attach it to the Word Mapper window in a location of your choosing using the guide diamond control.
<Document>Indicates the current position of the pane; in this example, tabbed to the Document window.
New Horizontal Tab Group Creates a new tab group that spans the Word Mapper window.
New Vertical Tab Group Creates a new tab group that spans the vertical edge of the Word Mapper window.
Remove Group Removes the selected tab group.
Related Information
Exploring Word Mapper [page 38]Customization of the Word Mapper Interface [page 45]Moving a Pane in Word Mapper [page 46]Floating and Docking Panes in Word Mapper [page 47]Hiding and Auto Hiding Panes in Word Mapper [page 48]
2.2.11.3 Floating and Docking Panes in Word Mapper
Panes in Report Builder Microsoft Word Mapper can be floated over or docked in the Word Mapper interface to suit your work style.
1. Right-click the header of the pane whose display you want to change.2. From the pop-up menu, select Floating or Dockable.
Report Builder HelpUsing Report Builder © 2014 SAP AG or an SAP affiliate company. All rights reserved. 47

Related Information
Exploring Word Mapper [page 38]Customization of the Word Mapper Interface [page 45]Moving a Pane in Word Mapper [page 46]Tabbing Panes in Word Mapper [page 46]Hiding and Auto Hiding Panes in Word Mapper [page 48]
2.2.11.4 Hiding and Auto Hiding Panes in Word Mapper
Panes in Report Builder Microsoft Word Mapper can be hidden or set to auto hide in the Word Mapper interface to suit your work style.
1. Right-click the header of the pane whose display you want to change.2. From the pop-up menu, select Auto Hide or Hide.
Auto Hide hides the pane when you are not using it; hovering your mouse over the tab, or clicking it, opens the hidden pane.
The dashed lines around the names of the tab show you that they will be hidden again as soon as you are not using them.
Related Information
Exploring Word Mapper [page 38]Customization of the Word Mapper Interface [page 45]Moving a Pane in Word Mapper [page 46]Tabbing Panes in Word Mapper [page 46]Floating and Docking Panes in Word Mapper [page 47]
2.3 What is a Report Builder template?
A Report Builder template is a Microsoft Excel workbook that has been fully mapped with XBRL taxonomy concepts and contextual information. The Report Builder template anchors XBRL attributes, fact data, and cell references, enabling users to handle XBRL content in a Microsoft Excel workbook. The metadata in a Report Builder template can be exported as a Mappings Report which can then be imported to XBRL-enable any number of similarly formatted reports in Microsoft Excel workbooks.
A Report Builder template may or may not contain fact data in mapped cells. A Report Builder template without data can be used as an input form to collect fact data for XBRL reporting. A Report Builder template with data can be used to generate an XBRL instance document.
48 © 2014 SAP AG or an SAP affiliate company. All rights reserved.Report Builder Help
Using Report Builder

NoteA Report Builder template contains mapped XBRL attributes for reportable facts. Other content that makes a Report Builder template human readable (such as headings, names or labels of line items and titles in cells) is informational but is not considered in Report Builder reports.
A Report Builder template:
● Is an XBRL-enabled Microsoft Excel workbook that Report Builder uses to process financial data in XBRL.● Contains custom document properties and metadata that identify the reporting entity, taxonomy, and XBRL
attributes for reportable fact data.● Can be a form in which XBRL fact data can be entered or it may already contain facts.● Can match XBRL facts to cell references.● Can be used to:
○ Import data by reference from external sources. For more information, see Import External Data [page 168].
○ Validate and preview data in mapped cells. For more information, see Preview an XBRL Instance Document [page 175]
○ Save mapped data as an XBRL instance document. For more information, see Save XBRL lnstance Document [page 186].
○ Create an inline XBRL report. For more information, see Save an inline XBRL Report [page 214].○ Import and validate an XBRL instance document. For more information, see Import an Instance Document
[page 84].○ Edit and regenerate an XBRL instance document. For more information, see Instance Editor Tab [page
31].
Related Information
Organize your Mapping Project [page 116]Report Builder Metadata in Excel [page 49]Reusing Mapping Information [page 130]
2.3.1 Report Builder Metadata in Excel
Report Builder adds XML and XBRL attributes as custom properties in a Microsoft Excel workbook. As shown in the sample below, the encrypted custom document properties are not easy to read.
Report Builder can interpret the metadata for mapped or imported XBRL taxonomy concepts and contextual information to generate and validate XBRL-enabled reports.
Example
<?xml version="1.0"?><?mso-application progid="Excel.Sheet"?>
Report Builder HelpUsing Report Builder © 2014 SAP AG or an SAP affiliate company. All rights reserved. 49
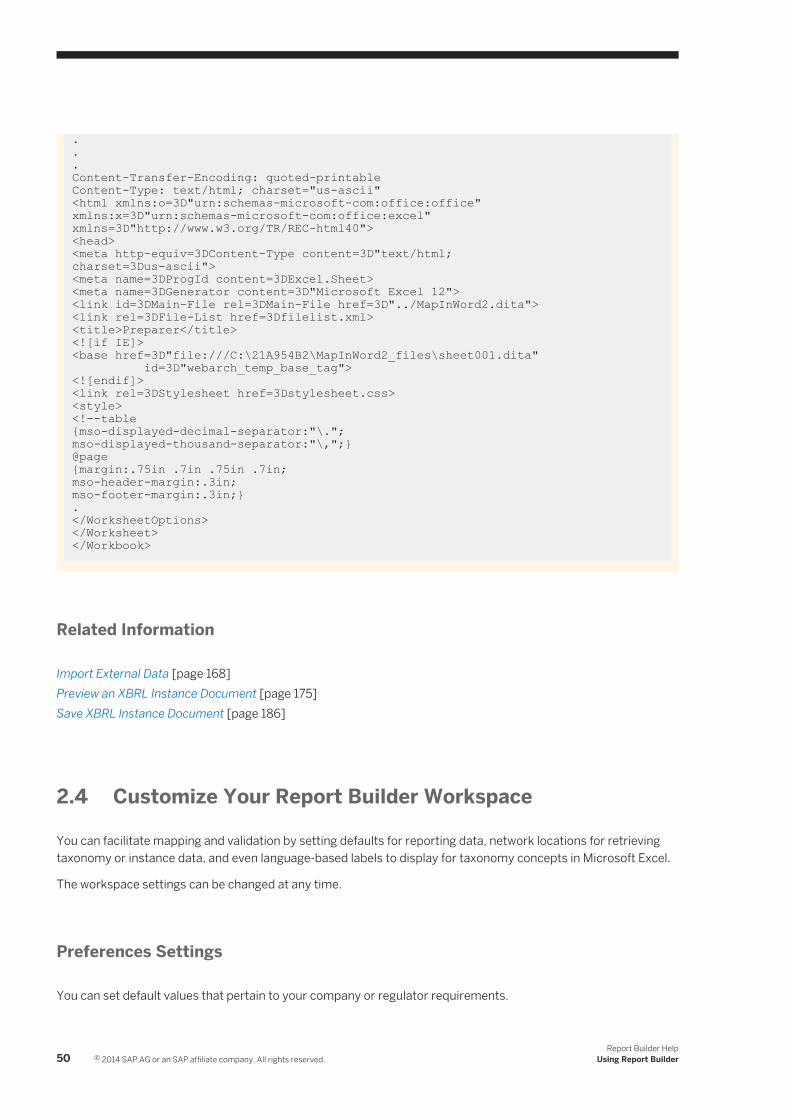
.
.
.Content-Transfer-Encoding: quoted-printableContent-Type: text/html; charset="us-ascii"<html xmlns:o=3D"urn:schemas-microsoft-com:office:office"xmlns:x=3D"urn:schemas-microsoft-com:office:excel"xmlns=3D"http://www.w3.org/TR/REC-html40"><head><meta http-equiv=3DContent-Type content=3D"text/html;charset=3Dus-ascii"><meta name=3DProgId content=3DExcel.Sheet><meta name=3DGenerator content=3D"Microsoft Excel 12"><link id=3DMain-File rel=3DMain-File href=3D"../MapInWord2.dita"><link rel=3DFile-List href=3Dfilelist.xml><title>Preparer</title><![if IE]><base href=3D"file:///C:\21A954B2\MapInWord2_files\sheet001.dita" id=3D"webarch_temp_base_tag"><![endif]><link rel=3DStylesheet href=3Dstylesheet.css><style><!--table{mso-displayed-decimal-separator:"\.";mso-displayed-thousand-separator:"\,";}@page{margin:.75in .7in .75in .7in;mso-header-margin:.3in;mso-footer-margin:.3in;}.</WorksheetOptions></Worksheet></Workbook>
Related Information
Import External Data [page 168]Preview an XBRL Instance Document [page 175]Save XBRL lnstance Document [page 186]
2.4 Customize Your Report Builder Workspace
You can facilitate mapping and validation by setting defaults for reporting data, network locations for retrieving taxonomy or instance data, and even language-based labels to display for taxonomy concepts in Microsoft Excel.
The workspace settings can be changed at any time.
Preferences Settings
You can set default values that pertain to your company or regulator requirements.
50 © 2014 SAP AG or an SAP affiliate company. All rights reserved.Report Builder Help
Using Report Builder

● EDGAR Filers can use predefined settings for EDGAR Filer Manual Validation. For more information, see EDGAR Workspace Settings [page 206].
● HMRC Filers can use predefined settings for the UK GAAP 2009 taxonomy.
You can change Preferences Settings at any time from the Microsoft Excel ribbon, even when you are not using Report Builder.
See To set
Instance [page 79] Identifiers for the reporting entity, data type, and currency.
Network Settings [page 57] Configuration for a shared cache or network server login for access to web-based XBRL documents.
Setup [page 53] Data encoding, default settings for numerical data, default paths for accessing and saving taxonomy and instance files, default validation report settings, and context naming conventions.
Real Time Settings [page 64] How Report Builder updates and validates mapped values, including synchronization of the active item in the taxonomy, workbook, application windows, and interactive reports.
Views [page 55] The default view, language/labels, and load options for the taxonomy.
User Environment [page 54] Text colors for reportable and non-reportable taxonomy concepts and highlight colors for concept, context, and unit mappings in the workbook.
Taxonomy Views and Preferred Labels
You can customize how the taxonomy appears in the Report Builder.
See To
Filter View [page 26] Hide or show various parts of the taxonomy so you only view the branches or extensions you are working with.
User Environment [page 54] Display reportable concepts (called Non-Abstract Elements) in a different color text from non-reportable concepts (called Abstract Elements).
Views [page 55] Display concept names in other languages or that are unique to your company or department. Each concept in a taxonomy is defined with a Concept ID (or Qname), but label linkbases can extend the available names, or preferred labels.
Taxonomy Pane [page 22]
Report Builder HelpUsing Report Builder © 2014 SAP AG or an SAP affiliate company. All rights reserved. 51

Validation and Update Behaviors
You can customize how Report Builder saves, validates, and displays mapped data in a workbook, Report Builder template, or in a report.
See To
Real Time Settings [page 64] Control how and when Report Builder synchronizes the tabular data in the Instance Editor with the content in the Microsoft Excel workbook, show details about any row in Report Builder, trace validation errors in real time in the Microsoft Excel workbook.
Global Update - Manual Refresh [page 126]
Refresh and resynchronize the fact data in Report Builder with data that was imported to Microsoft Excel from a third party add-in.
Setup [page 53] Define the (default) encoding, unit definitions, source file paths, report validation options, and naming for dimensions.
Sharing Settings
To share your workspace settings, copy the C:\Users\<user>\AppData\Local\EDGAR Online\UBmatrix Report Builder\RBMEResources\RBMEResources\System folder from your local user settings to the same location on the recipient user's computer.
Related Information
Preferences Settings (User Preferences) [page 52]About Palette [page 35]Organize your Mapping Project [page 116]
2.4.1 Preferences Settings (User Preferences)
You can define your own Report Builder workspace, including default values and default program behavior, language options for the loaded taxonomy, and support for mapping and validation. You can view or edit preferences settings from the UBmatrix tab in the Microsoft Excel ribbon to set company data and folder locations for taxonomies and instance documents.
NoteTo set language and numeric separators, change the regional settings in the control panel.
● To open the Preferences Settings dialog box, click User Preferences in the UBmatrix tab in the Microsoft Excel ribbon.
52 © 2014 SAP AG or an SAP affiliate company. All rights reserved.Report Builder Help
Using Report Builder
● To open Preferences Settings when Report Builder is running, click the Preferences icon on the Report Builder toolbar.
Reporting requirements for monetary and numeric items, institution (entity) identification, and character encoding are usually managed by a regulatory agency.
You can change Preferences Settings at any time; however, some changes require restarting Microsoft Excel.
Related Information
Global Update [page 125]Report Builder Icons [page 15]EDGAR Workspace Settings [page 206]
2.4.1.1 Setup
Use the Setup tab in the Preferences Settings dialog box to define default settings for data interpretation and storage.
Default Settings
Set the default options for:
● Encoding: Encoding method for the XBRL instance output. Options include:
○ utf-7○ utf-8 encoding for most public taxonomies and for inline XBRL.○ utf-16 double-byte unicode.○ ASCII encoding required for reports that reference the US GAAP taxonomy;
● Decimal/Precision: The default setting for units must be either decimal (100 to -100, or infinite) or precision (1-9, zero, or infinite).
● Taxonomy path: Default storage and retrieval path for taxonomies● Instance path: Default storage and retrieval path for instance documents
Validation
Set the default options for including a calculation trace and an XBRL formula trace in report validation. For more information, see Reports: Include Calculation Trace [page 178], Include XBRL Formula Trace [page 181], and Report Validation [page 176].
Report Builder HelpUsing Report Builder © 2014 SAP AG or an SAP affiliate company. All rights reserved. 53
Context ID Naming in Dimension Mapping
If selected, Report Builder does not build the abbreviations for contexts for mapping explicit and typed dimensions . For more information, see Defining a Context [page 88] and Dimensions [page 107].
Related Information
Preferences Settings (User Preferences) [page 52]
2.4.1.2 User Environment
Use the User Environment tab to define text colors for concepts in a loaded taxonomy and highlighting for mapped cells in a workbook.
Taxonomy Colors
The Report Builder window can show several views, including a filtered view, of a taxonomy. To facilitate mapping, Report Builder distinguishes mappable concepts from other elements in a taxonomy. For more information, see Mapping Reportable Taxonomy Elements [page 75].
● Abstract elements are not facts, and therefore Report Builder provides a read-only view of these elements and the default text color is gray.
● Non-abstract elements are reportable concepts that can be mapped. The default text color for non-abstract elements is blue.
Mapping Colors
Report Builder flags mapped cells in a workbook with a customizable* highlight. Each reportable fact value in a workbook must be mapped with a concept and a context or unit. The two mapping colors enable you to see at a glance what has been mapped in a workbook. For examples of both stages of mapping in a workbook, see Mapping Units and Unit Patterns [page 97].
● Concept mappings identify the reportable elements defined in a taxonomy.● Context/Unit mappings identify the unit patterns that have been mapped for a concept.
NoteIf the No Color option is selected, a mapped Report Builder template can be sent out to look just like an unmapped Microsoft Excel report. For more information how to protect the Report Builder template, seeProtecting a Report Builder Template [page 18].
54 © 2014 SAP AG or an SAP affiliate company. All rights reserved.Report Builder Help
Using Report Builder
Related Information
Views [page 55]Unit Pattern Tab [page 36]Preferences Settings (User Preferences) [page 52]Mapping Reportable Taxonomy Elements [page 75]
2.4.1.3 Views
Use the Views tab of the Preferences Settings to set the default view for a taxonomy when you open a workbook or instance.
You can control the default action for the taxonomy Report Builder.
The settings on this tab include:
● Taxonomy View: Default view (presentation, calculation, definition, or schema) when a taxonomy loads.● Load Taxonomy: Default action when opening a mapped workbook in Microsoft Excel. You can elect to view or
edit a mapped workbook or Report Builder template without loading the taxonomy. Options are Always, Ask, and Never.
● Language: Language to use for concept labels in the taxonomy view, Element Details tab, or reports. The drop-down list displays the languages that are defined in the current taxonomy or DTS. For more information, see Taxonomy Pane [page 22] and Element Details Tab [page 28].
● Label Role: Default role for displaying taxonomy concepts. Label roles include:
○ Standard: Display the Standard label in the taxonomy for a concept.○ Terse: Use the Short label in the taxonomy, which often omits text that may be inferred when a concept is
reported in a context.○ Verbose: Use the Extended label in the taxonomy, which contains additional text that ensures the label is
understandable as a standalone item.○ Total Label: For concepts that are the total of a set of other values, include the labels for all the
constituent concepts.
NoteAdditional label roles may be defined in a taxonomy. The label role and language you select can be helpful for mapping taxonomy concepts.
Related Information
Load a Taxonomy [page 67]Mapping Concepts [page 73]
Report Builder HelpUsing Report Builder © 2014 SAP AG or an SAP affiliate company. All rights reserved. 55

2.4.2 Configure Network Settings
Use network settings to optimize performance in your work environment.
Network Configuration Option
Default Description
Work Offline Disabled When enabled, Report Builder is prevented from accessing the Internet.
Web Caching Enabled When enabled, the configured cache location is automatically populated with the hierarchical file structure of web-based XBRL taxonomies when they are first accessed. Subsequent references to the web-based files use the cache.
Proxy Server Not configured Report Builder also supports configuring the web cache and Internet connection through proxy settings.
ExampleThe table below summarizes commonly used network settings and caching options. These settings assume the Internet is available when a taxonomy loads:
Work Offline Web Caching Proxy Server A web-based XBRL document...
Default Cache location is checked first. If content is missing or corrupt,then the file is loaded from the Web location to the cache and then loaded from the cache into memory.
Disabled Disabled Not configured Loads directly from the Web.
Enabled Enabled or disabled Not configured Loads only if it exists in the current cache location.
Disabled Disabled Configured Loads directly from the Web through the proxy server. If proxy settings are incorrect and an Internet connection is found outside the proxy server, the XBRL document loads directly from the Web.
It is a good practice to leave Web caching enabled so that the cache is automatically updated with Web-based XBRL documents. Mapped workbooks typically open more efficiently using files on the local network. When the Web cache is populated with all Web-based XBRL documents you need, you can enable Work Offline to work without an Internet connection.
56 © 2014 SAP AG or an SAP affiliate company. All rights reserved.Report Builder Help
Using Report Builder
Related Information
Network Settings [page 57]Work Offline [page 58]Web Caching [page 59]Caching FAQ [page 62]
2.4.2.1 Network Settings
Use the Network Settings tab in the Preferences Settings dialog box to configure Web access and caching for Web-based XBRL taxonomy and linkbase documents.
For a description of the default behavior and default settings, see Configure Network Settings [page 56].
The Network Settings tab has the following sections:
● Configuration defines how Report Builder accesses local and Web-based XBRL documents.● Proxy Settings is required only if the Internet must be accessed through a proxy server.
From the Network Settings tab you can:
● Enable and disable Internet access for loading Web-based XBRL documents.● Enable and disable caching for Web-based XBRL documents.● Set or change the cache location.● Set or change a proxy server for the cache location or for Internet access.
Configuration
Use the Configuration section to enable or disable Web caching and to change the local file path for caching or loading Web-based XBRL documents.
● The Work Offline option uses the XBRL documents that are stored in the cache location. Click Work Offline to load XBRL documents from the cache location without having to connect to the Internet. If the files do not exist in the local cache, the load fails.
● The Web Caching option enables the application to access, store, and load Web-based XBRL documents in the cache location.
NoteTo build a Web cache manually, go to the currently configured cache location, and copy your documents under the \http folder. The default directory for the Web cache is ..\resources\system\cache\http\<document hierarchy>.
● The Cache Location is the fully qualified local file path for storing Web-based XBRL documents or for using an existing XBRL document structure.
Report Builder HelpUsing Report Builder © 2014 SAP AG or an SAP affiliate company. All rights reserved. 57
Proxy Settings
If your work environment uses a proxy server to access the Internet, use the Proxy Settings section to configure a proxy server. Contact your system or network administrator for additional information. After configuring proxy settings, you must restart Report Builder.
NoteThe default port for proxy server is 8080. To specify a different port, append the port number to the end of the Proxy Server Host Name (<<proxy server>> :<<port number>> ).
● Proxy Server Host Name can be an IP address, such as 192.168.0.0 or host name, such as www.mydomain.com, and can optionally include a port number, such as www.mydomain.com:2030.
● Proxy User and Proxy Server Password may be required for authenticated proxy servers. These optional settings can be obtained from your system or network administrator.
Related Information
Preferences Settings (User Preferences) [page 52]How does Web caching work? [page 60]Web Caching [page 59]Manage Rules FAQ [page 205]
2.4.2.2 Work Offline
You can configure Report Builder to use a folder in your local network for the Web cache; that is, you can use the contents of a folder for Web-based XBRL documents when you do not have an internet connection. This topic explains in detail how you can create, use, and synchronize the Web cache for offline use.
The Web cache is the quickest and easiest way to work with Web-based XBRL documents. The Web cache makes it possible to work with Web-based XBRL-documents when you are not connected to the Internet and when you are connected to the Internet, you can synchronize the Web-based content.
This article explains in detail how you can create, use, and synchronize offline folders.
When you are working offline, you work with the contents of the Web cache. If Web-based documents generate an error when working offline, temporarily disable Work Offline and make sure you have internet connection and then try to load the Web-based document again. Report Builder automatically refreshes the related XBRL content in your Web cache.
The standard configuration is to keep the Web cache enabled and Work Offline is disabled. When you know the Web cache has all the required XBRL documents, you can enable Work Offline so that Report Builder uses the XBRL documents in the Web cache location.
58 © 2014 SAP AG or an SAP affiliate company. All rights reserved.Report Builder Help
Using Report Builder
Related Information
Web Caching [page 59]Network Settings [page 57]
2.4.2.3 Web Caching
Report Builder provides a local Web cache for storing Web-based XBRL taxonomy and instance documents. Caching support built into Report Builder improves processing time by substantially reducing the number of files that need to be accessed from the Web when you open, import, or load a Web-based taxonomy or instance.
Working with XBRL documents that contain references to Web-based files can be time-consuming given that:
● Bandwidth limitations, connectivity issues, proxy servers, and firewalls can limit the availability of a public Web site.
● An enterprise environment keeps large taxonomies in memory for multiple submissions and for multiple users.
● System designers or system administrators may need to migrate user requests from one server to another or from one Web location to another.
In addition, regulators encourage use of locally-stored versions of Web-based documents to validate submissions.
The built-in caching features automate access to data from the original Web location and provide the flexibility to load or store XBRL documents from any data source, including Web-based or network file systems, databases, and data streams.
Web caching creates a local repository of Web-based XBRL content as it is loaded. The Web cache mirrors the hierarchical folder structure of Web content, including any dependent documents in XBRL taxonomies and instances.
Benefits
There are additional benefits to Web caching beyond expected performance improvements:
● Integrators do not need to manually map and debug Web-based XBRL references because the original hierarchy is mirrored.
● Users can work offline using locally-stored Web-based XBRL content.● Users can share and edit Web-based XBRL content.
You can configure the Report Builder Web cache to use locally stored copies of XBRL documents so you can work offline. Although it is a good practice to keep Web caching enabled, if your network storage has a complete and managed set of Web-based XBRL documents, you can enable Work Offline to use the store as the default cache location, and disable Checking the Internet for Updates.
Report Builder HelpUsing Report Builder © 2014 SAP AG or an SAP affiliate company. All rights reserved. 59
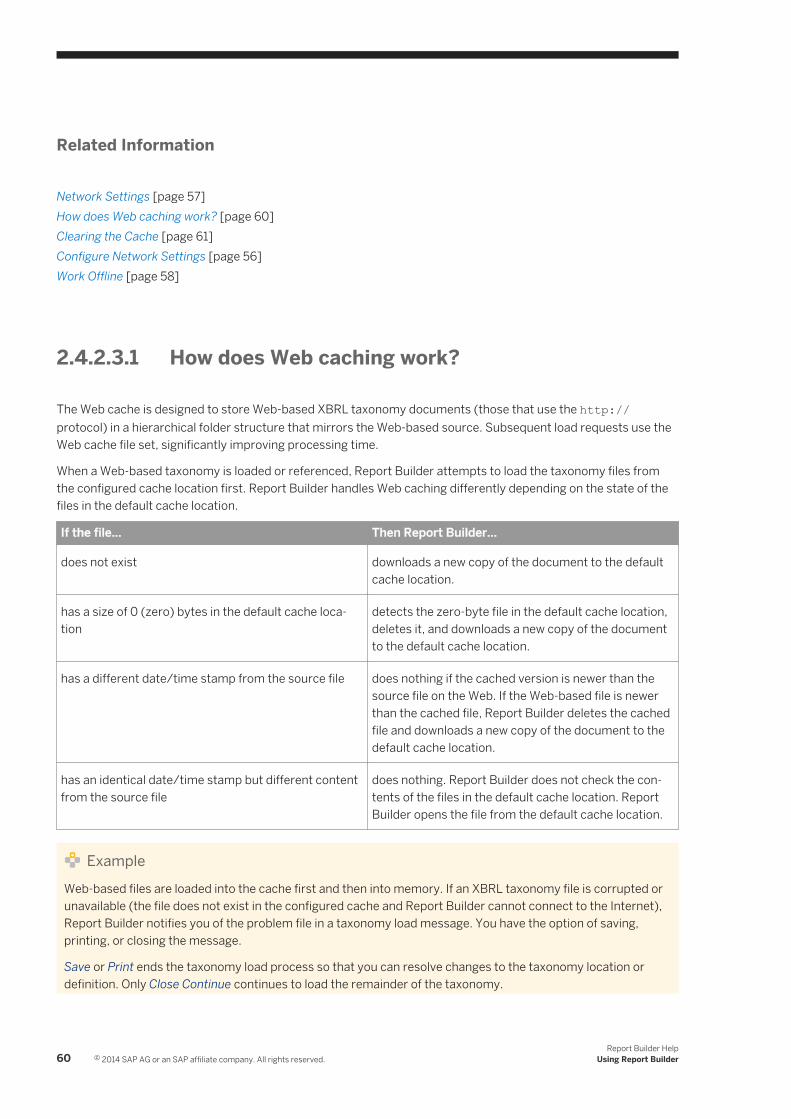
Related Information
Network Settings [page 57]How does Web caching work? [page 60]Clearing the Cache [page 61]Configure Network Settings [page 56]Work Offline [page 58]
2.4.2.3.1 How does Web caching work?
The Web cache is designed to store Web-based XBRL taxonomy documents (those that use the http:// protocol) in a hierarchical folder structure that mirrors the Web-based source. Subsequent load requests use the Web cache file set, significantly improving processing time.
When a Web-based taxonomy is loaded or referenced, Report Builder attempts to load the taxonomy files from the configured cache location first. Report Builder handles Web caching differently depending on the state of the files in the default cache location.
If the file... Then Report Builder...
does not exist downloads a new copy of the document to the default cache location.
has a size of 0 (zero) bytes in the default cache location
detects the zero-byte file in the default cache location, deletes it, and downloads a new copy of the document to the default cache location.
has a different date/time stamp from the source file does nothing if the cached version is newer than the source file on the Web. If the Web-based file is newer than the cached file, Report Builder deletes the cached file and downloads a new copy of the document to the default cache location.
has an identical date/time stamp but different content from the source file
does nothing. Report Builder does not check the contents of the files in the default cache location. Report Builder opens the file from the default cache location.
ExampleWeb-based files are loaded into the cache first and then into memory. If an XBRL taxonomy file is corrupted or unavailable (the file does not exist in the configured cache and Report Builder cannot connect to the Internet), Report Builder notifies you of the problem file in a taxonomy load message. You have the option of saving, printing, or closing the message.
Save or Print ends the taxonomy load process so that you can resolve changes to the taxonomy location or definition. Only Close Continue continues to load the remainder of the taxonomy.
60 © 2014 SAP AG or an SAP affiliate company. All rights reserved.Report Builder Help
Using Report Builder
Load failures can often be corrected by retrieving a missing file from the Web location and saving it to the same relative path on your computer or by loading the taxonomy from a directory that contains the locally-stored taxonomy files. For more information, see Reset the Taxonomy Reference [page 70].
Default Cache Location
The default cache location for Web-based taxonomies is created when you first load a Web-based taxonomy. The typical local path is:
C:\Users\<user>\AppData\Local\EDGAR Online\UBmatrix Report Builder\resources\system\cache\http\
The XBRL documents for a Web-based taxonomy are added to or updated in the Web cache in a hierarchical folder structure that mirrors the Web-based source and then Report Builder loads the files.
Related Information
Clearing the Cache [page 61]Network Settings [page 57]Web Caching [page 59]Loading a Taxonomy from the Web [page 68]
2.4.2.3.2 Clearing the Cache
If the Internet connection is lost when downloading a taxonomy, the Web cache may have an incomplete definition of the taxonomy or discoverable taxonomy set (DTS). You can clear the files from the cache and load the taxonomy again to refresh file content.
Use the File Manager of your operating system to clear the Web cache. The File Explorer view shows the default Web cache location with for a taxonomy loaded from the SEC archives.
If Web caching is disabled in the Network Settings configuration, clearing the Web cache is permanent and you will be unable to load Web-based taxonomies.
Related Information
Web Caching [page 59]Network Settings [page 57]Caching FAQ [page 62]Taxonomy Views [page 22]
Report Builder HelpUsing Report Builder © 2014 SAP AG or an SAP affiliate company. All rights reserved. 61
2.4.2.3.3 Caching FAQ
This FAQ contains supplemental information for caching and answers the following questions.
● The taxonomy takes a long time to load. How can I be sure that caching is working?● How do I resolve load errors?● Why am I getting load errors for an instance document that uses a locally stored taxonomy?
● The performance seems very slow; how can I be sure that caching is working?If you are using the US GAAP 2009 or later taxonomies with formulas, a minimum of 2 GB RAM is recommended. Check your system's RAM and processor speed using Control Panel. Open File Explorer to check your Web cache location to see if the taxonomy is loaded to that base path.Report Builder displays taxonomy load status and messages in the Microsoft Excel status bar and in the loading taxonomy message box.
● How do I resolve a file cannot be found or is corrupted load error?If you receive one of the following errors when trying to load a taxonomy:...unable to find or read the file ...ensure file exists, URL is correct, and file is not corrupted.orFailed to load the taxonomy <path and filename> correctly. The linkbase "<filename>" failed to load. Please check the linkbase reference or the contents of the linkbase.Review your settings for Web caching and for the proxy server in the Network Settings.To use a server share (//server/share), it must be mapped to a drive on your local machine.If the referenced file is part of a Web-based taxonomy, the file may be corrupt or your Web cache may have only a partial collection of actual Web content for the taxonomy, particularly if the Internet connection was lost during a download. To remedy this, use File Manager to clear the faulty taxonomy files from your Report Builder Web cache (typically ..\resources\system\cache...) and then reload the taxonomy when you have Internet access.For the error message in the example above, delete the acme folder.
● I am getting errors when I try to load an instance document that uses a locally-stored XBRL taxonomy. How do I resolve this?Report Builder may not be able to resolve file paths in the instance document to file paths on your local cache. Typically, loading an instance document that references a Web-based taxonomy is resolved without issues. However, references to a local copy of a taxonomy or linkbase can fail if duplicate reference documents reside in different folders. For more information, see Reset the Taxonomy Reference [page 70].
NoteDo not edit elements or relationships in the XBRL.org schemas.
Related Information
Web Caching [page 59]Network Settings [page 57]
62 © 2014 SAP AG or an SAP affiliate company. All rights reserved.Report Builder Help
Using Report Builder
2.4.3 User Account Control (UAC) Settings
Report Builder needs read and write access to files and folders. On operating systems that have built-in UAC security to prevent unauthorized access, read and write access must be enabled after installing Report Builder.
It is recommended that user permission is set to allow Full control at the Report Builder root install folder. At a minimum, clear Read-only and set Modify and Read & execute permissions for report, instance document, and Web cache folders and for the following Report Builder folders:
● ..\RBMEResources● ..\resources● ..\Temp
For more information, see Templates, Reports, and Log Files [page 183].
Related Information
Exploring Report Builder [page 13]
2.4.3.1 Enabling Access for Report Builder Files and Folders
Report Builder needs read and write access to files and folders. On operating systems that have built-in UAC security to prevent unauthorized access, read and write access must be enabled after installing Report Builder.
It is recommended that user permission is set to allow Full control at the Report Builder root install folder. At a minimum, clear Read-only and set Modify and Read & execute permissions for report, instance document, and Web cache folders and for the following Report Builder folders:
● ..\RBMEResources● ..\resources● ..\Temp
For more information, see Templates, Reports, and Log Files [page 183].
1. Open File Explorer and navigate to the Report Builder root folder (typically C:\Program Files\UBmatrix\EDGAR Online UBmatrix Report Builder Microsoft Office Edition).
2. Right-click a folder and click Properties.3. In the Properties dialog box, click the Security tab, and then click Edit.4. In the Permissions dialog box, click the Report Builder group or user name, under Permissions for Users, select
Allow options and then click Apply.Modify, Read & execute, and Write are required; Full control is recommended.Repeat this step to set permissions for each Report Builder group or user name, and then click OK to save your changes.
5. In the Properties dialog box, click Apply.6. In the Confirm Attribute Changes dialog box, click Apply changes to this folder, subfolders and files , and then
click OK.
Report Builder HelpUsing Report Builder © 2014 SAP AG or an SAP affiliate company. All rights reserved. 63

7. Click OK to close the Properties dialog box.8. On the General tab, ensure that the Read-only attribute is not selected.9.
Repeat this procedure to enable access for each required folder, and then reboot your machine to incorporate the configuration settings.
Related Information
User Account Control (UAC) Settings [page 63]Exploring Report Builder [page 13]
2.4.4 Real Time Settings
Use the Real Time Settings tab to show or hide automated visual displays built into Report Builder. Real Time Settings can be changed at any time.
For more information about each option see:
● Synchronization [page 64]: Synchronize mapped items in the workbook and in Report Builder.● Granular Validation [page 65]: Validate each cell as you add or edit mappings.● Show Warning Message for Unmapped Concepts [page 65]: Show or hide messages that warn you if you
attempt to map contextual information to an unmapped cell.● Manual Refresh [page 66]: Show or hide refreshed data automatically if details about a fact changed in the
Instance Editor or in the mapped workbook.
Related Information
Bulk Update - Updating Contexts [page 92]
2.4.4.1 Synchronization
When synchronization is enabled, selecting a mappable item in Report Builder or a mapped item in the workbook automatically highlights the corresponding item in the current view of Report Builder and all occurrences of the corresponding item in the workbook.
Selecting a mapped cell highlights the mapped concept, context, or unit in Report Builder views and tabs. If a mapped item is selected but is not in the current Report Builder view, change views.
Selecting a concept, unit, or context in Report Builder:
● All occurrences of the corresponding concept, context, or unit mapping is outlined in the Microsoft Excel workbook, even on different worksheets, and is highlighted in Report Builder.
64 © 2014 SAP AG or an SAP affiliate company. All rights reserved.Report Builder Help
Using Report Builder

● The taxonomy view scrolls to the concept, even when changing taxonomy views. If a taxonomy view does not use the selected concept, it cannot display.
When synchronization is not enabled, mappings in the workbook are not associated with Report Builder concepts or contexts; changing taxonomy views does not synchronize any content in the taxonomy views or Palette tabs.
Related Information
Preferences Settings (User Preferences) [page 52]
2.4.4.2 Granular Validation
Granular validation can be used to visually track validation errors for a cell or a worksheet while mapping or updating concepts, contexts, and units in a report.
When granular validation is enabled, errors and warnings that pertain to each mapping action for the active or selected cell are displayed in a tooltip.
Other cells that have an error are flagged with red in the top right corner. To view the validation error or warning for a flagged cell, pause the pointer over the cell. To clear the flag and the tooltip message, right-click the cell and click Delete Comment.
To disable granular validation, clear the Granular Validation option on the Real Time Settings tab of Preferences Settings.
Related Information
Preferences Settings (User Preferences) [page 52]
2.4.4.3 Show Warning Message for Unmapped Concepts
The logical mapping order in Report Builder is to map a concept and then map additional contextual information, such as context, unit, tuple, footnote, or dimension. The default behavior in Report Builder is to silently disregard any attempt to map a contextual attribute to an unmapped cell.
When Warn me when attempting to map... is selected, Report Builder shows a Missing Concept warning dialog when any attempt is made to map contextual information to an unmapped cell.
When mapping a block of cells with contextual attributes, this warning displays for each unmapped cell in the selected block. If you do not want to see the warning, clear the Warn me when... option on the Real Time Settings tab of Preferences Settings.
Report Builder HelpUsing Report Builder © 2014 SAP AG or an SAP affiliate company. All rights reserved. 65
Related Information
Preferences Settings (User Preferences) [page 52]
2.4.4.4 Manual Refresh
Report Builder can be set to automatically display XBRL details in the Instance Editor tab. By default, the details do not display until you request them using Update from the right-click menu.
To display real time updates in the Instance Editor tab for changes to instance data in the mapped workbook, clear the Manual Refresh option on the Real Time Settings tab of Preferences Settings. You can force the fact data in the Instance Editor and mapped workbook to update by clicking Global Update in Report Builder Tools.
Report Builder can display details for items listed on the Contexts tab and Unit Patterns tab of the Palette.
Related Information
Preferences Settings (User Preferences) [page 52]Instance Editor Tab [page 31]Global Update - Manual Refresh [page 126]Tools [page 192]About Palette [page 35]
2.5 Load Taxonomy Overview
Report Builder enables you to load one or more XBRL texonomies into a Microsoft Excel workbook and create an XBRL-enabled report template based on the concepts defined in the taxonomy. For more information about using multiple taxonomies, see Loading Multiple Taxonomies [page 70].
You can load a taxonomy from the following sources:
● Loading a Taxonomy from a Local Directory [page 68] - load a taxonomy from your hard drive or a mapped network drive.
● Loading a Taxonomy from the Web [page 68] - load a taxonomy from the Internet.● Loading a Taxonomy from WebDAV [page 69] - load a taxonomy from a WebDAV server.
When you load a taxonomy or import facts into a workbook, Report Builder adds metadata to the workbook. The next time the workbook is opened, Report Builder attempts to load the taxonomy from the same location. If the location or definition of the workbook or taxonomy has changed, Report Builder may be unable to locate the taxonomy. In this case, Report Builder automatically displays a search dialog box prompting you for the taxonomy.
If the definition for a concept in the taxonomy conflicts with the concept attributes in the mapped workbook, Report Builder automatically generates a report.
66 © 2014 SAP AG or an SAP affiliate company. All rights reserved.Report Builder Help
Using Report Builder

Related Information
Log: Fact with Missing Concept in the Taxonomy [page 188]Exploring Report Builder [page 13]Load a Taxonomy [page 67]Taxonomy Views [page 22]About Mapping [page 112]
2.5.1 Load a Taxonomy
Before loading a taxonomy, you can identify the location on your computer or on the Internet:
● Use File Explorer to locate the taxonomy schema (.xsd file).● Use an Internet browser to locate the URL for a Web-based taxonomy schema (.xsd file), and then copy the
Web address (URL).● Use the RBME Load Taxonomy from WebDAV dialog box to find the taxonomy.
To load a taxonomy, proceed as follows:
1. Open your mapped workbook file in Microsoft Excel. If you are creating a new workbook, save the file before proceeding.
2. Click the UBmatrix tab on the Excel toolbar.3. Click Load Taxonomies.4. In the Load Taxonomy dialog box, choose one of the following three options:
○ To load the taxonomy from your local hard drive or a mapped network drive, click the folder icon, navigate to the file in the Select Taxonomy dialog box, and then click Open.
○ To load the taxonomy from the Internet, paste the URL of a Web-based taxonomy into the Select Schema box, and then click Open.
○ To load the taxonomy from the Internet using the WebDAV protocol, click the WebDAV icon, navigate to the file in the Load Taxonomy from WebDAV dialog box, and then click Load.
5. In the Load Taxonomy dialog box, click Add, and then click Load.
Report Builder displays a Loading Taxonomy status box and changes the Excel status bar message to inform you of the loading status. When the taxonomy is completely loaded, it is displayed in the Report Builder taxonomy listing window.
Related Information
Loading Multiple Taxonomies [page 70]Taxonomy Views [page 22]Mapping Concepts [page 73]
Report Builder HelpUsing Report Builder © 2014 SAP AG or an SAP affiliate company. All rights reserved. 67
2.5.2 Loading a Taxonomy from a Local Directory
Before loading a taxonomy, you can identify its location on your machine. You can use File Explorer to locate the taxonomy schema (.xsd file) on your hard drive or mapped network drive.
1. Open Microsoft Excel.2. In an unmapped workbook, from the UBmatrix tab, click Load Taxonomies.
Report Builder initializes and then opens the Load Taxonomy dialog box.
3. Click (Folder), browse to a taxonomy on your local file system or on a mapped network drive, and then click Open.
4. To add the taxonomy to the list of schemas attached to this workbook, click Add, and then click Load to load the taxonomy.The Excel status bar shows that the taxonomy is loading from your local directory and a load progress dialog box is displayed.
The loaded taxonomy opens in the default view in Report Builder. For more information about the default view, see Presentation View [page 23].
Related Information
Load Taxonomy Overview [page 66]Load a Taxonomy [page 67]Loading Multiple Taxonomies [page 70]Taxonomy Pane [page 22]
2.5.3 Loading a Taxonomy from the Web
Before loading a taxonomy, you can identify its location on the Internet. You can use an Internet browser to locate the URL for a Web-based taxonomy schema (.xsd file), and then copy the Web address (URL).
1. Open Microsoft Excel.2. From the UBmatrix tab, Load Taxonomy group, click Load Taxonomies.
Report Builder initializes and then opens the Load Taxonomy dialog box.3. In the Load Taxonomy dialog box, in the Select Schema box, paste the URL of the Web-based taxonomy file,
and then click Add.
NoteThe URL you enter must end with .xsd in order to be accepted. If your URL does not end with an .xsd filename, the Add button is not available.
4. To load the attached taxonomy, click Load.The Excel status bar shows the progress of loading the taxonomy and a load progress dialog box is displayed.
68 © 2014 SAP AG or an SAP affiliate company. All rights reserved.Report Builder Help
Using Report Builder

The loaded taxonomy opens in the default view in Report Builder. For more information about the default view, see Presentation View [page 23].
Related Information
Load Taxonomy Overview [page 66]Load a Taxonomy [page 67]Loading Multiple Taxonomies [page 70]Taxonomy Pane [page 22]Details Pane [page 27]Taxonomy Validation Tab [page 35]Network Settings [page 57]Web Caching [page 59]Preferences Settings (User Preferences) [page 52]
2.5.4 Loading a Taxonomy from WebDAV
Before loading a taxonomy using WebDAV (Web-based Distributed Authoring and Versioning extensions to the HTTP protocol), you might wish to first identify the taxonomy's location on the Internet.
1. Open Microsoft Excel.2. From the UBmatrix tab, Load Taxonomy group, click Load Taxonomies.
Report Builder initializes and then opens the Load Taxonomy dialog box.
3. In the Load Taxonomy dialog box, click (WebDAV), and then use the Load Taxonomy From WebDAV interface to find the taxonomy.
4. After you have selected the file, click Load.If prompted, enter your network credentials to establish a connection with the WebDAV server.
NoteThe URL you enter must end with .xsd in order to be accepted. If your URL does not end in an .xsd filename, the Add button is not available.
The Excel status bar shows the progress of loading the taxonomy and a load progress dialog box is displayed.
The loaded taxonomy opens in the default view in Report Builder. For more information about the default view, see Presentation View [page 23].
Related Information
Load Taxonomy Overview [page 66]Loading Multiple Taxonomies [page 70]
Report Builder HelpUsing Report Builder © 2014 SAP AG or an SAP affiliate company. All rights reserved. 69

2.5.5 Loading Multiple Taxonomies
Report Builder supports the use of multiple taxonomies in Microsoft Excel.
1. To add taxonomies one by one, follow the appropriate procedures:
○ Loading a Taxonomy from a Local Directory [page 68]○ Loading a Taxonomy from the Web [page 68]○ Loading a Taxonomy from WebDAV [page 69]
2. Browse to each taxonomy schema and then click Add.3. When all of the desired taxonomies are listed in the Load Taxonomy schema list, in the Load Taxonomy dialog
box, click Load.The order in which you load taxonomies is the order that is used to list them in Report Builder. Taxonomies are loaded in the order in which they are shown in the Load Taxonomy dialog box. In the presentation view, the extended links can be listed in alphabetical order. For more information, see Presentation View [page 23].
Once the taxonomies are loaded, in the Taxonomy pane, you can see Temp as the taxonomy name. This reflects the merged discoverable taxonomy set (DTS) generated by Report Builder. The taxonomy associations are saved along with the workbook.
NoteCollisions between taxonomy elements:
Because each taxonomy has a unique name, each taxonomy concept does as well. While different taxonomies may share concept names, the full name for each concept is different because Report Builder manages each element as follows:
<Taxonomy_Name:Element name>
Taxonomies are listed in the Report Builder taxonomy list as usual. Each taxonomy's concepts are listed together; the taxonomies are not interleaved in the taxonomy view.
Related Information
Load Taxonomy Overview [page 66]Load a Taxonomy [page 67]Taxonomy Pane [page 22]Loading a Taxonomy from a Local Directory [page 68]Loading a Taxonomy from the Web [page 68]Loading a Taxonomy from WebDAV [page 69]
2.5.6 Reset the Taxonomy Reference
If you encounter a problem loading a taxonomy, resetting the taxonomy reference can be a solution.
70 © 2014 SAP AG or an SAP affiliate company. All rights reserved.Report Builder Help
Using Report Builder

When a taxonomy is loaded into a workbook, Report Builder adds metadata to the workbook. An XBRL instance and a Mappings Report also contain taxonomy reference information. For an example, see Sample Mappings Report [page 132].
When you open a mapped workbook or import an XBRL instance document or Mappings Report, Report Builder attempts to locate the taxonomy using the taxonomy references. If the taxonomy is not in the expected location, Report Builder may generate load errors or may prompt you to locate the taxonomy and then have problems because the new taxonomy location differs from the taxonomy reference in the metadata. For more information about load errors, see Logs [page 188].
This procedure repairs import issues for an XBRL instance that you created from a Report Builder template for a prior reporting period.
1. Open the previous Report Builder template.2. To delete the taxonomy references and all mappings, in the Report Builder Close menu, click Detach and
Close Report Builder.For more information, see Close Report Builder [page 19].
3. Load the taxonomy from the new location.For more information, see Load Taxonomy Overview [page 66].
4. To display taxonomy details, in the Report Builder toolbar, click (Taxonomy Hierarchy).
5. In the Details pane, click the Taxonomy Validation tab, and then click (Validate Taxonomy).For more information, see Taxonomy Validation Tab [page 35].
6. If the taxonomy is valid, import the contexts and units from the instance:a) In the Report Builder Import External Data menu, click Import Data.b) In the File Properties dialog box, under Select Data to import, click Contexts and Units.
c) Click and browse to the local XBRL instance document (.xbrl or .xml file extension).d) To import contexts and units, click OK.
Report Builder automatically prompts you for the taxonomy.7. In the Attach Taxonomy dialog box, browse to the taxonomy that you loaded in step 3, and click OK.
The Fact with Missing Concept in the Taxonomy log is generated automatically, showing that Import Contexts/Units selection will not import facts without units. For more information, see Log: Fact with Missing Concept in the Taxonomy [page 188].
8. Clear one or more of the checkboxes and then click Close.The log is automatically saved to <User>\My Documents.
Related Information
Importing an XBRL Instance Document [page 83]Mappings Report [page 131]File Properties [page 19]
Report Builder HelpUsing Report Builder © 2014 SAP AG or an SAP affiliate company. All rights reserved. 71

2.6 Currency Codes
Report Builder supports ISO 4217 currency codes.
You can configure the default currency codes in your application, as well as the order that currencies display in the user interface. These currency codes are used in the following dialog boxes and tabs:
● Preferences Settings dialog boxFor more information, see Preferences Settings (User Preferences) [page 52].
● Unit Patterns tabFor more information, see Unit Pattern Tab [page 36].
● Add Measure dialog boxFor more information, see Defining a Unit Pattern [page 95].
The complete list of ISO 4217 currency codes are itemized in the Report Builder product file ..RBMEresources\System\CurrencyCodes.xml.
2.7 Validation
Report Builder provides built-in validation capabilities that enable preparers to verify filings prior to submission. Validation settings are flexible and can be enabled to show field-level errors during the mapping process. Validation reports can be run at any time to evaluate well-formed XML and XBRL, calculations, rules, and rendering. Schema validation errors may be a result of taxonomy files or data sources being in a different location from the original mapped location.
Report Builder uses the embedded processing engine to validate reported facts. Mapping reports can identify mapping issues for concepts, contexts, and units. The processing engine binds mapped fact data to the relational structure defined in the taxonomy and notes any inconsistencies in XML and XBRL grammar, schema definitions, calculation definitions, or business rules expressed in XBRL formulas.
Validation reports present errors and warnings in a secondary tabbed Reports window and can present summary or detailed results. Errors and warnings in detailed validation reports include a narrative description of the rule, often with a hyperlink to the XBRL specification, that pertains to the alert and the cell reference that triggered the alert. Each error, warning, or rule is logged in the order in which it was encountered. Most reports can be saved in HTML, XML, or XBRL format.
Report Validation [page 176] Create validation reports that can be viewed in a browser, printed, or saved in HTML format.
XBRL Validation [page 8] Ensure compliance with XBRL 2.1 specifications.
Taxonomy Validation Tab [page 35] Validate the taxonomy before mapping concepts.
Granular Validation [page 65] Validate the reported fact in each cell as you map concepts, contexts, and units. Granular validation can help resolve data and mapping issues. You can toggle granular validation on or off at any time.
72 © 2014 SAP AG or an SAP affiliate company. All rights reserved.Report Builder Help
Using Report Builder

Reports: Calculation Trace [page 178]
The calculation trace report shows roll up or summation item errors and inconsistencies
Manage Rules Overview [page 193] The XBRL formula trace report applies business rules to the data, the taxonomy, or both, and returns a description of the rule, a result, and a message that identifies line and character coordinates for the item that triggered the rule.
EDGAR Filer Manual Validation [page 207]
Additional built-in validation rules and preview capabilities permit EDGAR filers to validate and preview reported data from their desktop.
Instance Reports [page 82] Reported data in an imported instance document can be validated; the referenced taxonomy can also be validated.
You can import external data during report validation and when saving an instance report.
NoteEDGAR Filer validation uses preconfigured settings that override some customized validation configurations. To apply customized settings, clear the Use default rule parameters when possible option when including an XBRL formula trace in report validation.
Related Information
Reading a Formula Trace Report [page 182]Reading an EDGAR Filer Manual Validation Report [page 210]Preview an EDGAR Filing [page 211]Compliance with XBRL Specifications [page 7]Save an XBRL Formula Trace as an Instance Document [page 187]
2.8 Mapping Concepts
You have set up your workspace and identified which taxonomy concepts you want to map. For more information, see Customize Your Report Builder Workspace [page 50].
You can use any mapping technique except the double-click option to map taxonomy concepts to cells in a Microsoft Office Excel 2007 or Microsoft Office Excel 2010 workbook. For more information, see Mapping in Microsoft Office Excel [page 117].
NoteIt is also possible to map taxonomy concepts to facts in a Microsoft Word document. For more information, see Mapping Facts in Microsoft Word [page 167].
Report Builder HelpUsing Report Builder © 2014 SAP AG or an SAP affiliate company. All rights reserved. 73
To display the taxonomy in Report Builder with terminology you are most familiar with, see Language and Label Role on the Views tab in Preferences Settings. For more information, see Preferences Settings (User Preferences) [page 52] and Views [page 55].
NoteReport Builder provides read-only access to a taxonomy; typically, the taxonomy has already been defined. Check with your taxonomy designer for additional information.
1. Open a Microsoft Excel workbook.For this example, open ..\Tutorials\Sample\Template\Unmapped Workbook.xlsx.
2. Load the taxonomy.For more information, see Load Taxonomy Overview [page 66].For this example, load from a local directory. Browse to ..\Sample Taxonomies\Patterns\Extension\Extension-BasicCalculation.xsd and click Open.
3. In the workbook, click the Property tab, then select or highlight the cell or cells you want to map.For this example, select cells B5:C5.
4. In the Report Builder toolbar, click the Presentation View, and then click Expand All.For more information, see Report Builder Icons [page 15] and Presentation View [page 23].Mappable taxonomy concepts display in a different color text from the unmappable taxonomy elements.
5. Drag the Land concept from Report Builder onto the selected cells.The mapped cells are highlighted to show they are mapped with a concept.
NoteYou can choose the text color for mappable and unmappable concepts in Report Builder and set the highlight color of mapped cells. For more information, see User Environment [page 54].
6. Right-click a mapped cell, and click View Mappings.7. The Cell Mappings dialog box shows the Concept Name is Land.8. Close the Cell Mappings dialog box.9. Repeat this procedure to map applicable taxonomy concepts to columns B and C.
Related Information
View Incomplete Mappings [page 124]Tuple Mapping Workflows [page 140]Mapping Qnames [page 122]Mapping Facts in Microsoft Word [page 167]
74 © 2014 SAP AG or an SAP affiliate company. All rights reserved.Report Builder Help
Using Report Builder

2.8.1 Filtering the Taxonomy View
Mapping involves identifying all the concepts that need to be mapped for the current report. If you are working with a large taxonomy, you can limit the taxonomy to the relevant concepts using Filter View to hide the unnecessary taxonomy calculation linkbases. For more information, see Filter View [page 26].
1. To show the calculation linkbases for various reports, click the Calculation view.
2. To display the selected linkbases for the current taxonomy view, click (Filter View).3. To clear all check boxes, click Select All.
4. To redisplay the selected linkbase, select CondensedConsolidatedBalanceSheets, and then click (Home).
5. To show the concepts in the selected linkbase(s) and select a concept, click or Expand All.Notice that the Filter View icon appears as disabled on the Report Builder toolbar, and no taxonomy view is highlighted.
6. Click Presentation view.If you switch to a view that does not use the selected element, the hierarchical nodes are not expanded.The selected concept displays in the Presentation view.
7. To turn off filtering, click (Filter View).
8. To return to the default taxonomy view, click (Home).9. To view the concept hierarchy in the default view, click Expand All.
Related Information
Mapping Concepts [page 73]Mapping Reportable Taxonomy Elements [page 75]Find the Data Type and Period Type of a Reportable Concept [page 76]
2.8.2 Mapping Reportable Taxonomy Elements
To facilitate mapping, Report Builder provides visual cues for identifying what can be mapped, what has been mapped, where an element is mapped, which elements have similar data types or period types, and which have been mapped with similar contexts or units.
You can use these Report Builder features to facilitate your mapping project:
Report Builder toolbar
For more information, see Report Builder Icons [page 15].
Click an available icon and then select Expand All to display taxonomy elements in the presentation, calculation, definition, or schema view. For more information, see Taxonomy Views [page 22].
Report Builder HelpUsing Report Builder © 2014 SAP AG or an SAP affiliate company. All rights reserved. 75

Label Role
For more information, see Views [page 55].
Report Builder allows you to choose the labels to display in the Report Builder taxonomy view. If the taxonomy has multiple label linkbases or supports multiple languages, you can display the taxonomy using the labels or language you are most familiar with.
Taxonomy Colors and Mapping Colors
For more information, see User Environment [page 54].
Taxonomies display mappable and unmappable elements in different text colors. You can choose the text colors for reportable concepts (Non-Abstract Elements) and non-reportable concepts (Abstract Elements). You can choose the mapping colors (cell highlighting) for concepts, contexts, and units.
Synchronize
For more information, see Real Time Settings [page 64].
Highlight the selected concept in the mapped workbook, in the taxonomy view, and in the detail view.
Filter View
For more information, see Filter View [page 26].
For large taxonomies, use this toggle to show or hide selected linkbases in the taxonomy view.
Search tab
Search Tab [page 30]
Search for taxonomy elements by name or label. Results can be sorted by any column.
Instance Editor tab
For more information, see Instance Editor Tab [page 31].
Show details about all mappings in a list that can be sorted by label, location, data type, period type, context, unit.
Related Information
About Mapping [page 112]Mapping in Microsoft Office Excel [page 117]Organize your Mapping Project [page 116]About Palette [page 35]
2.8.3 Find the Data Type and Period Type of a Reportable Concept
In an XBRL instance report, all reported concepts from a taxonomy require a context, and all the reported numeric concepts require a unit definition. For more information, see Units and Unit Patterns [page 93].
In an XBRL taxonomy, element details, such as data type, period type, abstract, nillable, and balance identify whether a concept is reportable (mappable), whether a reportable concept is text or numeric, and what sort of context is required for that concept in an XBRL financial report.
76 © 2014 SAP AG or an SAP affiliate company. All rights reserved.Report Builder Help
Using Report Builder
Report Builder provides three ways to discover the data type and period type for a concept:
● The Element Details tab shows the concept name, Label, data type, and period type of a selected taxonomy element.
● The Cell Mappings dialogbox shows the concept name, Label, data type, and period type, and additional XBRL attributes for a mapped concept.
● The Instance Editor tab shows the mapped concepts, which can be sorted by standard label, data type, reference (mapped location), context, unit, decimal, and scale.
ExampleIn the examples below, the concept is a stringItem Type. Cell Mappings shows that the context ID has been mapped; therefore, the mapping is complete because string data types do not take unit, scale, or balance attributes.
● Element DetailsThe Element Details tab shows attributes for the selected concept.
NoteIf Report Builder does not automatically display details on this tab, enable Synchronization settings on the Real Time Settings tab.
● Cell MappingsThe Cell Mappings dialog box shows the XBRL attributes and element details for a mapped concept. To open this dialog box, right-click a mapped cell and click View Mappings.
Related Information
Mapping Concepts [page 73]Element Details Tab [page 28]Review and Verify Mappings [page 153]Instance Editor Tab [page 31]Real Time Settings [page 64]
2.8.4 Tuples
A set of concepts that must be grouped is called a tuple. A tuple is an XBRL taxonomy element used to report the value of a compound concept, or a combination of simple concept values.
Business information compiled in blocks of information are defined in XBRL as tuples. The tuple data model groups concepts that must be reported jointly in order for the information to make sense and that are likely to be repeated jointly in the same report.
Tuples are structures or set of concepts that must be used as a group to add meaning to the complete set of concepts within the group. Tuples can be referred to as containers of items that have meaning by being together. Tuples may be containers for other tuples.
Report Builder HelpUsing Report Builder © 2014 SAP AG or an SAP affiliate company. All rights reserved. 77
For example, while preparing your company sales report, you may want to include information about the company, such as Address Description, Address Line 1, Town, Postcode , and Country. Such information can be grouped together in a tuple that can be referred to as Company Address.
Tuples can be repeating data sets in which the same information can appear more than once in the report.
Related Information
Tuple Mapping Workflows [page 140]Mapping Nested Tuples [page 145]Replicating Tuple Mapping [page 140]Deleting Tuples [page 146]Mapping in Microsoft Office Excel [page 117]Mapping Concepts [page 73]
2.8.5 QNames
In Report Builder, qualified names (QNames) are used to include concept names as fact values. Concepts, which are reported as facts which have data type QNameItem Type, can contain only concepts in the loaded taxonomy. QNames can be mapped to cells in your Report Builder workbook.
<fact>[prefix:concept]</fact>
Sample QName path:
de-gaap-ci-2010-12-16:hbst.transfer.bsEqLiab.name
Report Builder allows you to drag and drop a concept from the loaded taxonomy to be the value of the fact, reducing the chance of data-entry errors.
In the Element Details tab, the QName concept is identified with data type xbrli:QNameItemType.
Related Information
Mapping Qnames [page 122]Reports [page 170]Preview an XBRL Instance Document [page 175]Report Validation [page 176]Save XBRL Instance Documents and Reports [page 184]
78 © 2014 SAP AG or an SAP affiliate company. All rights reserved.Report Builder Help
Using Report Builder
2.9 Instances
Report Builder is designed to validate and transform financial data in a Microsoft Excel report into an XBRL instance document. An XBRL instance document identifies the taxonomy, the reporting period (context), and the units that lend meaning to the reported fact values.
Report Builder enables users to produce, read, and validate XBRL instance documents from a Microsoft Office desktop interface. Report Builder supplies the validation, cache of XBRL taxonomies, and libraries of contexts, units, and business rules that you use or want to reuse when working with XBRL instance documents.
To set or view instance-related information in Report Builder, see:
● Instance [page 79] tab - set default entity and measure for Report Builder● Instance Editor Tab [page 31] - view or edit attributes for instance data● Element Details Tab [page 28] - view attributes for the selected taxonomy element● About Palette [page 35] - add or edit contexts, units, dimensions, and footnotes for an instance
To view, edit, validate, preview, save, or import XBRL instance data, see:
● Using the Instance Editor [page 80]● Instance Reports [page 82]● Save XBRL Instance Documents and Reports [page 184]● Import an Instance Document [page 84]
Related Information
Importing an XBRL Instance Document [page 83]Import External Data [page 168]Reset the Taxonomy Reference [page 70]
2.9.1 Instance
Use the Instance tab to set the default values for reporting entity and currency, to enable null fact values in a report, and to save XBRL mapping information in an XML file whenever the workbook is saved. Instance default settings are applied when defining a context, defining unit patterns, or saving an instance document.
Entity information is standard header content for an XBRL instance document; entity settings are required to identify the reporting company:
● Entity URI: Uniform resource identifier (URI) that represents the domain name and nature of the reporting entity
● Entity Code: Unique identifier for the reporting entity, typically registered with or assigned by a reporting authority
The default measure for numeric concepts can be set:
● Measure: Default measure for reported numeric values includes preferred currency, share, or pure. An example of pure may be a count, such as number of computers or full time employees. Report Builder has a
Report Builder HelpUsing Report Builder © 2014 SAP AG or an SAP affiliate company. All rights reserved. 79

full set of ISO4217 currency codes, which can be configured and sorted for display in Report Builder. For more information, see Currency Codes [page 72].
Enabling a nil value to be used for empty mapped cells ensures the generated instance document will pass report validation in the event a nillable fact is not reported:
● Use Nil for Empty Cells Where Possible: When enabled, Report Builder automatically assigns an xsi:nil attribute to a cell when it is mapped with a concept that is defined in the taxonomy as nillable. When this option is cleared, the xsi:nil attribute is not applied, which can lead to validation errors for unreported nillable concepts.
NoteThe Nil setting only applies to new concept mappings; to add or remove the xsi:nil attribute for a mapped cell, remap the concept.
● Enabling the Auto-save XBRL mapping file generates an XML file with mapping information when a workbook, Report Builder template, or instance document is saved. The mapping file is saved in the same location as and uses the base file name of the workbook or instance with a MappingFile.xml extension. The autogenerated MappingFile overwrites any existing file of the same name. The XML content of this file is identical to the Mappings Report. For more information, see Mapping File [page 138] and Mappings Report [page 131].
Related Information
Defining a Context [page 88]Defining a Unit Pattern [page 95]Save XBRL Instance Documents and Reports [page 184]Unit Pattern Tab [page 36]Preferences Settings (User Preferences) [page 52]User Environment [page 54]
2.9.2 Using the Instance Editor
The Instance Editor displays details about the fact data in the current workbook, whether imported or mapped.
● The Instance Editor shows the fact values, together with all of the taxonomy and contextual information for facts imported from an external source or instance document.
● If the workbook has been mapped with taxonomy elements, the Instance Editor shows the standard label and any other mapped details.
The Instance Editor tab shows details such as reference cell location, fact value, effective value, unit, and contextual information for additional detail, review customization available with the Column Chooser.
If no data displays in the Instance Editor tab and you know that fact data exists, right-click in the grid and click Update.
80 © 2014 SAP AG or an SAP affiliate company. All rights reserved.Report Builder Help
Using Report Builder
Manual Refresh
The default setting for the Instance Editor is Manual Refresh, meaning that changes in the workbook and in the Instance Editor are not synchronized until you right-click in the Instance Editor header row and click Update to refresh the content. Update applies changes in both the Instance Editor and the workbook; if content has been revised in both, the data refreshes to the most recent edit.
To automate update so that content is refreshed whenever a change is made in the workbook or in the Instance Editor grid, clear the Manual Refresh option on the Real Time Settings tab.
Synchronize
You can synchronize the Instance Editor, the taxonomy view, and the workbook to highlight the selected concept(s) in the corresponding record, taxonomy view, or cell. By default this is not enabled. To enable, see Real Time Settings [page 64].
Map or Edit Contexts and Units, Delete Mapped Facts
From the Instance Editor grid you can:
● View label, reference, fact value, effective value, context, unit, decimals and scale for imported or mapped facts and tuples.
● Map facts from an imported instance document by dragging a row or record from Instance Editor onto one or more cells in a workbook.
● Create new contexts and units, save to update Report Builder, and then apply a different context and unit to a record.
● Sort fact data by any available column.● Synchronize Report Builder with the values in the workbook.● Delete records (delete mappings and the fact value).
To delete a fact and related mapping information from the open workbook, right-click a row and click Delete Record.
Customize the Instance Editor
Right-click the header row in the Instance Editor to update data in the Instance Editor and workbook, to sort the data, or to customize the column display.
Customize the Instance Editor grid
Right-click a column header and click:
Report Builder HelpUsing Report Builder © 2014 SAP AG or an SAP affiliate company. All rights reserved. 81
● Update to synchronize the data in Report Builder and the workbook.● Default View to reset the columns that display.● Sort Ascending/Descending to sort the contents by the selected column. (You can also click a column heading
to sort.)● Column Chooser to show or hide columns using the Customization list box.
○ Drag column names to the Instance Editor tab to show additional columns.○ Drag a column header from the Instance Editor tab to hide columns.
● Best Fit to adjust column width for an individual column.● Best Fit (all columns) to adjust column width for all displayed columns.
NoteIf you are unable to accomplish these customizations, the Report Builder template may be protected. See Protecting a Report Builder Template [page 18].
Related Information
Instances [page 79]Element Details Tab [page 28]Instance Editor Tab [page 31]
2.9.3 Instance Reports
The Reports menu offers options for validating, previewing, and saving instance reports.
Validate
For more information, see Report Validation [page 176].
Validate facts in the current workbook or Report Builder template. Report Validation includes checking for well-formed XML and compliance with XBRL specifications, and can enforce custom or regulatory business rules, such as EDGAR Filer Manual Validation , and can also include externally linked content, and Calculation Trace assessments.
Preview
For more information, see Preview an XBRL Instance Document [page 175].
Preview the XBRL fact data in a workbook as raw XBRL in an XML file.
For filings based on the US GAAP taxonomy, preview a formatted tabbed instance report in the SEC Interactive Data Previewer [page 175].
Saving Instance Documents
For more information, see Save XBRL Instance Documents and Reports [page 184].
An instance can be saved as XBRL content in an .xml or .xbrl file, or as inline XBRL tags in an HTML or XHTML rendering.
82 © 2014 SAP AG or an SAP affiliate company. All rights reserved.Report Builder Help
Using Report Builder

Related Information
inline XBRL Support [page 213]Using the Instance Editor [page 80]
2.9.4 Importing an XBRL Instance Document
When you import an XBRL instance document, Report Builder constructs a relational representation using the concepts defined in the referenced taxonomy and the fact attributes from the instance. This relational representation can be validated. If no mapping information is included, the fact data can be viewed from the Instance Editor.
If Report Builder cannot locate the referenced taxonomy based on the schemaRef or taxonomy entry point in the instance document, the application prompts you for one in your local file system.
If you select a taxonomy or version of the taxonomy that does not support the concept relationships for reported facts, Report Builder may be unable to resolve attributes and concepts and automatically generates a Fact with Missing Concept report, listing the facts that have undefined concepts. For more information, see Contexts Tab [page 36] and Unit Pattern Tab [page 36].
Importing an Instance into an Unmapped Workbook
The XBRL data and the relational structure in memory have references to cell locations, but are not connected to the cells in an open unmapped workbook. Thus an imported XBRL instance report cannot display until the concepts and the related contexts and unit are mapped.
You can, however, run Report Validation for the data in the relational model in Report Builder memory, and view or validate the taxonomy using the Views and Details tabs. The Instance Editor tab also displays details about taxonomy elements, including the reference (worksheet and cell location), fact value, effective value, context, and unit. This information can be helpful in reconstructing an Excel mapping. For more information, see Report Validation [page 176], Taxonomy Views [page 22], and Details Pane [page 27].
Importing an Instance into a Mapped Workbook
When an instance is imported into a workbook that is mapped with compatible taxonomy concepts, contexts, and units, the fact values are automatically populated and visible in the workbook.
Report Builder's built-in referential integrity checks compare the taxonomy schema reference and contextual data in the instance with the mappings in the workbook. Any fact data in the instance that does not match mappings in the workbook are not imported and the application automatically generates a Fact with Missing Concept report, listing the facts in the instance for concepts that are not defined in the taxonomy, and contexts and units incompatible with taxonomy concept definition.
Report Builder HelpUsing Report Builder © 2014 SAP AG or an SAP affiliate company. All rights reserved. 83

Mapping an Imported Instance in a Workbook
You can view and map the reported data in the workbook opening the Instance Editor and dragging records onto cells in the workbook. Another way to view fact data in an imported instance document is to import the companion Mappings Report or mapping file, if available. For more information, see Import Mappings Report [page 136] and Mapping File [page 138].
Related Information
Import External Data [page 168]Log: Fact with Missing Concept in the Taxonomy [page 188]
2.9.4.1 Import an Instance Document
This example imports the facts and related XBRL attributes, such as footnotes, from an XBRL instance document into an unmapped financial report in a Microsoft Excel workbook.
1. Open an unmapped Microsoft Excel workbook.2. In the Import External Data group, click Import Data.
3. In the File Properties dialog box, in Select Data to Import, click Instance Document, and then click .4. Report Builder prompts you to select among the available contexts in the instance report. The fact data for
selected contexts is imported.
NoteTo import all information in an instance document, import the contexts or Mappings Report before you import the fact data.
The context and unit definitions for reported facts are always included in an instance document.5. In the Import From dialog box, browse to the file that contains the data you want to import:
a) Click File System or click .b) In the Open dialog box, browse to the local file and click OK.
NoteIn Report Builder, the default file extension for an XBRL instance document is .xbrl. If your instance document has a different file extension, click the File name list box and click an alternate file extension.
6. Do one of the following:
○ If the taxonomy location referenced in the instance document differs from the taxonomy or Web cache location on your local environment, Report Builder displays the Attach Taxonomy dialog box prompting you to browse to the taxonomy schema.
84 © 2014 SAP AG or an SAP affiliate company. All rights reserved.Report Builder Help
Using Report Builder
○ If the instance document references a Web-based taxonomy, enable Internet connectivity in the Network Settings. For more information, see Configure Network Settings [page 56].
When the taxonomy is located, Report Builder loads the taxonomy. When the taxonomy is loaded, Report Builder displays the Context Selection dialog box, prompting you to select the contexts for the fact data you want to import.
7. Select the contexts for the facts you want to import and then click OK.If you clear a context, the facts related to that context are not imported.
NoteReport Builder creates a logical representation of the concepts and relationships defined in the taxonomy, together with the fact data for the selected contexts from the instance report. Fact data from an imported instance data is viewable in the Instance Editor; to view the instance data in the workbook, import the related Mappings Report. For more information, see Mapping File [page 138].
The taxonomy view that Report Builder displays is based on the default definition for real time settings. For more information, see Real Time Settings [page 64]. The extension taxonomy may have a limited set of linkbase relationships and the workbook displays the imported fact data based on available cell mappings. Mapped cells are highlighted with the mapping colors specified in your User Preferences. For more information about mapping colors, see User Environment [page 54]. For more information about user preferences, see Preferences Settings (User Preferences) [page 52].
NoteIf an XBRL instance document is imported to an unmapped workbook, fact data can be viewed and edited in the Instance Editor and can be validated and saved as a new instance; however, the facts are not visible in the workbook. To view the facts in the workbook, import the related Mappings Report or build a mapped report by dragging fact data from the Instance Editor onto the workbook. For more information, see Mapping in Microsoft Office Excel [page 117].
Related Information
Importing an XBRL Instance Document [page 83]Considerations when Importing a Mappings Report [page 137]Log: Fact with Missing Concept in the Taxonomy [page 188]Unmapped Fact Report [page 161]Instance Editor Tab [page 31]Import Contexts [page 91]Import Mappings Report [page 136]
Report Builder HelpUsing Report Builder © 2014 SAP AG or an SAP affiliate company. All rights reserved. 85

2.10 Contextual Information
Contextual information is required for each mapped concept in order to generate a valid XBRL instance document. Contextual information provides XBRL attributes, or characteristics that give semantic meaning to reported fact data.
In Report Builder, the About Palette [page 35] helps you manage (define, map and edit) XBRL contextual information.
The Palette tabs include:
Contexts Tab [page 36] identify the entity, reporting period (time frame), and dimensional information (scenarios and segments) for each reported fact.
Unit Pattern Tab [page 36] provide measurement information (units, decimal/precision) for numeric facts.
Create a Footnote [page 102] provide optional supportive narrative text that further defines the data in a report.
Dimensions [page 107] provide ways to define and view related reported facts.
The recommended workflow is to collect the contexts, units, measurements, footnotes, and dimensions prior to starting a mapping project.
Related Information
Organize your Mapping Project [page 116]
2.10.1 Contexts
In XBRL, a context is required for each reported fact. Context identifies the reporting entity, the reporting period, and, optionally, the reporting scenario.
You can reuse contexts by importing them from a Mappings Report or an XBRL instance document. Use Bulk Update to change the definition of a context that has been mappe.
If tooltips are enabled, you can view the definition of a context by pausing the pointer over a row in the Contexts Tab [page 36].
Default Values
You can set the default Entity URI and Entity Code for new contexts. See the Instance [page 79] tab of Preferences Settings. Setting defaults ensures that the default attributes are consistently applied.
86 © 2014 SAP AG or an SAP affiliate company. All rights reserved.Report Builder Help
Using Report Builder
Clicking a row in the Contexts tab outlines the cells that are mapped with a selected context ID. For more information, see Synchronization and Show Tooltip on the Real Time Settings [page 64] tab.
Context Definitions
You can define any number of contexts for a given reporting period; however, avoid creating different context names with identical definitions, as this can lead to calculation and validation errors in an XBRL instant document. Use the following procedures to create and manage contexts:
● Defining a Context [page 88]● Mapping Contexts [page 89]● Editing a Context [page 90]● Import Contexts [page 91]● Deleting a Context [page 91]● Bulk Update - Updating Contexts [page 92]
2.10.1.1 Contexts Tab
The Contexts tab is used to define, edit, delete, and view contexts, which provide detailed information about reporting periods.
The Contexts tab shows the contexts that you defined, the contexts you imported, or the contexts that are mapped in the current workbook.
Report Builder helps you define, edit, and delete contexts, map contexts in a workbook, and globally update the contexts that are mapped.
Defining a Context [page 88]
Editing a Context [page 90]
Deleting a Context [page 91]
Import Contexts [page 91]
Bulk Update - Updating Contexts [page 92]
Related Information
Incomplete Mapping Report [page 157]Full Mapping Report [page 160]
Report Builder HelpUsing Report Builder © 2014 SAP AG or an SAP affiliate company. All rights reserved. 87

2.10.1.2 Defining a Context
A Contexts [page 86] contains information about the reporting entity, the type and range of the reporting period, and additional scenario and/or organizational segment dimensions that collectively give meaning to reported business facts.
In an XBRL instance, a context must be included for each reported fact.
It is important to know the reporting period(s) to be included in a report and to identify the data types associated with the reported concepts. Facts that belong to a particular reporting period or data type must be mapped with the same context, and a financial report cannot use more than one set of entity identifiers.
Example
This example creates an instant context for the reporting entity Sample Mapping Company for the second quarter of 2010, using the following details:
● Reporting period: 2010-Q2● Entity URI: http://SampleCompany.com● Entity Code: SMC
The unit is defined in Defining a Unit Pattern [page 95]; the rest of the information is defined in the procedure below.
To define a new context
1. Open a Microsoft Excel workbook and Load Taxonomy Overview [page 66].
2. In the Report Builder toolbar, click to open the Palette, and then click the Contexts tab.
3. On the Contexts toolbar, click [New Context].4. In the New Context dialog box, enter the required attributes.
○ <ID:> a unique identifier for the context. A context ID must begin with an alphabet character; often the reporting authority has specific requirements for the context format and values.
○ <Description:> optional text field for describing the context ID.○ Entity URI: the scheme (http://) and domain (domain.com) for your company or organization. To set the
default value for Entity URI, see Instance [page 79] tab in Preferences Settings.○ <Entity Code:> identifier for the reporting company or reporting entity and often obtained from or set
by a regulator. This can be any combination of numeric or alphabet characters. To set the default value for Entity Code, see Instance [page 79] tab in Preferences Settings.
○ <Type:> the time frame, or reporting period, that the data represents. Options are Instant (as of date), Duration (start date and end date), or Forever (no date). Selecting a context Type enables the applicable calendar list boxes for the dates.
○ <Instance> or <Start Date> and <End Date>: click the calendar to choose a date.
88 © 2014 SAP AG or an SAP affiliate company. All rights reserved.Report Builder Help
Using Report Builder

○ <Scenario> and <Segment>: unclassified Dimensions [page 107] in the taxonomy.5. Optionally, Dimensions [page 107] or Scenarios and Segments [page 110].6. Click OK to create the context.
NoteYou can sort the Contexts list by any attribute type by clicking a column header.
Related Information
Editing a Context [page 90]Deleting a Context [page 91]Import Contexts [page 91]
2.10.1.3 Calendar - Select a Date
The weekdays and the way they display on the calendar (Sunday to Saturday, Monday to Sunday) are based on the operating system and the Regional Settings set in the Windows Control Panel. The default date is the currently selected month and the year.
To change the month (year, decade), click once (twice, three times) on the displayed month and year in the title bar, click the right or left arrows for next or previous, and then click to select the (decade, year, month) date. The calendar automatically closes when a date is selected.
2.10.1.4 Mapping Contexts
Contexts are defined for a particular reporting entity, reporting period, and optional scenario or segments that collectively give meaning to reported business facts. All concepts that belong to a particular scenario (or dimension), reporting period, or data type must be mapped with the same context.
Example
This procedure shows how to Mapping in Microsoft Office Excel [page 117] a Defining a Context [page 88] onto Mapping Concepts [page 73] in Microsoft Excel.
Report Builder HelpUsing Report Builder © 2014 SAP AG or an SAP affiliate company. All rights reserved. 89

To map a context
1. Open a workbook that has been mapped with concepts. For this exercise, open Mapped with Concepts.xlsx located in ..\Tutorials\Mapping\Templates .
2. In Report Builder , click About Palette [page 35].3. In the Contexts tab, select the context you wish to map; for example, select I-Ctx2011. If no contexts display,
define or import concepts. See Defining a Context [page 88].4. In the workbook, select the cells that contain concept mappings. In this example, select cells C5:C12.5. Drag the context from Report Builder onto the selected cells.6. The selected cells show as mapped to the context I-Ctx2011 .7. Repeat Steps 4 to 6 to map context I-Ctx2010 to the mapped concepts in column D in the sample workbook.
You can map contexts or units to a mapped concept.
Related Information
Mapping Units and Unit Patterns [page 97]Using the Instance Editor [page 80]
2.10.1.5 Editing a Context
The About Palette [page 35] in the About Palette [page 35] displays the contexts that are defined in the open workbook.
You can edit these contexts individually, or, if you have to change the definition of numerous contexts that have been mapped, use the Bulk Update - Updating Contexts [page 92] feature.
NoteYou can use this feature to revise contexts that have been defined as well as contexts that have already been mapped. To revise context mappings in the current workbook, use the Context column in the Instance Editor Tab [page 31].
To edit a context definition
1. Open a workbook that contains defined contexts.
2. In the Report Builder toolbar, click to open the Palette , and then click the Contexts tab.3. The Contexts tab displays the contexts defined in the current workbook.4. Double-click a context or select a context and then click the Edit Context icon.5. In the Edit Context dialog box, change or add any attributes.
90 © 2014 SAP AG or an SAP affiliate company. All rights reserved.Report Builder Help
Using Report Builder

NoteThe Context ID is a read-only field and cannot be edited.
6. Click OK to save your changes. Any changes are reflected immediately in the Contexts tab.7. To view context details in a tooltip , pause the pointer over a row.
NoteTo enable tooltips . See Real Time Settings [page 64].
Related Information
Contexts Tab [page 36]Deleting a Context [page 91]Import Contexts [page 91]
2.10.1.6 Import Contexts
You can select the contexts to import from an instance document. Only the concepts and facts for the selected contexts are imported.
To import contexts from an instance document
1. From the UBmatrix Tab [page 16], click Import External Data and then click Import Data.2. In the File Properties dialog box, select the Contexts chek box and clear the other check boxes.
3. Click to browse to an instance document that contains the contexts you want to use.4. In the Import From dialog box:
○ Click File System to import instance document stored on your local file system.5. Click OK.
2.10.1.7 Deleting a Context
1. Click to open the Palette.
2. In the Contexts tab, click a context to select it, and then click [Delete Context].3. In the Delete Context confirmation message dialog box, click Yes.
Report Builder HelpUsing Report Builder © 2014 SAP AG or an SAP affiliate company. All rights reserved. 91

4. The context is deleted from the context list and is also deleted from each cell it was mapped to. The Cell Mappings dialog box will show that the context ID is no longer available.
Related Information
Contexts Tab [page 36]Scenarios and Segments [page 110]Mapping Contexts [page 89]Bulk Update - Updating Contexts [page 92]
2.10.1.8 Bulk Update - Updating Contexts
Bulk Update supports changing details about contexts that are already mapped. You can edit the attributes of one or multiple contexts in the current workbook and report builder automatically applies the change to each occurrence of each context.
You can redefine:
● Description● Entity URI● Entity Code● The dates for a given period type.
NoteThe Context ID is a primary cannot be changed from Bulk Update or by Editing a Context [page 90].
Bulk Update is available from the toolbar on the Contexts Tab [page 36] tab of the About Palette [page 35].
To update contexts mapped in the current workbook
1. On the Report Builder toolbar, click to open the About Palette [page 35].
2. On the Contexts tab, click Bulk Update.3. In the ID field of the Update Contexts dialog box, enter a mapped context ID, or to select one or more
contexts, click .4. Click to clear individual contexts, and then click OK.5. In the Update Contexts dialog box, enter new values for any attribute you want to update, and then click OK.6. The Contexts Updated dialog box displays a confirmation message. Click OK.7. The Contexts tab shows changes have been applied to the selected context definitions, and the mappings in
the current workbook reflect the new definitions.
92 © 2014 SAP AG or an SAP affiliate company. All rights reserved.Report Builder Help
Using Report Builder
Related Information
Contexts Tab [page 36]Mapping Contexts [page 89]Global Update [page 125]
2.10.2 Units and Unit Patterns
An XBRL taxonomy defines the data type for each numeric concept. Data types for XBRL concepts include date , monetary (which includes a credit or debit balance modifier), shares, decimal, integer, and ratio/percentage.
Data types are similar to the number categories in Microsoft Excel (Currency, Percentage, Number, Date, Time).
However, the taxonomy does not define the units (or measure) for a data type; units are instance elements:
Each numeric fact reported in an XBRL instance document must include a unit definition that identifies the data type and one or more unit attributes , such as precision (+ or-), decimals, and one or more currency codes from the ISO 4217 namespace.
Although it is possible to define more than one currency, the taxonomy definition enforces any requirements for "related concepts" to use a compatible unit definition.
Report Builder supports the XBRL 2.1 specification for units, enabling you to define a single measure (simple unit), a ratio (complex unit) that can be represented by multiplied units, divided units with numerator and denominator elements. Simple units must include either a precision or decimal attribute.
Examples of simple units include:
● <monetary>: in many possible currencies● <shares>● <Pure>: can be anything: distance in miles or meters, weight, full time employees, or acres
Examples of ratios, or complex units, include
● <earnings per share>● <return on investment>● <rate of return>
Report Builder helps define unit patterns and enables you save and reuse unit patterns consistently in a workbook or across workbooks. Unit patterns that you define and units for facts in an instance document or mapped to concepts in a workbook are viewable on the About Palette [page 35].
You can define any number of unit patterns for a given data type, but in an XBRL instance, units for given data type cannot be mixed; inconsistent attributes cause validation and calculation errors. For example, mixed monetary units are not valid in an XBRL instance report.
Report Builder prevents you from mapping multiple unit definitions for the same data type. It is important to use descriptive names for the unit patterns you define and even more important to avoid mapping multiple unit patterns for with the same unit definition in a report.
Report Builder HelpUsing Report Builder © 2014 SAP AG or an SAP affiliate company. All rights reserved. 93
NoteYou can set default Decimals or Precision attribute for unit patterns you define. See Setup [page 53] tab in Preferences Settings.
Unit Patterns
My Patterns shows the unit patterns that you've defined in Report Builder; these unit patterns are available for mapping in any workbook you open, and can replace any units used in a workbook or instance.
Use the following procedures to manage your unit patterns. Unit patterns are saved in the Report Builder config.xml file.
Defining a Unit Pattern [page 95]
Editing a Unit Pattern [page 97]
Deleting a Unit Pattern [page 98]
Units
Use the following procedures to manage units in a workbook:
Import Units [page 99]
Editing a Unit in a Workbook [page 99]
Deleting a Unit from a Workbook [page 100]
Related Information
Unit Patterns FAQ [page 101]
2.10.2.1 Unit Pattern Tab
Report Builder helps you define the units and decimal or precision pairs for numeric facts. Because XBRL supports combinations of a broad range of units and permits many combinations for unit definitions, Report Builder provides a library for storing unit patterns that you use repeatedly as unit patterns that are in a personal My Patterns library. Unit patterns can be mapped as units in any workbook that you open in Report Builder. You may also import units to map in the workbook.
A unit pattern consists of a unit of measurement and the decimal or precision of the value.
94 © 2014 SAP AG or an SAP affiliate company. All rights reserved.Report Builder Help
Using Report Builder
The currency codes available in Report Builder are defined in the CurrencyCodes.xml file located in the ..\RBMEresources\System folder.
NoteXBRL data types differ from the number formats in Microsoft Excel. Microsoft Excel number formats are not used in Report Builder.
To view the Unit Patterns tab, click Palette in the Report Builder toolbar. The Unit Patterns tab has two panes that identify unit definitions in the workbook and unit pattern definitions in your library:
● The Currently In Use pane displays the units that are mapped or loaded (imported) in the open workbook.● The My Patterns pane displays the unit patterns that you have defined and saved in your personal library.
NoteFor more information about XBRL instance documents, see XBRL Fundamentals [page 7]. For additional procedures that are specific to instance documents in Report Builder, see Instances [page 79].
Mapping a unit pattern to a cell adds two attributes to the concept that is mapped to that cell:
● <Unit ID>● <Decimals or Precision>
You can add, modify, or remove unit patterns in My Patterns without affecting the unit patterns that are defined in a Report Builder template, the open workbook, or the instance document. You can also set the default settings for decimal and precision in Report Builder.
For more information on how to define and map units and precision/decimal attributes in a Report Builder template on the Unit Patterns tab, see Units and Unit Patterns [page 93].
Related Information
Incomplete Mapping Report [page 157]Full Mapping Report [page 160]
2.10.2.2 Defining a Unit Pattern
To create a Report Builder template, units must be defined before they can be mapped to numeric concepts. You can import units from other mapped XBRL content and use them in the current workbook, or you can define unit patterns, which are saved in Report Builder so that they are available in any workbook.
Unit Patterns have a friendly name for the unit definitions you use. For more information, see Units and Unit Patterns [page 93].
Report Builder HelpUsing Report Builder © 2014 SAP AG or an SAP affiliate company. All rights reserved. 95
To define a unit pattern
1. Open a Microsoft Excel Workbook.
2. On the Report Builder toolbar, click to open the Palette, and then click Unit Patterns.
3. On the My Patterns toolbar, click (New Unit Pattern).4. On the New Unit Pattern dialog box, enter a Pattern Name that describes the unit definition.5. 5 Under Unit Definition, select or enter values for the following fields:
○ <ID> select or enter an identifier for the unit. The unit ID and definition becomes part of the instance document that reports facts mapped with this unit ID. The Unit ID must start with an alpha character and cannot contain spaces or special characters.
○ <Description> optionally, enter an brief summary of the purpose of this unit pattern.○ <Type> select Simple (a numeric measure), MultipliedUnits (shares times currency per share), or
DividedUnits (a rate, percentage or ratio, such as currency per share). For more information, see XBRL 2.1, section 4.8.2.
○ <Numerator> for Simple or MultipliedUnits, click + to open the Add Measure dialog box and select an ISO 4217 currency, or shares, pure, or enter your a custom measure, and then click OK. To alter the list of available currencies and measures, see Currency Codes [page 72].
○ <Denominator>, for DividedUnits, click + to open the Add Measure dialog box and select an ISO 4217 currency, shares, pure, or enter your a custom measure, and then click OK.
NoteUse the + (plus) sign to add multiple numerators (for multiplied units). Use the - (minus) sign to delete a Numerator or Denominator definition. To set default values for unit patterns, see Measure on the Instance [page 79] tab in Preferences Settings.
6. Under Decimal/Precision Definition, select Decimal, Precision, or No Decimal/Precision.
○ For Decimal, select a value (-100 to +100, or INF).○ For Precision, select a value. (0 to 9, or INF).
NoteTo set default values for Decimal and Precision, see the Setup [page 53] tab in Preferences Settings.
7. 7 Click OK to save the new unit pattern.
Related Information
Import Units [page 99]About Mapping [page 112]Unit Pattern Tab [page 36]
96 © 2014 SAP AG or an SAP affiliate company. All rights reserved.Report Builder Help
Using Report Builder

2.10.2.3 Mapping Units and Unit Patterns
This procedure shows how to map units and unit patterns to cells and cell blocks in a Microsoft Excel workbook.
All numeric concepts must be mapped with a unit. See Find the Data Type and Period Type of a Reportable Concept [page 76].
This procedure assumes that you have already mapped concepts in the Microsoft Excel workbook:
● If concepts have not been mapped in your workbook, see Mapping Concepts [page 73].● You can only map units that have been defined. If no units are mapped in the workbook and no unit patterns
have been defined, see Defining a Unit Pattern [page 95] or Import Units [page 99].
To map a unit or unit pattern
1. Open a Microsoft Excel workbook that is mapped with concepts.2. Select a cell or a range of cells you wish to map. In the sample workbook, select cells C9 to G15.
NoteYou can drag a unit pattern onto a selected cell block (multiple rows and/or multiple columns).
3. On the Report Builder toolbar, click to open the Palette, and then click the Unit Patterns tab.4. In My Patterns, click a unit that you want to map. Map this unit to all numeric concepts by dragging the unit
pattern onto a cell or selected cell block.5. Partially mapped cells change color when mapped, and the unit is added to the Currently In Use list.
NoteUnit patterns can be mapped from the Currently In Use list or the My Patterns list.
2.10.2.4 Editing a Unit Pattern
Editing a unit pattern revises the definition that is stored in your My Patterns library and does not alter the unit definitions in the workbook or the imported instance document. To change a unit in the workbook or instance document, Editing a Unit in a Workbook [page 99] from in the Currently In Use list.
Edit a Unit Pattern
My Patterns lists the unit patterns that you have defined in your Report Builder library. You can edit a unit pattern without affecting mapped units. Changes to unit patterns in My Patterns are saved in Report Builder and can be reused in multiple Report Builder templates.
Report Builder HelpUsing Report Builder © 2014 SAP AG or an SAP affiliate company. All rights reserved. 97
To edit a unit pattern
1. Click a unit pattern under My Patterns and then click [Edit Unit Pattern].2. The Edit Unit Pattern dialog box shows that any attribute of a unit pattern can be modified.3. Make any definition changes, and then click OK.4. In the example below, a description was added to the Euro unit pattern. The unit in Currently In Use shows
that editing the unit pattern does not alter the mapped unit; to apply the change to the workbook, see. To edit mapped units, see Editing a Unit in a Workbook [page 99].
To view the definition of a unit or unit pattern in a tooltip, pause the pointer over a row.
Related Information
Unit Pattern Tab [page 36]Defining a Unit Pattern [page 95]Mapping Units and Unit Patterns [page 97]
2.10.2.5 Deleting a Unit Pattern
My Patterns shows the unit patterns that you've defined in Report Builder. You can delete a unit pattern without affecting any mappings in an open a workbook.
To delete a unit pattern
1. Click on the Report Builder toolbar to open the About Palette [page 35], and then click the Unit Patterns tab.
2. Under My Patterns , highlight the unit pattern you want to delete.
3. In My Patterns toolbar , click [Delete Unit Pattern].4. In the Delete Unit dialog box , click Yes.5. The unit pattern definition is no longer available in My Patterns on the Unit Patterns tab.
The mappings in the workbook are not affected by this change.
Related Information
Deleting a Unit from a Workbook [page 100]Editing a Unit Pattern [page 97]
98 © 2014 SAP AG or an SAP affiliate company. All rights reserved.Report Builder Help
Using Report Builder
Editing a Unit in a Workbook [page 99]
2.10.2.6 Import Units
You can reuse units by importing the unit definition from an instance document or mappings file.
This procedure shows how to import unit definitions from an instance document and reuse them in the current workbook.
To import units from an instance document
1. From the UBmatrix tab, click Import External Data, and then click Import Data.2. In the Import dialog box, select the Units option and click Browse.3. In the Import From dialog box, click an option and then click the appropriate icon to browse for the saved
instance document.Click File System to import an instance document stored on your local file system.
Related Information
Import an Instance Document [page 84]Import Contexts [page 91]Import Mappings Report [page 136]
2.10.2.7 Editing a Unit in a Workbook
You can change the definition of a unit that is already mapped and alter all occurrences in the workbook or imported instance.
To edit a unit
1. Select a unit in the Currently in Use pane, and click the Edit Unit icon.2. In the Edit Unit dialog box, select:
a. Replace with existing unit pattern to replace the definition of the unit that is mapped in workbook with the definition of a unit pattern from My Patterns. All of the cells mapped with the existing unit will be updated.
b. Modify existing unit manually to change the definition of the unit in the current workbook. All Unit Definition fields except Unit ID, and all Decimal/Precision Definition fields are available for update. To
Report Builder HelpUsing Report Builder © 2014 SAP AG or an SAP affiliate company. All rights reserved. 99

change the Unit ID, Editing a Unit Pattern [page 97] and then restart this procedure, selecting Replace with an existing unit pattern.
3. Click OK.4. The unit definition is updated for any concept or fact mapped with the unit ID. This edit has no affect on unit
patterns under My Patterns.5. In the Currently In Use pane, pause the pointer over a unit to view the definition in a tooltip.
NoteIf tooltips do not display, enable them on the Real Time Settings [page 64] tab in the Preferences Settings (User Preferences) [page 52] dialog box.
After redefining a mapped unit, it is a good idea to generate a Reports: Validation [page 177] that includes Reports: Calculation Trace [page 178] in order to verify the change did not create unexpected errors.
Related Information
Unit Pattern Tab [page 36]Editing a Unit Pattern [page 97]Deleting a Unit from a Workbook [page 100]
2.10.2.8 Deleting a Unit from a Workbook
There are two ways to delete a unit from an open workbook.
Delete a unit mapping from one or more cells
Right-click one or more cells in the workbook and then click Delete Unit in the context menu to delete the mapping from selected cells.
The affected cells appear in a reverse video dashed-line box.
Delete a unit from a workbook
To remove a unit from all mapped cells in a workbook, delete the unit from the Currently In Use list. The unit is not available in the workbook and may be available in your My Patterns collection.
100 © 2014 SAP AG or an SAP affiliate company. All rights reserved.Report Builder Help
Using Report Builder

To delete a unit from a workbook
1. On the Report Builder toolbar , click [About Palette [page 35]], and then click the Unit Patterns tab.2. Under Currently In Use , click the unit you want to delete.
3. In the Currently In Use toolbar, click [Delete Unit].4. On the Delete Unit dialog box, click Yes.5. On the Delete confirmation dialog box, click Yes.6. Report Builder displays a hashed border around the cells that had been mapped with the deleted unit.7. The unit is no longer available in the Currently In Use list on the Unit Patterns tab.
After deleting a mapped, or Currently In Us unit, it is good practice to generate a Full Mapping Report [page 160] or Incomplete Mapping Report [page 157] to assess incomplete mappings.
Related Information
Units and Unit Patterns [page 93]Unit Patterns FAQ [page 101]
2.10.2.9 Unit Patterns FAQ
This FAQ provides supplemental information for managing the unit patterns that are in your MyPatterns list:
● My Patterns has multiple units named USD for US GAAP and for COREP. How do the same units coexist?You cannot create unit patterns that use the same Unit ID for two different taxonomies. This is considered an incompatible definition. See Defining a Unit Pattern [page 95].
● Can I reuse My Patterns from previously mapped workbooks?You can import an instance document that had been created by a previous version of Report Builder into this release of Report Builder without problems, however, the Unit Patterns feature has changed the way it uses metadata, so workbooks created by a version earlier than Report Builder v3.5.2 will not work.If you import an instance document that uses Unit Patterns from older versions of Report Builder, the import should be successful. You can create additional mappings in the workbook; however, editing facts that were imported from an older mapping may result in duplicate facts, which can cause XBRL validation errors. You should delete the old mapping and create a new one. See Duplicate Mapping Report [page 129].
● What happens if I create the same unit definition under two different names?You can save a unit pattern definition under multiple names in MyPatterns. However, when you map two unit patterns with an identical definition to different cells in a workbook, Report Builder automatically removes one of the unit patterns from the workbook and from the Currently In Use list.
2.10.3 Footnotes
Report Builder supports defining and saving footnotes in a workbook, even if they are not mapped to a fact.
Report Builder HelpUsing Report Builder © 2014 SAP AG or an SAP affiliate company. All rights reserved. 101

Footnotes are optional narrative that further define, support, or provide additional meaning for one or more facts in an XBRL instance document. A footnote can contain formatted or unformatted text or can be a reference to another document, such as a schedule or a fully formatted Microsoft Word document.
The Report Builder Footnotes Tab [page 102] displays details about the footnotes that are defined or mapped in the current workbook. Report Builder simplifies the processes for:
● Create a Footnote [page 102]● Saving a footnote in multiple languages and formats● Mapping Footnotes [page 103]● Viewing Footnotes [page 104]● Import Footnotes [page 105]● Delete or Remove a Footnote [page 106]
Related Information
inline XBRL FAQ [page 218]
2.10.3.1 Footnotes Tab
Use Footnotes tab in the About Palette [page 35] to define, edit, and map footnotes. Footnotes that you create are saved in workbook and can be mapped to any mapped concept.
The Footnotes tab is available by clicking the About Palette [page 35] on the Report Buildertoolbar .
The Footnotes tab displays all the footnotes that are defined in the current workbook or imported instance. Unmapped footnotes appear with an icon. To view the details about a footnote, pause the pointer over a row. The footnote language, text, and mapping information displays in a tooltip.
To view details about footnote mappings, see Mapping Footnotes [page 103] and Delete or Remove a Footnote [page 106].
Related Information
About Palette [page 35]Create a Footnote [page 102]
2.10.3.2 Create a Footnote
This procedure assumes that the taxonomy is already loaded.
102 © 2014 SAP AG or an SAP affiliate company. All rights reserved.Report Builder Help
Using Report Builder

Footnotes can be created in an open workbook at any time. Although footnotes can be defined without reference to a taxonomy, the taxonomy must be available (open) in order to map a footnote. Footnotes can only be mapped to mapped concepts.
Footnote content is saved in the workbook, but only mapped footnotes are included in a Mappings Report [page 131], Mapping File [page 138], or XBRL instance.
1. In the Report Builder window, click to open the Palette.
2. Click the Footnotes tab, and then click the New Footnote icon .3. In the New Footnote dialog box, select a language from the Language drop-down list.4. In the Text field, enter the footnote or paste content copied from another source.5. Select Preserve Formatting to keep the original text style. If Preserve Formatting is not selected, the footnote
is saved as plain text and footnotes use the report template default font.6. Click OK to save the footnote.
The footnote is added to Report Builder. To view details about a footnote, pause the pointer over the row. A tooltip displays details about the selected footnote.
Related Information
Mapping Footnotes [page 103]About Palette [page 35]Delete or Remove a Footnote [page 106]
2.10.3.3 Mapping Footnotes
Footnotes can be mapped to any mapped fact.
The following example shows how to map an existing footnote to the fact value for Asset ID LD01, Land, in Microsoft Excel.
To map a footnote in the current workbook
1. On the Report Builder toolbar, click to open the About Palette [page 35].2. Click the Footnotes Tab [page 102] tab to view the footnotes that are defined or mapped in the current
workbook. Report Builder are listed, together with the language of the footnote and the text. Large or formatted footnotes have a link in the Text column that opens the footnote in a secondary window.
3. Drag the first footnote Value of Land to the Value column for LD01.4. The Value of Land footnote icon has disappeared from the left column. Right-click the footnote you just
mapped to view details in a tooltip.
Report Builder HelpUsing Report Builder © 2014 SAP AG or an SAP affiliate company. All rights reserved. 103

NoteA footnote can be mapped to multiple cells and multiple footnotes can be mapped to a cell.
5. Right-click a cell, click View Mappings from the context menu, and then in the Cell Mappings dialog box click
to view details about the footnote(s) that are mapped to a cell.6. The Footnotes dialog box lists all the footnotes for the mapped cell;the text column contains hyperlinks to
formatted or large footnotes.7. Click the hyperlink to view formatted content in the Footnote Viewer dialog box.8. Click OK close the dialog box.
Related Information
Create a Footnote [page 102]Delete or Remove a Footnote [page 106]
2.10.3.4 Viewing Footnotes
Report Builder provides multiple options for viewing footnotes.
From the Create a Footnote [page 102]:
● Click a footnote to highlight the cell(s) that it is mapped to.● Pause the pointer over a row to display the footnote details in a quick info text.
From the mapped workbook:
● Right-click a footnote and then click Disassociate to open the Footnote Selection dialog box, which shows the footnotes and the the concept(s) and cell reference(s) it is mapped to.
To view footnote mappings
1. In the Report Builder toolbar of a workbook, click the Palette icon , and then click the Footnotes tab.
2. In the Footnotes grid, click a mapped footnote (a row that does not have a icon).3. Each cell that is mapped with the selected footnote is outlined.
NoteThe Footnotes tab is a central location to view and edit all the footnotes in a workbook. Unmapped footnotes
are easily identified by the icon on a row.
104 © 2014 SAP AG or an SAP affiliate company. All rights reserved.Report Builder Help
Using Report Builder

To view the content of a footnote
1. Open the Create a Footnote [page 102], and pause the pointer over a row of a text-based footnote.2. Details of the footnote display in a quick info text.
To view content of a formatted footnote
Formatted footnotes display as a hyperlink on the Create a Footnote [page 102].
1. Open the Create a Footnote [page 102], and click the Click here to view hyperlink.2. The Footnote Viewer dialog box shows footnote details, including the formatted content of the footnote.3. Click and drag any corner of the dialog box to resize and display the content of the footnote. Use the scroll bar
to view multipage footnote content.4. Click Close to close the Footnote Viewer dialog box.
Related Information
Create a Footnote [page 102]
2.10.3.5 Import Footnotes
When you import data from an XBRL instance document or mapping file, the footnotes that are associated with imported facts or mappings are also imported. The imported footnotes retain any formatting that was provided in the instance or mapping file. See:
● Sample Mappings Report [page 132]● sample footnote in an XBRL instance document
The ability of Report Builder to both generate and import XBRL is often referred to as round trip functionality.
Import Data
You can import footnotes from an XBRL instance document into a blank workbook or into the current mapping project. You can import all of the fact data in an XBRL instance document, or fact data for one or more specified contexts in the report. The footnotes associated with the imported fact data are also imported and can be edited, validated, or saved.
Use the Select Data to import wizard to select the items to import from an XBRL instance document; for information about importing XBRL fact data and related XBRL metadata, see Import an Instance Document [page 84].
Report Builder HelpUsing Report Builder © 2014 SAP AG or an SAP affiliate company. All rights reserved. 105
Import Mappings
You can import footnotes from a mapping file into a blank workbook or into the current mapping project. The mapping file automatically associates the footnotes with one or more You can import all of the fact data in an XBRL instance document, or fact data for one or more specified contexts in the report. The footnotes associated with the imported fact data are also imported and can be edited, validated, or saved.
Use the Select Data to import wizard to select the items to import from an XBRL instance document; for information about importing XBRL fact data and related XBRL metadata, see Import an Instance Document [page 84].
Related Information
Import an Instance Document [page 84]Import Mappings Report [page 136]
2.10.3.6 Delete or Remove a Footnote
You can dissociate one or more footnotes that are mapped to a particular cell in the workbook, or you can dissociate a particular footnote from one or more cells that it is mapped to.
To dissociate one or more footnotes mapped to a cell
1. Right-click the cell that is mapped with one or more footnotes and click Disassociate Footnotes from the context menu.
2. In the Footnote Selection dialog box select the footnote(s) you want to remove (a cell can be mapped with multiple footnotes in different languages).
3. Optionally, click Select All to dissociate all footnotes.4. Click OK.
5. Click to open the Palette, and then click the Footnotes tab to verify that the footnote is either available or is no longer mapped to the cell.
To dissociate one or more fact values (cell mappings) from a footnote
1. Click to open the Palette.
2. Click the Footnotes tab, click the footnote you want to dissociate, and then click on the Footnotes toolbar.
106 © 2014 SAP AG or an SAP affiliate company. All rights reserved.Report Builder Help
Using Report Builder
3. The Fact Selection dialog box lists the associated facts, which can be sorted by attributes: concept name, value, context, unit, decimals.
4. Click to select one or more facts that you want to dissociate from the footnote.5. Optionally, click Select All to dissociate all facts from the footnote.6. Click OK.7. Optionally, right-click a cell or review the Instance Editor Tab [page 31] to verify that the footnote is no longer
associated with a fact or mapped concept.
To delete a footnote
1. Click to open the Palette.2. Click the Footnotes tab, and click the footnote you want to delete.
3. Click .4. In the verification dialog box, click Yes to remove the footnote from this workbook.
Related Information
Create a Footnote [page 102]Mapping Footnotes [page 103]
2.10.4 Dimensions
In financial reporting, dimensions are used to categorize information by constituent parts, providing additional ways to view the same information, such as total sales by product or by region.
Some examples of dimensions include:
● A group and the business segments and/or geographic segments of a group● A class of sales and the breakdown of that class of sales by product or by region● A breakdown of the components of profit and loss by the continuing and discontinuing portions● A comparison of the actual, budgeted, and the variance between the actual and budgeted figures
For more information, see Dimensions Overview [page 108].
Related Information
Explicit and Typed Dimensions [page 109]Dimensions Tab [page 33]Scenarios and Segments [page 110]
Report Builder HelpUsing Report Builder © 2014 SAP AG or an SAP affiliate company. All rights reserved. 107
Mapping a Typed Dimension [page 149]Mapping Explicit Dimensions [page 150]
2.10.4.1 Dimensions Overview
Report Builder fully supports XBRL dimensions 1.0 and provides an interface for expanding contexts to include both Explicit and Typed Dimensions [page 109]. When preparing an XBRL instance report, dimensions provide a way to categorize the reported data, either by dimensions that are defined in a taxonomy, or by dimensions that you create.
Dimensions that are defined in the taxonomy can be mapped from the Dimensions Tab [page 33] of the taxonomy view in Microsoft Excel; dimensions that you generate can be mapped from the Dimensions Tab [page 33] of the palette.
This book demonstrates Mapping a Typed Dimension [page 149], Mapping Explicit Dimensions [page 150], and Viewing and Editing Mapped Dimensions [page 110].
Related Information
Taxonomy Validation Tab [page 35]
2.10.4.2 Dimensions Tab
Report Builder supports using both explicit and typed dimensions. Two Dimensions tabs display different information about dimensions:
● Details Pane● Palette
For more information, see Dimensions Overview [page 108].
Dimensions Tab in Taxonomy Details Pane
The Dimensions tab on the taxonomy Details pane shows the dimension type, dimension name, and dimension member that is mapped to a concept or block of concepts. This view enables you to update the items that are mapped to a dimension.
108 © 2014 SAP AG or an SAP affiliate company. All rights reserved.Report Builder Help
Using Report Builder

Dimensions Tab in Palette
The Dimensions tab in the Palette displays the explicit (denoted by icon E) and typed (denoted by icon T) dimensions available in the taxonomy, and the domain and domain members in a hierarchical view.
Related Information
Scenarios and Segments [page 110]Explicit and Typed Dimensions [page 109]Mapping a Typed Dimension [page 149]Mapping Explicit Dimensions [page 150]Viewing and Editing Mapped Dimensions [page 110]
2.10.4.3 Explicit and Typed Dimensions
Report Builder has supports both explicit and typed Dimensions.
Explicit Dimensions
A domain that explicitly defines each possible member is referred to as an explicit dimension. For example, the ByRegionPlaceholder dimension is an explicit dimension, which contains specific defined members: Europe, USA, Asia, Africa, Australia.
Typed Dimensions
Typed dimensions are those in which the number of domain members is known but so large that it would be impractical to list all them. For example:
● Each ZIP code in the US● Longitudes, which span from 180 to -180 degrees.
Report Builder supports using both Explicit and Typed dimensions for defining a context.
Related Information
Dimensions [page 107]Dimensions Tab [page 33]
Report Builder HelpUsing Report Builder © 2014 SAP AG or an SAP affiliate company. All rights reserved. 109

Scenarios and Segments [page 110]Mapping Explicit Dimensions [page 150]Mapping a Typed Dimension [page 149]Viewing and Editing Mapped Dimensions [page 110]
2.10.4.4 Viewing and Editing Mapped Dimensions
Use the Dimensions tab to view and edit domain members that are mapped in a Report Builder template in Microsoft Excel. In the following example, the Dimensions tab shows the explicit dimensions for sales regions.
To edit a mapped dimension, select a mapped cell and then click to select a different value from the Value drop-down list on the Dimensions tab.
Click Update to save your changes.
Dimensional schemaRef
When you edit a dimension, Report Builder automatically creates a default schema location if none is defined. The default schema location for dimensions in an XBRL report generated by Report Builder is:
xsi:schemaLocation=http://xbrl.org/2006/xbrldi http://www.xbrl.org/2006/xbrldi-2006.xsd
If this schema location is incorrect, import an instance document that has an accurate dimension schema location (xbrldi) and namespace prior to editing dimensions. Open the workbook again in Report Builder and it will automatically update the schema location.
If the schemaRef does not resolve correctly when Preview an XBRL Instance Document [page 175], manually navigate to the correct taxonomy path. Report Builder adds the taxonomy path as the schemaRef in the instance.
2.10.5 Scenarios and Segments
Scenario and segment attributes can be defined in the Context pane after the context has been defined Defining a Context [page 88]. Segments and scenarios are both defined with a dimension name-value pair attribute.
Scenarios
A scenario identifies the circumstances for the measurement of a set of facts and, like the segment element, its content is application-specific. Scenarios are used to document the circumstances surrounding the measurement of a set of business facts, such as actual, budgeted, restated, pro forma. Typically, scenarios are estimates or assumptions, such as:
110 © 2014 SAP AG or an SAP affiliate company. All rights reserved.Report Builder Help
Using Report Builder
● Assuming certain valuations of assets or future revenue streams● Actual, adjusted, estimated, forecasted, or reported as of a certain date● Assuming a particular foreign currency exchange rate
NoteFor EDGAR Filers: Scenarios with typedMembers are not allowed in an EDGAR filing. If a segment is included in a filing, the children must be explicitMembers.
Segments
A segment identifies a component of the business entity. Segments are used to identify the business segment more completely in cases where the entity identifier is insufficient. Typically, segments can include:
● Organizational structure such as the corporate headquarters and individual subsidiaries of an entity● Regional decomposition such as operations in Asia, Europe, and North America● Functional distinctions such as results from continuing and discontinued operations● Product distinctions such as operations relating to fishing, forestry, and farming● Operational distinctions such as recurring vs. non-recurring revenues or new subscriptions versus renewals
Both scenarios and segments can compose of dimensions and unclassified or ad hoc elements. For more information, see Dimensions [page 107] and Ad hoc or Unclassified Segments and Scenarios [page 111].
Related Information
Dimensions Overview [page 108]User Environment [page 54]
2.10.5.1 Ad hoc or Unclassified Segments and Scenarios
You can assign values to segments and scenarios that are unclassified. Taxonomy elements that have no substitution group are unclassified elements. These elements are declared as element names in the taxonomy schema, and lack the attributes required for a concept, so they do not display in Report Builder views.
An example of taxonomy elements that are unclassified are the segment and scenario declarations shown below.
<element name="segmentUS"/><element name="segmentUK"/><element name="segmentAsia"/><element name="scenarioA"/><element name="scenarioB"/>
The values for unclassified elements such as segment and scenarios, can be assigned using the New Context tab in the Palette. Use XML provide values for ad hoc or unclassified elements. The segments or scenarios can be mapped from the Dimensions tab of the taxonomy Schema view.
Report Builder HelpUsing Report Builder © 2014 SAP AG or an SAP affiliate company. All rights reserved. 111
ExampleTo map unclassified segments or scenarios
It is only possible to add segments and scenarios to a report when the taxonomy contains unclassified segments and scenarios. This example uses the hypercube taxonomy in the ../Taxonomies folder of the downloaded samples.
1. Open the partially mapped workbook and then map the primary items in a hypercube.2. Define a context for each segment or scenario.
3. On the Report Builder toolbar, click to open the Palette.
4. Click the Contexts tab, and then click (New).5. In the New Context dialog box, enter an ID and click a period type.6. The available scenarios and segments display.7. Open the XML Editor.8. Type the XML tag set for a scenario element defined in the taxonomy and provide a value. In this example,
use a scenario defined in acme.xsd.
<scenarioA>true</scenarioA>
9. To save the scenario, click OK .
10. In the New Context dialog box under Segment, click to open the XML Editor, and then enter the XML tags and values ( yes or no) for the segments you want to include.
<segmentUS>yes</segmentUS><segmentUK>no</segmentUK><segmentAsia>yes</segmentAsia>
11. To close the XML Editor, click OK.
When you generate an instance document, the scenarios and segments you define are included.
Related Information
Views [page 55]Viewing and Editing Mapped Dimensions [page 110]
2.11 About Mapping
Report Builder helps you associate business concepts defined in an XBRL taxonomy to data and conceptual information in Microsoft Excel and Word files. A mapped workbook can be used as a Report Builder template. The mapped workbook can also be used to validate fact values, generate an XBRL instance document, or import a XBRL instance document for validation or analysis.
Report Builder simplifies mapping tasks by providing features that help you:
112 © 2014 SAP AG or an SAP affiliate company. All rights reserved.Report Builder Help
Using Report Builder
● Organize your Mapping Project [page 116]● Customize Your Report Builder Workspace [page 50]● Mapping Reportable Taxonomy Elements [page 75]● Filtering the Taxonomy View [page 75]● Mapping Concepts [page 73]● Mapping Contexts [page 89]● Mapping Units and Unit Patterns [page 97]● Mapping Facts in Microsoft Word [page 167]● Import Mappings Report [page 136]● Bulk Update - Updating Contexts [page 92]● Using the Instance Editor [page 80]● Mapping Reports [page 156]
The Mapping Workflow [page 113] for a new project shows how these features are related and suggests a basic navigation through the required steps. Business requirements may dictate a different workflow than that depicted in the sample.
Related Information
Mapping Workflow [page 113]Organize your Mapping Project [page 116]Mapping in Microsoft Office Excel [page 117]Mapping in Microsoft Office Word [page 164]Bulk Update - Updating Contexts [page 92]Synchronization [page 119]
2.11.1 Mapping Workflow
Differing business requirements can change the suggested mapping workflow, but in general, the following tasks are part of preparation for mapping and then mapping data and conceptual information contained in a Microsoft Excel workbook, Microsoft Word document, and/or an instance document.
● Identify the business reports● Set up Report Builder workspace● Map concepts and contextual information in Excel● Mapping Facts in Microsoft Word [page 167]● Verify mappings● Validate reported data● Preview an instance document● Save an instance document
Report Builder HelpUsing Report Builder © 2014 SAP AG or an SAP affiliate company. All rights reserved. 113

Identify the business reports to be mapped
Several departments in your company may supply or contribute to the collection of fact data for an XBRL instance document. The taxonomy may have restrictions or business rules about the data that help determine what can or cannot be mapped.
The following table presents mapping tasks organized in the recommended order. These tasks apply to mapping a workbook or an attached external source (Microsoft Word document):
Mappable Items Description
Reportable elements are defined in a taxonomy
Mapping Concepts [page 73]
Your company may only be required to report a small fraction of the thousands of concepts in a public taxonomy. A taxonomy designer can help identify which concepts and relationships you need to report. A taxonomist can create an extension that enables you to report those items using your business terminology.
Dimensions [page 107] A taxonomy may define dimensions that you must report.
Tuples [page 77] A tuple is two or more elements that must be reported together, such as street address and zip code, or name, job title, and salary. Tuple mapping assigns additional attributes to group of mapped elements.
Contextual information is defined in Report Builder, either in a workbook or imported from an XBRL instance, Microsoft Word document, or mapping file.
Mapping Contexts [page 89]
A context identifies the reporting entity (who is submitting this data) and the reporting period (which quarter or year); each reported fact must be mapped with a context.
Mapping Units and Unit Patterns [page 97]
All mapped numeric concepts must also be mapped with a unit of measurement, based on attributes defined in the taxonomy. Data types associated with reportable concepts can help identify the units that need to be defined and then mapped. Units can be simple, such currency or share, or complex, such as fraction or percentage.
Create a Footnote [page 102]
Footnotes provide additional information about a fact value. A footnote may be number, word, sentence or entire document, and can include formatting from the source file.
Dimensions Overview [page 108]
You may want to report financial data based on your company's dimensional definitions. Report Builder can create dimensional context identifiers for you. If you report dimensional data, it must be mapped after other contextual information has been applied.
Set up Report Builder with default values and taxonomy for the reporting entity
Report Builder can save your Preferences Settings (User Preferences) [page 52] for networked resources and default settings. It is a good idea to review custom settings and to load and validate the taxonomy before starting a mapping project or analyzing imported XBRL instance data.
114 © 2014 SAP AG or an SAP affiliate company. All rights reserved.Report Builder Help
Using Report Builder
● Customize Your Report Builder Workspace [page 50]● Load Taxonomy Overview [page 66]● Taxonomy Validation Tab [page 35]
Map concepts and contextual information
Report Builder Mapping in Microsoft Office Excel [page 117] simplify the mapping process.
You can Mapping a Concept from a Search [page 121], Import Mappings Report [page 136] from other XBRL-aware reports, Real Time Settings [page 64] to provide immediate and detailed feedback for a complex mapping scenario, or Real Time Settings [page 64] and use Global Update [page 125] to streamline updates or apply a context change across all mappings.
Report Builder supports mapping fact data from external sources with options to include or exclude and validate fact data from multiple sources. Report Builder also supports Mapping Facts in Microsoft Word [page 167].
Verify mappings
Throughout the mapping process, use Mapping Reports [page 156] to view and verify what has been mapped. You can view or print these reports, and automate certain reporting features. For example, the Mappings Report [page 131] creates a snapshot of mappings in an XML file whenever you save a workbook or generate an instance; like the Mappings Report [page 131], this file can be used to recreate the mappings in an unmapped workbook or back up a mapping project.
Other mapping reports show Review and Verify Mappings [page 153], Duplicate Mapping Report [page 129], and Tuple Mapping Report [page 147] information you have mapped.
Right-click menus built-in tools and reports enable you to Review and Verify Mappings [page 153].
Validate reported data
Three types of validation reports are available in Report Builder. Business rules built into certain taxonomies can actually help you create a valid mapping project. Report Builder is delivered with a Manage Rules Overview [page 193] that contains predefined validation formulae and input parameters from several pubic taxonomies. You can also add to and run business rules or checklists that are defined in your extension taxonomies or formula linkbases.
A fully mapped financial report must be Report Validation [page 176] before sending the generated XBRL instance document as a financial report; Report Validation [page 176] can also be a formalized record included with a submission.
Report Builder HelpUsing Report Builder © 2014 SAP AG or an SAP affiliate company. All rights reserved. 115

Preview an instance document
You can view or update the collection of mapped facts from Instance Editor Tab [page 31] or Preview an XBRL Instance Document [page 175] how a worksheet or a workbook would appear if saved as an instance document.
Save an instance document
You can set options for the current workbook and Save XBRL lnstance Document [page 186] of the mapped data for a particular worksheet in the workbook.
See also
Mapping in Microsoft Office Excel [page 117]
Mapping Facts in Microsoft Word [page 167]
Related Information
Mapping in Microsoft Office Excel [page 117]Mapping Facts in Microsoft Word [page 167]
2.11.2 Organize your Mapping Project
Often, a public taxonomy has accompanying publications, handbooks, guidelines, directives, and checklists that help an organization assemble the necessary information for corporate financial reporting. Report Builder exposes the taxonomy and its elements in views that can be filtered, sorted, and searched in Microsoft Excel, and provides options for setting the language and labels you want to use for the Mapping Concepts [page 73] that you want to report.
Before starting to map a taxonomy to a Microsoft Excel workbook:
● Preferences Settings (User Preferences) [page 52] for entity identifiers, network and server settings, encoding, and default units.
● Define Contexts Tab [page 36] and Unit Pattern Tab [page 36].● Identify the external data sources and Footnotes [page 101] that you want to include in your XBRL instance
report.● Identify the Tuples [page 77] and Dimensions Tab [page 33] in the taxonomy, or Scenarios and Segments
[page 110] for your report.● Identify the Manage Rules Library [page 194] that apply to the taxonomy and that you want to use in Report
Validation [page 176].
116 © 2014 SAP AG or an SAP affiliate company. All rights reserved.Report Builder Help
Using Report Builder

● Prepare any Linking a Microsoft Word Document [page 165] that contain facts to be Mapping Facts in Microsoft Word [page 167] and included in your report.
Related Information
About Mapping [page 112]Mapping in Microsoft Office Excel [page 117]Mapping in Microsoft Office Excel [page 117]Mapping in Microsoft Office Word [page 164]
2.11.3 Mapping in Microsoft Office Excel
Report Builder Microsoft Excel shortcuts and function keys include:
● Context Sensitive Menus● Copy and Paste with keyboard shortcuts● Drag and Drop
Context-Sensitive Menus
Use context-sensitive menus (sometimes called right-click menus) to map concepts, contextual data and element details in Microsoft Excel.
Right-click a taxonomy concept, click Copy Concept, then right-click in the workbook and click Paste to map the concept to a cell or a selected range of cells.
Right-click an attribute value of a taxonomy element, click Copy, then right-click the formula bar or a cell and click Paste to copy the concept name or label to the workbook.
Right-click in a report grid to refresh the content or to edit a cell value. Right-click the heading row of a grid to choose which columns are displayed.
Right-click a cell to view or delete mappings. Report Builder adds a submenu to the Microsoft Excel right-click menu:
To clear mappings from a cell or cell block, right-click a cell or selected cell block, and then click Delete Mappings.
NoteThe Microsoft Excel Clear Contents command or formula bar does not affect Report Builder mappings. The Microsoft Excel Delete command to remove and shift cells, rows, or columns will also remove and shift Report Builder mappings.
Report Builder HelpUsing Report Builder © 2014 SAP AG or an SAP affiliate company. All rights reserved. 117

Copy and Paste
Use keyboard shortcuts Ctrl+C and Ctrl+V to copy and paste mappings within a workbook and to copy and paste concepts and contextual elements from Report Builder to an Excel workbook.
You can also use the keyboard shortcuts to copy and paste concept names and other information about taxonomy elements from the taxonomy view and element details.
Drag and Drop
Drag a concept, context, or unit from the Report Builder Taxonomy Pane [page 22], Details Pane [page 27] tab, Search Tab [page 30] tab, Instance Editor Tab [page 31] tab, or About Palette [page 35] tabs and drop it on a cell in the Excel workbook. A partially or mapped cell is highlighted with User Environment [page 54].
NoteUse the User Environment [page 54] Tab to choose mapping colors for cells and text colors for taxonomy concepts.
Mapping Qnames [page 122] requires you to press the Control key (Ctrl) while dragging and dropping the context name on a cell in the workbook.
Related Information
About Mapping [page 112]Protecting a Report Builder Template [page 18]Delete or View Mappings [page 154]
2.11.3.1 Enable Synchronization
Report Builder can highlight a selected concept in the workbook, taxonomy pane, and details pane in Microsoft Excel. When synchronization is enabled, a selected concept highlights wherever it is mapped, and is anchored when changing Taxonomy Pane [page 22] or Details Pane [page 27].
When changing taxonomy views, the selected concept must be available, or defined in the current taxonomy view. When using the Instance Editor, Manual Refresh [page 66] must be cleared to enable synchronization with that tab.
118 © 2014 SAP AG or an SAP affiliate company. All rights reserved.Report Builder Help
Using Report Builder

To enable synchronization
1. In Preferences Settings (User Preferences) [page 52], click Real Time Settings tab .2. Under Show, click Synchronization to select it.
Synchronization adds highlighting or outlines to a selected concept. Synchronization can be beneficial when:
○ You need to Search Tab [page 30] to identify concepts in large taxonomy○ Entering fact values for concepts using the Instance Editor○ Creating or reviewing mappings in the workbook
See Synchronization [page 119] for examples.
Related Information
Instance [page 79]Using the Instance Editor [page 80]
2.11.3.2 Synchronization
Synchronization helps you easily identify:
● The element details for a mapped cell (for defining the correct context type and unit)● The cell(s) on the current worksheet that are mapped with a selected concept, context, or unit● Members of a tuple, scenario, or dimension
Report Builder synchronizes the taxonomy view, details tabs, palette, and Microsoft Excel workbook so that the cell(s) mapped with a selected Report Builder item is outlined in bold hashing on the current worksheet, or the item mapped to a selected cell is highlighted in the Report Builder taxonomy view, details tab, or palette tab. When a mapped cell is selected and the Report Builder window is changed (to a different taxonomy view or to a palette tab), the Report Builder item mapped to the current cell comes into focus and is highlighted.
To view concept, context, and unit mappings across all Excel worksheets, use the sortable grids on Instance Editor Tab [page 31], Full Mapping Report [page 160] or Incomplete Mapping Report [page 157]. To view cells that are mapped with an identical concept, context and unit, see Duplicate Mapping Report [page 129].
For synchronization to occur, the selected taxonomy item must be mapped in the workbook, or the concept for a selected cell must be used in the current taxonomy view.
Synchronization can be enabled or disabled by selecting or clearing Synchronization on the Real Time Settings [page 64] tab.
For synchronization to be available in the Instance Editor, Manual Refresh [page 66] must be cleared (disabled).
Report Builder HelpUsing Report Builder © 2014 SAP AG or an SAP affiliate company. All rights reserved. 119
Identify Cells Mapped with a Selected Context or Unit
When synchronization is enabled, the cell(s) that are mapped with a selected context or unit are automatically outlined in bold hashing.
Identify Cells Mapped with a Concept, Tuple, or Dimension
Cell(s) that are mapped with a selected concept, tuple, dimension, or scenario are automatically outlined in bold hashing.
Keep a Selected Concept in Focus when Changing Taxonomy Views
Synchronization "pins" a concept so that it remains in focus when you change taxonomy views. Selecting a concept in the taxonomy automatically displays the Element Details and also outlines any and all cells that are mapped with the concept.
Find the Cell and the Fact Value for a Concept
In this example, the concept Balance sheet date is selected in the taxonomy view. Report Builder moves the focus in the Instance Editor to the mapped concept (bringing it into view, if necessary), highlights the record values, and outlines the mapped cell B31 in bold hashing.
Clicking the Element Details pane will show information about the mapped concept.
● For a mapped concept, the Instance Editor tab shows the worksheet and cell mapping in the Reference column. If mapped, the context and unit mappings display, as well.
● If a concept is unmapped or is not available on the current worksheet, the Element Details displays with details from the taxonomy definition.
Example of Synchronization not Enabled
If Synchronization is not enabled, there is no relationship between workbook mappings and Report Builder. Selecting a concept in the taxonomy view or Instance Editor does not bring the related mapped cell into focus with a highlight or outline. To enable or disable the synchronized relationships, see Real Time Settings [page 64].
Related Information
Enable Synchronization [page 118]
120 © 2014 SAP AG or an SAP affiliate company. All rights reserved.Report Builder Help
Using Report Builder
Taxonomy Pane [page 22]Taxonomy Views [page 22]Details Pane [page 27]Instance Editor Tab [page 31]
2.11.3.3 Mapping a Concept from a Search
If you know the name of a concept, but you are unable to locate it in the taxonomy view in Microsoft Excel , you can use the Search or Instance Editor tabs to locate the concept for mapping.
To map a search result
1. Open an Excel workbook and Load Taxonomy Overview [page 66].2. In the Report Builder Details Pane [page 27] pane, click the Search Tab [page 30] tab.
3. In the Search tab, build your search options by selecting one or more search options :
a. the Element listing or relationship to current view of the taxonomy.b. whether to search by Element name or label.c. whether Element text starts with or contains the search string.
4. Enter part of the concept name or label you want to map and then click .5. The elements that fit the search pattern display in a results list.6. Select an item from the results list and drag the concept onto the appropriate cell in the workbook.
2.11.3.4 Mapping Contexts
Contexts are defined for a particular reporting entity, reporting period, and optional scenario or segments that collectively give meaning to reported business facts. All concepts that belong to a particular scenario (or dimension), reporting period, or data type must be mapped with the same context.
Example
This procedure shows how to Mapping in Microsoft Office Excel [page 117] a Defining a Context [page 88] onto Mapping Concepts [page 73] in Microsoft Excel.
Report Builder HelpUsing Report Builder © 2014 SAP AG or an SAP affiliate company. All rights reserved. 121
To map a context
1. Open a workbook that has been mapped with concepts. For this exercise, open Mapped with Concepts.xlsx located in ..\Tutorials\Mapping\Templates .
2. In Report Builder , click About Palette [page 35].3. In the Contexts tab, select the context you wish to map; for example, select I-Ctx2011. If no contexts display,
define or import concepts. See Defining a Context [page 88].4. In the workbook, select the cells that contain concept mappings. In this example, select cells C5:C12.5. Drag the context from Report Builder onto the selected cells.6. The selected cells show as mapped to the context I-Ctx2011 .7. Repeat Steps 4 to 6 to map context I-Ctx2010 to the mapped concepts in column D in the sample workbook.
You can map contexts or units to a mapped concept.
Related Information
Mapping Units and Unit Patterns [page 97]Using the Instance Editor [page 80]
2.11.3.5 Mapping Qnames
You can use the Ctrl-drag shortcut to map taxonomy qnames to cells in a Microsoft Office Excel workbook. This allows you to use a concept name as the fact value for a mapped concept. While it is possible to enter a correctly-formatted qname concept in a cell, the Ctrl-drag shortcut can reduce errors.
This procedure assumes you've Customize Your Report Builder Workspace [page 50] and identified which taxonomy qnames you want to map.
To display the taxonomy in Report Builder with terminology you are most familiar with, see Language and Label Role on the Views [page 55] tab in Preferences Settings (User Preferences) [page 52].
To map qnames
1. Open a Microsoft Excel workbook.2. Load Taxonomy Overview [page 66].3. Select or highlight the cell or cells you want to map.4. In the Report Builder Report Builder Icons [page 15], click the Presentation View [page 23], and click Expand
All.5. Create the fact by dragging the desired concept onto the selected cell.6. If desired, Mapping Contexts [page 89] by dragging the desired context from the Contexts tab.7. Next, map the qname fact value to the cell you have selected. Hold down the Control ( Ctrl) key while you
drag the desired concept from Report Builder onto the selected cell.
122 © 2014 SAP AG or an SAP affiliate company. All rights reserved.Report Builder Help
Using Report Builder

The mapped cell is highlighted to show that it is mapped with a qname.8. The cell will contain the taxonomy prefix and the concept name separated by a colon (:). Right-click the
mapped cell and click View Mappings.The Cell Mappings dialog box shows the Type is xbrli:QNameItem Type .
9. Click to close the Cell Mappings dialog box.
Related Information
QNames [page 78]Mapping a Qname from a Search [page 123]Mapping Contexts [page 89]Tuple Mapping Workflows [page 140]
2.11.3.6 Mapping a Qname from a Search
If you know the name of a QName, but you are unable to locate it in the taxonomy view in Microsoft Excel, you can use the Search or Instance Editor tabs to locate the QName for mapping.
To map a search result
1. Open an Excel workbook and Load Taxonomy Overview [page 66].2. Mapping Concepts [page 73] to the selected cell.3. If desired, Mapping Contexts [page 89] to the selected cell.4. In the Report Builder Details Pane [page 27] pane, click the Search Tab [page 30] tab.
5. In the Search tab, build your search options by selecting one or more search options :
a. the Element listing or relationship to current view of the taxonomy.b. whether to search by Element name or label.c. whether Element text starts with or contains the search string.
6. Enter part of the QName name or label you want to map and then click .7. The elements that fit the search pattern display in a results list.8. Select an item from the results list and hold down the Control ( Ctrl) key as you drag the QName onto the
appropriate cell in the workbook.
Related Information
QNames [page 78]
Report Builder HelpUsing Report Builder © 2014 SAP AG or an SAP affiliate company. All rights reserved. 123
Mapping Qnames [page 122]
2.11.3.7 Mapping Units and Unit Patterns
This procedure shows how to map units and unit patterns to cells and cell blocks in a Microsoft Excel workbook.
All numeric concepts must be mapped with a unit. See Find the Data Type and Period Type of a Reportable Concept [page 76].
This procedure assumes that you have already mapped concepts in the Microsoft Excel workbook:
● If concepts have not been mapped in your workbook, see Mapping Concepts [page 73].● You can only map units that have been defined. If no units are mapped in the workbook and no unit patterns
have been defined, see Defining a Unit Pattern [page 95] or Import Units [page 99].
To map a unit or unit pattern
1. Open a Microsoft Excel workbook that is mapped with concepts.2. Select a cell or a range of cells you wish to map. In the sample workbook, select cells C9 to G15.
NoteYou can drag a unit pattern onto a selected cell block (multiple rows and/or multiple columns).
3. On the Report Builder toolbar, click to open the Palette, and then click the Unit Patterns tab.4. In My Patterns, click a unit that you want to map. Map this unit to all numeric concepts by dragging the unit
pattern onto a cell or selected cell block.5. Partially mapped cells change color when mapped, and the unit is added to the Currently In Use list.
NoteUnit patterns can be mapped from the Currently In Use list or the My Patterns list.
2.11.3.8 View Incomplete Mappings
Report Builder provides several options for identifying partially mapped cells:
● User Environment [page 54] distinguish mapped concepts and mapped context/unit from unmapped cells.● View or edit fact data and mapping information in the workbook Using the Instance Editor [page 80].● Run the Incomplete Mapping Report [page 157].
● Use the View Incomplete Mappings toggle on the Report Builder toolbar to identify incomplete mappings on the current worksheet. This toggle shows incomplete mappings for a selected taxonomy node, as demonstrated in the procedure below. For additional information, see Filtering the Taxonomy View [page 75].
124 © 2014 SAP AG or an SAP affiliate company. All rights reserved.Report Builder Help
Using Report Builder
To identify incomplete mappings for a selected taxonomy node
1. Arrange your workbook and Report Builder so that you can view the worksheet as well as the taxonomy node you want to verify.
2. #unique_67 and then click to select the taxonomy node that you want to verify.
3. In the Report Builder toolbar , click [View Incomplete Mappings].
NoteTo show or hide the ToolTips for Report Builder icons, see Real Time Settings [page 64].
4. Cells mapped with concepts from the selected taxonomy node are highlighted, and those that are incompletely mapped are outlined in a heavy dashed line.
Related Information
About Mapping [page 112]Review and Verify Mappings [page 153]Mapping Reports [page 156]
2.11.3.9 Global Update
Global update ensures that the content in Report Builder is in sync with the content in your Microsoft Excel workbook. When multiple Microsoft Excel add-ins are actively monitoring and updating data, the data in the Report Builder memory may need to be refreshed.
Global update refreshes Report Builder and the Microsoft Excel workbook by scanning the data to identify any discrepancy between the Report Builder memory model and the values in the workbook, and synchronize to the latest change.
NoteIt is strongly recommended that global update be Global Update - Manual Refresh [page 126] immediately after refreshing Microsoft Excel data from any third-party financial application.
Global Update runs automatically whenever an Instance Reports [page 82] and can be manually invoked at any time to synchronize data in Report Builder the Microsoft Excel workbook.
The Global Update tool is tool enabled by default in certain installations and disabled by default in others. For details about setting the Global Update option, see Enable or Disable Automated Global Update [page 126].
Because Global Update verifies all mapped data, this time-consuming process may affect performance when using large taxonomies and/or large data sets.
Report Builder HelpUsing Report Builder © 2014 SAP AG or an SAP affiliate company. All rights reserved. 125
Related Information
Global Update - Manual Refresh [page 126]Enable or Disable Automated Global Update [page 126]Bulk Update - Updating Contexts [page 92]
2.11.3.9.1 Global Update - Manual Refresh
You can manually refresh the content in Report Builder using the Global Update tool.
To resynchronize the Report Builder view of your Microsoft Excel workbook
1. On the UBmatrix tab, in Tools group click Global Update.2. The application scans each mapped cell in the workbook, and if any discrepancy exists between a mapped cell
value and the value in the memory image, Report Builder and the workbook are updated with the most recent value.
3. When the screen refreshes, click OK to save the data in Report Builder. A message box confirming the update displays.
Related Information
Global Update [page 125]Defining a Context [page 88]Deleting a Context [page 91]Editing a Context [page 90]
2.11.3.9.2 Enable or Disable Automated Global Update
Global Update [page 125] refreshes facts in Report Builder memory with data in Microsoft Excel workbook that may have been changed by other data connections.
The default setting in Report Builder is to run Global Update automatically as part of Report Validation [page 176] or whenever Save XBRL Instance Documents and Reports [page 184]. The automated global update capability can be enabled or disabled in the Registry Settings.
Global Update can be run manually from the Report Builder Tools menu.
126 © 2014 SAP AG or an SAP affiliate company. All rights reserved.Report Builder Help
Using Report Builder
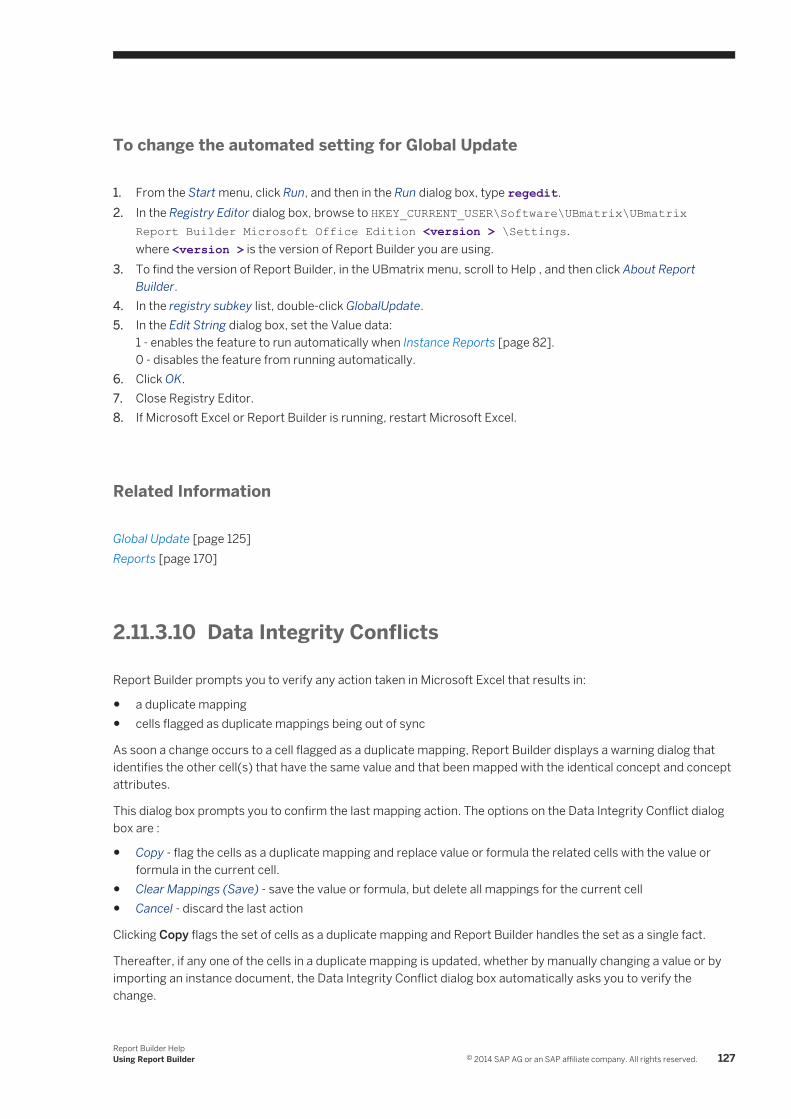
To change the automated setting for Global Update
1. From the Start menu, click Run, and then in the Run dialog box, type regedit.2. In the Registry Editor dialog box, browse to HKEY_CURRENT_USER\Software\UBmatrix\UBmatrix
Report Builder Microsoft Office Edition <version > \Settings.where <version > is the version of Report Builder you are using.
3. To find the version of Report Builder, in the UBmatrix menu, scroll to Help , and then click About Report Builder.
4. In the registry subkey list, double-click GlobalUpdate.5. In the Edit String dialog box, set the Value data:
1 - enables the feature to run automatically when Instance Reports [page 82].0 - disables the feature from running automatically.
6. Click OK.7. Close Registry Editor.8. If Microsoft Excel or Report Builder is running, restart Microsoft Excel.
Related Information
Global Update [page 125]Reports [page 170]
2.11.3.10 Data Integrity Conflicts
Report Builder prompts you to verify any action taken in Microsoft Excel that results in:
● a duplicate mapping● cells flagged as duplicate mappings being out of sync
As soon a change occurs to a cell flagged as a duplicate mapping, Report Builder displays a warning dialog that identifies the other cell(s) that have the same value and that been mapped with the identical concept and concept attributes.
This dialog box prompts you to confirm the last mapping action. The options on the Data Integrity Conflict dialog box are :
● Copy - flag the cells as a duplicate mapping and replace value or formula the related cells with the value or formula in the current cell.
● Clear Mappings (Save) - save the value or formula, but delete all mappings for the current cell● Cancel - discard the last action
Clicking Copy flags the set of cells as a duplicate mapping and Report Builder handles the set as a single fact.
Thereafter, if any one of the cells in a duplicate mapping is updated, whether by manually changing a value or by importing an instance document, the Data Integrity Conflict dialog box automatically asks you to verify the change.
Report Builder HelpUsing Report Builder © 2014 SAP AG or an SAP affiliate company. All rights reserved. 127

NoteEditing a fact value in a duplicate mapping can override the Microsoft Excel formula or reference pointer without notification.
Cells flagged as a duplicate mapping are duplicate facts, with identical value and definition, and XBRL concept, context, or unit. Adding, deleting or changing the value or the concept and contextual information in a Data Integrity Conflict warning, prompting you to verify the change.
Related Information
Mapping Reports [page 156]About Mapping [page 112]View Cell Mappings [page 152]
2.11.3.11 Duplicate Mappings
In Report Builder, if two or more cells are mapped with the same concept and contextual information, integrity checks built into Report Builder flag the cells as a duplicate mapping and Report Builder handles the set of cells as a single fact. Integrity checks also assess data conflicts in duplicate mappings and prompt the user to make choices about any changes to any cell that is flagged as a duplicate. Only one of the duplicate mapped cells appears in the Instance Editor Tab [page 31] and in Instance Reports [page 82], and only one fact is reported in an instance document.
For a numeric concept, contextual information comprises the context definition and unit definition. For a non-numeric concept, contextual information comprises the context definition.
Use the Duplicate Mapping Report [page 129] to identify duplicate facts that you want to report or to locate possible sources of errors when:
● Mapping a workbook● Merging mapped workbooks or worksheets● Importing a mapping file to consolidate mappings● A reported fact in a generated instance, validation report, or other output is inconsistent● There is a discrepancy between actual and expected values
Duplicate mappings can also be viewed in the Full Mapping Report [page 160] and in the duplicateGUIDList in the XML view of a Sample Mappings Report [page 132].
Duplicate Mappings and XBRL Instance Data
Report Builder uses only one instance of a fact value in an XBRL instance document; the application selects the first discovered duplicate fact and automatically ignores any other occurrences when saving, validating, or
128 © 2014 SAP AG or an SAP affiliate company. All rights reserved.Report Builder Help
Using Report Builder
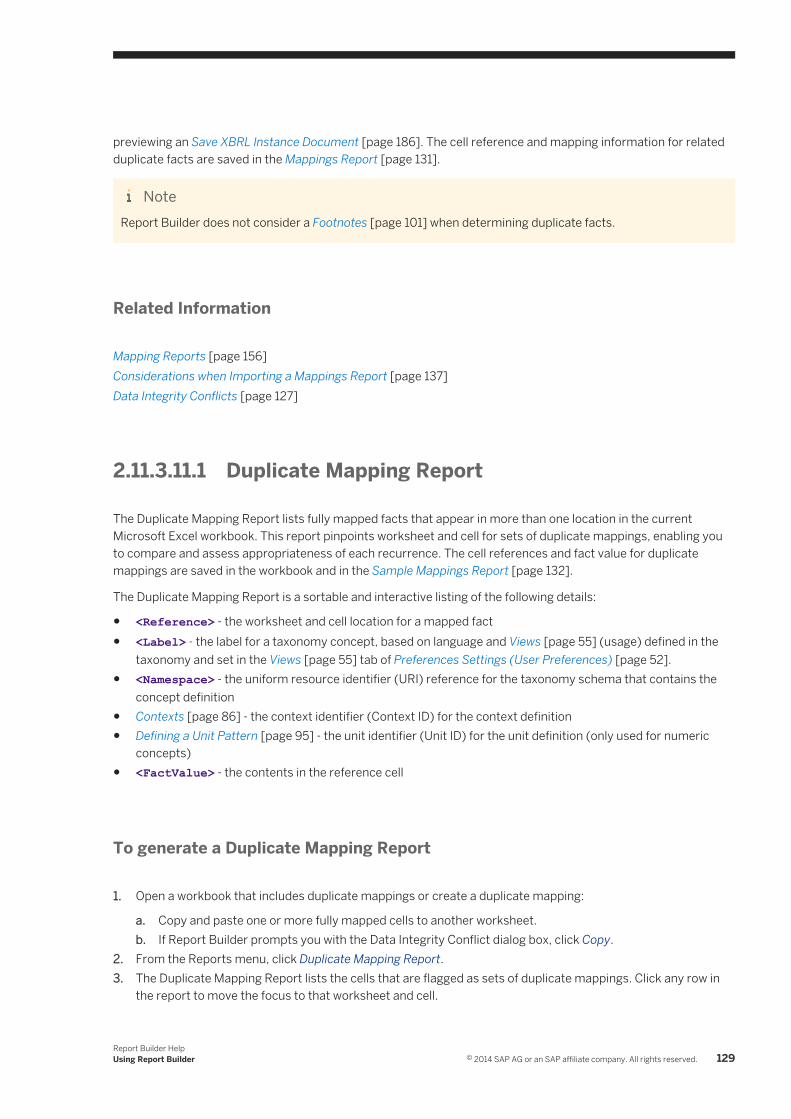
previewing an Save XBRL lnstance Document [page 186]. The cell reference and mapping information for related duplicate facts are saved in the Mappings Report [page 131].
NoteReport Builder does not consider a Footnotes [page 101] when determining duplicate facts.
Related Information
Mapping Reports [page 156]Considerations when Importing a Mappings Report [page 137]Data Integrity Conflicts [page 127]
2.11.3.11.1 Duplicate Mapping Report
The Duplicate Mapping Report lists fully mapped facts that appear in more than one location in the current Microsoft Excel workbook. This report pinpoints worksheet and cell for sets of duplicate mappings, enabling you to compare and assess appropriateness of each recurrence. The cell references and fact value for duplicate mappings are saved in the workbook and in the Sample Mappings Report [page 132].
The Duplicate Mapping Report is a sortable and interactive listing of the following details:
● <Reference> - the worksheet and cell location for a mapped fact● <Label> - the label for a taxonomy concept, based on language and Views [page 55] (usage) defined in the
taxonomy and set in the Views [page 55] tab of Preferences Settings (User Preferences) [page 52].● <Namespace> - the uniform resource identifier (URI) reference for the taxonomy schema that contains the
concept definition● Contexts [page 86] - the context identifier (Context ID) for the context definition● Defining a Unit Pattern [page 95] - the unit identifier (Unit ID) for the unit definition (only used for numeric
concepts)● <FactValue> - the contents in the reference cell
To generate a Duplicate Mapping Report
1. Open a workbook that includes duplicate mappings or create a duplicate mapping:
a. Copy and paste one or more fully mapped cells to another worksheet.b. If Report Builder prompts you with the Data Integrity Conflict dialog box, click Copy.
2. From the Reports menu, click Duplicate Mapping Report.3. The Duplicate Mapping Report lists the cells that are flagged as sets of duplicate mappings. Click any row in
the report to move the focus to that worksheet and cell.
Report Builder HelpUsing Report Builder © 2014 SAP AG or an SAP affiliate company. All rights reserved. 129
To repair an unwanted duplicate mapping, you can use Synchronization [page 119] and the About Palette [page 35] to identify which Contexts [page 86], Units and Unit Patterns [page 93], Footnotes [page 101], and Dimensions [page 107] are mapped on the current worksheet.
One way to ensure a subtotal is copied into a summary report on another worksheet is to create a duplicate mapping by dragging a fully mapped concept from the Instance Editor Tab [page 31] onto the destination cell.
NoteThe Duplicate Mapping Report does not show incomplete mappings. To view incomplete mappings, use the Incomplete Mapping Report [page 157], Full Mapping Report [page 160], or Instance Editor Tab [page 31].
Related Information
Duplicate Mappings [page 128]Mapping Reports [page 156]About Mapping [page 112]
2.11.3.12 Reusing Mapping Information
Mapping information can be reused. By default, Report Builder automatically saves a mapping file whenever a mapped workbook or related XBRL instance document is saved; this information can also be captured by generating a mappings report. For more information, see Mappings Report [page 131] and Mapping File [page 138].
A mappings report or mapping file exports all the pertinent information required to rebuild a Report Builder template in an unmapped workbook, ensuring a way to recreate even partially completed XBRL mappings.
NoteReport Builder has default setting to automatically generate a mapping file whenever a mapped workbook or instance document is saved. The mapping file and the Mappings Report provide the same functionality.
The mapping information can be imported to regenerate a Report Builder template, to XBRL-enable financial data in an unmapped workbook, or to backup up or start a mapping project.
The Mappings Report saves context and unit definitions, taxonomy and worksheet cell references, and footnotes. Definitions for contexts and units can be exported when a Mappings Report is generated. When importing mappings, the metadata in a Mappings Report are automatically applied to the current workbook.
NoteContexts and units that are not mapped are not imported.
130 © 2014 SAP AG or an SAP affiliate company. All rights reserved.Report Builder Help
Using Report Builder

Related Information
About Mapping [page 112]Import Mappings Report [page 136]Considerations when Importing a Mappings Report [page 137]
2.11.3.12.1 Mappings Report
Generating a Mappings Report exports Reusing Mapping Information [page 130] in the current Microsoft Excel workbook to an XML file, with options to include definitions of contexts and units. The Import Mappings Report [page 136] to similarly formatted unmapped workbooks that use the same taxonomy definitions to create an XBRL-enabled financial report. For more information, see Considerations when Importing a Mappings Report [page 137]
To view the XML content in a Mappings Report, see Sample Mappings Report [page 132].
Example
This example generates a Mappings Report for the mapped workbook located in the samples folder ..\Tutorials\Mappings Report\Template. The workbook and Mappings Report reference the sample Extension-BasicCalculation taxonomy.
To generate a Mappings Report
1. Open a mapped workbook or Report Builder template. For this example, use the fully mapped workbook in the samples folder ..\Tutorials\Mappings Report\Template\MappedWorkbook.xlsx.
2. If prompted for a taxonomy, browse to ..\Taxonomies\Patterns\Extension\Extension-BasicCalculation.xsd.
3. When the taxonomy has loaded, from the UBmatrix Reports menu, click Mappings Report.4. In the Export Mapping File dialog box, click to select options to save the definitions for the mapped Contexts
and Units as part of the Mappings Report, and then click OK.
NoteDefinitions for unmapped contexts and units are not exported.
5. In the Save As dialog box, browse to a folder, enter a file name for the Mappings Report (.xml extension), and then click Save. The ..\Tutorials\Mappings Reports\Reports folder has a Mappings Report with definitions for mapped contexts and units and a Mappings Report without context or unit definitions.
6. Close the workbook.
Report Builder HelpUsing Report Builder © 2014 SAP AG or an SAP affiliate company. All rights reserved. 131

Related Information
Considerations when Importing a Mappings Report [page 137]What is a Report Builder template? [page 48]Import Mappings Report [page 136]
2.11.3.12.2 Sample Mappings Report
This sample mappings report may differ from your reports. In particular, if you have more than one taxonomy loaded, the report will look somewhat different.
<?xml version="1.0" encoding="utf-8"?><!--Created with SAP Business Objects Disclosure Management http://www.sap.com--><!--Copyright© 2005 - 2011 EDGAR Online, Inc. All Rights Reserved.--><MappingProperties xmlns:xsi="http://www.w3.org/2001/XMLSchema-instance" xmlns:xsd="http://www.w3.org/2001/XMLSchema"> <taxonomy> <TargetNamespace>http://BasicCalculation.com/extension</TargetNamespace> <SchemaLocation>C:/RH/Report_Builder_Samples/Sample Taxonomies/Patterns/Extension/Extension-BasicCalculation.xsd</SchemaLocation> <TargetNamespacePrefix>ext</TargetNamespacePrefix> </taxonomy> <cells> <MappedCells> <GUID>a0fe7571b509f4752a2ecc08ced7c9acc</GUID> <ConceptName>http://www.UBmatrix.com/Patterns/BasicCalculation#Land</ConceptName> <TargetNamespace>http://www.UBmatrix.com/Patterns/BasicCalculation</TargetNamespace> <ContextID>I-ctx2011</ContextID> <UnitID>USD-2</UnitID> <Decimals>2</Decimals> <Scale>1</Scale> <SheetName>Property</SheetName> <RangeReference>C5</RangeReference> </MappedCells> <MappedCells> <GUID>a11aacd53d9f9466e8134e3e2fd696070</GUID> <ConceptName>http://www.UBmatrix.com/Patterns/BasicCalculation#Land</ConceptName> <TargetNamespace>http://www.UBmatrix.com/Patterns/BasicCalculation</TargetNamespace> <ContextID>I-ctx2010</ContextID> <UnitID>USD-2</UnitID> <Decimals>2</Decimals> <Scale>1</Scale> <SheetName>Property</SheetName> <RangeReference>D5</RangeReference> </MappedCells> <MappedCells> <GUID>a3a8c7ee1ed7d48fe89e07c6b229e1191</GUID> <ConceptName>http://www.UBmatrix.com/Patterns/BasicCalculation#Building</ConceptName> <TargetNamespace>http://www.UBmatrix.com/Patterns/BasicCalculation</TargetNamespace> <ContextID>I-ctx2011</ContextID> <UnitID>USD-2</UnitID> <Decimals>2</Decimals> <Scale>1</Scale> <SheetName>Property</SheetName>
132 © 2014 SAP AG or an SAP affiliate company. All rights reserved.Report Builder Help
Using Report Builder
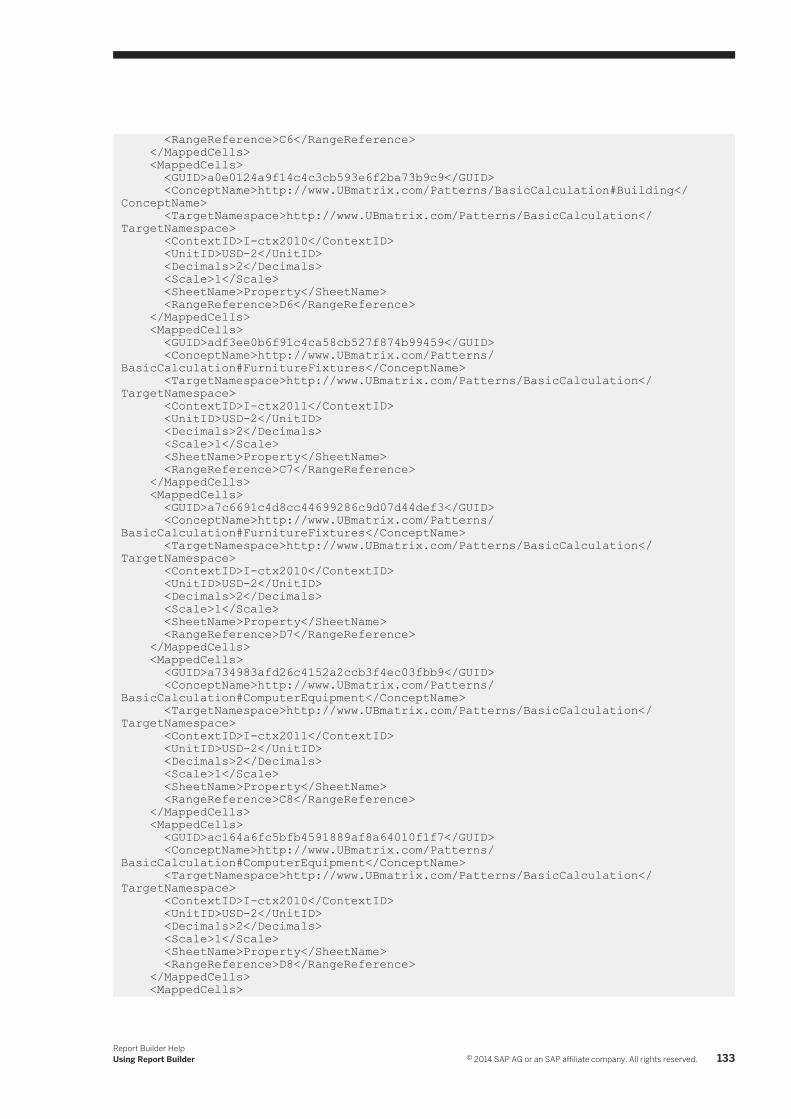
<RangeReference>C6</RangeReference> </MappedCells> <MappedCells> <GUID>a0e0124a9f14c4c3cb593e6f2ba73b9c9</GUID> <ConceptName>http://www.UBmatrix.com/Patterns/BasicCalculation#Building</ConceptName> <TargetNamespace>http://www.UBmatrix.com/Patterns/BasicCalculation</TargetNamespace> <ContextID>I-ctx2010</ContextID> <UnitID>USD-2</UnitID> <Decimals>2</Decimals> <Scale>1</Scale> <SheetName>Property</SheetName> <RangeReference>D6</RangeReference> </MappedCells> <MappedCells> <GUID>adf3ee0b6f91c4ca58cb527f874b99459</GUID> <ConceptName>http://www.UBmatrix.com/Patterns/BasicCalculation#FurnitureFixtures</ConceptName> <TargetNamespace>http://www.UBmatrix.com/Patterns/BasicCalculation</TargetNamespace> <ContextID>I-ctx2011</ContextID> <UnitID>USD-2</UnitID> <Decimals>2</Decimals> <Scale>1</Scale> <SheetName>Property</SheetName> <RangeReference>C7</RangeReference> </MappedCells> <MappedCells> <GUID>a7c6691c4d8cc44699286c9d07d44def3</GUID> <ConceptName>http://www.UBmatrix.com/Patterns/BasicCalculation#FurnitureFixtures</ConceptName> <TargetNamespace>http://www.UBmatrix.com/Patterns/BasicCalculation</TargetNamespace> <ContextID>I-ctx2010</ContextID> <UnitID>USD-2</UnitID> <Decimals>2</Decimals> <Scale>1</Scale> <SheetName>Property</SheetName> <RangeReference>D7</RangeReference> </MappedCells> <MappedCells> <GUID>a734983afd26c4152a2ccb3f4ec03fbb9</GUID> <ConceptName>http://www.UBmatrix.com/Patterns/BasicCalculation#ComputerEquipment</ConceptName> <TargetNamespace>http://www.UBmatrix.com/Patterns/BasicCalculation</TargetNamespace> <ContextID>I-ctx2011</ContextID> <UnitID>USD-2</UnitID> <Decimals>2</Decimals> <Scale>1</Scale> <SheetName>Property</SheetName> <RangeReference>C8</RangeReference> </MappedCells> <MappedCells> <GUID>ac164a6fc5bfb4591889af8a64010f1f7</GUID> <ConceptName>http://www.UBmatrix.com/Patterns/BasicCalculation#ComputerEquipment</ConceptName> <TargetNamespace>http://www.UBmatrix.com/Patterns/BasicCalculation</TargetNamespace> <ContextID>I-ctx2010</ContextID> <UnitID>USD-2</UnitID> <Decimals>2</Decimals> <Scale>1</Scale> <SheetName>Property</SheetName> <RangeReference>D8</RangeReference> </MappedCells> <MappedCells>
Report Builder HelpUsing Report Builder © 2014 SAP AG or an SAP affiliate company. All rights reserved. 133

<GUID>a38af5c509e574c98873f65f908116575</GUID> <ConceptName>http://BasicCalculation.com/extension#Server</ConceptName> <TargetNamespace>http://BasicCalculation.com/extension</TargetNamespace> <ContextID>I-ctx2011</ContextID> <UnitID>USD-2</UnitID> <Decimals>2</Decimals> <Scale>1</Scale> <SheetName>Property</SheetName> <RangeReference>C9</RangeReference> </MappedCells> <MappedCells> <GUID>a0218e58319b341cebac5383ea0170569</GUID> <ConceptName>http://BasicCalculation.com/extension#Server</ConceptName> <TargetNamespace>http://BasicCalculation.com/extension</TargetNamespace> <ContextID>I-ctx2010</ContextID> <UnitID>USD-2</UnitID> <Decimals>2</Decimals> <Scale>1</Scale> <SheetName>Property</SheetName> <RangeReference>D9</RangeReference> </MappedCells> <MappedCells> <GUID>a0544776b9688433b8b967f095a88e4d4</GUID> <ConceptName>http://BasicCalculation.com/extension#Laptop</ConceptName> <TargetNamespace>http://BasicCalculation.com/extension</TargetNamespace> <ContextID>I-ctx2011</ContextID> <UnitID>USD-2</UnitID> <Decimals>2</Decimals> <Scale>1</Scale> <SheetName>Property</SheetName> <RangeReference>C10</RangeReference> </MappedCells> <MappedCells> <GUID>ad78e809428c349d4ad0a7cf06befd67a</GUID> <ConceptName>http://BasicCalculation.com/extension#Laptop</ConceptName> <TargetNamespace>http://BasicCalculation.com/extension</TargetNamespace> <ContextID>I-ctx2010</ContextID> <UnitID>USD-2</UnitID> <Decimals>2</Decimals> <Scale>1</Scale> <SheetName>Property</SheetName> <RangeReference>D10</RangeReference> </MappedCells> <MappedCells> <GUID>a1ac5c6c9e54a4c699ea03424d39585d6</GUID> <ConceptName>http://www.UBmatrix.com/Patterns/BasicCalculation#Other</ConceptName> <TargetNamespace>http://www.UBmatrix.com/Patterns/BasicCalculation</TargetNamespace> <ContextID>I-ctx2011</ContextID> <UnitID>USD-2</UnitID> <Decimals>2</Decimals> <Scale>1</Scale> <SheetName>Property</SheetName> <RangeReference>C11</RangeReference> </MappedCells> <MappedCells> <GUID>a2c8ac7587dad4a3a859c1f413009a271</GUID> <ConceptName>http://www.UBmatrix.com/Patterns/BasicCalculation#Other</ConceptName> <TargetNamespace>http://www.UBmatrix.com/Patterns/BasicCalculation</TargetNamespace> <ContextID>I-ctx2010</ContextID> <UnitID>USD-2</UnitID> <Decimals>2</Decimals> <Scale>1</Scale> <SheetName>Property</SheetName> <RangeReference>D11</RangeReference>
134 © 2014 SAP AG or an SAP affiliate company. All rights reserved.Report Builder Help
Using Report Builder
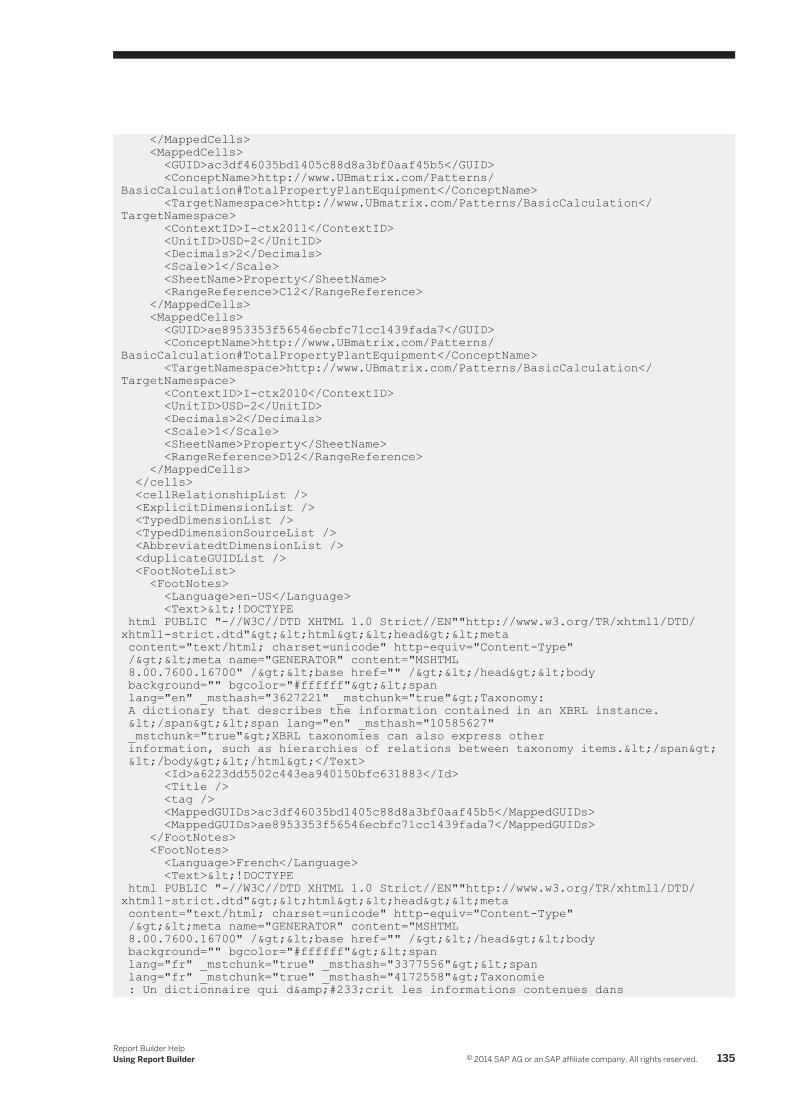
</MappedCells> <MappedCells> <GUID>ac3df46035bd1405c88d8a3bf0aaf45b5</GUID> <ConceptName>http://www.UBmatrix.com/Patterns/BasicCalculation#TotalPropertyPlantEquipment</ConceptName> <TargetNamespace>http://www.UBmatrix.com/Patterns/BasicCalculation</TargetNamespace> <ContextID>I-ctx2011</ContextID> <UnitID>USD-2</UnitID> <Decimals>2</Decimals> <Scale>1</Scale> <SheetName>Property</SheetName> <RangeReference>C12</RangeReference> </MappedCells> <MappedCells> <GUID>ae8953353f56546ecbfc71cc1439fada7</GUID> <ConceptName>http://www.UBmatrix.com/Patterns/BasicCalculation#TotalPropertyPlantEquipment</ConceptName> <TargetNamespace>http://www.UBmatrix.com/Patterns/BasicCalculation</TargetNamespace> <ContextID>I-ctx2010</ContextID> <UnitID>USD-2</UnitID> <Decimals>2</Decimals> <Scale>1</Scale> <SheetName>Property</SheetName> <RangeReference>D12</RangeReference> </MappedCells> </cells> <cellRelationshipList /> <ExplicitDimensionList /> <TypedDimensionList /> <TypedDimensionSourceList /> <AbbreviatedtDimensionList /> <duplicateGUIDList /> <FootNoteList> <FootNotes> <Language>en-US</Language> <Text><!DOCTYPE html PUBLIC "-//W3C//DTD XHTML 1.0 Strict//EN""http://www.w3.org/TR/xhtml1/DTD/xhtml1-strict.dtd"><html><head><meta content="text/html; charset=unicode" http-equiv="Content-Type" /><meta name="GENERATOR" content="MSHTML 8.00.7600.16700" /><base href="" /></head><body background="" bgcolor="#ffffff"><span lang="en" _msthash="3627221" _mstchunk="true">Taxonomy: A dictionary that describes the information contained in an XBRL instance. </span><span lang="en" _msthash="10585627" _mstchunk="true">XBRL taxonomies can also express other information, such as hierarchies of relations between taxonomy items.</span> </body></html></Text> <Id>a6223dd5502c443ea940150bfc631883</Id> <Title /> <tag /> <MappedGUIDs>ac3df46035bd1405c88d8a3bf0aaf45b5</MappedGUIDs> <MappedGUIDs>ae8953353f56546ecbfc71cc1439fada7</MappedGUIDs> </FootNotes> <FootNotes> <Language>French</Language> <Text><!DOCTYPE html PUBLIC "-//W3C//DTD XHTML 1.0 Strict//EN""http://www.w3.org/TR/xhtml1/DTD/xhtml1-strict.dtd"><html><head><meta content="text/html; charset=unicode" http-equiv="Content-Type" /><meta name="GENERATOR" content="MSHTML 8.00.7600.16700" /><base href="" /></head><body background="" bgcolor="#ffffff"><span lang="fr" _mstchunk="true" _msthash="3377556"><span lang="fr" _mstchunk="true" _msthash="4172558">Taxonomie : Un dictionnaire qui d&#233;crit les informations contenues dans
Report Builder HelpUsing Report Builder © 2014 SAP AG or an SAP affiliate company. All rights reserved. 135
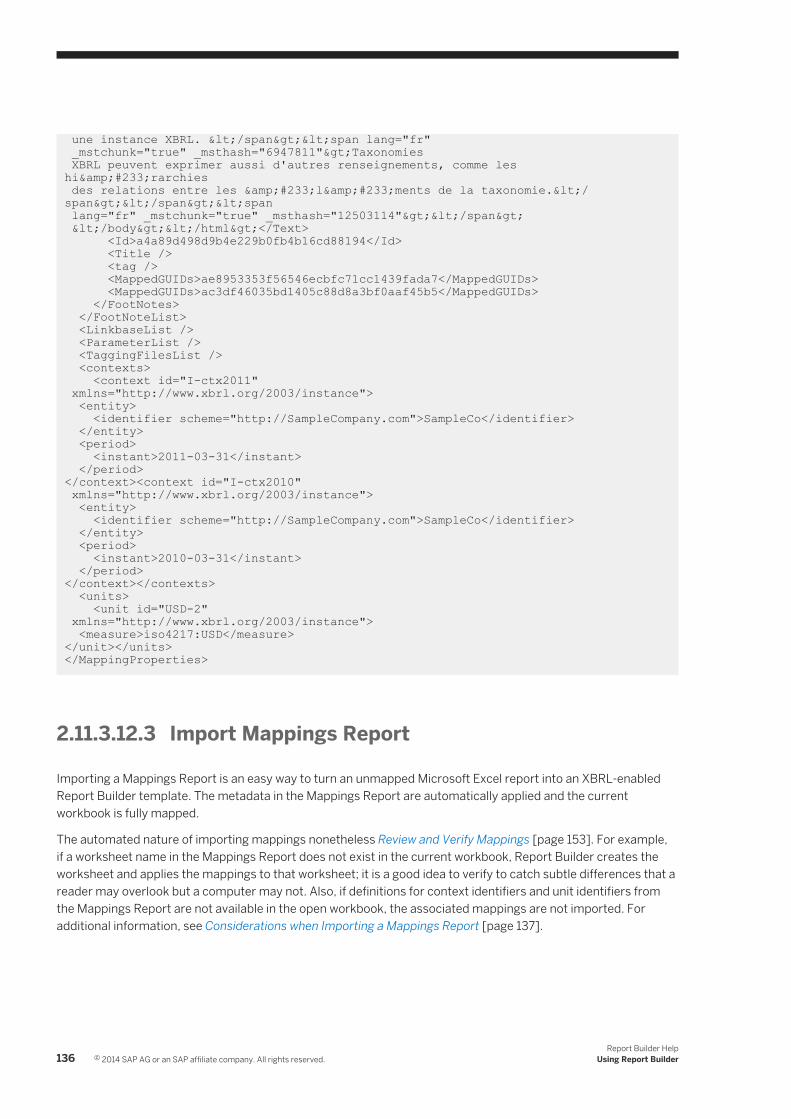
une instance XBRL. </span><span lang="fr" _mstchunk="true" _msthash="6947811">Taxonomies XBRL peuvent exprimer aussi d'autres renseignements, comme les hi&#233;rarchies des relations entre les &#233;l&#233;ments de la taxonomie.</span></span><span lang="fr" _mstchunk="true" _msthash="12503114"></span> </body></html></Text> <Id>a4a89d498d9b4e229b0fb4b16cd88194</Id> <Title /> <tag /> <MappedGUIDs>ae8953353f56546ecbfc71cc1439fada7</MappedGUIDs> <MappedGUIDs>ac3df46035bd1405c88d8a3bf0aaf45b5</MappedGUIDs> </FootNotes> </FootNoteList> <LinkbaseList /> <ParameterList /> <TaggingFilesList /> <contexts> <context id="I-ctx2011" xmlns="http://www.xbrl.org/2003/instance"> <entity> <identifier scheme="http://SampleCompany.com">SampleCo</identifier> </entity> <period> <instant>2011-03-31</instant> </period></context><context id="I-ctx2010" xmlns="http://www.xbrl.org/2003/instance"> <entity> <identifier scheme="http://SampleCompany.com">SampleCo</identifier> </entity> <period> <instant>2010-03-31</instant> </period></context></contexts> <units> <unit id="USD-2" xmlns="http://www.xbrl.org/2003/instance"> <measure>iso4217:USD</measure></unit></units></MappingProperties>
2.11.3.12.3 Import Mappings Report
Importing a Mappings Report is an easy way to turn an unmapped Microsoft Excel report into an XBRL-enabled Report Builder template. The metadata in the Mappings Report are automatically applied and the current workbook is fully mapped.
The automated nature of importing mappings nonetheless Review and Verify Mappings [page 153]. For example, if a worksheet name in the Mappings Report does not exist in the current workbook, Report Builder creates the worksheet and applies the mappings to that worksheet; it is a good idea to verify to catch subtle differences that a reader may overlook but a computer may not. Also, if definitions for context identifiers and unit identifiers from the Mappings Report are not available in the open workbook, the associated mappings are not imported. For additional information, see Considerations when Importing a Mappings Report [page 137].
136 © 2014 SAP AG or an SAP affiliate company. All rights reserved.Report Builder Help
Using Report Builder
Example
This example shows how a report in an unmapped workbook is transformed by importing a Mappings Report [page 131]. The Mappings Report used in this example was generated from mapped concepts in the Extension-BasicCalculation taxonomy.
To import mappings
1. Open an unmapped workbook. For this example, open ..\Tutorials\Mapping\Template\Unmapped Workbook.xlsx.
2. From the UBmatrix Load Taxonomy group, click Load from Local Directory.3. In the Select Taxonomy dialog box, browse to the XBRL schema file ..\Taxonomies\Patterns
\Extension\Extension-BasicCalculation.xsd and then click Open.4. From the UBmatrix Import External Data tab, click Import Mappings.5. In the Mapping File dialog box, browse to a Mappings Report. In this example, browse to ..\Tutorials
\Mappings Report\Reports\ExportMappingsWithContextUnitDefinitions.xml, and then click Open.
6. If the taxonomy reference in the Mappings Report differs from the currently loaded taxonomy or Report Builder cannot locate the taxonomy associated with the Mappings Report, you are prompted to attach the taxonomy. If prompted for a taxonomy, browse to ..\Taxonomies\Patterns\Extension\Extension-BasicCalculation.xsd.
7. Report Builder maps the worksheet cells, highlighting the mappings in your preferred colors.
Related Information
Mappings Report [page 131]File Properties [page 19]Considerations when Importing a Mappings Report [page 137]
2.11.3.12.4 Considerations when Importing a Mappings Report
Importing a Mappings Report is an easy way to reuse XBRL in Excel workbooks. The following examples offer tips for reusing a Mappings Report.
A Mappings Report identifies the worksheet and cell location for each mapped concept, and includes the Context ID, Unit ID and Footnote, if mapped. The Mappings Report may or may not include definitions for mapped contexts and units.
Importing a Mappings Report that has context or unit definitions or footnotes overwrites existing definitions of these items if defined in the current workbook.
When importing a Mappings Report, if a reference worksheet does not exist, Report Builder automatically creates it and then applies the cell mappings.
Report Builder HelpUsing Report Builder © 2014 SAP AG or an SAP affiliate company. All rights reserved. 137
It is a good idea to run Report Validation after importing a Mappings Report to identify any errors for elements or relationships defined in the taxonomy.
If the taxonomy path referenced in the Mappings Report differs from the current physical location of the taxonomy, Report Builder prompts you to attach the correct taxonomy.
NoteYou can use File Properties [page 19] to identify the folder path for the loaded taxonomy.
Import a Mappings Report into a Mapped Workbook
If you import a Mappings Report into a workbook that is already mapped, Report Builder warns you of any conflicts. If a discrepancy is found with the taxonomy reference, you may be able to correct the issue by Reset the Taxonomy Reference [page 70].
Report Builder displays a warning if the definition for a context or unit in the Mappings Report conflicts with a definition in the open workbook.
If the definition for a context or unit is missing from the Mappings Report and the open workbook, the associated mappings are not imported.
Report Builder notifies you if an imported mapping causes a duplicate mapping or data integrity conflict. Choosing Copy adds the mapping but overwrites the content of affected cells with the value in the most recent mapping. See Data Integrity Conflicts [page 127].
Related Information
Importing an XBRL Instance Document [page 83]Mappings Report [page 131]File Properties [page 19]
2.11.3.12.5 Mapping File
Report Builder automatically saves Reusing Mapping Information [page 130], including definitions of contexts and units, to a mapping file whenever a mapped Microsoft Excel workbook or XBRL instance is saved.
The XML format mapping file is saved in the folder that the mapped workbook or instance is saved to, appending -MappingFile.xml to the file name of the workbook or instance. If a mapping file with the same name already exists in that location, it is overwritten.
The auto-saved XML file is identical to a Mappings Report [page 131] that includes context and unit definitions, and can be imported into an unmapped Excel report to regenerate the fully or partially mapped workbook.
138 © 2014 SAP AG or an SAP affiliate company. All rights reserved.Report Builder Help
Using Report Builder
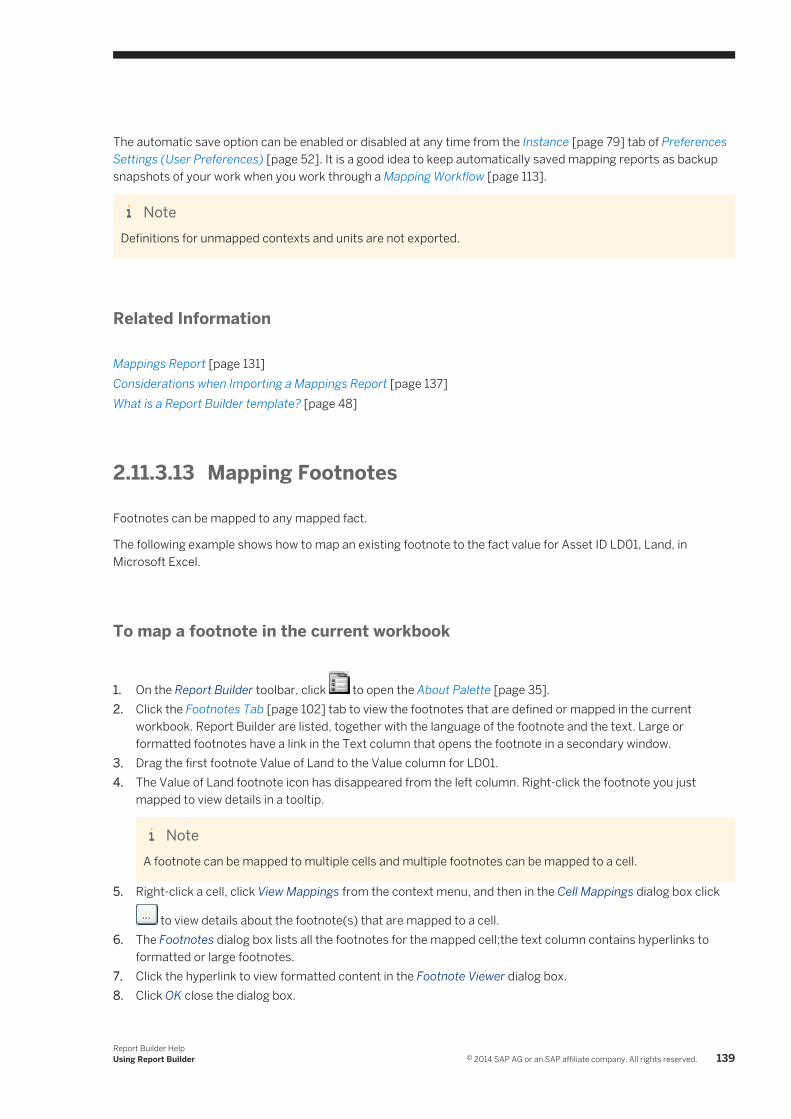
The automatic save option can be enabled or disabled at any time from the Instance [page 79] tab of Preferences Settings (User Preferences) [page 52]. It is a good idea to keep automatically saved mapping reports as backup snapshots of your work when you work through a Mapping Workflow [page 113].
NoteDefinitions for unmapped contexts and units are not exported.
Related Information
Mappings Report [page 131]Considerations when Importing a Mappings Report [page 137]What is a Report Builder template? [page 48]
2.11.3.13 Mapping Footnotes
Footnotes can be mapped to any mapped fact.
The following example shows how to map an existing footnote to the fact value for Asset ID LD01, Land, in Microsoft Excel.
To map a footnote in the current workbook
1. On the Report Builder toolbar, click to open the About Palette [page 35].2. Click the Footnotes Tab [page 102] tab to view the footnotes that are defined or mapped in the current
workbook. Report Builder are listed, together with the language of the footnote and the text. Large or formatted footnotes have a link in the Text column that opens the footnote in a secondary window.
3. Drag the first footnote Value of Land to the Value column for LD01.4. The Value of Land footnote icon has disappeared from the left column. Right-click the footnote you just
mapped to view details in a tooltip.
NoteA footnote can be mapped to multiple cells and multiple footnotes can be mapped to a cell.
5. Right-click a cell, click View Mappings from the context menu, and then in the Cell Mappings dialog box click
to view details about the footnote(s) that are mapped to a cell.6. The Footnotes dialog box lists all the footnotes for the mapped cell;the text column contains hyperlinks to
formatted or large footnotes.7. Click the hyperlink to view formatted content in the Footnote Viewer dialog box.8. Click OK close the dialog box.
Report Builder HelpUsing Report Builder © 2014 SAP AG or an SAP affiliate company. All rights reserved. 139
Related Information
Create a Footnote [page 102]Delete or Remove a Footnote [page 106]
2.11.3.14 Tuple Mapping Workflows
Report Builder supports two workflows for tuple mapping:
● Mapping the tuple children (as concepts) and then associating the tuple parent● Associating the tuple parent and then mapping the tuple children
NoteYou can map tuple children in any order without concern for the hierarchical order displayed in the Taxonomy Views [page 22].
Map concepts and tuple children, then associate the tuple parent
From the taxonomy schema view, map concepts first, then child tuples to range of cells, then tuple parents.
NoteTuples use the taxonomy color and mapping color Mapping Reportable Taxonomy Elements [page 75].
Select the cell range that is mapped with the tuple children.
Drag the parent tuple onto the selected cell block.
Related Information
Mapping Nested Tuples [page 145]Replicating Tuple Mapping [page 140]Mapping in Microsoft Office Excel [page 117]
2.11.3.14.1 Replicating Tuple Mapping
A mapped tuple can be replicated to multiple locations in a Microsoft Excel workbook. This feature is beneficial for creating repeating data sets.
140 © 2014 SAP AG or an SAP affiliate company. All rights reserved.Report Builder Help
Using Report Builder

● Copy and Paste a mapped tuple from one location to another in a workbook, even across multiple worksheets.● Drag a mapped mappings from Instance Editor to another location in the workbook or across multiple
worksheets.
Select the mapped tuple and copy and paste or drag it to another location. All mappings, including the tuple parent association, are copied to the destination cells.
Copy and Paste Example
The following example using Copy and Paste to add a new office location to the worksheet that details information about all offices owned by UBmatrix.
To copy and paste a tuple mapping
1. In the worksheet, copy mappings from cells A16:A23 and paste them to another location (into cells A25:A32).
The fact values (in cells B16 to B23) for cells A16 to A23 have been mapped to the nested tuples display in Report Builder as follows:
○ Cell B16 contains tuple child concept <Company Name> and is mapped to tuple parents <Company Details> and <Additional Information>.
Report Builder HelpUsing Report Builder © 2014 SAP AG or an SAP affiliate company. All rights reserved. 141

○ Cells B17 to B21 contain tuple child concept <Address Description>, <Address Line 1>, <Address Town>, <Address Post code>, and <Address Country> and are mapped to tuple parents <Company Address> and <Company Details>.
○ Cells B22 and B23 contain tuple child concepts <Website Description> and <Website URL> are mapped to tuple parents <Company Website> and <Company Address>.
2. Copy cells B16 to B23 (containing the tuple mappings) and paste that range of cells to B25 to B32. The mappings and associations are copied to the new destination.
3. Modify the fact values in cells B25 to B32. The new values display in the Instance Editor:
142 © 2014 SAP AG or an SAP affiliate company. All rights reserved.Report Builder Help
Using Report Builder

NoteImportant! Extending a tuple mapping does not create a new tuple record; the Instance Editor shows the extended mapping in the existing tuple record.
Related Information
Tuples [page 77]Deleting Tuples [page 146]Mapping Nested Tuples [page 145]
2.11.3.14.2 Extending Tuples
To extend a tuple, drag a reference from the Instance Editor to another cell in the Microsoft Excel workbook, including a location on a different worksheet.
In the example below, <Address Description > is mapped to cell B17 (shown) as a tuple child of <Company Address > (immediate tuple parent) and as a tuple child of <Company Details > (next-level parent).
Report Builder HelpUsing Report Builder © 2014 SAP AG or an SAP affiliate company. All rights reserved. 143
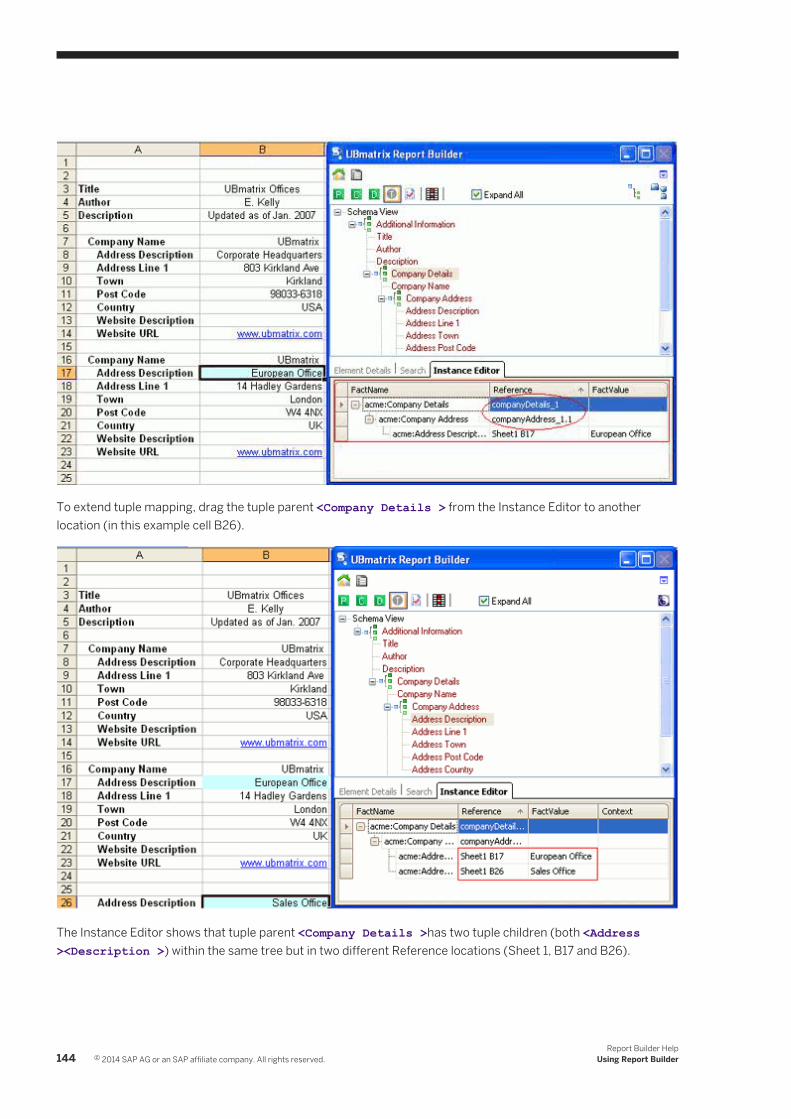
To extend tuple mapping, drag the tuple parent <Company Details > from the Instance Editor to another location (in this example cell B26).
The Instance Editor shows that tuple parent <Company Details >has two tuple children (both <Address ><Description >) within the same tree but in two different Reference locations (Sheet 1, B17 and B26).
144 © 2014 SAP AG or an SAP affiliate company. All rights reserved.Report Builder Help
Using Report Builder
Related Information
Instance Editor Tab [page 31]Replicating Tuple Mapping [page 140]
2.11.3.14.3 Mapping Nested Tuples
When a tuple is associated with one or more parent tuples in the same node, the tuples are said to be nested. Any number of tuples can be nested under a primary parent tuple. In the following example, the concepts <Additional Information>, <Company Details>, and <Company Address> are tuple parents associated with the child tuple <Address Description>.
Mapping nested tuples involves two tasks:
● Associate tuple parents (more than one tuple parent in the same node)● Map tuple children
These tasks can be completed using either Tuple Mapping Workflows [page 140]. In the following example, tuple child concept< Address Description> must be mapped to the selected cell to complete the mapping of nested tuples.
Mapping Order
Tuple parents (within a node) must be associated to tuple children in a particular order, referred to as Bottom-Up approach: the immediate tuple parent should be mapped first, followed by the next tuple parent in the node. In the following example, the tuple parents <Company Address>, <Company Details>, and <Additional Information> should be associated to the child concept <Address Description> in 3, 2, 1 order.
NoteAlthough it is not mandatory to associate all tuple parents to a tuple child, the two immediate tuple parents in the hierarchy must be associated.
The following conditions can cause validation errors:
● The immediate parent containing the child tuple is not mapped and associated. In the example, this is the <Company Address>.
● Mapping does not follow the hierarchy of the nested tuple parents; that is, if the tuple parent <Company Address> and the primary tuple parent <Additional Information> are associated, but the <Company Details> is omitted.
Relationships Between Nested Tuples
Nested tuples can share the following relationships:
Report Builder HelpUsing Report Builder © 2014 SAP AG or an SAP affiliate company. All rights reserved. 145
Parent-Child
Primary parent tuple <Additional Information> has a parent-child relationship with child tuples <Company Details>, <Company Address>, and <Company Website>.
Sibling
<Company Address> and <Company Website> share a sibling relationship as they are nested under the same tuple parent< Company Details>.
Siblings cannot be associated with nested child concepts. For example, an attempt to associate <Company Website> to the child tuple <Address Description> (under sibling tuple <Company Address>) generates an error message: Not a valid child concept
Related Information
Tuples [page 77]
2.11.3.14.4 Deleting Tuples
The deletion of tuples involves two steps:
● Delete tuple children (other tuples or concepts)● De-associate the tuple parent
Deleting Tuple Child Concepts
Deleting tuple mapping is similar to deleting concepts.
To delete a tuple mapped to a specific cell in the Microsoft Excel workbook:
Select the mapped cell in the workbook, and right-click and select Delete Mappings .
This will delete both the mapping of child tuple and tuple parent association, if existing.
De-associating a Tuple
To de-associate a tuple parent from a cell or range of cells, select the cells in the workbook, and right-click and select De-associate Tuple .
146 © 2014 SAP AG or an SAP affiliate company. All rights reserved.Report Builder Help
Using Report Builder

The selected cells will not longer have the parent tuple mapping; any child, or nested, tuple mappings need to be deassociated at the level in which they were created.
Related Information
Tuple Mapping Workflows [page 140]Tuple Mapping Report [page 147]
2.11.3.14.5 Tuple Mapping Report
The Tuple Mapping Report is an interactive hierarchical list of mapped tuples, with options to expand or hide the concepts or child tuples. The report shows the enumerated instances of tuple mappings and nested tuples, along with the Microsoft Excel worksheet and cell locations and contextual mappings of concepts within a tuple. Tuples in the report have controls that can be clicked to expand to show or hide tuple members and tuple children.
For information about tuples and mapping them, see Tuple Mapping Workflows [page 140].
The Tuple Mapping Report displays tuple items in the hierarchy defined in the taxonomy. The columns in the report are:
● <FactName> - the namespace prefix and tuple name or concept name for mapped tuple items● <Reference> - the tuple instance name or worksheet and cell location of mapped tuple concepts● Contexts [page 86] - the context identifier (Context ID) for the context definition● Defining a Unit Pattern [page 95] - the unit identifier (Unit ID) for the unit definition (only used for numeric
concepts)●
In this interactive report, tuples can be expanded or collapsed to show or hide child tuples. Content can be sorted and resized from the right-click context menu:
Sort Ascending/Descending the report records by any column.
Column Chooser. Drag up to 16 different elements for child concepts between the Customization list box and the report. The report refreshes automatically as columns are revised.
Best Fit/Best Fit (all columns) adjusts the column width to accommodate the data in a selected column, or adjusts the width of the columns you've added to the report.
To generate a Tuple Mapping Report
1. Open a workbook that includes tuple mappings.2. From the UBmatrix Reports menu, click Tuple Mapping Report.3. The Tuple Mapping report shows concept names for parent tuples, and for tuple children, concept names,
references to cell mappings, contexts, and units.
Report Builder HelpUsing Report Builder © 2014 SAP AG or an SAP affiliate company. All rights reserved. 147

Related Information
Tuple Mapping Workflows [page 140]Mapping Nested Tuples [page 145]Replicating Tuple Mapping [page 140]
2.11.3.15 Dimensions Overview
Report Builder fully supports XBRL dimensions 1.0 and provides an interface for expanding contexts to include both Explicit and Typed Dimensions [page 109]. When preparing an XBRL instance report, dimensions provide a way to categorize the reported data, either by dimensions that are defined in a taxonomy, or by dimensions that you create.
Dimensions that are defined in the taxonomy can be mapped from the Dimensions Tab [page 33] of the taxonomy view in Microsoft Excel; dimensions that you generate can be mapped from the Dimensions Tab [page 33] of the palette.
This book demonstrates Mapping a Typed Dimension [page 149], Mapping Explicit Dimensions [page 150], and Viewing and Editing Mapped Dimensions [page 110].
Related Information
Taxonomy Validation Tab [page 35]
2.11.3.15.1 Viewing and Editing Mapped Dimensions
Use the Dimensions tab to view and edit domain members that are mapped in a Report Builder template in Microsoft Excel. In the following example, the Dimensions tab shows the explicit dimensions for sales regions.
To edit a mapped dimension, select a mapped cell and then click to select a different value from the Value drop-down list on the Dimensions tab.
Click Update to save your changes.
Dimensional schemaRef
When you edit a dimension, Report Builder automatically creates a default schema location if none is defined. The default schema location for dimensions in an XBRL report generated by Report Builder is:
xsi:schemaLocation=http://xbrl.org/2006/xbrldi http://www.xbrl.org/2006/xbrldi-2006.xsd
148 © 2014 SAP AG or an SAP affiliate company. All rights reserved.Report Builder Help
Using Report Builder

If this schema location is incorrect, import an instance document that has an accurate dimension schema location (xbrldi) and namespace prior to editing dimensions. Open the workbook again in Report Builder and it will automatically update the schema location.
If the schemaRef does not resolve correctly when Preview an XBRL Instance Document [page 175], manually navigate to the correct taxonomy path. Report Builder adds the taxonomy path as the schemaRef in the instance.
2.11.3.15.2 Mapping a Typed Dimension
Typed and explicit dimensions are defined in and mapped from the Dimensions Tab [page 33] in Microsoft Excel.
Creating a typed dimension
You can add dimensions to a Report Builder template by mapping dimensional items to cells in the workbook.
To create a typed dimension
1. Map the Primary items.2. Map Contexts and Unit Patterns.3. Map the Dimensions.
Example
The following example creates an explicit dimension using a taxonomy that contains dimensions.
Mapping a Primary Item
1. Open the Schema View [page 25] to identify which primary items can be mapped to dimension domain members.In this example, the Schema View contains one primary item, <Sales>.The primary item can be mapped to all the domains and their respective members that are explicitly defined in the taxonomy.
2. Select the mapped concepts in the workbook, and then drag the primary item <Sales> onto the selected cells.In this example, the workbook is the sales breakdown by region report.
NotePrimary items may also be displayed in (and mapped from) taxonomy views other than the Schema view.
Report Builder HelpUsing Report Builder © 2014 SAP AG or an SAP affiliate company. All rights reserved. 149

Mapping Contexts and Units
Drag contexts and units onto the desired cells in the workbook.
Mapping Dimensions
Dimensions are mapped from the Dimensions Tab [page 33] on the About Palette [page 35]. The Dimensions tab displays all defined dimensions (both Explicit and Typed), dimension domain, and domain members.
Mapped dimensions create new contexts displayed on the Contexts tab. By default, the context name is suffixed by the domain member.
The dimensions also get displayed in the Scenario section of the New/Edit Context window .
Related Information
Dimensions Overview [page 108]Explicit and Typed Dimensions [page 109]Mapping Explicit Dimensions [page 150]Dimensions Tab [page 33]
2.11.3.15.3 Mapping Explicit Dimensions
Mapping an explicit dimension requires a workflow in which the facts are mapped before mapping the dimension.
The procedure is similar to Mapping a Typed Dimension [page 149] in Microsoft Excel.
Example
The following example shows how to create an explicit dimension using the following workflow:
● Map primary item● Map context and unit● Map the dimension
For additional information about dimensions, see Dimensions [page 107].
150 © 2014 SAP AG or an SAP affiliate company. All rights reserved.Report Builder Help
Using Report Builder
Map Primary Item
1. Open the taxonomy in the Schema View [page 25].2. In the Element Details view, identify the typed dimension and then map the primary item to the appropriate
cell(s) in the workbook.
Define and map contexts and unit
See Mapping Contexts [page 89] and Mapping Units and Unit Patterns [page 97].
Map the dimension
1. Open the About Palette [page 35], and click the Dimensions tab.2. Explicit dimensions appear as E elements in the Dimensions tab.3. Select the set of primary items first, and then drag the dimension from the Dimensions Tab [page 33] onto the
selection in the workbook.4. Drag the domain members onto the workbook.5. In the Define Explicit Dimension dialog box in the Dimension Source Value section, select the cells that contain
the dimension value. A dimension can apply to a single cell, a cell range, a column, or a row of cells containing the source value.
NoteIf you select a range of cells, Report Builder only maps the dimension to cells that are mapped with contexts and unit patterns.
6. Select the range of mapped cells. In the following example, the Mapped Cells Range is E10:E18.7. Under Update Context Id, select an option to add the dimensional name to the existing context ID as a prefix
or suffix. The Context ID for a dimension displays in the Mapped Dimensions grid.8. Click OK.
Report Builder creates new Contexts and updates the Context IDs.9. Repeat this procedure to map the '<lastname>' member to the cells containing primary item mappings.10. The Mapped Dimensions grid displays the contexts (containing customer '<firstname>').11. Click OK to update the contexts with the '<lastname>' dimension.
To view the dimensions that are applied to a cell, edit the context. The dimension names display in the Scenario grid of the Edit Context dialog box.
When saving the XBRL instance, the dimension value is passed in as an XML code. Typed Dimensions do not have a defined number of domain members, so the dimension value is user-defined.
Report Builder HelpUsing Report Builder © 2014 SAP AG or an SAP affiliate company. All rights reserved. 151
Related Information
Dimensions [page 107]Dimensions Overview [page 108]
2.11.3.16 Create a Range
Report Builder saves the mappings for ranges of cells (contiguous or non-contiguous) that you create in a Microsoft Excel workbook.
When you convert an Excel table to a range, structured references that use table names turn into regular cell references.
On the Table Tools Design tab, click Convert to Range.
You can also right-click the table, point to Table, and then click Convert to Range.
Related Information
About Mapping [page 112]Mapping Workflow [page 113]
2.11.3.17 View Cell Mappings
To view details about a mapped cell in Microsoft Excel, right-click the cell and in the context menu, click View Mappings.
1. Right-click the cell and click to select View Mappings.
NoteIf the selected cell has no mappings, the Report Builder options in the context menu are unavailable (greyed). If the Report Builder submenu is not visible, the cell may be mapped as an External Data Source. Use the Instance Editor or Validation Report to verify mappings.
The Cell Mappings dialog box shows attributes for the mapped concept and mapped contextual information.2. Mapping information is also available in Mapping Reports [page 156] and is viewable and can be edited from
the Instance Editor Tab [page 31] tab. Concept attributes and properties defined in the taxonomy are available from the Details Pane [page 27] tab, which can help identify the appropriate period type, data type, and scale when defining or verifying contexts and units.
152 © 2014 SAP AG or an SAP affiliate company. All rights reserved.Report Builder Help
Using Report Builder

Related Information
Review and Verify Mappings [page 153]About Mapping [page 112]Tuple Mapping Workflows [page 140]Mapping Footnotes [page 103]Mapping Qnames [page 122]Close Report Builder [page 19]
2.11.3.18 Review and Verify Mappings
When creating a Report Builder template, it is a good idea to review mappings, especially when mapping a large taxonomy to a Microsoft Excel workbook.
Although configuration options and default settings in Report Builder help to Customize Your Report Builder Workspace [page 50] the mapping process and you can Granular Validation [page 65], you can also view mapping information for a worksheet or the entire workbook as you work through a mapping project.
Mapping reports can be sorted interactively by any column and can be saved for reference or comparison. It is good practice to check the accuracy and completeness of mappings in a Report Builder template prior to running Report Validation [page 176] and prior to generating an XBRL instance document. You can also run a mapping report to verify what has been mapped on the current worksheet, or sort a report to review where units and contexts have been applied.
See Mapping Reports [page 156] for examples and procedures for the reports summarized below.
Duplicate Mapping Report
The Duplicate Mapping Report [page 129] shows multiple occurrences of an identical mapping . When creating a Report Builder Template, this report can identify issues without having to analyze test data. The Instance Editor and validation reports use the first occurrence of a fully mapped cell or fact and ignore any additional mappings because built-in data integrity checks enforce equality of values in Duplicate Mappings [page 128].
Incomplete Mapping Report
The Incomplete Mapping Report [page 157] identifies the cell reference and the contextual items that are needed to complete a concept mapping. Although mapping colors on the User Environment [page 54] provide visual cues in the workbook about mappings, this report identifies the values of mapped contexts and units, which can facilitate mapping a cell with the correct context or unit.
From the Taxonomy, you can also View Incomplete Mappings [page 124].
Report Builder HelpUsing Report Builder © 2014 SAP AG or an SAP affiliate company. All rights reserved. 153

Full Mapping Report
The Full Mapping Report [page 160] must be populated with mappings from a selected worksheet (or the entire workbook). The interactive report displays details about the mapped concepts, and units from the selected worksheet(s). In the interactive view, the column widths can be altered, and the output can be sorted by column heading. The printed output is formatted with a predefined XSLT layout and identifies the taxonomy and workbook.
To view mapped characteristics of an individual cell, see View Cell Mappings [page 152]. To save the mappings that you have created or to import the mappings to other workbooks, see Mappings Report.
Level of Detail in Mapping Reports
The following reports have options to view mapping information for individual sheets in a workbook:
● Incomplete Mapping Report [page 157]● Tuple Mapping Report [page 147]● Full Mapping Report [page 160]● Unmapped Fact Report [page 161]
The Using the Instance Editor [page 80] can be used to view or edit fact data and mapping details based on the loaded DTS.
Related Information
About Mapping [page 112]Tuple Mapping Workflows [page 140]Mapping Footnotes [page 103]Close Report Builder [page 19]
2.11.3.19 Delete or View Mappings
NoteMicrosoft Excel delete functions do not delete Report Builder mappings from a cell or workbook.
You can delete or view the following categories of mappings from a Microsoft Excel workbook or Report Builder Template:
● all mappings (concept, context, and unit)● contexts● units
154 © 2014 SAP AG or an SAP affiliate company. All rights reserved.Report Builder Help
Using Report Builder

To delete mappings
1. Open a workbook.2. Select a cell or range of cells.3. Right-click the selection and, in the context menu, select a delete option (mappings, context, or unit).
If a menu option is unavailable (grayed), the selected cells have no corresponding mapping.
Examples
In the following examples, the highlighted cell B12 is mapped with concept, context, and unit.
View Mappings
Right-click the cell and click to select View Mappings. The Cell Mappings dialog box displays details about the mapped concept. Compare Cell Mappings to details in the Element Details Tab [page 28].
Delete Mappings (Concept, Context, and Unit)
Use Delete Mappings to delete all mapping information, including the concept, context, and unit from one or more selected cells.
NoteSelect this option to remove a mapped concept from a cell.
Delete Context (or Units)
To verify a context (or unit) is deleted, right-click and select View Mappings.
Related Information
About Mapping [page 112]Mapping Contexts [page 89]Mapping Units and Unit Patterns [page 97]Bulk Update - Updating Contexts [page 92]
Report Builder HelpUsing Report Builder © 2014 SAP AG or an SAP affiliate company. All rights reserved. 155
Review and Verify Mappings [page 153]
2.11.3.20 Mapping Reports
Mapping reports are verification tools for mappings in a Microsoft Excel workbook. Each mapping report is a filtered view of mapped taxonomy items which can pinpoint potential issues in a Report Builder template (with or without data) or inaccuracies before saving mapped fact data as an XBRL instance.
Mapping reports are interactive and can be sorted, printed or saved to your local file system or to archive locations. The Reports group on the UBmatrix tab of the Microsoft Excel ribbon provide the following functions:
Menu Item Functionality
Duplicate Mapping Report [page 129]
List facts that are mapped in more than one location in the current Report Builder template or workbook.
Incomplete Mapping Report [page 157]
List mapped concepts that are missing a context or unit mapping. Interactive content and report can be saved.
Tuple Mapping Report [page 147] List the mappings for tuple children and tuple parents.
Full Mapping Report [page 160] List mapped content in a sortable interactive table. Report can be saved.
Unmapped Fact Report [page 161]
List fact data in Report Builder that do not display in the workbook; facts from an imported XBRL instance document may lack mapping information.
Mappings Report [page 131] Export mapping information in the current workbook to an XML file. A Mappings Report can be imported to unmapped workbooks. See Reusing Mapping Information [page 130].
Related Information
Save Reports [page 171]Print Reports [page 171]
2.11.3.20.1 Duplicate Mapping Report
The Duplicate Mapping Report lists fully mapped facts that appear in more than one location in the current Microsoft Excel workbook. This report pinpoints worksheet and cell for sets of duplicate mappings, enabling you to compare and assess appropriateness of each recurrence. The cell references and fact value for duplicate mappings are saved in the workbook and in the Sample Mappings Report [page 132].
The Duplicate Mapping Report is a sortable and interactive listing of the following details:
● <Reference> - the worksheet and cell location for a mapped fact
156 © 2014 SAP AG or an SAP affiliate company. All rights reserved.Report Builder Help
Using Report Builder
● <Label> - the label for a taxonomy concept, based on language and Views [page 55] (usage) defined in the taxonomy and set in the Views [page 55] tab of Preferences Settings (User Preferences) [page 52].
● <Namespace> - the uniform resource identifier (URI) reference for the taxonomy schema that contains the concept definition
● Contexts [page 86] - the context identifier (Context ID) for the context definition● Defining a Unit Pattern [page 95] - the unit identifier (Unit ID) for the unit definition (only used for numeric
concepts)● <FactValue> - the contents in the reference cell
To generate a Duplicate Mapping Report
1. Open a workbook that includes duplicate mappings or create a duplicate mapping:
a. Copy and paste one or more fully mapped cells to another worksheet.b. If Report Builder prompts you with the Data Integrity Conflict dialog box, click Copy.
2. From the Reports menu, click Duplicate Mapping Report.3. The Duplicate Mapping Report lists the cells that are flagged as sets of duplicate mappings. Click any row in
the report to move the focus to that worksheet and cell.
To repair an unwanted duplicate mapping, you can use Synchronization [page 119] and the About Palette [page 35] to identify which Contexts [page 86], Units and Unit Patterns [page 93], Footnotes [page 101], and Dimensions [page 107] are mapped on the current worksheet.
One way to ensure a subtotal is copied into a summary report on another worksheet is to create a duplicate mapping by dragging a fully mapped concept from the Instance Editor Tab [page 31] onto the destination cell.
NoteThe Duplicate Mapping Report does not show incomplete mappings. To view incomplete mappings, use the Incomplete Mapping Report [page 157], Full Mapping Report [page 160], or Instance Editor Tab [page 31].
Related Information
Duplicate Mappings [page 128]Mapping Reports [page 156]About Mapping [page 112]
2.11.3.20.2 Incomplete Mapping Report
The Incomplete Mapping Report lists mapped concepts that lack one or more contextual mappings (context and unit). The report identifies the incompletely mapped cells by worksheet and cell reference and describes both the mapped and missing details.
The Incomplete Mapping Report has two formats:
Report Builder HelpUsing Report Builder © 2014 SAP AG or an SAP affiliate company. All rights reserved. 157

● The interactive format can be sorted in ascending or descending order by any column header, and the columns can be resized to show the information you want to view. Pause the pointer over a row to Real Time Settings [page 64].
● The printed format (Print Preview ) is a formatted report that identifies the fully qualified file name for the taxonomy schema, the file name for the workbook, and incomplete mappings as sorted in the interactive report.
The Incomplete Mapping Report is a sortable listing of the following details:
● Reference - the worksheet and cell location of an incompletely mapped fact● Message - a description of the unmapped contextual items for the concept(s) mapped to the reference cell
location.● Namespace - the uniform resource identifier (URI) reference for the taxonomy schema that contains the
concept definition.
Note
To outline the cells that are incompletely mapped in the workbook, click [Incomplete Mappings] toggle on the Report Builder Report Builder Icons [page 15]. You can manually change worksheets to view incomplete mappings throughout the workbook. Click the Incomplete Mappings icon again to clear the outlines on all worksheets.
To generate an Incomplete Mapping Report
1. Open a partially mapped workbook.2. From the Reports menu, click to select Incomplete Mapping Report .3. The report displays the incompletely mapped concepts.4. Sort the report content by clicking column headers or resize column widths, then do one of the following:
a. Click Print to print the report to a preferred printer (opens a dialog box for your operating system). You can also print links or linked documents.
b. Click Print Preview to view the formatted report for page layout, then click Print to print the formatted report.
c. Click Close to close the Incomplete Mapping Report.5. If the current workbook has no mappings or if all the mapping(s) are complete, Report Builder displays an
error message and does not generate a report. Click OK to close the message.
To validate mapped values or check for incorrect mappings, see Report Validation [page 176].
Related Information
Mapping Workflow [page 113]Mapping Reports [page 156]Save Reports [page 171]
158 © 2014 SAP AG or an SAP affiliate company. All rights reserved.Report Builder Help
Using Report Builder
2.11.3.20.3 Tuple Mapping Report
The Tuple Mapping Report is an interactive hierarchical list of mapped tuples, with options to expand or hide the concepts or child tuples. The report shows the enumerated instances of tuple mappings and nested tuples, along with the Microsoft Excel worksheet and cell locations and contextual mappings of concepts within a tuple. Tuples in the report have controls that can be clicked to expand to show or hide tuple members and tuple children.
For information about tuples and mapping them, see Tuple Mapping Workflows [page 140].
The Tuple Mapping Report displays tuple items in the hierarchy defined in the taxonomy. The columns in the report are:
● <FactName> - the namespace prefix and tuple name or concept name for mapped tuple items● <Reference> - the tuple instance name or worksheet and cell location of mapped tuple concepts● Contexts [page 86] - the context identifier (Context ID) for the context definition● Defining a Unit Pattern [page 95] - the unit identifier (Unit ID) for the unit definition (only used for numeric
concepts)●
In this interactive report, tuples can be expanded or collapsed to show or hide child tuples. Content can be sorted and resized from the right-click context menu:
Sort Ascending/Descending the report records by any column.
Column Chooser. Drag up to 16 different elements for child concepts between the Customization list box and the report. The report refreshes automatically as columns are revised.
Best Fit/Best Fit (all columns) adjusts the column width to accommodate the data in a selected column, or adjusts the width of the columns you've added to the report.
To generate a Tuple Mapping Report
1. Open a workbook that includes tuple mappings.2. From the UBmatrix Reports menu, click Tuple Mapping Report.3. The Tuple Mapping report shows concept names for parent tuples, and for tuple children, concept names,
references to cell mappings, contexts, and units.
Related Information
Tuple Mapping Workflows [page 140]Mapping Nested Tuples [page 145]Replicating Tuple Mapping [page 140]
Report Builder HelpUsing Report Builder © 2014 SAP AG or an SAP affiliate company. All rights reserved. 159
2.11.3.20.4 Full Mapping Report
The Full Mapping report has two formats for verifying a mapped Microsoft Excel workbook.
● The interactive format has options to display mappings for a worksheet or for all mappings in the workbook. This interactive format can be sorted by any column header and is synchronized with the workbook and taxonomy.
○ Clicking a reference in the report automatically highlights the respective element in the taxonomy and the mapped cell(s) in the workbook.
○ If a selected element is mapped on a different worksheet, Report Builder automatically opens the applicable worksheet.
● The printed view (Print Preview) is a formatted report that identifies the fully qualified file name for the taxonomy schema and the workbook file name and lists mapping information as sorted in the interactive view.
The Full Mapping Report shows the following columns:
● <Reference> - the worksheet and cell location for a mapped fact● <(Concept) Label> - the label for a taxonomy concept, based on language and Views [page 55] (usage)
defined in the taxonomy and set in the Views [page 55] tab of Preferences Settings (User Preferences) [page 52].
● Contexts [page 86] - the context identifier (<Context ID>) for the context definition● Defining a Unit Pattern [page 95] - the unit identifier (<Unit ID>) for the unit definition (only used for
numeric concepts)● <Decimal or Precision> - part of a Defining a Unit Pattern [page 95]● < Namespace> - the uniform resource identifier (<URI>) reference for the taxonomy schema that contains
the concept definition
Example
This procedure can be used to generate a full mapping report from a open workbook. The Mapping Report will not be created if there are no mappings in the workbook. The full mapping report does not include fact values. To view fact values in a workbook, generate an Save XBRL Instance Documents and Reports [page 184] or Unmapped Fact Report [page 161] or Instance Editor Tab [page 31].
To generate a full mapping report
1. In the Reports menu click Full Mapping Report.2. In the drop-down list, click to select the worksheet you want to view or click View All Mappings, and then click
View Mappings.3. In the interactive report, sort the list of mappings by column by clicking a column header. Click a row to
highlight a mapped cell in the workbook and the applicable row in the report, or click a mapped concept in the taxonomy to highlight the applicable concept in the report or workbook.
4. To change the view to another sheet repeat Step 2.5. To save an interactive report, click Print Preview.
160 © 2014 SAP AG or an SAP affiliate company. All rights reserved.Report Builder Help
Using Report Builder
6. To save a the formatted report, click Print.
Related Information
Mapping Reports [page 156]Report Validation [page 176]Reports [page 170]
2.11.3.20.5 Unmapped Fact Report
The Unmapped Fact report shows fact data from an imported XBRL instance document that do not have mapping information in the current Microsoft Excel workbook. Report Builder recognizes unmapped facts that have a missing reference or a missing (but required) fact value.
The Unmapped Fact Report is a sortable and interactive listing of the following details:
● <Label> - the label for a taxonomy concept, based on language and Views [page 55] (usage) defined in the taxonomy and set in the Views [page 55] tab of Preferences Settings (User Preferences) [page 52].
● Contexts [page 86] - the context identifier (<Context ID>) for context definition associated with the unmapped fact
● Defining a Unit Pattern [page 95] - the unit identifier (<Unit ID>) for the unit definition (only used for numeric concepts) associated with the unmapped fact
● <Fact Value> - the contents or value of the concept referenced by the label● <Namespace Taxonomy> - the uniform resource identifier (<URI>) reference for the taxonomy schema that
contains the concept definition
Example
The example below shows fact data that was imported from an XBRL instance document. The imported facts do not have a Sheet reference in the Instance Editor.
To generate an Unmapped Facts report
1. Import an XBRL instance into an unmapped workbook.2. From the UBmatrix Reports menu, click Unmapped Fact Report. The report displays the imported facts.3. Click Print to print the report.
If a Mappings Report [page 131] is available, it can be imported to provide cell locations for unmapped fact data. Unmapped facts from an imported instance document can also be viewed in the Instance Editor Tab [page 31].
Report Builder HelpUsing Report Builder © 2014 SAP AG or an SAP affiliate company. All rights reserved. 161
Related Information
Import an Instance Document [page 84]Instance Editor Tab [page 31]Instance Reports [page 82]
2.11.3.20.6 Mappings Report
Generating a Mappings Report exports Reusing Mapping Information [page 130] in the current Microsoft Excel workbook to an XML file, with options to include definitions of contexts and units. The Import Mappings Report [page 136] to similarly formatted unmapped workbooks that use the same taxonomy definitions to create an XBRL-enabled financial report. For more information, see Considerations when Importing a Mappings Report [page 137]
To view the XML content in a Mappings Report, see Sample Mappings Report [page 132].
Example
This example generates a Mappings Report for the mapped workbook located in the samples folder ..\Tutorials\Mappings Report\Template. The workbook and Mappings Report reference the sample Extension-BasicCalculation taxonomy.
To generate a Mappings Report
1. Open a mapped workbook or Report Builder template. For this example, use the fully mapped workbook in the samples folder ..\Tutorials\Mappings Report\Template\MappedWorkbook.xlsx.
2. If prompted for a taxonomy, browse to ..\Taxonomies\Patterns\Extension\Extension-BasicCalculation.xsd.
3. When the taxonomy has loaded, from the UBmatrix Reports menu, click Mappings Report.4. In the Export Mapping File dialog box, click to select options to save the definitions for the mapped Contexts
and Units as part of the Mappings Report, and then click OK.
NoteDefinitions for unmapped contexts and units are not exported.
5. In the Save As dialog box, browse to a folder, enter a file name for the Mappings Report (.xml extension), and then click Save. The ..\Tutorials\Mappings Reports\Reports folder has a Mappings Report with definitions for mapped contexts and units and a Mappings Report without context or unit definitions.
6. Close the workbook.
162 © 2014 SAP AG or an SAP affiliate company. All rights reserved.Report Builder Help
Using Report Builder

Related Information
Considerations when Importing a Mappings Report [page 137]What is a Report Builder template? [page 48]Import Mappings Report [page 136]
2.11.3.21 Mapping File
Report Builder automatically saves Reusing Mapping Information [page 130], including definitions of contexts and units, to a mapping file whenever a mapped Microsoft Excel workbook or XBRL instance is saved.
The XML format mapping file is saved in the folder that the mapped workbook or instance is saved to, appending -MappingFile.xml to the file name of the workbook or instance. If a mapping file with the same name already exists in that location, it is overwritten.
The auto-saved XML file is identical to a Mappings Report [page 131] that includes context and unit definitions, and can be imported into an unmapped Excel report to regenerate the fully or partially mapped workbook.
The automatic save option can be enabled or disabled at any time from the Instance [page 79] tab of Preferences Settings (User Preferences) [page 52]. It is a good idea to keep automatically saved mapping reports as backup snapshots of your work when you work through a Mapping Workflow [page 113].
NoteDefinitions for unmapped contexts and units are not exported.
Related Information
Mappings Report [page 131]Considerations when Importing a Mappings Report [page 137]What is a Report Builder template? [page 48]
2.11.3.22 Protecting a Report Builder Template
A fully-mapped Report Builder template can be locked to restrict access to certain features of Report Builder.
Protect a Report Builder template to prevent a particular user role from accessing certain features in the current Report Builder template. For example, you can disable users from opening or changing one or more taxonomy views in Microsoft Excel.
To protect an open Report Builder template, proceed as follows:
1. In the UBmatrix tab, click Protection and then click Protect Template.
Report Builder HelpUsing Report Builder © 2014 SAP AG or an SAP affiliate company. All rights reserved. 163
2. In the Protect Template dialog box, click the Protect Template option.3. Optionally, enter a password. Passwords are case sensitive.
NoteIf you lose or forget the password, it cannot be recovered.
4. Expand the tree view and click to select the Report Builder features you want to hide or lock. One or more items must be selected in order to protect the current template.
5. Click OK .
Related Information
About Mapping [page 112]What is a Report Builder template? [page 48]
2.11.3.23 Close Report Builder
Use the Close group tab on the Report Builder toolbar to save or discard mapping information in the current Microsoft Excel workbook. Use Detach and Close Report Builder to delete all mappings and close the current workbook.
To close Report Builder without closing the workbook
1. In the Close group, click Close Report Builder.2. To save your changes, click No and save the Microsoft Excel workbook first and then repeat this process.
If you do not want to save mapping changes, click Yes.3. Report Builder closes, and the workbook remains open.4. To verify that the mappings are available, close Microsoft Excel, and then reopen the saved workbook in
Microsoft Excel.5. Click to select a mapped cell, then right-click and select View Mappings .6. Existing mappings for the cell display as values for Concept Name, Context ID , and Unit Id .
2.11.4 Mapping in Microsoft Office Word
You can map text or numeric data in a Microsoft Office Word 2007 or Word 2010 document (*.docx) and include it in a Report Builder workbook. This allows you to author and maintain lengthy or complicated facts, like tables, narratives, and summaries, in Word. Formatting like bold and italic added in Word will be preserved in generated XBRL reports when mapped to non-numeric concepts.
You first create or import the taxonomy definitions, contexts, units, and unit patterns using Report Builder in the Microsoft Excel workbook and then they will be available in Word for mapping content. These elements cannot be defined in the Report Builder Word Mapper.
164 © 2014 SAP AG or an SAP affiliate company. All rights reserved.Report Builder Help
Using Report Builder
Workflow for Mapping Facts in Microsoft Word
1. Link a Word document to your Excel workbook. Linking a Microsoft Word Document [page 165]2. Map facts in Microsoft Word. Mapping Facts in Microsoft Word [page 167]3. View mappings in the Word document. Exploring Word Mapper [page 38]
Related Information
Mapping Workflow [page 113]Organize your Mapping Project [page 116]Changing or Deleting the Mapping of a Fact in Microsoft Word [page 167]Exploring Report Builder [page 13]Exploring Word Mapper [page 38]
2.11.4.1 Linking a Microsoft Word Document
The procedure below shows how to link a Microsoft Word document to the open Microsoft Excel workbook.
To link an external data source to a Report Builder workbook
1. Open a mapped Microsoft Excel workbook.
NoteThe current workbook must be saved before using the Microsoft Word Mapper. Also, be sure to close any Microsoft Word windows that you have opened.
2. Click the UBmatrix tab, and then click Link to External Data Source.3. In the Link to External Data Sources dialog box, click Browse, and then navigate to the source Word document
(*.docx).4. Select the file, click Attach and then click Map Attached Document to open Word and map the document.
- or -Click Save to create a link to the Word file and close the dialog box.
The Word document is linked to the current workbook. The Attached Files list box identifies the source file that is attached to the current workbook.
NoteWhile multiple files can be linked to the Excel workbook, only the first one can be opened for mapping through the Report Builder Word Mapper.
Report Builder HelpUsing Report Builder © 2014 SAP AG or an SAP affiliate company. All rights reserved. 165

After you have linked the Word document to your Excel workbook, proceed to Mapping Facts in Microsoft Word [page 167].
Related Information
Mapping in Microsoft Office Word [page 164]Removing a Linked Microsoft Word Document [page 166]Mapping Facts in Microsoft Word [page 167]Link to an External Data Source [page 169]
2.11.4.2 Removing a Linked Microsoft Word Document
The procedure below shows how to remove a linked Microsoft Word document from the open Microsoft Excel workbook.
To remove a linked Microsoft Word document
1. Open a mapped Microsoft Excel workbook.2. Click the UBmatrix tab, and then click Link to External Data Source.
NoteBefore removing a linked Microsoft Word document, be sure to close any Microsoft Word windows that you have opened.
3. In the Attached Files list box, click the linked file you would like to remove, and then click Detach.
The Word document is detached from the current workbook. The Attached Files list box identifies any other source files attached to the current workbook.
NoteWhile multiple Microsoft Word *.docx files can be linked to the Excel workbook, only the first one can be opened for mapping through the Report Builder Word Mapper.
Related Information
Linking a Microsoft Word Document [page 165]Mapping Facts in Microsoft Word [page 167]
166 © 2014 SAP AG or an SAP affiliate company. All rights reserved.Report Builder Help
Using Report Builder
2.11.4.3 Mapping Facts in Microsoft Word
After you have linked to the Microsoft Word document using the procedure in Linking a Microsoft Word Document [page 165], you can begin mapping the facts.
To map facts in Microsoft Word
1. Open your workbook in Excel. On the UBmatrix tab, click Link to External Document.2. Click on the attached filename in the list box, and then click Map Attached Document.
A Report Builder Word Mapper window will open with the attached document loaded.3. In the Word mapper Taxonomy Presentation view pane, click to expand the tree.4. Select the fact that you want to map.5. Double-click the relevant concept in the taxonomy listing.
The appearance of the highlighted fact will change and the fact will be surrounded by a Content Control.6. After mapping the fact, associate it with a context. Select the fact and then double-click the relevant Context
ID in the Contexts pane.7. If needed, associate the fact with a unit. Select the fact and then double-click the relevant unit in the Units
pane.- or - If needed, associate the fact with a pattern. In the Units pane, click the My Patterns tab. Select the fact and then double-click the relevant pattern name.
8. Review the mapping properties by clicking the fact and then viewing the mappings in the Mapping Properties pane.- or - Review the mapping properties by right-clicking the fact and then selecting View Mapping from the Content Control menu.
Related Information
Mapping in Microsoft Office Word [page 164]Exploring Word Mapper [page 38]Changing or Deleting the Mapping of a Fact in Microsoft Word [page 167]
2.11.4.4 Changing or Deleting the Mapping of a Fact in Microsoft Word
After mapping a fact in Report Builder Microsoft Word Mapper, you might discover that you need to change or delete its mapping. Follow the procedure below to change or delete the mapping.
To change or delete the mapping of a fact in Microsoft Word
Report Builder HelpUsing Report Builder © 2014 SAP AG or an SAP affiliate company. All rights reserved. 167

1. Open your workbook in Excel. On the UBmatrix tab, click Link to External Document.2. Click on the attached filename in the list box, and then click Map Attached Document.
A Report Builder Word Mapper window will open with the attached document loaded.3. Right-click a highlighted fact in the main window. On the Content Control menu that appears, select the
appropriate option:
○ Delete Context: remove the context from this mapped fact.○ Delete Unit: remove the unit from this mapped fact.○ Delete Mapping: delete the entire mapping from this fact; this will delete any mapped concept, context,
unit, and pattern.4. After deleting all or a part of the mapping, you can map the fact again to reflect the correct concept, context,
until and pattern, as desired.5. Review the mapping properties by clicking the fact and then viewing the mappings in the Mapping Properties
pane.- or -Review the mapping properties by right-clicking the fact and then selecting View Mapping from the Content Control menu.
Related Information
Exploring Word Mapper [page 38]Mapping Facts in Microsoft Word [page 167]
2.12 Import External Data
With Report Builder, you can import XBRL instance documents, import mappings to convert Microsoft Excel reports into XBRL-enabled fact data, and dynamically include fact data from Microsoft Word documents in an XBRL instance report.
NoteWhen importing data or mappings, you may want to change the default settings for the taxonomy path and instance path to match those in the imported file. For more information, see Preferences Settings (User Preferences) [page 52].
You can import data from an XBRL instance document into a blank workbook or into the current mapping project. You can import all of the fact data in an XBRL instance document, or fact data for a one or more specified contexts and units in the report. The imported fact data can be edited, validated, or saved.
NoteWhen importing facts from an XBRL instance document, the referenced taxonomy items must be available in Report Builder.
Use the Select Data to import wizard to select the items to import from an XBRL instance document:
168 © 2014 SAP AG or an SAP affiliate company. All rights reserved.Report Builder Help
Using Report Builder

● Instance Document: Import XBRL fact data and related XBRL metadata● Contexts: Import selected contexts● Units: Import selected units
NoteXBRL instance documents can have either an .xbrl or .xml extension; when importing instance data, you may need to alter the default file extension on the Open dialog box.
You can import mappings from a Report Builder template into any number of Microsoft Excel workbooks. For more information, see Import Mappings Report [page 136].
You can include text or numeric fact data from Microsoft Word documents in a mapped workbook. Report Builder provides an interface for tagging data and attaching external sources to include in an XBRL report. For more information, see Mapping Facts in Microsoft Word [page 167].
Related Information
Importing an XBRL Instance Document [page 83]Import an Instance Document [page 84]Import Contexts [page 91]Import Units [page 99]Linking a Microsoft Word Document [page 165]
2.12.1 Link to an External Data Source
Report Builder supports including mapped facts from a linked Microsoft Word document when an XBRL instance document is validated, previewed, or saved.
Report Builder can include fact data from other files in an XBRL instance report. With Report Builder you can author and update mapped content in Microsoft Word source documents independently of mapped workbooks and opt to incorporate the external content when validating or saving fact data as an XBRL instance.
Why Link to External Data Sources?
Populating a Microsoft Excel workbook with business facts can be challenging, particularly if a fact is a large graphic, a multi-page corporate policy, a table, or an operation summary. This sort of content does not fit neatly in a single cell of a worksheet. If fact data is changing frequently or is updated independently of mapped content in the workbook, it can be difficult to ensure that the fact reported in the XBRL instance is up to date.
Business facts in external sources can be updated up to the moment you validate or save an XBRL instance in Report Builder . Before generating an XBRL instance document, save the changes in the source document, and Report Builder provides the option to automatically include mapped data from attached files.
Report Builder HelpUsing Report Builder © 2014 SAP AG or an SAP affiliate company. All rights reserved. 169
Linking Facts by Mappings in Report Builder
Report Builder linking features dynamically incorporate business data from Microsoft Word documents with the mapped workbook when validating or generating XBRL. For workflow procedures, see Mapping in Microsoft Office Word [page 164].
NoteThe Report Builder term for importing external data differs from the Microsoft Word and Microsoft Excel import and open commands.
Related Information
Linking a Microsoft Word Document [page 165]Mapping Facts in Microsoft Word [page 167]Exploring Word Mapper [page 38]Import External Data [page 168]
2.13 Reports
Reports available through the Reports tab or menu include both XBRL instance documents and predefined reports that provide feedback about mapped or imported XBRL instance data and mappings.
Many reports have options for sorting the displayed content and for exporting the content to an Microsoft Excel file.
Integrity checks in Report Builder automatically generate error reports if imported or loaded data is incomplete.
Details tabs provide interactive sortable views of instance data and dimensions for resolving errors in report output. For more information, see Details Pane [page 27].
Customizing predefined reports requires knowledge of XSLT and Java. For additional information, see Customize Reports [page 171].
Related Information
Report Validation [page 176]Preview [page 174]Save XBRL Instance Documents and Reports [page 184]Mapping Reports [page 156]
170 © 2014 SAP AG or an SAP affiliate company. All rights reserved.Report Builder Help
Using Report Builder

2.13.1 Save Reports
Reports can be saved as HTML or XML files
For information about saving an instance, see Save XBRL Instance Documents and Reports [page 184].
Each tab in a multi-tabbed report is considered a separate report. Use this procedure for each tab.
1. From the open report, click the drop-down arrow on the Save button, and then select the file type.2. In the Save File to dialog box, browse to the location for the report and then click Save.
Related Information
Print Reports [page 171]Report Validation [page 176]Instance Reports [page 82]Mapping Reports [page 156]Logs [page 188]
2.13.2 Print Reports
Each tab in a multi-tabbed report is considered a separate report. Use this procedure for each tab.
1. From the open report, click Print.2. In the Printer dialog box, configure any required parameters, and then click Print.
Related Information
Report Validation [page 176]Instance Reports [page 82]Mapping Reports [page 156]Logs [page 188]
2.13.3 Customize Reports
Customizing reports comprises the following:
● Customize validationSee the validation patterns and formulas that have been registered in the following configuration files:
○ xbrlData.properties
Report Builder HelpUsing Report Builder © 2014 SAP AG or an SAP affiliate company. All rights reserved. 171

○ xbrlConfiguration.xml● Add a watermark
You can add your company name to documents and reports that you generate with Report Builder by changing the watermark. For more information, see Adding a Watermark [page 172].
● Revise the title of a predefined reportYou can change the title of predefined reports. For more information, see Revising Title of a Predefined Report [page 172].
2.13.3.1 Adding a Watermark
The watermark is an attribute in one of the Report Builder system resource files. To revise the watermark for your reports, proceed as follows:
1. Open the file ..\RBMEResources\System\BrandingInfoList.XML in a text editor.
2. For application installations made for an individual desktop, scroll to the section <BrandName>0</BrandName>.
3. Revise the WatermarkTitle attribute in the following section:
.
.<WatermarkTitle>Created with (name of your program, company, or department)</WatermarkTitle> ..
4. Save your changes and restart Microsoft Excel.
2.13.3.2 Revising Title of a Predefined Report
Report Builder is delivered with predefined reports for validation and predefined reports for mapping.
The templates for reports are XSLT scripts (.xsl files) located in the Report Builder system folder (..\RBMEResources\System).
NoteDo not change other variables; the HTML is used to generate the body of the report.
1. Open a <report>.xsl file from the Report Builder system folder (..\RBMEResources\System) in a text editor.
2. Look for the title and revise as follows:
<table width="100%" border="0" cellspacing="0" cellpadding="0"> - <tr> <td width="28%" />- <td width="72%">- <div align="right" class="style1"> <h4 class="style2">EDGAR Online UBmatrix Report Builder - XBRL Validation Report Results</h4>
172 © 2014 SAP AG or an SAP affiliate company. All rights reserved.Report Builder Help
Using Report Builder

</div> </td> </tr> </table>
3. Save your changes and restart Microsoft Excel.
Related Information
Report Validation [page 176]
2.13.4 Localize Reports
The concept labels in a calculation trace report are determined by the language and label role(s) defined in the taxonomy or linkbase. If multiple labels are available, the labels in the report is determined by the language and label role from the Views tab in Preferences Settings (User Preferences). Concepts in the taxonomy that lack a label for the language and label role from the Views tab display the english label. If no english label exists or if Report Builder is unable to determine which language linkbase is attached, the application defaults to the Qname, using the declared namespace plus the element name from the taxonomy.
The language and the format of numerical data and dates are affected by settings in your operating system and in the processing engine resource files. If the formatting or labels used in your reports do not display as expected, check the following items:
● The regional and language options of your operating system● The preferred language for Microsoft Office.● The language settings in the attached label linkbase (xml:lang= "<language>")● The language settings in the processing engine resource files and XSLT stylesheets (see ..\resources
\system folder of Report Builder):● xbrlConfiguration.xml (language = "<language>")● Localizer.xml (xml:lang= "<language>")● CalcTrace-toHtml.xsl (<html xmlns="http://www.w3.org/1999/xhtml" xml:lang=
"<language>" lang= "<language>">)
If the language settings in the application and in the resource files differ, then the character sets and number and date formatting may not display correctly.
Related Information
Preferences Settings (User Preferences) [page 52]Views [page 55]Reports: Calculation Trace [page 178]
Report Builder HelpUsing Report Builder © 2014 SAP AG or an SAP affiliate company. All rights reserved. 173
2.13.5 Preview
You can preview any XBRL instance report as raw XBRL content, or for an instance report that references a US GAAP taxonomy or IFRS (2008 or 2010) taxonomy, you can preview the instance data in the embedded SEC Interactive Data Previewer, a multi-tabbed view of reported content in a financial report format for the U.S. Securities and Exchange Commission.
Prior to previewing a report, use the preview options to include linked external data and to filter the worksheets you want to include in a preview; preview options apply to the current session of the open workbook.
IFRS taxonomies may not render with the same level of detail as a USGAAP taxonomy in the SEC viewer.
The following procedures are available on the Preview menu:
● Preview Options [page 174]● Preview an XBRL Instance Document [page 175]● SEC Interactive Data Previewer [page 175]● Preview an EDGAR Filing [page 211]
You can also print or save a preview.
Related Information
Save Reports [page 171]Print Reports [page 171]
2.13.5.1 Preview Options
Before previewing an instance report as XBRL or in the SEC Interactive Data Previewer, use the preview options to include linked external data and to filter worksheets to include in the preview.
1. From the UBmatrix Reports menu, click Preview, and then click Options.2. If data from external sources has been mapped, click to select Retrieve linked external content when
generating preview3. To preview an instance using data for certain worksheets, under Filter Selection area, click to select Selected
Worksheets, and then use the arrows to move selected sheets from the Available Sheets list box to the Sheets in Report list box.
4. Click Save.
The preview options remain set for the current session of Report Builder (the current workbook). See the following procedures to complete the preview:
● Preview an XBRL Instance Document [page 175]● Preview an EDGAR Filing [page 211]
174 © 2014 SAP AG or an SAP affiliate company. All rights reserved.Report Builder Help
Using Report Builder
Related Information
Reports [page 170]Save XBRL lnstance Document [page 186]
2.13.5.2 Preview an XBRL Instance Document
You can preview mapped data prior to saving it as an XBRL instance document or inline XBRL document.
Previewing as XBRL displays read-only content of your instance report as raw XML tags in your default browser window. This content can be saved as an .xml, .xbrl, or .html file.
1. After setting Preview Options [page 174], in the UBmatrix Reports menu, click Preview and then click XBRL.2. If the preview options had been set to include linked external data sources, an informational message
appears. Click to select the check box to hide future notifications and then click OK.Report Builder's internal integrity checks verify the referenced tags in linked external data sources. If mapped items in external sources are not unique (more than one item is mapped with a given concept and contextual information), Report Builder cannot resolve the discrepancy and cannot generate the XBRL instance. Report Builder presents details about duplicate tags in external sources in a Duplicate Tags Report. Use this report to resolve discrepancies, and then restart this procedure.
3. Report Builder generates read-only XBRL output and displays it in your default browser:
Use the File menu of your browser to save the .xbrl file to a relative path that is appropriate for the taxonomy entry point. In the above example, the XBRL preview content should be saved in the same folder as the taxonomy entry point identified by the schemaRef, xlink:href="../Tutorial%20Files/SEC%20Filer/Taxonomy/UBM-20080928.xsd." The XBRL file can be saved with an .xml, .xbrl, or .html extension.
Related Information
Reports [page 170]Save XBRL lnstance Document [page 186]Importing an XBRL Instance Document [page 83]
2.13.5.3 SEC Interactive Data Previewer
The SEC Interactive Data Previewer is an implementation of the SEC software, available for previewing an EDGAR filing.
The Preview option in the Reports menu is available for an instance report or XBRL instance document that references the US GAAP taxonomy. The SEC Interactive Data Previewer displays an instance document in a browser window with interactive links to reported statements and to show definitions and text block notes in pop-up windows exactly as they would appear in the SEC EDGAR reporting system.
To preview an SEC filing see Preview an EDGAR Filing [page 211].
Report Builder HelpUsing Report Builder © 2014 SAP AG or an SAP affiliate company. All rights reserved. 175

2.13.6 Report Validation
Report validation ensures that the fact data in the current workbook meet regulatory rules and business rules for an XBRL instance report. Report validation should be run to verify the financial data are complete and accurate before previewing or saving as an XBRL instance document.
Report Builder evaluates the data based on the relational structure of the taxonomy, with options to assess calculation relationships and compliance with business rules in the taxonomy or from your Manage Rules Library. The output can show the results as a summary or as a predefined interactive report that itemizes inconsistencies, errors, warnings, and informational messages in a tabbed HTML format. Report output can be printed or saved.
The figure below represents the validation rules built into the integrated XBRL processing engine. XML and XBRL validation is always included in report validation and ensures the reported data is compliant with XBRL 2.1, Dimensions 1.0, and Formula 1.0 specifications. The Validation tab of the output shows any XML or XBRL inconsistencies.
Report validation has options for including externally linked fact data and for including trace reports for calculations and business rules defined the taxonomy or in attached linkbases.
NoteA desktop computer may need 2GB or more RAM for processing large taxonomies. Report validation may momentarily display Not Responding if your network connection is slow, your desktop memory is low, or when referencing a large taxonomy.
Include this option To view a report that
Calculation trace
For more information, see Reports: Calculation Trace [page 178].
Identifies any mathematical errors in your report based on definitions in the taxonomy calculation linkbase. This report displays computed values for summation items.
XBRL formula trace Evaluates reported data based on business rules defined in the taxonomy or that apply to the taxonomy using rules or rule sets from your personal Manage Rules Library.
176 © 2014 SAP AG or an SAP affiliate company. All rights reserved.Report Builder Help
Using Report Builder
Include this option To view a report that
For more information, see Reports: XBRL Formula Trace [page 180].
EDGAR filer manual validation
For more information, see EDGAR Filer Manual Validation [page 207].
Evaluates reported data based on built-in XBRL formula trace tests defined in a rule set that is available from your personal Manage Rules Library for submissions that reference a US GAAP taxonomy. See Running EDGAR Filer Manual Validation [page 209].
External data sources
For more information, see Link to an External Data Source [page 169].
Includes block and detail data that has been mapped in attached external Microsoft Word documents.
To configure report validation to include trace reports by default see the Setup tab in Preferences Settings. For more information, see Setup [page 53] and Preferences Settings (User Preferences) [page 52].
Related Information
Compliance with XBRL Specifications [page 7]Taxonomy Validation Tab [page 35]Global Update [page 125]Granular Validation [page 65]Manage Rules Overview [page 193]
2.13.6.1 Reports: Validation
Prior to saving an XBRL instance document, use predefined reports to validate the mapped data. Report Validation verifies the XML and XBRL for mapped concepts based on values, contexts, units, and taxonomy relationships.
A validation report always includes XML and XBRL validation. Optional calculation and formula trace reports can identify inconsistencies in calculation roll-ups or selected business rules.
1. From the UBmatrix Reports group, click Validate .2. In the Report Validation dialog box, click the options to include in the validation report:
○ To validate mapped facts that roll up to a mapped sum or total, click Include Calculation Trace.○ To validate mapped facts using rules from your Manage Rules Library, click Include XBRL Formula Trace.○ To include mapped content from an external source, click Include linked external data sources when
producing this report. See Link to an External Data Source [page 169] and concepts.3. To limit the validation to individual sheets in the workbook, click Filters, and then select the sheets you want to
include.4. Click Validate.
The Validation report displays in the Reports dialog box.
Report Builder HelpUsing Report Builder © 2014 SAP AG or an SAP affiliate company. All rights reserved. 177

To save, print, or export this report, see Save Reports [page 171] and Print Reports [page 171].
Related Information
Running EDGAR Filer Manual Validation [page 209]Manage Rules Library [page 194]Reports: Include Calculation Trace [page 178]Include XBRL Formula Trace [page 181]
2.13.6.2 Reports: Calculation Trace
Including a calculation trace in report validation identifies calculation roll-up errors or inconsistencies. A calculation trace evaluates computed values from mapped data against the calculation relationships defined in the taxonomy.
The calculation trace report has two setting for displaying results of comparing reported values with computed values:
● Summary LevelDisplays a count of the calculations in a workbook.
● Full ReportDisplays the computed values involving all parent concepts participating in a calculation. This report can be useful to help compute missing values.A calculation trace displays any calculation roll-up errors or inconsistencies.To enable the calculation trace option to be included whenever report validation is run, see Reports: Include Calculation Trace [page 178].
Related Information
Report Validation [page 176]Localize Reports [page 173]
2.13.6.3 Reports: Include Calculation Trace
To validate calculations for mapped facts that roll up to a mapped sum or total, include a Calculation Trace report in a validation report.
1. From the UBmatrix menu, select Reports,and then select Validate.2. In the Report Validation dialog box, select Include Calculation Trace, and then select options for the
Calculation Trace report output:
178 © 2014 SAP AG or an SAP affiliate company. All rights reserved.Report Builder Help
Using Report Builder

○ Summary Level Report: Displays the counts for tests that were run.○ Full Report: Displays details about each calculation.
NoteDefault settings for trace reports in report validation can be configured in the Setup tab of Preferences Settings.
○ Include linked external data sources when producing this report: Incorporate any numeric fact data that is referenced in external data sources.
3. To run a calculation trace report for individual sheets in the workbook, click Filters, and then select the sheets you want to include in the report.
4. Click Validate.5. If reported data is in an external document, Report Builder issues an informational message. Select the check
box hide future notifications and then click OK.6. The calculation trace report shows the concept names, attributes, and values for all calculations. Errors or
inconsistencies are highlighted in the message column.
You can save the report as an HTML file or print it.
Related Information
Save Reports [page 171]Print Reports [page 171]Reports: Validation [page 177]Reports: Validation [page 177]Instance Reports [page 82]
2.13.6.4 Reading a Calculation Trace Report
The calculation trace report shows the results of calculations defined in the calculation linkbase of the current taxonomy and identifies the result of each calculation as follows:
● OK (success)● Inconsistency● Failure
The report output is shown as a tab in the Reports dialog box and includes the following columns:
Column Name Description
(first column) Sequence number, with options that identify the contexts and units defined for the items participating in a calculation.
Report Builder HelpUsing Report Builder © 2014 SAP AG or an SAP affiliate company. All rights reserved. 179
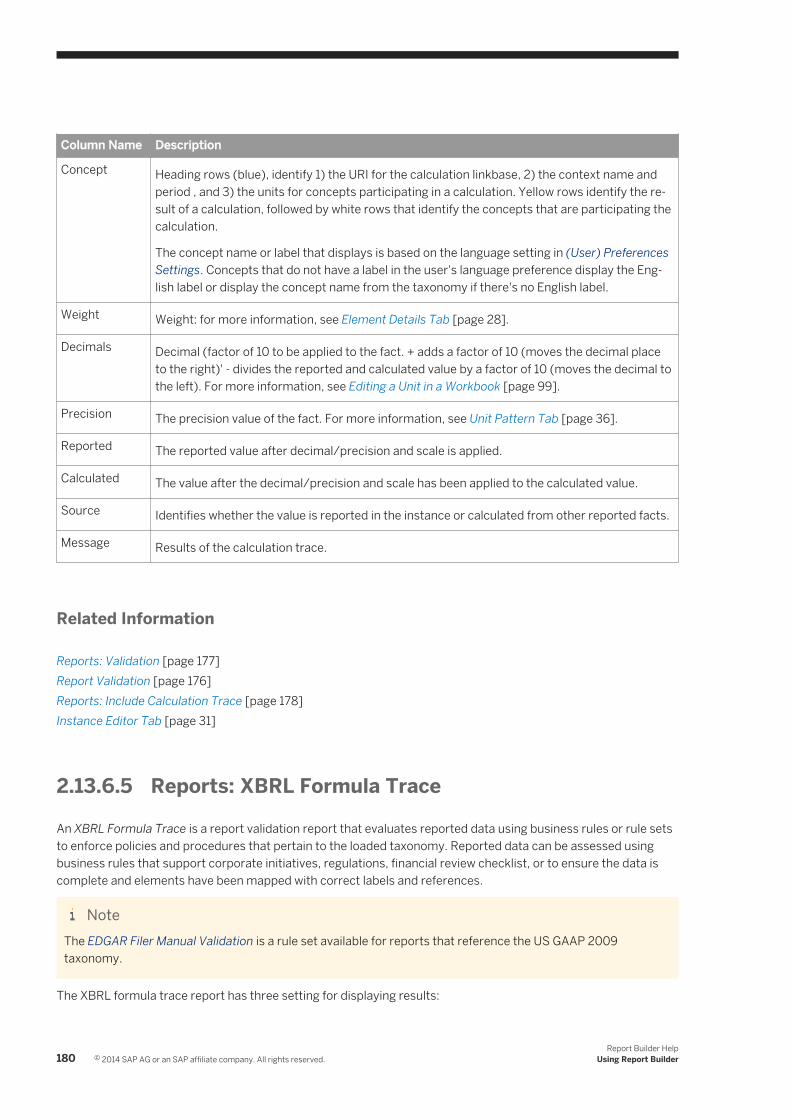
Column Name Description
Concept Heading rows (blue), identify 1) the URI for the calculation linkbase, 2) the context name and period , and 3) the units for concepts participating in a calculation. Yellow rows identify the result of a calculation, followed by white rows that identify the concepts that are participating the calculation.
The concept name or label that displays is based on the language setting in (User) Preferences Settings. Concepts that do not have a label in the user's language preference display the English label or display the concept name from the taxonomy if there's no English label.
Weight Weight: for more information, see Element Details Tab [page 28].
Decimals Decimal (factor of 10 to be applied to the fact. + adds a factor of 10 (moves the decimal place to the right)' - divides the reported and calculated value by a factor of 10 (moves the decimal to the left). For more information, see Editing a Unit in a Workbook [page 99].
Precision The precision value of the fact. For more information, see Unit Pattern Tab [page 36].
Reported The reported value after decimal/precision and scale is applied.
Calculated The value after the decimal/precision and scale has been applied to the calculated value.
Source Identifies whether the value is reported in the instance or calculated from other reported facts.
Message Results of the calculation trace.
Related Information
Reports: Validation [page 177]Report Validation [page 176]Reports: Include Calculation Trace [page 178]Instance Editor Tab [page 31]
2.13.6.5 Reports: XBRL Formula Trace
An XBRL Formula Trace is a report validation report that evaluates reported data using business rules or rule sets to enforce policies and procedures that pertain to the loaded taxonomy. Reported data can be assessed using business rules that support corporate initiatives, regulations, financial review checklist, or to ensure the data is complete and elements have been mapped with correct labels and references.
NoteThe EDGAR Filer Manual Validation is a rule set available for reports that reference the US GAAP 2009 taxonomy.
The XBRL formula trace report has three setting for displaying results:
180 © 2014 SAP AG or an SAP affiliate company. All rights reserved.Report Builder Help
Using Report Builder
● Summary LevelDisplays counts of formulas that were exercised, that passed, and that failed.
● Full ReportDisplays the concepts in a formula and values of concepts that participated in each formula, along with the result of the formula and any messages that were generated.
● Exceptions OnlyDisplays a detailed log of the exceptions encountered. This report displays details that can help debug.
To set the default formula trace option in report validation, see Setup tab of Preferences Settings (User Preferences).
Related Information
Include XBRL Formula Trace [page 181]Reading a Formula Trace Report [page 182]XBRL Formulas [page 203]Manage Rules Overview [page 193]Instance Reports [page 82]EDGAR Filer Manual Validation [page 207]
2.13.6.6 Include XBRL Formula Trace
1. From the UBmatrix Reports menu, click Validate.2. In the Report Validation dialog box, click Include XBRL Formula Trace, and then click a report output option:
○ Summary Level Report: List the counts for tests that were run.○ Full Report: Detail for each test, including hyperlinked reference to a specification, if available, result, and
message.○ Exceptions Only: For each failed test, itemize bindings, concept values participating in the formula
calculation, and line and column number of the failure in the resource file. These values are useful for debugging.
NoteYou can configure trace reports to be included by default in report validation. For more information, see Setup [page 53].
3. In the Available Rules list box, click the rules or rule sets to include in the formula trace. Optionally, click Select All to include all listed rules.
4. If rules require input parameters, clear or select Use default rule parameters where possible. For more information, Manage Rules Library [page 194].
Report Builder HelpUsing Report Builder © 2014 SAP AG or an SAP affiliate company. All rights reserved. 181
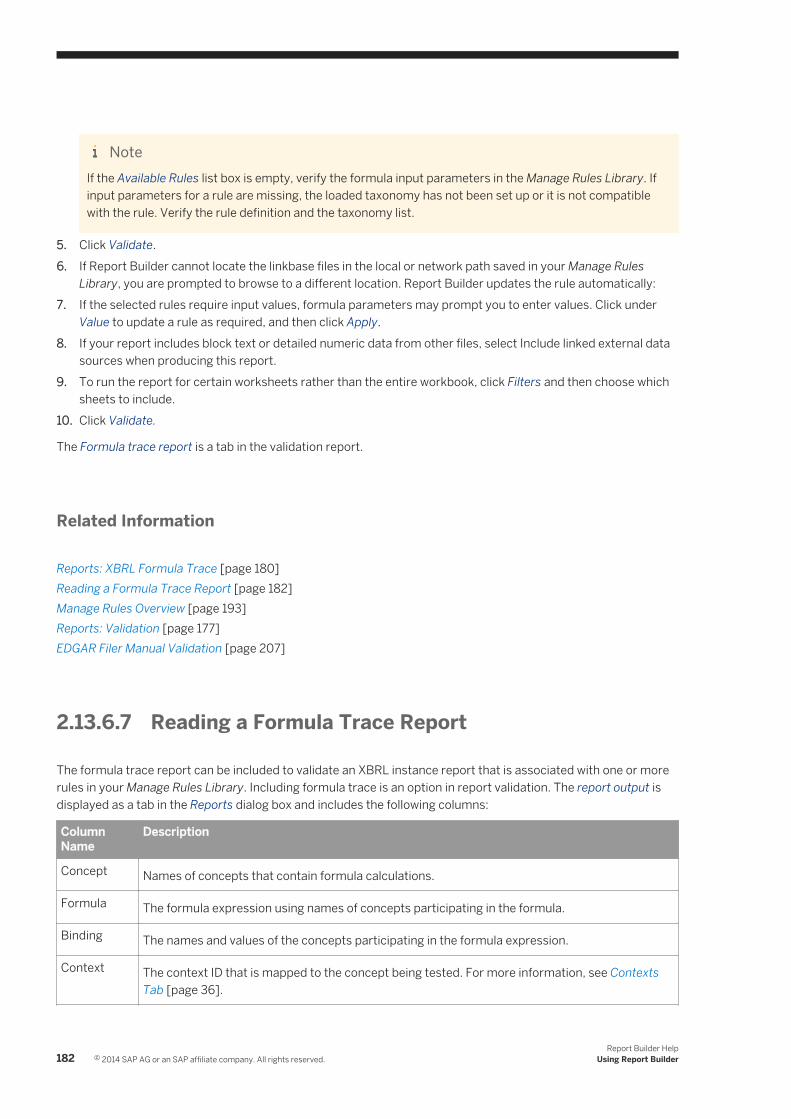
NoteIf the Available Rules list box is empty, verify the formula input parameters in the Manage Rules Library. If input parameters for a rule are missing, the loaded taxonomy has not been set up or it is not compatible with the rule. Verify the rule definition and the taxonomy list.
5. Click Validate.6. If Report Builder cannot locate the linkbase files in the local or network path saved in your Manage Rules
Library, you are prompted to browse to a different location. Report Builder updates the rule automatically:7. If the selected rules require input values, formula parameters may prompt you to enter values. Click under
Value to update a rule as required, and then click Apply.8. If your report includes block text or detailed numeric data from other files, select Include linked external data
sources when producing this report.9. To run the report for certain worksheets rather than the entire workbook, click Filters and then choose which
sheets to include.10. Click Validate.
The Formula trace report is a tab in the validation report.
Related Information
Reports: XBRL Formula Trace [page 180]Reading a Formula Trace Report [page 182]Manage Rules Overview [page 193]Reports: Validation [page 177]EDGAR Filer Manual Validation [page 207]
2.13.6.7 Reading a Formula Trace Report
The formula trace report can be included to validate an XBRL instance report that is associated with one or more rules in your Manage Rules Library. Including formula trace is an option in report validation. The report output is displayed as a tab in the Reports dialog box and includes the following columns:
Column Name
Description
Concept Names of concepts that contain formula calculations.
Formula The formula expression using names of concepts participating in the formula.
Binding The names and values of the concepts participating in the formula expression.
Context The context ID that is mapped to the concept being tested. For more information, see Contexts Tab [page 36].
182 © 2014 SAP AG or an SAP affiliate company. All rights reserved.Report Builder Help
Using Report Builder
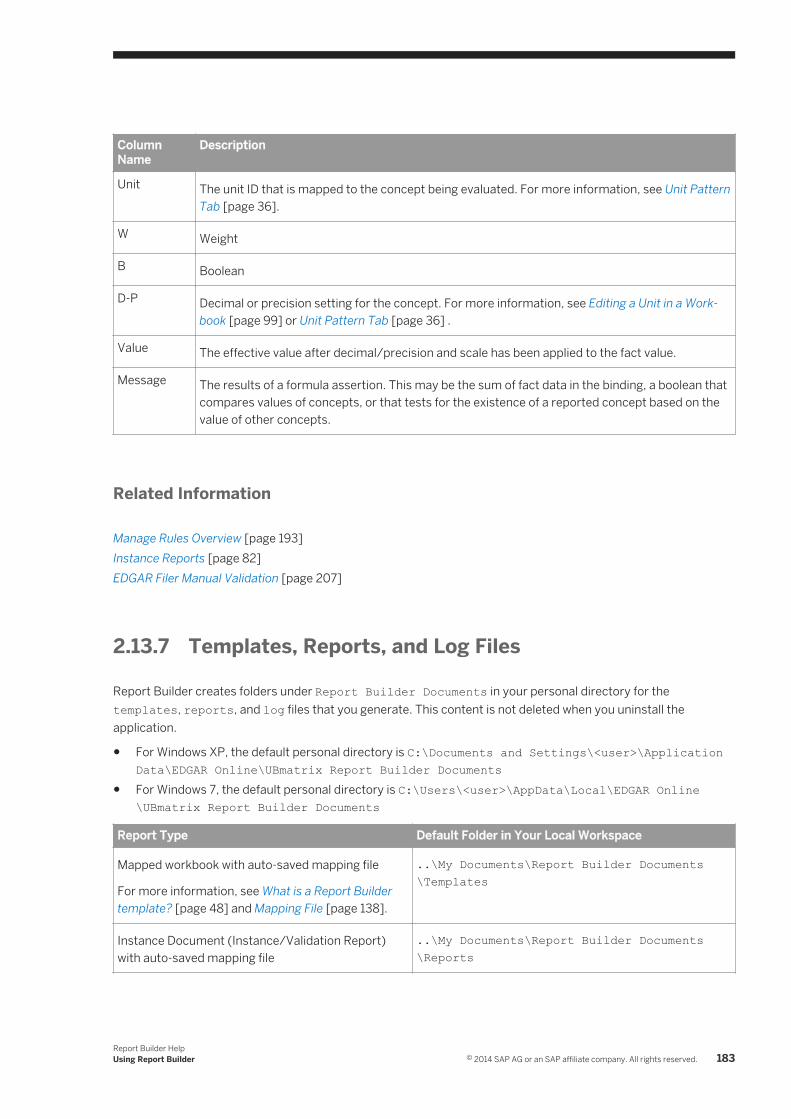
Column Name
Description
Unit The unit ID that is mapped to the concept being evaluated. For more information, see Unit Pattern Tab [page 36].
W Weight
B Boolean
D-P Decimal or precision setting for the concept. For more information, see Editing a Unit in a Workbook [page 99] or Unit Pattern Tab [page 36] .
Value The effective value after decimal/precision and scale has been applied to the fact value.
Message The results of a formula assertion. This may be the sum of fact data in the binding, a boolean that compares values of concepts, or that tests for the existence of a reported concept based on the value of other concepts.
Related Information
Manage Rules Overview [page 193]Instance Reports [page 82]EDGAR Filer Manual Validation [page 207]
2.13.7 Templates, Reports, and Log Files
Report Builder creates folders under Report Builder Documents in your personal directory for the templates, reports, and log files that you generate. This content is not deleted when you uninstall the application.
● For Windows XP, the default personal directory is C:\Documents and Settings\<user>\Application Data\EDGAR Online\UBmatrix Report Builder Documents
● For Windows 7, the default personal directory is C:\Users\<user>\AppData\Local\EDGAR Online\UBmatrix Report Builder Documents
Report Type Default Folder in Your Local Workspace
Mapped workbook with auto-saved mapping file
For more information, see What is a Report Builder template? [page 48] and Mapping File [page 138].
..\My Documents\Report Builder Documents\Templates
Instance Document (Instance/Validation Report) with auto-saved mapping file
..\My Documents\Report Builder Documents\Reports
Report Builder HelpUsing Report Builder © 2014 SAP AG or an SAP affiliate company. All rights reserved. 183

Report Type Default Folder in Your Local Workspace
For more information, see Preview an XBRL Instance Document [page 175].
Trace Report (Run Calculation option)
For more information, see Reports: Calculation Trace [page 178].
..\My Documents\Report Builder Documents\Reports
Errors in an XBRL Validation Report
For more information, see Report Validation [page 176].
..\My Documents\Report Builder Documents\Reports
Logs
For more information, see Logs [page 188].
..\My Documents\Report Builder Documents\Logs
NoteThe default location for Taxonomy path and Instance path is the C:\ drive. To change the default taxonomy path, see the Setup Setup tab in Preferences Settings.
In a multi-user installation, or if you cannot enable read/write access for the C:\drive using User Account Control (UAC), open the Setup tab of Preferences Settings to change the default taxonomy and instance file locations. For more information about UAC, see User Account Control (UAC) Settings [page 63].
After you have saved an instance, workbook, or report, Report Builder defaults to the last folder that was saved to as the default folder location for opening, loading, or saving any Report Builder file.
The auto-save mapping file is saved to the last specified folder location referenced in Report Builder. The first time you save a workbook that has mapping information, the auto-saved mapping file is updated in the original workbook folder location; saving or closing the workbook in the new location does not auto-generate a mapping file.
To configure the default folder locations for saving taxonomies and instance documents, see Setup [page 53] and Web Caching [page 59].
Related Information
Network Settings [page 57]Work Offline [page 58]
2.13.8 Save XBRL Instance Documents and Reports
When saving an XBRL instance, inline XBRL document, or other report, Report Builder extracts fact values and metadata from the mapped workbook that identify the taxonomy, references to the Microsoft Excel location (worksheet and cell), and the contextual information (entity, reporting period) for each reported fact.
184 © 2014 SAP AG or an SAP affiliate company. All rights reserved.Report Builder Help
Using Report Builder
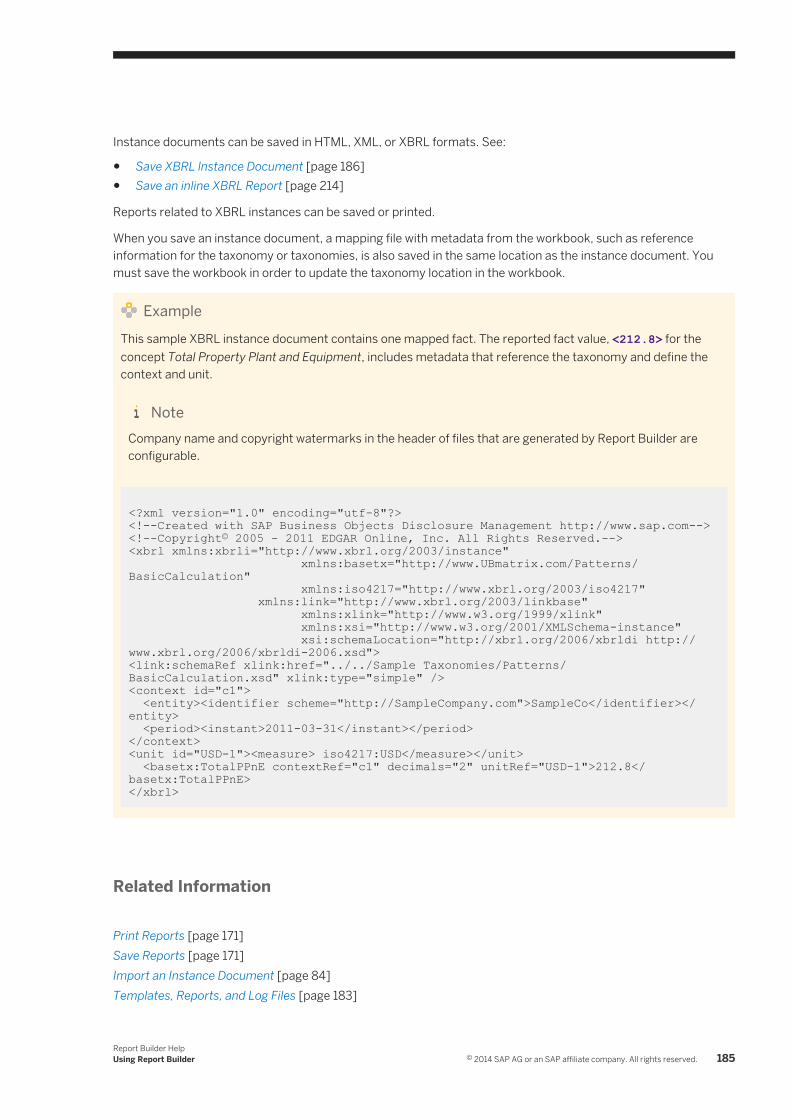
Instance documents can be saved in HTML, XML, or XBRL formats. See:
● Save XBRL lnstance Document [page 186]● Save an inline XBRL Report [page 214]
Reports related to XBRL instances can be saved or printed.
When you save an instance document, a mapping file with metadata from the workbook, such as reference information for the taxonomy or taxonomies, is also saved in the same location as the instance document. You must save the workbook in order to update the taxonomy location in the workbook.
ExampleThis sample XBRL instance document contains one mapped fact. The reported fact value, <212.8> for the concept Total Property Plant and Equipment, includes metadata that reference the taxonomy and define the context and unit.
NoteCompany name and copyright watermarks in the header of files that are generated by Report Builder are configurable.
<?xml version="1.0" encoding="utf-8"?><!--Created with SAP Business Objects Disclosure Management http://www.sap.com--><!--Copyright© 2005 - 2011 EDGAR Online, Inc. All Rights Reserved.--><xbrl xmlns:xbrli="http://www.xbrl.org/2003/instance" xmlns:basetx="http://www.UBmatrix.com/Patterns/BasicCalculation" xmlns:iso4217="http://www.xbrl.org/2003/iso4217" xmlns:link="http://www.xbrl.org/2003/linkbase" xmlns:xlink="http://www.w3.org/1999/xlink" xmlns:xsi="http://www.w3.org/2001/XMLSchema-instance" xsi:schemaLocation="http://xbrl.org/2006/xbrldi http://www.xbrl.org/2006/xbrldi-2006.xsd"><link:schemaRef xlink:href="../../Sample Taxonomies/Patterns/BasicCalculation.xsd" xlink:type="simple" /><context id="c1"> <entity><identifier scheme="http://SampleCompany.com">SampleCo</identifier></entity> <period><instant>2011-03-31</instant></period></context><unit id="USD-1"><measure> iso4217:USD</measure></unit> <basetx:TotalPPnE contextRef="c1" decimals="2" unitRef="USD-1">212.8</basetx:TotalPPnE></xbrl>
Related Information
Print Reports [page 171]Save Reports [page 171]Import an Instance Document [page 84]Templates, Reports, and Log Files [page 183]
Report Builder HelpUsing Report Builder © 2014 SAP AG or an SAP affiliate company. All rights reserved. 185

2.13.8.1 Save XBRL lnstance Document
It is good practice to validate the reported data and preview the instance document prior to saving it for submission. For more information, see Report Validation [page 176] and Preview an XBRL Instance Document [page 175].
The business data (facts) in a Report Builder template can be saved as an XBRL instance document with either an XBRL or XML file extension.
NoteWhen you save an instance report, you must identify the taxonomy that was used to generate the instance by including a relative or absolute path, a server location, or a URI reference. When the instance report is opened, the taxonomy must be available from the saved location in order to view, extract, or validate the XBRL data in the instance document. If you have associated more than one taxonomy with the workbook, they must all be available.
1. From the UBmatrix Reports menu, click Save.2. Under Save As Xbrl, click the option for the XBRL content you want to include in the XBRL instance document:
○ To save a report using mapped data in the workbook, click Data in the Excel Template.○ To include concept data mapped in external data sources, click Data in the Excel Template + Linked
External Sources.3. Report Builder may display a verification message for including externally linked data. To suppress this
verification message, select the check box and click OK.4. Click OK.5. On the Save File to dialog box:
○ To save the report to your local file system, click File System.○ For some installations, reports can be saved to a server location. Ensure that you are logged onto the
sever.6. Optionally, click File name and, in the drop-down list, select a file name.7. Optionally, click the Save as type and, in the drop-down list, select a file extension.8. Click Save.9. Verify or set the taxonomy path:
a) For a locally stored taxonomy, click and, on the Select Taxonomy path dialog box, browse to the XBRL schema file for the taxonomy.
b) Optionally, click File name and in the drop-down list, select a taxonomy schema.c) Click Open.
10. Click OK to save the XBRL instance document.
Related Information
Link to an External Data Source [page 169]Reports [page 170]
186 © 2014 SAP AG or an SAP affiliate company. All rights reserved.Report Builder Help
Using Report Builder

Import an Instance Document [page 84]
2.13.8.2 Save an XBRL Formula Trace as an Instance Document
XBRL formulas may change values of data in an XBRL instance. Report Builder supports saving a Formula Trace report as an XBRL instance document.
1. Click the drop-down arrow on the Save button, and then select Save Instance Document in the drop down list.
2. In the Save File to dialog box, click an option to select file system or server, then click , and browse to the location where you want to save the file.
3. Click More and do one of the following to specify the taxonomy schema file for this report.
a) To browse to the taxonomy schema file (.xsd) on the local file system, click .b) Enter the relative path and taxonomy file name.c) Enter the HTTP address for the taxonomy schema.d) Click OK.
The XBRL instance includes a schemaRef to the taxonomy, and the schema location is also saved in the metadata of the current workbook.
Check regulatory requirements for taxonomy references; many require a relative path from the XBRL instance to the taxonomy schema.
Related Information
Manage Rules Overview [page 193]Instance Reports [page 82]EDGAR Filer Manual Validation [page 207]XBRL Formulas [page 203]
2.13.8.3 Save a Report Builder Template
When you have validated mappings, save the mapped workbook before distributing the Report Builder template to other users.
1. In the Excel menu, click File Save As .2. In the Save As dialog box, enter the file name and in Save as type select Template .3. Click Save to save the workbook as a template (.xlt) file.
You may want to protect the workbook as a Report Builder template. For more information, see Protecting a Report Builder Template [page 18].
Report Builder HelpUsing Report Builder © 2014 SAP AG or an SAP affiliate company. All rights reserved. 187

2.13.9 Logs
Report Builder automatically generates a message log if there are load issues related to mappings or reported facts. The logs detail the discrepancies between concepts associated with facts reported in an imported instance document or mapped in the workbook and those discovered in the taxonomy.
When you save a message log, Report Builder automatically generates a Logs folder under Report, Trace, and Log files. If a log file already exists in the Logs folder, it is overwritten.
For more details, click a log record below:
Log Purpose
Log: Fact with Missing Concept in the Taxonomy [page 188]
Enumerates fact data in an imported instance document for concepts or relationships that do not exist in the referenced/loaded taxonomy.
Logs: Messages [page 191] Enumerates errors encountered when a taxonomy cannot load properly or does not exist in the expected location. One or more files in the taxonomy or referenced by the taxonomy cannot be located, is corrupt, or has been changed.
Example
Related Information
Templates, Reports, and Log Files [page 183]Save Reports [page 171]
2.13.9.1 Log: Fact with Missing Concept in the Taxonomy
The Fact with Missing Concept in the taxonomy log lists facts whose XBRL metadata (concept name, concept label, period type, unit type, period type or reference) either differs from or is not defined in the taxonomy that was loaded.
This log has two formats:
● XBRL facts that are mapped in the workbook● XBRL facts in an imported XBRL instance whose definition is not valid
188 © 2014 SAP AG or an SAP affiliate company. All rights reserved.Report Builder Help
Using Report Builder

XBRL facts that are mapped in the workbook
If this log appears when you open a mapped workbook, mapped facts refer to a taxonomy concept or context whose definition differs from the taxonomy that was loaded. These errors can often be corrected by verifying the location of the taxonomy.
Alternatively, verify the definitions of the concepts and contexts.
The Fact with Missing Concept in the taxonomy log shows the following columns:
● Label: Label for a mapped taxonomy concept. Label is based on the label role set in User Preferences.● Contex: Context identifier (Context ID) for the context definition.● Unit: Unit identifier (Unit ID) for the unit definition (only used for numeric concepts).● Reference: Worksheet and cell location for a fact.● Value: Contents or value of the concept referenced by the label.● Taxonomy: Uniform resource identifier (URI) reference for the taxonomy schema that contains the concept
definition.
Sort the fact records by clicking any column header.
Click To do this
Delete Delete the selected records so that the workbook contains only the valid facts from the instance document.
If you choose this option, the deleted facts will not exist in the workbook; be sure to save the new instance with a different name or in a different location. Although an XBRL instance document is typically saved as a read-only file, you do not want to inadvertently overwrite the original instance data.
Save Save the log. The default location for the log is: C:\Documents and Settings\...\My Docu-ments\Report Builder Documents\Logs\ErrorLog.xml
Print Print the log.
Close Keep the mappings and fact data in the current workbook. Choose this option if the discrepancies for the mapped facts can be corrected by using Report Builder features to synchronize context or unit definitions or taxonomy references with the taxonomy. Invalid mappings may corrupt a Report Builder template, so to avoid losing any valid mappings, save the workbook or mappings report with a different file name.
Resolving Attributes for Facts with Missing Concepts
Report Builder performs integrity checks when loading a taxonomy associated with a mapped workbook, imported instance document, or mappings report. The integrity checks compare the XBRL metadata and cell mappings in the external data to the definitions in the taxonomy being loaded.
This report can pinpoint contexts and taxonomy references that conflict with the currently loaded taxonomy or DTS. It may be the location of the referenced taxonomy or the preferred taxonomy label role has changed.
The report and the following procedure can be used to troubleshoot the taxonomy and to synchronize the workbook mappings with the taxonomy.
Report Builder HelpUsing Report Builder © 2014 SAP AG or an SAP affiliate company. All rights reserved. 189

For more information, see Troubleshooting the Taxonomy and Synchronizing the Eorkbook with the Taxonomy [page 190].
XBRL facts in an imported XBRL instance whose definitions are not valid
When importing an instance document, Report Builder does not import a fact whose value cannot be read or whose XBRL metadata cannot be resolved or is inconsistent with the taxonomy. Items listed in red cannot be imported.
The Fact with Missing Concept in the taxonomy log for an imported instance shows the following columns:
● Label: Label for a mapped taxonomy concept. Label is based on the label role set in User Preferences.● Contexts [page 86]: Context identifier (Context ID) for the context definition.● Defining a Unit Pattern [page 95]: Unit identifier (Unit ID) for the unit definition (only used for numeric
concepts).● Value: Contents or value of the concept referenced by the label.
Sort the fact records by clicking any column header.
Click To do this
Save Save the log. The default location for the log is: C:\Documents and Settings\...\My Docu-ments\Report Builder Documents\Logs\ErrorLog.xml
Print Print the log.
Close Keep the mappings and fact data in the current workbook. Choose this option if the discrepancies for the mapped facts can be corrected by using Report Builder features to synchronize context or unit definitions or taxonomy references with the taxonomy. Invalid mappings may corrupt a Report Builder template, so to avoid losing any valid mappings, save the workbook or mappings report with a different file name
Related Information
Logs: Messages [page 191]Load Taxonomy Overview [page 66]Considerations when Importing a Mappings Report [page 137]Importing an XBRL Instance Document [page 83]
2.13.9.2 Troubleshooting the Taxonomy and Synchronizing the Eorkbook with the Taxonomy
1. Click Save to save the Fact with Missing Concept report, then click Close to keep the mappings in the workbook.
190 © 2014 SAP AG or an SAP affiliate company. All rights reserved.Report Builder Help
Using Report Builder

2. Use Report Builder features to verify and validate the currently loaded taxonomy:a) In the UBmatrix menu, click File Properties to verify the location of the taxonomy.
b) In the Report Builder toolbar, click to open the taxonomy hierarchy view, then click the Taxonomy
Validation tab and click to validate the taxonomy.c) Use Instance Editor tab to review the context and unit definitions match the concept attributes.
3. Edit the mappings for the reference cells in this logs:a) In the In the taxonomy details pane, use the Search tab to verify that each concept exists.b) Use the Element Details tab to review the attributes for each concept.c) Use Instance Editor tab to review the context and unit definitions match the concept attributes.d) Use the palette to review, edit, or update the context and unit definitions.
4. For mappings that cannot be resolved, right-click the cell(s), and in the context menu click Delete Mappings to remove them.
5. For resolved mappings, recreate concept, context, and unit mappings using the worksheet and cell from the Reference column in this log.
Related Information
About Palette [page 35]Taxonomy Validation Tab [page 35]File Properties [page 19]
2.13.9.3 Logs: Messages
When a mapped workbook is opened or an XBRL instance is imported, Report Builder loads the taxonomy associated with the workbook or imported instance. Built-in integrity checks verify that each mapped fact corresponds to a concept element in the loaded taxonomy or DTS.
If any concept, context, unit, or taxonomy reference is not valid, Report Builder automatically logs the load errors in a Messages dialog box.
Use the details in the messages to identify the cause of a load the error. If a concept was not found in the taxonomy or DTS verify the location of the taxonomy or the concepts defined in the taxonomy. The Messages log can be compared with content in the Fact with Missing Concept log to help resolve errors.
Click this To do this
Save Save the report in a local directory. The default location for this log file is:
..\My Documents\Report Builder Documents\Logs\<name>.log
Print Print the Messages log.
Report Builder HelpUsing Report Builder © 2014 SAP AG or an SAP affiliate company. All rights reserved. 191
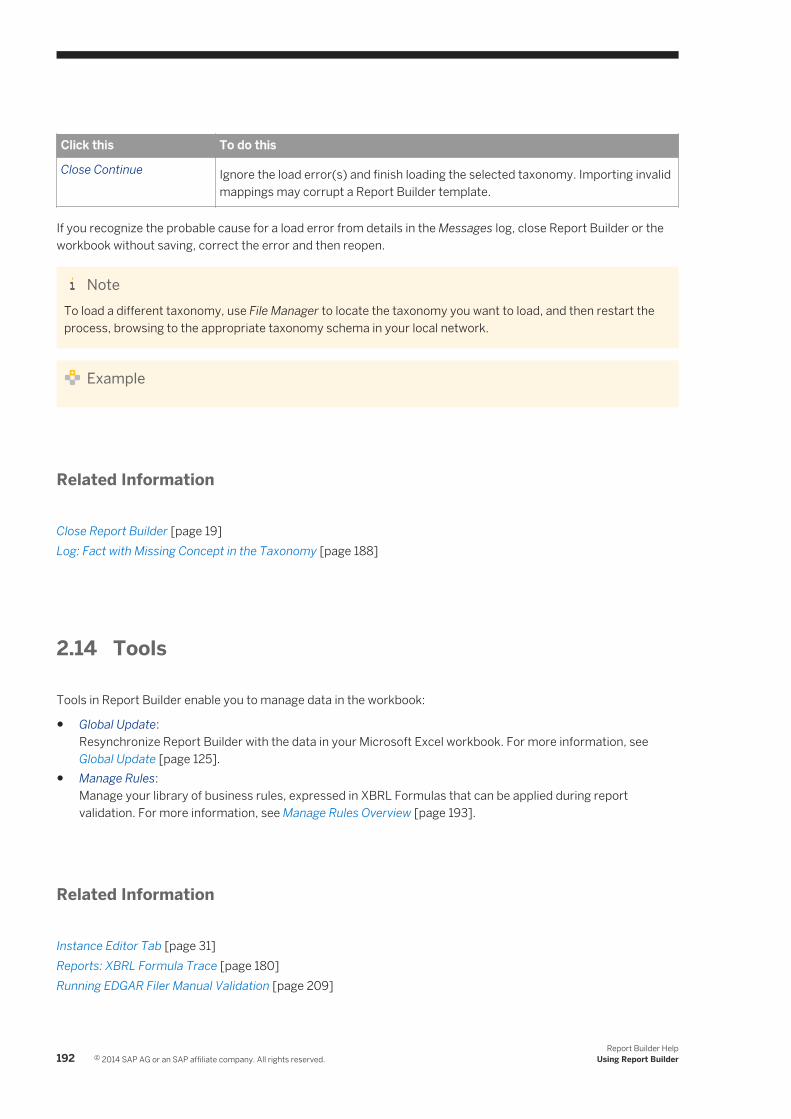
Click this To do this
Close Continue Ignore the load error(s) and finish loading the selected taxonomy. Importing invalid mappings may corrupt a Report Builder template.
If you recognize the probable cause for a load error from details in the Messages log, close Report Builder or the workbook without saving, correct the error and then reopen.
NoteTo load a different taxonomy, use File Manager to locate the taxonomy you want to load, and then restart the process, browsing to the appropriate taxonomy schema in your local network.
Example
Related Information
Close Report Builder [page 19]Log: Fact with Missing Concept in the Taxonomy [page 188]
2.14 Tools
Tools in Report Builder enable you to manage data in the workbook:
● Global Update:Resynchronize Report Builder with the data in your Microsoft Excel workbook. For more information, see Global Update [page 125].
● Manage Rules:Manage your library of business rules, expressed in XBRL Formulas that can be applied during report validation. For more information, see Manage Rules Overview [page 193].
Related Information
Instance Editor Tab [page 31]Reports: XBRL Formula Trace [page 180]Running EDGAR Filer Manual Validation [page 209]
192 © 2014 SAP AG or an SAP affiliate company. All rights reserved.Report Builder Help
Using Report Builder

2.14.1 Manage Rules Overview
Managing rules enables you to catalog the business rules that are included in an XBRL formula trace during report validation. Report Builder handles the technical aspects of XBRL and displays compatible rules automatically, enabling you to select those you want to include.
Validation rules for a large public taxonomy that are written as XBRL formulas are typically organized in formula linkbases that are associated with particular nodes in the taxonomy. Elements or values in a report can trigger assertions that invoke additional formula linkbases, with dependencies that only the taxonomy designer and formula writer can understand. The taxonomy schema may contain XBRL formula definitions that run automatically.
Manage Rules helps you establish and test a workflow for financial reporting, devise and share checklists for disclosures, set and review default values for required input parameters. Use taxonomy type to associate rule names with the applicable compatible taxonomies. You can create and run variations of rules without losing the original settings.
Your Report Builder installation includes several public XBRL taxonomies and related XBRL formulas with predefined settings. These taxonomies and formulas are already available in your Manage Rules Library.
NoteIf your Report Builder installation includes EDGAR Filer Manual Validation, the input parameters for the EDGAR Filer Manual Validation rule set must be configured prior to running Report Validation.
Your taxonomy designer may have additional or customized settings for the business rules that you want to enforce for or provide additional information about, transform, or extend XBRL instance document validation. Rules for evaluating, parsing, or transforming financial data can be defined using XBRL formulas and added to the Manage Rules Library.
You can add rules that support financial reporting disclosure checklists, set default values for required input parameters for the current workbook, and change input values when you run Report Validation [page 176]. See Formula Input Parameters [page 201].
You can generate a set of use cases by saving the same XBRL formula linkbase file or folder with different combinations of input parameters. Rule Names enable you to validate financial data from different reports using the same rules and input parameters.
Related Information
XBRL Formulas [page 203]Report Validation [page 176]XBRL Formulas [page 203]Manage Rules Library [page 194]Manage Rules FAQ [page 205]Adding a Rule [page 199]
Report Builder HelpUsing Report Builder © 2014 SAP AG or an SAP affiliate company. All rights reserved. 193
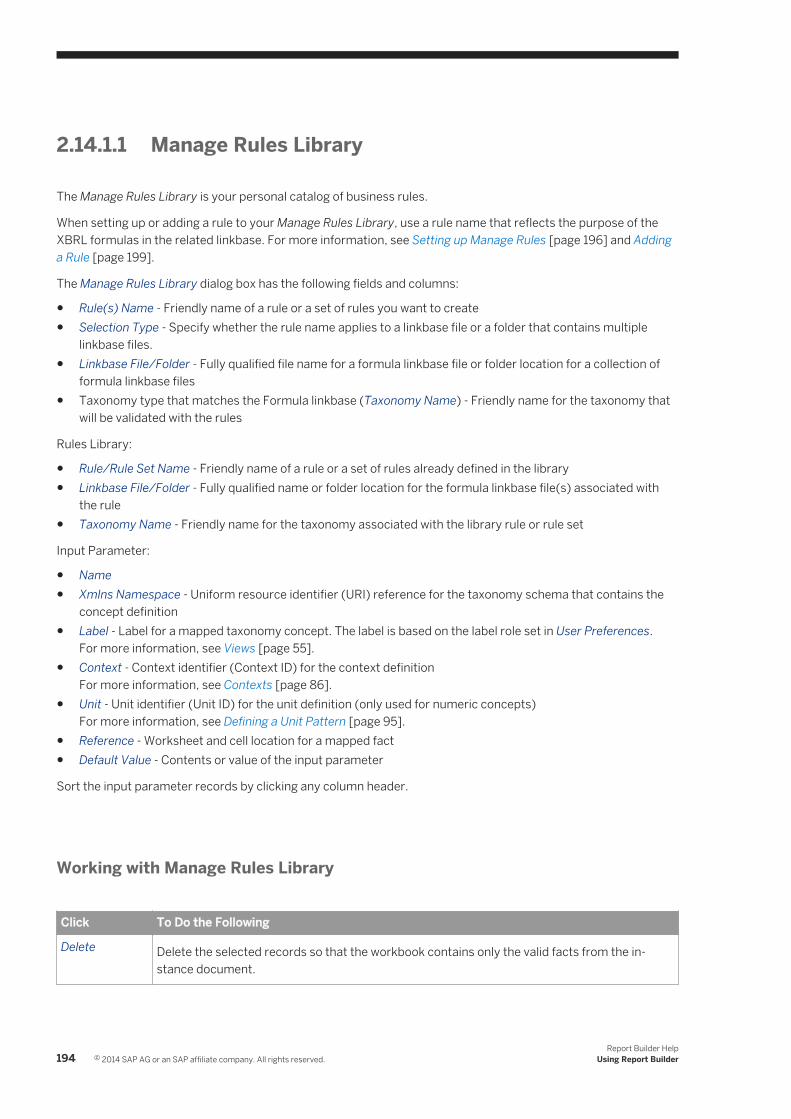
2.14.1.1 Manage Rules Library
The Manage Rules Library is your personal catalog of business rules.
When setting up or adding a rule to your Manage Rules Library, use a rule name that reflects the purpose of the XBRL formulas in the related linkbase. For more information, see Setting up Manage Rules [page 196] and Adding a Rule [page 199].
The Manage Rules Library dialog box has the following fields and columns:
● Rule(s) Name - Friendly name of a rule or a set of rules you want to create● Selection Type - Specify whether the rule name applies to a linkbase file or a folder that contains multiple
linkbase files.● Linkbase File/Folder - Fully qualified file name for a formula linkbase file or folder location for a collection of
formula linkbase files● Taxonomy type that matches the Formula linkbase (Taxonomy Name) - Friendly name for the taxonomy that
will be validated with the rules
Rules Library:
● Rule/Rule Set Name - Friendly name of a rule or a set of rules already defined in the library● Linkbase File/Folder - Fully qualified name or folder location for the formula linkbase file(s) associated with
the rule● Taxonomy Name - Friendly name for the taxonomy associated with the library rule or rule set
Input Parameter:
● Name● Xmlns Namespace - Uniform resource identifier (URI) reference for the taxonomy schema that contains the
concept definition● Label - Label for a mapped taxonomy concept. The label is based on the label role set in User Preferences.
For more information, see Views [page 55].● Context - Context identifier (Context ID) for the context definition
For more information, see Contexts [page 86].● Unit - Unit identifier (Unit ID) for the unit definition (only used for numeric concepts)
For more information, see Defining a Unit Pattern [page 95].● Reference - Worksheet and cell location for a mapped fact● Default Value - Contents or value of the input parameter
Sort the input parameter records by clicking any column header.
Working with Manage Rules Library
Click To Do the Following
Delete Delete the selected records so that the workbook contains only the valid facts from the instance document.
194 © 2014 SAP AG or an SAP affiliate company. All rights reserved.Report Builder Help
Using Report Builder
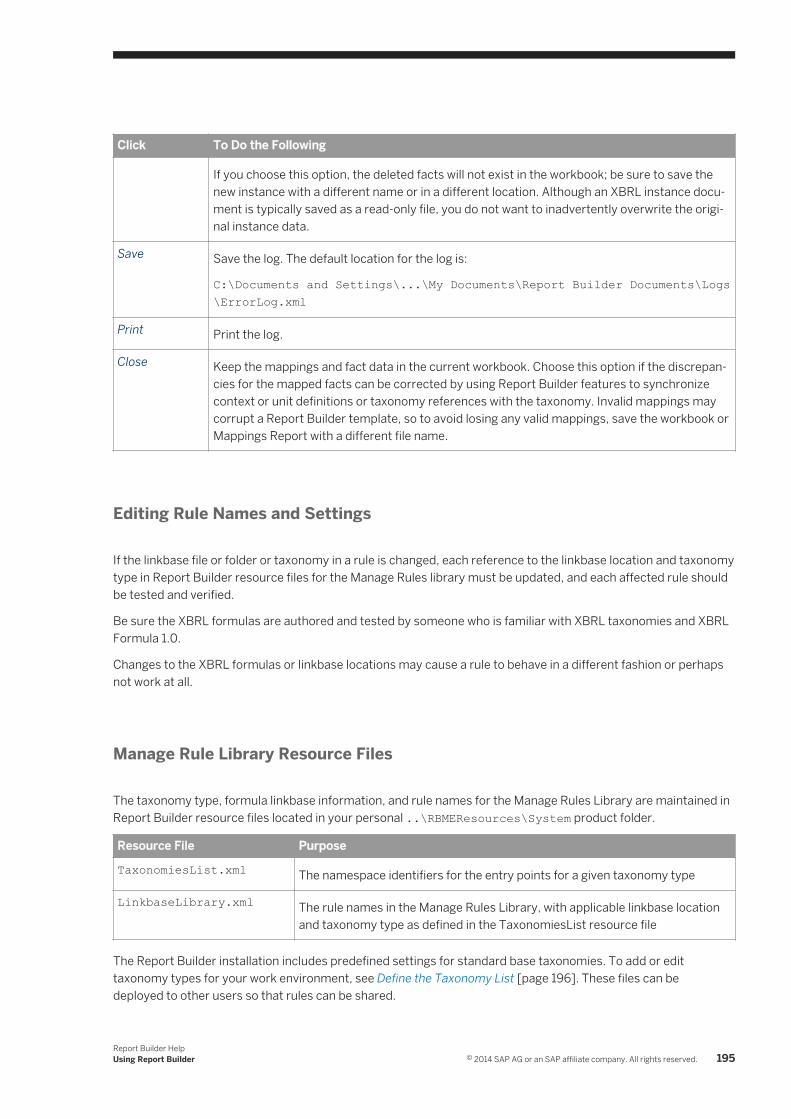
Click To Do the Following
If you choose this option, the deleted facts will not exist in the workbook; be sure to save the new instance with a different name or in a different location. Although an XBRL instance document is typically saved as a read-only file, you do not want to inadvertently overwrite the original instance data.
Save Save the log. The default location for the log is:
C:\Documents and Settings\...\My Documents\Report Builder Documents\Logs\ErrorLog.xml
Print Print the log.
Close Keep the mappings and fact data in the current workbook. Choose this option if the discrepancies for the mapped facts can be corrected by using Report Builder features to synchronize context or unit definitions or taxonomy references with the taxonomy. Invalid mappings may corrupt a Report Builder template, so to avoid losing any valid mappings, save the workbook or Mappings Report with a different file name.
Editing Rule Names and Settings
If the linkbase file or folder or taxonomy in a rule is changed, each reference to the linkbase location and taxonomy type in Report Builder resource files for the Manage Rules library must be updated, and each affected rule should be tested and verified.
Be sure the XBRL formulas are authored and tested by someone who is familiar with XBRL taxonomies and XBRL Formula 1.0.
Changes to the XBRL formulas or linkbase locations may cause a rule to behave in a different fashion or perhaps not work at all.
Manage Rule Library Resource Files
The taxonomy type, formula linkbase information, and rule names for the Manage Rules Library are maintained in Report Builder resource files located in your personal ..\RBMEResources\System product folder.
Resource File Purpose
TaxonomiesList.xml The namespace identifiers for the entry points for a given taxonomy type
LinkbaseLibrary.xml The rule names in the Manage Rules Library, with applicable linkbase location and taxonomy type as defined in the TaxonomiesList resource file
The Report Builder installation includes predefined settings for standard base taxonomies. To add or edit taxonomy types for your work environment, see Define the Taxonomy List [page 196]. These files can be deployed to other users so that rules can be shared.
Report Builder HelpUsing Report Builder © 2014 SAP AG or an SAP affiliate company. All rights reserved. 195

Related Information
Sharing a Manage Rules Library [page 203]Setting up Manage Rules [page 196]Manage Rules Overview [page 193]Adding a Rule [page 199]
2.14.1.2 Setting up Manage Rules
Rules in your Manage Rules Library need to be tied to the taxonomies that define the concepts used in the formula expressions, which may be defined in a formula linkbase and attached to the taxonomy.
Managing the filenames, URIs, and schema references for formula linkbases and taxonomies can be difficult. Typically, a formula linkbase is authored for use with a particular XBRL taxonomy or taxonomy group, so the taxonomy and formula authors may be the only informed users of a rule set.
The Manage Rules Library enables you to catalog the rules (formula linkbase or folder) for a taxonomy, and Report Builder displays the available rules when a Formula Trace Report is included in a validation report. The rules that you have associated with the taxonomy are automatically available to include in a Include XBRL Formula Trace [page 181]. The taxonomy itself may contain additional rules that are run automatically.
The recommended sequence for setting up your Manage Rules Library are:
● Define the Taxonomy List [page 196]● Adding a Rule [page 199]● Formula Input Parameters [page 201]● Using a Managed Rule [page 202]● Sharing a Manage Rules Library [page 203]
NoteWhen adding to your Manage Rules Library, check with your taxonomy developer or XBRL administrator to confirm which formula linkbases can be used with a taxonomy type.
Related Information
Manage Rules Library [page 194]Manage Rules FAQ [page 205]
2.14.1.3 Define the Taxonomy List
Report Builder is delivered with a Manage Rules Library. This library is a catalog of business rules written in XBRL Formula 1.0 for validating XBRL instance reports, based on the taxonomy or taxonomies loaded. Because
196 © 2014 SAP AG or an SAP affiliate company. All rights reserved.Report Builder Help
Using Report Builder
business rules are written for a particular taxonomy, the library is pre-populated with standard business rules that are catalogued by friendly names. A secondary filter identifies which rules to show you based on the referenced taxonomies.
When running report validation, Report Builder shows the rules available in the Manage Rules Library based on the target namespace URIs, or entry point schema documents referenced in the loaded taxonomy. You can select which rules you want to include with XBRL formula trace. For more information, see Include XBRL Formula Trace [page 181].
Two resource files, LinkbaseLibrary.xml and TaxonomyList.xml, associate formula linkbase files or folders with the friendly name for the taxonomies. A resource file in your user directory, ..\RBMEResources\System\TaxonomiesList.xml, itemizes the target namespace URIs for the taxonomy types that can be associated with the rules in the LinkbaseLibrary cataloged in the Manage Rules Library. As rules are added to the library, or as taxonomies evolve, the taxonomy list needs to be updated.
Report Builder users can add, edit, or remove taxonomy types in the Manage Rules Library by adding or editing the target namespaces and entry point schemas in the taxonomiesList.xml file. This resource file can also be shared with other users.
In the taxonomiesList.xml, a taxonomy and its entry points are defined by nested XML elements:
● taxonomy - the container for XML attributes for a taxonomy● taxonomyType - the friendly taxonomy name displayed in Report Builder● taxonomyList - container for the taxonomyNamespaces for the taxonomyType● taxonomyNamespace - the entry point URIs associated with the taxonomyType
The following procedures show how to add or remove taxonomies from the Manage Rules Library:
● Adding or Modifying Taxonomies (Example) [page 197]● Removing Taxonomies (Example) [page 198]
NoteIf business rules are defined in the taxonomy, they run automatically as part of report validation.
Related Information
Manage Rules Library [page 194]EDGAR Filer Manual Validation [page 207]
2.14.1.3.1 Adding or Modifying Taxonomies (Example)
This example copies the US_GAAP 2009 taxonomy to create a library entry for the US_GAAP 2010 taxonomy.
NoteAsk your taxonomy developer or XBRL administrator which taxonomy namespaces you need to include for your taxonomies list.
Report Builder HelpUsing Report Builder © 2014 SAP AG or an SAP affiliate company. All rights reserved. 197

1. Identify the taxonomy URIs that you want to include for the new taxonomy type US_GAAP 2010.You can collect these from header content in XBRL instance documents or taxonomies that you want to work with.
2. In a text editor, create entries for each new taxonomy URI in taxonomyNamespace XML tags.
For example, the first three URIs can be saved as:
<taxonomyNamespace>http://xbrl.us/us-gaap/2009-01-31</taxonomyNamespace><taxonomyNamespace>http://xbrl.us/us-gaap-std/2009-01-31</taxonomyNamespace> <taxonomyNamespace>http://xbrl.us/dei/2009-01-31</taxonomyNamespace>
3. Open ..\RBMEResources\System\TaxonomiesList.xml in a text editor and select a taxonomy element.
<taxonomy> <taxonomyType>US_GAAP 2009</taxonomyType> <taxonomyList> <taxonomyNamespace>http://xbrl.us/us-gaap/2009-01-31</taxonomyNamespace> <taxonomyNamespace>http://xbrl.us/us-gaap-std/2009-01-31</taxonomyNamespace> <taxonomyNamespace>http://xbrl.us/dei/2009-01-31</taxonomyNamespace> </taxonomyList></taxonomy>
4. Copy the selected content, change the "friendly name" taxonomyType and then replace the taxonomyNamespace elements in the taxonomyList tag set with content created in step 2.
<taxonomy> <taxonomyType>US_GAAP 2010</taxonomyType> <taxonomyList> <taxonomyNamespace>http://xbrl.us/us-gaap/2009-01-31</taxonomyNamespace> <taxonomyNamespace>http://xbrl.us/us-gaap-std/2009-01-31</taxonomyNamespace> <taxonomyNamespace>http://xbrl.us/dei/2009-01-31</taxonomyNamespace> </taxonomyList></taxonomy>
5. Save the TaxonomiesList.xml file.
6. Open Microsoft Excel and load an extension taxonomy for a US GAAP 2010 submission.7. In the Tools menu, click Manage Rules.
The taxonomy types that are compatible with the currently loaded taxonomy or extension taxonomy display in the Manage Rules Library window, and the available rules appear in the Rules Library grid.
Related Information
Manage Rules Library [page 194]EDGAR Filer Manual Validation [page 207]
2.14.1.3.2 Removing Taxonomies (Example)
You can remove a taxonomy or taxonomyNamespace from the list of available taxonomies. This example removes CEBS FINREP 2006 from the taxonomy list in the Manage Rules Library window.
198 © 2014 SAP AG or an SAP affiliate company. All rights reserved.Report Builder Help
Using Report Builder

NoteYou can add or remove taxonomyNamespaces from a taxonomyList, or comment out the entry points you want to exclude, but each taxonomyType container must have at least one taxonomyNamespace.
1. Open TaxonomiesList.xml in a text editor.
2. Highlight the taxonomy element or taxonomyNamespace element you want to remove.
<taxonomy> <taxonomyType>finrep 2006</taxonomyType> <taxonomyList> <taxonomyNamespace>http://www.c-ebs.org/eu/fr/esrs/finrep/t-FINREP/2006-09-30</taxonomyNamespace> <taxonomyNamespace>http://www.c-ebs.org/eu/fr/esrs/finrep/p-FINREP/2006-09-30</taxonomyNamespace> </taxonomyList></taxonomy>
3. Delete the taxonomy element and save your changes.4. Restart Microsoft Excel.5. On the UBmatrix tab in the Tools group, click Manage Rules and verify CEBS FINREP 2006 is no longer
available in the Manage Rules Library window.
Related Information
Manage Rules Library [page 194]EDGAR Filer Manual Validation [page 207]
2.14.1.4 Adding a Rule
To add a rule that requires a new taxonomy type, update the Define the Taxonomy List [page 196] before adding the rule to your Rules Library.
Your Rules Library catalogs rules that are defined in formula linkbases. Typically, a formula linkbase is associated with a particular taxonomy or taxonomy type. Your taxonomy developer or XBRL administrator can identify whether a formula linkbase can be used with the taxonomy types in your Rules Library.
You can add rules that apply to the current taxonomy.
This procedure adds a rule for the USGAAP 2008 taxonomy type to support an EDGAR 10-K filing.
1. Launch Microsoft Excel and then load the sample mapped workbook 10-Q Statements (Mapped).xlsx from ..\Tutorials\SEC Filer\Template
2. Report Builder displays the loaded USGAAP taxonomy in the default Presentation view.3. On the UBmatrix Tools tab, click Manage Rules.4. On the Manage Rules Library dialog box, enter a Rule Name and, for Selection Type, select:
○ File to create a rule that applies to a single XBRL formula linkbase.
Report Builder HelpUsing Report Builder © 2014 SAP AG or an SAP affiliate company. All rights reserved. 199

○ Folder to create a rule that applies to linkbase files in aspecified folder.5. Click Browse.6. Do one of the following:
○ For a file, on the Open dialog box, browse to a formula linkbase file that you want to add as a rule, select it, and then click Open.
○ For a folder, on the Browse For Folder dialog box, browse to a formula linkbase folder that you want to add as a rule, select it, and then click OK.
7. On the Manage Rules Library dialog box, in Taxonomy type that matches the XBRL formula linkbases list, select one or more taxonomy types to associate with the linkbase file or folder. If the taxonomy type you want to use is not in the list, Define the Taxonomy List [page 196] and then restart this procedure.
8. Verify the Rule Name, Linkbase File, and Taxonomy Type are correct, and then click Add Rule.9. If you selected more than one taxonomy type for the rule, an entry for each selected taxonomy type is added
to your Rules Library. In the above example, the EFM for US GAAP 2008 rule has associated the US_GAAP 2008 taxonomy with the linkbase folder containing EDGAR Filing Manual Validation formulas.
10. In the Rules Library list, click the new rule. Under Input Parameters, the input parameters and default values defined in the formulas display. To set default values for the current session, see Formula Input Parameters [page 201].To use the rule in report validation, see Include XBRL Formula Trace [page 181].
Related Information
Manage Rules Library [page 194]Sharing a Manage Rules Library [page 203]Report Validation [page 176]
2.14.1.5 Deleting a Rule
You can delete rules at any time. To delete a rule or rule set
1. Click the check box to the left of the rule(s) you want to delete.2. Click Delete Selection.
Related Information
Manage Rules Library [page 194]Sharing a Manage Rules Library [page 203]Report Validation [page 176]
200 © 2014 SAP AG or an SAP affiliate company. All rights reserved.Report Builder Help
Using Report Builder

2.14.1.6 Formula Input Parameters
XBRL formulas can be authored so that default values are supplied for required input parameters with the expectation actual values will be supplied during Validation. Often, defaults are "dummy values" with a format that permits validation to complete, such as limit, date range, fact value, format or heading for output, or a condition that triggers calculations in the formula.
Formula input parameters can be set in several places:
● Default values may be XBRL Formulas [page 203] that is part of the taxonomy or attached to the taxonomy. The taxonomy designer can provide details.
● You can define input parameter values in the Manage Rules Library [page 194] to override defaults defined in a formula linkbase that is part of the taxonomy or that is in your rules library. These input parameter settings are effective for the current session and current workbook.
● You can Report Validation [page 176]. Report Validation input parameters override the input parameters specified in your Manage Rules Library and in the formula linkbase. These input parameter settings are effective for report validation in the current workbook in the current session of Report Builder.
Related Information
Adding a Rule [page 199]Using a Managed Rule [page 202]Reports: XBRL Formula Trace [page 180]
2.14.1.7 Specifying Input Parameters for Report Validation
1. In the Reports menu, click Validate.2. On the Report Validation dialog box, click Include XBRL Formula Trace and clear Use default rule parameters
where possible.3. Click the rules you want to run, and then click Validate.4. Report Builder displays the current formula input parameters for the selected rule(s). Change a value by
clicking the Value cell.5. Click Apply to run the formula with the currently displayed values.
Related Information
Formula Input Parameters [page 201]Adding a Rule [page 199]Using a Managed Rule [page 202]Reports: XBRL Formula Trace [page 180]
Report Builder HelpUsing Report Builder © 2014 SAP AG or an SAP affiliate company. All rights reserved. 201

2.14.1.8 Using a Managed Rule
The rules in your Manage Rules Library can be used to validate an XBRL instance document by including an Reports: XBRL Formula Trace [page 180] during report validation.
This example assumes that the Report Builder EDGAR Filer Manual Validation [page 207] rules have been set up for the USGAAP references in the taxonomy:
This example uses rules from the EDGAR Filer Support [page 206] that are implemented as XBRL formula and included in the Report Builder Manage Rules Library.
The example starts with an unmapped workbook and loads a web-based taxonomy for an EDGAR filing:
● Taxonomy: http://www.sec.gov/Archives/edgar/data/1080224/000119312511064906/edgr-20101231.xsd
The respective input parameters from the SEC web site are:
● cikList: 0001080224● cikNameList: EDGAR ONLINE INC● submissionType: 10-K
1. Launch Microsoft Excel and open the sample unmapped workbook.2. Load a web-based taxonomy. For this exercise, use http://www.sec.gov/Archives/edgar/data/
1080224/000119312511064906/edgr-20101231.xsd3. When the taxonomy has loaded, save the workbook.4. Map a concept. For this exercise, map Total, Property, Plant and Equipment5. Verify that the Manage Rule Library has been set up to accommodate the taxonomy namespaces in the
EDGAR filing.a) Click Manage Rules to verify that the rules and default values have been set up.b) If none appear, refer to the prerequisites.
6. On the Reports menu, click Validate.7. In the Report Validation dialog box, select Include XBRL Formula Trace and in the list of Available Rules click to
select EDGAR Filer Manual Validation.8. Click to clear Use default rule parameters where possible; this enables you to edit input parameters for the
formula.9. Click Validate.10. Report Builder prompts you to provide input parameters; default parameters, if defined for the rule, display in
Value column. Click each row and replace the formula parameter values:a) cikList: 0001080224b) cikNameList: EDGAR ONLINE INCc) submissionType: 10-K
11. Click Apply.To reset entity default values in your application, see Preferences Settings (User Preferences) [page 52], Instance [page 79].
The Reports window shows validation output. The Formula tab displays the summary and detail for a full trace report.
For more information, see Reading a Formula Trace Report [page 182].
202 © 2014 SAP AG or an SAP affiliate company. All rights reserved.Report Builder Help
Using Report Builder

Related Information
Setting up Manage Rules [page 196]Sharing a Manage Rules Library [page 203]Report Validation [page 176]
2.14.1.9 Sharing a Manage Rules Library
When you uninstall Report Builder, the additions and changes you make to the Manage Rules Library remain in your personal user directory.
1. Copy the Report Builder files from your personal user files ..\RBMEResources\System\TaxonomiesList.xml and ..\RBMEResources\System\LinkbaseLibrary.xml from your machine to the same directory location on the recipient user's machine .
2. Verify that the linkbaseAddress file paths in the LinkbaseLibrary.xml on the recipient user's machine are correct and available to the recipient. For each linkbaseAddress:
a) Copy the referenced files or folders that are located on your hard drive to the same relative path on recipient user's machine.
b) For files or folders on network locations (mapped network drives or server shares), verify that the recipient has access.
c) As necessary, update the path specified in the linkbaseAddress of the recipient's file to the network location or copied file or folder.
3. On the recipient's computer, start Microsoft Excel and, in the Tools group, click Manage Rules to set initial formula input parameters for the new rules.
Related Information
Manage Rules Library [page 194]Customize Your Report Builder Workspace [page 50]Manage Rules Overview [page 193]Setting up Manage Rules [page 196]Manage Rules FAQ [page 205]
2.14.1.10 XBRL Formulas
The XBRL standard for writing business rules that evaluate XBRL taxonomies and XBRL instances is Formula Specification1.0. XBRL formulas facilitate business analysis and forecasting by assessing reported data in if-then-else Xpath expressions that support boolean, string, numeric, and monetary data types.
Typically, XBRL formulas are designed for a specific taxonomy and are authored by the taxonomy designer. Formulas can be defined in the taxonomy, or in a formula linkbase that is associated with a taxonomy.
Report Builder HelpUsing Report Builder © 2014 SAP AG or an SAP affiliate company. All rights reserved. 203
In Report Builder, XBRL formula linkbases can be organized by taxonomy type and saved in your personal Manage Rules Overview [page 193]. Default values for Formula Input Parameters [page 201] can be defined in the Manage Rules Library and can be overridden when running an Reports: XBRL Formula Trace [page 180]. See Include XBRL Formula Trace [page 181].
NoteReport Builder is delivered with predefined taxonomy types, rules, and sample formulas. See Manage Rules Library [page 194].
Related Information
Identifying Taxonomy Concepts in a Formula [page 204]Report Validation [page 176]Reports: XBRL Formula Trace [page 180]Manage Rules Overview [page 193]
2.14.1.11 Identifying Taxonomy Concepts in a Formula
If the taxonomy contains formula definitions that you want to use in report validation, you can add them as rules in your Manage Rules Library.
To find which taxonomy concepts participate in a formula:
1. Open the Presentation view, the Instance Editor, in the details pane, and then right-click and click Update to populate the Instance Editor.
2. Total Property, Plant and Equipment, has a fact value and is mapped in the workbook.3. Open the Schema View [page 25]: The concept <IsValidCalculation> has a Boolean data type. This
concept is not defined in the Presentation or Calculation views, and therefore is not mappable. Total Property, Plant and Equipment, is also shown in the Schema view, suggesting that it part of a formula definition. These two elements suggest that the taxonomy contains a formula definition to evaluate the calculation rollup for Total Property, Plant and Equipment
Related Information
Report Validation [page 176]Reports: XBRL Formula Trace [page 180]Manage Rules Overview [page 193]
204 © 2014 SAP AG or an SAP affiliate company. All rights reserved.Report Builder Help
Using Report Builder
2.14.1.12 Manage Rules FAQ
Common questions about XBRL Formula implementation in the Report Builder Manage Rules Library [page 194] are answered below.
● Can I edit or create new formulas for my Rule Library? Report Builder does not support formula creation or editing. Business rules should be implemented by the taxonomy author who is familiar with the relationships in the base and extension taxonomies. See XBRL Formulas [page 203].Formula linkbase definitions require a working knowledge of coding languages such as Java, COBOL, HTML, and XBRL Formula. The formula linkbases for EDGAR filer manual validation also use XSLT and Xpath 2.0 expressions as well as built-in functions from the embedded Processing Engine.
● What is the difference between a rule and a formula? A rule or rule set is business logic used to validate business data.A formula is an XBRL expression in an XBRL taxonomy or linkbase that can evaluate, test, or measure data to satisfy a business rule. In Report Builder, the Manage Rules Library makes it possible to attach a formula linkbase to the current taxonomy to evaluate reported facts. An attached linkbase is not part of the original taxonomy, but can be used to obtain information about the elements.
● How are the rules in my Rule Library used in reports? In the Manage Rules Library, a formula linkbase defines rules that are asserted in an Reports: XBRL Formula Trace [page 180]. The formulas can be written to test for consistency, for existence, or for value range for a reported fact in an instance document. Facts can be simple, in which case their values must be expressed as simple content (except in the case of simple facts whose values are expressed as a ratio), and facts can be compound, in which case their value is made up from other simple and/or compound facts. Simple facts are expressed using items (and are referred to as items in this specification) and compound facts are expressed using tuples (and are referred to as tuples in this specification). Some examples of formula assertions are:
○ Consistency Assertion: Reported item matches computed item: Assets = Ending balance. An item is an element in the substitution group for the XBRL item element. It contains the value of the simple fact and a reference to the context (and, for numeric items, unit) needed to correctly interpret that fact.
○ Existence Assertion: Total assets is reported. Correct entityis reports. No fact is reported outside of cutoff date. An entity is a business entity, the subject of XBRL items. Where the [XML]/[SGML] concept of syntactic "entity" is meant, this will be pointed out.
○ Value Assertion: Ratio is greater than minimum (for example, interest cover ratio >2.5%), cash balance is positive.
● How can I differentiate the formulas in my rules from those defined in the loaded taxonomy?The rules in your Rules Library that are compatible with the currently loaded taxonomy are available when you select Include XBRL Formula Trace on Report Validation. You can select the rules that you want to run. If formulas are embedded in the loaded taxonomy, they are always run in a formula trace. If you run a formula trace report without any Manage Rules; the Formula report will contain the results of the formula that are embedded in the loaded taxonomy.
Report Builder HelpUsing Report Builder © 2014 SAP AG or an SAP affiliate company. All rights reserved. 205
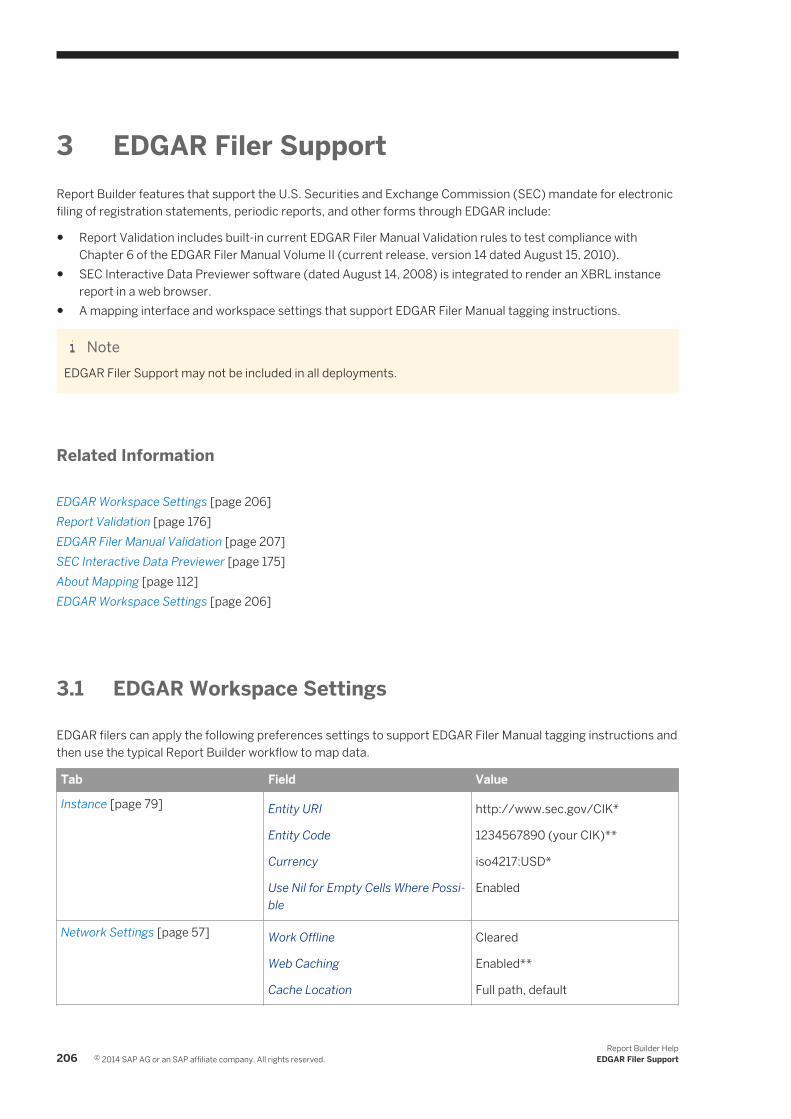
3 EDGAR Filer Support Report Builder features that support the U.S. Securities and Exchange Commission (SEC) mandate for electronic filing of registration statements, periodic reports, and other forms through EDGAR include:
● Report Validation includes built-in current EDGAR Filer Manual Validation rules to test compliance with Chapter 6 of the EDGAR Filer Manual Volume II (current release, version 14 dated August 15, 2010).
● SEC Interactive Data Previewer software (dated August 14, 2008) is integrated to render an XBRL instance report in a web browser.
● A mapping interface and workspace settings that support EDGAR Filer Manual tagging instructions.
NoteEDGAR Filer Support may not be included in all deployments.
Related Information
EDGAR Workspace Settings [page 206]Report Validation [page 176]EDGAR Filer Manual Validation [page 207]SEC Interactive Data Previewer [page 175]About Mapping [page 112]EDGAR Workspace Settings [page 206]
3.1 EDGAR Workspace Settings
EDGAR filers can apply the following preferences settings to support EDGAR Filer Manual tagging instructions and then use the typical Report Builder workflow to map data.
Tab Field Value
Instance [page 79] Entity URI
Entity Code
Currency
Use Nil for Empty Cells Where Possible
http://www.sec.gov/CIK*
1234567890 (your CIK)**
iso4217:USD*
Enabled
Network Settings [page 57] Work Offline
Web Caching
Cache Location
Cleared
Enabled**
Full path, default
206 © 2014 SAP AG or an SAP affiliate company. All rights reserved.Report Builder Help
EDGAR Filer Support

Tab Field Value
Setup [page 53] Encoding
Decimals
ASCII*
2*
Real Time Settings [page 64] Synchronization
Show Tooltip (Context and Unit)
Enabled
Enabled
Views [page 55] Language
Label Role
en-US*
Standard Label*
User Environment [page 54] Taxonomy Colors
Mapping Colors
Use default colors
Use default colors
* EDGAR Filer Manual requirement
** Mapped workbooks, XBRL instance documents, or iXBRL reports that reference a US GAAP or IFRS taxonomy can be validated using the embedded EDGAR Filer Manual Validation software and previewed in the embedded SEC Interactive Data Previewer.
When mapping a large taxonomy, see Filter View settings for helpful suggestions to limit the number of concepts you are working with or to search for specific content. For more information, see Customize Your Report Builder Workspace [page 50].
Related Information
Organize your Mapping Project [page 116]Exploring Report Builder [page 13]What is a Report Builder template? [page 48]Preferences Settings (User Preferences) [page 52]Running EDGAR Filer Manual Validation [page 209]SEC Interactive Data Previewer [page 175]
3.2 EDGAR Filer Manual Validation
The EDGAR filing process requires that electronic filings to the SEC be validated prior to submission. In support of this requirement, Report Builder implemented an automated electronic financial review checklist for Interactive Data Exhibit 100 (attachment type EX-100) and Exhibit 101 (attachment type EX-101).
EDGAR Filer Manual Validation is a Report Builder installation option; for installations that include this option, the financial review checklist is viewable as rule set in the Manage Rules Library. The EDGAR Filer Manual Validation Report is an available rule in an XBRL Formula Trace for an instance report that references an SEC Standard Taxonomy.
Report Builder HelpEDGAR Filer Support © 2014 SAP AG or an SAP affiliate company. All rights reserved. 207

The EDGAR Filer Manual Validation Report evaluates reported data to ensure that an XBRL submission is consistent with EDGAR Filer Manual Validation rules. The report output can be a summary of tests that passed or failed, or a detailed report that itemizes each test that was run, with a hyperlinked reference to the applicable section of EDGAR Filer Manual (Chapter 6), a satisfied/not satisfied result, and a descriptive message about the parameters being tested.
The report can be run repeatedly and the output can be saved in HTML or print format.
For details about running the report, see Running EDGAR Filer Manual Validation [page 209].
Related Information
Reading an EDGAR Filer Manual Validation Report [page 210]SEC Interactive Data Previewer [page 175]Link to an External Data Source [page 169]Manage Rules Library [page 194]
3.3 Setting EDGAR Filer Manual Validation Input Parameters
Before running Report Validation, set the EDGAR Filer Manual Validation input parameters.
In Report Builder, the EDGAR Filer Manual Validation rule is predefined for the US GAAP 2009 taxonomy type. This procedure shows how to set the default values in this managed rule to reflect the current filing.
NoteFor a different taxonomy type, see Adding a Rule [page 199].
1. In the Tools group, click Manage Rules.2. In the Manage Rules Library dialog box, under Rules Library, click EDGAR Filer Manual Validation.
Under Input Parameters, the input parameters for the predefined rule appear.3. Under Default Value, click each entry to set the parameter for this session:
○ cikList: Entity CIK for the instance data in the current workbook○ cikNameList: Registered company name for the instance data in the current workbook○ submissionType: SEC form number for this submission
4. Click Close.
The input parameters you provide are valid for the current session of Report Builder and can be overridden when running EDGAR Filer Manual Validation. For more information, see Formula Input Parameters [page 201].
Related Information
Running EDGAR Filer Manual Validation [page 209]
208 © 2014 SAP AG or an SAP affiliate company. All rights reserved.Report Builder Help
EDGAR Filer Support
Reading an EDGAR Filer Manual Validation Report [page 210]
3.4 Running EDGAR Filer Manual Validation
Before running EDGAR filer manual validation, set the input parameters. For more information, see Setting EDGAR Filer Manual Validation Input Parameters [page 208].
This procedure generates a validation report for a mapped workbook or an imported instance document that references the US GAAP taxonomy.
EDGAR filer manual validation rules are automatically available in report validation for any file that references a US GAAP taxonomy.
NoteThis procedure uses a mapped workbook and the USGAAP extension taxonomy located in the samples folder ..\Tutorial s\SEC Filer.
1. Start Microsoft Excel.2. Open a mapped workbook, Report Builder template, or imported instance that references a US GAAP
taxonomy.3. In the Reports group, click Validate.4. In the Report Validation dialog box, select Include XBRL Formula Trace.5. Select Summary Level Report or Full Report.6. In the Available Rules list box, click EDGAR Filer Manual Validation, or, optionally, click Select All. In this
example, there is only a single rule set, so both options are selected.
NoteIf the Available Rules list box is unavailable, open Manage Rules Library and click EDGAR Filer Manual Validation Rules Library in the list box. Set the Input Parameters and continue this procedure. If your rules library does not contain EDGAR Filer Manual or if the related input parameters do not appear, then either the current taxonomy has not been set up or is not compatible with a US GAAP taxonomy type.
7. Do one of the following:
○ If the formula input parameters have been set to the required CIK criteria for the report and submission type , select Use default rule parameters where possible.
○ If you need to change (or want to verify) the formula input parameters, clear Use default rule parameters where possible.
8. If the report references block text or detailed numeric data mapped in other files, select Include linked external data sources when producing this report.
9. Click Validate.If the Use default rule parameters where possible option is not selected or if the preconfigured formula parameters cause an error, Report Builder requests them. The EDGAR filer manual validation input parameters override default input parameters you define in the manage rules library.
Report Builder HelpEDGAR Filer Support © 2014 SAP AG or an SAP affiliate company. All rights reserved. 209

10. If you selected to include reported data from an external document, Report Builder issues an informational message. Select the check box to hide future notifications and click OK.
The formula reports and validation reports are displayed as tabs in the Reports dialog box. For sample results, see Reading an EDGAR Filer Manual Validation Report [page 210].
NoteMapped facts can be previewed in the embedded SEC Interactive Data Previewer [page 175].
Related Information
Include XBRL Formula Trace [page 181]Save Reports [page 171]
3.5 Reading an EDGAR Filer Manual Validation Report
An EDGAR Filer Manual Validation report shows either summary or detail results of running tests on the mapped fact data.
Formula Tab
The Formula tab identifies the tests, or rules, from the EDGAR Filer Manual that were run. The detailed report includes a hyperlinked reference to the part of the rule that was satisfied or not satisfied.
Summary Level Report
The summary level report displays counts of the tests that compiled, the number of rules (EDGAR Filer Manual requirements) that were evaluated, tallies of satisfied and unsatisfied requirements in this test case, and the time in milliseconds to run this test suite. The column headings in the report are:
● Tests Compiled: Count of the tests in the EDGAR validation rules (formulas) that completed.● Tests Run: Count of the tests (formulas)that were run for this validation report.● EFM Requirements Satisfied: Count of tests (EDGAR Filer Manual requirements) that passed.● EFM Requirements Not Satisfied: Count of tests (EDGAR Filer Manual requirements) that failed.● Time (ms): Milliseconds to compile all of the tests in this validation.
210 © 2014 SAP AG or an SAP affiliate company. All rights reserved.Report Builder Help
EDGAR Filer Support
Full Report
A full report includes the summary level report, described above, and a Detail test log that references the EDGAR Filer Manual requirement being tested by section and title, together with a message describing the EDGAR filer rule and the fact data or concept that was evaluated to generate the test result.
The Detail section itemizes the EDGAR Filer Manual requirement for each test that was run:
● Test: Hyperlink to the SEC web site for EDGAR Filer Manual and Technical Specifications, with the name of the validation rule (formula) being run and the subsection of the EDGAR Filer Manual being validated.
● Result: Shows whether the EDGAR Filer Manual requirement in the test was satisfied or not satisfied.● Message: Identifies the item in the instance report that caused the result, a description of the rule, and the
subsection of the EDGAR Filer Manual being validated.
Validation Tab
The companion validation report identifies XBRL and XML errors. The report includes the cell reference and context name from the mapped workbook, and the message often includes the fully qualified filename (location in your local file system) where the output report is cached. The message may include the line number in the report where the error occurred. Errors that affect terminate the report cause validation to terminate.
Related Information
Save an XBRL Formula Trace as an Instance Document [page 187]Manage Rules Overview [page 193]Instance Reports [page 82]EDGAR Filer Manual Validation [page 207]Save XBRL Instance Documents and Reports [page 184]
3.6 Preview an EDGAR Filing
Set the preview options. For more information, see Preview Options [page 174].
NotePreview options must be set for a workbook or Report Builder template every time it is opened.
Report Builder includes an SEC Interactive Data Previewer to view an EDGAR or IFRS filing prior to saving as an XBRL instance document. The SEC Interactive Data Previewer is available for Report Builder templates that are mapped with concepts from a DTS that references a US GAAP or IFRS taxonomy.
1. From the Reports menu, click Preview and then click SEC Interactive Data Previewer.
Report Builder HelpEDGAR Filer Support © 2014 SAP AG or an SAP affiliate company. All rights reserved. 211
If reported data is in an external document, Report Builder issues an informational message.2. Select the check box to hide future notifications and click OK to continue.3. In the SEC Format Previewer Setup dialog box, set the preview report headings:
○ Enter the Company Name that you want to display as the title in the instance cocument report preview.○ Select an available Period Ending date from the list box.○ Select the Report Type that you want displayed in the subtitle. Options include Quarterly, Annually, Yearly.○ The default filing date is today's date. To select an earlier Filing Date, click Calendar.
4. Click Preview.The mapped fact data displays on the Instance Document tab of the Reports dialog box.
NoteIf the workbook contains Validation [page 72] errors, or if data from Link to an External Data Source [page 169] is unavailable, parts of the report are available in the preview.
Friendly names for statements (forms and tables) included in the filing appear in a scrollable horizontal menu (in navy blue) above the report title.
5. To preview a statement or form, click the statement in the menu.
○ Reports that reference another document use a Click Here To View hyperlink. To open the report in a secondary window, click the hyperlink.
○ If your filing references a large number of statements, use arrows in the top right to scroll to the list of reported statements and tables.
○ To preview all statements in the current instance, click All Reports at the end of the scrollable menu. Statement or report definitions, if available, display as tooltips.
○ Click Click Here To View to view a text block note in a resizeable pop-up window.
You can save or print the preview output. To return to Report Builder, click Cancel.
Related Information
Save Reports [page 171]Print Reports [page 171]Instance Reports [page 82]SEC Interactive Data Previewer [page 175]
212 © 2014 SAP AG or an SAP affiliate company. All rights reserved.Report Builder Help
EDGAR Filer Support
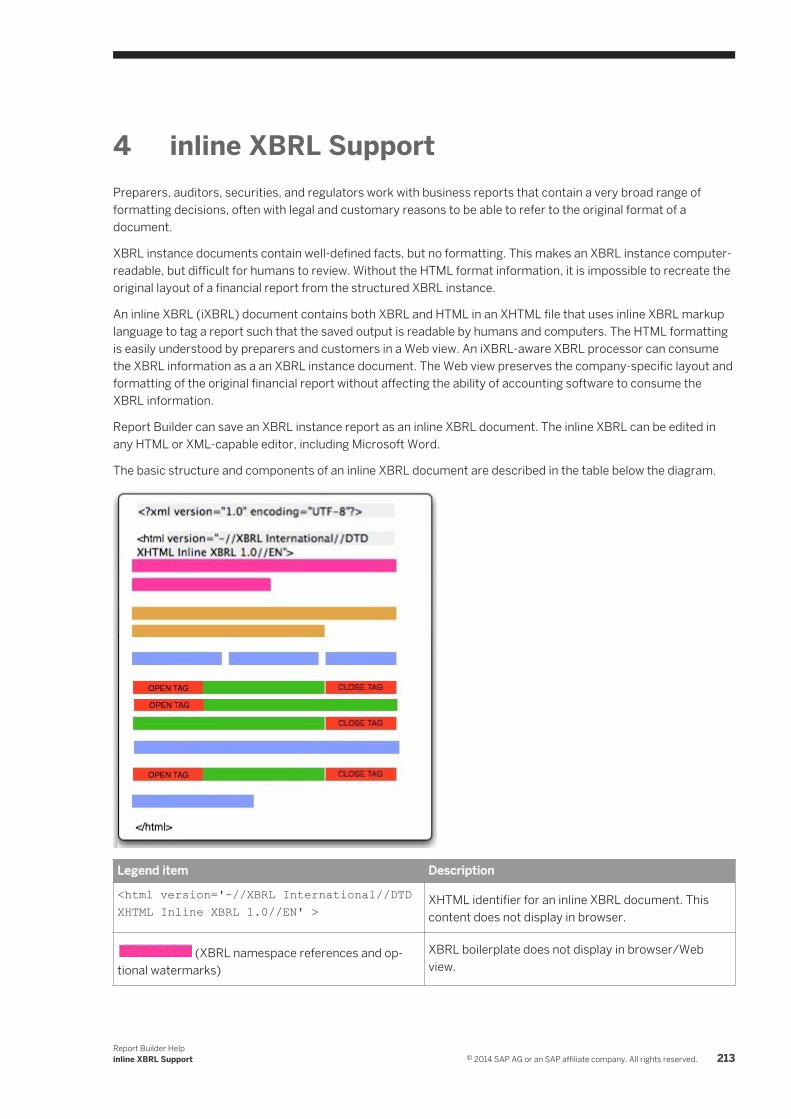
4 inline XBRL Support Preparers, auditors, securities, and regulators work with business reports that contain a very broad range of formatting decisions, often with legal and customary reasons to be able to refer to the original format of a document.
XBRL instance documents contain well-defined facts, but no formatting. This makes an XBRL instance computer-readable, but difficult for humans to review. Without the HTML format information, it is impossible to recreate the original layout of a financial report from the structured XBRL instance.
An inline XBRL (iXBRL) document contains both XBRL and HTML in an XHTML file that uses inline XBRL markup language to tag a report such that the saved output is readable by humans and computers. The HTML formatting is easily understood by preparers and customers in a Web view. An iXBRL-aware XBRL processor can consume the XBRL information as a an XBRL instance document. The Web view preserves the company-specific layout and formatting of the original financial report without affecting the ability of accounting software to consume the XBRL information.
Report Builder can save an XBRL instance report as an inline XBRL document. The inline XBRL can be edited in any HTML or XML-capable editor, including Microsoft Word.
The basic structure and components of an inline XBRL document are described in the table below the diagram.
Legend item Description
<html version='-//XBRL International//DTD XHTML Inline XBRL 1.0//EN' >
XHTML identifier for an inline XBRL document. This content does not display in browser.
(XBRL namespace references and optional watermarks)
XBRL boilerplate does not display in browser/Web view.
Report Builder Helpinline XBRL Support © 2014 SAP AG or an SAP affiliate company. All rights reserved. 213
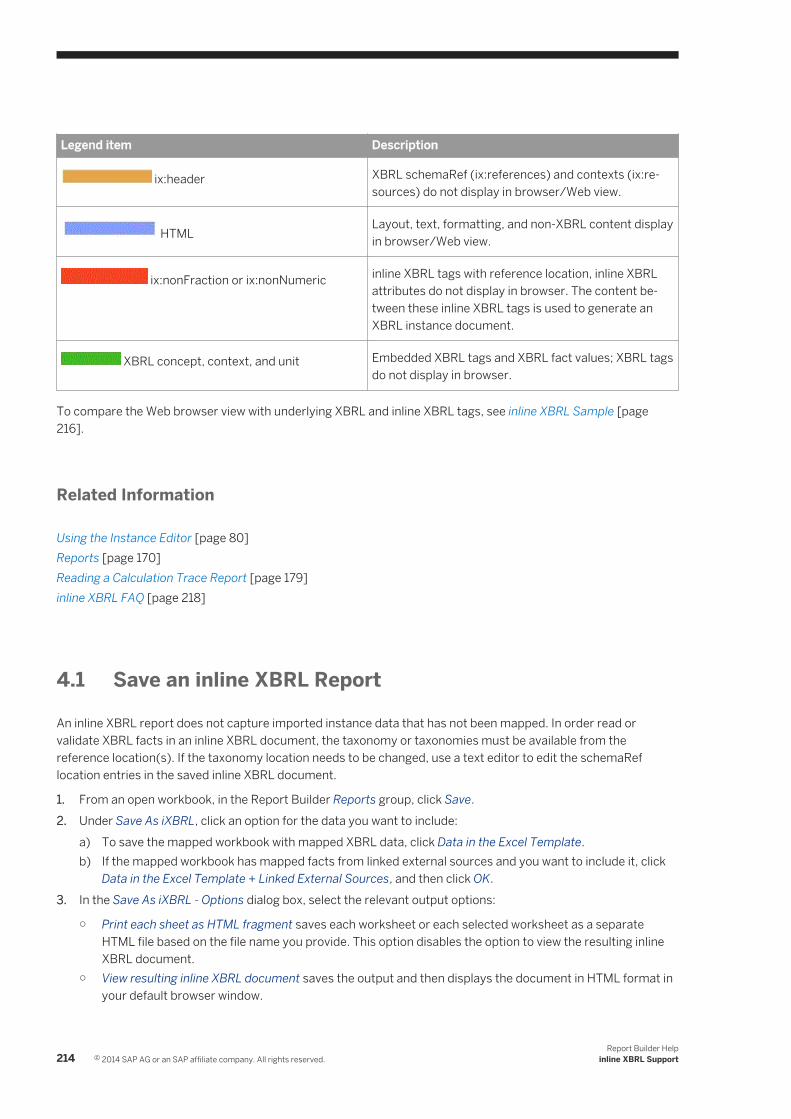
Legend item Description
ix:header XBRL schemaRef (ix:references) and contexts (ix:resources) do not display in browser/Web view.
HTMLLayout, text, formatting, and non-XBRL content display in browser/Web view.
ix:nonFraction or ix:nonNumeric inline XBRL tags with reference location, inline XBRL attributes do not display in browser. The content between these inline XBRL tags is used to generate an XBRL instance document.
XBRL concept, context, and unit Embedded XBRL tags and XBRL fact values; XBRL tags do not display in browser.
To compare the Web browser view with underlying XBRL and inline XBRL tags, see inline XBRL Sample [page 216].
Related Information
Using the Instance Editor [page 80]Reports [page 170]Reading a Calculation Trace Report [page 179]inline XBRL FAQ [page 218]
4.1 Save an inline XBRL Report
An inline XBRL report does not capture imported instance data that has not been mapped. In order read or validate XBRL facts in an inline XBRL document, the taxonomy or taxonomies must be available from the reference location(s). If the taxonomy location needs to be changed, use a text editor to edit the schemaRef location entries in the saved inline XBRL document.
1. From an open workbook, in the Report Builder Reports group, click Save.2. Under Save As iXBRL, click an option for the data you want to include:
a) To save the mapped workbook with mapped XBRL data, click Data in the Excel Template.b) If the mapped workbook has mapped facts from linked external sources and you want to include it, click
Data in the Excel Template + Linked External Sources, and then click OK.3. In the Save As iXBRL - Options dialog box, select the relevant output options:
○ Print each sheet as HTML fragment saves each worksheet or each selected worksheet as a separate HTML file based on the file name you provide. This option disables the option to view the resulting inline XBRL document.
○ View resulting inline XBRL document saves the output and then displays the document in HTML format in your default browser window.
214 © 2014 SAP AG or an SAP affiliate company. All rights reserved.Report Builder Help
inline XBRL Support

○ Show HTML Borders adds the Microsoft Excel cell border spacing and formatting to the HTML output.○ Available Sheets enables you to set reporting options for each worksheet in the current workbook.
○ Include includes the worksheet in the inline XBRL output and display the fact data in the HTML view.○ Hide hides the fact data and exclude the worksheet.○ Exclude omits the worksheet from the inline XBRL output. No content or fact data is included.
○ Select the HTML version for your HTML output. For more information, see inline XBRL FAQ [page 218].
○ Under File name, browse to a folder location in your local network by clicking .
NoteView resulting iXBRL document is disabled if HTML fragments is selected because the fragment files must first be reassembled in order to for the content to be rendered in a browser view.
4. In the Save as iXBRL dialog box, optionally click Browse Folders to expand the folder view, and then browse to a location on your local network.
5. Enter a file name, or click the File name drop-down list and select a file name.6. On the Save As iXBRL dialog box, click Save.7. If HTML fragments were saved, the file names are assigned with a fragment sequence number. For more
information, see HTML Fragments [page 215].8. If View resulting inline XBRL document is selected, the resulting HTML file displays in a browser window, with
individual sheets showing as separate tables. Footnotes display after the last table in the order they were encountered in the workbook.
Related Information
HTML Fragments [page 215]Save XBRL lnstance Document [page 186]inline XBRL Sample [page 216]inline XBRL FAQ [page 218]inline XBRL Support [page 213]
4.2 HTML Fragments
An inline XBRL document is a single HTML file that can be quite lengthy.
When saving fact data as an inline XBRL document, Report Builder provides options to save worksheets separately in files that are HTML fragments. The HTML fragments are blocks of XHTML from the inline XBRL document output. The HTML markups can be edited separately or included in other reports.
These HTML fragments are incomplete and must be reassembled in order to be viewed from a browser or to be consumed or validated. The complete HTML file must be reconstructed with header, fragments, and footer files concatenated into a complete HTML file.
Report Builder Helpinline XBRL Support © 2014 SAP AG or an SAP affiliate company. All rights reserved. 215

When you save an inline XBRL document as HTML fragments, the document is saved as separate HTML file segments:
● Header file contains the XBRL taxonomy boilerplate and contexts.
< CSS stylesheet settings/ >
XBRL schemas, namespace declarations, and taxonomy entry point, contexts and units. Not displayed in the HTML rendering.
● Worksheets are saved as the base file name appended with sequential identifiers "-fragment 1," "-fragment 2," "-fragment 3"One fragment file for each sheet in the workbook. Each file has a complete <div> tag:
<div> Worksheet in HTML with mapped data and XBRL attributes mapped in inline XBRL </div>
● Footer file contains footers and closing HTML tag.Footnotes are collected in the order they are encountered, are added at the end of an inline XBRL document. When the XBRL instance document is created, the footnotes are associated with the fact they were mapped to.The footer contains footnotes and the closing </html> tag:
<div> collection of footnotes, if there are any</div></html>
HTML fragments must be reassembled in sequence in order for the inline XBRL document to be viewable in a browser or parsed as an XBRL instance.
4.3 inline XBRL Sample
An inline XBRL document contains XBRL facts in a Web-based file. The HTML file may contain hidden facts, together with the viewable report.
ExampleThis example compares two inline XBRL facts in the human-readable web view and in the XHTML, or machine-readable XBRL view.
● Web viewIn the Web view of inline XBRL output, the mapped facts are highlighted in green, which is the default color for a fully mapped cell. Mapping colors can be set in the Report Builder User Environment tab.
● Machine-Readable HTMLThe HTML snippets below show the inline XBRL tags with embedded XBRL for the two mapped facts. The raw code suggests how an inline XBRL document may be interpreted by a browser and by an iXBRL parser.
○ The XHTML header (first snippet) identifies inline XBRL references (in bold) and taxonomy namespace references
○ The title <title> inline XBRL Document for IXBRL.html </title> is predefined to identify the filename for the inline XBRL output
○ The inline XBRL resources and XBRL schemaRef information and is formatted as display:none
216 © 2014 SAP AG or an SAP affiliate company. All rights reserved.Report Builder Help
inline XBRL Support

○ Each worksheet is a table within a set of <div> tags○ The table layout identifies formatting for mapped cell background and text○ The inline XBRL tags use style attributes that are interpreted by a browser to hide the embedded XBRL
○ <ix:references> identifies the XBRL schemaRef, or taxonomy for the reported data○ <ix:resources> identifies the XBRL contextual information, such as entity ID (reporting entity)○ <ix:nonFraction> identifies numeric XBRL fact data, reference location, and XBRL attributes
(taxonomy concept, contextRef, unitRef)
<html xmlns='http://www.w3.org/1999/xhtml' xmlns:ix='http://www.xbrl.org/2008/inlineXBRL' xmlns:ixt='http://www.xbrl.org/2008/inlineXBRL/transformation'
xmlns:ci='http://www.UBmatrix.com/Patterns/BasicCalculation' xmlns:ext='http://BasicCalculation.com/extension'... xsi:schemaLocation='http://www.w3.org/1999/xhtml http://www.xbrl.org/2008/inlineXBRL/xhtml-inlinexbrl-1_0.xsd' version='-//XBRL International//DTD XHTML Inline XBRL 1.0//EN' > xsi:schemaLocation="http://www.w3.org/1999/xhtml http://www.xbrl.org/2008/inlineXBRL/xhtml-inlinexbrl-1_0.xsd' version='-//XBRL International//DTD XHTML Inline XBRL 1.0//EN' ><head><title> inline XBRL Document for IXBRL.html </title> <meta name='robots' content='noindex,nofollow' /> <style type="text/css"> (table formatting)</style></head>...<div title='inline XBRL Headers' style='display:none;'> <ix:header> <ix:references> <link:schemaRef xlink:href="../Sample%20Taxonomies/Patterns/Extension/Extension-BasicCalculation.xsd" xlink:type="simple" /> </ix:references> <ix:resources> <context id="Ctx-2009" xmlns="http://www.xbrl.org/2003/instance"> <entity> <identifier scheme="http://www.companieshouse.gov.uk/">.......<div style='page-break-before:always' id='Sheet_NotesAndDisclosures' title='Notes and Disclosures' ><table class='border_all' style='background-color:#FFFFFF;padding:0px;text-align:center;margin-left:auto;margin-right:auto;'> <tr> <td class='border_all' colspan ='4'> <b>Property, Land and Equipment</b>...<tr align="center" class='border_all' > <td class='border_all' style='color:Black;background-color:White;text-align:left;font-family:"helv";font-size:medium;'> <b>Land</b> </td> <td class='border_all style='color:Black;background-color:#CCFFCC;text-align:right;'>
Report Builder Helpinline XBRL Support © 2014 SAP AG or an SAP affiliate company. All rights reserved. 217
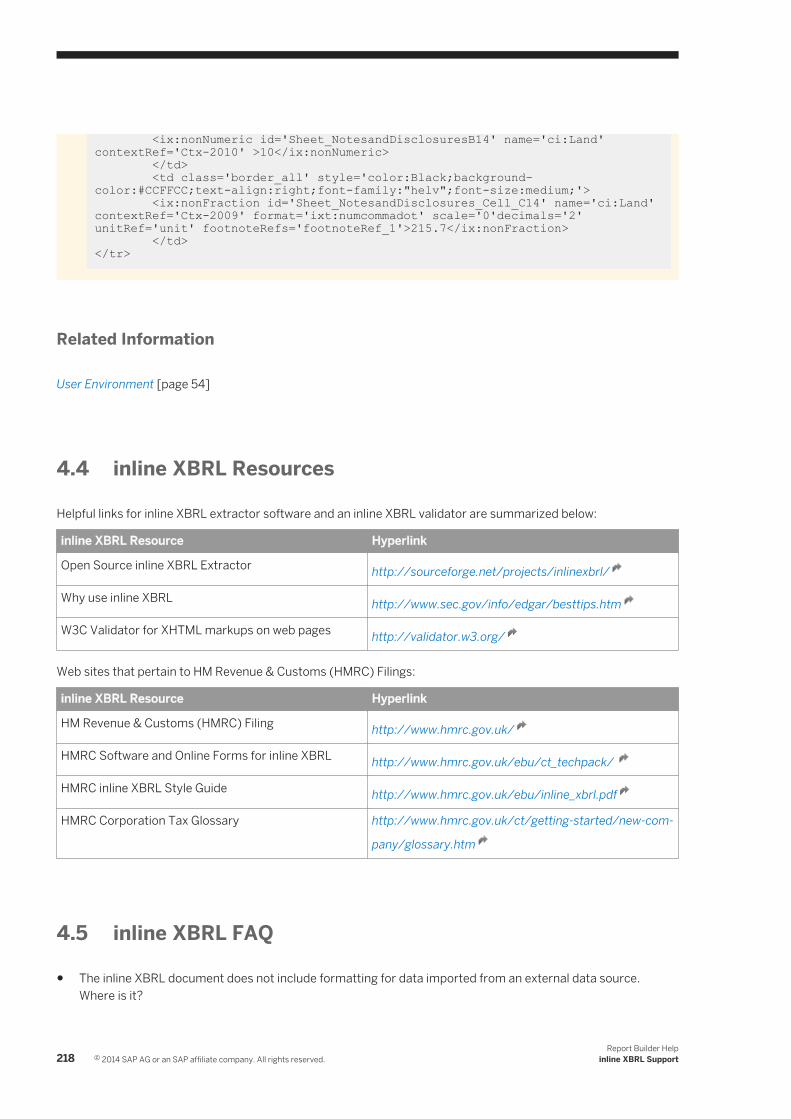
<ix:nonNumeric id='Sheet_NotesandDisclosuresB14' name='ci:Land' contextRef='Ctx-2010' >10</ix:nonNumeric> </td> <td class='border_all' style='color:Black;background-color:#CCFFCC;text-align:right;font-family:"helv";font-size:medium;'> <ix:nonFraction id='Sheet_NotesandDisclosures_Cell_C14' name='ci:Land' contextRef='Ctx-2009' format='ixt:numcommadot' scale='0'decimals='2' unitRef='unit' footnoteRefs='footnoteRef_1'>215.7</ix:nonFraction> </td></tr>
Related Information
User Environment [page 54]
4.4 inline XBRL Resources
Helpful links for inline XBRL extractor software and an inline XBRL validator are summarized below:
inline XBRL Resource Hyperlink
Open Source inline XBRL Extractor http://sourceforge.net/projects/inlinexbrl/
Why use inline XBRL http://www.sec.gov/info/edgar/besttips.htm
W3C Validator for XHTML markups on web pages http://validator.w3.org/
Web sites that pertain to HM Revenue & Customs (HMRC) Filings:
inline XBRL Resource Hyperlink
HM Revenue & Customs (HMRC) Filing http://www.hmrc.gov.uk/
HMRC Software and Online Forms for inline XBRL http://www.hmrc.gov.uk/ebu/ct_techpack/
HMRC inline XBRL Style Guide http://www.hmrc.gov.uk/ebu/inline_xbrl.pdf
HMRC Corporation Tax Glossary http://www.hmrc.gov.uk/ct/getting-started/new-com
pany/glossary.htm
4.5 inline XBRL FAQ
● The inline XBRL document does not include formatting for data imported from an external data source. Where is it?
218 © 2014 SAP AG or an SAP affiliate company. All rights reserved.Report Builder Help
inline XBRL Support

Numeric data imported from an external data source does not retain its original formatting. Non-numeric data imported from a Microsoft Word document using Word Mapper will retain most formatting applied to it.
● Can I run validation on an inline XBRL document?Report Builder supports validation of XBRL fact data in the Microsoft Excel workbook. XBRL validation should be performed prior to generating an inline XBRL document. Report Builder will support import/read/validate inline XBRL documents in a future release.
● When using another inline XBRL application, it cannot open the inline XBRL document created by Report Builder. Why?Report Builder saves inline XBRL documents with an HTML extension. Some iXBRL/XBRL applications expect inline XBRL files to have an XML or XHTML extensions. Because all three file extensions are valid for an inline XBRL document, you can simply change the file extension of the inline XBRL document and it should open successfully.
● Where are the footnotes in the inline XBRL document?Report Builder collects footnotes and saves them in a table at the end of the inline XBRL document. For more information, see Footnotes [page 101].
NoteThe current inline XBRL model (May 2010) does not use the full XBRL footnote model provided by XBRL Specification 2.1. In inline XBRL, the link between facts and footnotes uses a direct identification/reference structure, rather than the link:footnoteLink attribute.
● How do I know which version of HTML to use for my inline XBRL document?The inline XBRL specification defines HTML 4.01 as a standard format. Report Builder provides an option for HTML 3.2 to support regulator-specific requirements. Because inline XBRL documents are XHTML, the output file is always HTML 4.01. Check with your regulator or taxonomy designer.
● How do I control the sheet names when generating inline XBRL?The inline XBRL specification 1.0 requires cell references to be in XML; thus most symbols, such as & or + cause inline XBRL schema validation errors. To support XML, Report Builder prefixes cell names with Sheet_. Non-alphanumeric characters that are permitted in inline XBRL include underscore (_), minus (-) and full stop (.). Additional options may be available in a future release.
Report Builder Helpinline XBRL Support © 2014 SAP AG or an SAP affiliate company. All rights reserved. 219
5 Important Disclaimers on Legal AspectsThis document is for informational purposes only. Its content is subject to change without notice, and SAP does not warrant that it is error-free. SAP MAKES NO WARRANTIES, EXPRESS OR IMPLIED, OR OF MERCHANTABILITY, OR FITNESS FOR A PARTICULAR PURPOSE.
Coding Samples
Any software coding and/or code lines / strings ("Code") included in this documentation are only examples and are not intended to be used in a productive system environment. The Code is only intended to better explain and visualize the syntax and phrasing rules of certain coding. SAP does not warrant the correctness and completeness of the Code given herein, and SAP shall not be liable for errors or damages caused by the usage of the Code, unless damages were caused by SAP intentionally or by SAP's gross negligence.
Accessibility
The information contained in the SAP documentation represents SAP's current view of accessibility criteria as of the date of publication; it is in no way intended to be a binding guideline on how to ensure accessibility of software products. SAP specifically disclaims any liability with respect to this document and no contractual obligations or commitments are formed either directly or indirectly by this document.
Gender-Neutral Language
As far as possible, SAP documentation is gender neutral. Depending on the context, the reader is addressed directly with "you", or a gender-neutral noun (such as "sales person" or "working days") is used. If when referring to members of both sexes, however, the third-person singular cannot be avoided or a gender-neutral noun does not exist, SAP reserves the right to use the masculine form of the noun and pronoun. This is to ensure that the documentation remains comprehensible.
Internet Hyperlinks
The SAP documentation may contain hyperlinks to the Internet. These hyperlinks are intended to serve as a hint about where to find related information. SAP does not warrant the availability and correctness of this related information or the ability of this information to serve a particular purpose. SAP shall not be liable for any damages caused by the use of related information unless damages have been caused by SAP's gross negligence or willful misconduct. Regarding link classification, see: http://help.sap.com/disclaimer
220 © 2014 SAP AG or an SAP affiliate company. All rights reserved.Report Builder Help
Important Disclaimers on Legal Aspects

Report Builder HelpImportant Disclaimers on Legal Aspects © 2014 SAP AG or an SAP affiliate company. All rights reserved. 221

www.sap.com/contactsap
© 2014 SAP AG or an SAP affiliate company. All rights reserved.No part of this publication may be reproduced or transmitted in any form or for any purpose without the express permission of SAP AG. The information contained herein may be changed without prior notice.Some software products marketed by SAP AG and its distributors contain proprietary software components of other software vendors. National product specifications may vary.These materials are provided by SAP AG and its affiliated companies ("SAP Group") for informational purposes only, without representation or warranty of any kind, and SAP Group shall not be liable for errors or omissions with respect to the materials. The only warranties for SAP Group products and services are those that are set forth in the express warranty statements accompanying such products and services, if any. Nothing herein should be construed as constituting an additional warranty.SAP and other SAP products and services mentioned herein as well as their respective logos are trademarks or registered trademarks of SAP AG in Germany and other countries.Please see http://www.sap.com/corporate-en/legal/copyright/index.epx for additional trademark information and notices.