Embed Size (px)
Citation preview

REPORT
ON
FLY ASH GENERATION
AT
COAL/LIGNITE BASED THERMAL POWER STATIONS
AND
ITS UTILIZATION IN THE COUNTRY
FOR
THE YEAR 2011-12 AND 2012-13
CENTRAL ELECTRICITY AUTHORITY
NEW DELHI
JANUARY, 2014

i
CONTENTS
PARA
No.
DESCRIPTION PAGE
No.
1.0 Background
1
2.0 Ash Generation & Utilization during the Year 2011-12 and 2012-13
1
2.1 A Brief Summary
1
2.2 Retirement of Units during 2011-12 and 2012-13
2
2.3 Power Utility wise status of fly ash generation & its utilization
during the Year 2011-12 and 2012-13
3
2.4 State wise status of fly ash generation & its utilization during the
Year 2011-12 and 2012-13
7
3.0 Targets of fly ash utilization as per MOEF’s Amendment Notification
dated 3rd November, 2009
8
3.1 Thermal Power Station in operation as on 03.11.2009
8
3.2 Thermal Power Stations Commissioned after 03.11.2009
9
4.0 Present status of fly ash utilization as per MoEF’s amendment
notification dated 3rd November, 2009
9
4.1 Status during the Year 2011-12 and 2012-13
10
4.2 Range of percentage of ash utilization during the year 2011-12 and
2012-13
11
4.3 Thermal Power Stations that have achieved 100% or more ash
utilization during the year 2011-12 and 2012-13
11
4.4 Power Stations in ash utilization range of less than 100% and up
to 75% during the year 2011-12 and 2012-13
14
4.5 Power Stations in ash utilization of less than 75% and up to 60%
during the year 2011-12 and 2012-13
17
4.6 Power Stations with ash utilization level of less than 60% during
the year 2011-12 and 2012-13
18
5.0 Modes of ash utilization during the year 2011-12 and 2012-13
23
6.0 Progressive fly ash generation & utilization during the period from
1996-97 to 2012-13
25
7.0 Progressive fly ash utilization in various modes/sectors during the
period from 1998-99 to 2012-13
26
ii
PARA
No.
DESCRIPTION PAGE
No.
7.1 Cement Industry
26
7.2 Reclamation of low lying area
27
7.3 Construction of Road, Embankments, Flyovers and raising of Ash
dykes.
28
7.4 Back Filling/Stowing of Mines
28
7.5 Building materials like bricks, blocks, tiles etc.
29
7.6 Agriculture
29
8.0 Conclusions & Recommendations
30
Annex-I Fly ash generation and its utilization at coal/lignite based thermal
power stations in the country during the year 2011-12 (Power
Station Wise)
Annex-II Fly ash generation and its utilization at coal/lignite based thermal
power stations in the country during the year 2012-13 (Power
Station Wise)
iii
tLIST OF TABLES
TABLE
No.
TITLE OF TABLE PAGE
No.
I Summary of fly ash generation and utilization during the year 2011-
12 and 2012-13
2
II Details of retirement of units during the year 2011-12 and 2012-13
2
III Power Utility wise status of fly ash generation & utilization during
the year 2011-12 and 2012-13
3
IV State wise status of fly ash generation & utilization during the year
2011-12 and 2012-13
7
V Targets for fly ash utilization for Thermal Power Station in operation
as on 03.11.2009
8
VI Targets for fly ash utilization for Thermal Power Station
commissioned after 03.11.2009
9
VII Status of utilization of fly ash as per MoEF’s notification dated 3rd
November, 2009 for the year 2011-12 and 2012-13
10
VIII Range of percentage ash utilization during the year 2011-12 and
2012-13
11
IX Thermal Power Stations with ash utilization level of 100% or more
during the year 2011-12 and 2012-13
11
X Thermal Power Stations with ash utilization level of less than 100%
and up to 75% during the year 2011-12 and 2012-13
14
XI Thermal Power Stations with ash utilization level of less than 75%
and up to 60% during the year 2011-12 and 2012-13
17
XII Power Stations with Ash Utilization Level of less than 60% during
the Year 2011-12 and 2012-13
19
XIII Major modes of fly ash utilization during Year 2011-12 and 2012-13
23
XIV Progressive Fly Ash generation & utilization during the period from
1996-97 to 2012-13
25
iv
LIST OF FIGURES
Figure
No.
TITLE OF FIGURE PAGE
No.
1 Mode of fly ash utilization during 2011-12
24
2 Mode of fly ash utilization during 2012-13
24
3 Progressive generation & utilization of fly ash during the
Period from 1998-99 to 2012-13
26
4 Progressive utilization of fly ash in cement
manufacturing and concrete during the Period from
1998-99 to 2012-13
27
5 Progressive utilization of fly ash in reclamation of low
lying areas during the period from 1998-99 to 2012-13
27
6 Progressive utilization of fly ash in construction of
roads/embankments/ash dyke raising during the period
from 1998-99 to 2012-13
28
7 Progressive utilization of fly ash in Mine filling during the
period from 1998-99 to 2012-13
28
8 Progressive utilization of fly ash in manufacture of fly
ash based brick/blocks/ tiles during the period from
1998-99 to 2012-13
29
9 Progressive utilization of fly ash in agriculture during the
period from 1998-99 to 2012-13
30
1
FLY ASH GENERATION AT COAL/LIGNITE BASED THERMAL POWER
STATIONS AND ITS UTILIZATION IN THE COUNTRY
(FOR THE YEARS 2011-12 AND 2012-13)
1.0 BACKGROUND
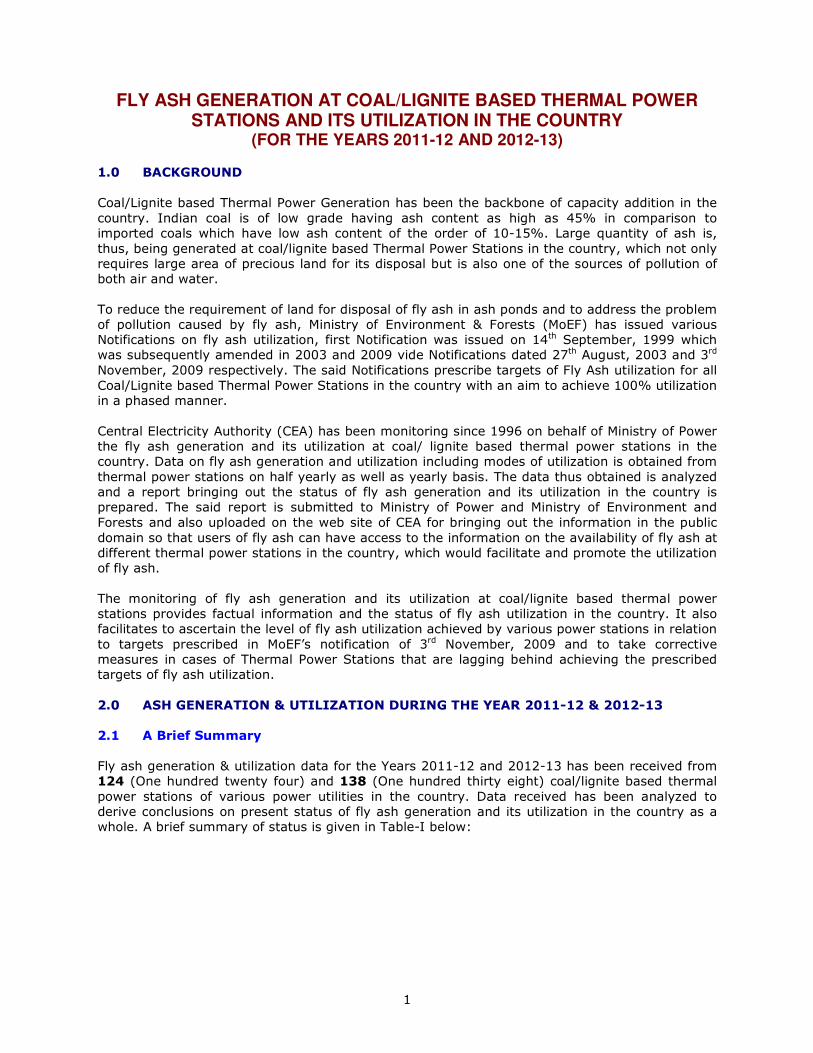
Coal/Lignite based Thermal Power Generation has been the backbone of capacity addition in the
country. Indian coal is of low grade having ash content as high as 45% in comparison to
imported coals which have low ash content of the order of 10-15%. Large quantity of ash is,
thus, being generated at coal/lignite based Thermal Power Stations in the country, which not only
requires large area of precious land for its disposal but is also one of the sources of pollution of
both air and water.
To reduce the requirement of land for disposal of fly ash in ash ponds and to address the problem
of pollution caused by fly ash, Ministry of Environment & Forests (MoEF) has issued various
Notifications on fly ash utilization, first Notification was issued on 14th September, 1999 which
was subsequently amended in 2003 and 2009 vide Notifications dated 27th August, 2003 and 3rd
November, 2009 respectively. The said Notifications prescribe targets of Fly Ash utilization for all
Coal/Lignite based Thermal Power Stations in the country with an aim to achieve 100% utilization
in a phased manner.
Central Electricity Authority (CEA) has been monitoring since 1996 on behalf of Ministry of Power
the fly ash generation and its utilization at coal/ lignite based thermal power stations in the
country. Data on fly ash generation and utilization including modes of utilization is obtained from
thermal power stations on half yearly as well as yearly basis. The data thus obtained is analyzed
and a report bringing out the status of fly ash generation and its utilization in the country is
prepared. The said report is submitted to Ministry of Power and Ministry of Environment and
Forests and also uploaded on the web site of CEA for bringing out the information in the public
domain so that users of fly ash can have access to the information on the availability of fly ash at
different thermal power stations in the country, which would facilitate and promote the utilization
of fly ash.
The monitoring of fly ash generation and its utilization at coal/lignite based thermal power
stations provides factual information and the status of fly ash utilization in the country. It also
facilitates to ascertain the level of fly ash utilization achieved by various power stations in relation
to targets prescribed in MoEF’s notification of 3rd November, 2009 and to take corrective
measures in cases of Thermal Power Stations that are lagging behind achieving the prescribed
targets of fly ash utilization.
2.0 ASH GENERATION & UTILIZATION DURING THE YEAR 2011-12 & 2012-13
2.1 A Brief Summary
Fly ash generation & utilization data for the Years 2011-12 and 2012-13 has been received from
124 (One hundred twenty four) and 138 (One hundred thirty eight) coal/lignite based thermal
power stations of various power utilities in the country. Data received has been analyzed to
derive conclusions on present status of fly ash generation and its utilization in the country as a
whole. A brief summary of status is given in Table-I below:
2
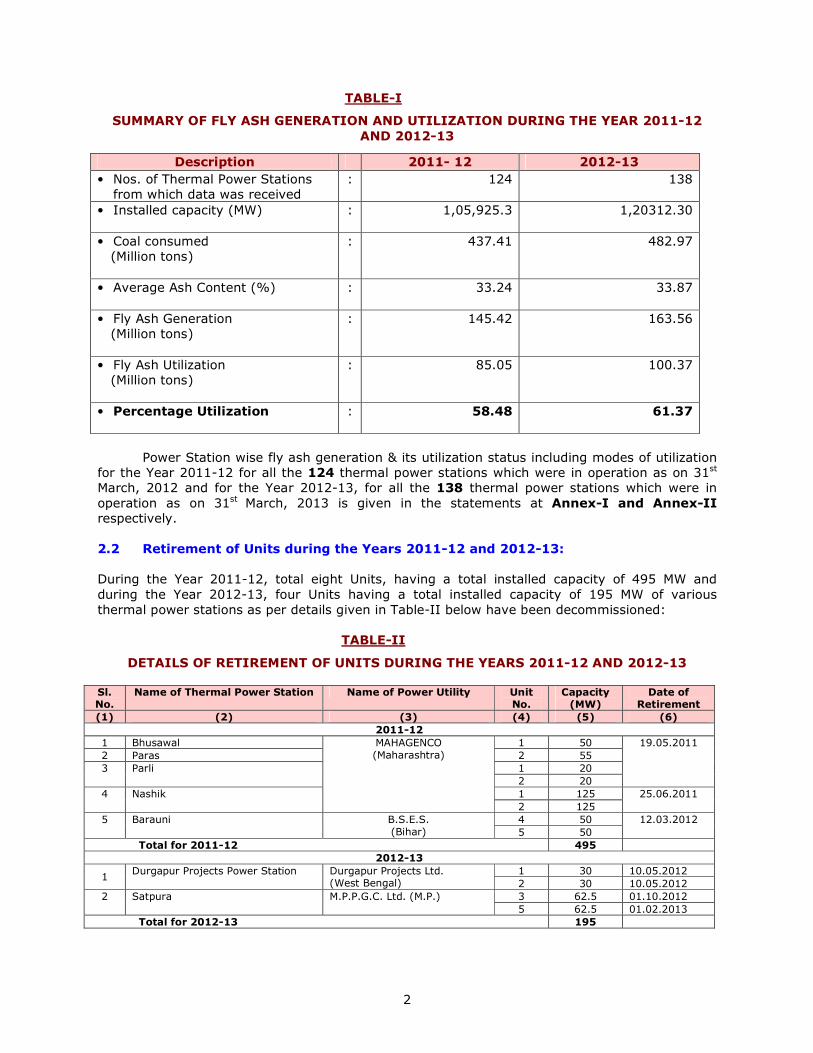
TABLE-I
SUMMARY OF FLY ASH GENERATION AND UTILIZATION DURING THE YEAR 2011-12
AND 2012-13
Power Station wise fly ash generation & its utilization status including modes of utilization
for the Year 2011-12 for all the 124 thermal power stations which were in operation as on 31st
March, 2012 and for the Year 2012-13, for all the 138 thermal power stations which were in
operation as on 31st March, 2013 is given in the statements at Annex-I and Annex-II
respectively.
2.2 Retirement of Units during the Years 2011-12 and 2012-13:
During the Year 2011-12, total eight Units, having a total installed capacity of 495 MW and
during the Year 2012-13, four Units having a total installed capacity of 195 MW of various
thermal power stations as per details given in Table-II below have been decommissioned:
TABLE-II
DETAILS OF RETIREMENT OF UNITS DURING THE YEARS 2011-12 AND 2012-13
Sl. No.
Name of Thermal Power Station Name of Power Utility Unit No.
Capacity (MW)
Date of Retirement
(1) (2) (3) (4) (5) (6)
2011-12
1 Bhusawal 1 50
2 Paras 2 55
1 20 3 Parli
2 20
19.05.2011
1 125 4 Nashik
MAHAGENCO
(Maharashtra)
2 125
25.06.2011
4 50 5 Barauni B.S.E.S.
(Bihar) 5 50
12.03.2012
Total for 2011-12 495
2012-13
1 30 10.05.2012 1
Durgapur Projects Power Station Durgapur Projects Ltd. (West Bengal) 2 30 10.05.2012
3 62.5 01.10.2012 2
Satpura M.P.P.G.C. Ltd. (M.P.)
5 62.5 01.02.2013
Total for 2012-13 195
Description 2011- 12 2012-13
• Nos. of Thermal Power Stations
from which data was received
: 124 138
• Installed capacity (MW)
: 1,05,925.3 1,20312.30
• Coal consumed
(Million tons)
: 437.41 482.97
• Average Ash Content (%)
: 33.24 33.87
• Fly Ash Generation (Million tons)
: 145.42 163.56
• Fly Ash Utilization (Million tons)
: 85.05 100.37
• Percentage Utilization
: 58.48 61.37
3
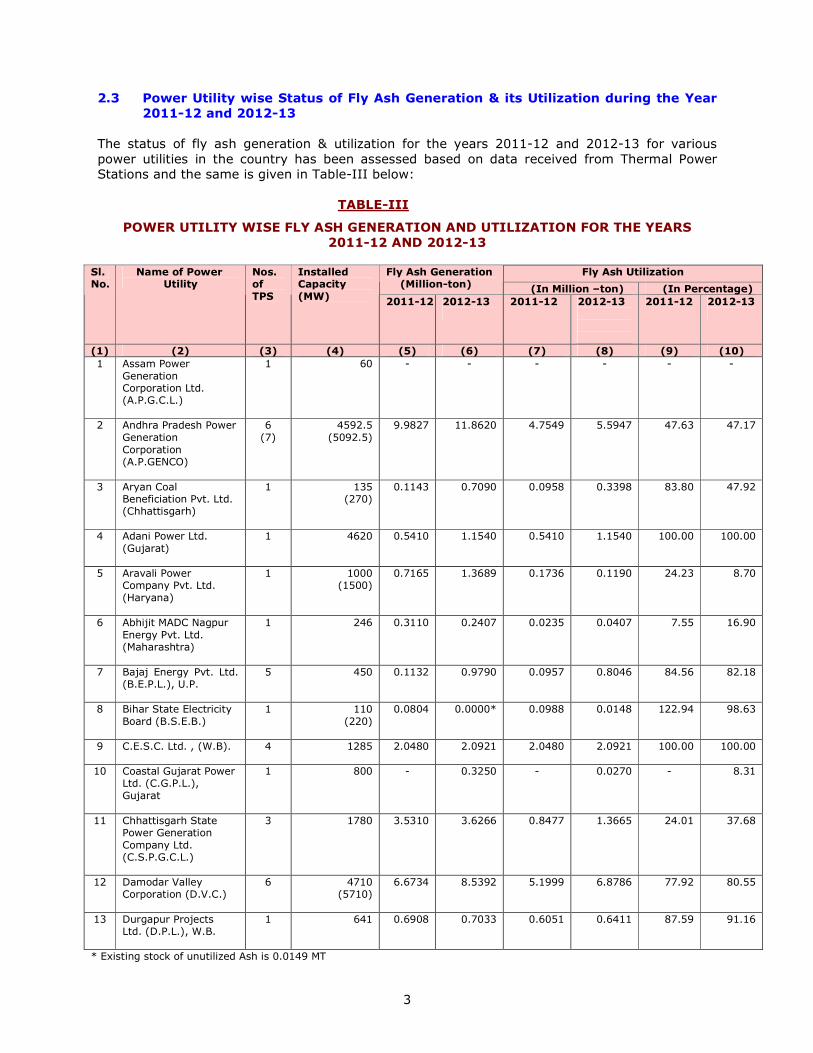
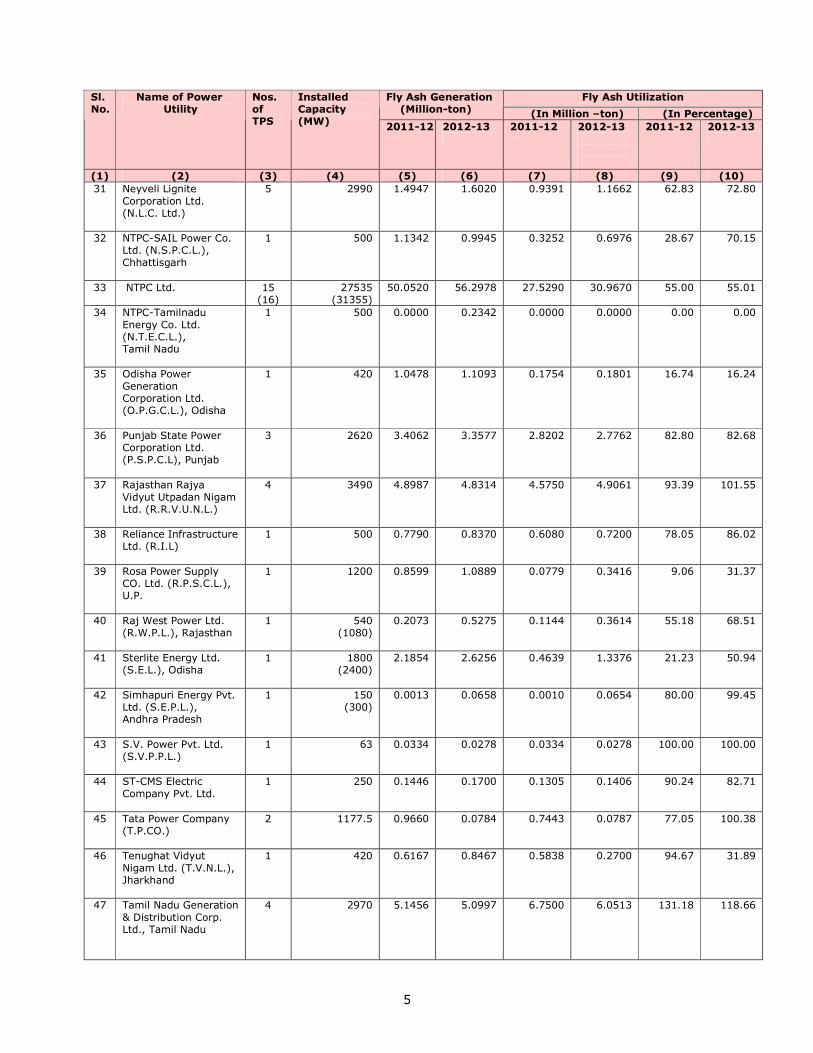
2.3 Power Utility wise Status of Fly Ash Generation & its Utilization during the Year
2011-12 and 2012-13
The status of fly ash generation & utilization for the years 2011-12 and 2012-13 for various
power utilities in the country has been assessed based on data received from Thermal Power
Stations and the same is given in Table-III below:
TABLE-III
POWER UTILITY WISE FLY ASH GENERATION AND UTILIZATION FOR THE YEARS
2011-12 AND 2012-13
Fly Ash Utilization Fly Ash Generation
(Million-ton) (In Million –ton) (In Percentage)
Sl. No.
Name of Power Utility
Nos. of
TPS
Installed Capacity
(MW) 2011-12 2012-13
2011-12 2012-13
2011-12 2012-13
(1) (2) (3) (4) (5) (6) (7) (8) (9) (10)
1 Assam Power
Generation Corporation Ltd. (A.P.G.C.L.)
1 60 - - - - - -
2 Andhra Pradesh Power
Generation
Corporation (A.P.GENCO)
6
(7)
4592.5
(5092.5)
9.9827 11.8620 4.7549 5.5947 47.63 47.17
3 Aryan Coal Beneficiation Pvt. Ltd. (Chhattisgarh)
1 135 (270)
0.1143 0.7090 0.0958 0.3398 83.80 47.92
4 Adani Power Ltd.
(Gujarat)
1 4620 0.5410 1.1540 0.5410 1.1540 100.00 100.00
5 Aravali Power Company Pvt. Ltd.
(Haryana)
1 1000 (1500)
0.7165 1.3689 0.1736 0.1190 24.23 8.70
6 Abhijit MADC Nagpur
Energy Pvt. Ltd. (Maharashtra)
1 246 0.3110 0.2407 0.0235 0.0407 7.55 16.90
7 Bajaj Energy Pvt. Ltd. (B.E.P.L.), U.P.
5 450 0.1132 0.9790 0.0957 0.8046 84.56 82.18
8 Bihar State Electricity
Board (B.S.E.B.)
1 110
(220)
0.0804 0.0000*
0.0988 0.0148 122.94 98.63
9 C.E.S.C. Ltd. , (W.B).
4 1285 2.0480 2.0921 2.0480 2.0921 100.00 100.00
10 Coastal Gujarat Power Ltd. (C.G.P.L.),
Gujarat
1 800 - 0.3250 - 0.0270 - 8.31
11 Chhattisgarh State Power Generation
Company Ltd. (C.S.P.G.C.L.)
3 1780 3.5310 3.6266 0.8477 1.3665 24.01 37.68
12 Damodar Valley Corporation (D.V.C.)
6 4710 (5710)
6.6734 8.5392 5.1999 6.8786 77.92 80.55
13 Durgapur Projects Ltd. (D.P.L.), W.B.
1 641 0.6908 0.7033 0.6051 0.6411 87.59 91.16
* Existing stock of unutilized Ash is 0.0149 MT

4
Fly Ash Utilization Fly Ash Generation (Million-ton) (In Million –ton) (In Percentage)
Sl. No.
Name of Power Utility
Nos. of TPS
Installed Capacity (MW)
2011-12 2012-13
2011-12 2012-13
2011-12 2012-13
(1) (2) (3) (4) (5) (6) (7) (8) (9) (10)
14 D.P.S.C. Ltd. (W.B) 1
(2)
30
(42)
0.0153 0.0197 0.0149 0.0197 97.16 100.00
15 Essar Power Gujarat Ltd. (Gujarat)
1 600 (1200)
0.0036 0.1367 0.0036 0.1367 100.00 100.00
16 Gujarat Industries
Power Corporation Ltd. (G.I.P.C.L.), Gujarat
1 500 0.4580 0.5721 0.4582 0.5721 100.05 100.00
17 Gujarat Mineral
Development Corporation Ltd. (G.M.D.C.L.), Gujarat
1 250 0.1705 0.1858 0.1871 0.1859 109.76 100.03
18 Gujarat State Electric
Corporation Ltd. (G.S.E.C.L), Gujarat
5 3720 6.2370 5.1810 3.0080 3.4836 48.23 67.24
19 Haryana Power
Generation Corporation, Ltd. (H.P.G.C.L.), Haryana
3 3167.5 5.2096 4.4406 1.7862 1.5768 34.29 35.51
20 Indraprastha Power
Generation Company Ltd. (I.P.G.C.L), Delhi
1 135 0.2278 0.2384 0.1725 0.1999 75.70 83.85
21 Jharkhand State Electricity Board
(J.S.E.B.), Jharkhand
1 770
0.1510 0.2590 0.0117 0.0061 7.75 2.37
22 Jhajjar Power Ltd. J.H.P.L (Haryana)
1 1320 0.0412 0.7795 0.0412 0.7795 100.00 100.00
23 Jindal Power Ltd. (J.P.L.), Chhattisgarh
1 1000 1.9350 1.9990 1.1360 1.1940 58.71 59.73
24 JSW Energy Ltd.
2 2060 0.4473 0.5275 0.3951 0.5064 88.33 96.00
25 Karnataka Power Corporation Ltd. (K.P.C.L.), Karnataka
2 2220 (2720)
2.3992 3.0313 1.1833 1.2913 49.32 42.60
26 Kanti Bijlee Utpadan
Nigam Ltd. (K.B.U.N.L.), Bihar
1 220 0.0863 - 0.0863 - 100.00 -
27 LANCO Power Ltd.
2 1800 0.9740 1.8073 0.2360 0.3662 24.23 20.26
28 Madhya Pradesh
Power Generation Corporation Ltd. (M.P.P.G.C.L.), M.P.
3 2932.5 4.3736 5.0533 1.6608 2.4843 37.97 49.16
29 Maithon Power Ltd. (M.P.L.), Jharkhand
1 1050 0.3550 1.2977 0.0013 0.3691 0.36 28.44
30 Maharashtra State
Power Generation Corporation Ltd. (M.S.P.G.C.L)
7 6960 10.4091 11.3386 5.3263 6.6454 51.17 58.61
5
Fly Ash Utilization Fly Ash Generation (Million-ton) (In Million –ton) (In Percentage)
Sl. No.
Name of Power Utility
Nos. of TPS
Installed Capacity (MW)
2011-12 2012-13
2011-12 2012-13
2011-12 2012-13
(1) (2) (3) (4) (5) (6) (7) (8) (9) (10)
31 Neyveli Lignite
Corporation Ltd. (N.L.C. Ltd.)
5 2990 1.4947 1.6020 0.9391 1.1662 62.83 72.80
32 NTPC-SAIL Power Co. Ltd. (N.S.P.C.L.),
Chhattisgarh
1 500 1.1342 0.9945 0.3252 0.6976 28.67 70.15
33 NTPC Ltd. 15 (16)
27535 (31355)
50.0520 56.2978 27.5290 30.9670 55.00 55.01
34 NTPC-Tamilnadu
Energy Co. Ltd. (N.T.E.C.L.), Tamil Nadu
1 500 0.0000 0.2342 0.0000 0.0000 0.00 0.00
35 Odisha Power
Generation Corporation Ltd. (O.P.G.C.L.), Odisha
1 420 1.0478 1.1093 0.1754 0.1801 16.74 16.24
36 Punjab State Power Corporation Ltd. (P.S.P.C.L), Punjab
3 2620 3.4062 3.3577 2.8202 2.7762 82.80 82.68
37 Rajasthan Rajya
Vidyut Utpadan Nigam Ltd. (R.R.V.U.N.L.)
4 3490 4.8987 4.8314 4.5750 4.9061 93.39 101.55
38 Reliance Infrastructure Ltd. (R.I.L)
1 500 0.7790 0.8370 0.6080 0.7200 78.05 86.02
39 Rosa Power Supply CO. Ltd. (R.P.S.C.L.), U.P.
1 1200 0.8599 1.0889 0.0779 0.3416 9.06 31.37
40 Raj West Power Ltd. (R.W.P.L.), Rajasthan
1 540 (1080)
0.2073 0.5275 0.1144 0.3614 55.18 68.51
41 Sterlite Energy Ltd. (S.E.L.), Odisha
1 1800 (2400)
2.1854 2.6256 0.4639 1.3376 21.23 50.94
42 Simhapuri Energy Pvt. Ltd. (S.E.P.L.), Andhra Pradesh
1 150 (300)
0.0013 0.0658 0.0010 0.0654 80.00 99.45
43 S.V. Power Pvt. Ltd. (S.V.P.P.L.)
1 63 0.0334 0.0278 0.0334 0.0278 100.00 100.00
44 ST-CMS Electric
Company Pvt. Ltd.
1 250 0.1446 0.1700 0.1305 0.1406 90.24 82.71
45 Tata Power Company (T.P.CO.)
2 1177.5
0.9660 0.0784 0.7443 0.0787 77.05 100.38
46 Tenughat Vidyut
Nigam Ltd. (T.V.N.L.), Jharkhand
1 420 0.6167 0.8467 0.5838 0.2700 94.67 31.89
47 Tamil Nadu Generation
& Distribution Corp. Ltd., Tamil Nadu
4 2970 5.1456 5.0997 6.7500 6.0513 131.18 118.66

6
Fly Ash Utilization Fly Ash Generation (Million-ton) (In Million –ton) (In Percentage)
Sl. No.
Name of Power Utility
Nos. of TPS
Installed Capacity (MW)
2011-12 2012-13
2011-12 2012-13
2011-12 2012-13
(1) (2) (3) (4) (5) (6) (7) (8) (9) (10)
48 Torrent Power Ltd.
(Gujarat)
1 400 0.4700 0.4690 0.6565 0.4590 139.68 97.87
49 Udupi Power Corporation Ltd. (U.P.C.L.), Karnataka
1 600 (1200)
0.0800 0.1390 0.0490 0.1080 61.25 77.70
50 Uttar Pradesh Rajya Vidyut Utpadan Nigam Ltd. (U.P.R.V.U.N.L.)
5 4200 (4950)
5.6228 5.3649 1.0166 1.4500 18.08 27.03
51 Vandana Energy & Steels Pvt. Ltd. (V.E.S.P.L), Chhattisgarh
1 35 0.0037 - 0.0037 - 100.00 -
52 West Bengal Power Development Corporation Ltd. (W.B.P.D.C. L.), W.B.
5 3860 7.1710 6.7792 6.4630 6.9663 90.13 102.76
53 Wardha Power Co. Pvt. Ltd. (W.P.C.L.), Maharashtra
1 540 0.7992 0.8453 0.7992 0.8453 100.00 100.00
54 Gupta Energy Pvt. Ltd. (Maharashtra)
0 (1)
0 (120)
- 0.1428 - 0.1428 - 100.00
55 J.P. Ventures Ltd., (M.P.)
0 (1)
0 (500)
- 0.1569 - 0.1047 - 66.74
56 AP&NR Ltd. (Jharkhand)
0 (1)
0 (540)
- 0.0946 - 0.0189 20.00
57 VIP Limited
(Maharashtra)
0
(1)
0
(300)
- 0.0017 - 0.0000 - 0.00
58 EMCO Energy Ltd., (Maharashtra)
0 (1)
0 (300)
_ 0.0241 _ 0.0200 _ 83.04
59 Spectrum Coal & Power Ltd., (Chhattisgarh)
0 (1)
0 (50)
_ 0.0103 _ 0.0103 _ 100.00
60 Adani Power Ltd.,
(Maharashtra)
0
(1)
0
(1320)
_ 0.0979 _ 0.0479 _ 48.93
61 Indiabulls Power Ltd., (Maharashtra)
0 (1)
0 (270)
_ 0.0001 _ 0.0001 _ 100.00
62 Ideal Energy Projects
Ltd., (Maharashtra)
0
(1)
0
(270)
_ 0.0015 _ 0.0005 _ 33.40
63 ESSAR Power M.P. Ltd., (M.P.)
0 (1) 0
(600)
_ 0.0080 _ 0.0080 _ 100.00
64 Meenakshi Energy Pvt. Ltd. , (Andhra Pradesh)
0 (1)
0 (300)
0.0072 0.0032 44.75
GRAND TOTAL 124 (138)
105925.3 (120312.3)
145.42 163.56 85.05 100.37 58.48 61.37
[Values in brackets in above Table are for year of 2012-13]
7
It may be seen from the Table-III above that:
(i) The data of fly ash generation and utilization for the year 2011-12 was received from 53
Power Utilities out of which 13 Power Utilities have achieved fly ash utilization level of 100%
or more and 15 power utilities have achieved fly ash utilization level in the range of less than
100% to 75%;
(ii) The data of fly ash generation and utilization for the year 2012-13 was received from 64
Power Utilities, out of which 17 Power Utilities have achieved fly ash utilization level of 100%
or more and 13 power utilities have achieved fly ash utilization level in the range of less than
100% to 75%.
The performance of these power utilities in fly ash utilization has been excellent during the
aforesaid periods (i.e. during the years 2011-12 and 2012-13).
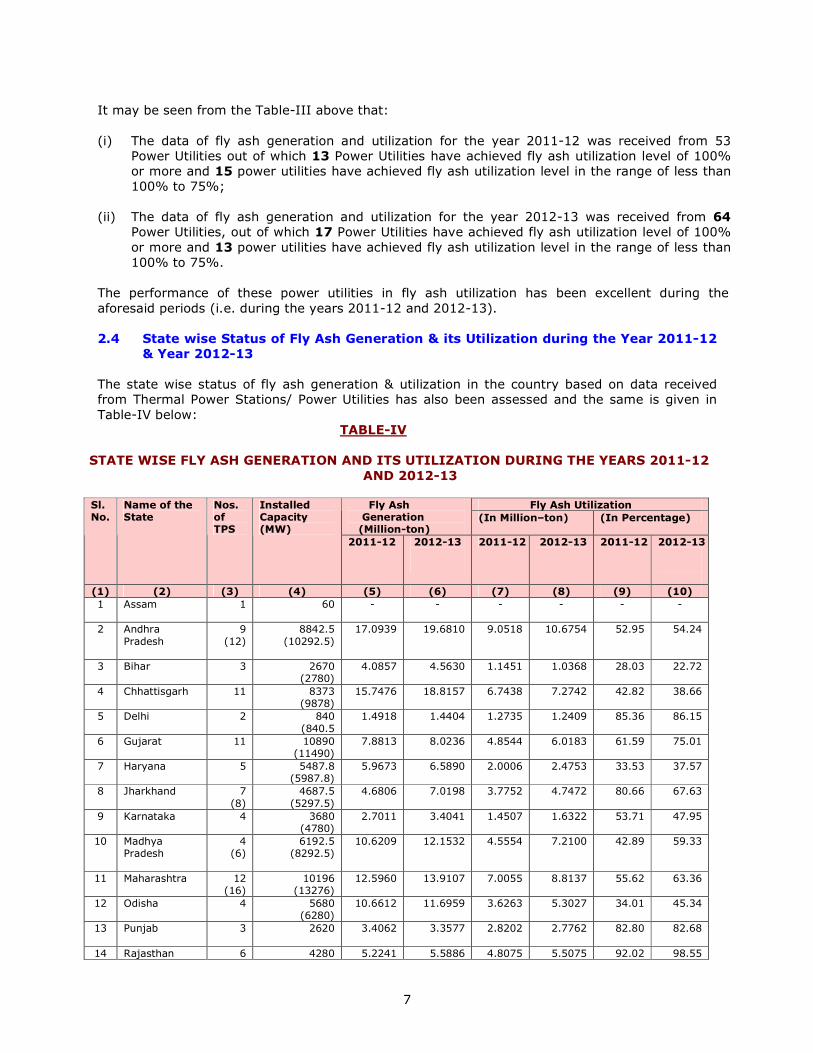
2.4 State wise Status of Fly Ash Generation & its Utilization during the Year 2011-12
& Year 2012-13
The state wise status of fly ash generation & utilization in the country based on data received
from Thermal Power Stations/ Power Utilities has also been assessed and the same is given in
Table-IV below:
TABLE-IV
STATE WISE FLY ASH GENERATION AND ITS UTILIZATION DURING THE YEARS 2011-12
AND 2012-13
Fly Ash Utilization Fly Ash
Generation (Million-ton)
(In Million–ton) (In Percentage)
Sl. No.
Name of the State
Nos. of TPS
Installed Capacity (MW)
2011-12 2012-13
2011-12 2012-13
2011-12 2012-13
(1) (2) (3) (4) (5) (6) (7) (8) (9) (10)
1 Assam
1 60 - - - - - -
2 Andhra
Pradesh
9
(12)
8842.5
(10292.5)
17.0939 19.6810 9.0518 10.6754 52.95 54.24
3 Bihar 3 2670 (2780)
4.0857 4.5630 1.1451 1.0368 28.03 22.72
4 Chhattisgarh 11
8373 (9878)
15.7476 18.8157 6.7438 7.2742 42.82 38.66
5 Delhi 2 840
(840.5
1.4918 1.4404 1.2735 1.2409 85.36 86.15
6 Gujarat 11 10890 (11490)
7.8813 8.0236 4.8544 6.0183 61.59 75.01
7 Haryana 5 5487.8 (5987.8)
5.9673 6.5890 2.0006 2.4753 33.53 37.57
8 Jharkhand 7
(8)
4687.5
(5297.5)
4.6806 7.0198 3.7752 4.7472 80.66 67.63
9 Karnataka 4 3680 (4780)
2.7011 3.4041 1.4507 1.6322 53.71 47.95
10 Madhya Pradesh
4 (6)
6192.5 (8292.5)
10.6209 12.1532 4.5554 7.2100 42.89 59.33
11 Maharashtra 12 (16)
10196 (13276)
12.5960 13.9107 7.0055 8.8137 55.62 63.36
12 Odisha 4 5680 (6280)
10.6612 11.6959 3.6263 5.3027 34.01 45.34
13 Punjab
3 2620 3.4062 3.3577 2.8202 2.7762 82.80 82.68
14 Rajasthan 6 4280 5.2241 5.5886 4.8075 5.5075 92.02 98.55

8
Fly Ash Utilization Fly Ash Generation (Million-ton)
(In Million–ton) (In Percentage)
Sl. No.
Name of the State
Nos. of TPS
Installed Capacity (MW)
2011-12 2012-13
2011-12 2012-13
2011-12 2012-13
(1) (2) (3) (4) (5) (6) (7) (8) (9) (10)
(4820)
15 Tamil Nadu
10 6460 6.6668 6.8763 7.7015 7.1181 115.52 103.52
16 Uttar Pradesh 17 14360 (15610)
20.4509 22.2475 10.4291 12.4175 51.00 55.82
17 West Bengal 15 16
10606 (11618)
16.1414 18.4139 13.8056 17.0572 85.53 92.63
GRAND TOTAL
124 (138)
105925.30 (120312.30)
145.42 163.56 85.05 100.37 58.48 61.37
[Values in brackets in above Table are for the year 2012-13]
It may be seen from Table-IV above that:
(i) Out of 17 states, 7 states have generated more than 10 million-ton of fly ash during the
Years 2011-12 and 2012-13 and the maximum fly ash of more than 20 million ton was
generated in U.P. during the aforesaid periods.
(ii) During the Year 2011-12, the State of Tamil Nadu has achieved fly ash utilization level of
more than 100% and the States of Delhi, Jharkhand, Punjab, Rajasthan and West Bengal
have achieved the fly ash utilization level of more than 80%.
(iii) During the Year 2012-13, the State of Tamil Nadu has achieved the fly ash utilization level
of more than 100% and the States of Delhi, Punjab, Rajasthan and West Bengal have
achieved the fly ash utilization level of more than 80%.
The performance of aforesaid states in fly ash utilization has been excellent during the aforesaid
periods.
3.0 TARGETS FOR FLY ASH UTILIZATION AS PER MoEF’S NOTIFICATION OF 3rd
NOVEMBER, 2009
3.1 Thermal Power Station in Operation as on 3rd November, 2009
All coal/lignite based thermal Power Stations and/or expansion units in operation on or before the
date of MoEF’s notification i.e. 03.11.2009 are required to achieve the targets of fly ash
utilization as given in Table-V below:
TABLE-V
TARGETS FOR FLY ASH UTILIZATION FOR THERMAL POWER STATIONS IN OPERATION
AS ON 3rd NOVEMBER, 2009
Sl.
No.
Target of Fly Ash Utilization (In Percentage)
Target Date
(1) (2) (3)
1 At least 50% of Fly Ash generation One year from the date of notification
2 At least 60% of Fly Ash generation Two years from the date of notification
3 At least 75% of Fly Ash generation Three years from the date of notification
4 At least 90% of Fly Ash generation Four years from the date of notification
5 100% of Fly Ash generation Five years from the date of notification

9
The unutilized fly ash, if any, in relation to the target during a year would be required to be
utilized within next two years in addition to the targets stipulated for those years and the balance
unutilized fly ash accumulated during first five years (the difference between the generation and
the utilization target) would be required to be utilized progressively over the next five years in
addition to 100% utilization of current generation of fly ash.
3.2 Thermal Power Station Commissioned after 3rd November, 2009
New coal/lignite based thermal Power Stations and/or expansion units commissioned after
issuance of MoEF’s notification of 3rd November, 2009 are required to achieve the target of fly ash
utilization as given in Table-VI below:
TABLE-VI
TARGETS FOR FLY ASH UTILIZATION FOR THERMAL POWER STATION COMMISSIONED
AFTER 3rd NOVEMBER, 2009
Sl.
No.
Target of Fly Ash Utilization (In Percentage)
Target Date
(1) (2) (3)
1 At least 50% of fly ash generation One year from the date of Commissioning
2 At least 70% of fly ash generation Two years from the date of Commissioning
3 At least 90% of fly ash generation Three years from the date of Commissioning
4 100% of fly ash generation Four years from the date of commissioning
The unutilized fly ash, if any, in relation the target during a year would be required to be utilized
within next two years in addition to the targets stipulated for these years and the balance
unutilized fly ash accumulated during first four years (the difference between the generation and
utilization target) would be required to be utilized progressively over next five years in addition to
100% utilization of current generation of fly ash.
4.0 PRESENT STATUS OF FLY ASH UTILIZATION AS PER MoEF’S NOTIFICATION OF
3rd NOVEMBER, 2009
Fly ash generation and utilization data received from Thermal Power Stations/Power Utilities in
the country for the years 2011-12 and 2012-13 has been analyzed broadly to ascertain the
power stations which have achieved the targets of fly ash utilization as prescribed in MoEF’s
notification of 3rd November, 2009.
During the Year 2011-12, all those thermal power stations which were in operation on the date of
issuance of MoEF’s notification (i.e. 3rd November, 2009) should have achieved the target of fly
ash utilization of 60% within two years from the date of notification i.e. by 3rd November, 2011.
All those thermal power stations which have come into operation after the date of issuance of
MoEF’s notification (i.e. 3rd November, 2009) should have achieved the target of fly ash utilization
as specified in Table-VI above depending upon their date of commissioning.
During the Year 2012-13, all those thermal power stations which were in operation on the date of
issuance of MoEF’s notification (i.e. 3rd November, 2009) should have achieved the target of fly
ash utilization of 75% within three years from the date of notification i.e. by 3rd November, 2012.
All those thermal power stations which have come into operation after the date of issuance of
MoEF’s notification (i.e. 3rd November, 2009) should have achieved the target of fly ash utilization
as specified in Table-VI above depending upon their date of commissioning.

10
4.1 Status during the Year 2011-12 and 2012-13
To have a broad assessment of the achievement of targets of fly ash utilization by those thermal
power stations which were in operation as on 3rd November, 2009 (i.e. date of MoEF’s
Notification) for the years 2011-12 and 2012-13, the fly ash utilization in terms of percentage as
achieved by thermal power stations as on 31st March, 2012 and 31st March, 2013 respectively has
been compared with the targets of fly ash utilization required to be achieved by them as on 3rd
November, 2011 for the Year 2011-12 and as on 3rd November, 2012 for the Year 2012-13 as per
MoEF’s Notification of 3rd November, 2009.
For thermal power stations which were commissioned after 3rd November, 2009 (i.e. date of
MoEF’s Notification), the fly ash utilization in terms of percentage as achieved by them as on 31st
March, 2012 for the year 2011-12 and as on 31st March, 2013 for the year 2012-13 has been
compared with the targets of fly ash utilization required to be achieved by them as per MoEF’s
Notification of 3rd November, 2009 and given in Table-VI above depending upon their date of
commissioning.
For thermal power stations which were in operation for less than one year as on 31st March, 2012
for the Year 2011-12 and as on 31st March, 2013 for the Year 2012-13, the target of fly ash
utilization of 50% as applicable for the 1st year from the date of commissioning has been
considered.
Based on above, the status of achievement of targets of fly ash utilization as prescribed in MoEF’s
notification of 3rd November, 2009 for the Years 2011-12 and 2012-13 has been assessed and
the same is given in Table-VII below.
TABLE-VII
STATUS OF UTILIZATION OF FLY ASH AS PER MOEF’S NOTIFICATION DATED 3rd
NOVEMBER, 2009 FOR THE YEARS 2011-12 AND 2012-13
Nos. of TPS Sl. No. Description
2011-12 2012-13
(1) (2) (3) (4)
1 Nos. of TPS which have achieved the target of fly ash
utilization as per MoEF’s Notification of 3rd November, 2009
73 66
2 Nos. of TPS which have not been able to achieve the
target of fly ash utilization as per MoEF’s Notification of 3rd
November, 2009
43 66
3 Nos. of TPS which have not generated any significant fly
ash or any fly ash
8 6
Total 124 138
It may be seen from Table-VII above that:
(i) During the Year 2011-12, out of 124 (one hundred twenty four) thermal power stations for
which data was received, 73 (seventy three) power stations have achieved the targets of fly
ash utilization as stipulated in MoEF’s Notification of 3rd November, 2009.

11
(ii) During the year of 2012-13, out of 138 (one hundred thirty eight) thermal power stations
for which data was received, 66 (sixty six) power stations have achieved the targets of fly
ash utilization as stipulated in MoEF’s Notification of 3rd November, 2009.
4.2 Range of Fly Ash Utilization during the Years 2011-12 and 2012-13
Based on the analysis of fly ash utilization data received from Thermal Power Stations/Power
Utilities, the range of fly ash utilization in percentage and numbers of thermal power stations in
that range has been assessed and the same is given in Table-VIII below:
TABLE-VIII
RANGE OF PERCENTAGE FLY ASH UTILIZATION DURING THE YEARS 2011-12 AND
2012-13
Nos. of Power Stations Sl.
No.
Level of Fly Ash utilization 2011-12 2012-13
(1) (2) (3) (4)
1 100% and more than 100% 29 32
2 Less than 100% and up to 75% 27 33
3 Less than 75% and up to 60% 17 19
4 Less than 60% 43 48
5 Nos. of TPS which have not generated any
significant fly ash or any fly ash
8 6
Total 124 138
It may be seen from Table-VIII above that 29 thermal power stations during the year 2011-12
and 32 thermal power stations during the year 2012-13 have achieved fly ash utilization level of
100% or more. The performance of these thermal power stations in fly ash utilization has been
excellent.
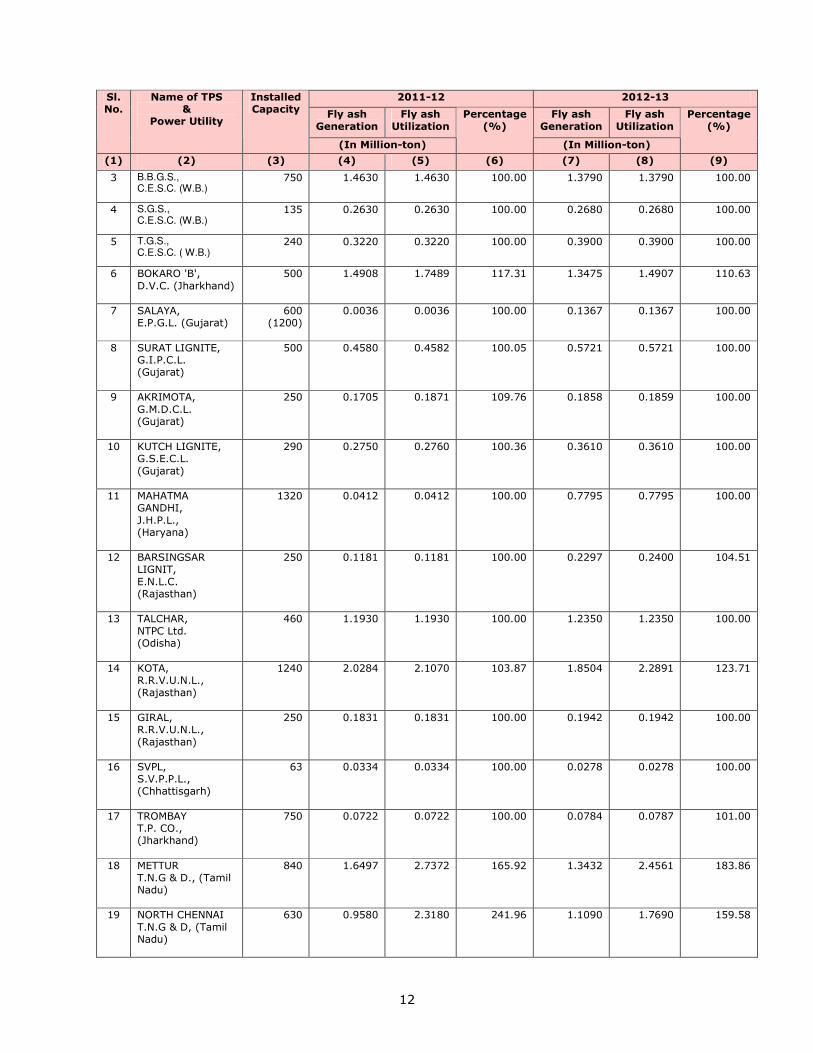
4.3 Thermal Power Stations that have achieved Fly Ash utilization level of 100% or
more during the Years 2011-12 and 2012-13
The following names of Thermal Power Stations achieved the fly ash utilization level of 100% or
more during 2011-12 and 2012-13. The fly ash utilization level achieved by each of these power
stations is given in Table-IX below:
TABLE–IX
THERMAL POWER STATIONS WITH FLY ASH UTILIZATION LEVEL OF 100% OR MORE
DURING THE YEARS 2011-12 AND 2012-13
2011-12 2012-13
Fly ash Generation
Fly ash Utilization
Fly ash Generation
Fly ash Utilization
Sl.
No.
Name of TPS
& Power Utility
Installed
Capacity
(In Million-ton)
Percentage (%)
(In Million-ton)
Percentage (%)
(1) (2) (3) (4) (5) (6) (7) (8) (9)
1 MUNDRA TPS, A.P.L. (Gujarat)
4620 0.5410 0.5410 100.00 1.1540 1.1540 100.00
2 BARAUNI, B.S.E.B. (Bihar)
110 0.0804 0.0988 122.94 _ _ _
12
2011-12 2012-13
Fly ash
Generation
Fly ash
Utilization
Fly ash
Generation
Fly ash
Utilization
Sl. No.
Name of TPS &
Power Utility
Installed Capacity
(In Million-ton)
Percentage
(%)
(In Million-ton)
Percentage
(%)
(1) (2) (3) (4) (5) (6) (7) (8) (9)
3 B.B.G.S., C.E.S.C. (W.B.)
750 1.4630 1.4630 100.00 1.3790 1.3790 100.00
4 S.G.S., C.E.S.C. (W.B.)
135 0.2630 0.2630 100.00 0.2680 0.2680 100.00
5 T.G.S., C.E.S.C. ( W.B.)
240 0.3220 0.3220 100.00 0.3900 0.3900 100.00
6 BOKARO 'B',
D.V.C. (Jharkhand)
500 1.4908 1.7489 117.31 1.3475 1.4907 110.63
7 SALAYA, E.P.G.L. (Gujarat)
600 (1200)
0.0036 0.0036 100.00 0.1367 0.1367 100.00
8 SURAT LIGNITE, G.I.P.C.L. (Gujarat)
500 0.4580 0.4582 100.05 0.5721 0.5721 100.00
9 AKRIMOTA,
G.M.D.C.L. (Gujarat)
250 0.1705 0.1871 109.76 0.1858 0.1859 100.00
10 KUTCH LIGNITE, G.S.E.C.L.
(Gujarat)
290 0.2750 0.2760 100.36 0.3610 0.3610 100.00
11 MAHATMA GANDHI,
J.H.P.L., (Haryana)
1320 0.0412 0.0412 100.00 0.7795 0.7795 100.00
12 BARSINGSAR LIGNIT,
E.N.L.C. (Rajasthan)
250 0.1181 0.1181 100.00 0.2297 0.2400 104.51
13 TALCHAR,
NTPC Ltd. (Odisha)
460 1.1930 1.1930 100.00 1.2350 1.2350 100.00
14 KOTA, R.R.V.U.N.L.,
(Rajasthan)
1240 2.0284 2.1070 103.87 1.8504 2.2891 123.71
15 GIRAL, R.R.V.U.N.L.,
(Rajasthan)
250 0.1831 0.1831 100.00 0.1942 0.1942 100.00
16 SVPL, S.V.P.P.L., (Chhattisgarh)
63 0.0334 0.0334 100.00 0.0278 0.0278 100.00
17 TROMBAY T.P. CO., (Jharkhand)
750 0.0722 0.0722 100.00 0.0784 0.0787 101.00
18 METTUR T.N.G & D., (Tamil Nadu)
840 1.6497 2.7372 165.92 1.3432 2.4561 183.86
19 NORTH CHENNAI
T.N.G & D, (Tamil Nadu)
630 0.9580 2.3180 241.96 1.1090 1.7690 159.58

13
2011-12 2012-13
Fly ash
Generation
Fly ash
Utilization
Fly ash
Generation
Fly ash
Utilization
Sl. No.
Name of TPS &
Power Utility
Installed Capacity
(In Million-ton)
Percentage
(%)
(In Million-ton)
Percentage
(%)
(1) (2) (3) (4) (5) (6) (7) (8) (9)
20 PANKI, U.P.R.V.U.N.L., (U.P.)
210 0.2747 0.3789 137.95 0.2571 0.4016 156.21
21 KOLAGHAT,
W.B.P.D.C.L., (W.B.)
1260 2.5470 3.0200 118.57 2.4387 3.4196 143.63
22 BANDEL,
W.B.P.D.C.L. (W.B.)
450 0.6510 0.7410 113.82 0.5617 0.7479 146.32
23 BAKRESWAR, W.B.P.D.C.L.
(W.B.)
1050 1.9760 2.3780 120.34 2.0795 2.3103 111.31
24 WARDHA, W.P.C.L.,
(Maharashtra)
540 0.7992 0.7992 100.00 0.8453 0.8453 100.00
25 MUZAFFARPUR, K.B.U.N.L., (Bihar)
220 0.0863 0.0863 100.00 - - -
26 KHAPARKHEDA,
M.S.P.G.C.L., (Maharashtra)
840 1.4801 1.5501 104.73 - - -
27 SABARMATI,
Torrent Power Ltd. (Gujarat)
400
0.4700 0.6565 139.68 - - -
28 HARDUAGANJ, U.P.R.V.U.N.L.,
(U.P.)
420 0.0191 0.0232 121.47 - - -
29 KATGHORA, V.E.S.P.L.,
(Chhattisgarh)
35 0.0037 0.0037 100.00 - - -
30 GEPL, Gupta Energy Pvt. Ltd., (Maharashtra)
120 - - - 0.1428 0.1428 100.00
31 RATIJA, Spectrum Coal & Power Ltd.,
(Chhattisgarh)
50 - - - 0.0103 0.0103 100.00
32 AMARAVATI, Indiabulls Power Ltd., (Maharashtra)
270 - - - 0.0001 0.0001 100.00
33 NEW COSSIPORE, C.E.S.C. ( W.B. )
160 - - - 0.0551 0.0551 100.00
34 DISHERGARH POWER STATION,
D.P.S.C.L., (W.B.)
12 - - - 0.0197 0.0197 100.00
35 MAHAN, ESSAR POWER MP Ltd., (M.P.)
600 - - - 0.0080 0.0080 100.00

14
2011-12 2012-13
Fly ash
Generation
Fly ash
Utilization
Fly ash
Generation
Fly ash
Utilization
Sl. No.
Name of TPS &
Power Utility
Installed Capacity
(In Million-ton)
Percentage
(%)
(In Million-ton)
Percentage
(%)
(1) (2) (3) (4) (5) (6) (7) (8) (9)
36 GANDHINAGAR, G.S.E.C.L.(Gujarat)
870 - - - 0.8580 0.8590 100.15
37 SIKKA, G.S.E.C.L.(Gujarat)
240 - - - 0.1850 0.2136 115.37
38 JOJOBERA, Tata Power Co., (Jharkhand)
427.5 - - - 1.1552 1.2084 105.56
[‘-‘ denotes that TPS is not in the range of fly ash utilization under consideration]
It may be seen from Table-IX above that:
(i) During the Year 2011-12, 29 thermal power stations have achieved the fly ash utilization
level of 100% or more than 100%. 15 thermal power stations out of 29 have achieved fly
ash utilization level of more than 100%.
(ii) During the year 2012-13, 32 thermal power stations have achieved the fly ash utilization
level of 100% or more than 100%. 13 thermal power stations out of 32 have achieved fly
ash utilization level of more than 100%.
Power Stations which have achieved fly ash utilization level of more than 100% during the years
2011-12 and/or during the year 2012-13 have utilized the fly ash stored in ash ponds during
earlier years.
4.4 Power Stations in Fly Ash Utilization Range of less than 100% and up to 75%
during the Years 2011-12 and 2012-13
The names of Thermal Power Stations which have achieved the fly ash utilization level of less
than 100% and up to 75% during the years 2011-12 and 2012-13 along with fly ash utilization
level achieved by each of these power stations are given in Table-X below:
TABLE-X
THERMAL POWER STATIONS WITH FLY ASH UTILIZATION LEVEL OF LESS THAN 100%
AND UP TO 75% DURING FOR THE YEARS 2011-12 AND 2012-13
2011-12 2012-13
Fly ash Generation
Fly ash Utilization
Fly ash Generation
Fly ash Utilization
Sl.
No.
Name of TPS
& Power Utility
Installed
Capacity
(In Million-ton)
Percentage (%)
(In Million-ton)
Percentage (%)
(1) (2) (3) (4) (5) (6) (7) (8) (9)
1 KASAI PALLI, A.C.B.P.L.,
(Chhattisgarh)
135 0.1143 0.0958 83.80 - - -
2 BARKHERA, B.E.P.L. (U.P.)
90 0.0295 0.0251 85.06 0.2043 0.1634 80.00
3 KHAMBAR KHERA,
B.E.P.L. (U.P.)
90 0.0412 0.0347 84.24 0.2084 0.1701 81.64
4 KUNDARKI, B.E.P.L. (U.P.)
90 0.0110 0.0093 84.45 0.2023 0.1759 86.96
5 MAQSOODPUR,
B.E.P.L. (U.P.)
90 0.0235 0.0199 84.41 0.2104 0.1706 81.06

15
2011-12 2012-13
Fly ash
Generation
Fly ash
Utilization
Fly ash
Generation
Fly ash
Utilization
Sl. No.
Name of TPS &
Power Utility
Installed Capacity
(In Million-ton)
Percentage
(%)
(In Million-ton)
Percentage
(%)
(1) (2) (3) (4) (5) (6) (7) (8) (9)
6 UTRAULA, B.E.P.L. (U.P.)
90 0.0079 0.0067 85.00 0.1536 0.1245 81.06
7 D.P.L ,
D.P.L. (W. B.)
641 0.6908 0.6051 87.59 0.7033 0.6411 91.16
8 RAJGHAT, I.P.G.C.L. (Delhi)
135 0.2278 0.1725 75.70 0.2384 0.1999 83.85
9 RATNAGIRI,
JSW Energy Ltd. (Maharashtra)
1200 0.2250 0.1760 78.22 0.2937 0.2731 93.00
10 VIJAYANAGAR,
JSW Energy Ltd., (Karnataka)
860 0.2223 0.2191 98.56 0.2338 0.2334 99.57
11 SANJAY GANDHI, M.P.P.G.C.L (M.P.)
1340 1.6610 1.5680 94.40 2.2907 1.8017 78.65
12 NASHIK, M.S.P.G.C.L., (Maharashtra)
630 1.2760 1.0381 81.36 1.2680 0.9530 75.12
13 NEYVELI -I EXPN. N.L.C. Ltd. (Tamil Nadu)
420 0.2270 0.2221 97.84 0.2385 0.2385 99.80
14 BADARPUR,
NTPC Ltd. (Delhi)
705 1.2640 1.1010 87.10 1.2020 1.0410 86.61
15 FARAKKA, NTPC Ltd. (W.B.)
2100 2.2070 1.9810 89.76 3.6470 3.3340 91.40
16 LEHRA MOHABAT, P.S.P.C.L., (Punjab)
920 1.4113 1.1482 81.35 1.2306 1.0788 87.66
17 ROPAR,
P.S.P.C.L. (Punjab)
1260 1.5284 1.4373 94.04 1.8056 1.4764 81.76
18 SURATGARH, R.R.V.U.N.L.,
(Rajasthan)
1500 2.1100 1.7275 81.87 2.1259 1.8796 88.40
19 CHHABRA R.R.V.U.N.L., (Rajasthan)
500 0.5774 0.5575 96.56 0.6609 0.5433 84.36
20 DAHANU, Reliance Infrastructure Ltd.
(Maharashtra)
500 0.7790 0.6080 78.05 0.8370 0.7200 86.07
21 CUDDALORE, ST-CMS, (Tamil Nadu)
250 0.1446 0.1305 90.24 0.1700 0.1406 82.71
22 ENNORE, T.N.G & D.
Corporation,
(Tamil Nadu)
450 0.4324 0.4148 95.92 0.3941 0.3331 84.54
23 CHINAKURI, D.P.S.C.L. (W.B.)
30.00 0.0153 0.0149 97.16 - - -

16
2011-12 2012-13
Fly ash
Generation
Fly ash
Utilization
Fly ash
Generation
Fly ash
Utilization
Sl. No.
Name of TPS &
Power Utility
Installed Capacity
(In Million-ton)
Percentage
(%)
(In Million-ton)
Percentage
(%)
(1) (2) (3) (4) (5) (6) (7) (8) (9)
24 GANDHINAGAR, G.S.E.C.L.(Gujarat)
870 1.2450 0.9870 79.28 - - -
25 UNCHAHAR,
NTPC Ltd. (U.P.)
1050 2.5730 1.9320 75.09 - - -
26 JOJOBERA, Tata Power Co. (Jharkhand)
427.5 0.8938 0.6721 75.19 - - -
27 TENUGHAT, T.V.N.L. (Jharkhand)
420 0.6167 0.5838 94.67 - - -
28 RAYALSEEMA, A.P.GENCO (A.P.)
1050 - - - 2.0868 1.6271 77.95
29 BARAUNI, B.S.E.B. (Bihar)
220 - - - 0.0000* 0.0148 98.63
30 KORBA (WEST), C.S.P.G.C.L. (Chhattisgarh)
840 - - - 1.4829 1.2395 83.58
31 DURGAPUR, D.V.C. (W. B.)
350 - - - 0.8172 0.6933 84.84
32 MEJIA, D.V.C. (W.B.)
2340 - - - 3.7320 3.1610 84.70
33 DADRI, NTPC Ltd. (U.P.)
1820 - - - 2.7440 2.3800 86.75
34 SABARMATI,
Torrent Power Ltd. (Gujarat)
400 - - - 0.4690 0.4590 97.76
35 SIMHAPURI, S.E.P.L. (A.P.)
300 - - - 0.0658 0.0654 99.45
36 UDUPI, U.P.C.L. (Karnataka)
1200 - - - 0.1391 0.1075 77.32
37 EMCO ENERGY, EMCO ENERGY Ltd. (Maharashtra)
300 - - - 0.0241 0.0200 83.00
38 PARAS
M.S.P.G.C.L. (Maharashtra)
500 - - - 0.9440 0.7210 75.23
39 PARLI M.S.P.G.C.L.
(Maharashtra)
1130 - - - 1.5060 1.1920 79.16
[‘-‘ denotes that TPS is not in the range of fly ash utilization under consideration] * Existing stock of unutilized Ash is 0.0149 MT
It may be seen from Table-X above that 27 thermal power stations during the year 2011-12 and
33 thermal power stations during the Year 2012-13 have achieved fly ash utilization level in the
range of less than 100% to 75%.
17
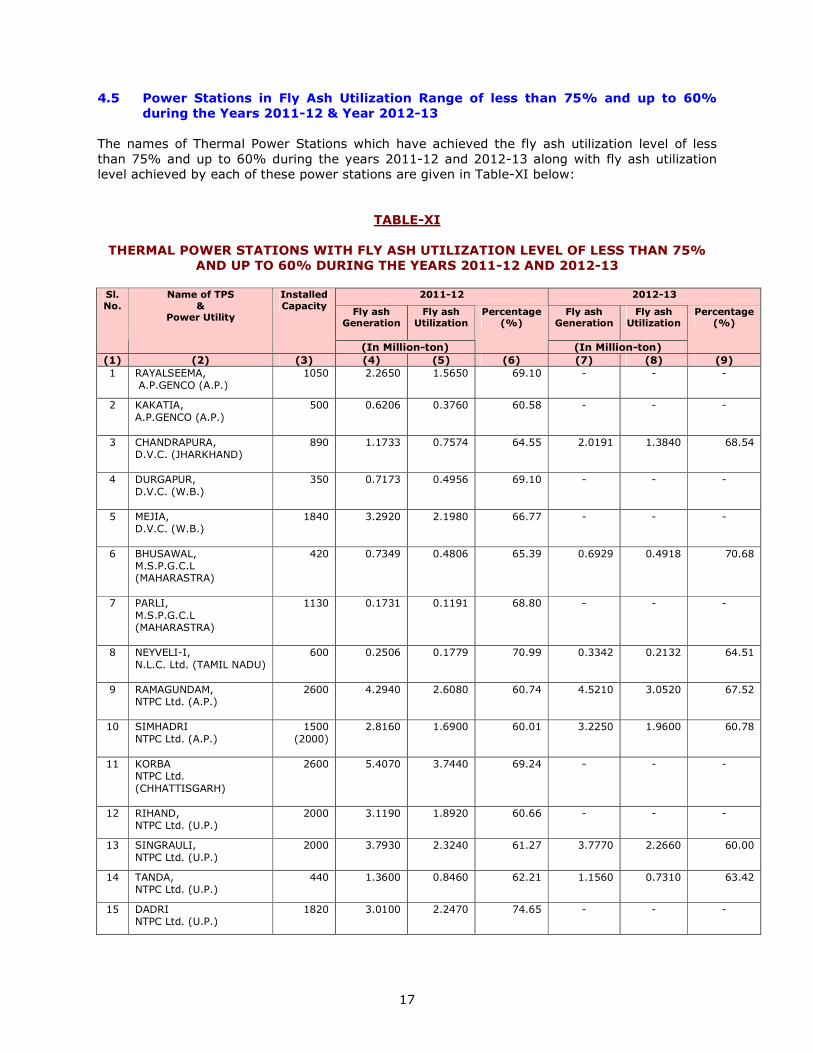
4.5 Power Stations in Fly Ash Utilization Range of less than 75% and up to 60%
during the Years 2011-12 & Year 2012-13
The names of Thermal Power Stations which have achieved the fly ash utilization level of less
than 75% and up to 60% during the years 2011-12 and 2012-13 along with fly ash utilization
level achieved by each of these power stations are given in Table-XI below:
TABLE-XI
THERMAL POWER STATIONS WITH FLY ASH UTILIZATION LEVEL OF LESS THAN 75%
AND UP TO 60% DURING THE YEARS 2011-12 AND 2012-13
2011-12 2012-13
Fly ash Generation
Fly ash Utilization
Fly ash Generation
Fly ash Utilization
Sl. No.
Name of TPS &
Power Utility
Installed Capacity
(In Million-ton)
Percentage (%)
(In Million-ton)
Percentage (%)
(1) (2) (3) (4) (5) (6) (7) (8) (9)
1 RAYALSEEMA, A.P.GENCO (A.P.)
1050 2.2650 1.5650 69.10 - - -
2 KAKATIA,
A.P.GENCO (A.P.)
500 0.6206 0.3760 60.58 - - -
3 CHANDRAPURA, D.V.C. (JHARKHAND)
890 1.1733 0.7574 64.55 2.0191 1.3840 68.54
4 DURGAPUR,
D.V.C. (W.B.)
350 0.7173 0.4956 69.10 - - -
5 MEJIA, D.V.C. (W.B.)
1840 3.2920 2.1980 66.77 - - -
6 BHUSAWAL, M.S.P.G.C.L (MAHARASTRA)
420 0.7349 0.4806 65.39 0.6929 0.4918 70.68
7 PARLI,
M.S.P.G.C.L (MAHARASTRA)
1130 0.1731 0.1191 68.80 - - -
8 NEYVELI-I,
N.L.C. Ltd. (TAMIL NADU)
600 0.2506 0.1779 70.99 0.3342 0.2132 64.51
9 RAMAGUNDAM, NTPC Ltd. (A.P.)
2600 4.2940 2.6080 60.74 4.5210 3.0520 67.52
10 SIMHADRI
NTPC Ltd. (A.P.)
1500
(2000)
2.8160 1.6900 60.01 3.2250 1.9600 60.78
11 KORBA NTPC Ltd.
(CHHATTISGARH)
2600 5.4070 3.7440 69.24 - - -
12 RIHAND, NTPC Ltd. (U.P.)
2000 3.1190 1.8920 60.66 - - -
13 SINGRAULI,
NTPC Ltd. (U.P.)
2000 3.7930 2.3240 61.27 3.7770 2.2660 60.00
14 TANDA, NTPC Ltd. (U.P.)
440 1.3600 0.8460 62.21 1.1560 0.7310 63.42
15 DADRI NTPC Ltd. (U.P.)
1820 3.0100 2.2470 74.65 - - -

18
2011-12 2012-13
Fly ash Generation
Fly ash Utilization
Fly ash Generation
Fly ash Utilization
Sl. No.
Name of TPS &
Power Utility
Installed Capacity
(In Million-ton)
Percentage (%)
(In Million-ton)
Percentage (%)
(1) (2) (3) (4) (5) (6) (7) (8) (9)
16 TUTICORIN,
TG & D.C. Ltd. (TAMIL NADU)
1050 2.1054 1.2800 60.79 2.2534 1.4930 66.25
17 UDUPI U.P.C.L. (KARNATAK)
600 0.0800 0.0490 61.25 - - -
18 BHILAI,
N.S.P.C.L. (CHHATTISHGARH)
500 - - - 0.9945 0.6976 70.15
19 DR. NTR (VIJAIWADA),
APGENCO (A.P.)
1760 - - - 4.1007 2.9170 71.13
20 BELLARY, K.P.C.L. (KARNATKA)
1000 - - - 0.5381 0.3813 70.85
21 VINDHYACHAL,
NTPC Ltd. (M.P.)
4260 - - - 6.9350 4.6130 66.50
22 BHATINDA, P.S.P.C.L. (PUNJAB)
440 - - - 0.3215 0.2211 68.77
23 KHAPARKHEDA,
M.S.P.G.C.L. (MAHARASTRA)
840 - - - 1.8457 1.2867 69.70
24 NEYVELI-II,
N.L.C. Ltd. (TAMIL NADU)
1470 - - - 0.7996 0.4745 60.50
25 UNCHAHAR, NTPC Ltd. (U.P.)
1050 - - - 2.4540 1.5320 62.49
26 JALIIPA KAPURDI,
R.W.P.L. (RAJASTHAN)
1080 - - - 0.5275 0.3614 68.50
27 PARICHHA, U.P.R.V.U.N.L. (U.P.)
1140 - - - 1.1380 0.7033 61.80
28 BINA, Jaypee Bina Thermal Power Plant (M.P.)
500 - - - 0.1569 0.1047 66.66
[‘-‘ denotes that TPS is not in the range of fly ash utilization under consideration]
It may be seen from Table-XI above that 17 thermal power stations during the year 2011-12 and
19 thermal power stations during the year 2012-13 have achieved fly ash utilization level of less
than 75% and up to 60%.
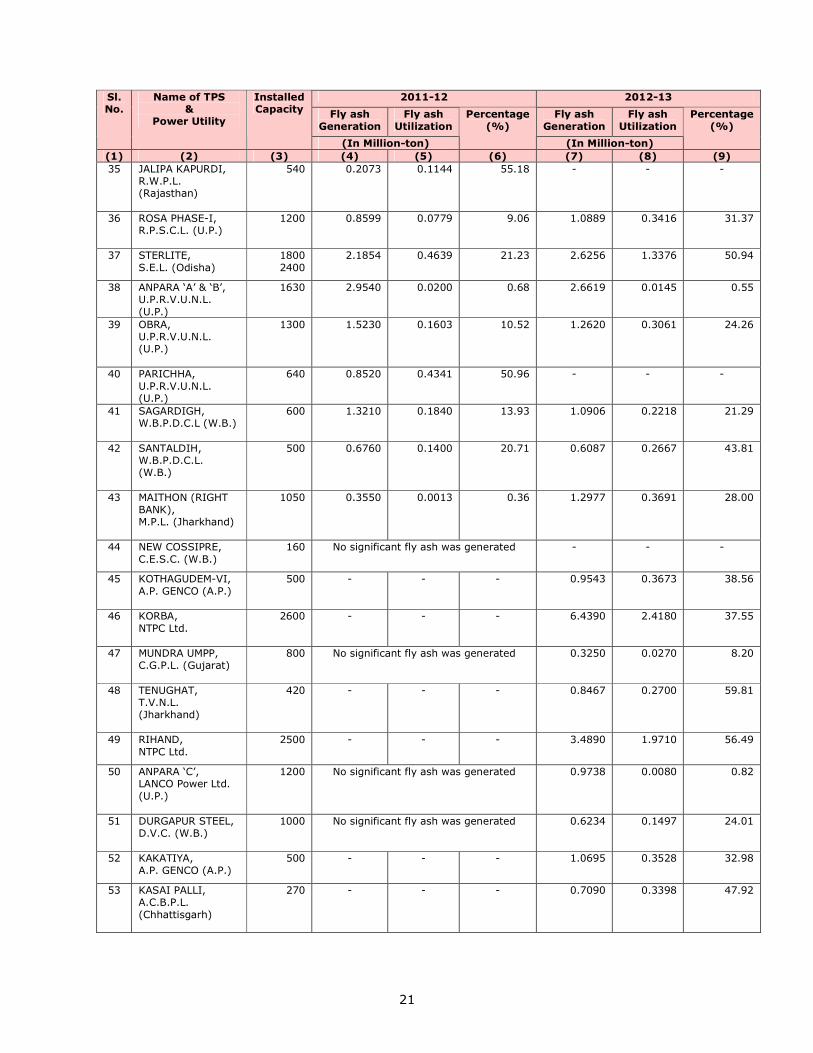
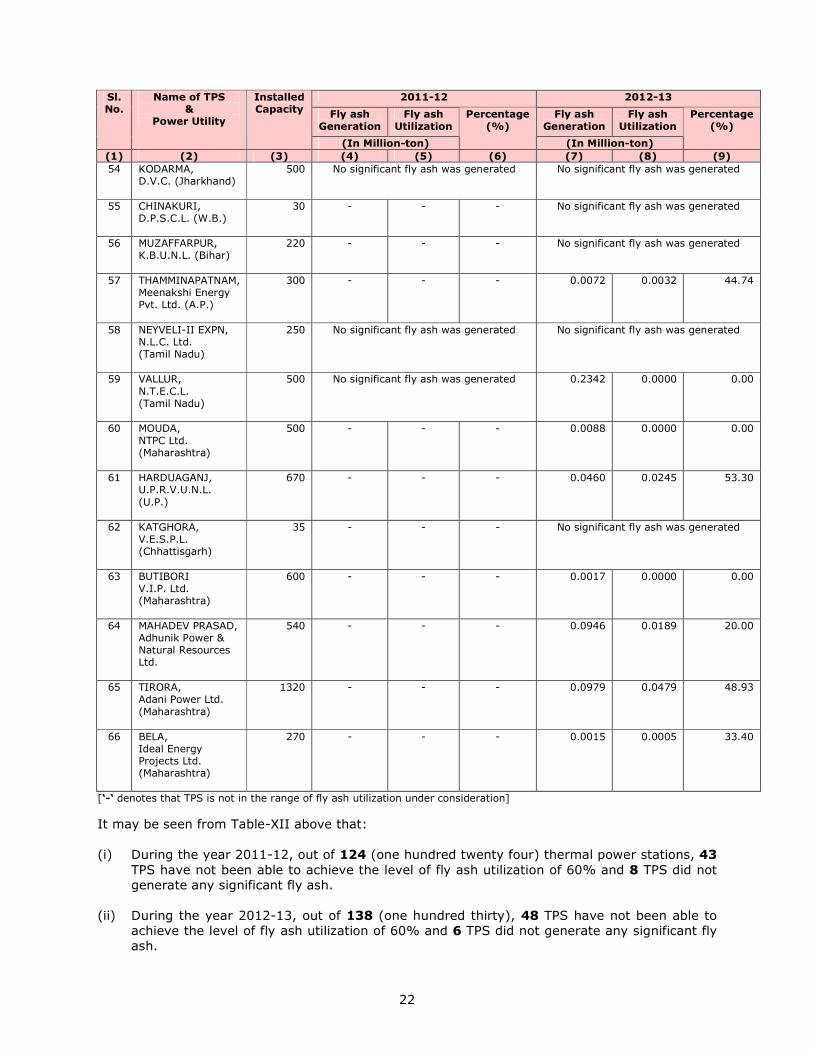
4.6 Power Stations with Fly Ash Utilization Level of less than 60% during the Years
2011-12 and 2012-13
The names of Thermal Power Stations which have achieved the fly ash utilization level of less
than 60% during the years 2011-12 and 2012-13 along with fly ash utilization level achieved by
each of these power stations are given in Table-XII below:

19
TABLE-XII
THERMAL POWER STATIONS WITH FLY ASH UTILIZATION LEVEL OF BELOW 60%
DURING THE YEARS 2011-12 AND 2012-13
2011-12 2012-13
Fly ash Generation
Fly ash Utilization
Fly ash Generation
Fly ash Utilization
Sl.
No.
Name of TPS
& Power Utility
Installed
Capacity
(In Million-ton)
Percentage (%)
(In Million-ton)
Percentage (%)
(1) (2) (3) (4) (5) (6) (7) (8) (9)
1 CHANDRAPUR
A.P.G.P.C.L. (Assam)
60.00 No fly ash was generated No fly ash was generated
2 KOTHAGUDAM
A.P. GENCO (A.P.)
720 2.0113 0.1191 5.92 2.1051 0.1995 9.48
3 KOTHAGUDEM-V A.P. GENCO (A.P.)
500 0.9090 0.2000 22.00 1.4032 0.0711 5.09
4 RAMAGUNDUM’B’
A.P. GENCO (A.P.)
62.50 0.1398 0.0748 53.51 0.1425 0.0601 42.18
5 Dr. N.T.R (VIJAWADA)
A.P. GENCO ( A.P.)
1760 4.0370 2.4200 59.95 - - -
6 INDIRA GANDHI, A.P.C.P.L. (Haryana)
1000 0.7165 0.1736 24.23 1.3689 0.1190 8.70
7 MIHAN, A.M.N.E.P.L. (Maharashtra)
246 0.3110 0.0235 7.55 0.2407 0.0407 26.98
8 KORBA (WEST), C.S.P.G.C.L. (Chhattisgarh)
840 1.5737 0.6279 39.90 - - -
9 KORBA(EAST),
C.S.P.G.C.L. (Chhattisgarh)
440 0.9701 0.2198 22.66 1.0557 0.1270 12.03
10 DSPM,
C.S.P.G.C.L. (Chhattisgarh)
500 0.9872 0.0000 0.00 1.0880 0.0000 0.00
11 SIKKA, G.S.E.C.L.(Gujarat)
240 0.3480 0.1830 52.59 - - -
12 UKAI, G.S.E.C.L (Gujarat)
850 1.4530 0.5230 35.99 1.3780 0.7490 54.34
13 WANAKBORI,
G.S.E.C.L. Gujarat)
1470 2.9160 1.0390 35.63 2.3990 1.3010 54.23
14 HISAR, H.P.G.C.L. (Haryana)
1200 1.0995 0.0319 2.90 1.4738 0.1856 12.59
15 YAMUNANAGAR, H.P.G.C.L. (Haryana)
600 0.8470 0.3480 41.09 0.2410 0.0259 10.75
16 PANIPAT,
H.P.G.C.L. (Haryana)
1367.8 3.2631 1.4063 43.10 2.7258 1.3653 50.09

20
2011-12 2012-13
Fly ash
Generation
Fly ash
Utilization
Fly ash
Generation
Fly ash
Utilization
Sl. No.
Name of TPS &
Power Utility
Installed Capacity
(In Million-ton)
Percentage
(%)
(In Million-ton)
Percentage
(%)
(1) (2) (3) (4) (5) (6) (7) (8) (9)
17 O.P. JINDAL, J.P.L. (Chhattisgarh)
1000 1.9350 1.1360 58.71 1.9990 1.1940 59.72
18 PATRATU, J.S.E.B. (Jharkhand)
770 0.1510 0.0117 7.75 0.2590 0.0061 2.36
19 BELLARY, K.P.C.L. (Karnataka)
500 0.5422 0.2283 42.11 - - -
20 RAICHUR, K.P.C.L.
(Karnataka)
1720 1.8570 0.9550 51.43 2.4932 0.9100 36.50
21 AMARKANTAK,
LANCO Power Ltd.
600 0.9740 0.2360 24.23 0.8335 0.3582 42.96
22 SATPURA, M.P.P.G.C.L. (M.P.)
1142.5 2.1676 0.0328 1.52 2.0185 0.5221 25.86
23 AMARKANTAK, M.P.P.G.C.L. (M.P.)
450 0.5450 0.0600 11.01 0.7441 0.1605 21.57
24 CHANDRAPUR, M.S.P.G.C.L.
(Maharashtra)
2340 4.6157 1.1245 24.36 4.2539 1.5419 36.18
25 KORADI, M.S.P.G.C.L. (Maharashtra)
1100 1.2080 0.5250 43.46 0.8280 0.4590 51.46
26 PARAS, M.S.P.G.C.L. (Maharashtra)
500 0.9212 0.4890 53.08 - - -
27 NEYVELI-II, N.L.C. Ltd. (Tami Nadu)
1470 0.8990 0.4210 46.83 - - -
28 BHILAI, N.S.P.C.L. (Chhattisgarh)
500 1.1342 0.3252 28.67 - - -
29 KAHALGAON,
NTPC Ltd.
2340 3.9190 0.9600 24.50 4.5630 1.0220 22.40
30 SIPAT, NTPC Ltd.
1660 2980
2.6150 0.3220 12.31 4.1760 0.8620 20.64
31 VINDHYACHAL, NTPC Ltd.
3260 6.2470 2.8950 46.34 - - -
32 TALCHAR (KAN), NTPC Ltd.
3000 6.2350 1.7940 28.77 6.7260 2.5500 37.91
33 IB VALLEY, O.P.G.C.L. (Odisha)
420 1.0478 0.1754 16.74 1.1093 0.1801 16.24
34 BATHINDA,
P.S.P.C.L. (Punjab)
440 0.4664 0.2347 50.32 - - -
21
2011-12 2012-13
Fly ash
Generation
Fly ash
Utilization
Fly ash
Generation
Fly ash
Utilization
Sl. No.
Name of TPS &
Power Utility
Installed Capacity
(In Million-ton)
Percentage
(%)
(In Million-ton)
Percentage
(%)
(1) (2) (3) (4) (5) (6) (7) (8) (9)
35 JALIPA KAPURDI, R.W.P.L. (Rajasthan)
540 0.2073 0.1144 55.18 - - -
36 ROSA PHASE-I, R.P.S.C.L. (U.P.)
1200 0.8599 0.0779 9.06 1.0889 0.3416 31.37
37 STERLITE,
S.E.L. (Odisha)
1800
2400
2.1854 0.4639 21.23 2.6256 1.3376 50.94
38 ANPARA ‘A’ & ‘B’, U.P.R.V.U.N.L.
(U.P.)
1630 2.9540 0.0200 0.68 2.6619 0.0145 0.55
39 OBRA, U.P.R.V.U.N.L. (U.P.)
1300 1.5230 0.1603 10.52 1.2620 0.3061 24.26
40 PARICHHA,
U.P.R.V.U.N.L. (U.P.)
640 0.8520 0.4341 50.96 - - -
41 SAGARDIGH, W.B.P.D.C.L (W.B.)
600 1.3210 0.1840 13.93 1.0906 0.2218 21.29
42 SANTALDIH, W.B.P.D.C.L. (W.B.)
500 0.6760 0.1400 20.71 0.6087 0.2667 43.81
43 MAITHON (RIGHT
BANK), M.P.L. (Jharkhand)
1050 0.3550 0.0013 0.36 1.2977 0.3691 28.00
44 NEW COSSIPRE,
C.E.S.C. (W.B.)
160 No significant fly ash was generated - - -
45 KOTHAGUDEM-VI,
A.P. GENCO (A.P.)
500 - - - 0.9543 0.3673 38.56
46 KORBA,
NTPC Ltd.
2600 - - - 6.4390 2.4180 37.55
47 MUNDRA UMPP, C.G.P.L. (Gujarat)
800 No significant fly ash was generated 0.3250 0.0270 8.20
48 TENUGHAT, T.V.N.L. (Jharkhand)
420 - - - 0.8467 0.2700 59.81
49 RIHAND,
NTPC Ltd.
2500 - - - 3.4890 1.9710 56.49
50 ANPARA ‘C’, LANCO Power Ltd.
(U.P.)
1200 No significant fly ash was generated 0.9738 0.0080 0.82
51 DURGAPUR STEEL, D.V.C. (W.B.)
1000 No significant fly ash was generated 0.6234 0.1497 24.01
52 KAKATIYA,
A.P. GENCO (A.P.)
500 - - - 1.0695 0.3528 32.98
53 KASAI PALLI, A.C.B.P.L.
(Chhattisgarh)
270 - - - 0.7090 0.3398 47.92
22
2011-12 2012-13
Fly ash
Generation
Fly ash
Utilization
Fly ash
Generation
Fly ash
Utilization
Sl. No.
Name of TPS &
Power Utility
Installed Capacity
(In Million-ton)
Percentage
(%)
(In Million-ton)
Percentage
(%)
(1) (2) (3) (4) (5) (6) (7) (8) (9)
54 KODARMA, D.V.C. (Jharkhand)
500 No significant fly ash was generated No significant fly ash was generated
55 CHINAKURI, D.P.S.C.L. (W.B.)
30 - - - No significant fly ash was generated
56 MUZAFFARPUR, K.B.U.N.L. (Bihar)
220 - - - No significant fly ash was generated
57 THAMMINAPATNAM, Meenakshi Energy Pvt. Ltd. (A.P.)
300 - - - 0.0072 0.0032 44.74
58 NEYVELI-II EXPN, N.L.C. Ltd. (Tamil Nadu)
250 No significant fly ash was generated No significant fly ash was generated
59 VALLUR,
N.T.E.C.L. (Tamil Nadu)
500 No significant fly ash was generated 0.2342 0.0000 0.00
60 MOUDA,
NTPC Ltd. (Maharashtra)
500 - - - 0.0088 0.0000 0.00
61 HARDUAGANJ, U.P.R.V.U.N.L.
(U.P.)
670 - - - 0.0460 0.0245 53.30
62 KATGHORA, V.E.S.P.L. (Chhattisgarh)
35 - - - No significant fly ash was generated
63 BUTIBORI V.I.P. Ltd. (Maharashtra)
600 - - - 0.0017 0.0000 0.00
64 MAHADEV PRASAD, Adhunik Power & Natural Resources Ltd.
540 - - - 0.0946 0.0189 20.00
65 TIRORA, Adani Power Ltd.
(Maharashtra)
1320 - - - 0.0979 0.0479 48.93
66 BELA, Ideal Energy Projects Ltd. (Maharashtra)
270 - - - 0.0015 0.0005 33.40
[‘-‘ denotes that TPS is not in the range of fly ash utilization under consideration]
It may be seen from Table-XII above that:
(i) During the year 2011-12, out of 124 (one hundred twenty four) thermal power stations, 43
TPS have not been able to achieve the level of fly ash utilization of 60% and 8 TPS did not
generate any significant fly ash.
(ii) During the year 2012-13, out of 138 (one hundred thirty), 48 TPS have not been able to
achieve the level of fly ash utilization of 60% and 6 TPS did not generate any significant fly
ash.
23
The power stations which are not able to achieve the targets of fly ash utilization as prescribed in
MoEF’s Notification of 3rd November, 2009 during the years 2011-12 and 2012-13 would be
required to utilize the unutilized fly ash in relation to the target for a particular year in the
subsequent years in the manner prescribed in said notification and given in Para 3.1 & 3.2 above.
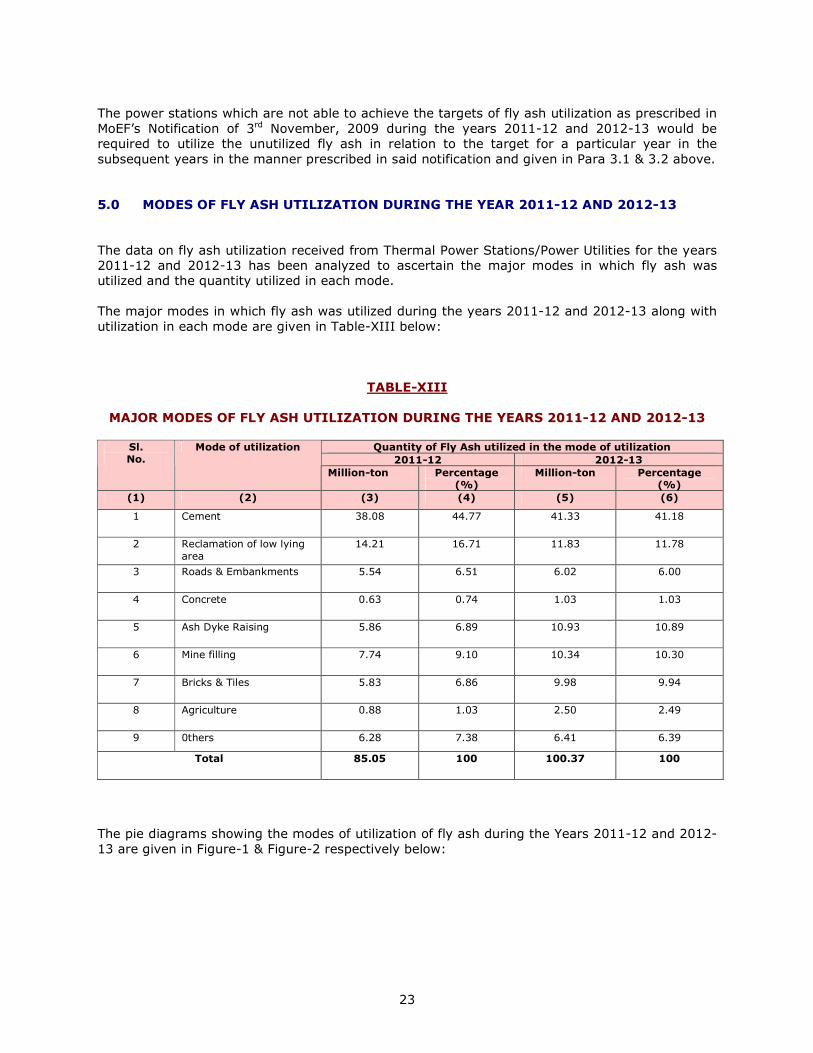
5.0 MODES OF FLY ASH UTILIZATION DURING THE YEAR 2011-12 AND 2012-13
The data on fly ash utilization received from Thermal Power Stations/Power Utilities for the years
2011-12 and 2012-13 has been analyzed to ascertain the major modes in which fly ash was
utilized and the quantity utilized in each mode.
The major modes in which fly ash was utilized during the years 2011-12 and 2012-13 along with
utilization in each mode are given in Table-XIII below:
TABLE-XIII
MAJOR MODES OF FLY ASH UTILIZATION DURING THE YEARS 2011-12 AND 2012-13
Quantity of Fly Ash utilized in the mode of utilization
2011-12 2012-13
Sl. No.
Mode of utilization
Million-ton Percentage (%)
Million-ton Percentage (%)
(1) (2) (3) (4) (5) (6)
1 Cement 38.08 44.77 41.33 41.18
2 Reclamation of low lying
area
14.21 16.71 11.83 11.78
3 Roads & Embankments 5.54 6.51 6.02 6.00
4 Concrete 0.63 0.74 1.03 1.03
5 Ash Dyke Raising 5.86 6.89 10.93 10.89
6 Mine filling 7.74 9.10 10.34 10.30
7 Bricks & Tiles 5.83 6.86 9.98 9.94
8 Agriculture 0.88 1.03 2.50 2.49
9 0thers 6.28 7.38 6.41 6.39
Total 85.05 100 100.37 100
The pie diagrams showing the modes of utilization of fly ash during the Years 2011-12 and 2012-
13 are given in Figure-1 & Figure-2 respectively below:

24
FIGURE-1
FIGURE-2
MODES OF FLY ASH UTILIZATION DURING 2012-13
BRICKS, BLOCKS &
TITLES
9.94%
CEMENT
41.18%
ROADS, EMBANKMENTS
& FLYOVERS
6.00%
CONCRETE
1.03%
ASH DYKE RAISING
10.89%
RECLAMATION OF LOW
LYING AREAS
11.78%
MINE FILLING
10.30%
AGRICULTURE
2.49% OTHERS
6.39%
25
It may be seen from Table-XIII and Figures-1 & 2 above that:
(i) During the Year 2011-12, the maximum utilization of fly ash to the extent of 44.77% of
total fly ash utilized was in the Cement sector, followed by 16.71% in reclamation of low
lying area, 9.10% in mine filling, 6.89% in ash dyke raising, 6.86% in making bricks & tiles,
6.51 % in roads & embankments etc.
(ii) During the Year 2012-13, the maximum utilization of fly ash to the extent of 41.18.% of
total fly ash utilized was in the Cement sector, followed by 11.78% in reclamation of low
lying area, 10.89% in ash dyke raising, 10.30% in mine filling, 9.94% in making bricks &
tiles, 6.00 % in roads & embankments etc.
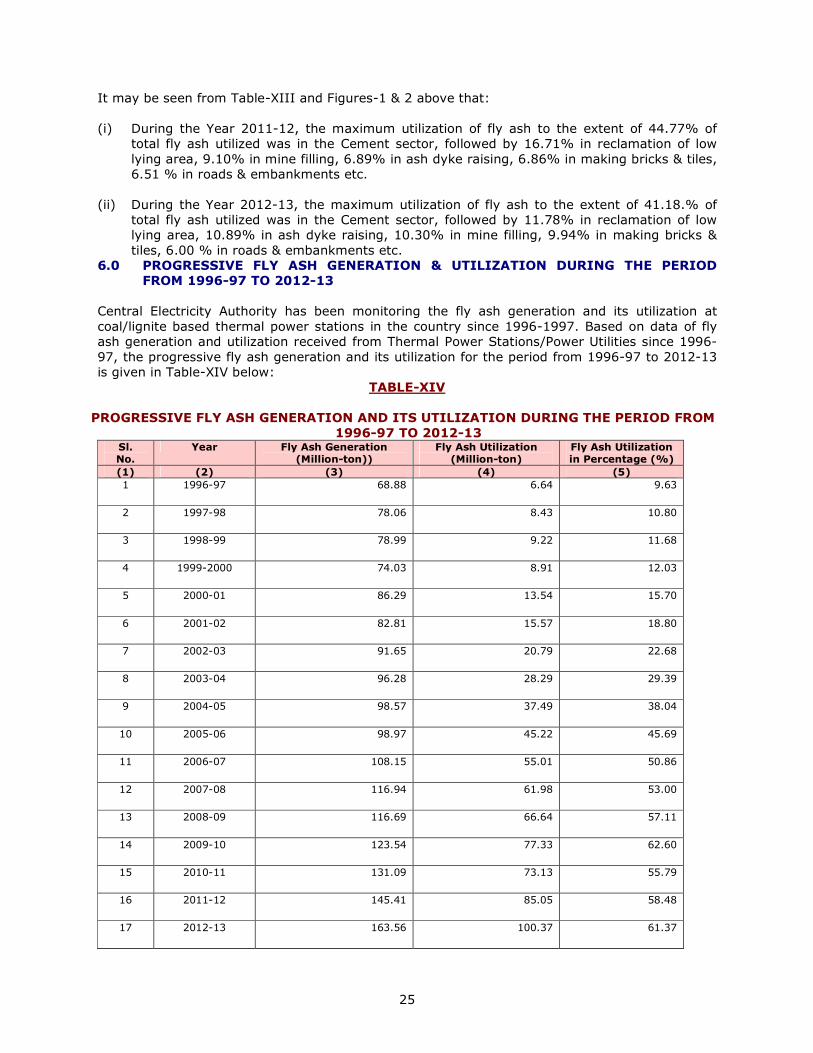
6.0 PROGRESSIVE FLY ASH GENERATION & UTILIZATION DURING THE PERIOD
FROM 1996-97 TO 2012-13
Central Electricity Authority has been monitoring the fly ash generation and its utilization at
coal/lignite based thermal power stations in the country since 1996-1997. Based on data of fly
ash generation and utilization received from Thermal Power Stations/Power Utilities since 1996-
97, the progressive fly ash generation and its utilization for the period from 1996-97 to 2012-13
is given in Table-XIV below:
TABLE-XIV
PROGRESSIVE FLY ASH GENERATION AND ITS UTILIZATION DURING THE PERIOD FROM
1996-97 TO 2012-13 Sl. No.
Year Fly Ash Generation (Million-ton))
Fly Ash Utilization (Million-ton)
Fly Ash Utilization in Percentage (%)
(1) (2) (3) (4) (5)
1 1996-97 68.88 6.64 9.63
2 1997-98 78.06 8.43 10.80
3 1998-99 78.99 9.22 11.68
4 1999-2000 74.03 8.91 12.03
5 2000-01 86.29 13.54 15.70
6 2001-02 82.81 15.57 18.80
7 2002-03 91.65 20.79 22.68
8 2003-04 96.28 28.29 29.39
9 2004-05 98.57 37.49 38.04
10 2005-06 98.97 45.22 45.69
11 2006-07 108.15 55.01 50.86
12 2007-08 116.94 61.98 53.00
13 2008-09 116.69 66.64 57.11
14 2009-10 123.54 77.33 62.60
15 2010-11 131.09 73.13 55.79
16 2011-12 145.41 85.05 58.48
17 2012-13 163.56 100.37 61.37
26
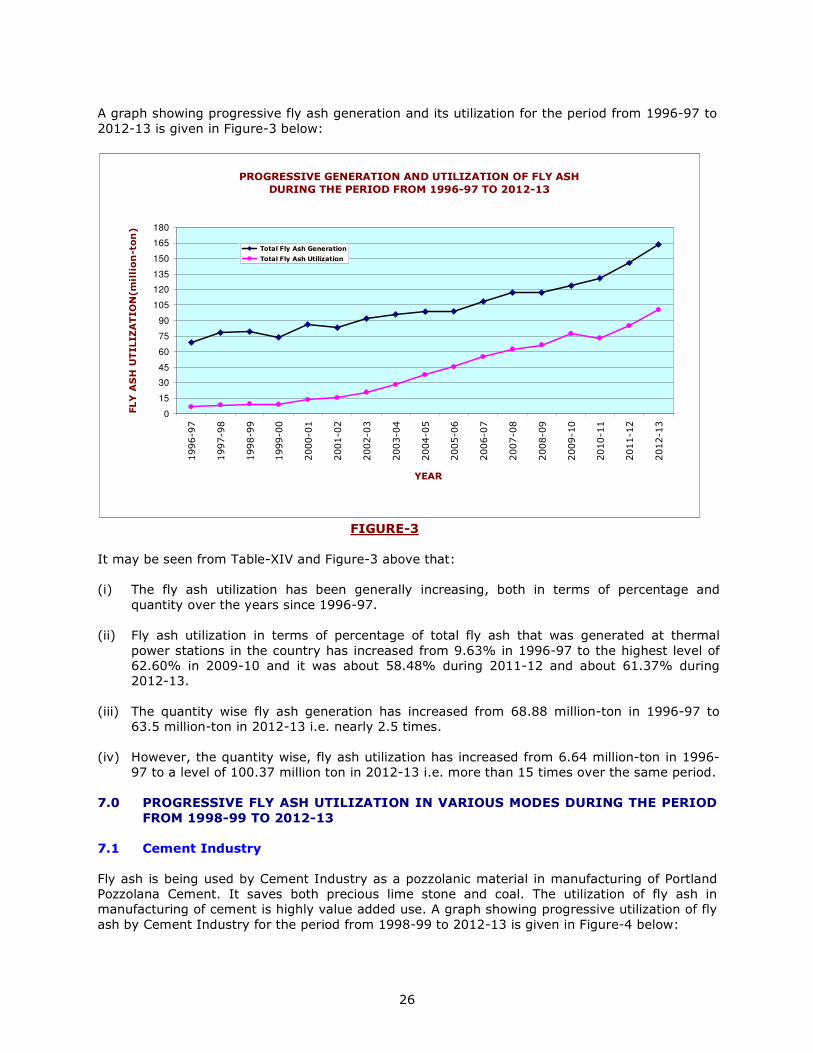
A graph showing progressive fly ash generation and its utilization for the period from 1996-97 to
2012-13 is given in Figure-3 below:
PROGRESSIVE GENERATION AND UTILIZATION OF FLY ASH
DURING THE PERIOD FROM 1996-97 TO 2012-13
0
15
30
45
60
75
90
105
120
135
150
165
180
1996-97
1997-98
1998-99
1999-00
2000-01
2001-02
2002-03
2003-04
2004-05
2005-06
2006-07
2007-08
2008-09
2009-10
2010-11
2011-12
2012-13
YEAR
FLY ASH UTILIZATION(million-ton)
Total Fly Ash Generation
Total Fly Ash Utilization
FIGURE-3
It may be seen from Table-XIV and Figure-3 above that:
(i) The fly ash utilization has been generally increasing, both in terms of percentage and
quantity over the years since 1996-97.
(ii) Fly ash utilization in terms of percentage of total fly ash that was generated at thermal
power stations in the country has increased from 9.63% in 1996-97 to the highest level of
62.60% in 2009-10 and it was about 58.48% during 2011-12 and about 61.37% during
2012-13.
(iii) The quantity wise fly ash generation has increased from 68.88 million-ton in 1996-97 to
63.5 million-ton in 2012-13 i.e. nearly 2.5 times.
(iv) However, the quantity wise, fly ash utilization has increased from 6.64 million-ton in 1996-
97 to a level of 100.37 million ton in 2012-13 i.e. more than 15 times over the same period.
7.0 PROGRESSIVE FLY ASH UTILIZATION IN VARIOUS MODES DURING THE PERIOD
FROM 1998-99 TO 2012-13
7.1 Cement Industry
Fly ash is being used by Cement Industry as a pozzolanic material in manufacturing of Portland
Pozzolana Cement. It saves both precious lime stone and coal. The utilization of fly ash in
manufacturing of cement is highly value added use. A graph showing progressive utilization of fly
ash by Cement Industry for the period from 1998-99 to 2012-13 is given in Figure-4 below:

27
PROGRESSIVE UTILIZATION OF FLY ASH IN CEMENT MANUFACTURING &
CONCRETE DURING THE PERIOD 1998-99 TO 2012-13
0
20
40
60
80
100
120
1998-99
1999-00
2000-01
2001-02
2002-03
2003-04
2004-05
2005-06
2006-07
2007-08
2008-09
2009-10
2010-11
2011-12
2012-13
YEAR
FLY ASH UTILIZATION (million-ton)
Total Fly Ash Utilization
Utilization in Cement Industry
FIGURE-4
It may be seen from Figure-4 above that 2.45 million-ton of fly ash was used by Cement Industry
in 1998-99 which increased to 38.08 million-ton during 2011-12 and constituted 44.77% of total
fly ash utilization in the aforesaid year. During 2012-13, it was 41.33 million-ton and constituted
41.18% of total fly ash utilization in the aforesaid year.
7.2 Reclamation of Low Lying Areas
Fly ash is being used for reclamation of low lying areas which results in saving of fertile top soil.
A graph showing the progressive utilization of fly ash in reclamation of low lying area for the
period from 1998-99 to 2012-13 is given in Figure-5 below:
PROGRESSIVE UTILIZATION OF FLYASH IN RECLAMATION/ OF LOW LYING AREAS
DURING THE PERIOD 1998-99 TO 2012-13
0
20
40
60
80
100
120
1998-99
1999-00
2000-01
2001-02
2002-03
2003-04
2004-05
2005-06
2006-07
2007-08
2008-09
2009-10
2010-11
2011-12
2012-13
YEAR
FLY ASH UTILIZATION (million-ton)
Total Fly Ash Utilization
Utilization of Flyash in Reclamation of low lying area/land filling
FIGURE-5
It may be seen from Figure-5 above that 4.17 million-ton of fly ash was used for reclamation of
low lying area in 1998-99 which has increased to 14.21 million ton in 2011-12 and constituted
16.71% of total fly ash utilization during the aforesaid year. During the year 2012-13, the
utilization of fly ash in reclamation of low lying areas was 11.83 million-ton and constituted
11.78% of total fly ash utilization during the aforesaid year.
28
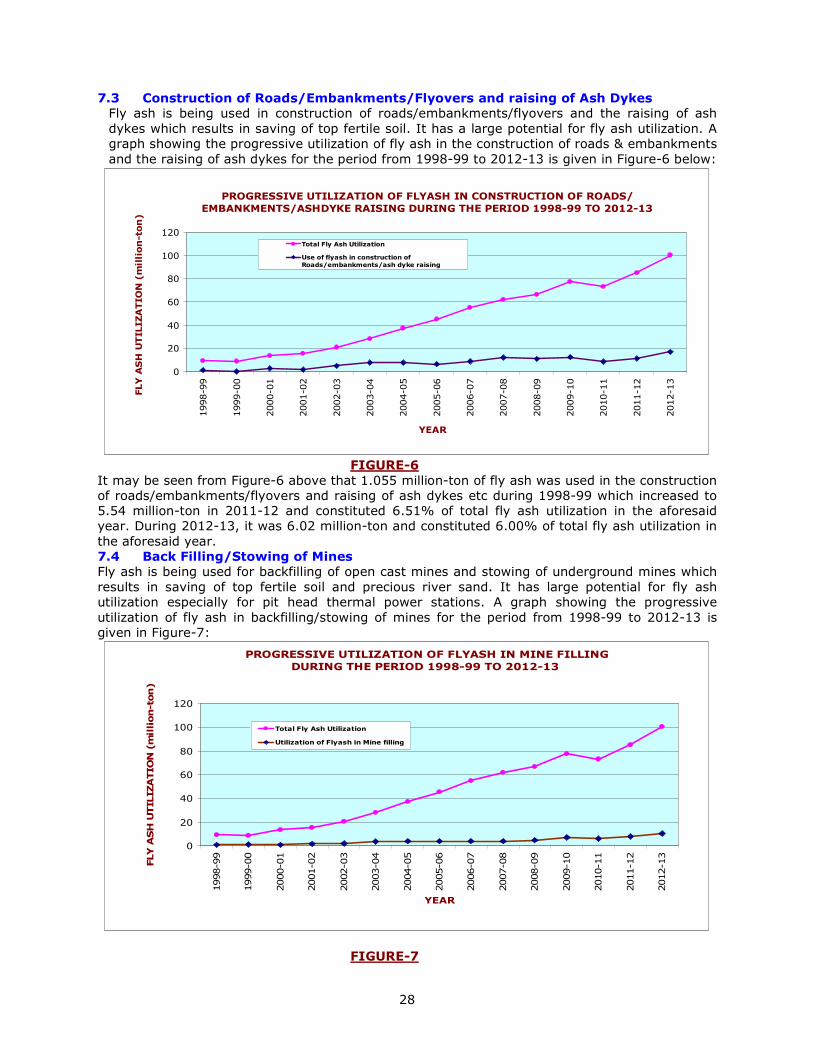
7.3 Construction of Roads/Embankments/Flyovers and raising of Ash Dykes
Fly ash is being used in construction of roads/embankments/flyovers and the raising of ash
dykes which results in saving of top fertile soil. It has a large potential for fly ash utilization. A
graph showing the progressive utilization of fly ash in the construction of roads & embankments
and the raising of ash dykes for the period from 1998-99 to 2012-13 is given in Figure-6 below:
PROGRESSIVE UTILIZATION OF FLYASH IN CONSTRUCTION OF ROADS/
EMBANKMENTS/ASHDYKE RAISING DURING THE PERIOD 1998-99 TO 2012-13
0
20
40
60
80
100
120
1998-99
1999-00
2000-01
2001-02
2002-03
2003-04
2004-05
2005-06
2006-07
2007-08
2008-09
2009-10
2010-11
2011-12
2012-13
YEAR
FLY ASH UTILIZATION (million-ton)
Total Fly Ash Utilization
Use of flyash in construction of
Roads/embankments/ash dyke raising
FIGURE-6
It may be seen from Figure-6 above that 1.055 million-ton of fly ash was used in the construction
of roads/embankments/flyovers and raising of ash dykes etc during 1998-99 which increased to
5.54 million-ton in 2011-12 and constituted 6.51% of total fly ash utilization in the aforesaid
year. During 2012-13, it was 6.02 million-ton and constituted 6.00% of total fly ash utilization in
the aforesaid year.
7.4 Back Filling/Stowing of Mines
Fly ash is being used for backfilling of open cast mines and stowing of underground mines which
results in saving of top fertile soil and precious river sand. It has large potential for fly ash
utilization especially for pit head thermal power stations. A graph showing the progressive
utilization of fly ash in backfilling/stowing of mines for the period from 1998-99 to 2012-13 is
given in Figure-7:
PROGRESSIVE UTILIZATION OF FLYASH IN MINE FILLING
DURING THE PERIOD 1998-99 TO 2012-13
0
20
40
60
80
100
120
1998-99
1999-00
2000-01
2001-02
2002-03
2003-04
2004-05
2005-06
2006-07
2007-08
2008-09
2009-10
2010-11
2011-12
2012-13
YEAR
FLY ASH UTILIZATION (million-ton)
Total Fly Ash Utilization
Utilization of Flyash in Mine filling
FIGURE-7

29
It may be seen from Figure-7 above that 0.65 million-ton of fly ash was used for
backfilling/stowing of open cast and underground mines during 1998-99 which increased to 7.74
million-ton in 2011-12 and constituted 9.10% of total fly ash utilization in the aforesaid year. In
the Year 2012-13, it was 10.34 million-ton and constituted 10.30% of total fly ash utilization in
the aforesaid year.
7.5 Building Materials like Bricks, Blocks and Tiles etc.
Fly ash is being used in manufacturing of fly ash based building products like bricks, blocks, tiles
etc which results in saving of fertile top soil. Fly ash based bricks/blocks/tiles are as good as clay
based conventional building products. It has substantial potential of fly ash utilization especially
for thermal power stations located near load centers. A graph showing progressive utilization of
fly ash in making of fly ash based building products for the period from 1998-99 to 2012-13 is
given in Figure -8 below:
PROGRESSIVE UTILIZATION OF FLY ASH IN MANUFACTURE OF FLYASH BASED
BRICKS/BLOCKS/TILES DURING THE PERIOD 1998-99 TO 2012-13
0
20
40
60
80
100
120
1998-99
1999-00
2000-01
2001-02
2002-03
2003-04
2004-05
2005-06
2006-07
2007-08
2008-09
2009-10
2010-11
2011-12
2012-13
YEAR
FLY ASH UTILIZATION(million-ton)
Total Fly Ash Utilization
Utilization of Flyash in manufacturing of
based Bricks,blocks,tiles
FIGURE-8
It may be seen from Figure-8 above that 0.70 million-ton of fly ash was used for making of fly
ash based bricks/blocks/tiles etc during 1998-99 which increased to 5.83 million-ton in 2011-12
and constituted 6.86% of total fly ash utilization in the aforesaid year. In 2012-13, it was 9.98
million-ton and constituted 9.94% of total fly ash utilization in the aforesaid year.
7.6 Agriculture
Fly ash is being used as manure in agricultural sector as it has many micronutrients. The
progressive utilization of fly ash in Agricultural Sector for the period from 1998-99 to 2012-13
is given in Figure-9.

30
PROGRESSIVE UTILIZATION OF FLY ASH IN AGRICULTURE
DURING THE PERIOD 1998-99 TO 2012-13
0
20
40
60
80
100
120
1998-99
1999-00
2000-01
2001-02
2002-03
2003-04
2004-05
2005-06
2006-07
2007-08
2008-09
2009-10
2010-11
2011-12
2012-13
YEAR
FLY ASH UTILIZATION (million-ton)
Total Fly Ash Utilization
Utilization of Flyash in Agriculture
FIGURE-9
It may be seen from Figure-9 above that 0.126 million ton of fly ash was used in agricultural
sector during 1998-99 which increased to 0.88 million ton in 2011-12 and constituted about
1.03% of total fly ash utilization in the aforesaid year. In 2012-13, it was 2.50 million ton and
constituted 2.49% of total fly ash utilization in the aforesaid year.
8.0 CONCLUSIONS & RECOMMENDATIONS
1. The highest level of fly ash utilization of about 62.6% was achieved in the year 2009-10 and
it was about 58.48% in the year 2011-12 and about 61.37% in the year 2012-13. It would
require a lot of efforts to achieve the target of 100% utilization of fly ash as stipulated in
MoEF’s Notification of 3rd November, 2009.
2. While according environmental clearance to Thermal Power Projects, MoEF has been
recently stipulating conditions to the effect that fly ash shall not be used in filling of low
lying areas, in agriculture and in backfilling/stowing of mines etc. These conditions are
contrary to provisions in MOEF’s own Notification of 3rd November, 2009 on fly ash
utilization and are going to have adverse impact on the pace of fly ash utilization in the
country. Many organizations including NTPC have raised their concern on these conditions.
These conditions may have to be suitably reviewed by MoEF so that the target of 100%
utilization of fly ash as mandated in MoEF’s Notification of 3rd November, 2009 could be
achieved.
3. The utilization of fly ash in mine filling, in making fly ash based building products and in the
construction of roads & embankments has been less than 10% or around 10% in each of
these areas of fly ash utilization. These areas have large potential of fly ash utilization which
needs to be explored for increasing the overall utilization of fly ash in the country.
4. A few strategies which need to be adopted to further increase the utilization level of fly ash
are given below:
• Renovation and modernization of coal/lignite based Thermal Power Station needs to
include the technological advancement required to ensure development of dry fly ash
collection, storage and disposal facilities so that fly ash in dry form could be made
31
available to its users. Renovation and modernization should also include a marketing
strategy for the development of fly ash based industries and making available fly ash
and fly ash based building products in the nearby markets.
• The states and districts where thermal power stations are located need to be sensitized
to the need for utilization of fly ash and fly ash based building products and take
necessary measures to promote them in the construction of buildings, highways/roads/
flyovers and other infrastructure projects. Measures can include policy intervention,
planning strategies, fiscal incentives, recognizing specific efforts etc.
• Use of fly ash based building products like fly ash based bricks, blocks, tiles etc. by both
Govt. and Public & Private Construction agencies at Central and State levels is required
to be ensured especially in construction works within a radius of 100km of any coal/
lignite based thermal power station as mandated in MoEF’s Notification of 3rd November,
2009. The government agencies responsible for approval of building plans may have to
ensure stipulation of a condition in their approval to the effect that only fly ash based
building products like bricks/blocks/tiles etc shall be used in the construction of buildings
as prescribed in MoEF’s Notification of 3rd November, 2009 within a prescribed distance
of any thermal power station especially in the construction of large office/commercial
buildings and housing projects being developed both in government and private sectors.
• Use of fly ash in the construction of roads, road embankments and flyovers is well
established and is slowly picking up. However, its potential is yet to be fully utilized. The
use of fly ash in these projects within a radius of 100 km of any thermal power station
as mandated in MoEF’s Notification of 3rd November, 2009 has to be ensured right from
project formulation stage and included in tender documents by having a prior tie up with
the concerned thermal power station for their requirement. There is a need to sensitize
National Highway Authority of India, CPWD, State PWDs and other agencies both at
Central and State levels that are involved in the construction of highways, roads,
flyovers etc in this matter.
• Use of fly ash in backfilling/stowing of closed/abandoned/running open cast and
underground mines has large potential for utilization of fly ash, especially for pit head
thermal power stations which otherwise have limited avenues for fly ash utilization.
However, its potential is yet to be fully utilized. The use of fly ash in back filling/stowing
of open cast and underground mines within a radius of 50 km of any thermal power
station as mandated in MoEF’s Notification of 3rd November, 2009 has to be ensured
right from initial stage of preparation of mine development plan. Inclusion of fly ash and
bottom ash as backfill materials in the guidelines for preparation of mine closure plan is
required for which Ministry of Coal and other concerned Ministries/Authorities have to
take necessary action. There are environmental and safety concerns for use of fly ash
along with OB material for back filling of operating open cast mines. These concerns
need to be addressed.
• Use of fly ash in the construction of embankments for laying railway lines has also
significant potential for large scale utilization of fly ash. There are safety concerns in use
of fly ash in the construction of railway embankments having passenger traffic. There is
a need to address these concerns by carrying out necessary studies by organizations like
RDSO, a research organization under the Ministry of Railways.
• Thermal Power Stations have to ensure the utilization of fly ash and fly ash based
building products within the thermal power station for the development of infrastructure
like construction of buildings & roads, reclamation of low lying areas, the raising of ash
dyke etc.
• The use of fly ash in Agriculture and waste land development has large potential. There
are reservations in various quarters for use of fly ash in agriculture because of presence
32
of heavy metals and radioactive elements in fly ash inspite of findings of research
projects funded by Fly Ash Unit under Ministry of Science & Technology and studies
carried out by other organizations to any adverse effects. However, these concerns are
required to be addressed for increasing the fly ash utilization.
• A large number of technologies have been developed for gainful utilization and safe
management of fly ash through research projects funded by Fly Ash Mission/ Fly Ash
Unit under Ministry of Science & Technology, GOI since 1994. Propagation of these
technologies by establishing ‘Self sustaining technology demonstration centers’ would
facilitate and accelerate the fly ash utilization in the country.
• Thermal Power Stations have to explore and promote all possible modes of fly ash
utilization at their respective thermal power station for increasing the fly ash utilization
in the country in line with MoEF’s notification of 3rd November, 2009.
• There is a need to encourage ‘Industry–Institute Interactions’ for entrepreneur
development, creating awareness and organizing training programmes and workshops.
• Induction of ‘Fly Ash’ as a subject in academic curriculum of Engineering and
Architecture is needed.
* * *

Coal
consumed
Ash content
of coal
Fly Ash
Generation
Fly Ash
Utilization
% age
Utilization
In making of
Fly Ash based
Bricks/Blocks
/Tiles etc.
In
manufacture
of Portland
Pozzolana
Cement
In
construction
of Highways
& Roads
including
Flyovers
Part
replacement
of cement in
concrete
In Hydro
Power Sector
as part
replacement
of cement in
concrete
In Ash dyke
raising
In
reclamation
of low lying
Area
In Mine filling In Agriculture
/ Waste land
Devlopment
Others
(MW) (Million-ton) % age (Million-ton) (Million-ton) % (Million-ton) (Million-ton) (Million-ton) (Million-ton) (Million-ton) (Million-ton) (Million-ton) (Million-ton) (Million-ton) (Million-ton)
(1) (2) (3) (4) (5) (6) (7) (8) (9) (10) (11) (12) (13) (14) (15) (16) (17) (18) (19) (20)
1 CHANDRAPUR A.P.G.P.C.L. (Assam) 60 - - - - - - - - - - - - - - - -
2 KOTHAGUDEM 720 4.3892 45.82 2.011250 0.119107 5.92 0.014950 0.084486 - - - - - - - 0.019667 0.119103
3 KOTHAGUDEM-V 500 2.6800 33.89 0.909000 0.200000 22.00 0.060000 0.140000 - - - - - - - - 0.200000
4 RAMAGUNDAM'B' 62.50 0.3260 42.86 0.139800 0.074800 53.51 0.038900 0.035900 - - - - - - - - 0.074800
5 RAYALSEEMA 1050 5.4853 41.29 2.265034 1.565047 69.10 0.573061 0.991780 - - - - - - - - 1.564841
6 Dr. N.T.R (Vijawada) 1760 9.8020 41.19 4.037000 2.420000 59.95 0.642000 1.249000 0.163000 0.040000 - - 0.170000 - - 0.156000 2.420000
7 KAKATIA 500 1.4871 41.70 0.620610 0.375979 60.58 0.001407 0.154836 - - - - 0.219736 - - - 0.375979
8 KASAI PALLI A.C.B.P.L. (Chhattishgarh) 135 0.2027 56.80 0.114287 0.095772 83.80 0.017534 - - - - 0.009415 0.068822 - - - 0.095771
9 INDIRA GANDHI A.P.C.P.L. (Haryana) 1000 2.4279 36.84 0.716531 0.173615 24.23 - - - - - - - - - 0.173615 0.173615
10 Mundra TPS A.P.L. (Gujrat ) 4620 7.1370 7.58 0.541000 0.541000 100.00 - 0.229000 0.080000 - - 0.027000 0.204000 - - - 0.540000
11 Mihan A.M.N.E.P.L. (Maharashtra) 246 0.7143 43.50 0.311030 0.023470 7.55 0.023020 0.000441 - - - - - - - - 0.023461
12 BARAUNI B.S.E.B. (Bihar) 110 0.1663 48.34 0.080397 0.098840 122.94 0.054000 - 0.015000 - - - - - - 0.029841 0.098841
13 Barkhera 90 0.0849 34.77 0.029495 0.025088 85.06 - 0.010000 - - - - 0.015000 - - - 0.025000
14 Khambar Khera 90 0.1175 35.27 0.041196 0.034705 84.24 - 0.019000 - - - - 0.016103 - - - 0.035103
15 Kundarki 90 0.0301 36.60 0.011036 0.009320 84.45 - 0.005734 - - - - 0.003585 - - - 0.009319
16 Maqsoodpur 90 0.0654 36.14 0.023532 0.019863 84.41 - 0.010542 - - - - 0.009321 - - - 0.019863
17 Utraula 90 0.0218 36.71 0.007928 0.006739 85.00 - 0.003663 - - - - 0.003075 - - - 0.006738
18 B.B.G.S. 750 3.5680 36.28 1.463000 1.463000 100.00 0.018000 1.111000 - - - - 0.334000 - - - 1.463000
19 S.G.S. 135 0.7270 31.59 0.263000 0.263000 100.00 0.002000 0.221000 - - - - 0.040000 - - - 0.263000
20 T.G.S. 240 1.0910 27.30 0.322000 0.322000 100.00 0.044000 0.016000 0.051000 - - - 0.211000 - - - 0.322000
21 New Cossipore 160 - - - - - - - - - - - - - - - -
22 Mundra UMPP C.G.P.L. (Gujarat) 800 - - - - - - - - - - - - - - - -
23 KORBA (WEST) 840 4.7011 33.47 1.573700 0.627900 39.90 0.002700 - - - - 0.597700 0.027500 - - - 0.627900
24 DSPM 500 2.2501 43.66 0.987153 0.000000 - - - - - - - - - - - -
25 KORBA (EAST) 440 2.7738 43.72 0.970100 0.219800 22.66 - - - - - 0.206800 - - 0.013000 - 0.219800
26 BOKARO 'B' 630 3.0080 48.87 1.490807 1.748890 117.31 - 0.031172 - - - - - 1.717718 - - 1.748890
27 CHANDRAPURA 890 2.3093 50.79 1.173304 0.757417 64.55 0.006190 - - - - - - 0.751231 - - 0.757421
28 DURGAPUR 350 1.5623 45..55 0.717286 0.495629 69.10 0.002296 - - - - - - 0.493334 - - 0.495630
29 MEJIA 1840 7.2333 45.49 3.292000 2.198000 66.77 0.036000 0.579000 - - - - - 1.585000 - - 2.200000
30 Durgapur Steel 500 - - - - - - - - - - - - - - - -
31 Kodarma D.V.C. (Jharkhand) 500 - - - - - - - - - - - - - - - -
32 D.P.L D.P.L (West Bengal). 641 1.5913 43.41 0.690792 0.605082 87.59 0.010699 0.034398 0.071953 - - - - - 0.488032 - 0.605082
33 Chinakuri D.P.S.C.L. (West Bengal) 30.00 0.0415 36.88 0.015298 0.014863 97.16 - - - - - - - 0.014863 - - 0.014863
34 Essar Power Gujrat Ltd.Salaya E.P.G.L. (Gujarat) 600 0.0542 66.76 0.003617 0.003617 100.00 - 0.001428 - - - 0.000993 0.000474 - 0.000722 - 0.003617
35 SURAT LIGNITE G.I.P.C.L.(Gujarat) 500 2.7167 16.87 0.458000 0.458236 100.05 0.383970 - 0.033208 - - - - 0.041096 - - 0.458274
36 AKRIMOTA G.M.D.C.L.(Gujarat) 250 0.8130 20.97 0.170456 0.187094 109.76 - 0.004790 - - - - - 0.182000 - - 0.186790
37 GANDHINAGAR 870 3.7180 33.48 1.245000 0.987000 79.28 0.015829 0.873836 - 0.074518 - - - - - 0.022890 0.987072
38 KUTCH LIGNITE 290 1.8417 14.96 0.275000 0.276000 100.36 - - - - - - - 0.276000 - - 0.276000
39 SIKKA 240 0.8320 41.88 0.348000 0.183000 52.59 0.076588 0.106831 - - - - - - - - 0.183419
40 UKAI 850 4.0300 35.90 1.453000 0.523000 35.99 0.038000 0.268000 - - - - - - - 0.217000 0.523000
41 WANAKBORI 1470 7.3100 39.78 2.916000 1.039000 35.63 - 0.788000 - - - - - - - 0.250000 1.038000
B.E.P.L. (U.P.)
D.V.C.(West Bengal)
G.S.E.C.L. (Gujarat)
ANNEX-I
Power Utility & State
FLY ASH GENERATION AND ITS UTILIZATION AT COAL/LIGNITE BASED THERMAL POWER STATIONS IN THE COUNTRY FOR THE YEAR 2011-12 (FROM APRIL, 2011 to MARCH, 2012)
( POWER STATION WISE )
Sl.
No.
Name of TPS Installed
Capcity
C.E.S.C. (West Bengal)
C.S.P.G.C.L. (Chhattisgarh)
Total
Utilization
MODES OF UTILIZATIONFLY ASH GENERATION AND ITS UTILIZATION
D.V.C.(Jharkhand)
A.P. GENCO (Andhra Pradesh)
Page 1 of 3

Coal
consumed
Ash content
of coal
Fly Ash
Generation
Fly Ash
Utilization
% age
Utilization
In making of
Fly Ash based
Bricks/Blocks
/Tiles etc.
In
manufacture
of Portland
Pozzolana
Cement
In
construction
of Highways
& Roads
including
Flyovers
Part
replacement
of cement in
concrete
In Hydro
Power Sector
as part
replacement
of cement in
concrete
In Ash dyke
raising
In
reclamation
of low lying
Area
In Mine filling In Agriculture
/ Waste land
Devlopment
Others
(MW) (Million-ton) % age (Million-ton) (Million-ton) % (Million-ton) (Million-ton) (Million-ton) (Million-ton) (Million-ton) (Million-ton) (Million-ton) (Million-ton) (Million-ton) (Million-ton)
(1) (2) (3) (4) (5) (6) (7) (8) (9) (10) (11) (12) (13) (14) (15) (16) (17) (18) (19) (20)
ANNEX-I
Power Utility & State
FLY ASH GENERATION AND ITS UTILIZATION AT COAL/LIGNITE BASED THERMAL POWER STATIONS IN THE COUNTRY FOR THE YEAR 2011-12 (FROM APRIL, 2011 to MARCH, 2012)
( POWER STATION WISE )
Sl.
No.
Name of TPS Installed
Capcity
Total
Utilization
MODES OF UTILIZATIONFLY ASH GENERATION AND ITS UTILIZATION
42 HISAR 1200 2.9180 37.68 1.099533 0.031911 2.90 0.000310 0.031601 - - - - - - - - 0.031911
43 YAMUNANAGAR 600 2.1100 32.17 0.847000 0.348000 41.09 - 0.345000 - - - - - - - 0.003000 0.348000
44 PANIPAT 1367.8 7.8235 41.71 3.263060 1.406310 43.10 - 1.406310 - - - - - - - - 1.406310
45 RAJGHAT I.P.G.C.L. (Delhi) 135 0.6796 33.52 0.227836 0.172473 75.70 - 0.160793 0.011680 - - - - - - - 0.172473
46 Mahatma Gandhi J.H.P.L. (Haryana) 1320 0.1197 34.37 0.041151 0.041151 100.00 - 0.023140 - - - 0.013275 - - 0.004736 - 0.041151
47 O.P.Jindal J.P.L. (Chhattisgarh) 1000 5.2440 36.92 1.935000 1.136000 58.71 0.016000 - - - - - 0.264000 0.856000 - - 1.136000
48 PATRATU J.S.E.B. (Jarkhand) 770 0.4040 37.40 0.151000 0.011700 7.75 0.004800 0.006000 - - - - - 0.001000 - - 0.011800
49 RATNAGIRI JSW Energy Limited (Maharashtra) 1200 3.6300 6.55 0.225000 0.176000 78.22 0.077000 0.009000 - 0.090000 - - - - - - 0.176000
50 VIJAYANAGAR JSW Energy Limited (Karnataka) 860 2.2870 9.72 0.222300 0.219100 98.56 0.017000 0.200000 - - - - - - - - 0.217000
51 BELLARY 500 2.1594 25.11 0.542207 0.228301 42.11 - 0.228301 - - - - - - - - 0.228301
52 RAICHUR 1720 7.4900 34.58 1.857000 0.955000 51.43 0.138000 0.817000 - - - - - - - - 0.955000
53 Muzaffarpur TPS K.B.U.N.L (Bihar) 220 0.1900 45.42 0.086289 0.086289 100.00 - - - - - - 0.086289 - - - 0.086289
54 Amarkantak TPS Lanco Power Ltd. (Chhattisgarh) 600 2.8800 42.20 0.974000 0.236000 24.23 - 0.031000 - - - - - - - 0.205000 0.236000
55 Anpara 'C' Lanco Power Ltd. (U.P.) 1200 - - - - - - - - - - - - - - - -
56 Maithon RBTPP M.P.L. (Jharkhand) 1050 0.7779 45.64 0.355000 0.001274 0.36 - 0.001274 - - - - - - - - 0.001274
57 SANJAY GANDHI 1340 5.8600 37.73 1.661000 1.568000 94.40 0.001000 1.567000 - - - - - - - - 1.568000
58 SATPURA 1142.5 5.5305 39.19 2.167566 0.032842 1.52 0.000690 0.008252 0.000400 - - 0.023500 - - - - 0.032842
59 AMARKANTAK 450 1.5100 36.02 0.545000 0.060000 11.01 - 0.059500 - - - - - - - - 0.059500
60 BHUSAWAL 420 2.1612 34.01 0.734929 0.480557 65.39 0.133231 0.289657 - - - - - - 0.006594 0.051075 0.480557
61 CHANDRAPUR 2340 10.7816 42.81 4.615747 1.124495 24.36 0.056419 1.059695 - 0.000600 - - - - - 0.007782 1.124496
62 KHAPARKHEDA 840 4.8125 30.76 1.480110 1.550067 104.73 0.471115 0.248527 0.553280 - - 0.215000 - - - 0.062145 1.550067
63 KORADI 1100 2.8890 40.22 1.208000 0.525000 43.46 0.303000 0.031770 0.183000 - - 0.007000 - - - - 0.524770
64 NASHIK 630 3.3900 37.53 1.276006 1.038101 81.36 0.392200 0.490711 - - - - 0.109900 - 0.045290 - 1.038101
65 PARAS 500 2.2493 40.96 0.921236 0.489005 53.08 0.283995 0.205010 - - - - - - - - 0.489005
66 PARLI 1130 0.4179 41.42 0.173100 0.119100 68.80 0.035700 0.050900 - - - - - - 0.001870 0.030600 0.119070
67 NEYVELI - I 600 5.8850 5.67 0.250600 0.177910 70.99 0.013915 0.161600 - - - - - - - 0.002390 0.177905
68 NEYVELI -I EXPN 420 3.1387 7.11 0.227000 0.222100 97.84 0.036000 0.143500 - - - - - 0.042500 - - 0.222000
69 NEYVELI - II 1470 12.1390 7.41 0.899000 0.421000 46.83 0.033000 0.147000 - - - 0.083000 - 0.154000 0.003800 - 0.420800
70 Neyveli-II Exp 250 - - - - - - - - - - - - - - - -
71 Barsingsar-Lignite N.L.C. Ltd. (Rajasthan) 250 0.6413 18.42 0.118105 0.118104 100.00 0.000116 0.084891 - - - - - 0.033096 - - 0.118103
72 Bhilai N.S.P.C.L. (Chhattisgarh) 500 2.7488 41.26 1.134225 0.325209 28.67 0.034751 0.289458 - - - - 0.001000 - - - 0.325209
73 Vallur N.T.E.C.L. (Tamil Nadu) 500 - - - - - - - - - - - - - - - 0.000000
74 RAMAGUNDAM 2600 13.0810 32.55 4.294000 2.608000 60.74 0.011000 1.606000 0.015000 - - 0.182000 - - - 0.794000 2.608000
75 SIMHADRI 1500 7.6700 36.69 2.816000 1.690000 60.01 - 0.472000 0.172000 - - 0.647000 0.002000 - - 0.398000 1.691000
76 KAHALGAON NTPC Ltd. (Bihar) 2340 11.5260 34.00 3.919000 0.960000 24.50 0.006000 0.151000 - - - 0.495000 0.303000 - - 0.005000 0.960000
77 KORBA 2600 13.2340 40.72 5.407000 3.744000 69.24 0.020000 0.167000 - - - 0.678000 2.879000 - - - 3.744000
78 SIPAT 1660 7.1840 36.08 2.615000 0.322000 12.31 - 0.317000 - - - - 0.004000 - - - 0.321000
79 BADARPUR NTPC Ltd. (Delhi) 705 4.2120 30.00 1.264000 1.101000 87.10 0.002000 0.605000 0.482000 - - - 0.013000 - - - 1.102000
80 VINDHYACHAL NTPC Ltd. ( M.P.) 3260 18.0040 34.53 6.247000 2.895000 46.34 0.011000 0.776000 - - - 0.444000 0.410000 - - 1.254000 2.895000
81 TALCHAR(KAN) 3000 17.1040 36.47 6.235000 1.794000 28.77 0.022000 0.079000 - - - 1.234000 0.120000 - - 0.340000 1.795000
82 TALCHAR(TPS) 460 3.1000 38.50 1.193000 1.193000 100.00 0.004000 0.020000 - - - - - 1.168000 - - 1.192000
N.T.P.C. (Andhra Pradesh)
NTPC Ltd. (Chhattisgarh)
NTPC Ltd. (Odisha)
M.S.P.G.C.L. (Maharashtra)
H.P.G.C.L.(Haryana)
K.P.C.L (Karnataka)
M.P.P.G.C.L. ( M.P.)
N.L.C. Ltd. (Tamil Nadu)
Page 2 of 3

Coal
consumed
Ash content
of coal
Fly Ash
Generation
Fly Ash
Utilization
% age
Utilization
In making of
Fly Ash based
Bricks/Blocks
/Tiles etc.
In
manufacture
of Portland
Pozzolana
Cement
In
construction
of Highways
& Roads
including
Flyovers
Part
replacement
of cement in
concrete
In Hydro
Power Sector
as part
replacement
of cement in
concrete
In Ash dyke
raising
In
reclamation
of low lying
Area
In Mine filling In Agriculture
/ Waste land
Devlopment
Others
(MW) (Million-ton) % age (Million-ton) (Million-ton) % (Million-ton) (Million-ton) (Million-ton) (Million-ton) (Million-ton) (Million-ton) (Million-ton) (Million-ton) (Million-ton) (Million-ton)
(1) (2) (3) (4) (5) (6) (7) (8) (9) (10) (11) (12) (13) (14) (15) (16) (17) (18) (19) (20)
ANNEX-I
Power Utility & State
FLY ASH GENERATION AND ITS UTILIZATION AT COAL/LIGNITE BASED THERMAL POWER STATIONS IN THE COUNTRY FOR THE YEAR 2011-12 (FROM APRIL, 2011 to MARCH, 2012)
( POWER STATION WISE )
Sl.
No.
Name of TPS Installed
Capcity
Total
Utilization
MODES OF UTILIZATIONFLY ASH GENERATION AND ITS UTILIZATION
83 RIHAND 2000 11.0560 28.20 3.119000 1.892000 60.66 0.002000 0.082000 - - - 0.293000 1.515000 - - - 1.892000
84 SINGRAULI 2000 11.2020 33.87 3.793000 2.324000 61.27 0.003000 0.310000 - - - 0.025000 1.009000 - - 0.978000 2.325000
85 UNCHAHAR 1050 5.9870 42.86 2.573000 1.932000 75.09 0.001000 1.605000 0.008000 - - - 0.050000 - - 0.268000 1.932000
86 TANDA 440 3.0400 44.39 1.360000 0.846000 62.21 0.004000 0.298000 - - - 0.222000 0.046000 - - 0.276000 0.846000
87 DADRI 1820 8.8560 34.00 3.010000 2.247000 74.65 0.002000 1.658000 0.158000 - - - 0.429000 - - - 2.247000
88 FARAKKA NTPC Ltd. (W.B.) 2100 6.9900 31.51 2.207000 1.981000 89.76 0.007000 0.918000 0.963000 - - - 0.093000 - - - 1.981000
89 IB VALLEY O.P.G.C.L. (Odisha) 420 2.5729 40.70 1.047806 0.175425 16.74 0.010734 0.000210 - - - 0.038400 0.125980 - - 0.000101 0.175425
90 BATHINDA 440 1.3889 33.58 0.466425 0.234728 50.32 0.012758 0.221970 - - - - - - - - 0.234728
91 LEHRA MOHABAT 920 4.5388 31.10 1.411315 1.148164 81.35 0.000680 1.051746 - 0.054068 - - 0.041667 - - - 1.148161
92 ROPAR 1260 6.1529 33.04 1.528438 1.437345 94.04 0.005785 1.421655 - 0.009903 - - - - - - 1.437343
93 KOTA 1240 6.4826 31.29 2.028371 2.106950 103.87 0.188158 1.785527 0.059400 0.020952 - - - - 0.007396 0.044662 2.106095
94 SURATGARH 1500 6.9202 30.48 2.109950 1.727470 81.87 0.132292 1.537327 0.049541 - - - 0.008260 - - - 1.727420
95 Chhabra 500 1.6817 34.33 0.577359 0.557505 96.56 0.221072 0.336343 - - 0.000090 - - - - - 0.557505
96 Giral 250 0.5772 31.71 0.183069 0.183069 100.00 0.000600 0.000000 - - - - - 0.182469 - - 0.183069
97 Jalipa Kapurdi R.W.P.L. (Rajasthan) 540 1.6376 12.01 0.207275 0.114378 55.18 0.001857 0.012050 - 0.005522 - - 0.094948 - - - 0.114377
98 Rosa Phase-I R.P.S.C.L. (U.P.) 1200 2.8084 30.62 0.859928 0.077935 9.06 0.001434 0.069600 - 0.006902 - - - - - - 0.077936
99 DAHANU Reliance Infrastructure Ltd.
(Maharashtra)
500 2.8060 27.75 0.779000 0.608000 78.05 0.000817 - - 0.280000 - 0.307000 - - - 0.019540 0.607357
100 Sterlite S.E.L. (Odisha) 1800 5.0990 42.85 2.185365 0.463860 21.23 0.000205 - 0.085613 - - 0.084000 0.294042 - - - 0.463860
101 Simhapuri S.E.P.L. (A.P.) 150 0.0136 9.36 0.001275 0.001020 80.00 0.000714 0.000306 - - - - - - - - 0.001020
102 CUDDALORE ST-CMS (Tamil Nadu) 250 1.9269 7.50 0.144583 0.130477 90.24 - 0.112122 - - - - - 0.018000 - - 0.130122
103 SVPL S.V.P.P.L. (Chhattisgarh) 63 0.0648 51.56 0.033416 0.033416 100.00 0.000750 - 0.001750 - - 0.028416 0.002500 - - - 0.033416
104 JOJOBERA T.P.CO. (Jarkhnad) 427.5 2.0071 44.53 0.893840 0.672091 75.19 0.000850 0.389910 - 0.005850 - - 0.274060 0.001420 - - 0.672090
105 TROMBAY T.P.CO.(Maharashtra) 750 2.5680 2.81 0.072200 0.072200 100.00 0.005000 - 0.053000 - - - - - - 0.014200 0.072200
106 SABARMATI Torrent Power Ltd. (Gujarat) 400 1.8803 0.00 0.470000 0.656500 139.68 0.004500 0.348000 - - - - - - 0.304000 - 0.656500
107 TENUGHAT T.V.N.L.(Jarkhnad) 420 1.5416 40.00 0.616654 0.583801 94.67 - - - - - - 0.583801 - - - 0.583801
108 ENNORE 450 1.0574 40.90 0.432427 0.414777 95.92 0.034629 0.086026 0.062784 - - - - - - 0.231338 0.414777
109 METTUR 840 4.8877 33.80 1.649742 2.737220 165.92 0.436732 2.300485 - - - - - - - - 2.737217
110 NORTH CHENNAI 630 3.0660 31.32 0.958000 2.318000 241.96 0.086000 0.380000 1.845000 0.007260 - - - - - - 2.318260
111 TUTICORIN 1050 5.9495 37.39 2.105430 1.279991 60.79 0.194015 1.070781 - 0.001772 - - 0.013418 - - 0.000050 1.280036
112 ANPARA 'A' & 'B' 1630 8.4408 37.36 2.954000 0.020016 0.68 - 0.008399 - - - - 0.010142 - - 0.001475 0.020016
113 HARDUAGANJ 420 0.0962 19.85 0.019100 0.023200 121.47 - - 0.023200 - - - - - - - 0.023200
114 OBRA 1300 3.9610 38.45 1.523000 0.160286 10.52 - 0.160286 - - - - - - - - 0.160286
115 PANKI 210 0.8667 31.47 0.274679 0.378920 137.95 0.000588 0.106419 - - - - 0.271913 - - - 0.378920
116 PARICHHA 640 2.5132 33.91 0.852000 0.434140 50.96 0.000030 0.404920 0.002550 - - - 0.026650 - - - 0.434150
117 Udupi U.P.C.L. (KARNATAK) 600 1.5560 5.18 0.080000 0.049000 61.25 - 0.039000 - 0.010000 - - - - - - 0.049000
118 Katghora VESPL (Chhattisgarh) 35 0.0080 46.00 0.003691 0.003691 100.00 0.000096 0.000780 - - - - 0.000120 - - 0.002695 0.003691
119 KOLAGHAT 1260 6.3430 40.12 2.547000 3.020000 118.57 0.174000 0.549000 0.393000 - - - 1.574000 - - 0.332000 3.022000
120 SAGARDIGHI 600 2.9250 44.97 1.321000 0.184000 13.93 0.047000 0.115000 - - - - - - - 0.022000 0.184000
121 BANDEL 450 1.6380 39.85 0.651000 0.741000 113.82 0.026000 0.004000 - - - - 0.658000 - - 0.058000 0.746000
122 SANTALDIH 500 1.8040 37.49 0.676000 0.140000 20.71 0.002000 - - - - - 0.147000 - - 0.000200 0.149200
123 BAKRESWAR 1050 5.0740 3.85 1.976000 2.378000 120.34 0.031000 0.938000 - - - - 1.395000 - - 0.015000 2.379000
124 Wardha Warora W.P.C.L. (Maharashtra) 540 2.1281 37.46 0.799240 0.799240 100.00 0.010740 0.497996 - 0.024661 - - 0.037891 0.225959 - - 0.797247
105925.30 437.41 33.24 145.42 85.05 58.48 5.835421 38.078584 5.536359 0.632008 0.000090 5.861499 14.216197 7.743686 0.875440 6.285266 85.06GRAND TOTAL
P.S.P.C.L. (Punjab)
T.N.G & D. Corporation
(Tamil Nadu)
U.P.R.V.U.N.L. ( U.P.)
W.B.P.D.C.L(W.B.)
R.R.V.U.N.L. (Rajasthan)
NTPC Ltd. (U.P.)
Page 3 of 3
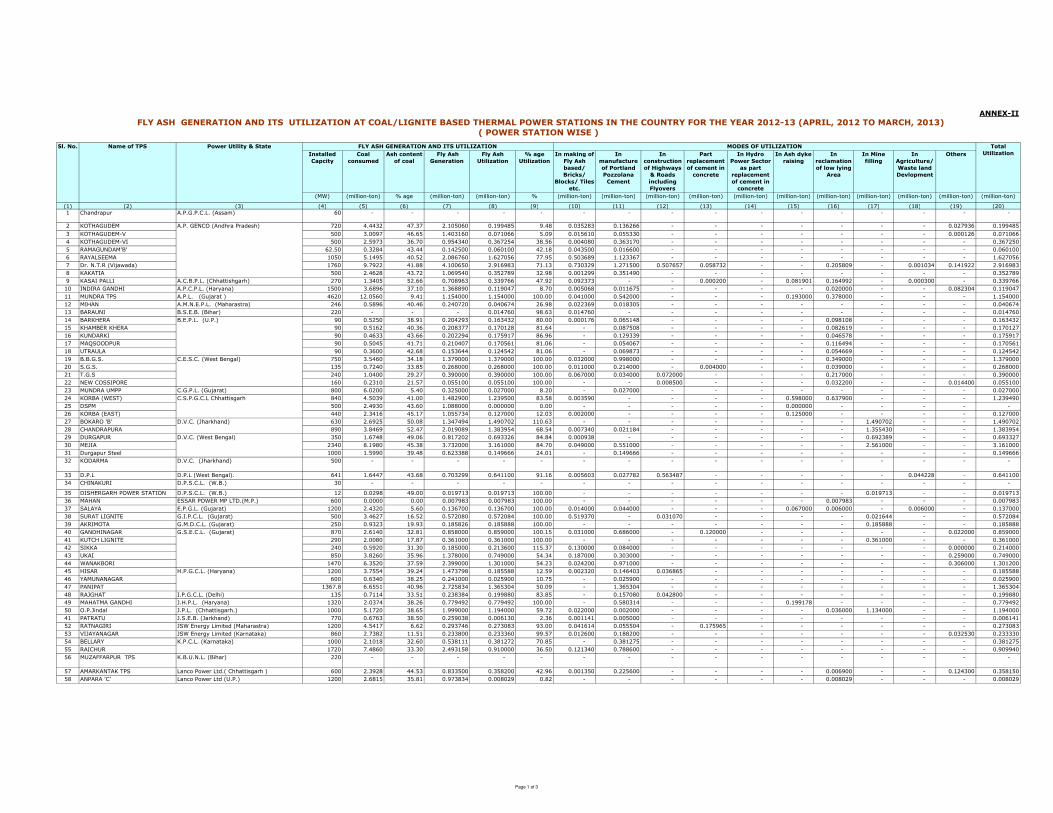
Installed
Capcity
Coal
consumed
Ash content
of coal
Fly Ash
Generation
Fly Ash
Utilization
% age
Utilization
In making of
Fly Ash
based/
Bricks/
Blocks/ Tiles
etc.
In
manufacture
of Portland
Pozzolana
Cement
In
construction
of Highways
& Roads
including
Flyovers
Part
replacement
of cement in
concrete
In Hydro
Power Sector
as part
replacement
of cement in
concrete
In Ash dyke
raising
In
reclamation
of low lying
Area
In Mine
filling
In
Agriculture/
Waste land
Devlopment
Others
(MW) (million-ton) % age (million-ton) (million-ton) % (million-ton) (million-ton) (million-ton) (million-ton) (million-ton) (million-ton) (million-ton) (million-ton) (million-ton) (million-ton) (million-ton)
(1) (2) (3) (4) (5) (6) (7) (8) (9) (10) (11) (12) (13) (14) (15) (16) (17) (18) (19) (20)1 Chandrapur A.P.G.P.C.L. (Assam) 60 - - - - - - - - - - - - - - - -
2 KOTHAGUDEM 720 4.4432 47.37 2.105060 0.199485 9.48 0.035283 0.136266 - - - - - - - 0.027936 0.199485
3 KOTHAGUDEM-V 500 3.0097 46.65 1.403160 0.071066 5.09 0.015610 0.055330 - - - - - - - 0.000126 0.071066
4 KOTHAGUDEM-VI 500 2.5973 36.70 0.954340 0.367254 38.56 0.004080 0.363170 - - - - - - - - 0.367250
5 RAMAGUNDAM'B' 62.50 0.3284 43.44 0.142500 0.060100 42.18 0.043500 0.016600 - - - - - - - - 0.060100
6 RAYALSEEMA 1050 5.1495 40.52 2.086760 1.627056 77.95 0.503689 1.123367 - - - - - - - - 1.627056
7 Dr. N.T.R (Vijawada) 1760 9.7922 41.88 4.100650 2.916983 71.13 0.730329 1.271500 0.507657 0.058732 - - 0.205809 - 0.001034 0.141922 2.916983
8 KAKATIA 500 2.4628 43.72 1.069540 0.352789 32.98 0.001299 0.351490 - - - - - - - - 0.352789
9 KASAI PALLI A.C.B.P.L. (Chhattishgarh) 270 1.3405 52.66 0.708963 0.339766 47.92 0.092373 - - 0.000200 - 0.081901 0.164992 - 0.000300 - 0.339766
10 INDIRA GANDHI A.P.C.P.L. (Haryana) 1500 3.6896 37.10 1.368890 0.119047 8.70 0.005068 0.011675 - - - - 0.020000 - - 0.082304 0.119047
11 MUNDRA TPS A.P.L. (Gujarat ) 4620 12.0560 9.41 1.154000 1.154000 100.00 0.041000 0.542000 - - - 0.193000 0.378000 - - - 1.154000
12 MIHAN A.M.N.E.P.L. (Maharastra) 246 0.5896 40.46 0.240720 0.040674 26.98 0.022369 0.018305 - - - - - - - - 0.040674
13 BARAUNI B.S.E.B. (Bihar) 220 - - - 0.014760 98.63 0.014760 - - - - - - - - - 0.014760
14 BARKHERA 90 0.5250 38.91 0.204293 0.163432 80.00 0.000176 0.065148 - - - - 0.098108 - - - 0.163432
15 KHAMBER KHERA 90 0.5162 40.36 0.208377 0.170128 81.64 - 0.087508 - - - - 0.082619 - - - 0.170127
16 KUNDARKI 90 0.4633 43.66 0.202294 0.175917 86.96 - 0.129339 - - - - 0.046578 - - - 0.175917
17 MAQSOODPUR 90 0.5045 41.71 0.210407 0.170561 81.06 - 0.054067 - - - - 0.116494 - - - 0.170561
18 UTRAULA 90 0.3600 42.68 0.153644 0.124542 81.06 - 0.069873 - - - - 0.054669 - - - 0.124542
19 B.B.G.S. 750 3.5460 34.18 1.379000 1.379000 100.00 0.032000 0.998000 - - - - 0.349000 - - - 1.379000
20 S.G.S. 135 0.7240 33.85 0.268000 0.268000 100.00 0.011000 0.214000 - 0.004000 - - 0.039000 - - - 0.268000
21 T.G.S 240 1.0400 29.27 0.390000 0.390000 100.00 0.067000 0.034000 0.072000 - - - 0.217000 - - - 0.390000
22 NEW COSSIPORE 160 0.2310 21.57 0.055100 0.055100 100.00 - - 0.008500 - - - 0.032200 - - 0.014400 0.055100
23 MUNDRA UMPP C.G.P.L. (Gujarat) 800 6.0200 5.40 0.325000 0.027000 8.20 - 0.027000 - - - - - - - - 0.027000
24 KORBA (WEST) 840 4.5039 41.00 1.482900 1.239500 83.58 0.003590 - - - - 0.598000 0.637900 - - - 1.239490
25 DSPM 500 2.4930 43.60 1.088000 0.000000 0.00 - - - - - 0.000000 - - - - -
26 KORBA (EAST) 440 2.3416 45.17 1.055734 0.127000 12.03 0.002000 - - - - 0.125000 - - - - 0.127000
27 BOKARO 'B' 630 2.6925 50.08 1.347494 1.490702 110.63 - - - - - - - 1.490702 - - 1.490702
28 CHANDRAPURA 890 3.8469 52.47 2.019089 1.383954 68.54 0.007340 0.021184 - - - - - 1.355430 - - 1.383954
29 DURGAPUR 350 1.6748 49.06 0.817202 0.693326 84.84 0.000938 - - - - - - 0.692389 - - 0.693327
30 MEJIA 2340 8.1980 45.38 3.732000 3.161000 84.70 0.049000 0.551000 - - - - - 2.561000 - - 3.161000
31 Durgapur Steel 1000 1.5990 39.48 0.623388 0.149666 24.01 - 0.149666 - - - - - - - - 0.149666
32 KODARMA D.V.C. (Jharkhand) 500 - - - - - - - - - - - - - - - -
33 D.P.L D.P.L (West Bengal). 641 1.6447 43.68 0.703299 0.641100 91.16 0.005603 0.027782 0.563487 - - - - - 0.044228 - 0.641100
34 CHINAKURI D.P.S.C.L. (W.B.) 30 - - - - - - - - - - - - - - - -
35 DISHERGARH POWER STATION D.P.S.C.L. (W.B.) 12 0.0298 49.00 0.019713 0.019713 100.00 - - - - - - - 0.019713 - - 0.019713
36 MAHAN ESSAR POWER MP LTD.(M.P.) 600 0.0000 0.00 0.007983 0.007983 100.00 - - - - - - 0.007983 - - - 0.007983
37 SALAYA E.P.G.L. (Gujarat) 1200 2.4320 5.60 0.136700 0.136700 100.00 0.014000 0.044000 - - - 0.067000 0.006000 - 0.006000 - 0.137000
38 SURAT LIGNITE G.I.P.C.L. (Gujarat) 500 3.4627 16.52 0.572080 0.572084 100.00 0.519370 - 0.031070 - - - - 0.021644 - - 0.572084
39 AKRIMOTA G.M.D.C.L. (Gujarat) 250 0.9323 19.93 0.185826 0.185888 100.00 - - - - - - - 0.185888 - - 0.185888
40 GANDHINAGAR 870 2.6140 32.81 0.858000 0.859000 100.15 0.031000 0.686000 - 0.120000 - - - - - 0.022000 0.859000
41 KUTCH LIGNITE 290 2.0080 17.87 0.361000 0.361000 100.00 - - - - - - - 0.361000 - - 0.361000
42 SIKKA 240 0.5920 31.30 0.185000 0.213600 115.37 0.130000 0.084000 - - - - - - - 0.000000 0.214000
43 UKAI 850 3.8260 35.96 1.378000 0.749000 54.34 0.187000 0.303000 - - - - - - - 0.259000 0.749000
44 WANAKBORI 1470 6.3520 37.59 2.399000 1.301000 54.23 0.024200 0.971000 - - - - - - - 0.306000 1.301200
45 HISAR 1200 3.7554 39.24 1.473798 0.185588 12.59 0.002320 0.146403 0.036865 - - - - - - - 0.185588
46 YAMUNANAGAR 600 0.6340 38.25 0.241000 0.025900 10.75 - 0.025900 - - - - - - - - 0.025900
47 PANIPAT 1367.8 6.6551 40.96 2.725834 1.365304 50.09 - 1.365304 - - - - - - - - 1.365304
48 RAJGHAT I.P.G.C.L. (Delhi) 135 0.7114 33.51 0.238384 0.199880 83.85 - 0.157080 0.042800 - - - - - - - 0.199880
49 MAHATMA GANDHI J.H.P.L. (Haryana) 1320 2.0374 38.26 0.779492 0.779492 100.00 - 0.580314 - - - 0.199178 - - - - 0.779492
50 O.P.Jindal J.P.L. (Chhattisgarh.) 1000 5.1720 38.65 1.999000 1.194000 59.72 0.022000 0.002000 - - - - 0.036000 1.134000 - - 1.194000
41 PATRATU J.S.E.B. (Jarkhand) 770 0.6763 38.50 0.259038 0.006130 2.36 0.001141 0.005000 - - - - - - - - 0.006141
52 RATNAGIRI JSW Energy Limited (Maharastra) 1200 4.5417 6.62 0.293746 0.273083 93.00 0.041614 0.055504 - 0.175965 - - - - - - 0.273083
53 VIJAYANAGAR JSW Energy Limited (Karnataka) 860 2.7382 11.51 0.233800 0.233360 99.57 0.012600 0.188200 - - - - - - - 0.032530 0.233330
54 BELLARY 1000 2.1018 32.60 0.538111 0.381272 70.85 - 0.381275 - - - - - - - - 0.381275
55 RAICHUR 1720 7.4860 33.30 2.493158 0.910000 36.50 0.121340 0.788600 - - - - - - - - 0.909940
56 MUZAFFARPUR TPS K.B.U.N.L. (Bihar) 220 - - - - - - - - - - - - - - - -
57 AMARKANTAK TPS Lanco Power Ltd.( Chhattisgarh ) 600 2.3928 44.53 0.833500 0.358200 42.96 0.001350 0.225600 - - - - 0.006900 - - 0.124300 0.358150
58 ANPARA 'C' Lanco Power Ltd (U.P.) 1200 2.6815 35.81 0.973834 0.008029 0.82 - - - - - - 0.008029 - - - 0.008029
K.P.C.L. (Karnataka)
FLY ASH GENERATION AND ITS UTILIZATION
B.E.P.L. (U.P.)
C.E.S.C. (West Bengal)
C.S.P.G.C.L Chhattisgarh
D.V.C. (Jharkhand)
D.V.C. (West Bengal)
G.S.E.C.L. (Gujarat)
H.P.G.C.L. (Haryana)
ANNEX-II
Power Utility & State
FLY ASH GENERATION AND ITS UTILIZATION AT COAL/LIGNITE BASED THERMAL POWER STATIONS IN THE COUNTRY FOR THE YEAR 2012-13 (APRIL, 2012 TO MARCH, 2013)
( POWER STATION WISE )
Sl. No. Total
Utilization
Name of TPS
A.P. GENCO (Andhra Pradesh)
MODES OF UTILIZATION
Page 1 of 3

Installed
Capcity
Coal
consumed
Ash content
of coal
Fly Ash
Generation
Fly Ash
Utilization
% age
Utilization
In making of
Fly Ash
based/
Bricks/
Blocks/ Tiles
etc.
In
manufacture
of Portland
Pozzolana
Cement
In
construction
of Highways
& Roads
including
Flyovers
Part
replacement
of cement in
concrete
In Hydro
Power Sector
as part
replacement
of cement in
concrete
In Ash dyke
raising
In
reclamation
of low lying
Area
In Mine
filling
In
Agriculture/
Waste land
Devlopment
Others
(MW) (million-ton) % age (million-ton) (million-ton) % (million-ton) (million-ton) (million-ton) (million-ton) (million-ton) (million-ton) (million-ton) (million-ton) (million-ton) (million-ton) (million-ton)
(1) (2) (3) (4) (5) (6) (7) (8) (9) (10) (11) (12) (13) (14) (15) (16) (17) (18) (19) (20)
FLY ASH GENERATION AND ITS UTILIZATION
ANNEX-II
Power Utility & State
FLY ASH GENERATION AND ITS UTILIZATION AT COAL/LIGNITE BASED THERMAL POWER STATIONS IN THE COUNTRY FOR THE YEAR 2012-13 (APRIL, 2012 TO MARCH, 2013)
( POWER STATION WISE )
Sl. No. Total
Utilization
Name of TPS MODES OF UTILIZATION
59 THAMMINAPATNAM TPS Meenakshi Energy Pvt. Ltd. (A.P.) 300 0.2810 2.50 0.007191 0.003218 44.74 - 0.000218 0.001050 - - - - - - 0.001950 0.003218
60 MAITHON RBTPP M.P.L. (Jharkhand) 1050 2.8839 45.00 1.297700 0.369100 28.00 - - - - - - - 0.369100 - - 0.369100
61 SANJAY GANDHI 1340 6.2689 36.44 2.290671 1.801672 78.65 0.001141 1.800531 - - - - - - - - 1.801672
62 SATPURA 1142.5 5.3182 37.95 2.018509 0.522108 25.86 0.011916 0.008943 0.202938 - - 0.298311 - - - - 0.522108
63 AMARKANTAK 450 2.1664 34.35 0.744094 0.160478 21.57 0.004595 0.155883 - - - - - - - - 0.160478
64 BHUSAWAL 420 1.8326 37.81 0.692947 0.491807 70.68 0.139342 0.284098 - - - - - - 0.007374 0.058987 0.489801
65 CHANDRAPUR 2340 11.8339 35.99 4.253873 1.541898 36.18 0.067278 1.217715 - - - - - 0.058000 0.008800 0.189368 1.541161
66 KHAPARKHEDA 840.00 4.7408 38.93 1.845749 1.286725 69.70 0.501585 0.087390 0.321333 - - 0.063595 0.214220 - - 0.098600 1.286723
67 KORADI 1100 2.0840 39.69 0.828000 0.459000 55.43 0.328000 0.020000 0.009000 - - 0.102000 - - - - 0.459000
68 NASIK 630 3.1160 37.97 1.268000 0.953000 75.12 0.503000 0.411000 0.000000 - - - 0.030000 - 0.009000 - 0.953000
69 PARAS 500 2.3300 44.21 0.944000 0.721000 75.23 0.292000 0.429000 0.000000 - - - - - - - 0.721000
70 PARLI 1130 3.4720 43.52 1.506000 1.192000 79.16 0.432000 0.504000 0.000000 - - - - - 0.032000 0.224000 1.192000
71 NEYVELI - I 600 5.8710 5.83 0.334200 0.213190 64.51 0.029000 0.183000 0.000000 - - - - - - 0.001190 0.213190
72 NEYVELI -I EXPN. 420 3.3845 7.10 0.238541 0.238529 99.80 0.042160 0.151913 0.000000 - - - - 0.043917 - 0.000539 0.238529
73 NEYVELI - II 1470 12.3034 6.50 0.799615 0.474459 60.50 0.092263 0.221079 0.000000 - - - - 0.159925 - 0.001192 0.474459
74 NEYVELI - II EXPN. N.L.C. Ltd. (Tamil Nadu) 250 - - - - - - - 0.000000 - - - - - - - -
75 BARSINGSAR LIGNITE N.L.C. Ltd. (Rajasthan) 250 1.2739 18.03 0.229669 0.240023 104.51 0.000934 0.179914 0.000000 - - - - 0.059175 - - 0.240023
76 BHILAI N.S.P.C.L. (Chhattisgarh) 500 2.6555 37.50 0.994533 0.697635 70.15 0.106026 0.591609 0.000000 - - - - - - - 0.697635
77 VALLUR N.T.E.C.L. (Tamil Nadu) 500 0.6741 34.70 0.234240 0.000000 0.00 - - 0.000000 - - - - - - - -
78 RAMAGUNDAM 2600 13.1040 34.32 4.521000 3.052000 67.52 0.827000 1.054000 0.066000 - - 0.252000 - 0.137000 - 0.716000 3.052000
79 SIMHADRI 2000 9.1520 35.37 3.225000 1.960000 60.78 0.112000 0.249000 0.002000 - - 0.927000 - - - 0.670000 1.960000
80 KAHALGAON NTPC Ltd. (Bihar) 2340 13.4220 34.00 4.563000 1.022000 22.40 0.062000 0.254000 0.008000 - - 0.410000 0.289000 - - 0.001000 1.024000
81 KORBA 2600 15.2520 42.19 6.439000 2.418000 37.55 0.037000 0.146000 - - - 2.134000 0.101000 - - - 2.418000
82 SIPAT 2980 11.1530 37.28 4.176000 0.862000 20.64 0.078000 0.445000 - - - 0.314000 0.024000 - - - 0.861000
83 BADARPUR NTPC Ltd. (Delhi) 705 4.0060 30.00 1.202000 1.041000 86.61 0.391000 0.606000 0.030000 - - - 0.014000 - - - 1.041000
84 VINDHYACHAL NTPC Ltd. ( M.P.) 4260 18.9210 36.66 6.935000 4.613000 66.50 0.494000 0.962000 - - - 0.765000 1.005000 - - 1.387000 4.613000
85 TALCHAR(KAN) 3000 17.5120 38.49 6.726000 2.550000 37.91 0.058000 0.065000 - - - 1.576000 0.496000 - - 0.354000 2.549000
86 TALCHAR(TPS) 460 3.1660 39.00 1.235000 1.235000 100.00 - 0.037000 - - - - - 1.198000 - - 1.235000
87 RIHAND 2500 1.1190 31.20 3.489000 1.971000 56.49 0.012000 0.097000 0.002000 - - 0.522000 1.338000 - - - 1.971000
88 SINGRAULI 2000 11.3140 33.37 3.777000 2.266000 60.00 0.014000 0.315000 - - - 1.266000 0.014000 - - 0.657000 2.266000
89 UNCHAHAR 1050 5.8550 41.88 2.454000 1.532000 62.49 0.043000 1.238000 0.005000 - - - 0.032000 - - 0.214000 1.532000
90 TANDA 440 2.6570 43.36 1.156000 0.731000 63.42 0.087000 0.162000 - - - 0.188000 0.064000 - - 0.230000 0.731000
91 DADRI 1820 8.4070 3.27 2.744000 2.380000 86.75 0.114000 1.846000 0.022000 - - - 0.399000 - - - 2.381000
92 FARAKKA NTPC Ltd. (W.B.) 2100 9.2010 39.47 3.647000 3.334000 91.40 0.024000 1.040000 1.710000 - - 0.247000 0.314000 - - - 3.335000
93 MOUDA TPS NTPC Ltd. (Maharastra) 500 0.0157 56.00 0.008805 0.000000 0.00 - - - - - - - - - - 0.000000
94 IB VALLEY O.P.G.C.L. (Odisha) 420 2.7572 40.21 1.109346 0.180129 16.24 0.002094 - - - - 0.059400 0.118635 - - - 0.180129
95 BATHINDA 440 1.0285 31.26 0.321512 0.221107 68.77 0.013885 0.207222 - - - - - - - - 0.221107
96 LEHRA MOHABAT 920 4.1181 29.88 1.230643 1.078750 87.66 0.003041 0.981854 - 0.057483 - - 0.036374 - - - 1.078752
97 ROPAR 1260 5.7293 31.51 1.805578 1.476364 81.76 0.008653 1.425268 0.010565 0.022008 - - 0.009873 - - - 1.476367
98 KOTA 1240 6.2243 29.73 1.850390 2.289051 123.71 0.421905 1.539559 0.229300 0.020735 - - - - 0.006442 0.071110 2.289051
99 SURATGARH 1500 6.8178 31.13 2.125903 1.879611 88.40 0.149685 1.575658 - 0.154278 - - - - - - 1.879621
100 CHHABRA 500 1.8719 35.31 0.660945 0.543274 84.36 0.000685 0.401587 - - 0.004550 - - - - 0.136452 0.543274
101 GIRAL 250 0.5902 32.90 0.194160 0.194160 100.00 0.000270 - - - - - - 0.193890 - - 0.194160
102 JALIIPA KAPURDI Raj West Power (Rajasthan) 1080 3.7766 13.90 0.527500 0.361400 68.50 0.000770 0.203000 - 0.006540 - - 0.122000 0.029100 - - 0.361410
103 ROSA PHASE-I R.P.S.C.L.( U.P.) 1200 4.9578 21.96 1.088852 0.341564 31.37 0.001074 0.062691 0.105676 0.005065 - - 0.166908 - - - 0.341414
104 DAHANU Reliance Infrastructure Ltd.(Maharastra) 500 2.7570 30.35 0.837000 0.720000 86.07 - - - 0.299000 - 0.359000 - - - 0.061040 0.719040
105 STERLITE S.E.L. (Odisha) 2400 6.4117 40.99 2.625564 1.337590 50.94 0.000504 - 0.130038 - - 0.016562 1.190486 - - - 1.337590
106 SIMHAPURI S.E.P.L. (A.P.) 300 1.0784 6.16 0.065794 0.065429 99.45 0.034306 0.031123 - - - - - - - - 0.065429
107 CUDDALORE ST-CMS (Tamil Nadu) 250 1.9092 8.91 0.170024 0.140630 82.71 - 0.125947 - - - - - 0.014683 - - 0.140630
108 SVPL S.V.P.P.L. (Chhattisgarh.) 63 0.0577 48.17 0.027812 0.027812 100.00 0.000750 - 0.001200 - - 0.015862 0.010000 - - - 0.027812
109 JOJOBERA Tata Power Co. (Jarkhnad) 427.5 2.6294 43.93 1.155210 1.208400 105.56 0.000530 0.497090 - 0.002400 - - 0.707271 0.001100 - - 1.208391
110 TROMBAY Tata Power Co. (Maharashtra) 750 2.8390 2.76 0.078400 0.078700 101.00 0.003700 - - 0.063100 - - - 0.007000 0.004900 - 0.078700
111 SABARMATI Torrent Power Ltd.(Gujarat) 400 1.8200 25.59 0.469000 0.459000 97.76 0.004000 0.340000 - - - - - - 0.115000 - 0.459000
112 TENUGHAT T.V.N.L. (Jarkhnad) 420 2.1168 40.00 0.846706 0.270000 59.81 - - - - - - 0.270000 - - - 0.270000
113 ENNORE 450 0.9662 40.90 0.394091 0.333148 84.54 0.040303 0.072969 0.028419 - - - - - - 0.191457 0.333148
114 METTUR 840 4.5629 21.99 1.343177 2.456119 183.86 0.409941 2.046178 - - - - - - - - 2.456119
115 NORTH CHENNAI 630 3.4820 32.00 1.109000 1.769000 159.58 0.085400 0.388000 1.293000 0.000263 - - - - - - 1.766663
116 TUTICORIN 1050 6.6490 33.89 2.253441 1.493013 66.25 0.236916 1.101912 - - - - 0.153875 - - 0.000310 1.493013
117 ANPARA 'A' & 'B' 1630 7.6053 39.24 2.661870 0.014530 0.55 - 0.005650 - - - - 0.007255 - - 0.001625 0.014530
118 HARDUAGANJ 670 0.1139 40.35 0.045993 0.024514 53.30 - - 0.024514 - - - - - - - 0.024514
NTPC Ltd. (Chhattisgarh)
NTPC Ltd. (Odisha)
NTPC Ltd. (U.P.)
P.S.P.C.L. (Punjab)
T.N.G & D Corporation (Tamil Nadu)
U.P.R.V.U.N.L. ( U.P.)
NTPC Ltd. (Andhra Pradesh).
R.R.V.U.N.L. (Rajasthan)
M.P.P.G.C.L. ( M.P.)
M.S.P.G.C.L. (Maharastra)
N.L.C. Ltd. (Tamil Nadu)
Page 2 of 3

Installed
Capcity
Coal
consumed
Ash content
of coal
Fly Ash
Generation
Fly Ash
Utilization
% age
Utilization
In making of
Fly Ash
based/
Bricks/
Blocks/ Tiles
etc.
In
manufacture
of Portland
Pozzolana
Cement
In
construction
of Highways
& Roads
including
Flyovers
Part
replacement
of cement in
concrete
In Hydro
Power Sector
as part
replacement
of cement in
concrete
In Ash dyke
raising
In
reclamation
of low lying
Area
In Mine
filling
In
Agriculture/
Waste land
Devlopment
Others
(MW) (million-ton) % age (million-ton) (million-ton) % (million-ton) (million-ton) (million-ton) (million-ton) (million-ton) (million-ton) (million-ton) (million-ton) (million-ton) (million-ton) (million-ton)
(1) (2) (3) (4) (5) (6) (7) (8) (9) (10) (11) (12) (13) (14) (15) (16) (17) (18) (19) (20)
FLY ASH GENERATION AND ITS UTILIZATION
ANNEX-II
Power Utility & State
FLY ASH GENERATION AND ITS UTILIZATION AT COAL/LIGNITE BASED THERMAL POWER STATIONS IN THE COUNTRY FOR THE YEAR 2012-13 (APRIL, 2012 TO MARCH, 2013)
( POWER STATION WISE )
Sl. No. Total
Utilization
Name of TPS MODES OF UTILIZATION
119 OBRA 1300 3.1909 39.55 1.262000 0.306115 24.26 - 0.306115 - - - - - - - - 0.306115
120 PANKI 210 0.7758 33.19 0.257053 0.401564 156.21 0.002346 0.141098 - - - - 0.258120 - - - 0.401564
121 PARICHHA 1140 3.3979 33.48 1.137951 0.703251 61.80 0.000180 0.531350 - - - 0.137760 0.030980 - 0.002920 0.000060 0.703250
122 UDUPI U.P.C.L. (Karnatak) 1200 2.7550 5.04 0.139069 0.107536 77.32 0.000152 0.081327 - 0.026057 - - - - - - 0.107536
123 KATGHORA V.E.S.P.L. (Chhattisgarh.) 35 - - - - - - - - - - - - - - - -
124 BUTIBORI V.I.P Ltd. (Maharastra) 300 0.0058 29.71 0.001720 0.000000 0.00 - - - - - - - - - - -
125 KOLAGHAT 1260 6.0495 40.19 2.438700 3.419600 143.63 0.690200 0.532700 0.523840 0.010100 - - - - 1.602700 0.059147 3.418687
126 SAGARDIGHI 600 2.6107 41.93 1.090625 0.221796 21.29 0.044326 0.142667 0.034330 - - - - - - 0.000023 0.221346
127 BANDEL 450 1.5703 36.27 0.561700 0.747900 146.32 0.033100 - - - - - - - 0.663100 0.059800 0.756000
128 SANTALDIH 500 1.5959 38.42 0.608716 0.266692 43.81 0.008452 - - - - - 0.258188 - - - 0.266640
129 BAKRESWAR 1050 5.2808 39.31 2.079500 2.310300 111.31 0.058700 0.807000 - - - - 1.430000 - - 0.013500 2.309200
130 WARDHA WARORA W.P.C.L. (Maharastra) 540 2.3180 36.46 0.845300 0.845300 100.00 0.007328 0.542100 - 0.001100 - - 0.049326 0.245509 - - 0.845363
131 GEPL TPP Gupta Energy Pvt. Ltd. (Maharastra) 120 0.5059 28.22 0.142787 0.142787 100.00 0.008224 0.116667 - - - 0.007590 0.010306 - - - 0.142787
132 JAYPEE BINA TPP Jaypee Bina Thermal Power Plant (M.P.) 500 0.3608 43.49 0.156941 0.104747 66.74 - 0.005563 - - - - 0.099184 - - - 0.104747
133 MAHADEV PRASAD TPS Adhunik Power & Natural Resources Ltd. 540 0.2129 44.43 0.094600 0.018920 20.00 0.009460 0.009460 - - - - - - - - 0.018920
134 EMCO ENERGY Ltd. EMCO Energy Ltd. (Maharastra) 300 0.0602 40.00 0.024084 0.019998 83.00 - 0.015600 - - - - - 0.004398 - - 0.019998
135 RATIJA TPS Spectrum Coal & Power Ltd.(Chhattisgarh) 50 0.0251 51.00 0.010289 0.010289 100.00 0.001792 - - - - - 0.008497 - - - 0.010289
136 TIRORA Adani Power Ltd. (Maharastra) 1320 0.4200 24.20 0.097900 0.047900 48.93 0.000100 - - - - - 0.047800 - - - 0.047900
137 AMARAVATI TPS Indiabulls Power Ltd. (Maharastra) 270 0.0002 40.00 0.000096 0.000096 100.00 - - - - - 0.000096 - - - - 0.000096
138 BELA TPS Ideal Energy Projects Ltd. (Maharastra) 270 0.0044 34.00 0.001497 0.000500 33.33 - - - - - - 0.000500 - - - 0.000500
120312.30 482.9728 33.87 163.56 100.37 61.37 9.982954 41.327098 6.022582 1.027026 0.004550 10.925255 11.827079 10.342563 2.503798 6.409869 100.37
W.B.P.D.C.L. (W.B.)
GRAND TOTAL
Page 3 of 3