Embed Size (px)
Citation preview
1
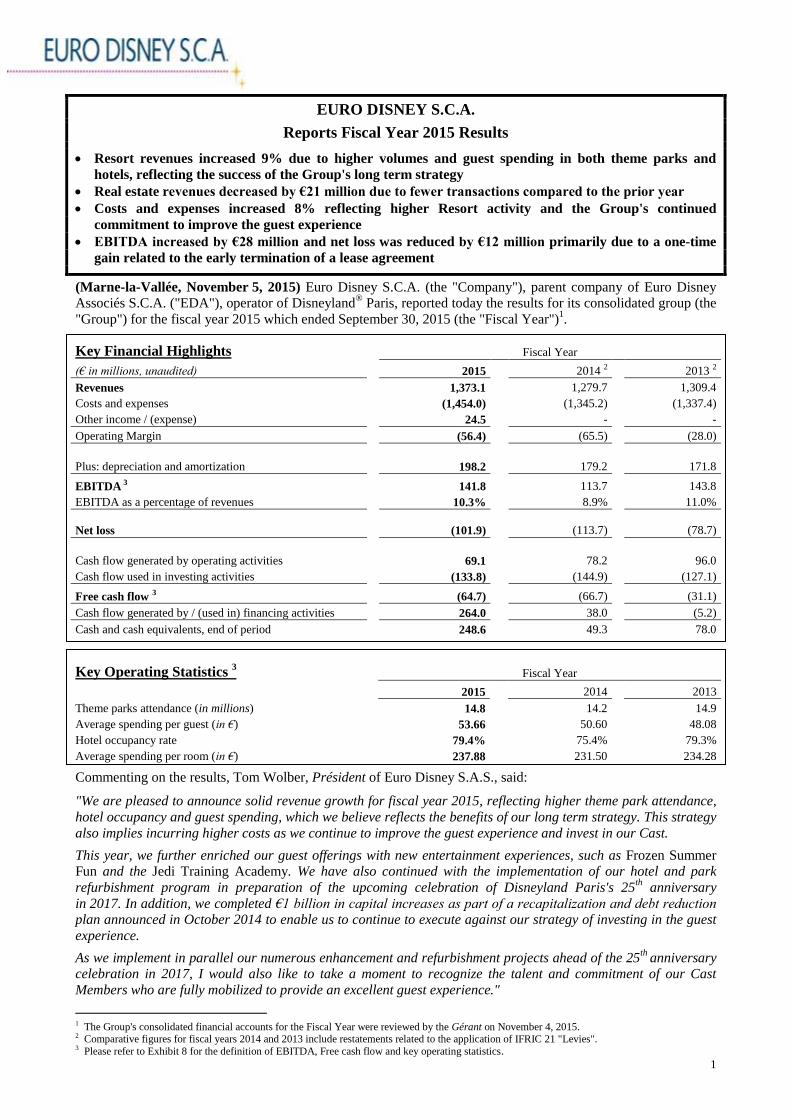
EURO DISNEY S.C.A.
Reports Fiscal Year 2015 Results
Resort revenues increased 9% due to higher volumes and guest spending in both theme parks and
hotels, reflecting the success of the Group's long term strategy
Real estate revenues decreased by €21 million due to fewer transactions compared to the prior year
Costs and expenses increased 8% reflecting higher Resort activity and the Group's continued
commitment to improve the guest experience
EBITDA increased by €28 million and net loss was reduced by €12 million primarily due to a one-time
gain related to the early termination of a lease agreement
(Marne-la-Vallée, November 5, 2015) Euro Disney S.C.A. (the "Company"), parent company of Euro Disney
Associés S.C.A. ("EDA"), operator of Disneyland® Paris, reported today the results for its consolidated group (the
"Group") for the fiscal year 2015 which ended September 30, 2015 (the "Fiscal Year")1.2
Key Financial Highlights Fiscal Year
(€ in millions, unaudited) 2015 2014 2 2013 2
Revenues 1,373.1 1,279.7 1,309.4
Costs and expenses (1,454.0) (1,345.2) (1,337.4)
Other income / (expense) 24.5 - -
Operating Margin (56.4) (65.5) (28.0)
Plus: depreciation and amortization 198.2 179.2 171.8
EBITDA 3 141.8 113.7 143.8
EBITDA as a percentage of revenues 10.3% 8.9% 11.0%
Net loss (101.9) (113.7) (78.7)
Cash flow generated by operating activities 69.1 78.2 96.0
Cash flow used in investing activities (133.8) (144.9) (127.1)
Free cash flow 3 (64.7) (66.7) (31.1)
Cash flow generated by / (used in) financing activities 264.0 38.0 (5.2)
Cash and cash equivalents, end of period 248.6 49.3 78.0
Key Operating Statistics 3 Fiscal Year
2015 2014 2013
Theme parks attendance (in millions) 14.8 14.2 14.9
Average spending per guest (in €) 53.66 50.60 48.08
Hotel occupancy rate 79.4% 75.4% 79.3%
Average spending per room (in €) 237.88 231.50 234.28
Commenting on the results, Tom Wolber, Président of Euro Disney S.A.S., said:
"We are pleased to announce solid revenue growth for fiscal year 2015, reflecting higher theme park attendance,
hotel occupancy and guest spending, which we believe reflects the benefits of our long term strategy. This strategy
also implies incurring higher costs as we continue to improve the guest experience and invest in our Cast.
This year, we further enriched our guest offerings with new entertainment experiences, such as Frozen Summer
Fun and the Jedi Training Academy. We have also continued with the implementation of our hotel and park
refurbishment program in preparation of the upcoming celebration of Disneyland Paris's 25th
anniversary
in 2017. In addition, we completed €1 billion in capital increases as part of a recapitalization and debt reduction plan announced in October 2014 to enable us to continue to execute against our strategy of investing in the guest
experience.
As we implement in parallel our numerous enhancement and refurbishment projects ahead of the 25th
anniversary celebration in 2017, I would also like to take a moment to recognize the talent and commitment of our Cast
Members who are fully mobilized to provide an excellent guest experience."
1 The Group's consolidated financial accounts for the Fiscal Year were reviewed by the Gérant on November 4, 2015. 2 Comparative figures for fiscal years 2014 and 2013 include restatements related to the application of IFRIC 21 "Levies". 3 Please refer to Exhibit 8 for the definition of EBITDA, Free cash flow and key operating statistics.
2
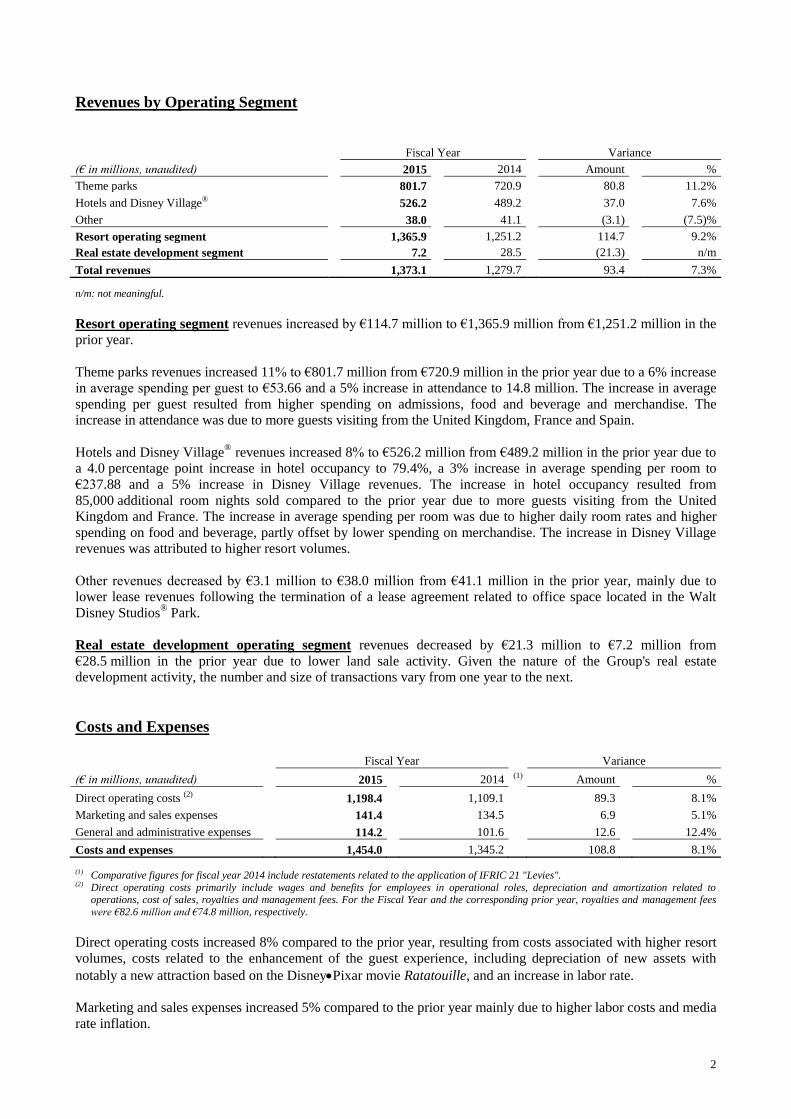
Revenues by Operating Segment
Fiscal Year Variance
(€ in millions, unaudited) 2015 2014 Amount %
Theme parks 801.7 720.9 80.8 11.2%
Hotels and Disney Village® 526.2 489.2 37.0 7.6%
Other 38.0 41.1 (3.1) (7.5)%
Resort operating segment 1,365.9 1,251.2 114.7 9.2%
Real estate development segment 7.2 28.5 (21.3) n/m
Total revenues 1,373.1 1,279.7 93.4 7.3%
n/m: not meaningful.
Resort operating segment revenues increased by €114.7 million to €1,365.9 million from €1,251.2 million in the
prior year.
Theme parks revenues increased 11% to €801.7 million from €720.9 million in the prior year due to a 6% increase
in average spending per guest to €53.66 and a 5% increase in attendance to 14.8 million. The increase in average
spending per guest resulted from higher spending on admissions, food and beverage and merchandise. The
increase in attendance was due to more guests visiting from the United Kingdom, France and Spain.
Hotels and Disney Village® revenues increased 8% to €526.2 million from €489.2 million in the prior year due to
a 4.0 percentage point increase in hotel occupancy to 79.4%, a 3% increase in average spending per room to
€237.88 and a 5% increase in Disney Village revenues. The increase in hotel occupancy resulted from
85,000 additional room nights sold compared to the prior year due to more guests visiting from the United
Kingdom and France. The increase in average spending per room was due to higher daily room rates and higher
spending on food and beverage, partly offset by lower spending on merchandise. The increase in Disney Village
revenues was attributed to higher resort volumes.
Other revenues decreased by €3.1 million to €38.0 million from €41.1 million in the prior year, mainly due to
lower lease revenues following the termination of a lease agreement related to office space located in the Walt
Disney Studios® Park.
Real estate development operating segment revenues decreased by €21.3 million to €7.2 million from
€28.5 million in the prior year due to lower land sale activity. Given the nature of the Group's real estate
development activity, the number and size of transactions vary from one year to the next.
Costs and Expenses
Fiscal Year Variance
(€ in millions, unaudited) 2015 2014 (1) Amount %
Direct operating costs (2) 1,198.4 1,109.1 89.3 8.1%
Marketing and sales expenses 141.4 134.5 6.9 5.1%
General and administrative expenses 114.2 101.6 12.6 12.4%
Costs and expenses 1,454.0 1,345.2 108.8 8.1%
(1) Comparative figures for fiscal year 2014 include restatements related to the application of IFRIC 21 "Levies". (2) Direct operating costs primarily include wages and benefits for employees in operational roles, depreciation and amortization related to
operations, cost of sales, royalties and management fees. For the Fiscal Year and the corresponding prior year, royalties and management fees
were €82.6 million and €74.8 million, respectively.
Direct operating costs increased 8% compared to the prior year, resulting from costs associated with higher resort
volumes, costs related to the enhancement of the guest experience, including depreciation of new assets with
notably a new attraction based on the DisneyPixar movie Ratatouille, and an increase in labor rate.
Marketing and sales expenses increased 5% compared to the prior year mainly due to higher labor costs and media
rate inflation.
3
General and administrative expenses increased 12% compared to the prior year primarily due to higher labor
costs, mainly resulting from an increase in labor rate, new positions for social programs in line with regulatory
obligations and agreements as well as technology initiatives.
Other Income / (Expense)
During the Fiscal Year, the Group received from The Walt Disney Company (France) S.A.S. a €24.5 million fee
for the termination, before the contractual term, of a lease agreement related to office space located in the Walt
Disney Studios® Park.
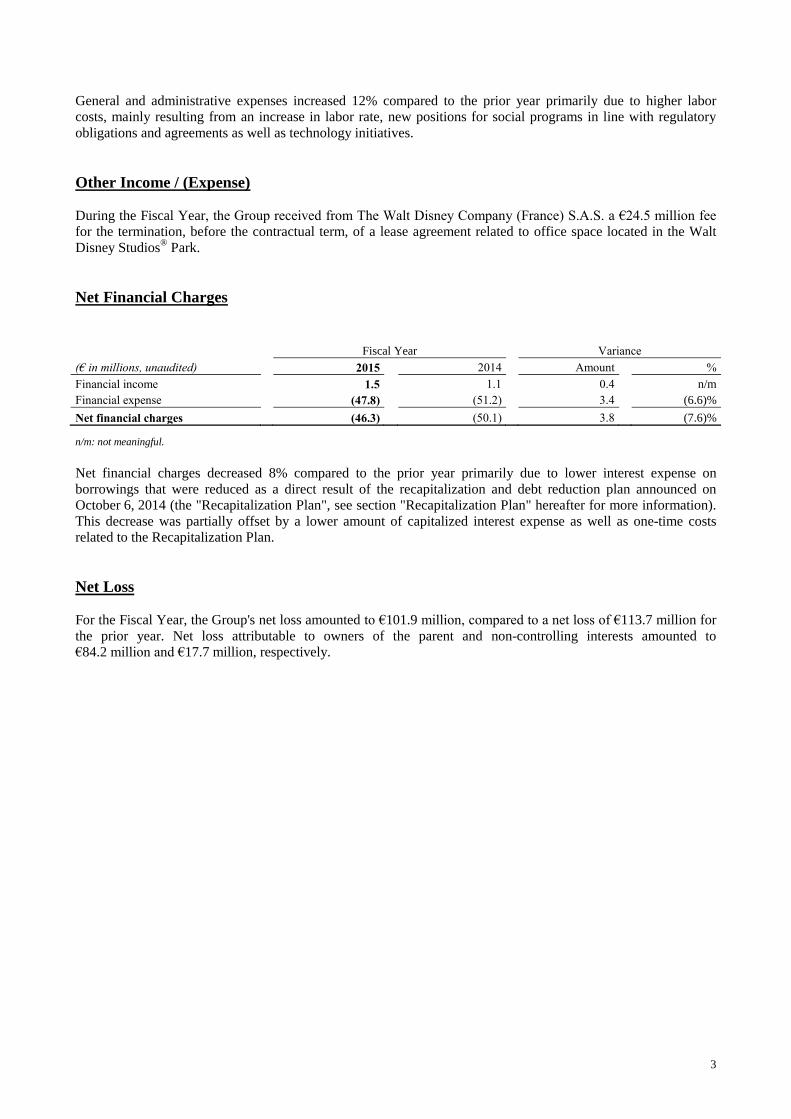
Net Financial Charges
Fiscal Year Variance
(€ in millions, unaudited) 2015 2014 Amount %
Financial income 1.5 1.1 0.4 n/m
Financial expense (47.8) (51.2) 3.4 (6.6)%
Net financial charges (46.3) (50.1) 3.8 (7.6)%
n/m: not meaningful.
Net financial charges decreased 8% compared to the prior year primarily due to lower interest expense on
borrowings that were reduced as a direct result of the recapitalization and debt reduction plan announced on
October 6, 2014 (the "Recapitalization Plan", see section "Recapitalization Plan" hereafter for more information).
This decrease was partially offset by a lower amount of capitalized interest expense as well as one-time costs
related to the Recapitalization Plan.
Net Loss
For the Fiscal Year, the Group's net loss amounted to €101.9 million, compared to a net loss of €113.7 million for
the prior year. Net loss attributable to owners of the parent and non-controlling interests amounted to
€84.2 million and €17.7 million, respectively.
4
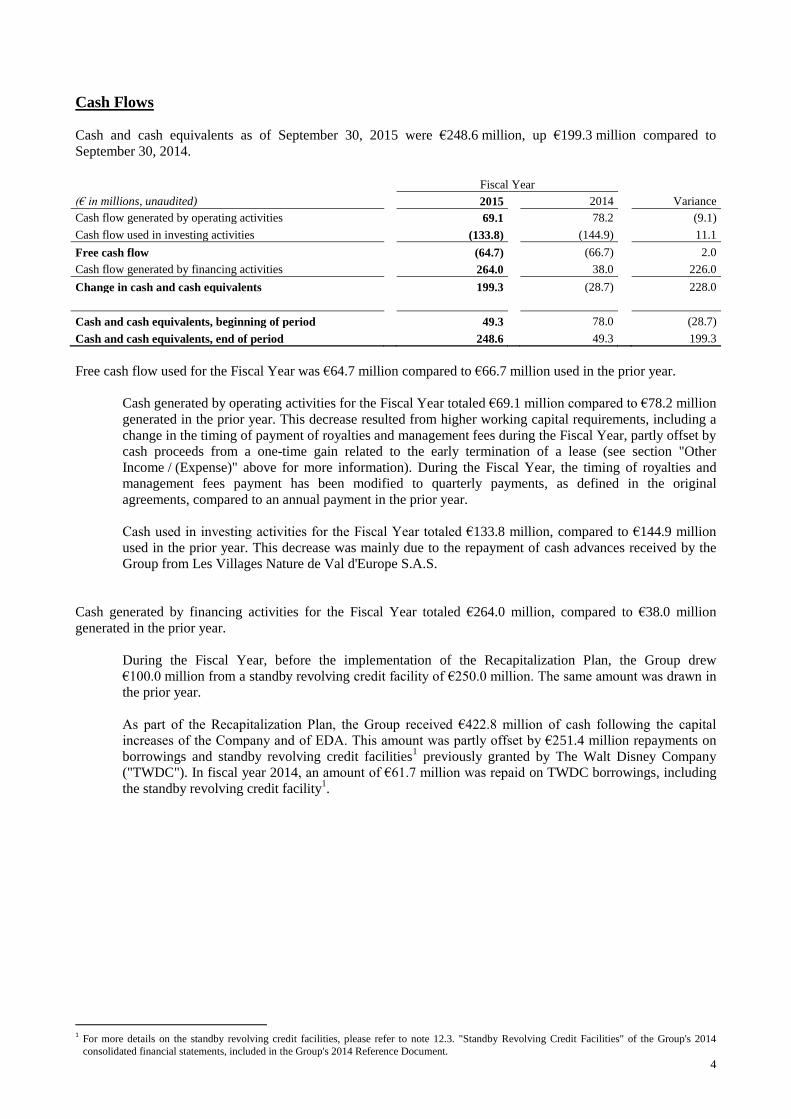
Cash Flows
Cash and cash equivalents as of September 30, 2015 were €248.6 million, up €199.3 million compared to
September 30, 2014.
Fiscal Year
(€ in millions, unaudited) 2015 2014 Variance
Cash flow generated by operating activities 69.1 78.2 (9.1)
Cash flow used in investing activities (133.8) (144.9) 11.1
Free cash flow (64.7) (66.7) 2.0
Cash flow generated by financing activities 264.0 38.0 226.0
Change in cash and cash equivalents 199.3 (28.7) 228.0
Cash and cash equivalents, beginning of period 49.3 78.0 (28.7)
Cash and cash equivalents, end of period 248.6 49.3 199.3
Free cash flow used for the Fiscal Year was €64.7 million compared to €66.7 million used in the prior year.
Cash generated by operating activities for the Fiscal Year totaled €69.1 million compared to €78.2 million
generated in the prior year. This decrease resulted from higher working capital requirements, including a
change in the timing of payment of royalties and management fees during the Fiscal Year, partly offset by
cash proceeds from a one-time gain related to the early termination of a lease (see section "Other
Income / (Expense)" above for more information). During the Fiscal Year, the timing of royalties and
management fees payment has been modified to quarterly payments, as defined in the original
agreements, compared to an annual payment in the prior year.
Cash used in investing activities for the Fiscal Year totaled €133.8 million, compared to €144.9 million
used in the prior year. This decrease was mainly due to the repayment of cash advances received by the
Group from Les Villages Nature de Val d'Europe S.A.S.
Cash generated by financing activities for the Fiscal Year totaled €264.0 million, compared to €38.0 million
generated in the prior year.
During the Fiscal Year, before the implementation of the Recapitalization Plan, the Group drew
€100.0 million from a standby revolving credit facility of €250.0 million. The same amount was drawn in
the prior year.
As part of the Recapitalization Plan, the Group received €422.8 million of cash following the capital
increases of the Company and of EDA. This amount was partly offset by €251.4 million repayments on
borrowings and standby revolving credit facilities1 previously granted by The Walt Disney Company
("TWDC"). In fiscal year 2014, an amount of €61.7 million was repaid on TWDC borrowings, including
the standby revolving credit facility1.
1
For more details on the standby revolving credit facilities, please refer to note 12.3. "Standby Revolving Credit Facilities" of the Group's 2014
consolidated financial statements, included in the Group's 2014 Reference Document.
5
Recapitalization Plan
During the Fiscal Year, the Group implemented the recapitalization and debt reduction plan announced on
October 6, 2014, which amounted to approximately €1 billion. The Recapitalization Plan aimed at improving the
Group's financial position and enabling it to continue investing in Disneyland® Paris so as to improve the guest
experience.
The main elements of this Recapitalization Plan are presented below:
- cash infusion of €422.8 million, made through capital increases of the Company and of EDA;
- conversion of €600 million of debt owed to indirect subsidiaries of TWDC into equity through capital
increases of the Company and of EDA;
- deferral of all amortization payments of loans granted by indirect subsidiaries of TWDC until a revised
maturity date in December 2024 (previously 2028); and
- repayment of €250.0 million drawn under the standby revolving credit facilities granted previously by
TWDC, maturing in 2015, 2017 and 2018, replaced by a single €350.0 million revolving credit facility
maturing in December 2023.
During the Fiscal Year, the Company completed share capital increases as part of the Recapitalization Plan.
Following these share capital increases, EDL Holding Company, LLC, Euro Disney Investments S.A.S. ("EDI")
and EDL Corporation S.A.S. ("EDLC") reported that their interests in the Company crossed certain thresholds. As
a result, they were required to launch a mandatory tender offer for the Company's shares that they did not own
(the "Mandatory Tender Offer"). This Mandatory Tender Offer was completed on September 24, 2015, and its
results were published on September 29, 2015. Following completion of the Mandatory Tender Offer, EDL
Holding Company, LLC, EDI and EDLC owned together 643,497,755 Company's shares, representing 82.15% of
the Company's share capital and voting rights.
Following completion of the Mandatory Tender Offer, and as announced, shareholders having the status of
eligible shareholders (other than EDL Holding Company, LLC, EDI and EDLC) have the possibility to acquire,
under certain conditions, at a price of 1.25 euro per share, a portion of the Company's shares previously
subscribed by EDI and EDLC in the context of the capital increases reserved to those entities (as part of the
Recapitalization Plan) and completed during the second quarter of the Fiscal Year (the "Rights to Acquire
Company's Shares"). The exercise period of the Rights to Acquire Company's Shares began on October 12, 2015
and will end on November 10, 2015. The collective ownership of TWDC, through its subsidiaries, following
completion of this anti-dilution mechanism will be announced on November 18, 2015.
For more details on the terms and conditions regarding the status of eligible shareholders, the allocation and the
exercise of the Rights to Acquire Company's Shares as well as the different steps of the Recapitalization Plan,
please refer to the press releases and the other related documents, which are available on the Group's website
(http://corporate.disneylandparis.com).

6
Press Contact Investor Relations
Cathy Pianon Yoann Nguyen
Tel: +331 64 74 58 33 Tel: +331 64 74 58 55
Fax: +331 64 74 59 69 Fax: +331 64 74 56 36
e-mail: [email protected] e-mail: [email protected]
Corporate Communication
François Banon
Tel: +331 64 74 59 50
Fax: +331 64 74 59 69
e-mail: [email protected]
Fiscal Year 2015 results presentation webcast (in French language with simultaneous English translation),
together with the presentation document, will be available on the Company's website
(http://corporate.disneylandparis.com) on November 6th
, 2015, 9:30 am CET
Additional financial information can be found on the Internet at: http://corporate.disneylandparis.com
Code ISIN: FR0010540740
Code Reuters: EDLP.PA
Code Bloomberg: EDL:FP
The Group operates Disneyland® Paris which includes: Disneyland® Park, Walt Disney Studios® Park, seven themed hotels with
approximately 5,800 rooms (excluding approximately 2,300 additional third-party rooms located on the site), two convention
centers, the Disney Village®, a dining, shopping and entertainment centre, and golf courses. The Group's operating activities also
include the development of the 2,230-hectare site, half of which is yet to be developed. Euro Disney S.C.A.'s shares are listed and
traded on Euronext Paris. Attachments: Exhibit 1 – Consolidated Statements of Income
Exhibit 2 – Consolidated Segment Statements of Income
Exhibit 3 – Consolidated Statements of Financial Position Exhibit 4 – Consolidated Statements of Cash Flows
Exhibit 5 – Consolidated Statements of Changes in Equity
Exhibit 6 – Statement of Changes in Borrowings Exhibit 7 – Consolidated Semestrial Statements of Income
Exhibit 8 – Definitions

EXHIBIT 1
7
EURO DISNEY S.C.A.
Fiscal Year 2015 Results Announcement
CONSOLIDATED STATEMENTS OF INCOME
Fiscal Year Variance
(€ in millions, unaudited) 2015 2014 (1) Amount %
Revenues 1,373.1 1,279.7 93.4 7.3%
Costs and expenses (1,454.0) (1,345.2) (108.8) 8.1%
Other income / (expense) 24.5 - 24.5 n/a
Operating margin (56.4) (65.5) 9.1 (13.9)%
Net financial charges (46.3) (50.1) 3.8 (7.6)%
Gain from equity investments 0.8 1.9 (1.1) n/m
Loss before taxes (101.9) (113.7) 11.8 (10.4)%
Income taxes - - - n/a
Net loss (101.9) (113.7) 11.8 (10.4)%
Net loss attributable to:
Owners of the parent (84.2) (93.5) 9.3 (9.9)%
Non-controlling interests (17.7) (20.2) 2.5 (12.4)% (1) Comparative figures for fiscal year 2014 include restatements related to the application of IFRIC 21 "Levies".
n/a: not applicable. n/m: not meaningful.

EXHIBIT 2
8
EURO DISNEY S.C.A.
Fiscal Year 2015 Results Announcement
CONSOLIDATED SEGMENT STATEMENTS OF INCOME
RESORT OPERATING SEGMENT
Fiscal Year Variance
(€ in millions, unaudited) 2015 2014 (1) Amount %
Revenues 1,365.9 1,251.2 114.7 9.2%
Costs and expenses (1,445.9) (1,326.7) (119.2) 9.0%
Operating margin (80.0) (75.5) (4.5) 6.0%
Net financial charges (46.3) (50.3) 4.0 (8.0)%
(Loss) / gain from equity investments (0.7) 0.2 (0.9) n/m
Loss before taxes (127.0) (125.6) (1.4) 1.1%
Income taxes - - - n/a
Net loss (127.0) (125.6) (1.4) 1.1%
(1) Comparative figures for fiscal year 2014 include restatements related to the application of IFRIC 21 "Levies".
n/a: not applicable. n/m: not meaningful.
REAL ESTATE DEVELOPMENT OPERATING SEGMENT
Fiscal Year Variance
(€ in millions, unaudited) 2015 2014 Amount %
Revenues 7.2 28.5 (21.3) n/m
Costs and expenses (8.1) (18.5) 10.4 n/m
Other income / (expense) 24.5 - 24.5 n/a
Operating margin 23.6 10.0 13.6 n/m
Net financial income - 0.2 (0.2) n/m
Gain from equity investments 1.5 1.7 (0.2) n/m
Profit before taxes 25.1 11.9 13.2 n/m
Income taxes - - - n/a
Net profit 25.1 11.9 13.2 n/m
n/a: not applicable. n/m: not meaningful.

EXHIBIT 3
9
EURO DISNEY S.C.A.
Fiscal Year 2015 Results Announcement
CONSOLIDATED STATEMENTS OF FINANCIAL POSITION
September 30,
(€ in millions, unaudited) 2015 2014 (1)
Non-current assets
Property, plant and equipment, net 1,724.5 1,775.7
Investment property 16.6 16.6
Intangible assets 43.1 41.8
Restricted cash 15.1 15.1
Other 62.8 58.6
1,862.1 1,907.8
Current assets
Inventories 40.9 41.4
Trade and other receivables 119.6 136.6
Cash and cash equivalents 248.6 49.3
Other 19.2 24.4
428.3
251.7
Total assets 2,290.4 2,159.5
Equity attributable to owners of the parent
Share capital 783.4 39.0
Share premium 1,717.6 1,627.3
Accumulated deficit (1,900.3) (1,816.4)
Other (17.9) (18.7)
Total equity attributable to owners of the parent 582.8 (168.8)
Non-controlling interests 130.8 (31.7)
Total equity 713.6 (200.5)
Non-current liabilities
Borrowings 998.8 1,716.3
Deferred income 19.9 20.7
Provisions 16.9 18.7
Other 65.0 57.9
1,100.6 1,813.6
Current liabilities
Trade and other payables 340.4 389.8
Borrowings 2.1 31.4
Deferred income 129.4 117.8
Other 4.3 7.4
476.2
546.4
Total liabilities 1,576.8 2,360.0
Total equity and liabilities 2,290.4 2,159.5 (1) Comparative figures for fiscal year 2014 include restatements related to the application of IFRIC 21 "Levies".
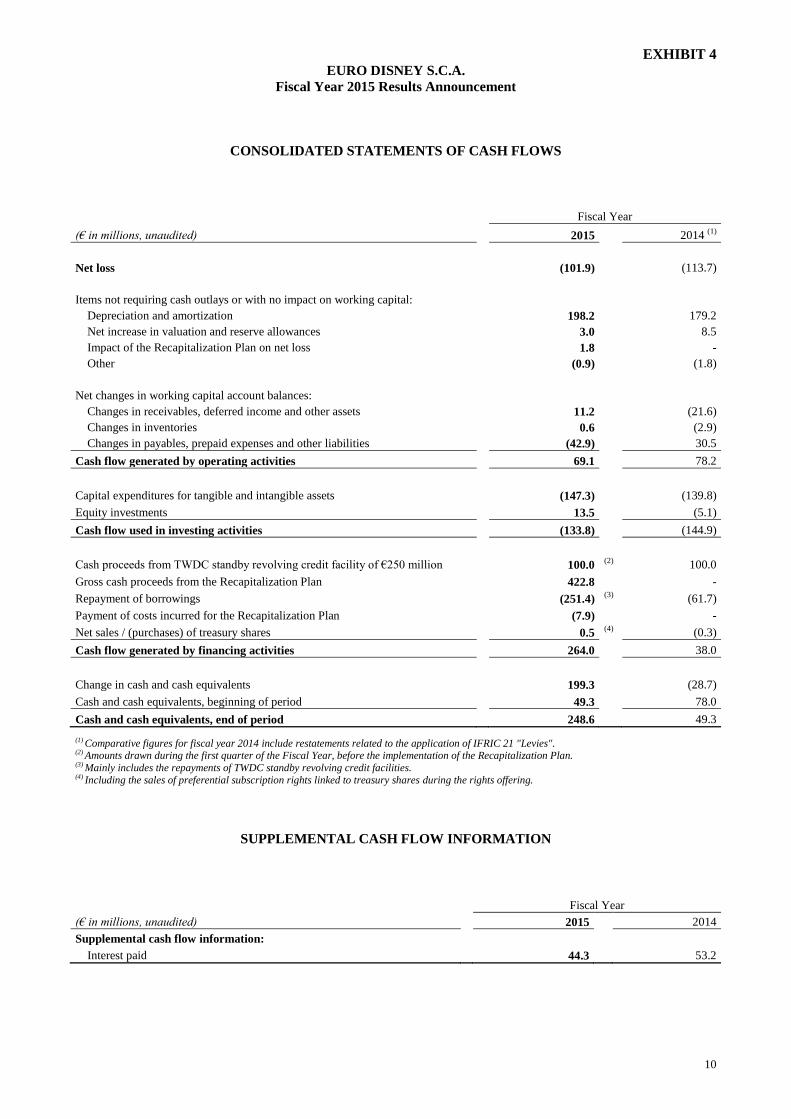
EXHIBIT 4
10
EURO DISNEY S.C.A.
Fiscal Year 2015 Results Announcement
CONSOLIDATED STATEMENTS OF CASH FLOWS
Fiscal Year
(€ in millions, unaudited) 2015 2014 (1)
Net loss (101.9) (113.7)
Items not requiring cash outlays or with no impact on working capital:
Depreciation and amortization 198.2 179.2
Net increase in valuation and reserve allowances 3.0 8.5
Impact of the Recapitalization Plan on net loss 1.8 -
Other (0.9) (1.8)
Net changes in working capital account balances:
Changes in receivables, deferred income and other assets 11.2 (21.6)
Changes in inventories 0.6 (2.9)
Changes in payables, prepaid expenses and other liabilities (42.9) 30.5
Cash flow generated by operating activities 69.1 78.2
Capital expenditures for tangible and intangible assets (147.3) (139.8)
Equity investments 13.5 (5.1)
Cash flow used in investing activities (133.8) (144.9)
Cash proceeds from TWDC standby revolving credit facility of €250 million 100.0 (2) 100.0
Gross cash proceeds from the Recapitalization Plan 422.8 -
Repayment of borrowings (251.4) (3) (61.7)
Payment of costs incurred for the Recapitalization Plan (7.9) -
Net sales / (purchases) of treasury shares 0.5 (4) (0.3)
Cash flow generated by financing activities 264.0 38.0
Change in cash and cash equivalents 199.3 (28.7)
Cash and cash equivalents, beginning of period 49.3 78.0
Cash and cash equivalents, end of period 248.6 49.3 (1) Comparative figures for fiscal year 2014 include restatements related to the application of IFRIC 21 "Levies".
(2) Amounts drawn during the first quarter of the Fiscal Year, before the implementation of the Recapitalization Plan.
(3) Mainly includes the repayments of TWDC standby revolving credit facilities. (4) Including the sales of preferential subscription rights linked to treasury shares during the rights offering.
SUPPLEMENTAL CASH FLOW INFORMATION
Fiscal Year
(€ in millions, unaudited) 2015 2014
Supplemental cash flow information:
Interest paid 44.3 53.2

EXHIBIT 5
11
EURO DISNEY S.C.A.
Fiscal Year 2015 Results Announcement
CONSOLIDATED STATEMENTS OF CHANGES IN EQUITY
(€ in millions unaudited) September 30,
2014 (1)
Net capital
increases
Net loss for
the Fiscal Year Other September 30,
2015
Equity attributable to owners of the
parent
Share capital 39.0 744.4 - - 783.4
Share premium 1,627.3 90.3 (2) - - 1,717.6
Accumulated deficit (1,816.4) - (84.2) 0.3 (1,900.3)
Other (18.7) - - 0.8 (17.9)
Total equity attributable to owners of
the parent
(168.8) 834.7 (84.2) 1.1 582.8
Non-controlling interests (31.7) 180.0 (17.7) 0.2 130.8
Total equity (200.5) 1,014.7 (101.9) 1.3 713.6 (1) As of September 30, 2014, comparative figures include restatements related to the application of IFRIC 21 "Levies". (2) The increase in share premium includes a negative impact of €8.1 million of costs related to the Company's share capital increases.
EXHIBIT 6
STATEMENT OF CHANGES IN BORROWINGS
Fiscal Year 2015 (unaudited)
(€ in millions)
September
30, 2014 Increase
Debt
conversion Repayments Transfers
September
30, 2015
(unaudited)
Long-term loans 1,191.8 - (208.6) - - 983.2
Consolidated promissory note - Disney Enterprises Inc. 268.7 - (268.7) - - -
Consolidated promissory note - Euro Disney S.A.S. 92.7 - (92.7) - - -
Standby revolving credit facility of €100 million 100.0 - - (100.0) - -
Standby revolving credit facility of €250 million 50.0 100.0 - (150.0) - -
Loan from TWDC to Centre de Congrès Newport S.N.C. 13.1 - - - (1.6) 11.5
Sub-total TWDC debt 1,716.3 100.0 (570.0) (250.0) (1.6) 994.7
Financial leases - 4.1 - - - 4.1
Total non current borrowings 1,716.3 104.1 (570.0) (250.0) (1.6) 998.8
Long-term loans 30.0 - (30.0) - - -
Loan from TWDC to Centre de Congrès Newport S.N.C. 1.4 - - (1.4) 1.6 1.6
Sub-total TWDC debt 31.4 - (30.0) (1.4) 1.6 1.6
Financial leases - 0.5 - - - 0.5
Total current borrowings 31.4 0.5 (30.0) (1.4) 1.6 2.1
Total borrowings 1,747.7 104.6 (600.0) (1) (251.4) - 1,000.9
(1) As part of the Recapitalization Plan, an amount of €600.0 million of debt was converted into equity.
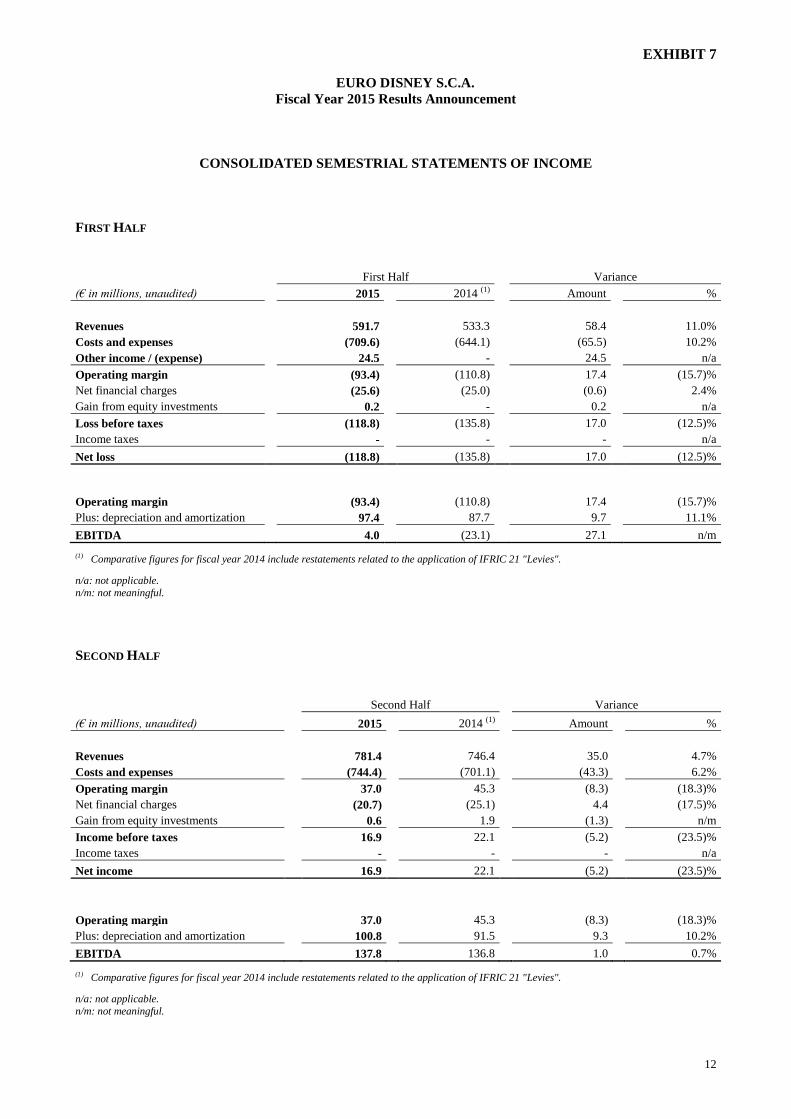
EXHIBIT 7
12
EURO DISNEY S.C.A.
Fiscal Year 2015 Results Announcement
CONSOLIDATED SEMESTRIAL STATEMENTS OF INCOME
FIRST HALF
First Half Variance
(€ in millions, unaudited) 2015 2014 (1) Amount %
Revenues 591.7 533.3 58.4 11.0%
Costs and expenses (709.6) (644.1) (65.5) 10.2%
Other income / (expense) 24.5 - 24.5 n/a
Operating margin (93.4) (110.8) 17.4 (15.7)%
Net financial charges (25.6) (25.0) (0.6) 2.4%
Gain from equity investments 0.2 - 0.2 n/a
Loss before taxes (118.8) (135.8) 17.0 (12.5)%
Income taxes - - - n/a
Net loss (118.8) (135.8) 17.0 (12.5)%
Operating margin (93.4) (110.8) 17.4 (15.7)%
Plus: depreciation and amortization 97.4 87.7 9.7 11.1%
EBITDA 4.0 (23.1) 27.1 n/m (1) Comparative figures for fiscal year 2014 include restatements related to the application of IFRIC 21 "Levies".
n/a: not applicable.
n/m: not meaningful.
SECOND HALF
Second Half Variance
(€ in millions, unaudited) 2015 2014 (1) Amount %
Revenues 781.4 746.4 35.0 4.7%
Costs and expenses (744.4) (701.1) (43.3) 6.2%
Operating margin 37.0 45.3 (8.3) (18.3)%
Net financial charges (20.7) (25.1) 4.4 (17.5)%
Gain from equity investments 0.6 1.9 (1.3) n/m
Income before taxes 16.9 22.1 (5.2) (23.5)%
Income taxes - - - n/a
Net income 16.9 22.1 (5.2) (23.5)%
Operating margin 37.0 45.3 (8.3) (18.3)%
Plus: depreciation and amortization 100.8 91.5 9.3 10.2%
EBITDA 137.8 136.8 1.0 0.7% (1) Comparative figures for fiscal year 2014 include restatements related to the application of IFRIC 21 "Levies".
n/a: not applicable.
n/m: not meaningful.

EXHIBIT 8
13
EURO DISNEY S.C.A.
Fiscal Year 2015 Results Announcement
DEFINITIONS
EBITDA corresponds to earnings before interest, taxes, depreciation and amortization. EBITDA is not a measure
of financial performance defined under IFRS, and should not be viewed as a substitute for operating margin, net
profit / (loss) or operating cash flows in evaluating the Group's financial results. However, management believes
that EBITDA is a useful tool for evaluating the Group's performance.
Free cash flow is cash generated by operating activities less cash used in investing activities. Free cash flow is not
a measure of financial performance defined under IFRS, and should not be viewed as a substitute for operating
margin, net profit / (loss) or operating cash flows in evaluating the Group's financial results. However,
management believes that free cash flow is a useful tool for evaluating the Group's performance.
Theme Parks attendance corresponds to the attendance recorded on a "first click" basis, meaning that a person
visiting both parks in a single day is counted as only one visitor.
Average spending per guest is the average daily admission price and spending on food, beverage, merchandise
and other services sold in the parks, excluding value added tax.
Hotel occupancy rate is the average daily rooms occupied as a percentage of total room inventory (total room
inventory is approximately 5,800 rooms).
Average spending per room is the average daily room price and spending on food, beverage, merchandise and
other services sold in hotels, excluding value added tax.