Embed Size (px)
Citation preview
Hindawi Publishing CorporationInternational Journal of Distributed Sensor NetworksVolume 2013, Article ID 209803, 13 pageshttp://dx.doi.org/10.1155/2013/209803
Research ArticleAn Intelligent Energy Management Systemfor Educational Buildings
Ahmad Al-Daraiseh,1 Nazaraf Shah,2 and Eyas El-Qawasmeh1
1 King Saud University, Riyadh, Saudi Arabia2 Coventry University, Priory Street, Coventry, UK
Correspondence should be addressed to Nazaraf Shah; [email protected]
Received 13 April 2013; Revised 6 August 2013; Accepted 21 August 2013
Academic Editor: Ting-Hua Yi
Copyright © 2013 Ahmad Al-Daraiseh et al. This is an open access article distributed under the Creative Commons AttributionLicense, which permits unrestricted use, distribution, and reproduction in any medium, provided the original work is properlycited.
There is a wide variation in the energy consumption between different educational institutions due to the adoption of differentmanagement strategies and different levels of occupants’ environmental understanding. The presence of large amounts ofinformation and communication technology (ICT) equipment and heating, ventilation, and air conditioning (HVAC) system causesa major consumption of energy in higher education institution (HEI) buildings.Themain objective of this research is to investigatethe use of ICT to optimize the energy consumption in HEI buildings and reduce carbon dioxide (CO
2) emission. The first phase
of the system has been implemented at King Saud University to measure energy consumption through sensors that read energyconsumption of electrical appliances and devices every 10 seconds. The analysis of collected data allows us to develop and employenergy saving strategies that lead to a reduction in total energy consumption. Our preliminary results show that up to 17% of energyconsumption can be reduced by simply dealing with standby energy loss of labs’ computers. The novelty of this research comesfrom the use of a functional database approach to deal with high volume of data and query performance and the incorporation ofa timetabling system in energy management system.
1. Introduction
Today’s world is facing an unprecedented challenge in con-trolling increasing greenhouse gases emission, which is themain cause of global warming. CO
2makes 72% of the
total emissions of the greenhouse gases [1]. The burning offossil fuel in order to generate energy for domestic, public,commercial, and industrial use is a major source of CO
2
emission. Any attempt to deal with the issue of globalwarming requires the reduction of CO
2emission, which in
return requires a reduction in the use of energy generated byfossil fuel.
Climate change and the increase in energy bills arethe main driving forces behind a new wave of energymanagement systems for residential, public, industrial, andcommercial buildings. Most of the currently available energymanagement systems are concerned with real-time energyconsumption monitoring and the displaying of energy con-sumption statistical and real-time data [2–5]. These sys-tems play a crucial role in providing a detailed picture of
energy consumption to occupants and building managersof residential, commercial, and educational buildings. Thesesystems contribute towards influencing the energy consump-tion behavior of residential building occupants and buildingmanagers of commercial and industrial buildings. However,the majority of these systems does not automatically adjustenergy usage and leave it to the occupants to respondappropriately to reduce their energy consumption [2–5].Furthermore, these systems have serious limitations in theirintegration with HVAC.
The proposed project integrates all energy consumptionappliances, machines, and devices into a uniform systemusing a service oriented architecture (SOA) [6]. This inte-grated system provides a comprehensive picture of energyconsumption and enable the employment of effective energyconsumption strategies in a uniform and consistent manner.These energy management strategies range from automaticadjustment of various electrical systems and advice genera-tion for human operator for the use of a human as an actuator.
2 International Journal of Distributed Sensor Networks
The system fine-tunes these strategies by learning from pastevents and their associated actions.
Currently, some energy management systems providegeneral energy saving tips but do not consider the occu-pants’ energy consumption profiles and the external physicalenvironmental conditions (e.g., external temperature andsunlight, etc.). The proposed project attempts to influenceHEI staff, students, and building manager’ behavior towardssaving energy and taking automatic energy-aware actions tooptimize energy consumption while maintaining the qualityof work and level of comfort of students and staff.
The process of creating greener higher educationalinstitutions involves efficient use of energy in educationalbuildings and promoting environmental awareness withinstudents and institutional staff [7]. The proposed projectis an effort to make a greener HEI by using ICT basedsolution to optimize energy consumption and create aware-ness of green issues and sustainability. The proposed systemattempts to address the issue of sustainability and CO
2
emission reduction inHEIs by taking into account occupants’energy consumption profiles and internal as well as externalphysical conditions. The motivation behind this approach isto provide the staff, students, and building managers witheffective advice on their energy consumption, so they cantake appropriate actions towards achieving efficient energyconsumption in addition to considering automatic energy-aware actions for saving energy, such as the switching offlights or network printers in a laboratory when all computersare already switched off. The fact that the system has todeal with a large volume of sensor data and respond tovarious queries in an acceptable time is a great challenge.We attempt to deal with this issue using functional databaseapproaches, which allows us to split a higher-level queryinto low-level queries and then combine their results byapplying a service composition approach. Our proposedapproach brings together functional database features and aweb services composition to deal with the challenge posed byhuge volumes of sensor data coming from various sources.The distinguishing feature of the system is that it takes intoaccount the occupancy time of various rooms in the buildingfrom a timetabling system. It is believed that this feature willgreatly improve the energy consumption of HVAC.
The organization of this paper will be as follows. Section 2describes the current related work. Section 3 presents thesystem architecture. Section 4 describes the SOA approachfor designing and development of the system. Section 5provides a description of various components related tomanagement of huge volumes of data and reasoning over thatdata. Section 6 discusses the implementation of the system.In Section 7 we present the results. Section 8 provides a briefdiscussion and conclusion of the paper.
2. Current Related Work
Currently, there are a variety of commercial and domesticenergy management systems available. Most of them areimplemented within what are called building managementsystems, and the majority of these systems does not include
occupants in the energy management loop. Current energymanagement systems can be broadly divided into threecategories as follows.
(1) The first category consists of energy monitoringsensors and energy consumption data displays. Theseare basic systems that read energy consumption andshow the consumption on a display. These are moresuitable for domestic environment as they depend onhuman for judgement and actions.
(2) The second category of these systems is those systemsthat extend the capability of the first group by allow-ing alert generation on excessive usage of energy oron some conditions set by the user.
(3) The third category of energy management systemsemploys advanced networking and energy monitor-ing technologies. These systems allow the users toview energy consumption at appliances level andcontrol the appliance usage from anywhere via a webinterface.
In the following, we discuss some well-known energymanagement systems that belong to the third category, asthese are the most promising technology for effective energymanagement.
(1) AIM (http://www.ict-aim.eu/home.html) is a 7thFramework Programme funded project for the designand implementation of a system that aims to mini-mize energywaste in a domestic environment. In con-trast, Digital environmental home energy manage-ment system (DEHEMS) uses wireless sensor moni-toring network to control home appliances accordingto user profiles [8].
(2) Sarnadas et al. proposed an architecture for homeenergy appliances management and control [9] thatfocuses on the use of hardware components such assensors, actuators, and communication network tomanage energy consumption in home environment.Another strand of research focuses onproviding intel-ligent interfaces to increase awareness of energy usageand hence influence the householder’s behaviour [10,11].
(3) There are a number of freely available web based toolsfor providing householders with common sense ad-vice on their energy consumption (http://www.goo-gle.com/powermeter/about/, http://www.microsoft-hohm.com/, http://www.imeasure.org.uk/); how-ever, these tools heavily rely on users’ manual in-put. There are also a number of commercial ICTbased energy management systems available (http://www.plugwise.com/idplugtype-g/home-efficiency,https://www.ewgeco.com/). These tools and systemsbroadly focus on issues of energy consumptionmonitoring, displaying, and basic statistical analysisof energy consumption data.
(4) The goal of the DEHEMS [8] is to empower house-holders in using their energy consuming appliances
International Journal of Distributed Sensor Networks 3
by increasing visibility of energy consumption dataand providing intelligent advice on their energy usebased on their profiles, and the appliances’ profiles.
(5) Energy surveillance system (ESS). “This systemis a web-based energy monitoring system thatallows the user to compare energy usage byequipment type, store location, fuel type, or timeof day. The web based energy monitoring softwareallows remote access to the crucial data for energysavings in different locations. The system is builtto monitor up to 17 subloads per module withina facility to better detect energy leaks, providebenchmark reports and bill verification, and bealerted when abnormal energy usage occurs”(http://www.egenergy.com/energy-monitoring#).
Although some of these systems can be used for energymanagement in HEIs, they do not provide an effective energymanagement solution in educational institutions’ environ-ment by disregarding timetabling and event-managementsystems.
There is also an expanding strand of research on HVACcontrol and occupant behaviour modelling for reducingenergy consumption in residential, commercial, and edu-cational buildings. However, their main focus has been onreducing energy consumption while maintaining occupantcomfort in terms of maintaining indoor temperature andair quality. The majority of this literature disregards appli-ances/machine level energy consumption optimization andinclusion, of timetabling and event management systems.
Mamidi et al. proposed an adoptive multiagent systemthat learns about occupants’ behaviour in order to optimizeHVAC operation [12]. They use machine learning techniqueto predict occupancy of the rooms up to an hour in advanceto allow HVAC to minimize energy consumption whilemaintaining occupants’ comfort.Their systemonly deals withtemperature control, and they do not give any considerationto energy consumed by PCs and laptops in labs. They also donot include humans in the energy conservation loop.
Hagras et al. proposed an integrated approach using fuzzylogic, neural networks, and genetic algorithm to learn build-ing thermal responses to external weather conditions, inter-nal occupants requirements, and building plants response[13]. Their proposed system works with an existing buildingmanagement system to reduce the energy demand, but it doesnot deal with appliance and device level energy consumptionand monitoring.
Rogers et al. demonstrate in a simulated environmentwhere a heating agent can optimize heating use to mini-mize cost and carbon emissions whilst satisfying the homeowners comfort requirements [14]. Their simulation showspromising results, but it only considers energy consumptionof maintaining home’s environmental comfort.
Wang et al. proposed an hierarchical agent basedapproach to minimize the conflict between occupants’ com-fort and energy consumption [15]. Their proposed systemtakes into account management of lighting systems andthe built environment temperature without any regard to
appliance level and device level energy monitoring andoptimization.
Mo and Mahdavi present an agent based frameworkfor building operators and individual occupants’ to nego-tiate their control activities [16]. Their simulation resultssuggest that agent-based bilateral control strategy improveoccupancy requirements while maintaining optimal energyconsumption. Their focus is on temperature and lighting inthe built environment.
Yu applied a genetic programming (GP) approach tomodel occupant behaviour by taking into account variationin occupancy timing [17]. This approach applies GP to learnoccupants’ behavioural rules and predict the presence ofan occupant in a single-person office. It is not suitable formultiple occupancy settings.
Kolokotsa et al. proposed a system that integrates anopen architecture and a fuzzy controller, which incorporatesthermal comfort, visual comfort, and indoor air quality [18].The fuzzy controller’s structure is adjusted to the users’requirements, which are monitored via a smart card system,and then attempts to optimize energy consumption whilemaintaining occupants comfort.This systemdoes not addressenergy consumption at the appliance level.
Figureiredo and Costa have implemented a predictivecontroller above a data acquisition platform for energymanagement in buildings [19]. The predictive controlleroptimises the preferences of the user, which come fromseveral distributed user interfaces while meeting constraintsof minimising energy waste.
Timetabling and event-management systems provide richinformation for energy management systems. The use of thisinformation can optimize the operation ofHVAC inHEIs andappliances level energy consumption. Using this information,the energy management system is able to switch on andoff air conditioning and other appliances at a critical timewithout affecting the comfort of the occupants. It is believedthat the proposed system incorporating this information willresult in considerable energy saving, as the Kingdom of SaudiArabia’s weather conditions require substantial use of airconditioning. Devices in standby mode waste a considerableamount of energy. Our preliminary results have shown thatthis hidden energy waste of PC/laptop in computer labs is upto 18% of total energy consumption.
3. System Architecture
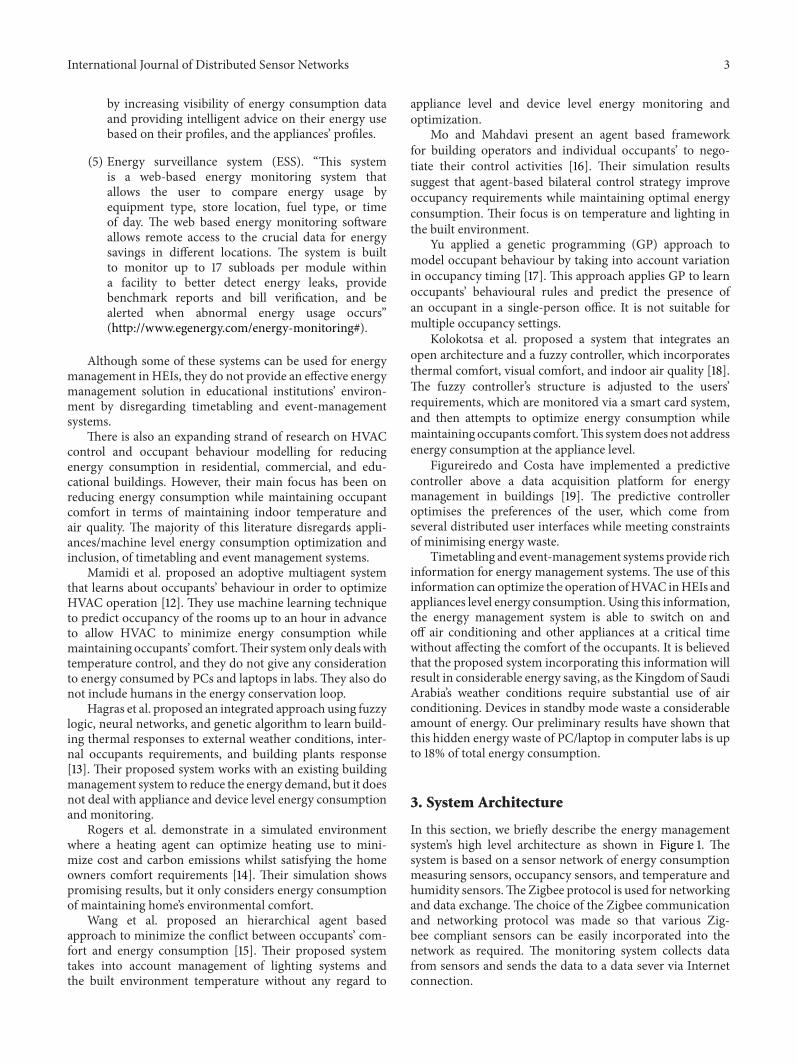
In this section, we briefly describe the energy managementsystem’s high level architecture as shown in Figure 1. Thesystem is based on a sensor network of energy consumptionmeasuring sensors, occupancy sensors, and temperature andhumidity sensors.The Zigbee protocol is used for networkingand data exchange. The choice of the Zigbee communicationand networking protocol was made so that various Zig-bee compliant sensors can be easily incorporated into thenetwork as required. The monitoring system collects datafrom sensors and sends the data to a data sever via Internetconnection.
4 International Journal of Distributed Sensor Networks
Router
Occupancy Temperature Occupancy Temperature
Internet
Data collector
Office Computer laboratory
AC AC
Data server Application server
Figure 1: System architecture.
3.1.Monitoring Subsystem. Energy consumption andphysicalenvironment parameters monitoring functionality is thebackbone of our energy management System. It providesessential energy consumption information and parameters tobe used by the reasoning subsystems.
The sensors collect energy consumption data of electricalappliances every 10 seconds and send the data to the localdata collector, which in turn forwards the data to the centralserver. Occupancy and temperature sensors are also incorpo-rated into the system in order to detect the presence of peoplein labs and offices and also room temperature and humiditylevels. The real-time collection of data makes it possibleto understand the correlation between appliances, statisticalanalysis, and intelligent advice generation. It also allowsbuilding managers to have real-time energy consumptionlevels for all the equipments and devices.
3.2. Data Storage. The sensor network enables us to monitorthe equipments and machines and to create their profiles.The formation of profiles requires initial input from buildingmanagers as well, for example, information about varioussettings of air conditioning.The incoming data from the datacollector is stored in a data server. The collected data grows
rapidly. It is resource consuming to extract meaningful infor-mation from a database containing raw energy consumptiondata. In order to reduce response time of queries, the rawdata needs to be preprocessed and analyzed to convert it intomeaningful information and store it in a collection of analyticdatabases. The analytic data can be aggregated into a highor abstract level of information about energy usage based oncategories such as type of equipment, labs, floor, and periodof time.
The long-term storage of data enables the system to usehistorical data patterns of energy consumption to detectabnormality in energy consumption while incorporatingfactors such as cold day and hot day. Occupancy data is amain source to identify energy waste due to equipment ON,standby, or idle states.
Having millions of records of energy consumption datacoming directly in real time from hundreds of appliancesposes a performance problem for data storage, retrieval andreasoning. One of the solutions to data storage and retrievalis TimeSeries DataBlade [20] TimeSeries DataBlade, whichhas an advantage over traditional relational database man-agement systems “RDBMSs” in its organization and manip-ulation of time-stamped data. The application of TimeSeries
International Journal of Distributed Sensor Networks 5
DataBlade provides a potential solution to the performancedegradation of the reasoning process which results fromreasoning over a huge volume of data. Another solution couldbe the use of Hypertable DBMS [21].
3.3. Application Server. Our proposed system makes intelli-gent use of monitored energy consumption data collected bythe monitoring subsystems. On detection of any abnormalityin energy consumption, the system tries to figure out theunderlying cause by using available data on energy consump-tion and device profiles or interactingwith buildingmanagersto get the required information. The application server hoststhe proposed intelligent energy management system. We useGlassfish (http://glassfish.java.net/) open source applicationserver, which uses Jess Expert Shell [22] as a library to supportthe reasoning capabilities of the system.
3.4. Rule Base. The intelligent energy management systemwill be populated with rules prepared with the help ofthe building manager’s knowledge and energy consumptionoptimization knowledge available in the literature. Theserules contain experiential knowledge about energy saving ineducational institutions and commercial buildings.
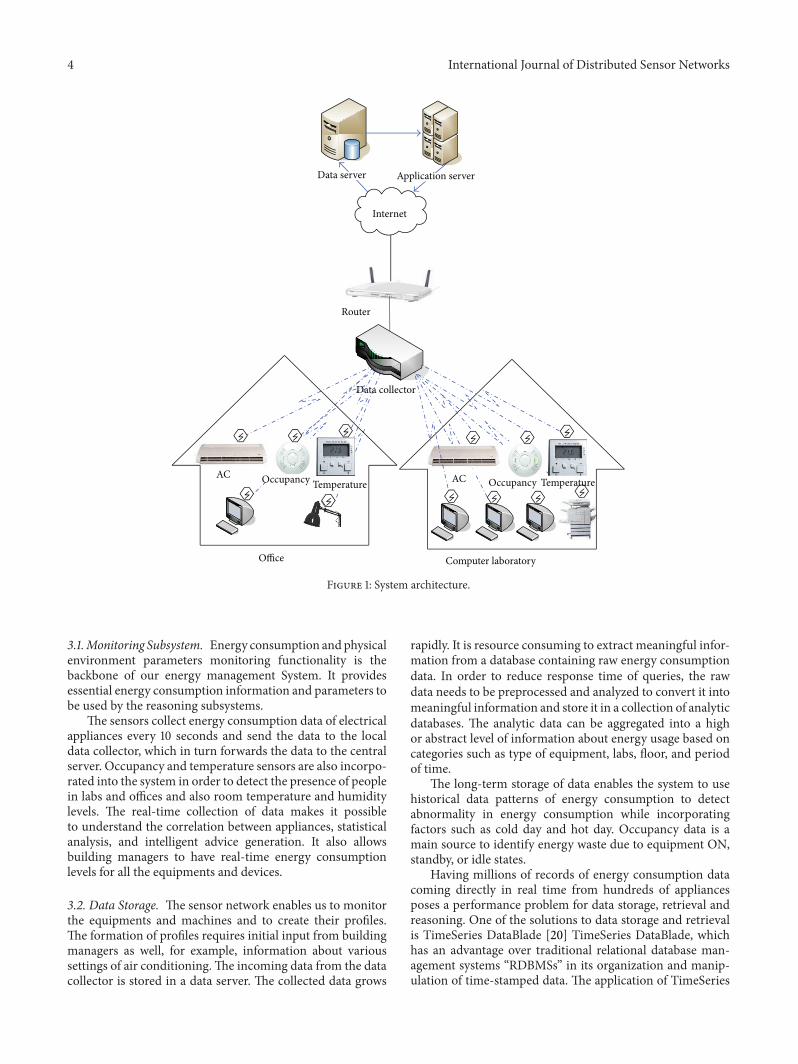
In order to be able to incorporate a new rule, a userinterface is provided for the building manager to set valuesof various parameters and the consequences of such values.This information will then be translated by the system intorules and templates and will be added to the rule base.On the addition of a new rule, the system checks if anyinconsistency occurs. If so, the system will try to reconcileamongst rules by interacting with the building managerand making suggestions. The rule base system is modelledusing a well-known heuristic classification approach [23]. Atypical rule for diagnosing abnormal consumption of energyby air conditioning of a room is shown in Figure 2. Theintelligent systemdiscovers the abnormal consumption basedon historical data and tries to establish the underlying causeof this abnormality.
3.5. Knowledge Base. The knowledge base encodes knowl-edge about pieces of advices and their semantics.This knowl-edge is used as facts by the Jess expert shell.We classify energyconsumption activities related to various electrical appliancesin home environment [24] into a hierarchy, which will beextended to incorporate new concepts and relations that existin the HEI domain. The ontological representation as a hier-archy provides the semantics to these activities and provides arich structure for reasoning rules.This classification also linksthe pieces of advice with their associated activities. Theseenergy consumption activities are distinct in a way that theyare uniquely associated with various appliances.
4. Service Oriented Architecture (SOA)
The development of the system is driven by SOA. SOAis a paradigm that allows software developers to focus onthe fulfillment of required enterprise functionalities at aconceptual level by providing standardized communication
protocols, interfaces, workflows, and service management.SOA enables developers to compose the existing servicewithout being concerned with any barriers caused by hetero-geneous operating and hardware systems.
The key property of SOA is that it allows services topublish their interfaces and related information, so theybecome searchable and can be discovered over the Internet.Those services having been discovered and selected can becomposed in a certain way to provide certain functions thatmeet specific application requirements [25]. The rationalfor using the SOA approach in design, development, anddeployment of the system is to provide standard interfaces forservices to be used by other systems.
5. Handling Large Volumes of Sensor Data
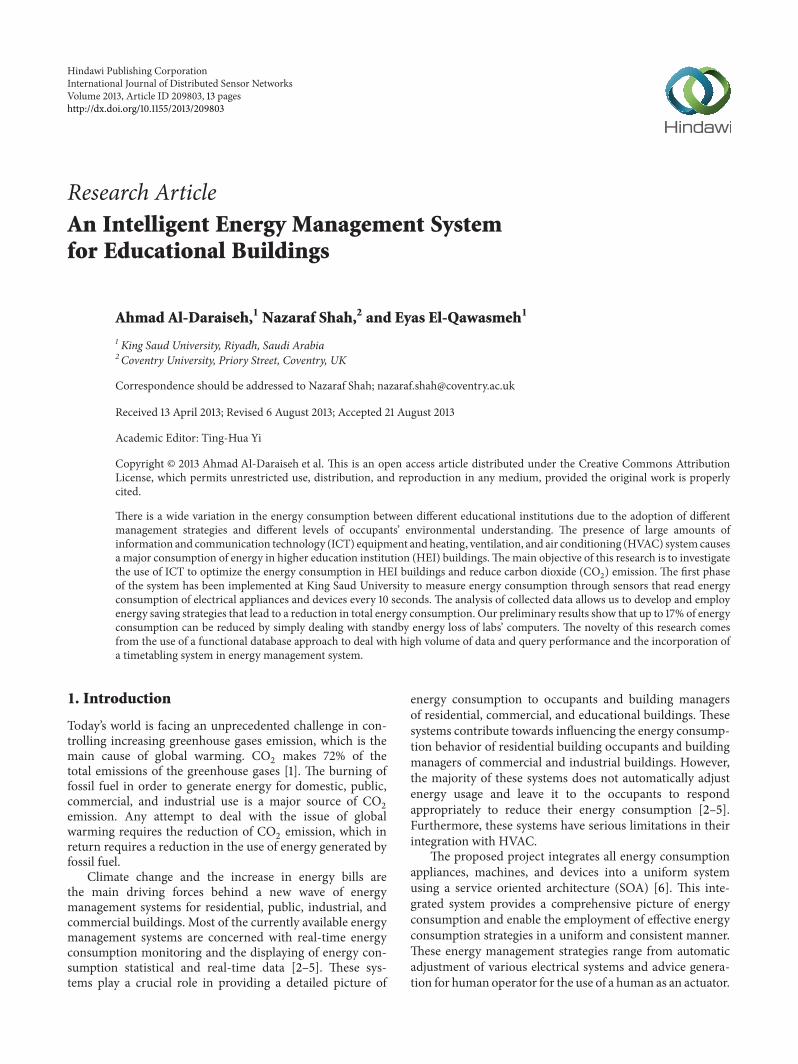
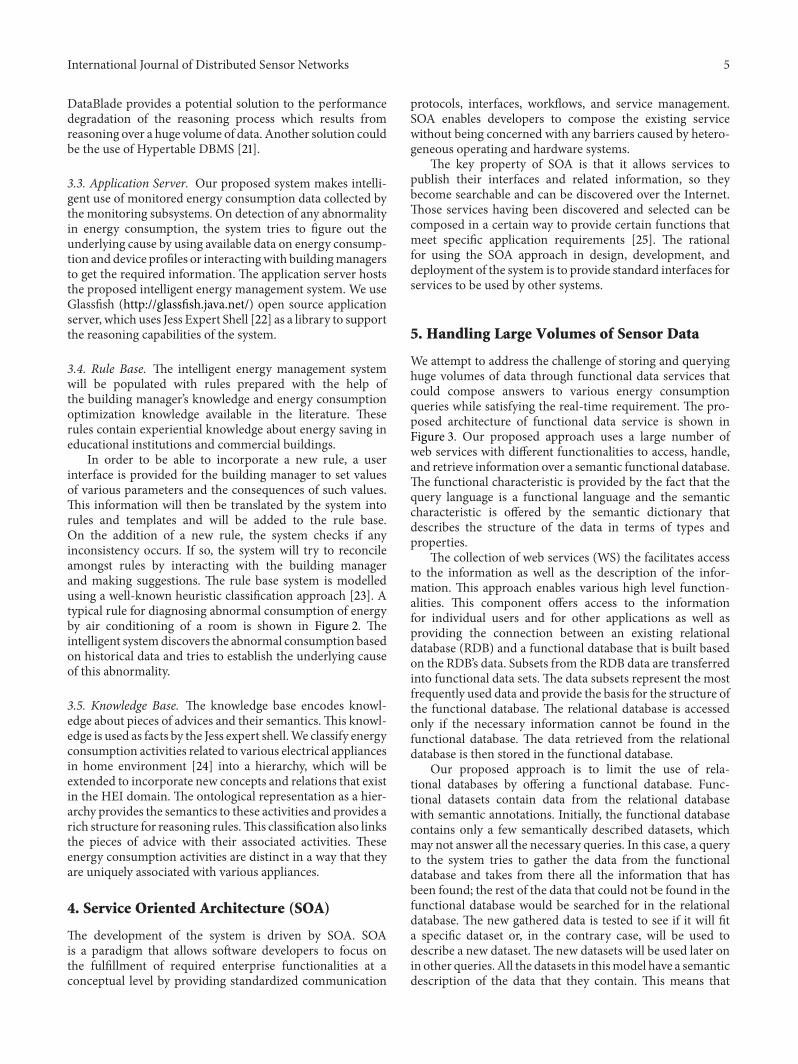
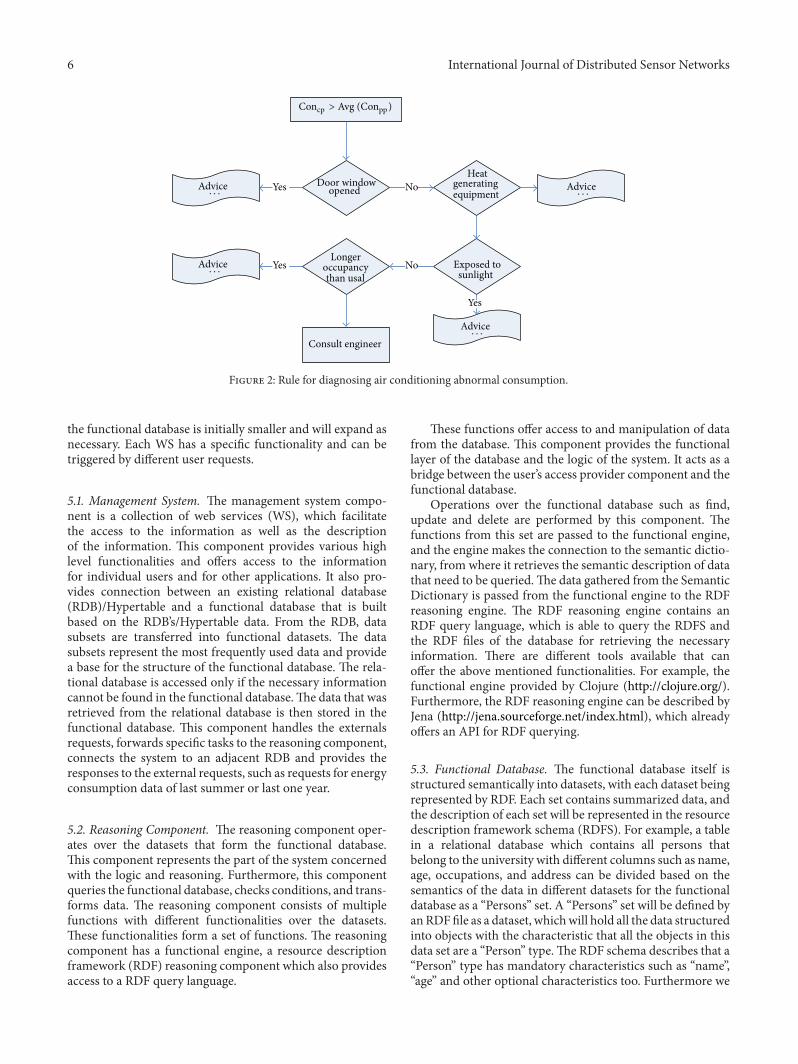
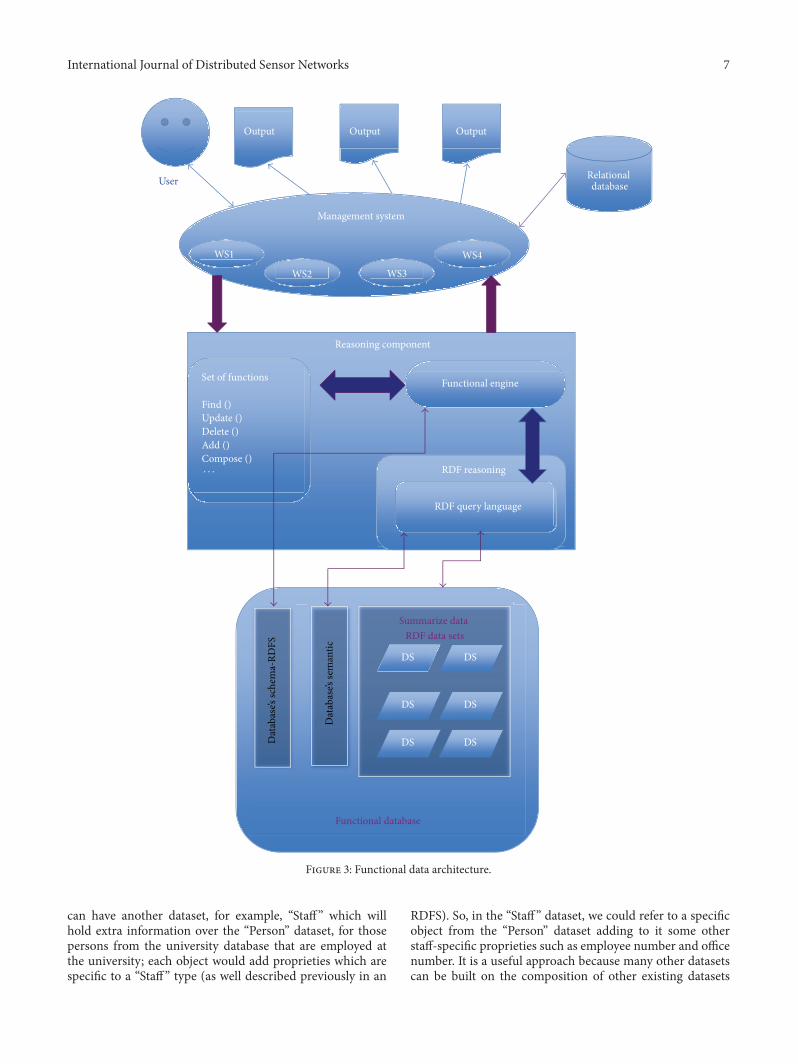
We attempt to address the challenge of storing and queryinghuge volumes of data through functional data services thatcould compose answers to various energy consumptionqueries while satisfying the real-time requirement. The pro-posed architecture of functional data service is shown inFigure 3. Our proposed approach uses a large number ofweb services with different functionalities to access, handle,and retrieve information over a semantic functional database.The functional characteristic is provided by the fact that thequery language is a functional language and the semanticcharacteristic is offered by the semantic dictionary thatdescribes the structure of the data in terms of types andproperties.
The collection of web services (WS) the facilitates accessto the information as well as the description of the infor-mation. This approach enables various high level function-alities. This component offers access to the informationfor individual users and for other applications as well asproviding the connection between an existing relationaldatabase (RDB) and a functional database that is built basedon the RDB’s data. Subsets from the RDB data are transferredinto functional data sets. The data subsets represent the mostfrequently used data and provide the basis for the structure ofthe functional database. The relational database is accessedonly if the necessary information cannot be found in thefunctional database. The data retrieved from the relationaldatabase is then stored in the functional database.
Our proposed approach is to limit the use of rela-tional databases by offering a functional database. Func-tional datasets contain data from the relational databasewith semantic annotations. Initially, the functional databasecontains only a few semantically described datasets, whichmay not answer all the necessary queries. In this case, a queryto the system tries to gather the data from the functionaldatabase and takes from there all the information that hasbeen found; the rest of the data that could not be found in thefunctional database would be searched for in the relationaldatabase. The new gathered data is tested to see if it will fita specific dataset or, in the contrary case, will be used todescribe a new dataset.The new datasets will be used later onin other queries. All the datasets in thismodel have a semanticdescription of the data that they contain. This means that
6 International Journal of Distributed Sensor Networks
Door window opened
Heat generating equipment
Exposed to sunlight
Longer occupancy than usal
Advice NoYes
No
Consult engineer
Yes
Yes
· · ·
Advice· · ·
Advice· · ·
Advice· · ·
Concp > Avg (Conpp )
Figure 2: Rule for diagnosing air conditioning abnormal consumption.
the functional database is initially smaller and will expand asnecessary. Each WS has a specific functionality and can betriggered by different user requests.
5.1. Management System. The management system compo-nent is a collection of web services (WS), which facilitatethe access to the information as well as the descriptionof the information. This component provides various highlevel functionalities and offers access to the informationfor individual users and for other applications. It also pro-vides connection between an existing relational database(RDB)/Hypertable and a functional database that is builtbased on the RDB’s/Hypertable data. From the RDB, datasubsets are transferred into functional datasets. The datasubsets represent the most frequently used data and providea base for the structure of the functional database. The rela-tional database is accessed only if the necessary informationcannot be found in the functional database.The data that wasretrieved from the relational database is then stored in thefunctional database. This component handles the externalsrequests, forwards specific tasks to the reasoning component,connects the system to an adjacent RDB and provides theresponses to the external requests, such as requests for energyconsumption data of last summer or last one year.
5.2. Reasoning Component. The reasoning component oper-ates over the datasets that form the functional database.This component represents the part of the system concernedwith the logic and reasoning. Furthermore, this componentqueries the functional database, checks conditions, and trans-forms data. The reasoning component consists of multiplefunctions with different functionalities over the datasets.These functionalities form a set of functions. The reasoningcomponent has a functional engine, a resource descriptionframework (RDF) reasoning component which also providesaccess to a RDF query language.
These functions offer access to and manipulation of datafrom the database. This component provides the functionallayer of the database and the logic of the system. It acts as abridge between the user’s access provider component and thefunctional database.
Operations over the functional database such as find,update and delete are performed by this component. Thefunctions from this set are passed to the functional engine,and the engine makes the connection to the semantic dictio-nary, from where it retrieves the semantic description of datathat need to be queried.The data gathered from the SemanticDictionary is passed from the functional engine to the RDFreasoning engine. The RDF reasoning engine contains anRDF query language, which is able to query the RDFS andthe RDF files of the database for retrieving the necessaryinformation. There are different tools available that canoffer the above mentioned functionalities. For example, thefunctional engine provided by Clojure (http://clojure.org/).Furthermore, the RDF reasoning engine can be described byJena (http://jena.sourceforge.net/index.html), which alreadyoffers an API for RDF querying.
5.3. Functional Database. The functional database itself isstructured semantically into datasets, with each dataset beingrepresented by RDF. Each set contains summarized data, andthe description of each set will be represented in the resourcedescription framework schema (RDFS). For example, a tablein a relational database which contains all persons thatbelong to the university with different columns such as name,age, occupations, and address can be divided based on thesemantics of the data in different datasets for the functionaldatabase as a “Persons” set. A “Persons” set will be defined byanRDFfile as a dataset, whichwill hold all the data structuredinto objects with the characteristic that all the objects in thisdata set are a “Person” type.The RDF schema describes that a“Person” type has mandatory characteristics such as “name”,“age” and other optional characteristics too. Furthermore we
International Journal of Distributed Sensor Networks 7
Dat
abas
e’s se
man
tic
Dat
abas
e’s sc
hem
a-RD
FS
Summarize data
Functional database
RDF data sets
DSDS
DSDS
DSDS
Management system
WS1
WS2 WS3
WS4
Relational database
Output OutputOutput
User
Reasoning component
Set of functions
Find ()Update ()Delete ()Add ()Compose ()
Functional engine
RDF reasoning
RDF query language
· · ·
Figure 3: Functional data architecture.
can have another dataset, for example, “Staff” which willhold extra information over the “Person” dataset, for thosepersons from the university database that are employed atthe university; each object would add proprieties which arespecific to a “Staff” type (as well described previously in an
RDFS). So, in the “Staff” dataset, we could refer to a specificobject from the “Person” dataset adding to it some otherstaff-specific proprieties such as employee number and officenumber. It is a useful approach because many other datasetscan be built on the composition of other existing datasets
8 International Journal of Distributed Sensor Networks
by adding extra information to it based on the semanticdescription of that dataset.
The RDFS describes the datasets and their content, fromthe point of view of what data can be stored inside and thedefinition of it; and the Semantic Dictionary of the databaseholds the semantic description of different proprieties andhow they link to each other. As mentioned in previousexample, the characteristic “Name” found in a dataset holdingthe “Person” data type can be semantically described in thedictionary of the database as a composer of “First Name”,“Middle Name” and “Last Name” and then even if otherdatasets have the “Name” characteristic in a different format,it will be known how to semantically search for the neededdata.
The advantage of having functional database encompass-ing semantic data sets is to provide a smaller search time forreasoning. Multiple functions of the reasoning componentcan be called by a single WS. The reasoning componenthandles different functions over the datasets. Each functionretrieves the necessary data for reasoning from one or moredatasets in order to send back to the web services a properresponse. Each function looks for the needed dataset/s in thefunctional database and composes the information receivedfrom them, for example, the composition of the monthlyenergy consumption data.
6. Implementation
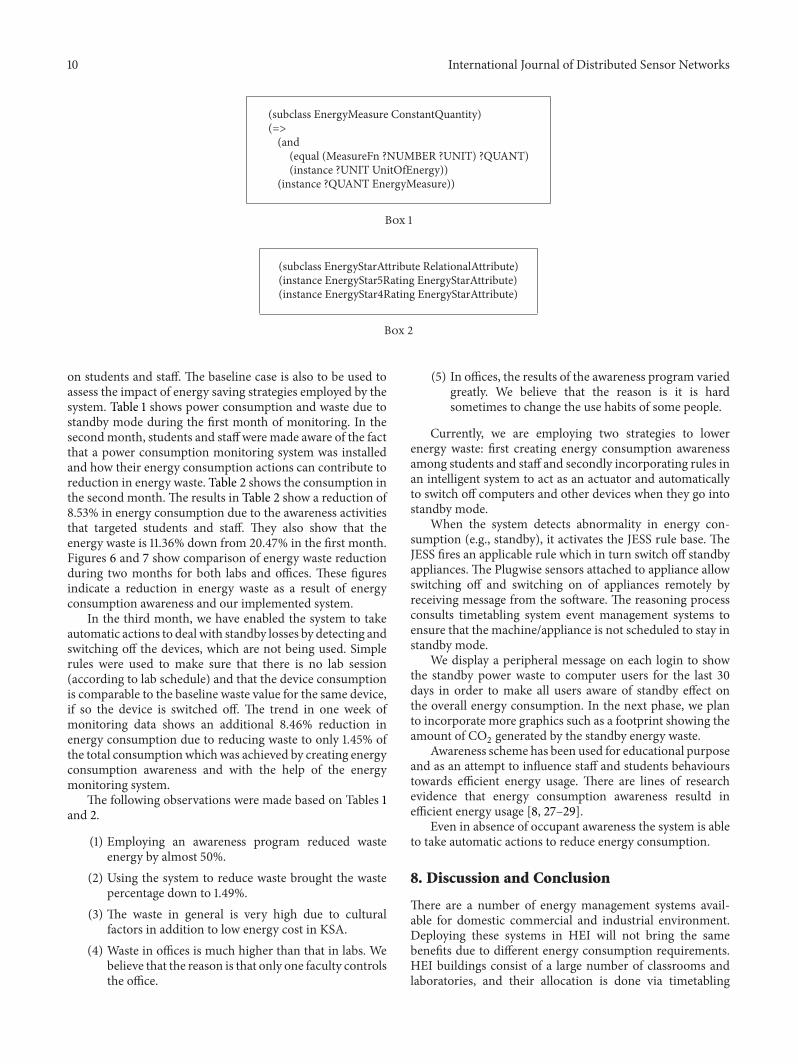
The system adopts web technologies to provide the inter-faces for the users to view energy consumption of variousappliances/devices and also acts as an actuator in orderto take optimal energy consumption actions. We usedProtege (http://protege.stanford.edu/) as a tool to createdevices/appliances ontology. Currently, we have around 80concepts relating to electricity appliances/devices definedand around 50 tips regarding energy saving having beenencoded. The inference engine, which supports reason-ing over knowledge base is Jess expert shell [22]. JessTab(http://www.ida.liu.se/∼her/JessTab/) was used to integrateJess and ontology, so the relations between the conceptsdefined in ontology can be exploited and reasoned.
6.1. Monitoring System. The energy consumptionmonitoringsystem has been installed in 10 computer laboratories and 10offices to collect energy consumption data. A total number of500 sensors were installed.
The sensors used to monitor and collect the energy usageare Plugwise (http://www.plugwise.com/idplugtype-g/) sen-sors and an electricity clamp meter (http://www.currentcost.com/products.html). The Plugwise sensor monitors indi-vidual electricity appliance or a collection of appliances,which share the same plug. The clamp meter is attachedto the wire of main electricity switch that gathers the totalelectricity consumption. Both of them make use of radiotransmissions to transfer the data to an Internet gateway,which process and send data to a centralized server for otherapplications to consume. In the following section we describe
the characteristics and component of Plugwise network forenergy consumption monitoring.
6.1.1. PlugwiseNetwork. Pluwise is a commercial product thatenables measurement of energy consumption of electricalappliances and devices. The energy consumption measuringsensors are calledCircles. Plugwise devices that are connectedto the ZigBee network are called modules; examples areCircles, Circle+, and Stick. Plugwise is based on the Zigbee2.4GHZ wireless mesh network. According to Plugwiseconfiguration, eachmodule can communicate to at least threeother modules, and the distance between two modules islimited to 5–10 meters. A configuration file allows the settingof time intervals for energy consumption reading. All Circleswithin the network are synchronized with a built-in clockof Circle+, which inturn gets synchronized with computer.Plugwise is consists of following components.
Circle. The Circle is a plug, which is placed between thewall socket and the plug of an appliance. It measures theenergy consumption of the connected appliance and storesthe data in its own memory. Energy consumption data istransmitted to the Plugwise software, installed on PC viaa wireless Zigbee mesh network. In fact the circle is anenergy consumption measuring sensor with an additionalfunctionality of switching off and switching on the applianceattached to it. The Circle gets power from the socket it isplugged into, and the power dissipation of a Circle (node)ranges from 0.55 to 1.1Watt.
Circle+. It is a Zigbee coordinator. The Circle+ containsadditional characteristics within the network, apart from thebasic functions of the Circle. It functions as a coordinator ina Plugwise network. It keeps track of the Circles, which arepart of the network, and communicates this information tothe Stick attached to a computer/data collector. The Circle+includes a real-time clock and a battery, which synchronizesthe time periodically with the other Circles.
Stick. It is also called a main controller. The Stick commu-nicates directly with the Zigbee coordinator also known asthe Circle+. The Circle+ communicates with other nodes(Circles) in the mesh network topology.
Source. The Source is the Plugwise software program, whichis installed on the PC. The program gives insight into theenergy consumption of the connected appliances by meansof clear overviews and graphs. The Source also comes with aweb server and its own scripting language.
Stretch Lite Pro. Stretch Lite Pro is used to manage multiplePlugwise networks. A single Plugwise network contains atmaximum 50 Circles and one Circle+. We have installedmultiple Plugwise networks to monitor energy consumptionin various labs and offices. Communication with a Plugwisenetwork is done through the Plugwise USB stick, called“Stick”. Each Stick is plugged into a Stretch Lite Pro, whichis connected by a UTP cable to the physical network, and
International Journal of Distributed Sensor Networks 9
Figure 4: Partial view of the ontology hierarchy.
communicates with the controlling PC via the existing LANcommunication [26].
6.2. Ontology Implementation. The proposed ontology wasfirst implemented using Protege ontology development envi-ronment; however, later we have adapted it to a standardupper ontology knowledge Interchange Format (SUO-KIF)(http://suo.ieee.org/SUO/KIF/suo-kif.html) in order to ben-efit from the logic rules stored in the original distribution ofSUO (http://suo.ieee.org/).
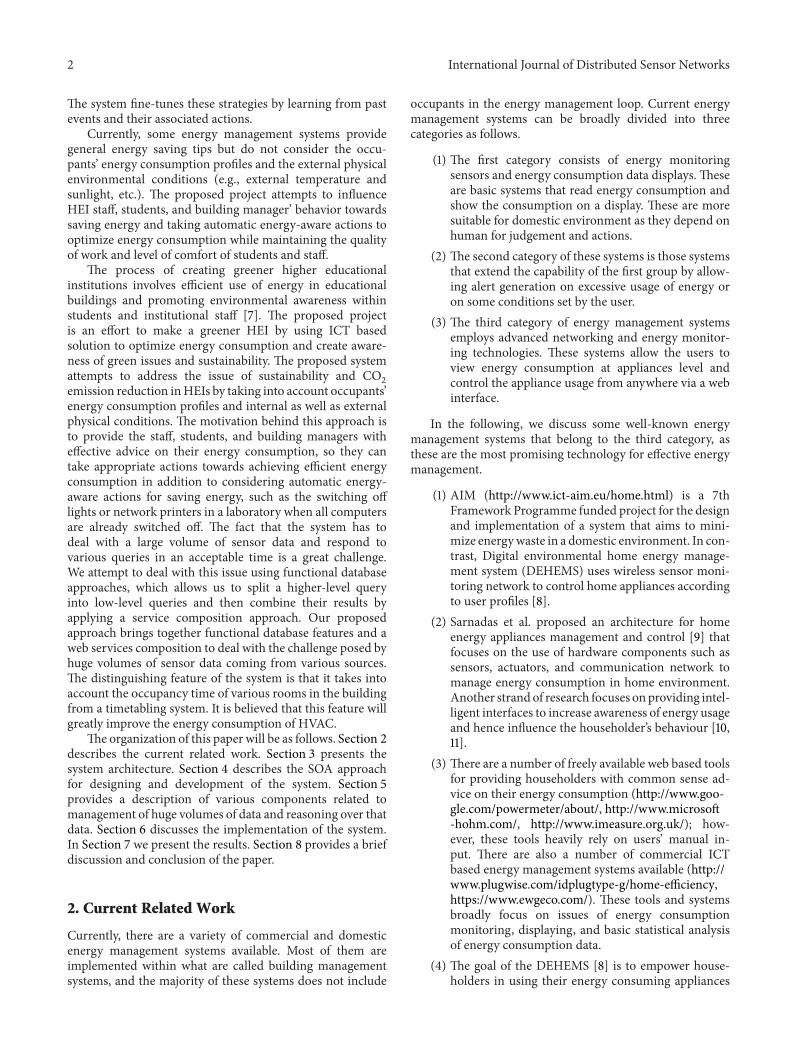
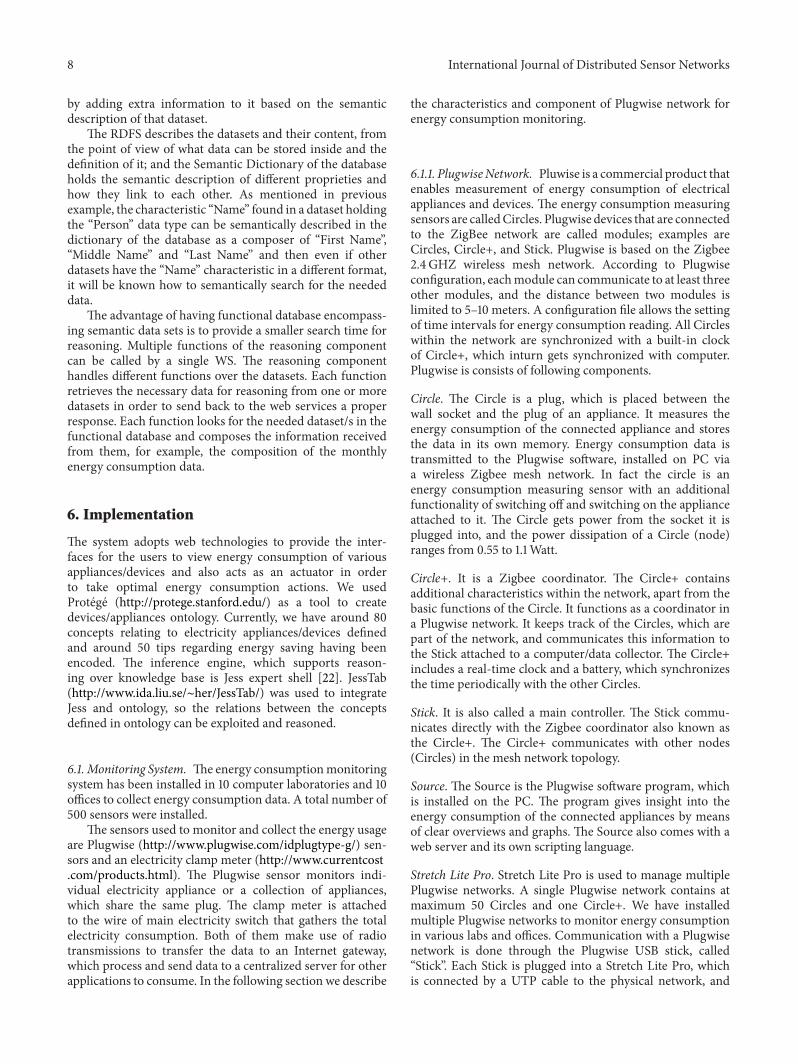
The concepts from energy consuming equipment andappliances are organized into a hierarchy based on theirfunctionality rather than their energy consumption. A partialgraph of the higher level of the hierarchy is shown in Figure 4.
In developing the energy devices/appliances ontology forHEI domain, we focused on encoding attributes related tothe energy efficiency of the devices/appliances to provide atool for rich knowledge representation for reasoning tools.The aim is to allow systems not only to reason about theenergy efficiency of an appliance in short term but also toprovide an overview on long-term operational aspects of thedevice’s/appliance’s energy consumption.
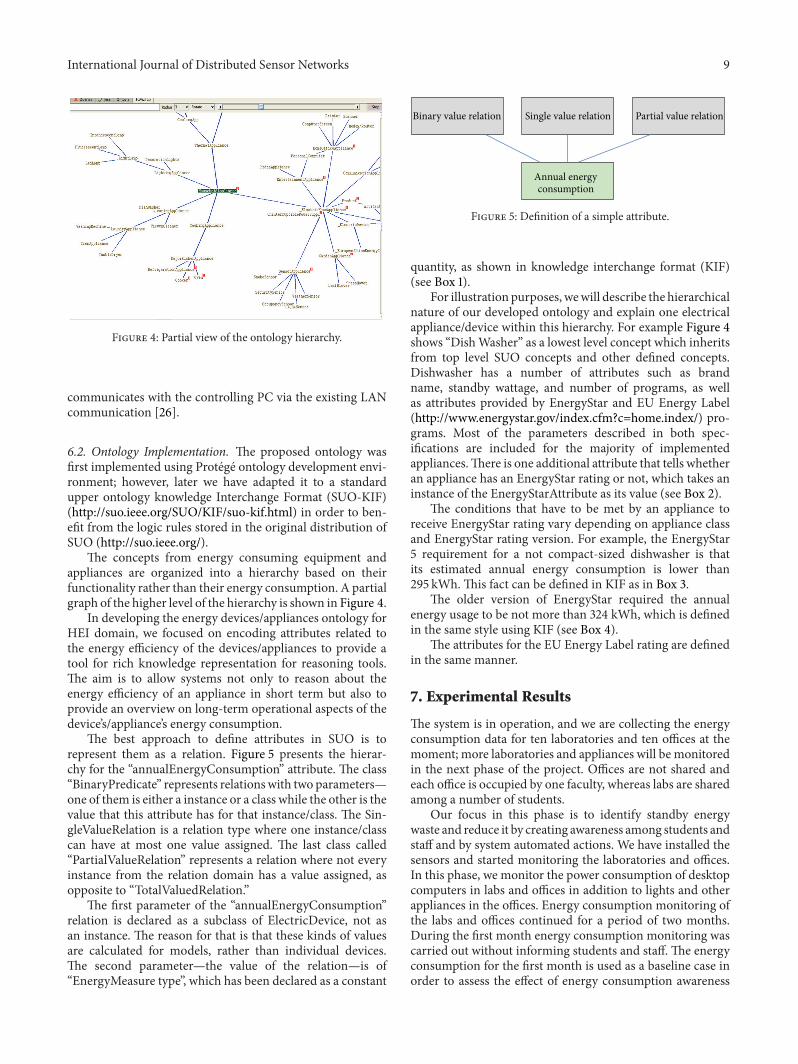
The best approach to define attributes in SUO is torepresent them as a relation. Figure 5 presents the hierar-chy for the “annualEnergyConsumption” attribute. The class“BinaryPredicate” represents relationswith two parameters—one of them is either a instance or a class while the other is thevalue that this attribute has for that instance/class. The Sin-gleValueRelation is a relation type where one instance/classcan have at most one value assigned. The last class called“PartialValueRelation” represents a relation where not everyinstance from the relation domain has a value assigned, asopposite to “TotalValuedRelation.”
The first parameter of the “annualEnergyConsumption”relation is declared as a subclass of ElectricDevice, not asan instance. The reason for that is that these kinds of valuesare calculated for models, rather than individual devices.The second parameter—the value of the relation—is of“EnergyMeasure type”, which has been declared as a constant
Partial value relation Single value relation Binary value relation
Annual energyconsumption
Figure 5: Definition of a simple attribute.
quantity, as shown in knowledge interchange format (KIF)(see Box 1).
For illustration purposes, wewill describe the hierarchicalnature of our developed ontology and explain one electricalappliance/device within this hierarchy. For example Figure 4shows “DishWasher” as a lowest level concept which inheritsfrom top level SUO concepts and other defined concepts.Dishwasher has a number of attributes such as brandname, standby wattage, and number of programs, as wellas attributes provided by EnergyStar and EU Energy Label(http://www.energystar.gov/index.cfm?c=home.index/) pro-grams. Most of the parameters described in both spec-ifications are included for the majority of implementedappliances.There is one additional attribute that tells whetheran appliance has an EnergyStar rating or not, which takes aninstance of the EnergyStarAttribute as its value (see Box 2).
The conditions that have to be met by an appliance toreceive EnergyStar rating vary depending on appliance classand EnergyStar rating version. For example, the EnergyStar5 requirement for a not compact-sized dishwasher is thatits estimated annual energy consumption is lower than295 kWh. This fact can be defined in KIF as in Box 3.
The older version of EnergyStar required the annualenergy usage to be not more than 324 kWh, which is definedin the same style using KIF (see Box 4).
The attributes for the EU Energy Label rating are definedin the same manner.
7. Experimental Results
The system is in operation, and we are collecting the energyconsumption data for ten laboratories and ten offices at themoment; more laboratories and appliances will be monitoredin the next phase of the project. Offices are not shared andeach office is occupied by one faculty, whereas labs are sharedamong a number of students.
Our focus in this phase is to identify standby energywaste and reduce it by creating awareness among students andstaff and by system automated actions. We have installed thesensors and started monitoring the laboratories and offices.In this phase, we monitor the power consumption of desktopcomputers in labs and offices in addition to lights and otherappliances in the offices. Energy consumption monitoring ofthe labs and offices continued for a period of two months.During the first month energy consumption monitoring wascarried out without informing students and staff. The energyconsumption for the first month is used as a baseline case inorder to assess the effect of energy consumption awareness
10 International Journal of Distributed Sensor Networks
(subclass EnergyMeasure ConstantQuantity)(=>(and(equal (MeasureFn ?NUMBER ?UNIT) ?QUANT)(instance ?UNIT UnitOfEnergy))
(instance ?QUANT EnergyMeasure))
Box 1
(subclass EnergyStarAttribute RelationalAttribute)(instance EnergyStar5Rating EnergyStarAttribute)(instance EnergyStar4Rating EnergyStarAttribute)
Box 2
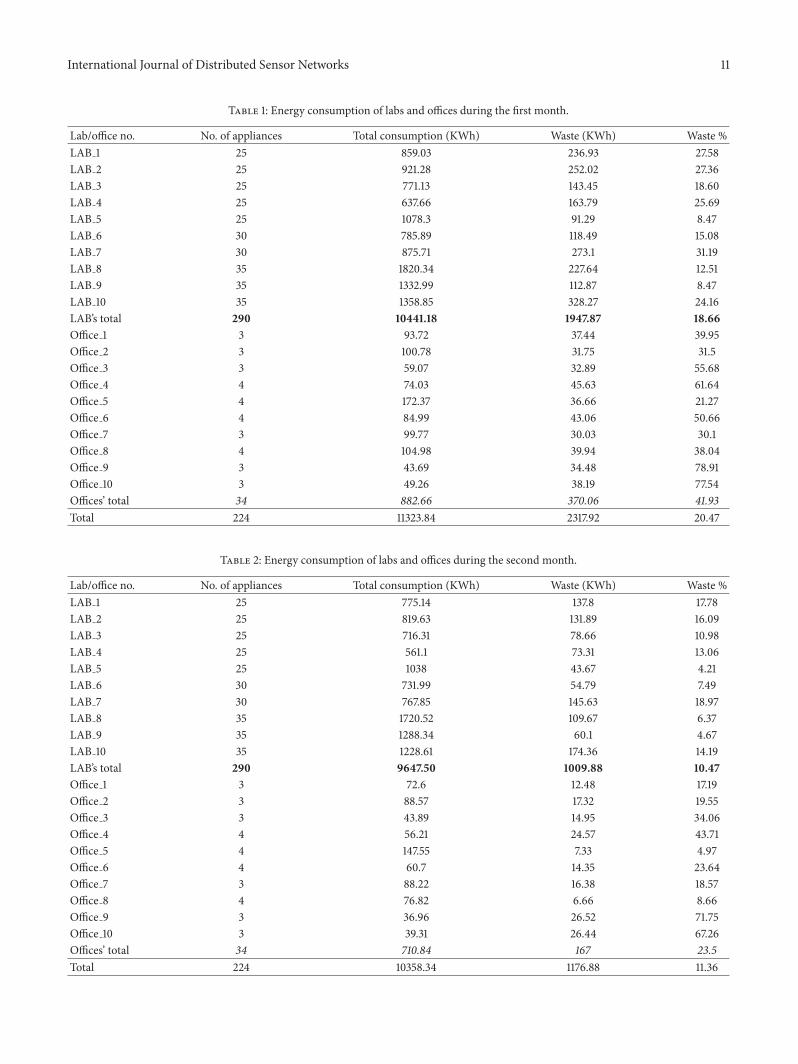
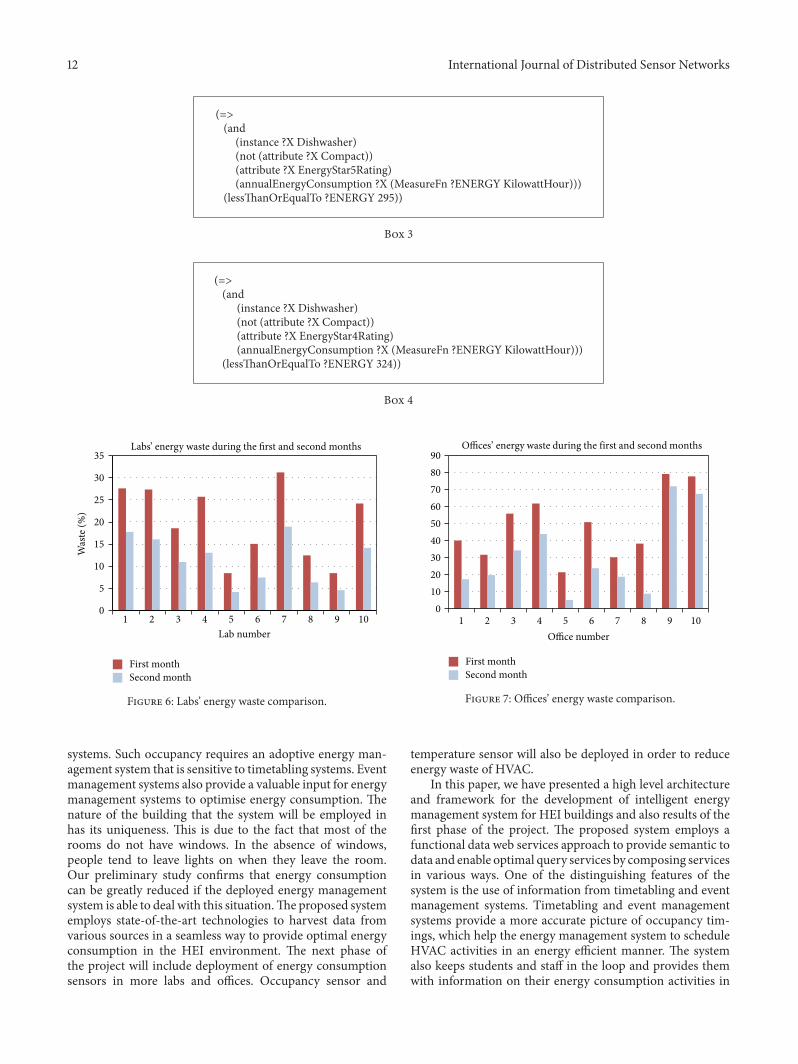
on students and staff. The baseline case is also to be used toassess the impact of energy saving strategies employed by thesystem. Table 1 shows power consumption and waste due tostandby mode during the first month of monitoring. In thesecondmonth, students and staff were made aware of the factthat a power consumption monitoring system was installedand how their energy consumption actions can contribute toreduction in energy waste. Table 2 shows the consumption inthe second month. The results in Table 2 show a reduction of8.53% in energy consumption due to the awareness activitiesthat targeted students and staff. They also show that theenergy waste is 11.36% down from 20.47% in the first month.Figures 6 and 7 show comparison of energy waste reductionduring two months for both labs and offices. These figuresindicate a reduction in energy waste as a result of energyconsumption awareness and our implemented system.
In the third month, we have enabled the system to takeautomatic actions to deal with standby losses by detecting andswitching off the devices, which are not being used. Simplerules were used to make sure that there is no lab session(according to lab schedule) and that the device consumptionis comparable to the baseline waste value for the same device,if so the device is switched off. The trend in one week ofmonitoring data shows an additional 8.46% reduction inenergy consumption due to reducing waste to only 1.45% ofthe total consumptionwhich was achieved by creating energyconsumption awareness and with the help of the energymonitoring system.
The following observations were made based on Tables 1and 2.
(1) Employing an awareness program reduced wasteenergy by almost 50%.
(2) Using the system to reduce waste brought the wastepercentage down to 1.49%.
(3) The waste in general is very high due to culturalfactors in addition to low energy cost in KSA.
(4) Waste in offices is much higher than that in labs. Webelieve that the reason is that only one faculty controlsthe office.
(5) In offices, the results of the awareness program variedgreatly. We believe that the reason is it is hardsometimes to change the use habits of some people.
Currently, we are employing two strategies to lowerenergy waste: first creating energy consumption awarenessamong students and staff and secondly incorporating rules inan intelligent system to act as an actuator and automaticallyto switch off computers and other devices when they go intostandby mode.
When the system detects abnormality in energy con-sumption (e.g., standby), it activates the JESS rule base. TheJESS fires an applicable rule which in turn switch off standbyappliances. The Plugwise sensors attached to appliance allowswitching off and switching on of appliances remotely byreceiving message from the software. The reasoning processconsults timetabling system event management systems toensure that the machine/appliance is not scheduled to stay instandby mode.
We display a peripheral message on each login to showthe standby power waste to computer users for the last 30days in order to make all users aware of standby effect onthe overall energy consumption. In the next phase, we planto incorporate more graphics such as a footprint showing theamount of CO
2generated by the standby energy waste.
Awareness scheme has been used for educational purposeand as an attempt to influence staff and students behaviourstowards efficient energy usage. There are lines of researchevidence that energy consumption awareness resultd inefficient energy usage [8, 27–29].
Even in absence of occupant awareness the system is ableto take automatic actions to reduce energy consumption.
8. Discussion and Conclusion
There are a number of energy management systems avail-able for domestic commercial and industrial environment.Deploying these systems in HEI will not bring the samebenefits due to different energy consumption requirements.HEI buildings consist of a large number of classrooms andlaboratories, and their allocation is done via timetabling
International Journal of Distributed Sensor Networks 11
Table 1: Energy consumption of labs and offices during the first month.
Lab/office no. No. of appliances Total consumption (KWh) Waste (KWh) Waste %LAB 1 25 859.03 236.93 27.58LAB 2 25 921.28 252.02 27.36LAB 3 25 771.13 143.45 18.60LAB 4 25 637.66 163.79 25.69LAB 5 25 1078.3 91.29 8.47LAB 6 30 785.89 118.49 15.08LAB 7 30 875.71 273.1 31.19LAB 8 35 1820.34 227.64 12.51LAB 9 35 1332.99 112.87 8.47LAB 10 35 1358.85 328.27 24.16LAB’s total 290 10441.18 1947.87 18.66Office 1 3 93.72 37.44 39.95Office 2 3 100.78 31.75 31.5Office 3 3 59.07 32.89 55.68Office 4 4 74.03 45.63 61.64Office 5 4 172.37 36.66 21.27Office 6 4 84.99 43.06 50.66Office 7 3 99.77 30.03 30.1Office 8 4 104.98 39.94 38.04Office 9 3 43.69 34.48 78.91Office 10 3 49.26 38.19 77.54Offices’ total 34 882.66 370.06 41.93Total 224 11323.84 2317.92 20.47
Table 2: Energy consumption of labs and offices during the second month.
Lab/office no. No. of appliances Total consumption (KWh) Waste (KWh) Waste %LAB 1 25 775.14 137.8 17.78LAB 2 25 819.63 131.89 16.09LAB 3 25 716.31 78.66 10.98LAB 4 25 561.1 73.31 13.06LAB 5 25 1038 43.67 4.21LAB 6 30 731.99 54.79 7.49LAB 7 30 767.85 145.63 18.97LAB 8 35 1720.52 109.67 6.37LAB 9 35 1288.34 60.1 4.67LAB 10 35 1228.61 174.36 14.19LAB’s total 290 9647.50 1009.88 10.47Office 1 3 72.6 12.48 17.19Office 2 3 88.57 17.32 19.55Office 3 3 43.89 14.95 34.06Office 4 4 56.21 24.57 43.71Office 5 4 147.55 7.33 4.97Office 6 4 60.7 14.35 23.64Office 7 3 88.22 16.38 18.57Office 8 4 76.82 6.66 8.66Office 9 3 36.96 26.52 71.75Office 10 3 39.31 26.44 67.26Offices’ total 34 710.84 167 23.5Total 224 10358.34 1176.88 11.36
12 International Journal of Distributed Sensor Networks
(=>(and
(instance ?X Dishwasher)(not (attribute ?X Compact))(attribute ?X EnergyStar5Rating)(annualEnergyConsumption ?X (MeasureFn ?ENERGY KilowattHour)))
(lessThanOrEqualTo ?ENERGY 295))
Box 3
(=>(and
(instance ?X Dishwasher)(not (attribute ?X Compact))(attribute ?X EnergyStar4Rating)(annualEnergyConsumption ?X (MeasureFn ?ENERGY KilowattHour)))
(lessThanOrEqualTo ?ENERGY 324))
Box 4
0
5
10
15
20
25
30
35
1 2 3 4 5 6 7 8 9 10
Was
te (%
)
Lab number
Labs’ energy waste during the first and second months
First monthSecond month
Figure 6: Labs’ energy waste comparison.
systems. Such occupancy requires an adoptive energy man-agement system that is sensitive to timetabling systems. Eventmanagement systems also provide a valuable input for energymanagement systems to optimise energy consumption. Thenature of the building that the system will be employed inhas its uniqueness. This is due to the fact that most of therooms do not have windows. In the absence of windows,people tend to leave lights on when they leave the room.Our preliminary study confirms that energy consumptioncan be greatly reduced if the deployed energy managementsystem is able to deal with this situation.The proposed systememploys state-of-the-art technologies to harvest data fromvarious sources in a seamless way to provide optimal energyconsumption in the HEI environment. The next phase ofthe project will include deployment of energy consumptionsensors in more labs and offices. Occupancy sensor and
0102030405060708090
Offices’ energy waste during the first and second months
1 2 3 4 5 6 7 8 9 10Office number
First monthSecond month
Figure 7: Offices’ energy waste comparison.
temperature sensor will also be deployed in order to reduceenergy waste of HVAC.
In this paper, we have presented a high level architectureand framework for the development of intelligent energymanagement system for HEI buildings and also results of thefirst phase of the project. The proposed system employs afunctional data web services approach to provide semantic todata and enable optimal query services by composing servicesin various ways. One of the distinguishing features of thesystem is the use of information from timetabling and eventmanagement systems. Timetabling and event managementsystems provide a more accurate picture of occupancy tim-ings, which help the energy management system to scheduleHVAC activities in an energy efficient manner. The systemalso keeps students and staff in the loop and provides themwith information on their energy consumption activities in

International Journal of Distributed Sensor Networks 13
an attempt to influence their future energy consumptionbehaviour. Our preliminary study onto energy consumptionreveals that the vast majority of equipment stays in thestandby mode unnecessarily. In the first phase of the project,the system identifies the hidden energy waste in laboratoriesand offices and takes appropriatemeasures to optimise energyconsumption.
Using both an awareness program and the developedsystem, we were able to reduce energy waste down to 14.9%of the total energy used.
Conflict of Interests
All authors are academic, and they donot have financial inter-est or any other interest in commercial products mentionedin this paper.The commercial products are purely mentionedas a potential candidate for a solution, but the project uses allopen sources technologies. The authors do not recommendthe use of any commercial products in this paper.
Acknowledgment
The authors would like to thank the National Plan forSciences and Technology (NPST) at the King SaudUniversityfor their support for this Project (no. 11-ENE-1605-02).
References
[1] IEO International Energy Outlook, 2009, http://www.eia.doe.gov/oiaf/ieo/pdf/0484(2009).pdf.
[2] Google PowerMeter, http://www.google.com/powermeter/about/partners.html.
[3] Hohm, Microsoft, http://www.microsoft-hohm.com/.[4] i-Measure, Oxford University, http://www.imeasure.org.uk/.[5] ewgeco, https://www.ewgeco.com/.[6] Service-OrientedArchitecture: Concepts, Technology, andDesign,
Prentice Hall, Upper Saddle River, NJ, USA, 2005.[7] M. Dahle and E. Neumayer, “Overcoming barriers to campus
greening: a survey among higher educational institutions inLondon, UK,” International Journal of Sustainability in HigherEducation, vol. 2, no. 2, 2001.
[8] 2013, http://www.dehems.eu/.[9] R. Sarnadas, P. Fonseca, and J. Paulo Teixeira, “Intelligent
architecture for home appliances and energy managementcontrol,” in Proceedings of the Conference on Design of IntegratedCircuits and Systems, Lisbon, Portugal, 2005.
[10] J. Karlgren, L. E. Fahlen, A. Wallberg et al., Socially IntelligentInterfaces for Increased Energy Awareness in the Home, Internetof Things, Springer, Berlin, Germany, 2008.
[11] G.Wood andM. Newborough, “Energy-use information trans-fer for intelligent homes: enabling energy conservation withcentral and local displays,” Energy and Buildings, vol. 39, no. 4,pp. 495–503, 2007.
[12] S. Mamidi, Y.-H. Chang, and R. Mahesswaran, “Improvingbuilding energy efficiency with network of sensing learningand prediction agents,” in Proceeding of the 11th InternationalConference on Autonomous Agents and Multiagent Systems,2012.
[13] H. Hagras, I. Packham, Y. Vanderstockt, N.McNulty, A. Vadher,and F. Doctor, “An intelligent approach for energy managementin commercial building,” in Proceedings of the Sytems Man andCybernetics, 2008.
[14] A. Rogers, S. Maleki, S. Ghosh, and N. Jennings, “An intelligentagent for home heating management,” in Proceedings of the 11thInternational Conference on Autonomous Agents andMultiagentSystems, 2012.
[15] Z. Wang, R. Yang, and L. Wang, “Multi-agent control systemwith intelligent optimization for smart and energy-efficientbuildings,” in Proceedings of the 36th Annual Conference of theIEEE Industrial Electronics Society (IECON ’10), pp. 1144–1149,November 2010.
[16] Z. Mo and A. Mahdavi, “An agent-based simulation-assistedapproach to bi-lateral building systems control,” in Proceedingsof the 8th International IBPSA Conference, Eindhoven, TheNetherlands, 2003.
[17] T. Yu, “Modeling occupancy behavior for energy efficiencyand occupants comfort management in intelligent buildings,”in Proceedings of the 9th International Conference on MachineLearning and Applications (ICMLA ’10), pp. 726–731, December2010.
[18] D. Kolokotsa, K. Niachou, V. Geros, K. Kalaitzakis, G. S.Stavrakakis, and M. Santamouris, “Implementation of an inte-grated indoor environment and energy management system,”Energy and Buildings, vol. 37, no. 1, pp. 93–99, 2005.
[19] J. Figureiredo and J. Costa, “A SCADA system for energymanagement in intelligent buildings,” Journal of Energy andBuildings, vol. 49, pp. 85–98, 2012.
[20] TimeSeries DataBlade, http://www.ibm.com/developerworks/data/library/techarticle/dm-0510durity2/.
[21] Hypertable: An Open Source, High Performance, ScalableDatabase, http://hypertable.org/.
[22] Jess Expert Shell, http://herzberg.ca.sandia.gov/.[23] E. H. Shortliffe, Computer Based Medical Consultations:
MYCIN, Elsevier, New York, NY, USA, 1976.[24] N. Shah and C.-F. Tsai, “Intelligent household energy manage-
ment recomender system,” in Proceedings of the InternationalConference on Green Computing, Athens, Greece, 2010.
[25] M. P. Papazoglou, P. Traverso, S. Dustdar, and F. Leymann,“Service-oriented computing: state of the art and researchchallenges,” Computer, vol. 40, no. 11, pp. 38–45, 2007.
[26] Plugwise in Business Environment, 2013, http://www.plug-wise.com/sites/default/files/plugwise in a business environ-ment 20110929.pdf.
[27] T. Hargreavesn, M. Nye, and J. Burgess, “Making energy visible:a qualitative field study of how householders interact withfeedback from smart energy monitors,” Energy Policy, vol. 38,no. 10, pp. 6111–6119, 2010.
[28] A. Faruqui, S. Sergici, and A. Sharif, “The impact of infor-mational feedback on energy consumption—a survey of theexperimental evidence,” Energy, vol. 35, no. 4, pp. 1598–1608,2010.
[29] F. W. Siero, A. B. Bakker, G. B. Dekker, and M. T. C. Van DenBurg, “Changing organizational energy consumption behaviourthrough comparative feedback,” Journal of Environmental Psy-chology, vol. 16, no. 3, pp. 235–246, 1996.

International Journal of
AerospaceEngineeringHindawi Publishing Corporationhttp://www.hindawi.com Volume 2014
RoboticsJournal of
Hindawi Publishing Corporationhttp://www.hindawi.com Volume 2014
Hindawi Publishing Corporationhttp://www.hindawi.com Volume 2014
Active and Passive Electronic Components
Control Scienceand Engineering
Journal of
Hindawi Publishing Corporationhttp://www.hindawi.com Volume 2014
International Journal of
RotatingMachinery
Hindawi Publishing Corporationhttp://www.hindawi.com Volume 2014
Hindawi Publishing Corporation http://www.hindawi.com
Journal ofEngineeringVolume 2014
Submit your manuscripts athttp://www.hindawi.com
VLSI Design
Hindawi Publishing Corporationhttp://www.hindawi.com Volume 2014
Hindawi Publishing Corporationhttp://www.hindawi.com Volume 2014
Shock and Vibration
Hindawi Publishing Corporationhttp://www.hindawi.com Volume 2014
Civil EngineeringAdvances in
Acoustics and VibrationAdvances in
Hindawi Publishing Corporationhttp://www.hindawi.com Volume 2014
Hindawi Publishing Corporationhttp://www.hindawi.com Volume 2014
Electrical and Computer Engineering
Journal of
Advances inOptoElectronics
Hindawi Publishing Corporation http://www.hindawi.com
Volume 2014
The Scientific World JournalHindawi Publishing Corporation http://www.hindawi.com Volume 2014
SensorsJournal of
Hindawi Publishing Corporationhttp://www.hindawi.com Volume 2014
Modelling & Simulation in EngineeringHindawi Publishing Corporation http://www.hindawi.com Volume 2014
Hindawi Publishing Corporationhttp://www.hindawi.com Volume 2014
Chemical EngineeringInternational Journal of Antennas and
Propagation
International Journal of
Hindawi Publishing Corporationhttp://www.hindawi.com Volume 2014
Hindawi Publishing Corporationhttp://www.hindawi.com Volume 2014
Navigation and Observation
International Journal of
Hindawi Publishing Corporationhttp://www.hindawi.com Volume 2014
DistributedSensor Networks
International Journal of