Embed Size (px)
Citation preview
Tsuchida et al. Biotechnology for Biofuels 2014, 7:127http://www.biotechnologyforbiofuels.com/content/7/1/127
RESEARCH ARTICLE Open Access
Nuclear magnetic resonance investigation ofwater accessibility in cellulose of pretreatedsugarcane bagasseJefferson Esquina Tsuchida1,2†, Camila Alves Rezende1†, Rodrigo de Oliveira-Silva1, Marisa Aparecida Lima1,Marcel Nogueira d’Eurydice1,3, Igor Polikarpov1 and Tito José Bonagamba1*
Abstract
Background: Enzymatic hydrolysis is a crucial step of biomass conversion into biofuels and different pretreatmentshave been proposed to improve the process efficiency. Amongst the various factors affecting hydrolysis yields ofbiomass samples, porosity and water accessibility stand out due to their intimate relation with enzymes accessibilityto the cellulose and hemicellulose fractions of the biomass. In this work, sugarcane bagasse was subjected to acidand alkali pretreatments. The changes in the total surface area, hydrophilicity, porosity and water accessibility ofcellulose were investigated by scanning electron microscopy (SEM) and nuclear magnetic resonance (NMR).
Results: Changes in chemical and physical properties of the samples, caused by the partial removal ofhemicellulose and lignin, led to the increase in porosity of the cell walls and unwinding of the cellulose bundles, asobserved by SEM. 1H NMR relaxation data revealed the existence of water molecules occupying the cores of wideand narrow vessels as well as the cell wall internal structure. Upon drying, the water molecules associated with thestructure of the cell wall did not undergo significant dynamical and partial moisture changes, while those locatedin the cores of wide and narrow vessels kept continuously evaporating until reaching approximately 20% of relativehumidity. This indicates that water is first removed from the cores of lumens and, in the dry sample, the onlyremaining water molecules are those bound to the cell walls. The stronger interaction of water with pretreatedbagasse is consistent with better enzymes accessibility to cellulose and higher efficiency of the enzymatic hydrolysis.
Conclusions: We were able to identify that sugarcane bagasse modification under acid and basic pretreatmentschange the water accessibility to different sites of the sample, associated with both bagasse structure (lumens and cellwalls) and hydrophilicity (lignin removal). Furthermore, we show that the substrates with increased water accessibilitycorrespond to those with higher hydrolysis yields and that there is a correlation between experimentally NMR-measuredtransverse relaxation times and the efficiency of enzymatic hydrolysis. This might allow for semiquantitative estimatesof the enzymatic hydrolysis efficiency of biomass samples using inexpensive and non-destructive low-field 1H NMRrelaxometry methods.
Keywords: Sugarcane bagasse, Bioethanol, Acid pretreatment, Alkali pretreatment, Chemical composition, Solid-stateNMR, Scanning electron microscopy
* Correspondence: [email protected]†Equal contributors1Instituto de Física de São Carlos, Universidade de São Paulo, Caixa Postal369, CEP 13560-970, São Carlos, SP, BrazilFull list of author information is available at the end of the article
© 2014 Tsuchida et al.; licensee BioMed Central Ltd. This is an Open Access article distributed under the terms of the CreativeCommons Attribution License (http://creativecommons.org/licenses/by/4.0), which permits unrestricted use, distribution, andreproduction in any medium, provided the original work is properly credited. The Creative Commons Public DomainDedication waiver (http://creativecommons.org/publicdomain/zero/1.0/) applies to the data made available in this article,unless otherwise stated.

Tsuchida et al. Biotechnology for Biofuels 2014, 7:127 Page 2 of 13http://www.biotechnologyforbiofuels.com/content/7/1/127
BackgroundSugarcane bagasse is a residue from sugarcane millingfor sugar and alcohol production and represents anabundant feedstock available to be converted into secondgeneration biofuels [1,2]. In Brazil almost 600 million tonsof sugarcane are processed every year [3], and 30% of thisamount corresponds to bagasse. This material could beprocessed in situ, yielding cellulosic ethanol and otherchemicals, by adapting the current milling plants alreadyused for ethanol production within the framework of abiorefinery.The classical approach to the production of cellulosic
ethanol involves three key steps: 1) pretreatment of thefeedstocks to decrease biomass recalcitrance, 2) enzymatichydrolysis to break the carbohydrates into hexoses and/orpentoses and 3) sugar fermentation into alcohol [4,5].Biomass recalcitrance is the major barrier to the in-
dustrial implementation of this process on a large scalesince it decreases the efficiency of enzymatic hydrolysisand requires higher enzyme loading [4,6]. Thus, significantresearch efforts have been applied to decrease enzymecosts, to develop more efficient pretreatments and tounderstand the chemical and structural changes takingplace as a consequence of different pretreatment tech-nologies [1,7-9].A variety of pretreatment methods have been proposed
to decrease the recalcitrance of lignocellulosic matricesand to improve hydrolysis efficiency. The most commonprocesses include milling [10,11], hot water and/orsteam explosion [4,12], ammonia explosion (AFEX) [13],supercritical fluids [14,15], sulfite [16,17], diluted acidsand bases [1,18-20] and irradiation [8,21].Different pretreatments may have diverse effects on
the biomass structure and chemical composition. Thepretreatments may act, for instance, by promoting thedecrease of cellulose crystallinity and/or degree of poly-merization, by changing the lignin to hemicellulose ratioor by altering the total surface area of the substrate [1,2,8].Lignin rearrangements, mainly characterized by its
removal from the inner parts of the cell wall and re-deposition on the surface, was described for other ligno-cellulosic biomasses submitted to steam explosion [22],diluted acid [23,24] and organosolv pretreatments [25].Among the various factors that affect the rate of en-
zymatic digestibility, the modification of sample porositywas identified as one of the most important, because itdirectly influences the enzyme access to the substrate[6,26,27]. Due to the intimate contact between the cellu-lose and the enzymes that is required for the hydrolyticaction to take place, the overall surface area, hydratedand accessible to the enzyme action, assumes a fundamen-tal role to the process efficiency.A variety of analytical techniques have been used to
estimate the water accessibility in cellulose and the total
surface area available in different lignocellulosic matrices.These techniques may use probing molecules, such asdextran in solute exclusion methods, or water in differen-tial scanning calorimetry (DSC) and nuclear magneticresonance (NMR) relaxometry [27-30]. They can also bebased on the adsorption of a given molecule to lignocellu-losic substrates, for instance, nitrogen adsorption to poresurfaces (BET method), proteins and enzymes adsorption,and the adsorption of dyes with a specific affinity to cellu-lose domains (Simon’s staining method) [6,26,31].Tanaka et al. [26] compared the efficiency of enzymes
with different sizes (cross-linked or normal cellulases) todeconstruct microcrystalline and amorphous cellulose.They observed that synergetic effects and hydrolysis yieldsare favored by the presence of pores on the substratewhich are sufficiently large to allow the enzyme to diffusein. Suurnäkkiet al. [31] concentrated on the porosity pro-file resulting from enzyme action on pine and birch kraftpulps using solute exclusion and NMR techniques.A relevant question in this field is how the different
pretreatments affect the sample surface area available tohydrolysis, which could create several cellulose sitescontaining water molecules with varying mobility. Severalpublished studies focus on the application of the techniquescurrently available for porosity determination to evaluatestructural changes concerning porous distribution and cel-lulose accessibility on pretreated samples [6,27,30].Wood samples undergoing thermomechanical, organo-
solv and steam treatments were studied by Chandra et al.[6], who estimated the cellulose accessibility on thesesamples using a modified version of Simons’ stain (SS)method. The method is based on a dye mixture containingdirect blue (DB) and direct orange (DO) dyes and on theirdifferent sizes and cellulose affinities. This allowed theauthors to establish a correlation between hydrolysisyields reached by each treatment and the ratio between theadsorbed amount of DO and DB [6]. Wood samples treatedwith dilute acid were also studied by NMR relaxation mea-surements, showing the potential of this technique to revealthe pore expansion within the plant cell wall [27].In the present work, we used 1H NMR relaxometry and
wide-line spectroscopy measurements to address this issueon sugarcane bagasse samples undergoing a two-step pre-treatment. First, samples were treated with diluted sulfuricacid, and subsequently, with sodium hydroxide solutionsof increasing concentrations. Dilute sulfuric acid pretreat-ment in the conditions applied in present work is knownto depolymerize and solubilize hemicellulose fraction,whereas alkaline pretreatment results in substantial removalof lignin from the residual lignocellulose [1,5,8,10,17,18,20].Therefore, the two-step pretreatment applied here aimedto separate the pretreatment step focused in hemicelluloseremoval from the one mostly impacting the lignin fractionof the biomass. In our previous publication [1], this
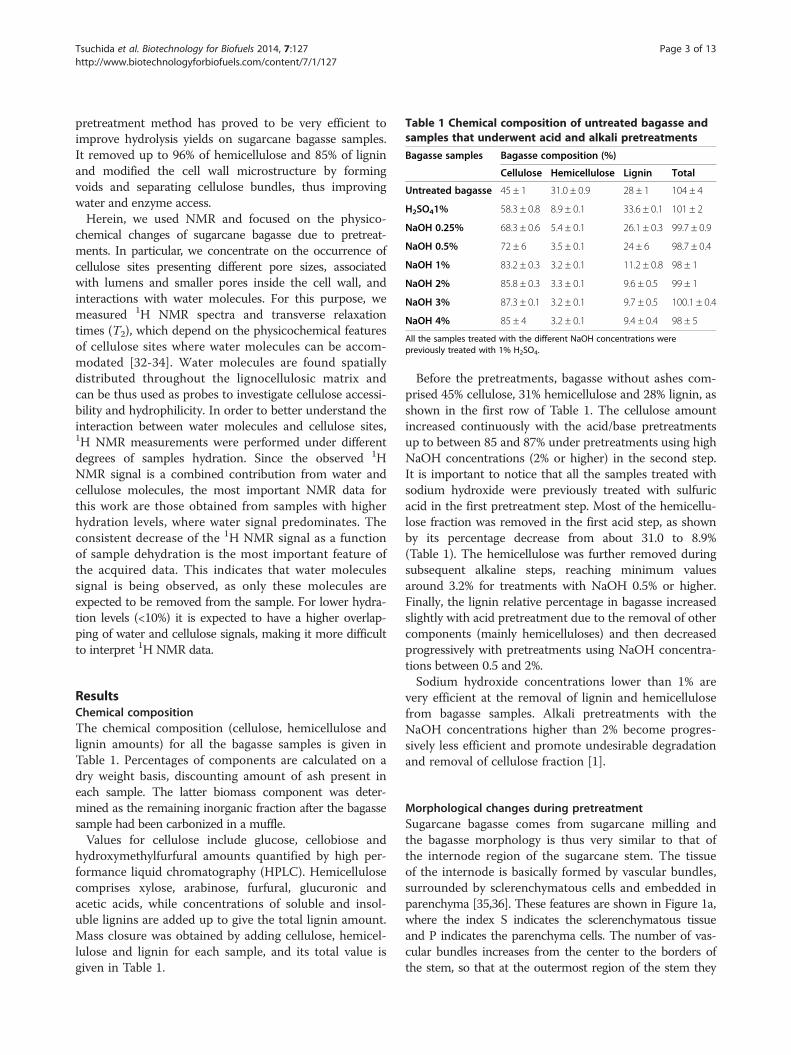
Table 1 Chemical composition of untreated bagasse andsamples that underwent acid and alkali pretreatments
Bagasse samples Bagasse composition (%)
Cellulose Hemicellulose Lignin Total
Untreated bagasse 45 ± 1 31.0 ± 0.9 28 ± 1 104 ± 4
H2SO41% 58.3 ± 0.8 8.9 ± 0.1 33.6 ± 0.1 101 ± 2
NaOH 0.25% 68.3 ± 0.6 5.4 ± 0.1 26.1 ± 0.3 99.7 ± 0.9
NaOH 0.5% 72 ± 6 3.5 ± 0.1 24 ± 6 98.7 ± 0.4
NaOH 1% 83.2 ± 0.3 3.2 ± 0.1 11.2 ± 0.8 98 ± 1
NaOH 2% 85.8 ± 0.3 3.3 ± 0.1 9.6 ± 0.5 99 ± 1
NaOH 3% 87.3 ± 0.1 3.2 ± 0.1 9.7 ± 0.5 100.1 ± 0.4
NaOH 4% 85 ± 4 3.2 ± 0.1 9.4 ± 0.4 98 ± 5
All the samples treated with the different NaOH concentrations werepreviously treated with 1% H2SO4.
Tsuchida et al. Biotechnology for Biofuels 2014, 7:127 Page 3 of 13http://www.biotechnologyforbiofuels.com/content/7/1/127
pretreatment method has proved to be very efficient toimprove hydrolysis yields on sugarcane bagasse samples.It removed up to 96% of hemicellulose and 85% of ligninand modified the cell wall microstructure by formingvoids and separating cellulose bundles, thus improvingwater and enzyme access.Herein, we used NMR and focused on the physico-
chemical changes of sugarcane bagasse due to pretreat-ments. In particular, we concentrate on the occurrence ofcellulose sites presenting different pore sizes, associatedwith lumens and smaller pores inside the cell wall, andinteractions with water molecules. For this purpose, wemeasured 1H NMR spectra and transverse relaxationtimes (T2), which depend on the physicochemical featuresof cellulose sites where water molecules can be accom-modated [32-34]. Water molecules are found spatiallydistributed throughout the lignocellulosic matrix andcan be thus used as probes to investigate cellulose accessi-bility and hydrophilicity. In order to better understand theinteraction between water molecules and cellulose sites,1H NMR measurements were performed under differentdegrees of samples hydration. Since the observed 1HNMR signal is a combined contribution from water andcellulose molecules, the most important NMR data forthis work are those obtained from samples with higherhydration levels, where water signal predominates. Theconsistent decrease of the 1H NMR signal as a functionof sample dehydration is the most important feature ofthe acquired data. This indicates that water moleculessignal is being observed, as only these molecules areexpected to be removed from the sample. For lower hydra-tion levels (<10%) it is expected to have a higher overlap-ping of water and cellulose signals, making it more difficultto interpret 1H NMR data.
ResultsChemical compositionThe chemical composition (cellulose, hemicellulose andlignin amounts) for all the bagasse samples is given inTable 1. Percentages of components are calculated on adry weight basis, discounting amount of ash present ineach sample. The latter biomass component was deter-mined as the remaining inorganic fraction after the bagassesample had been carbonized in a muffle.Values for cellulose include glucose, cellobiose and
hydroxymethylfurfural amounts quantified by high per-formance liquid chromatography (HPLC). Hemicellulosecomprises xylose, arabinose, furfural, glucuronic andacetic acids, while concentrations of soluble and insol-uble lignins are added up to give the total lignin amount.Mass closure was obtained by adding cellulose, hemicel-lulose and lignin for each sample, and its total value isgiven in Table 1.
Before the pretreatments, bagasse without ashes com-prised 45% cellulose, 31% hemicellulose and 28% lignin, asshown in the first row of Table 1. The cellulose amountincreased continuously with the acid/base pretreatmentsup to between 85 and 87% under pretreatments using highNaOH concentrations (2% or higher) in the second step.It is important to notice that all the samples treated withsodium hydroxide were previously treated with sulfuricacid in the first pretreatment step. Most of the hemicellu-lose fraction was removed in the first acid step, as shownby its percentage decrease from about 31.0 to 8.9%(Table 1). The hemicellulose was further removed duringsubsequent alkaline steps, reaching minimum valuesaround 3.2% for treatments with NaOH 0.5% or higher.Finally, the lignin relative percentage in bagasse increasedslightly with acid pretreatment due to the removal of othercomponents (mainly hemicelluloses) and then decreasedprogressively with pretreatments using NaOH concentra-tions between 0.5 and 2%.Sodium hydroxide concentrations lower than 1% are
very efficient at the removal of lignin and hemicellulosefrom bagasse samples. Alkali pretreatments with theNaOH concentrations higher than 2% become progres-sively less efficient and promote undesirable degradationand removal of cellulose fraction [1].
Morphological changes during pretreatmentSugarcane bagasse comes from sugarcane milling andthe bagasse morphology is thus very similar to that ofthe internode region of the sugarcane stem. The tissueof the internode is basically formed by vascular bundles,surrounded by sclerenchymatous cells and embedded inparenchyma [35,36]. These features are shown in Figure 1a,where the index S indicates the sclerenchymatous tissueand P indicates the parenchyma cells. The number of vas-cular bundles increases from the center to the borders ofthe stem, so that at the outermost region of the stem they
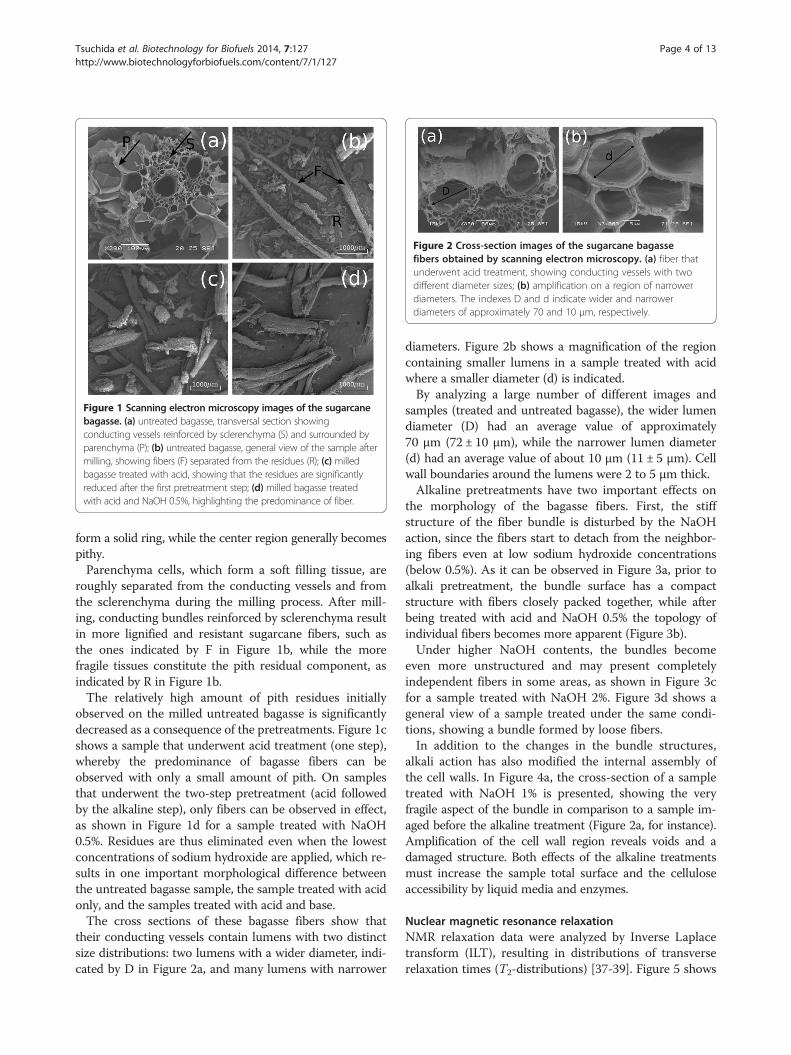
Figure 1 Scanning electron microscopy images of the sugarcanebagasse. (a) untreated bagasse, transversal section showingconducting vessels reinforced by sclerenchyma (S) and surrounded byparenchyma (P); (b) untreated bagasse, general view of the sample aftermilling, showing fibers (F) separated from the residues (R); (c) milledbagasse treated with acid, showing that the residues are significantlyreduced after the first pretreatment step; (d) milled bagasse treatedwith acid and NaOH 0.5%, highlighting the predominance of fiber.
Figure 2 Cross-section images of the sugarcane bagassefibers obtained by scanning electron microscopy. (a) fiber thatunderwent acid treatment, showing conducting vessels with twodifferent diameter sizes; (b) amplification on a region of narrowerdiameters. The indexes D and d indicate wider and narrowerdiameters of approximately 70 and 10 μm, respectively.
Tsuchida et al. Biotechnology for Biofuels 2014, 7:127 Page 4 of 13http://www.biotechnologyforbiofuels.com/content/7/1/127
form a solid ring, while the center region generally becomespithy.Parenchyma cells, which form a soft filling tissue, are
roughly separated from the conducting vessels and fromthe sclerenchyma during the milling process. After mill-ing, conducting bundles reinforced by sclerenchyma resultin more lignified and resistant sugarcane fibers, such asthe ones indicated by F in Figure 1b, while the morefragile tissues constitute the pith residual component, asindicated by R in Figure 1b.The relatively high amount of pith residues initially
observed on the milled untreated bagasse is significantlydecreased as a consequence of the pretreatments. Figure 1cshows a sample that underwent acid treatment (one step),whereby the predominance of bagasse fibers can beobserved with only a small amount of pith. On samplesthat underwent the two-step pretreatment (acid followedby the alkaline step), only fibers can be observed in effect,as shown in Figure 1d for a sample treated with NaOH0.5%. Residues are thus eliminated even when the lowestconcentrations of sodium hydroxide are applied, which re-sults in one important morphological difference betweenthe untreated bagasse sample, the sample treated with acidonly, and the samples treated with acid and base.The cross sections of these bagasse fibers show that
their conducting vessels contain lumens with two distinctsize distributions: two lumens with a wider diameter, indi-cated by D in Figure 2a, and many lumens with narrower
diameters. Figure 2b shows a magnification of the regioncontaining smaller lumens in a sample treated with acidwhere a smaller diameter (d) is indicated.By analyzing a large number of different images and
samples (treated and untreated bagasse), the wider lumendiameter (D) had an average value of approximately70 μm (72 ± 10 μm), while the narrower lumen diameter(d) had an average value of about 10 μm (11 ± 5 μm). Cellwall boundaries around the lumens were 2 to 5 μm thick.Alkaline pretreatments have two important effects on
the morphology of the bagasse fibers. First, the stiffstructure of the fiber bundle is disturbed by the NaOHaction, since the fibers start to detach from the neighbor-ing fibers even at low sodium hydroxide concentrations(below 0.5%). As it can be observed in Figure 3a, prior toalkali pretreatment, the bundle surface has a compactstructure with fibers closely packed together, while afterbeing treated with acid and NaOH 0.5% the topology ofindividual fibers becomes more apparent (Figure 3b).Under higher NaOH contents, the bundles become
even more unstructured and may present completelyindependent fibers in some areas, as shown in Figure 3cfor a sample treated with NaOH 2%. Figure 3d shows ageneral view of a sample treated under the same condi-tions, showing a bundle formed by loose fibers.In addition to the changes in the bundle structures,
alkali action has also modified the internal assembly ofthe cell walls. In Figure 4a, the cross-section of a sampletreated with NaOH 1% is presented, showing the veryfragile aspect of the bundle in comparison to a sample im-aged before the alkaline treatment (Figure 2a, for instance).Amplification of the cell wall region reveals voids and adamaged structure. Both effects of the alkaline treatmentsmust increase the sample total surface and the celluloseaccessibility by liquid media and enzymes.
Nuclear magnetic resonance relaxationNMR relaxation data were analyzed by Inverse Laplacetransform (ILT), resulting in distributions of transverserelaxation times (T2-distributions) [37-39]. Figure 5 shows

Figure 3 Scanning electron microscopy images of the surfaceof sugarcane bagasse fibers before and after undergoingalkaline treatments. (a) untreated sample, showing the closelypacked structure of the fiber bundle surface; (b) sample treated withH2SO4 1% and NaOH 0.5%, with individual fibers starting to comeapart; (c) sample treated with H2SO4 1% and NaOH 2%, withunattached and independent fibers and (d) general view of adegraded bagasse bundle with loose fibers.
Tsuchida et al. Biotechnology for Biofuels 2014, 7:127 Page 5 of 13http://www.biotechnologyforbiofuels.com/content/7/1/127
the T2-distributions obtained for bagasse samples thatwere submitted to the drying procedure being stack plot-ted for different relative humidities. Every set of curvescorresponds to a different pretreatment.The T2-distributions were fitted by log-Gaussian func-
tions as described in the experimental section, allowingfree adjustment of all the function parameters. The fittingprocess was done by using the data obtained in the previ-ous adjustment as initial parameters, starting from thehighest humidity (100%) for each sample studied by NMR.In order to define the highest humidity (100%), the
excess of free water in the sample after oversaturationwas taken into account. The excess water presented thelongest observed T2 components and corresponded to an
Figure 4 Scanning electron microscopy images of the sugarcanebagasse treated with H2SO4 1% and NaOH 1%. (a) general view ofthe cross section of a fiber bundle after pretreatment and (b)amplification on the cell wall (dashed square in (a)), showing thesurface damaged as a consequence of the pretreatments.
Figure 5 T2-distributionsversusrelative humidities for bagassesamples. (a) Untreated, (b) H2SO4 1%, (c) NaOH 0.25%, (d) NaOH0.5%, (e) NaOH 1%, (f) NaOH 2%, (g) NaOH 3%,(h) NaOH 4%. Darkerlines were included only to indicate extreme and intermediatehydration levels. All the samples treated with NaOH were previouslytreated with H2SO4 1%.
intense peak at the right side of T2-distributions. When thesample was oversaturated, the high intensity of this peakinterfered with the observation of shorter components inthe T2-distribution. The definition of the 100% humiditycorresponds to the drying step in which the peak assignedto excess free water became the smallest contribution forthe overall T2-distribution (Figure 6a, dashed line).
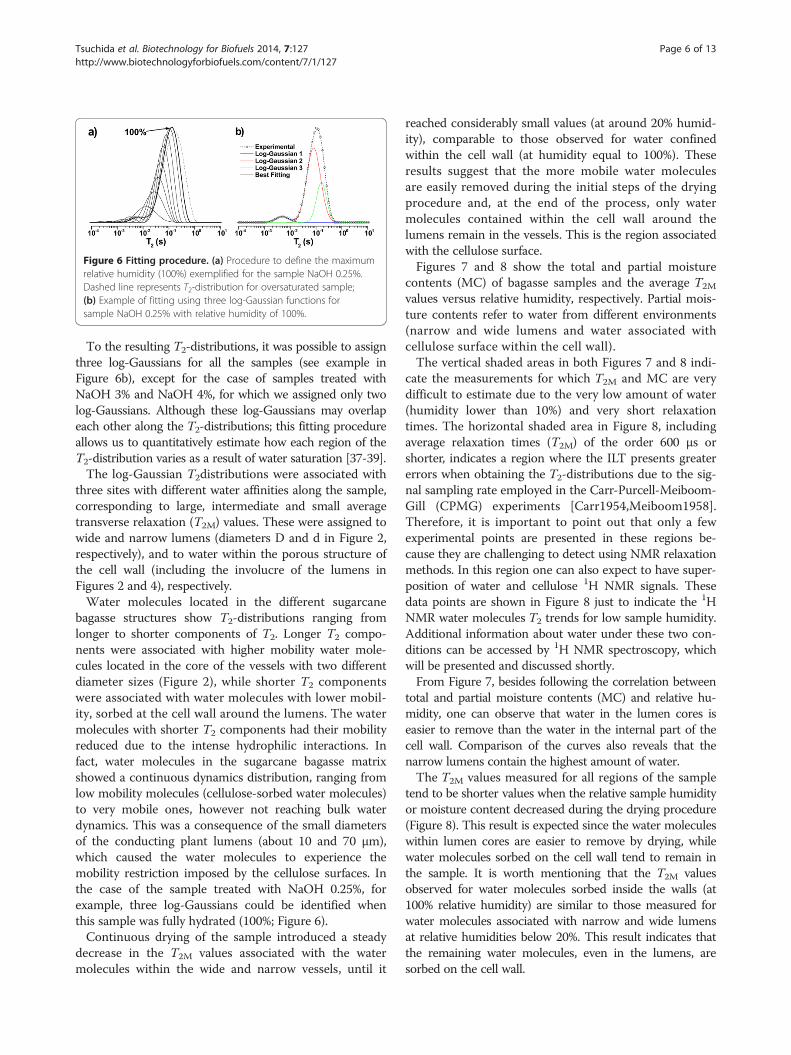
Figure 6 Fitting procedure. (a) Procedure to define the maximumrelative humidity (100%) exemplified for the sample NaOH 0.25%.Dashed line represents T2-distribution for oversaturated sample;(b) Example of fitting using three log-Gaussian functions forsample NaOH 0.25% with relative humidity of 100%.
Tsuchida et al. Biotechnology for Biofuels 2014, 7:127 Page 6 of 13http://www.biotechnologyforbiofuels.com/content/7/1/127
To the resulting T2-distributions, it was possible to assignthree log-Gaussians for all the samples (see example inFigure 6b), except for the case of samples treated withNaOH 3% and NaOH 4%, for which we assigned only twolog-Gaussians. Although these log-Gaussians may overlapeach other along the T2-distributions; this fitting procedureallows us to quantitatively estimate how each region of theT2-distribution varies as a result of water saturation [37-39].The log-Gaussian T2distributions were associated with
three sites with different water affinities along the sample,corresponding to large, intermediate and small averagetransverse relaxation (T2M) values. These were assigned towide and narrow lumens (diameters D and d in Figure 2,respectively), and to water within the porous structure ofthe cell wall (including the involucre of the lumens inFigures 2 and 4), respectively.Water molecules located in the different sugarcane
bagasse structures show T2-distributions ranging fromlonger to shorter components of T2. Longer T2 compo-nents were associated with higher mobility water mole-cules located in the core of the vessels with two differentdiameter sizes (Figure 2), while shorter T2 componentswere associated with water molecules with lower mobil-ity, sorbed at the cell wall around the lumens. The watermolecules with shorter T2 components had their mobilityreduced due to the intense hydrophilic interactions. Infact, water molecules in the sugarcane bagasse matrixshowed a continuous dynamics distribution, ranging fromlow mobility molecules (cellulose-sorbed water molecules)to very mobile ones, however not reaching bulk waterdynamics. This was a consequence of the small diametersof the conducting plant lumens (about 10 and 70 μm),which caused the water molecules to experience themobility restriction imposed by the cellulose surfaces. Inthe case of the sample treated with NaOH 0.25%, forexample, three log-Gaussians could be identified whenthis sample was fully hydrated (100%; Figure 6).Continuous drying of the sample introduced a steady
decrease in the T2M values associated with the watermolecules within the wide and narrow vessels, until it
reached considerably small values (at around 20% humid-ity), comparable to those observed for water confinedwithin the cell wall (at humidity equal to 100%). Theseresults suggest that the more mobile water moleculesare easily removed during the initial steps of the dryingprocedure and, at the end of the process, only watermolecules contained within the cell wall around thelumens remain in the vessels. This is the region associatedwith the cellulose surface.Figures 7 and 8 show the total and partial moisture
contents (MC) of bagasse samples and the average T2M
values versus relative humidity, respectively. Partial mois-ture contents refer to water from different environments(narrow and wide lumens and water associated withcellulose surface within the cell wall).The vertical shaded areas in both Figures 7 and 8 indi-
cate the measurements for which T2M and MC are verydifficult to estimate due to the very low amount of water(humidity lower than 10%) and very short relaxationtimes. The horizontal shaded area in Figure 8, includingaverage relaxation times (T2M) of the order 600 μs orshorter, indicates a region where the ILT presents greatererrors when obtaining the T2-distributions due to the sig-nal sampling rate employed in the Carr-Purcell-Meiboom-Gill (CPMG) experiments [Carr1954,Meiboom1958].Therefore, it is important to point out that only a fewexperimental points are presented in these regions be-cause they are challenging to detect using NMR relaxationmethods. In this region one can also expect to have super-position of water and cellulose 1H NMR signals. Thesedata points are shown in Figure 8 just to indicate the 1HNMR water molecules T2 trends for low sample humidity.Additional information about water under these two con-ditions can be accessed by 1H NMR spectroscopy, whichwill be presented and discussed shortly.From Figure 7, besides following the correlation between
total and partial moisture contents (MC) and relative hu-midity, one can observe that water in the lumen cores iseasier to remove than the water in the internal part of thecell wall. Comparison of the curves also reveals that thenarrow lumens contain the highest amount of water.The T2M values measured for all regions of the sample
tend to be shorter values when the relative sample humidityor moisture content decreased during the drying procedure(Figure 8). This result is expected since the water moleculeswithin lumen cores are easier to remove by drying, whilewater molecules sorbed on the cell wall tend to remain inthe sample. It is worth mentioning that the T2M valuesobserved for water molecules sorbed inside the walls (at100% relative humidity) are similar to those measured forwater molecules associated with narrow and wide lumensat relative humidities below 20%. This result indicates thatthe remaining water molecules, even in the lumens, aresorbed on the cell wall.
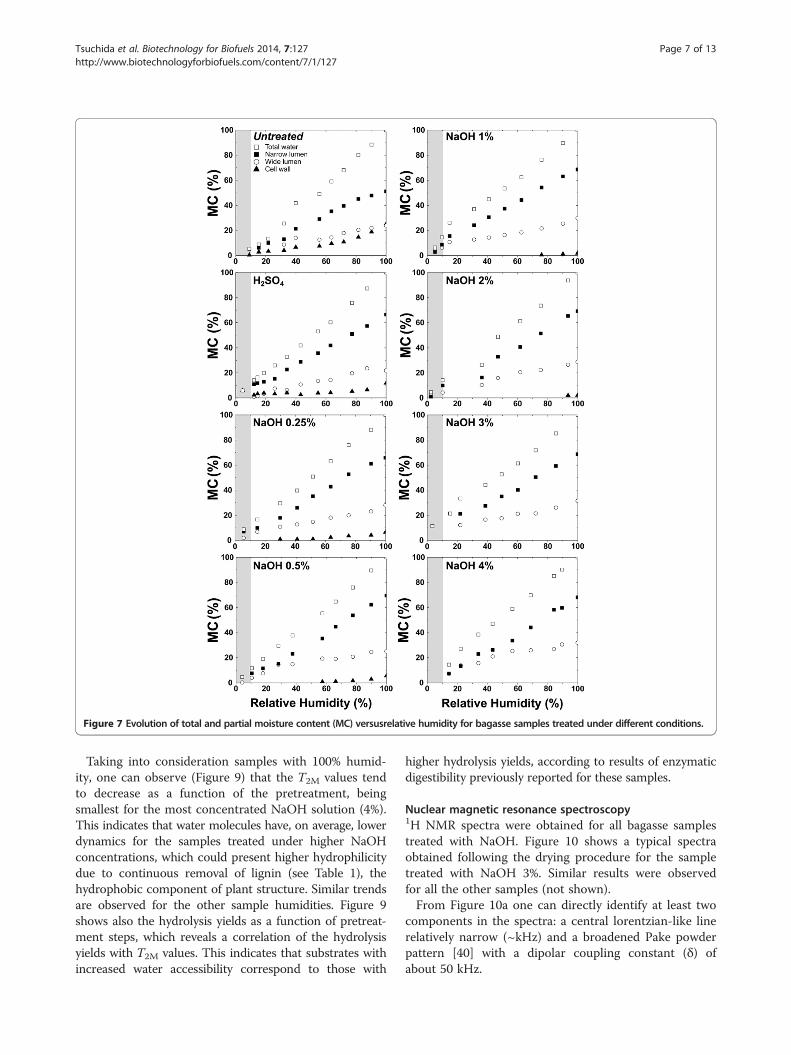
Figure 7 Evolution of total and partial moisture content (MC) versusrelative humidity for bagasse samples treated under different conditions.
Tsuchida et al. Biotechnology for Biofuels 2014, 7:127 Page 7 of 13http://www.biotechnologyforbiofuels.com/content/7/1/127
Taking into consideration samples with 100% humid-ity, one can observe (Figure 9) that the T2M values tendto decrease as a function of the pretreatment, beingsmallest for the most concentrated NaOH solution (4%).This indicates that water molecules have, on average, lowerdynamics for the samples treated under higher NaOHconcentrations, which could present higher hydrophilicitydue to continuous removal of lignin (see Table 1), thehydrophobic component of plant structure. Similar trendsare observed for the other sample humidities. Figure 9shows also the hydrolysis yields as a function of pretreat-ment steps, which reveals a correlation of the hydrolysisyields with T2M values. This indicates that substrates withincreased water accessibility correspond to those with
higher hydrolysis yields, according to results of enzymaticdigestibility previously reported for these samples.
Nuclear magnetic resonance spectroscopy1H NMR spectra were obtained for all bagasse samplestreated with NaOH. Figure 10 shows a typical spectraobtained following the drying procedure for the sampletreated with NaOH 3%. Similar results were observedfor all the other samples (not shown).From Figure 10a one can directly identify at least two
components in the spectra: a central lorentzian-like linerelatively narrow (~kHz) and a broadened Pake powderpattern [40] with a dipolar coupling constant (δ) ofabout 50 kHz.
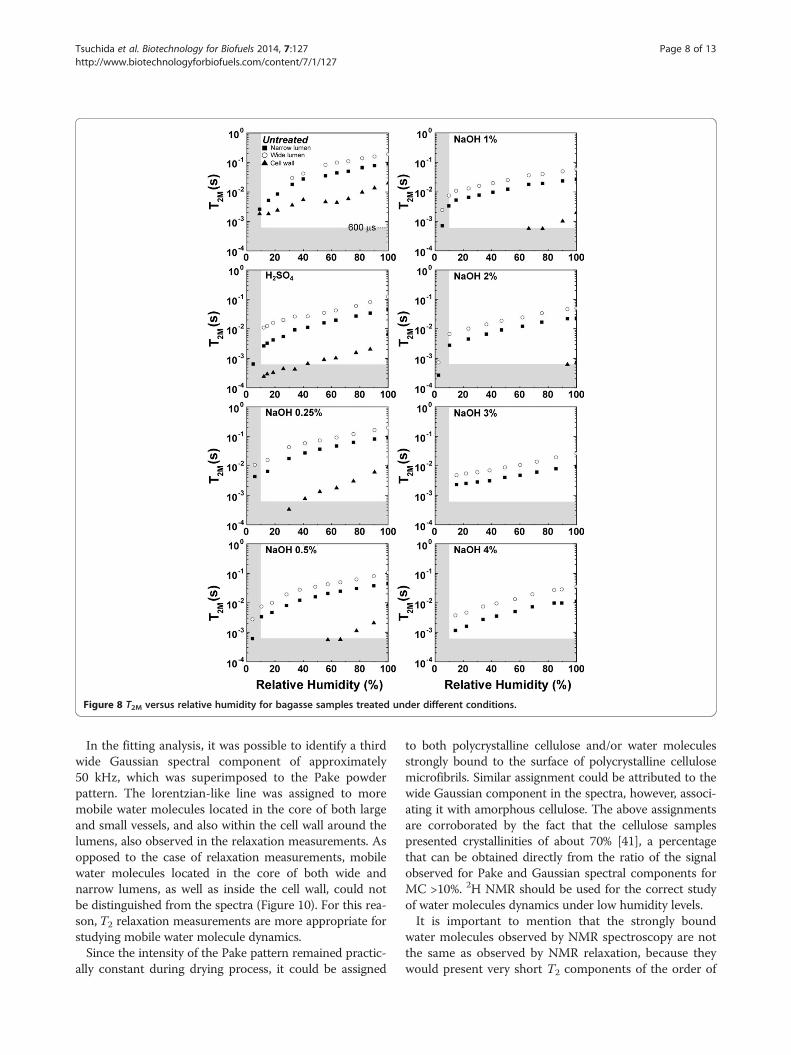
Figure 8 T2M versus relative humidity for bagasse samples treated under different conditions.
Tsuchida et al. Biotechnology for Biofuels 2014, 7:127 Page 8 of 13http://www.biotechnologyforbiofuels.com/content/7/1/127
In the fitting analysis, it was possible to identify a thirdwide Gaussian spectral component of approximately50 kHz, which was superimposed to the Pake powderpattern. The lorentzian-like line was assigned to moremobile water molecules located in the core of both largeand small vessels, and also within the cell wall around thelumens, also observed in the relaxation measurements. Asopposed to the case of relaxation measurements, mobilewater molecules located in the core of both wide andnarrow lumens, as well as inside the cell wall, could notbe distinguished from the spectra (Figure 10). For this rea-son,T2 relaxation measurements are more appropriate forstudying mobile water molecule dynamics.Since the intensity of the Pake pattern remained practic-
ally constant during drying process, it could be assigned
to both polycrystalline cellulose and/or water moleculesstrongly bound to the surface of polycrystalline cellulosemicrofibrils. Similar assignment could be attributed to thewide Gaussian component in the spectra, however, associ-ating it with amorphous cellulose. The above assignmentsare corroborated by the fact that the cellulose samplespresented crystallinities of about 70% [41], a percentagethat can be obtained directly from the ratio of the signalobserved for Pake and Gaussian spectral components forMC >10%. 2H NMR should be used for the correct studyof water molecules dynamics under low humidity levels.It is important to mention that the strongly bound
water molecules observed by NMR spectroscopy are notthe same as observed by NMR relaxation, because theywould present very short T2 components of the order of
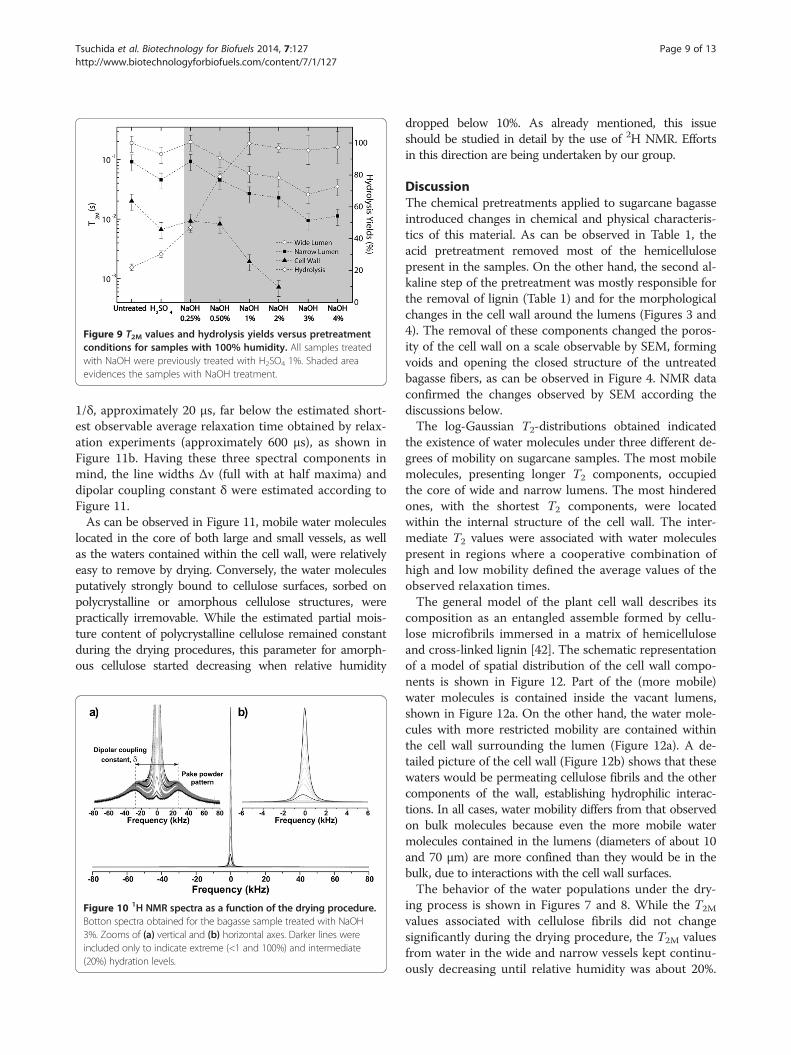
Figure 9 T2M values and hydrolysis yields versus pretreatmentconditions for samples with 100% humidity. All samples treatedwith NaOH were previously treated with H2SO4 1%. Shaded areaevidences the samples with NaOH treatment.
Tsuchida et al. Biotechnology for Biofuels 2014, 7:127 Page 9 of 13http://www.biotechnologyforbiofuels.com/content/7/1/127
1/δ, approximately 20 μs, far below the estimated short-est observable average relaxation time obtained by relax-ation experiments (approximately 600 μs), as shown inFigure 11b. Having these three spectral components inmind, the line widths Δν (full with at half maxima) anddipolar coupling constant δ were estimated according toFigure 11.As can be observed in Figure 11, mobile water molecules
located in the core of both large and small vessels, as wellas the waters contained within the cell wall, were relativelyeasy to remove by drying. Conversely, the water moleculesputatively strongly bound to cellulose surfaces, sorbed onpolycrystalline or amorphous cellulose structures, werepractically irremovable. While the estimated partial mois-ture content of polycrystalline cellulose remained constantduring the drying procedures, this parameter for amorph-ous cellulose started decreasing when relative humidity
Figure 10 1H NMR spectra as a function of the drying procedure.Botton spectra obtained for the bagasse sample treated with NaOH3%. Zooms of (a) vertical and (b) horizontal axes. Darker lines wereincluded only to indicate extreme (<1 and 100%) and intermediate(20%) hydration levels.
dropped below 10%. As already mentioned, this issueshould be studied in detail by the use of 2H NMR. Effortsin this direction are being undertaken by our group.
DiscussionThe chemical pretreatments applied to sugarcane bagasseintroduced changes in chemical and physical characteris-tics of this material. As can be observed in Table 1, theacid pretreatment removed most of the hemicellulosepresent in the samples. On the other hand, the second al-kaline step of the pretreatment was mostly responsible forthe removal of lignin (Table 1) and for the morphologicalchanges in the cell wall around the lumens (Figures 3 and4). The removal of these components changed the poros-ity of the cell wall on a scale observable by SEM, formingvoids and opening the closed structure of the untreatedbagasse fibers, as can be observed in Figure 4. NMR dataconfirmed the changes observed by SEM according thediscussions below.The log-Gaussian T2-distributions obtained indicated
the existence of water molecules under three different de-grees of mobility on sugarcane samples. The most mobilemolecules, presenting longer T2 components, occupiedthe core of wide and narrow lumens. The most hinderedones, with the shortest T2 components, were locatedwithin the internal structure of the cell wall. The inter-mediate T2 values were associated with water moleculespresent in regions where a cooperative combination ofhigh and low mobility defined the average values of theobserved relaxation times.The general model of the plant cell wall describes its
composition as an entangled assemble formed by cellu-lose microfibrils immersed in a matrix of hemicelluloseand cross-linked lignin [42]. The schematic representationof a model of spatial distribution of the cell wall compo-nents is shown in Figure 12. Part of the (more mobile)water molecules is contained inside the vacant lumens,shown in Figure 12a. On the other hand, the water mole-cules with more restricted mobility are contained withinthe cell wall surrounding the lumen (Figure 12a). A de-tailed picture of the cell wall (Figure 12b) shows that thesewaters would be permeating cellulose fibrils and the othercomponents of the wall, establishing hydrophilic interac-tions. In all cases, water mobility differs from that observedon bulk molecules because even the more mobile watermolecules contained in the lumens (diameters of about 10and 70 μm) are more confined than they would be in thebulk, due to interactions with the cell wall surfaces.The behavior of the water populations under the dry-
ing process is shown in Figures 7 and 8. While the T2M
values associated with cellulose fibrils did not changesignificantly during the drying procedure, the T2M valuesfrom water in the wide and narrow vessels kept continu-ously decreasing until relative humidity was about 20%.
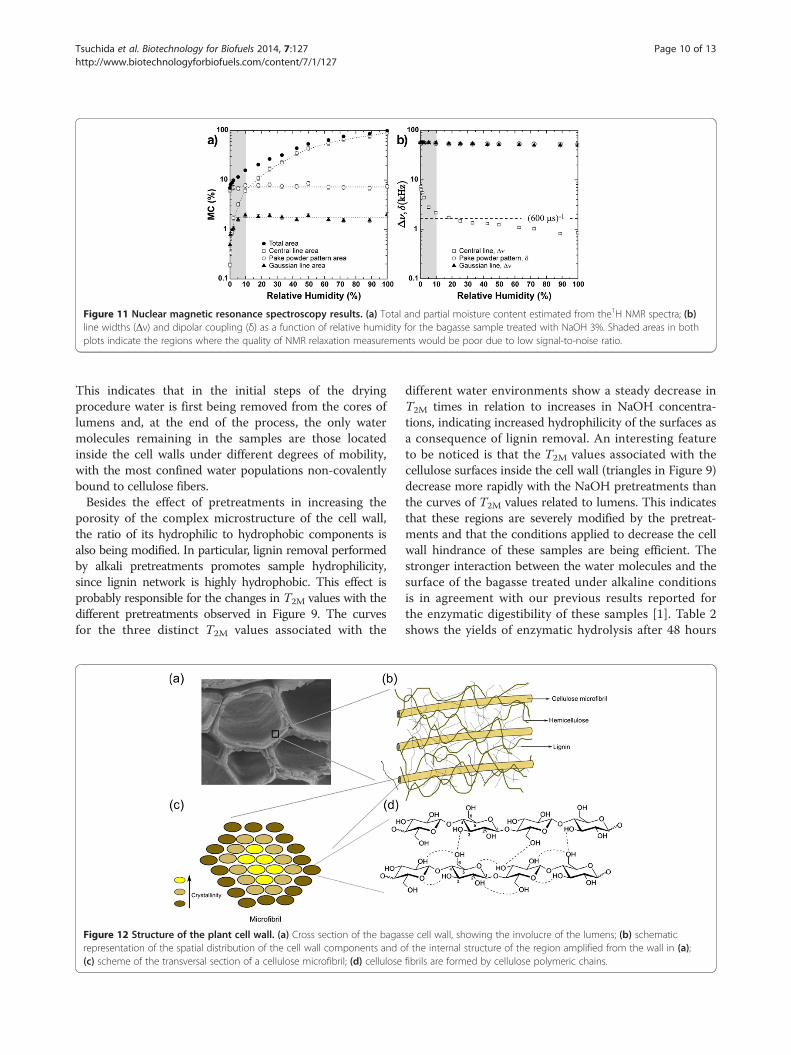
Figure 11 Nuclear magnetic resonance spectroscopy results. (a) Total and partial moisture content estimated from the1H NMR spectra; (b)line widths (Δν) and dipolar coupling (δ) as a function of relative humidity for the bagasse sample treated with NaOH 3%. Shaded areas in bothplots indicate the regions where the quality of NMR relaxation measurements would be poor due to low signal-to-noise ratio.
Tsuchida et al. Biotechnology for Biofuels 2014, 7:127 Page 10 of 13http://www.biotechnologyforbiofuels.com/content/7/1/127
This indicates that in the initial steps of the dryingprocedure water is first being removed from the cores oflumens and, at the end of the process, the only watermolecules remaining in the samples are those locatedinside the cell walls under different degrees of mobility,with the most confined water populations non-covalentlybound to cellulose fibers.Besides the effect of pretreatments in increasing the
porosity of the complex microstructure of the cell wall,the ratio of its hydrophilic to hydrophobic components isalso being modified. In particular, lignin removal performedby alkali pretreatments promotes sample hydrophilicity,since lignin network is highly hydrophobic. This effect isprobably responsible for the changes in T2M values with thedifferent pretreatments observed in Figure 9. The curvesfor the three distinct T2M values associated with the
Figure 12 Structure of the plant cell wall. (a) Cross section of the bagasrepresentation of the spatial distribution of the cell wall components and o(c) scheme of the transversal section of a cellulose microfibril; (d) cellulose
different water environments show a steady decrease inT2M times in relation to increases in NaOH concentra-tions, indicating increased hydrophilicity of the surfaces asa consequence of lignin removal. An interesting featureto be noticed is that the T2M values associated with thecellulose surfaces inside the cell wall (triangles in Figure 9)decrease more rapidly with the NaOH pretreatments thanthe curves of T2M values related to lumens. This indicatesthat these regions are severely modified by the pretreat-ments and that the conditions applied to decrease the cellwall hindrance of these samples are being efficient. Thestronger interaction between the water molecules and thesurface of the bagasse treated under alkaline conditionsis in agreement with our previous results reported forthe enzymatic digestibility of these samples [1]. Table 2shows the yields of enzymatic hydrolysis after 48 hours
se cell wall, showing the involucre of the lumens; (b) schematicf the internal structure of the region amplified from the wall in (a);fibrils are formed by cellulose polymeric chains.
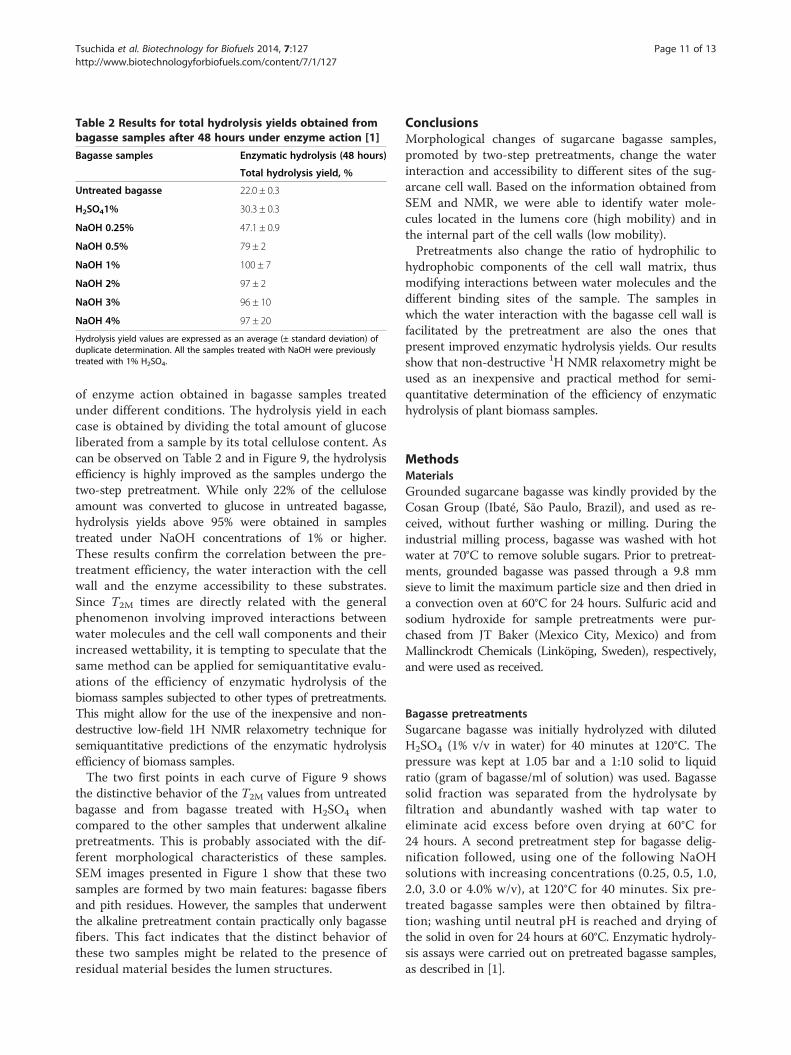
Table 2 Results for total hydrolysis yields obtained frombagasse samples after 48 hours under enzyme action [1]
Bagasse samples Enzymatic hydrolysis (48 hours)
Total hydrolysis yield, %
Untreated bagasse 22.0 ± 0.3
H2SO41% 30.3 ± 0.3
NaOH 0.25% 47.1 ± 0.9
NaOH 0.5% 79 ± 2
NaOH 1% 100 ± 7
NaOH 2% 97 ± 2
NaOH 3% 96 ± 10
NaOH 4% 97 ± 20
Hydrolysis yield values are expressed as an average (± standard deviation) ofduplicate determination. All the samples treated with NaOH were previouslytreated with 1% H2SO4.
Tsuchida et al. Biotechnology for Biofuels 2014, 7:127 Page 11 of 13http://www.biotechnologyforbiofuels.com/content/7/1/127
of enzyme action obtained in bagasse samples treatedunder different conditions. The hydrolysis yield in eachcase is obtained by dividing the total amount of glucoseliberated from a sample by its total cellulose content. Ascan be observed on Table 2 and in Figure 9, the hydrolysisefficiency is highly improved as the samples undergo thetwo-step pretreatment. While only 22% of the celluloseamount was converted to glucose in untreated bagasse,hydrolysis yields above 95% were obtained in samplestreated under NaOH concentrations of 1% or higher.These results confirm the correlation between the pre-treatment efficiency, the water interaction with the cellwall and the enzyme accessibility to these substrates.Since T2M times are directly related with the generalphenomenon involving improved interactions betweenwater molecules and the cell wall components and theirincreased wettability, it is tempting to speculate that thesame method can be applied for semiquantitative evalu-ations of the efficiency of enzymatic hydrolysis of thebiomass samples subjected to other types of pretreatments.This might allow for the use of the inexpensive and non-destructive low-field 1H NMR relaxometry technique forsemiquantitative predictions of the enzymatic hydrolysisefficiency of biomass samples.The two first points in each curve of Figure 9 shows
the distinctive behavior of the T2M values from untreatedbagasse and from bagasse treated with H2SO4 whencompared to the other samples that underwent alkalinepretreatments. This is probably associated with the dif-ferent morphological characteristics of these samples.SEM images presented in Figure 1 show that these twosamples are formed by two main features: bagasse fibersand pith residues. However, the samples that underwentthe alkaline pretreatment contain practically only bagassefibers. This fact indicates that the distinct behavior ofthese two samples might be related to the presence ofresidual material besides the lumen structures.
ConclusionsMorphological changes of sugarcane bagasse samples,promoted by two-step pretreatments, change the waterinteraction and accessibility to different sites of the sug-arcane cell wall. Based on the information obtained fromSEM and NMR, we were able to identify water mole-cules located in the lumens core (high mobility) and inthe internal part of the cell walls (low mobility).Pretreatments also change the ratio of hydrophilic to
hydrophobic components of the cell wall matrix, thusmodifying interactions between water molecules and thedifferent binding sites of the sample. The samples inwhich the water interaction with the bagasse cell wall isfacilitated by the pretreatment are also the ones thatpresent improved enzymatic hydrolysis yields. Our resultsshow that non-destructive 1H NMR relaxometry might beused as an inexpensive and practical method for semi-quantitative determination of the efficiency of enzymatichydrolysis of plant biomass samples.
MethodsMaterialsGrounded sugarcane bagasse was kindly provided by theCosan Group (Ibaté, São Paulo, Brazil), and used as re-ceived, without further washing or milling. During theindustrial milling process, bagasse was washed with hotwater at 70°C to remove soluble sugars. Prior to pretreat-ments, grounded bagasse was passed through a 9.8 mmsieve to limit the maximum particle size and then dried ina convection oven at 60°C for 24 hours. Sulfuric acid andsodium hydroxide for sample pretreatments were pur-chased from JT Baker (Mexico City, Mexico) and fromMallinckrodt Chemicals (Linköping, Sweden), respectively,and were used as received.
Bagasse pretreatmentsSugarcane bagasse was initially hydrolyzed with dilutedH2SO4 (1% v/v in water) for 40 minutes at 120°C. Thepressure was kept at 1.05 bar and a 1:10 solid to liquidratio (gram of bagasse/ml of solution) was used. Bagassesolid fraction was separated from the hydrolysate byfiltration and abundantly washed with tap water toeliminate acid excess before oven drying at 60°C for24 hours. A second pretreatment step for bagasse delig-nification followed, using one of the following NaOHsolutions with increasing concentrations (0.25, 0.5, 1.0,2.0, 3.0 or 4.0% w/v), at 120°C for 40 minutes. Six pre-treated bagasse samples were then obtained by filtra-tion; washing until neutral pH is reached and drying ofthe solid in oven for 24 hours at 60°C. Enzymatic hydroly-sis assays were carried out on pretreated bagasse samples,as described in [1].

Tsuchida et al. Biotechnology for Biofuels 2014, 7:127 Page 12 of 13http://www.biotechnologyforbiofuels.com/content/7/1/127
Chemical compositionThe percentage amounts of cellulose, hemicellulose andlignin in bagasse were determined as described in detailelsewhere [1]. Raw bagasse was previously extracted in95% ethanol and all the samples were milled until ableto pass through a 2 mm sieve before undergoing totalacid hydrolysis, using a 72% (v/v) H2SO4 solution. Solidfraction was separated from the hydrolysate by filtrationthough quantitative filter paper, rinsed until neutral pHand then oven dried at 105°C to a constant weight(containing insoluble lignin and ash). Ash content wasthen determined by calcination in a muffle (EDG 10PS,São Carlos-SP, Brazil) at 800°C for 2 hours, and used todetermine the insoluble lignin amount by subtraction.Soluble lignin was determined by absorbance measure-
ments (280 nm) using a UV-VIS spectrophotometer (modelLambda 25, Perkin Elmer, Waltham, MA, USA), and takinginto account the interfering absorption of furfural andhydroxymethylfurfural, as previously described [43].The hydrolysate was also analyzed by HPLC to determine
sugars, organic acids, furfural and hydroxymethylfurfural.HPLC determinations were performed in a Shimadzu LC-10 AD chromatograph (Shimadzu, Kyoto, Japan) equippedwith refractive index and UV-VIS detectors (ShimadzuSPD-10, Kyoto, Japan). A detailed description of the col-umns, mobile phases and analytical conditions employedcan be found in Rezende et al. [1].
Nuclear magnetic resonance1H NMR relaxation measurements were carried out usinga LapNMR console (Tecmag, Houston, USA) and a per-manent Bruker magnet (Bruker, Billerica, USA) operatingat 0.47 T (20 MHz). Transverse relaxation times (T2) weremeasured using CPMG sequence [44,45], with π/2 radio-frequency (rf) pulses of 6.6 μs, delay between π pulses of60 μs, and recycle delay of 15 seconds. NMR relaxationdata were analyzed by ILT, resulting in a distribution oftransverse relaxation times (T2-distributions). The T2-distributions were analyzed by least-squares fittingusing logarithmic-Gaussian (log-Gaussian) functions, ac-cording to the expression:
F τð Þ ¼ Ae−12 log τ
T2M
� �=σ
� �2
ð1Þ
where A is proportional to the number of water mole-cules, which was used for estimating the total and partialmoisture contents (MC) of bagasse samples, T2M is theaverage transverse relaxation value, and σ is the fullwidth at half maximum of the distribution.
1H NMR spectra were acquired using a Varian UNITYInova spectrometer (Varian, Palo Alto, USA) operatingat 8.22 T (350 MHz) and a 7-mm Jakobsen static probe(Varian, Palo Alto, USA). A single π/2 pulse sequence
was used to obtain the free induction decays (FIDs) andrespective spectra, with rf pulses of about 3.5 μs longand recycle delays of 7 seconds.NMR experiments were carried out along a drying
procedure consisting of submitting the wet samples tosubsequent steps of 5-minutes drying under vacuum at60°C. Samples were weighed before every NMR experi-ment, in order to evaluate hydration levels.
Scanning electron microscopyBagasse morphology was analyzed by SEM before andafter undergoing pretreatments. Samples from surfacesor transversal sections (obtained by fracture in liquidN2) were oven dried and coated with Au in a SCD 050sputter coater (Oerlikon-Balzers, Balzers, Liechtenstein)Sample imaging was carried out using the scanning elec-tron microscopes, models DSM 960 (Zeiss, Oberkochen,Germany) or JSM 5900LV (Jeol, Tokyo, Japan).Sample features such as lumen diameters and cell wall
thickness were manually measured using the programAxio Vision 4.8 (Carl Zeiss, Oberkochen, Germany). Aver-aged values of the lumen diameters were obtained bymeasuring about 350 lumens from different regions ofraw bagasse and treated samples (four images by sample).Since most of the lumens have a distorted circumferentialaspect, two diameters were measured: the maximumand the minimum axis, approximately perpendicular toeach other, so that a mean diameter could be obtainedfor each lumen.
AbbreviationsCPMG: Carr-Purcell-Meiboom-Gill; DSC: Differential scanning calorimetry;FID: Free induction decay; HPLC: High performance liquid chromatography;ILT: Inverse Laplace transform; MC: Moisture contents; NMR: Nuclearmagnetic resonance; SEM: Scanning electron microscopy; T2: Transverserelaxation; T2M: Average transverse relaxation.
Competing interestsThe authors declare that they have no competing interests.
Authors' contributionsAll the authors discussed the sample preparation and experiments to beperformed. CAR and MAL prepared the samples and conducted the biomasspretreatments and determination of their chemical composition. CARperformed the scanning electron microscopy analyses. JET, ROS and MNDEcarried out NMR relaxation and spectroscopy experiments. All the authorsdiscussed the experimental results and took part in the writing ofmanuscript. All authors read and approved the final manuscript.
AcknowledgementsThe authors thank FAPESP and CNPq for the financial support for this workvia grants 2009/54880-6, 2010/11135-6, 2009/18354-8, 2010/08370-3, 2008/56255-9, 2012/22119-7 (FAPESP); grants 482166/2010-0, 472523/2013-9 and490022/2009-0 (CNPq) and Projeto INCT do Bioetanol (CNPq/FAPESP). Theelectron microscopy work has been performed on the JSM-5900LV microscopeat Laboratory of Electron Microscopy (LME) at the National Laboratory ofNanotechnology (LNNano) in Campinas-SP, Brazil.
Author details1Instituto de Física de São Carlos, Universidade de São Paulo, Caixa Postal369, CEP 13560-970, São Carlos, SP, Brazil. 2Current Address: Departamentode Engenharia de Materiais, Universidade Federal de São Carlos, Laboratório
Tsuchida et al. Biotechnology for Biofuels 2014, 7:127 Page 13 of 13http://www.biotechnologyforbiofuels.com/content/7/1/127
de Materiais Vítreos, Rod. Washington Luis, km 235, São Carlos, SP, Brazil.3Current Address: School of Petroleum Engineering, University of New SouthWales, Building H6, Tyree Energy Technologies Building, Sydney, NSW 2052,Australia.
Received: 17 March 2014 Accepted: 19 August 2014
References1. Rezende CA, Lima MA, Maziero P, de Azevedo ER, Garcia W, Polikarpov I:
Chemical and morphological characterization of sugarcane bagassesubmitted to delignification process for enhanced enzymaticdigestibility. Biotechnol Biofuels 2011, 4:1–18.
2. Coletta VC, Rezende CA, da Conceição FR, Polikarpov I, Guimarães FEG:Mapping the lignin distribution in pretreated sugarcane bagasse byconfocal and fluorescence lifetime imaging microscopy. BiotechnolBiofuels 2013, 6:43.
3. Report on sugarcane production from Sugarcane Industry Association(UNICA - Brazil). [http://www.unicadata.com.br/historico-de-producao-e-moagem.php?idMn=32&tipoHistorico=4&acao=visualizar&idTabela=1588&safra=2013%2F2014&estado=RS%2CSC%2CPR%2CSP%2CRJ%2CMG%2CES%2CMS%2CMT%2CGO%2CDF%2CBA%2CSE%2CAL%2CPE%2CPB%2CRN%2CCE%2CPI%2CMA%2CTO%2CPA%2CAP%2CRO%2CAM%2CAC%2CRR]
4. Laser M, Schulman D, Allen SG, Lichwa J, Antal MJ, Lynd LR: A comparisonof liquid hot water and steam pretreatments of sugar cane bagasse forbioconversion to ethanol. Bioresour Technol 2002, 81:33–44.
5. Mosier N, Wyman C, Dale B, Elander R, Lee YY, Holtzapple M, Ladisch M:Features of promising technologies for pretreatment of lignocellulosicbiomass. Bioresour Technol 2005, 96:673–86.
6. Chandra R, Ewanick S, Hsiek C, Saddler JN: The characterization ofpretreated lignocellulosic substrates prior to enzymatic hydrolysis, part1: a modified Simons’ staining technique. Biotechnol 2008, 24:1178–1185.
7. Himmel ME, Ding S-Y, Johnson DK, Adney WS, Nimlos MR, Brady JW, FoustTD: Biomass recalcitrance: engineering plants and enzymes for biofuelsproduction. Science 2007, 315:804–7.
8. Taherzadeh MJ, Karimi K: Pretreatment of lignocellulosic wastes toimprove ethanol and biogas production: a review. Int J MolSci 2008,9:1621–51.
9. Lima MA, Lavorente GB, da Silva HK, Bragatto J, Rezende CA, Bernardinelli OD,Deazevedo ER, Gomez LD, McQueen-Mason SJ, Labate CA, Polikarpov I: Effectsof pretreatment on morphology, chemical composition and enzymaticdigestibility of eucalyptus bark: a potentially valuable source of fermentablesugars for biofuel production - part 1. Biotechnol Biofuels 2013, 6:75.
10. Gharpuray MM, Lee YH, Fan LT: Structural modification of lignocellulosicsby pretreatments to enhance enzymatic hydrolysis. Biotechnol Bioeng1983, 25:157–72.
11. Chang V, Holtzapple M: Fundamental factors affecting biomass enzymaticreactivity. Twenty-First Symp Biotechnol 2000, 84–86:5–37.
12. Sasaki M, Adschiri T, Arai K: Fractionation of sugarcane bagasse byhydrothermal treatment. Bioresour Technol 2003, 86:301–4.
13. Gollapalli LE, Dale BE, Rivers DM: Predicting digestibility of ammoniafiber explosion (AFEX)-treated rice straw. Appl Biochem Biotechnol 2002,98–100:23–35.
14. Saka S, Ueno T: Chemical conversion of various celluloses to glucose andits derivatives in supercritical water. Cellulose 1999, 6:177–191.
15. Matsumura Y, Sasaki M: Supercritical water treatment of biomass forenergy and material recovery. Combust Sci Technol 2006, 178:509–536.
16. Zhu JY, Pan XJ, Wang GS, Gleisner R: Sulfite pretreatment (SPORL) forrobust enzymatic saccharification of spruce and red pine. BioresourTechnol 2009, 100:2411–8.
17. Shuai L, Yang Q, Zhu JY, Lu FC, Weimer PJ, Ralph J, Pan XJ: Comparativestudy of SPORL and dilute-acid pretreatments of spruce for cellulosicethanol production. Bioresour Technol 2010, 101:3106–14.
18. Sun R, Lawther JM, Banks WB: Influence of alkaline pre-treatments on thecell wall components of wheat straw. Ind Crops Prod 1995, 4:127–145.
19. Deschamps FC, Ramos LP, Fontana JD: Pretreatment of sugar canebagasse for enhanced ruminal digestion. Appl Biochem Biotechnol 1996,57–58:171–82.
20. Betancur GJV, Pereira N Jr: Sugar cane bagasse as feedstock for secondgeneration ethanol production. Part I: Diluted acid pretreatmentoptimization. Electron J Biotechnol 2010, 13:1–9.
21. Lafitte-Trouqué S, Forster CF: The use of ultrasound and gamma-irradiationas pre-treatments for the anaerobic digestion of waste activated sludge atmesophilic and thermophilic temperatures. Bioresour Technol 2002, 84:113–8.
22. Heiss-Blanquet S, Zheng D, Lopes Ferreira N, Lapierre C, Baumberger S:Effect of pretreatment and enzymatic hydrolysis of wheat straw on cellwall composition, hydrophobicity and cellulase adsorption. BioresourTechnol 2011, 102:5938–46.
23. Donohoe BS, Decker SR, Tucker MP, Himmel ME, Vinzant TB: Visualizinglignin coalescence and migration through maize cell walls followingthermochemical pretreatment. Biotechnol Bioeng 2008, 101:913–25.
24. Selig M, Viamajala S: Deposition of lignin droplets produced during diluteacid pretreatment of maize stems retards enzymatic hydrolysis ofcellulose. Biotechnol Prog 2007, 23:1333–1339.
25. Koo B-W, Min B-C, Gwak K-S, Lee S-M, Choi J-W, Yeo H, Choi I-G: Structuralchanges in lignin during organosolv pretreatment of Liriodendron tulipiferaand the effect on enzymatic hydrolysis. Biomass Bioenergy 2012, 42:24–32.
26. Tanaka M, Ikesaka M, Matsuno R, Converse AO: Effect of pore size insubstrate and diffusion of enzyme on hydrolysis of cellulosic materialswith cellulases. Biotechnol Bioeng 1988, 32:698–706.
27. Foston M, Ragauskas AJ: Changes in the structure of the cellulose fiberwall during dilute acid pretreatment in populus studied by 1 H and 2 HNMR. Energy Fuel 2010, 24:5677–5685.
28. Maloney T, Paulapuro H, Stenius P: Hydration and swelling of pulp fibersmeasured with differential scanning calorimetry. Nord Pulp Pap Res J1998, 13:31–36.
29. Felby C, Thygesen LG, Kristensen JB, Jørgensen H, Elder T: Cellulose–waterinteractions during enzymatic hydrolysis as studied by time domainNMR. Cellulose 2008, 15:703–710.
30. Wang QQ, He Z, Zhu Z, Zhang Y-HP, Ni Y, Luo XL, Zhu JY: Evaluations ofcellulose accessibilities of lignocelluloses by solute exclusion and proteinadsorption techniques. Biotechnol Bioeng 2012, 109:381–9.
31. Suurnäkki A, Li T, Buchert J: Effects of enzymatic removal of xylan andglucomannan on the pore size distribution of kraftfibres. Holzforschung1997, 51:27–33.
32. Woessner DE, Southwestern T, Nell M, Rogers RB: The early days of NMR inthe Southwest. Concepts Magn Reson 2001, 13:77–102.
33. Kleinberg RL: Well logging overview. Concepts Magn Reson 2001, 13:342–343.34. Kleinberg RL, Jackson JA: An introduction to the history of NMR well
logging. Concepts Magn Reson 2001, 13:340–342.35. Souza AP, Leite DCC, Pattathil S, Hahn MG, Buckeridge MS: Composition
and structure of sugarcane cell wall polysaccharides: implications forsecond-generation bioethanol production. Bio Energy Res 2012, 6:564–579.
36. Artschwager E: Morphology of the vegetative organs of sugarcane. J AgricRes 1940, 60:503–549.
37. Brownstein K, Tarr C: Importance of classical diffusion in NMR studies ofwater in biological cells. Phys Rev A 1979, 19:2446–2453.
38. Watson AT, Chang CTP: Characterizing porous media with NMR methods.Transport 1997, 31:343–386.
39. Dunn K, Bergman D, La Torraca G: Nuclear Magnetic Resonance: Petrophysicaland Logging Applications. 32nd edition. New York: Pergamon Press; 2002.
40. Pake G: Nuclear resonance absorption in hydrated crystals: fine structureof the proton line. J Chem Phys 1948, 16:327.
41. Park S, Baker JO, Himmel ME, Parilla PA, Johnson DK: Cellulose crystallinityindex: measurement techniques and their impact on interpretingcellulase performance. Biotechnol Biofuels 2010, 3:10.
42. Carpita NC, Gibeaut DM: Structural models of primary cell walls inflowering plants: consistency of molecular structure with the physicalproperties of the walls during growth. Plant J 1993, 3:1–30.
43. JM Rocha G, Martin C, Soares IB, Maior AM S, Baudel HM, de Abreu CA M:Dilute mixed-acid pretreatment of sugarcane bagasse for ethanolproduction. Biomass Bioenergy 2011, 35:663–670.
44. Carr HY, Purcell EM: Effects of diffusion on free precession in nuclearmagnetic resonance experiments. Phys Rev 1954, 94:630–638.
45. Meiboom S, Gill D: Modified spin-echo method for measuring nuclearrelaxation times. Rev Sci Instrum 1958, 29:688.
doi:10.1186/s13068-014-0127-5Cite this article as: Tsuchida et al.: Nuclear magnetic resonanceinvestigation of water accessibility in cellulose of pretreated sugarcanebagasse. Biotechnology for Biofuels 2014 7:127.