Embed Size (px)
Citation preview
1
Results of the 72nd Opinion Survey
on the General Public's Views and Behavior
(December 2017 Survey) This is an English translation of the Japanese original released on January 11, 2018.
January 18, 2018
Public Relations Department
Bank of Japan
[Contents] I. Introduction ............................................................................................................................... 1
II. Survey Outline ......................................................................................................................... 1
III. Summary ................................................................................................................................. 2 A. Economic Conditions ............................................................................................................. 2
B. Household Circumstances ...................................................................................................... 6
C. Price Levels ........................................................................................................................... 11
D. Future Land Prices ............................................................................................................... 15
E. Growth Potential of the Japanese Economy ......................................................................... 16
F. Recognition and Credibility of the Bank .............................................................................. 17
IV. Distribution of the Sample by Category ............................................................................. 26
V. Complete Questionnaire and Results ................................................................................... 27
I. Introduction
The Bank of Japan, through public relations activities conducted at its Head Office and branches,
has been seeking to determine the concerns of a broad cross-section of the general public relative
to its policy and operations. An example of such action is the Bank's Opinion Survey on the
General Public's Views and Behavior, conducted since 1993 with a nationwide sample of 4,000
individuals who are at least 20 years of age. This survey is essentially an opinion poll designed to
gain insight into the public's perceptions and actions, and therefore differs in character from the
Bank's Tankan (Short-Term Economic Survey of Enterprises in Japan), which is conducted
separately from this survey.
II. Survey Outline
Survey period From November 10 to December 6, 2017.
Sample size 4,000 people (2,201 people [i.e., 55.0 percent of the overall sample
size] provided valid responses to questions).
Population of the survey Individuals living in Japan who are at least 20 years of age.
Sampling method Stratified two-stage random sampling method.
Survey methodology Questionnaire survey (mail survey method).
2
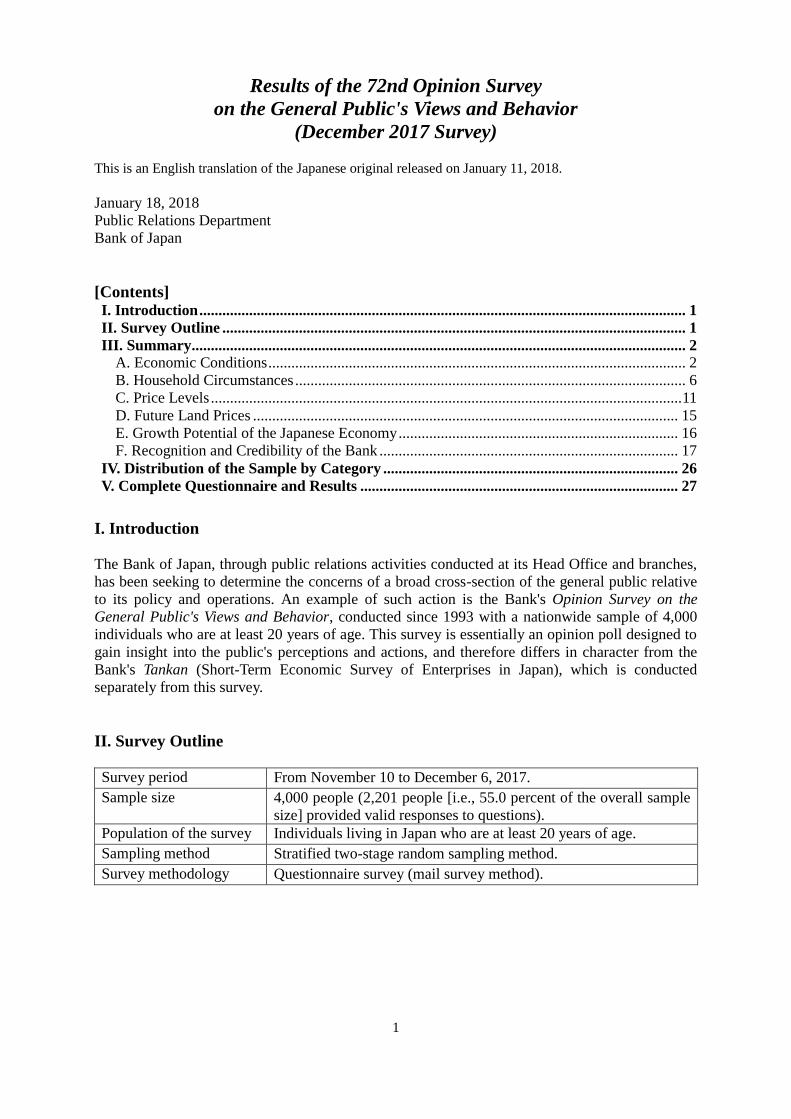
8.3
7.6
6.5
70.9
71.0
70.3
20.2
21.1
22.7
Dec 2017
Sep 2017
Jun 2017
(%)
Have improved Have remained the same Have worsened
III. Summary
A. Economic Conditions
1. Impression of economic conditions
Chart 1 Impression of Economic Conditions (Questions 1, 3, and 4)
(1) Present Compared with One Year Ago
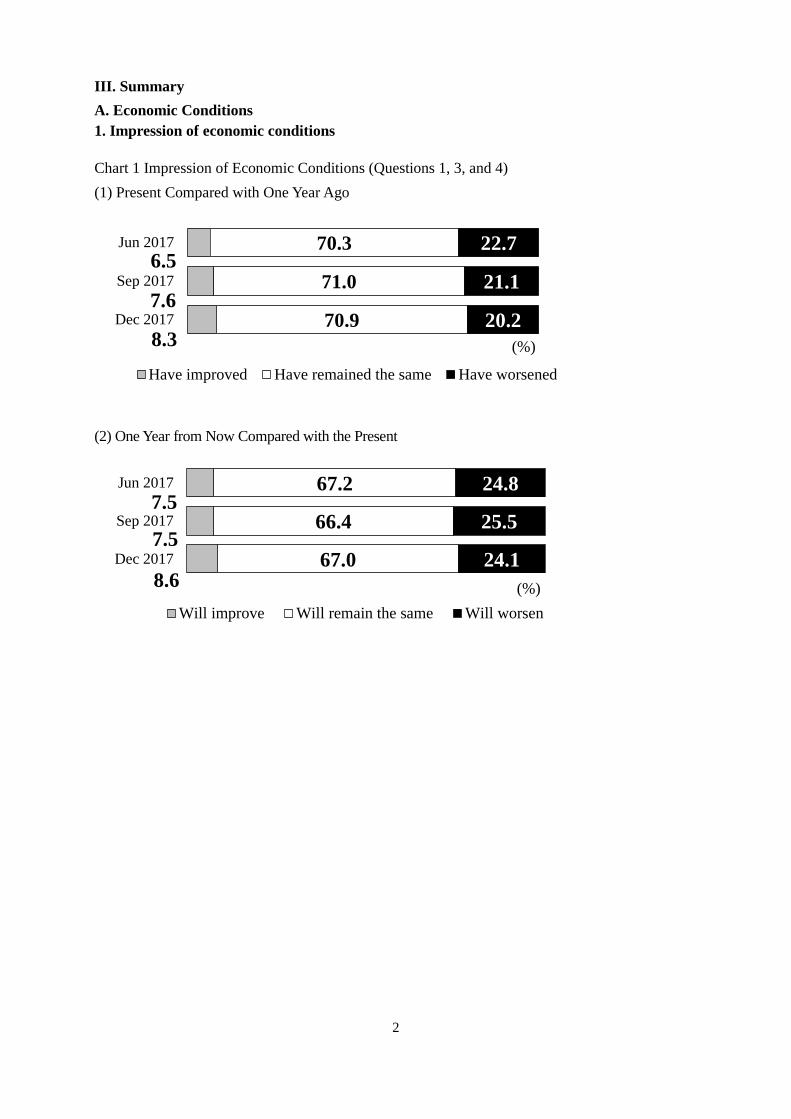
(2) One Year from Now Compared with the Present
8.6
7.5
7.5
67.0
66.4
67.2
24.1
25.5
24.8
Dec 2017
Sep 2017
Jun 2017
(%)
Will improve Will remain the same Will worsen
3
-100
-80
-60
-40
-20
0
20
1 9 9 6 97 98 99 2 0 0 0 01 02 03 04 05 06 07 08 09 10 11 12 13 14 15 16
Percentage points
Present compared with one year ago
Outlook for one year from now
17
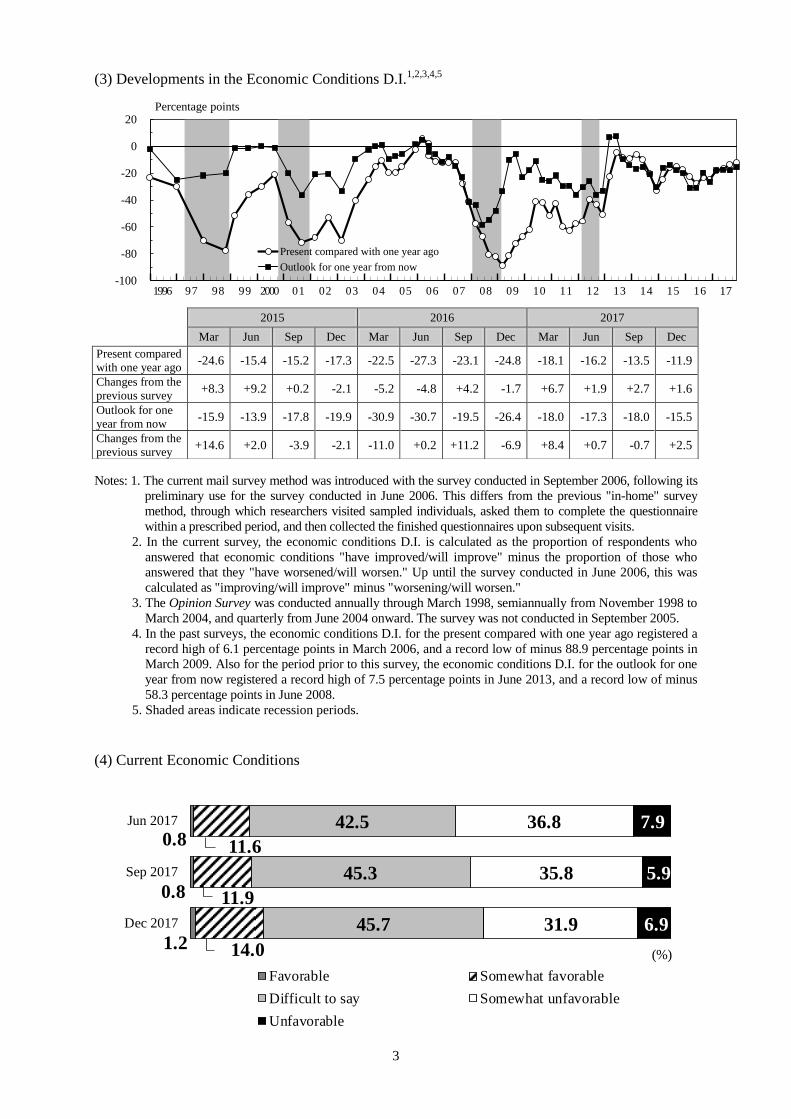
1.2
0.8
0.8
14.0
11.9
11.6
45.7
45.3
42.5
31.9
35.8
36.8
6.9
5.9
7.9
Dec 2017
Sep 2017
Jun 2017
(%)
Favorable Somewhat favorable
Difficult to say Somewhat unfavorable
Unfavorable
(3) Developments in the Economic Conditions D.I.1,2,3,4,5
Notes: 1. The current mail survey method was introduced with the survey conducted in September 2006, following its
preliminary use for the survey conducted in June 2006. This differs from the previous "in-home" survey
method, through which researchers visited sampled individuals, asked them to complete the questionnaire
within a prescribed period, and then collected the finished questionnaires upon subsequent visits.
2. In the current survey, the economic conditions D.I. is calculated as the proportion of respondents who
answered that economic conditions "have improved/will improve" minus the proportion of those who
answered that they "have worsened/will worsen." Up until the survey conducted in June 2006, this was
calculated as "improving/will improve" minus "worsening/will worsen."
3. The Opinion Survey was conducted annually through March 1998, semiannually from November 1998 to
March 2004, and quarterly from June 2004 onward. The survey was not conducted in September 2005.
4. In the past surveys, the economic conditions D.I. for the present compared with one year ago registered a
record high of 6.1 percentage points in March 2006, and a record low of minus 88.9 percentage points in
March 2009. Also for the period prior to this survey, the economic conditions D.I. for the outlook for one
year from now registered a record high of 7.5 percentage points in June 2013, and a record low of minus
58.3 percentage points in June 2008.
5. Shaded areas indicate recession periods.
(4) Current Economic Conditions
2015 2016 2017
Mar Jun Sep Dec Mar Jun Sep Dec Mar Jun Sep Dec
Present compared
with one year ago -24.6 -15.4 -15.2 -17.3 -22.5 -27.3 -23.1 -24.8 -18.1 -16.2 -13.5 -11.9
Changes from the
previous survey +8.3 +9.2 +0.2 -2.1 -5.2 -4.8 +4.2 -1.7 +6.7 +1.9 +2.7 +1.6
Outlook for one
year from now -15.9 -13.9 -17.8 -19.9 -30.9 -30.7 -19.5 -26.4 -18.0 -17.3 -18.0 -15.5
Changes from the
previous survey +14.6 +2.0 -3.9 -2.1 -11.0 +0.2 +11.2 -6.9 +8.4 +0.7 -0.7 +2.5
4
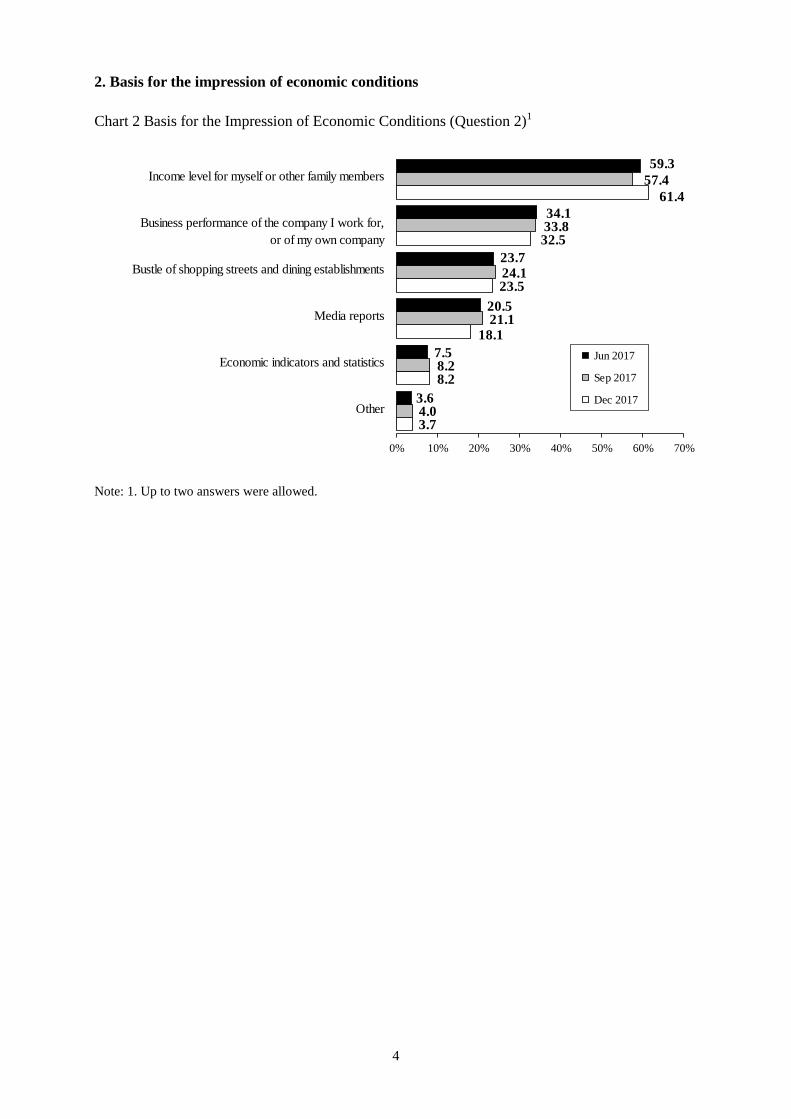
Income level for myself or other family members
Business performance of the company I work for,
or of my own company
Bustle of shopping streets and dining establishments
Media reports
Economic indicators and statistics
Other
3.7
8.2
18.1
23.5
32.5
61.4
4.0
8.2
21.1
24.1
33.8
57.4
3.6
7.5
20.5
23.7
34.1
59.3
0% 10% 20% 30% 40% 50% 60% 70%
Jun 2017
Sep 2017
Dec 2017
2. Basis for the impression of economic conditions
Chart 2 Basis for the Impression of Economic Conditions (Question 2)1
Note: 1. Up to two answers were allowed.

5
53.7
52.8
55.0
31.5
33.6
31.3
12.3
11.5
10.3
Dec 2017
Sep 2017
Jun 2017
(%)
Too low Appropriate Too high
-44.7
-41.3
-41.4
-100
-80
-60
-40
-20
0
2 0 0 6 07 08 09 10 11 12 13 14 15 16
Percentage points
17
3. Perception of the interest rate level
Chart 3 Perception of the Interest Rate Level (Question 5) Note: This question has been asked since the September 2006 survey.
(1) Perception of the Interest Rate Level
(2) Developments in the Interest Rate Level D.I.1,2,3
Notes: 1. The interest rate level D.I. is calculated as the proportion of respondents who answered that the interest
rate level was "too high" minus the proportion of those who answered that it was "too low."
2. In the past surveys, the interest rate level D.I. registered a record high of minus 27.9 percentage points
in March 2009, and a record low of minus 58.0 percentage points in March 2016.
3. Shaded areas indicate recession periods.
6
-100
-80
-60
-40
-20
0
20
1 9 9 6 97 98 99 2 0 0 0 01 02 03 04 05 06 07 08 09 10 11 12 13 14 15 16
Percentage points
The household circumstances D.I.The present economic conditions D.I. compared with one year ago
17
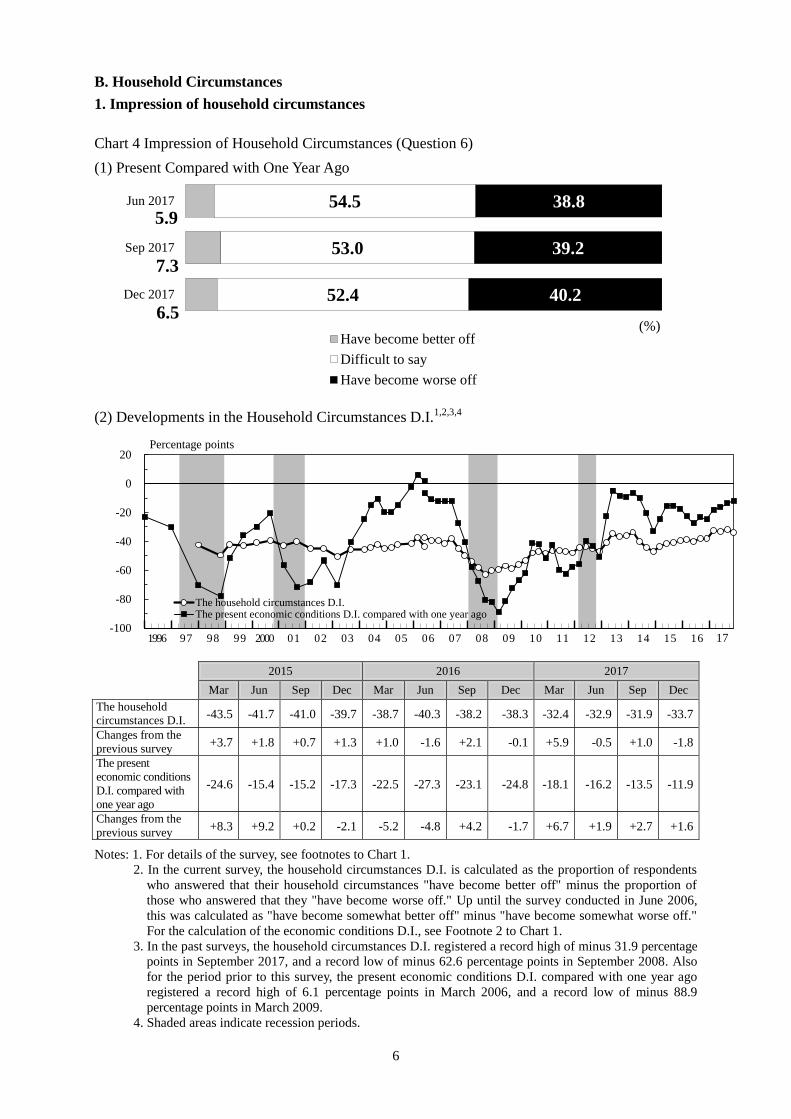
6.5
7.3
5.9
52.4
53.0
54.5
40.2
39.2
38.8
Dec 2017
Sep 2017
Jun 2017
(%)Have become better off
Difficult to say
Have become worse off
B. Household Circumstances
1. Impression of household circumstances
Chart 4 Impression of Household Circumstances (Question 6)
(1) Present Compared with One Year Ago
(2) Developments in the Household Circumstances D.I.1,2,3,4
Notes: 1. For details of the survey, see footnotes to Chart 1.
2. In the current survey, the household circumstances D.I. is calculated as the proportion of respondents
who answered that their household circumstances "have become better off" minus the proportion of
those who answered that they "have become worse off." Up until the survey conducted in June 2006,
this was calculated as "have become somewhat better off" minus "have become somewhat worse off."
For the calculation of the economic conditions D.I., see Footnote 2 to Chart 1.
3. In the past surveys, the household circumstances D.I. registered a record high of minus 31.9 percentage
points in September 2017, and a record low of minus 62.6 percentage points in September 2008. Also
for the period prior to this survey, the present economic conditions D.I. compared with one year ago
registered a record high of 6.1 percentage points in March 2006, and a record low of minus 88.9
percentage points in March 2009.
4. Shaded areas indicate recession periods.
2015 2016 2017
Mar Jun Sep Dec Mar Jun Sep Dec Mar Jun Sep Dec
The household
circumstances D.I. -43.5 -41.7 -41.0 -39.7 -38.7 -40.3 -38.2 -38.3 -32.4 -32.9 -31.9 -33.7
Changes from the
previous survey +3.7 +1.8 +0.7 +1.3 +1.0 -1.6 +2.1 -0.1 +5.9 -0.5 +1.0 -1.8
The present
economic conditions
D.I. compared with
one year ago
-24.6 -15.4 -15.2 -17.3 -22.5 -27.3 -23.1 -24.8 -18.1 -16.2 -13.5 -11.9
Changes from the
previous survey +8.3 +9.2 +0.2 -2.1 -5.2 -4.8 +4.2 -1.7 +6.7 +1.9 +2.7 +1.6
7
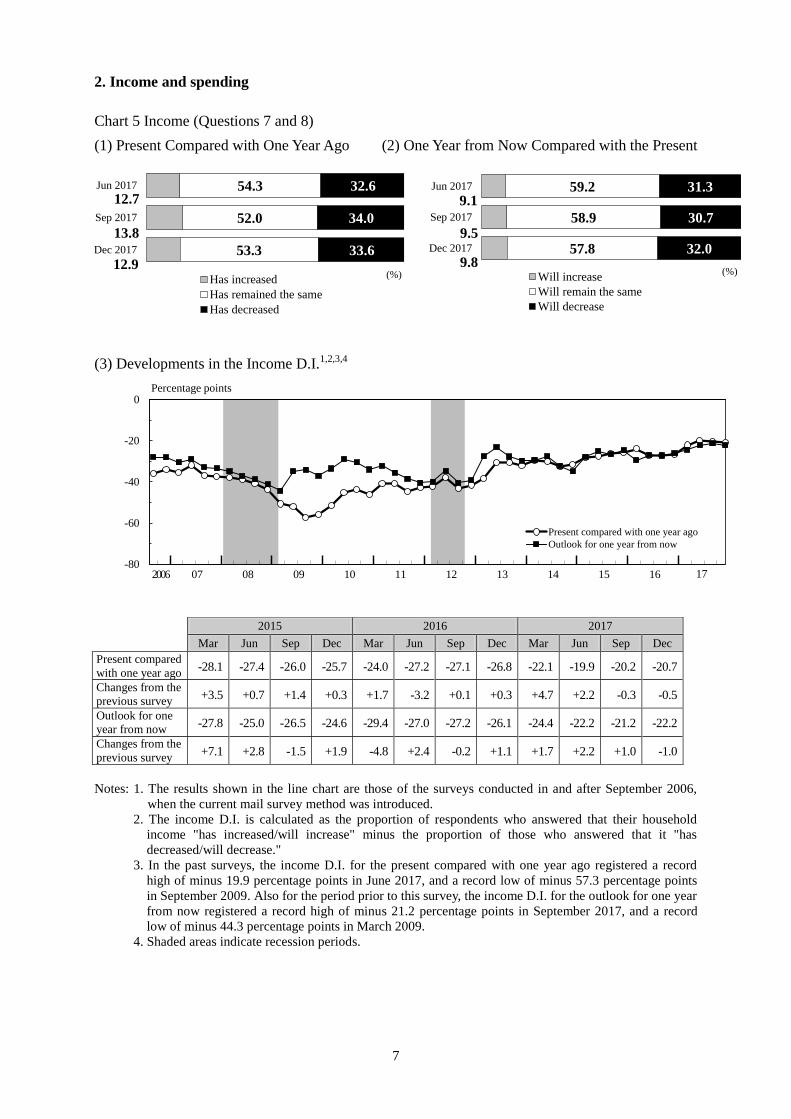
12.9
13.8
12.7
53.3
52.0
54.3
33.6
34.0
32.6
Dec 2017
Sep 2017
Jun 2017
(%)Has increased
Has remained the same
Has decreased
9.8
9.5
9.1
57.8
58.9
59.2
32.0
30.7
31.3
Dec 2017
Sep 2017
Jun 2017
(%)Will increase
Will remain the same
Will decrease
-80
-60
-40
-20
0
2 0 0 6 07 08 09 10 11 12 13 14 15 16
Percentage points
Present compared with one year ago
Outlook for one year from now
17
2. Income and spending
Chart 5 Income (Questions 7 and 8)
(1) Present Compared with One Year Ago
(2) One Year from Now Compared with the Present
(3) Developments in the Income D.I.1,2,3,4
Notes: 1. The results shown in the line chart are those of the surveys conducted in and after September 2006,
when the current mail survey method was introduced.
2. The income D.I. is calculated as the proportion of respondents who answered that their household
income "has increased/will increase" minus the proportion of those who answered that it "has
decreased/will decrease."
3. In the past surveys, the income D.I. for the present compared with one year ago registered a record
high of minus 19.9 percentage points in June 2017, and a record low of minus 57.3 percentage points
in September 2009. Also for the period prior to this survey, the income D.I. for the outlook for one year
from now registered a record high of minus 21.2 percentage points in September 2017, and a record
low of minus 44.3 percentage points in March 2009.
4. Shaded areas indicate recession periods.
2015 2016 2017
Mar Jun Sep Dec Mar Jun Sep Dec Mar Jun Sep Dec
Present compared
with one year ago -28.1 -27.4 -26.0 -25.7 -24.0 -27.2 -27.1 -26.8 -22.1 -19.9 -20.2 -20.7
Changes from the
previous survey +3.5 +0.7 +1.4 +0.3 +1.7 -3.2 +0.1 +0.3 +4.7 +2.2 -0.3 -0.5
Outlook for one
year from now -27.8 -25.0 -26.5 -24.6 -29.4 -27.0 -27.2 -26.1 -24.4 -22.2 -21.2 -22.2
Changes from the
previous survey +7.1 +2.8 -1.5 +1.9 -4.8 +2.4 -0.2 +1.1 +1.7 +2.2 +1.0 -1.0
8
41.5
38.5
37.9
42.0
44.8
43.8
15.7
15.7
17.5
Dec 2017
Sep 2017
Jun 2017
(%)Has increased
Has neither increased nor decreased
Has decreased
7.4
7.5
6.6
49.8
49.5
49.1
41.8
41.0
41.2
Dec 2017
Sep 2017
Jun 2017
(%)Will increase
Will neither increase nor decrease
Will decrease
-80
-60
-40
-20
0
20
40
2 0 0 6 07 08 09 10 11 12 13 14 15 16
Percentage points
Present compared with one year ago
Outlook for one year from now
17
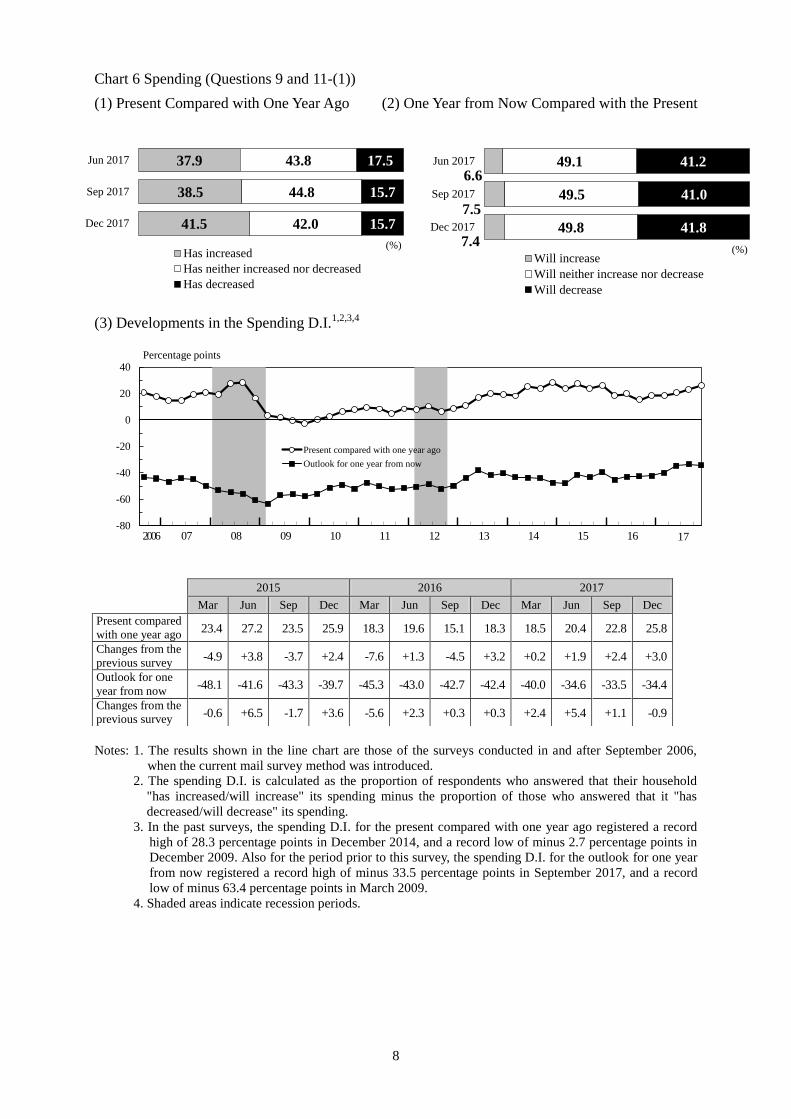
Chart 6 Spending (Questions 9 and 11-(1))
(1) Present Compared with One Year Ago
(2) One Year from Now Compared with the Present
(3) Developments in the Spending D.I.1,2,3,4
Notes: 1. The results shown in the line chart are those of the surveys conducted in and after September 2006,
when the current mail survey method was introduced.
2. The spending D.I. is calculated as the proportion of respondents who answered that their household
"has increased/will increase" its spending minus the proportion of those who answered that it "has
decreased/will decrease" its spending.
3. In the past surveys, the spending D.I. for the present compared with one year ago registered a record
high of 28.3 percentage points in December 2014, and a record low of minus 2.7 percentage points in
December 2009. Also for the period prior to this survey, the spending D.I. for the outlook for one year
from now registered a record high of minus 33.5 percentage points in September 2017, and a record
low of minus 63.4 percentage points in March 2009.
4. Shaded areas indicate recession periods.
2015 2016 2017
Mar Jun Sep Dec Mar Jun Sep Dec Mar Jun Sep Dec
Present compared
with one year ago 23.4 27.2 23.5 25.9 18.3 19.6 15.1 18.3 18.5 20.4 22.8 25.8
Changes from the
previous survey -4.9 +3.8 -3.7 +2.4 -7.6 +1.3 -4.5 +3.2 +0.2 +1.9 +2.4 +3.0
Outlook for one
year from now -48.1 -41.6 -43.3 -39.7 -45.3 -43.0 -42.7 -42.4 -40.0 -34.6 -33.5 -34.4
Changes from the
previous survey -0.6 +6.5 -1.7 +3.6 -5.6 +2.3 +0.3 +0.3 +2.4 +5.4 +1.1 -0.9

9
Whether there are appealing goods and services
An increase or decrease in my household's income
Future developments in prices
An increase or decrease in leisure time and holidays
An increase or decrease in the value of my household's assets
such as savings, stocks, and real estate
Progress in loan repayments
Other5.7
15.9
16.2
20.6
25.4
45.8
57.2
5.6
16.4
15.9
18.6
25.8
40.1
57.5
4.8
14.1
16.3
18.7
24.8
45.0
55.3
0% 10% 20% 30% 40% 50% 60% 70% 80%
Jun 2017
Sep 2017
Dec 2017
Functionality
Wholesomeness
After-sales service
Design
Environmental and social friendliness
Curiosity
Originality/Innovation
Brand reputation
Trend
Other
Durability
Reliability
Low price
Safety
0.2
0.6
2.3
2.5
3.7
7.0
7.7
17.5
20.4
31.9
37.2
40.3
45.7
52.4
0.5
0.7
1.8
2.4
3.5
7.8
7.7
15.9
17.9
30.8
38.8
39.0
47.8
52.1
0.4
0.7
2.0
2.3
3.9
6.8
8.1
16.8
16.9
30.3
37.5
40.2
46.0
51.6
0% 10% 20% 30% 40% 50% 60% 70% 80%
Jun 2017
Sep 2017
Dec 2017
Chart 7 Major Factor(s) to Be Considered When Making Spending Decisions for the Next Twelve
Months (Question 11-(2))1
Chart 8 Major Factor(s) in the Choice of Goods and Services on Which to Spend for the Next
Twelve Months (Question 11-(3))2
Notes: 1. Multiple answers were allowed.
2. Up to three answers were allowed.
10
19.6
23.2
21.7
50.4
50.4
49.9
30.0
26.1
28.3
Dec 2017
Sep 2017
Jun 2017
(%)
Not particularly Slightly Quite
-6.6
-2.9
-10.4
-80
-60
-40
-20
0
20
2 0 0 6 07 08 09 10 11 12 13 14 15 16
Percentage points
17
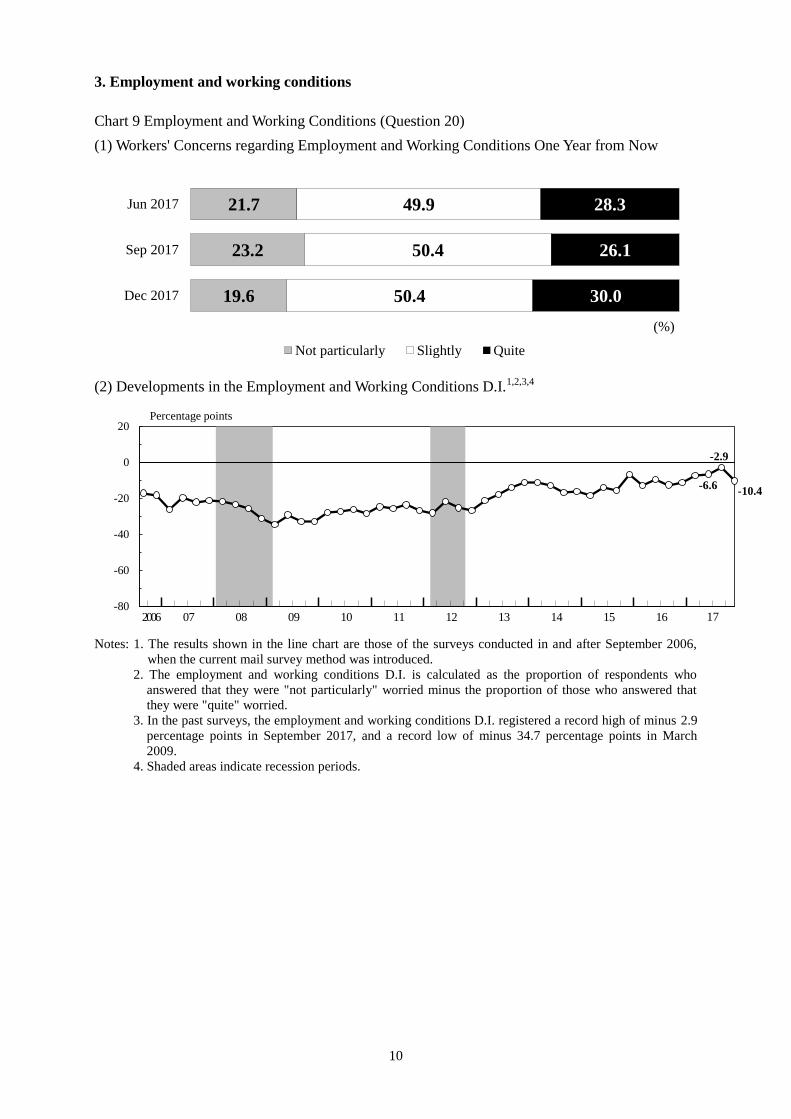
3. Employment and working conditions
Chart 9 Employment and Working Conditions (Question 20)
(1) Workers' Concerns regarding Employment and Working Conditions One Year from Now
(2) Developments in the Employment and Working Conditions D.I.1,2,3,4
Notes: 1. The results shown in the line chart are those of the surveys conducted in and after September 2006,
when the current mail survey method was introduced.
2. The employment and working conditions D.I. is calculated as the proportion of respondents who
answered that they were "not particularly" worried minus the proportion of those who answered that
they were "quite" worried.
3. In the past surveys, the employment and working conditions D.I. registered a record high of minus 2.9
percentage points in September 2017, and a record low of minus 34.7 percentage points in March
2009.
4. Shaded areas indicate recession periods.
11
0.7
0.7
0.3
26.2
18.2 28.8
18.6
6.4
-5.1% and under
-2.1% to -5.0%
-0.1% to -2.0%
0%
0.1% to 2.0%
2.1% to 5.0%
5.1% to 10.0%
10.1% and over
(0.6)
(16.9)
(1.2)
(0.8)
(29.1)
(17.9)(27.6)
(5.9)
7.6
7.8
9.8
59.5
55.4
57.6
30.0
33.1
29.6
2.2
2.8
2.0
0.1
0.3
0.3
Dec 2017
Sep 2017
Jun 2017
(%)Have gone up significantly
Have gone up slightly
Have remained almost unchanged
Have gone down slightly
Have gone down significantly
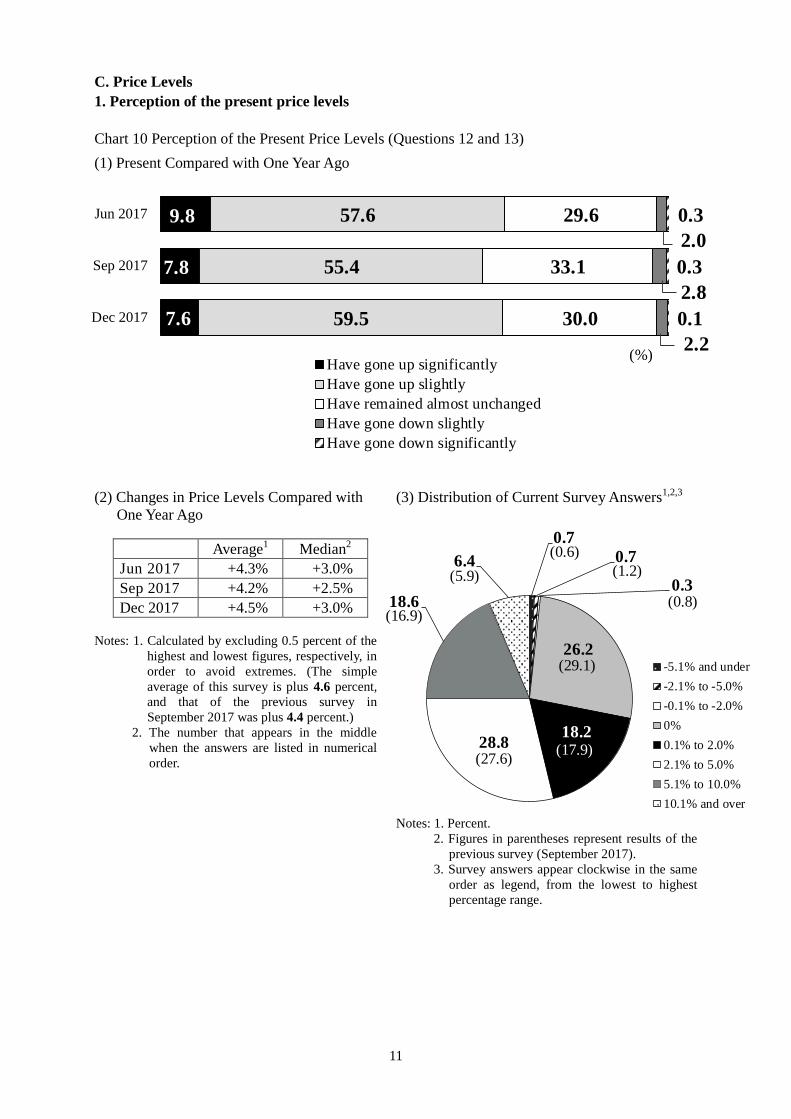
C. Price Levels
1. Perception of the present price levels
Chart 10 Perception of the Present Price Levels (Questions 12 and 13)
(1) Present Compared with One Year Ago
(2) Changes in Price Levels Compared with
One Year Ago
Average1 Median2
Jun 2017 +4.3% +3.0%
Sep 2017 +4.2% +2.5%
Dec 2017 +4.5% +3.0%
Notes: 1. Calculated by excluding 0.5 percent of the
highest and lowest figures, respectively, in
order to avoid extremes. (The simple
average of this survey is plus 4.6 percent,
and that of the previous survey in
September 2017 was plus 4.4 percent.)
2. The number that appears in the middle
when the answers are listed in numerical
order.
(3) Distribution of Current Survey Answers1,2,3
Notes: 1. Percent.
2. Figures in parentheses represent results of the
previous survey (September 2017).
3. Survey answers appear clockwise in the same
order as legend, from the lowest to highest
percentage range.
12
0.4
0.6
0.7
22.0
24.1 30.6
16.1
5.5
-5.1% and under
-2.1% to -5.0%
-0.1% to -2.0%
0%
0.1% to 2.0%
2.1% to 5.0%
5.1% to 10.0%
10.1% and over
(0.4)
(13.5)
(0.5)
(0.9)
(26.1)
(25.2)(28.5)
(4.9)
8.4
6.2
7.7
67.2
64.2
67.7
21.6
26.7
21.6
1.8
1.7
2.3
0.1
0.2
0.1
Dec 2017
Sep 2017
Jun 2017
(%)Will go up significantly
Will go up slightly
Will remain almost unchanged
Will go down slightly
Will go down significantly
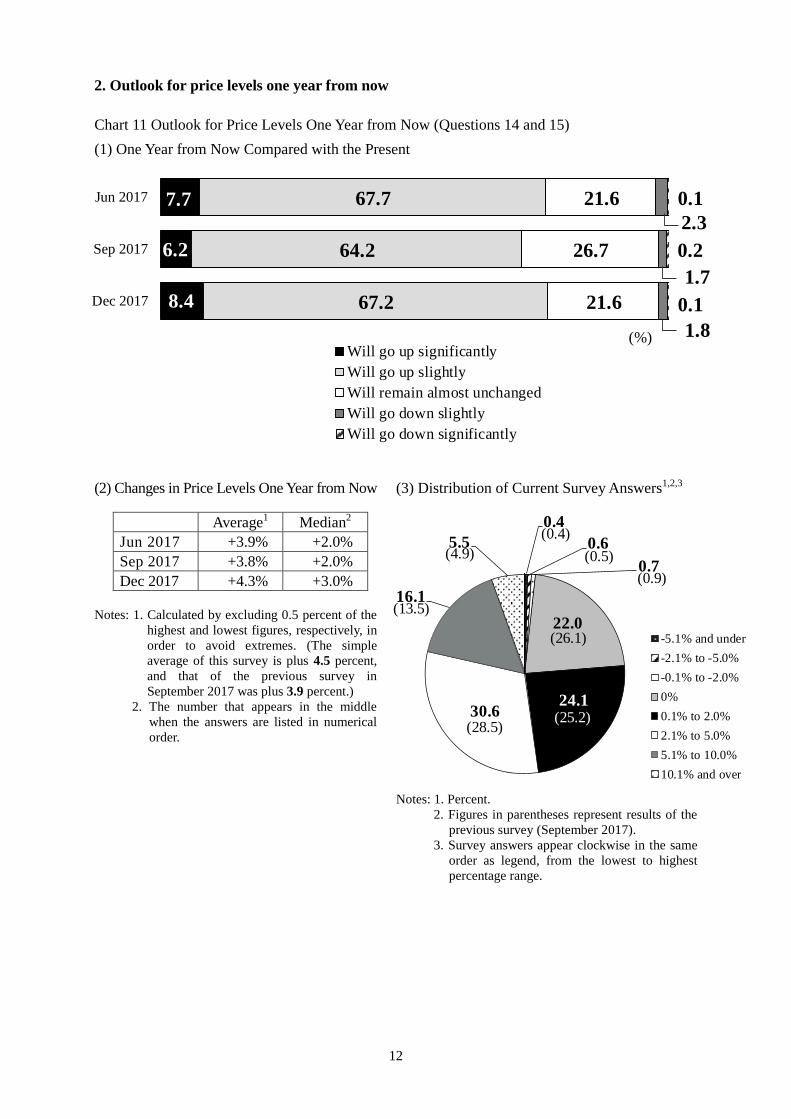
2. Outlook for price levels one year from now
Chart 11 Outlook for Price Levels One Year from Now (Questions 14 and 15)
(1) One Year from Now Compared with the Present
(2) Changes in Price Levels One Year from Now
Average1 Median2
Jun 2017 +3.9% +2.0%
Sep 2017 +3.8% +2.0%
Dec 2017 +4.3% +3.0%
Notes: 1. Calculated by excluding 0.5 percent of the
highest and lowest figures, respectively, in
order to avoid extremes. (The simple
average of this survey is plus 4.5 percent,
and that of the previous survey in
September 2017 was plus 3.9 percent.)
2. The number that appears in the middle
when the answers are listed in numerical
order.
(3) Distribution of Current Survey Answers1,2,3
Notes: 1. Percent.
2. Figures in parentheses represent results of the
previous survey (September 2017).
3. Survey answers appear clockwise in the same
order as legend, from the lowest to highest
percentage range.

13
0.6 1.2
1.5
13.2
37.2 29.1
11.6
5.6
-5.1% and under
-2.1% to -5.0%
-0.1% to -2.0%
0%
0.1% to 2.0%
2.1% to 5.0%
5.1% to 10.0%
10.1% and over
(0.5)
(11.5)
(1.0)
(1.7)
(13.1)
(38.6)(28.5)
(5.1)
23.4
20.7
20.0
58.5
60.7
62.3
13.1
12.7
12.7
3.0
3.2
2.7
0.5
0.6
0.4
Dec 2017
Sep 2017
Jun 2017
(%)Will go up significantly
Will go up slightly
Will remain almost unchanged
Will go down slightly
Will go down significantly
3. Outlook for price levels over the next five years
Chart 12 Outlook for Price Levels over the Next Five Years (Questions 16 and 17)
(1) Outlook for the Next Five Years
(2) Changes in Price Levels per Year on
Average over the Next Five Years
Average1 Median2
Jun 2017 +3.8% +2.0%
Sep 2017 +3.7% +2.0%
Dec 2017 +3.9% +2.0%
Notes: 1. Calculated by excluding 0.5 percent of the
highest and lowest figures, respectively, in
order to avoid extremes. (The simple
average of this survey is plus 4.1 percent,
and that of the previous survey in
September 2017 was plus 4.0 percent.)
2. The number that appears in the middle
when the answers are listed in numerical
order.
(3) Distribution of Current Survey Answers1,2,3
Notes: 1. Percent.
2. Figures in parentheses represent results of the
previous survey (September 2017).
3. Survey answers appear clockwise in the same
order as legend, from the lowest to highest
percentage range.

14
3.2
3.9
4.2
15.5
17.3
16.0
80.8
77.8
78.9
Dec 2017
Sep 2017
Jun 2017
(%)Rather favorable
Difficult to say
Rather unfavorable
45.1
55.4
40.0
21.6
15.4
24.0
31.4
27.7
34.0
Dec 2017
Sep 2017
Jun 2017
(%)Rather favorable
Difficult to say
Rather unfavorable
4. Comments on the rise and decline in prices
Chart 13 Comments on the Price Rise (Question 12-a)
Chart 14 Comments on the Price Decline (Question 12-b)
15
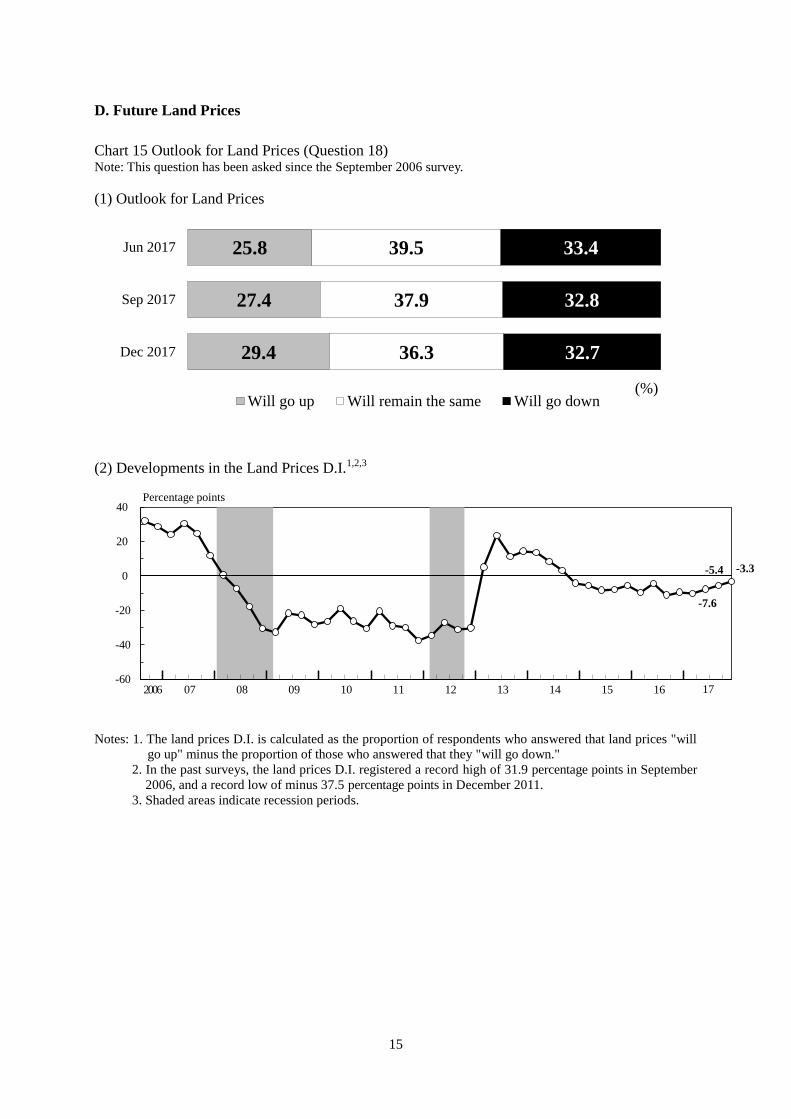
29.4
27.4
25.8
36.3
37.9
39.5
32.7
32.8
33.4
Dec 2017
Sep 2017
Jun 2017
(%)Will go up Will remain the same Will go down
-7.6
-5.4 -3.3
-60
-40
-20
0
20
40
2 0 0 6 07 08 09 10 11 12 13 14 15 16
Percentage points
17
D. Future Land Prices
Chart 15 Outlook for Land Prices (Question 18) Note: This question has been asked since the September 2006 survey.
(1) Outlook for Land Prices
(2) Developments in the Land Prices D.I.1,2,3
Notes: 1. The land prices D.I. is calculated as the proportion of respondents who answered that land prices "will
go up" minus the proportion of those who answered that they "will go down."
2. In the past surveys, the land prices D.I. registered a record high of 31.9 percentage points in September
2006, and a record low of minus 37.5 percentage points in December 2011.
3. Shaded areas indicate recession periods.
16
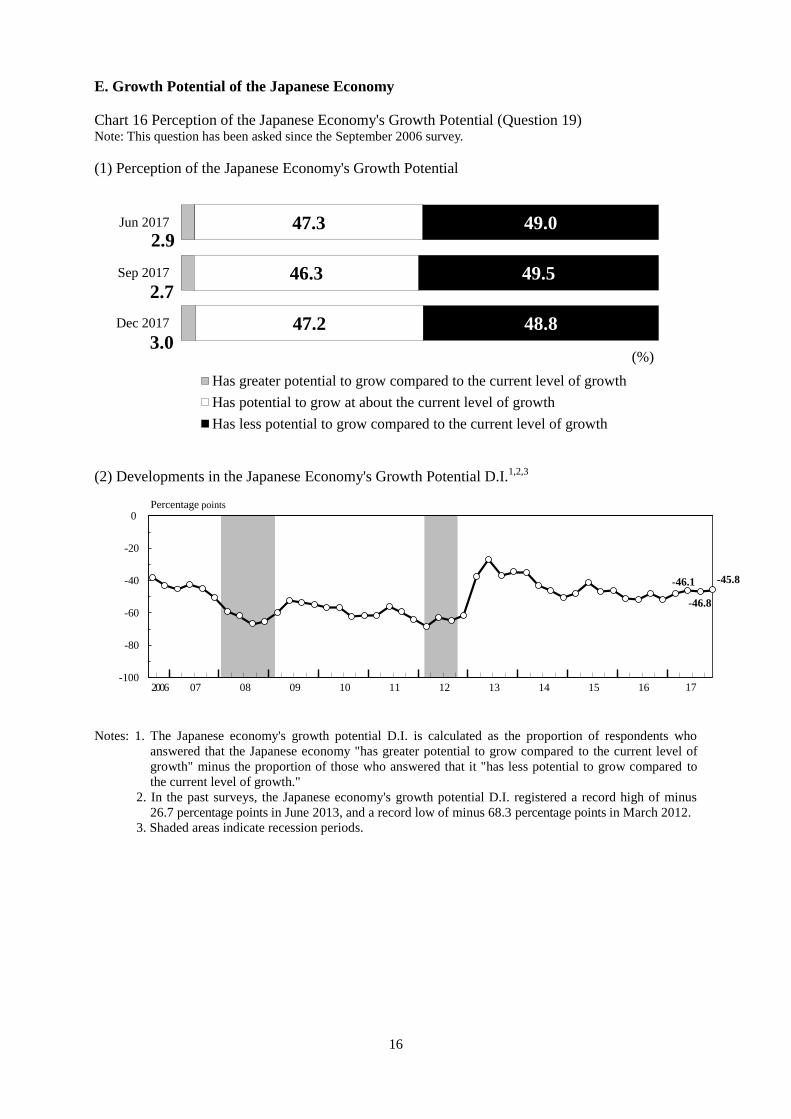
3.0
2.7
2.9
47.2
46.3
47.3
48.8
49.5
49.0
Dec 2017
Sep 2017
Jun 2017
(%)
Has greater potential to grow compared to the current level of growth
Has potential to grow at about the current level of growth
Has less potential to grow compared to the current level of growth
-46.1
-46.8
-45.8
-100
-80
-60
-40
-20
0
2 0 0 6 07 08 09 10 11 12 13 14 15 16
Percentage points
17
E. Growth Potential of the Japanese Economy
Chart 16 Perception of the Japanese Economy's Growth Potential (Question 19) Note: This question has been asked since the September 2006 survey.
(1) Perception of the Japanese Economy's Growth Potential
(2) Developments in the Japanese Economy's Growth Potential D.I.1,2,3
Notes: 1. The Japanese economy's growth potential D.I. is calculated as the proportion of respondents who
answered that the Japanese economy "has greater potential to grow compared to the current level of
growth" minus the proportion of those who answered that it "has less potential to grow compared to
the current level of growth."
2. In the past surveys, the Japanese economy's growth potential D.I. registered a record high of minus
26.7 percentage points in June 2013, and a record low of minus 68.3 percentage points in March 2012.
3. Shaded areas indicate recession periods.

17
0
10
20
30
40
50
60
2006 0 7 0 8 0 9 10 11 12 1 3 1 4 1 5 1 6
%
Know about it
Have read or heard of it, but do not know much about it
Have never heard of it
17
30.5
32.4
31.5
46.0
45.0
47.4
23.3
22.3
20.8
Dec 2017
Jun 2017
Dec 2016
(%)
Know about it
Have read or heard of it, but do not know
much about it
Have never heard of it
F. Recognition and Credibility of the Bank
Note: Asked quarterly through the June 2009 survey, and in principle semiannually thereafter in the June and
December surveys, with the exception of the June 2011 survey.
1. Objectives of the Bank
Chart 17 Recognition of the Bank's Objective to Achieve Price Stability (Questions 21-(1) through 21-(4))
(1) One of the Bank's Objectives Is to Achieve Price Stability1
Note: 1. The results shown in the line chart are those of the surveys conducted in and after September 2006, when
the current mail survey method was introduced.

18
27.3
26.7
27.7
33.0
35.7
31.8
39.4
36.7
40.2
Dec 2017
Sep 2017
Jun 2017
(%)
Know about it
Have read or heard of it, but do not know
much about it
Have never heard of it
41.0
28.1
40.1
36.6
38.4
40.0
22.1
32.1
19.6
Dec 2017
Sep 2017
Jun 2017
(%)
Know about it
Have read or heard of it, but do not know
much about it
Have never heard of it
22.3
16.5
23.3
36.3
33.1
38.7
40.8
49.1
37.7
Dec 2017
Sep 2017
Jun 2017
(%)
Know about it
Have read or heard of it, but do not know
much about it
Have never heard of it
(2) The Bank Has Set the Price Stability Target at 2 Percent in terms of the Year-on-Year Rate of
Change in the CPI
(3) The Bank Has Been Implementing Aggressive Monetary Easing Measures to Achieve the
Price Stability Target of 2 Percent
(4) The Bank Has Been Conducting "Quantitative and Qualitative Monetary Easing (QQE) with
Yield Curve Control"

19
0
10
20
30
40
50
60
2006 0 7 0 8 0 9 1 0 1 1 1 2 13 14 15 1 6
%
Know about it
Have read or heard of it, but do not know much about it
Have never heard of it
1 7
26.1
27.8
28.4
38.9
35.8
39.1
34.6
35.9
32.2
Dec 2017
Jun 2017
Dec 2016
(%)
Know about it
Have read or heard of it, but do not know
much about it
Have never heard of it
Chart 18 Recognition of the Bank's Objective to Ensure the Stability of the Financial System (Question 22)1
Note: 1. The results shown in the line chart are those of the surveys conducted in and after September 2006, when
the current mail survey method was introduced.

20
22.4
24.5
26.2
29.3
30.9
29.5
47.6
44.3
43.9
Dec 2017
Jun 2017
Dec 2016
(%)
Interested
Difficult to say
Not interested
0
10
20
30
40
50
60
70
80
2006 0 7 0 8 0 9 10 11 12 1 3 1 4 1 5 1 6
%
Interested Difficult to say Not interested
1 7
2. Interest in, recognition of, and evaluation of the Bank
Chart 19 Interest in, Recognition of, and Evaluation of the Bank (Questions 23-(1) through 23-(3))
Note: The results shown in the line charts below are those of the surveys conducted in and after September 2006,
when the current mail survey method was introduced.
(1) Interest in the Bank's Activities1,2
Notes: 1. "Interested" comprises the choices "interested" and "somewhat interested" that are found in the questionnaire.
2. "Not interested" comprises "not interested" and "not particularly interested."

21
70.9
71.6
70.7
17.9
19.0
18.5
10.7
9.1
10.3
Dec 2017
Jun 2017
Dec 2016
(%)
Related
Difficult to say
Not related
0
10
20
30
40
50
60
70
80
2006 0 7 0 8 0 9 1 0 11 12 13 1 4 1 5 1 6
%
Related Difficult to say Not related
17
41.3
45.3
42.0
43.7
42.3
43.3
14.3
12.1
14.0
Dec 2017
Jun 2017
Dec 2016
(%)
Significant
Difficult to say
Not significant
0
10
20
30
40
50
60
70
80
2006 0 7 0 8 0 9 1 0 1 1 1 2 1 3 1 4 1 5 1 6
%
Significant Difficult to say Not significant
17
(2) The Bank's Relationship to Our Lives1,2
Notes: 1. "Related" comprises the choices "related" and "somewhat related" that are found in the questionnaire.
2. "Not related" comprises "not related" and "not particularly related."
(3) The Bank's Contribution to Our Lives1,2
Notes: 1. "Significant" comprises the choices "significant" and "somewhat significant" that are found in the questionnaire.
2. "Not significant" comprises "not significant" and "not particularly significant."
22
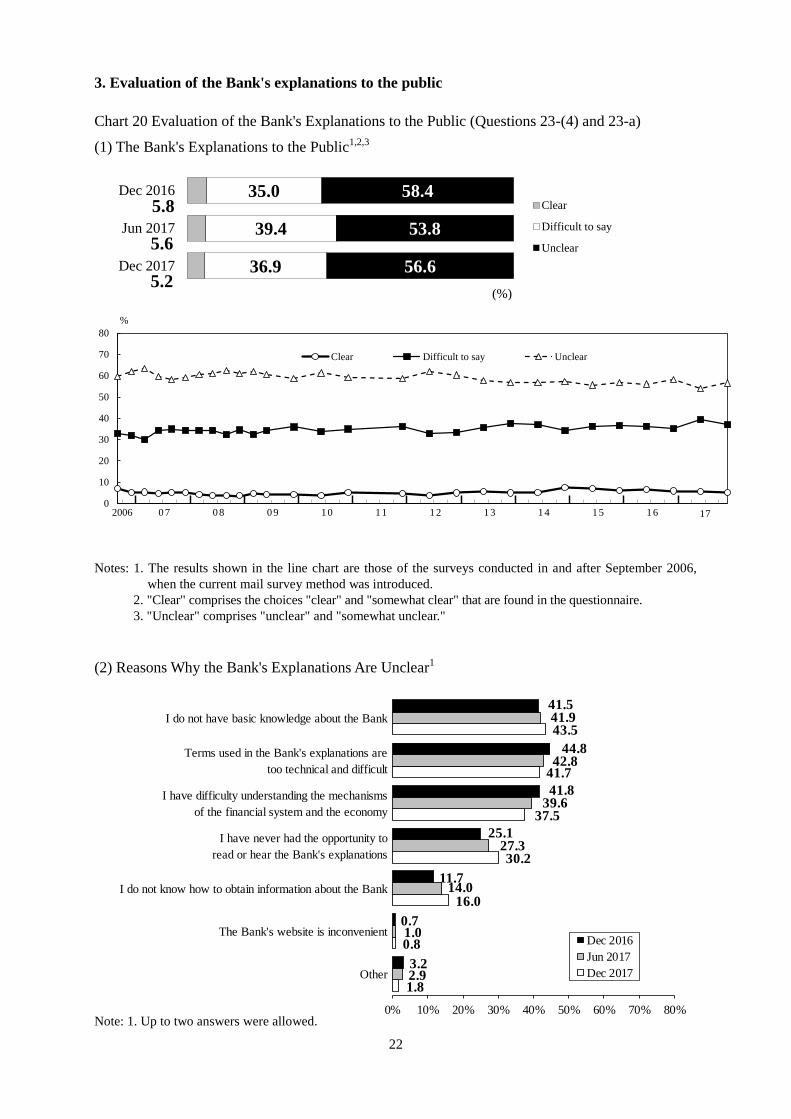
5.2
5.6
5.8
36.9
39.4
35.0
56.6
53.8
58.4
Dec 2017
Jun 2017
Dec 2016
(%)
Clear
Difficult to say
Unclear
0
10
20
30
40
50
60
70
80
2006 0 7 0 8 0 9 10 11 12 1 3 1 4 1 5 1 6
%
Clear Difficult to say Unclear
17
I do not have basic knowledge about the Bank
Terms used in the Bank's explanations are
too technical and difficult
I have difficulty understanding the mechanisms
of the financial system and the economy
I have never had the opportunity to
read or hear the Bank's explanations
I do not know how to obtain information about the Bank
The Bank's website is inconvenient
Other1.8
0.8
16.0
30.2
37.5
41.7
43.5
2.9
1.0
14.0
27.3
39.6
42.8
41.9
3.2
0.7
11.7
25.1
41.8
44.8
41.5
0% 10% 20% 30% 40% 50% 60% 70% 80%
Dec 2016
Jun 2017
Dec 2017
3. Evaluation of the Bank's explanations to the public
Chart 20 Evaluation of the Bank's Explanations to the Public (Questions 23-(4) and 23-a)
(1) The Bank's Explanations to the Public1,2,3
Notes: 1. The results shown in the line chart are those of the surveys conducted in and after September 2006,
when the current mail survey method was introduced.
2. "Clear" comprises the choices "clear" and "somewhat clear" that are found in the questionnaire.
3. "Unclear" comprises "unclear" and "somewhat unclear."
(2) Reasons Why the Bank's Explanations Are Unclear1
Note: 1. Up to two answers were allowed.
23
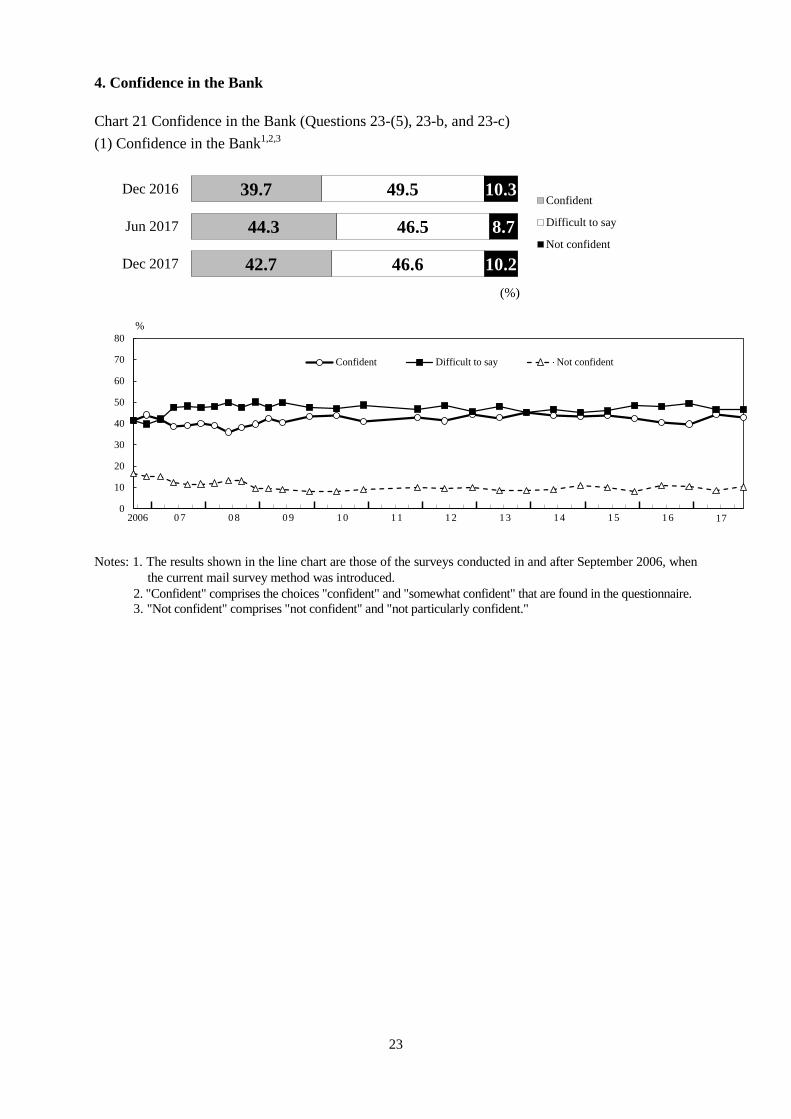
42.7
44.3
39.7
46.6
46.5
49.5
10.2
8.7
10.3
Dec 2017
Jun 2017
Dec 2016
(%)
Confident
Difficult to say
Not confident
0
10
20
30
40
50
60
70
80
2006 0 7 0 8 0 9 10 11 12 1 3 1 4 1 5 1 6
%
Confident Difficult to say Not confident
17
4. Confidence in the Bank
Chart 21 Confidence in the Bank (Questions 23-(5), 23-b, and 23-c)
(1) Confidence in the Bank1,2,3
Notes: 1. The results shown in the line chart are those of the surveys conducted in and after September 2006, when
the current mail survey method was introduced.
2. "Confident" comprises the choices "confident" and "somewhat confident" that are found in the questionnaire.
3. "Not confident" comprises "not confident" and "not particularly confident."
24
The Bank's activities are contributing to price stability
and financial system stability
The Bank maintains a neutral position in conducting its policy
I have an impression that the Bank and its staff are sincere
I support the content and intention of the Bank's policy
The Bank makes an effort to provide clear explanations to the general public
about its activities, and to collect public opinion data
Other
7.8
2.2
9.7
18.2
36.9
65.8
5.8
2.7
9.9
18.2
35.8
65.7
5.6
3.2
9.7
17.0
40.3
62.8
0% 10% 20% 30% 40% 50% 60% 70% 80%
Dec 2016
Jun 2017
Dec 2017
The Bank does not maintain a neutral position
in conducting its policy
The Bank's activities are not contributing to price stability
and financial system stability
The Bank does not make enough effort either to provide clear explanations
to the general public about its activities or to collect public opinion data
I have an impression that the Bank and its staff are insincere
I am opposed to the content and intention
of the Bank's policy
Other
7.1
20.9
20.9
26.2
36.0
51.1
3.6
16.1
19.2
33.7
35.2
51.8
5.8
12.4
19.1
25.3
43.6
51.1
0% 10% 20% 30% 40% 50% 60% 70% 80%
Dec 2016
Jun 2017
Dec 2017
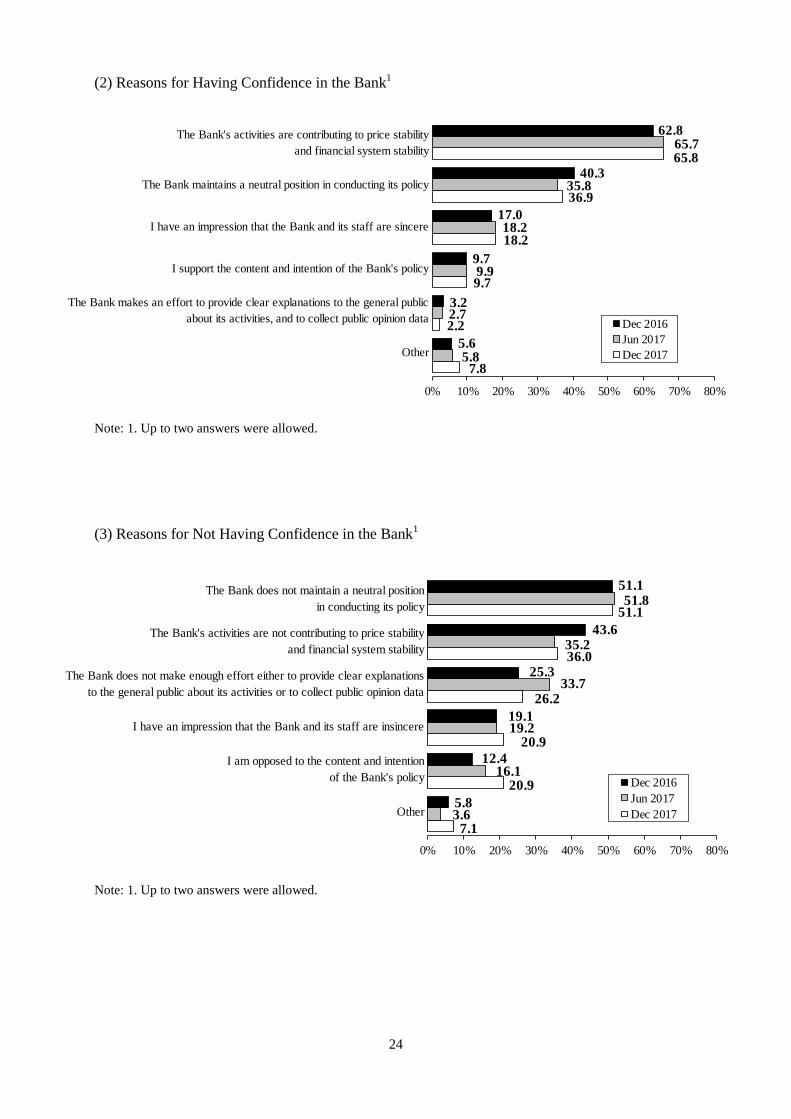
(2) Reasons for Having Confidence in the Bank1
Note: 1. Up to two answers were allowed.
(3) Reasons for Not Having Confidence in the Bank1
Note: 1. Up to two answers were allowed.
25
(1) 10,000 yen note
(2) 5,000 yen note
(3) 1,000 yen note
2.5
2.6
2.5
11.6
12.0
11.4
31.3
32.7
29.9
44.4
43.9
46.0
9.9
8.7
9.9
Dec 2017
Jun 2017
Dec 2016
7.3
7.5
7.4
25.3
26.4
25.5
33.6
33.7
33.7
27.6
27.2
27.7
6.0
5.1
5.6
Dec 2017
Jun 2017
Dec 2016
(%)
Becoming worn Becoming somewhat worn
Difficult to say Relatively clean
Clean
1.8
2.2
2.1
8.0
8.7
7.8
25.9
27.4
25.6
52.1
50.6
52.2
12.0
11.0
12.0
Dec 2017
Jun 2017
Dec 2016
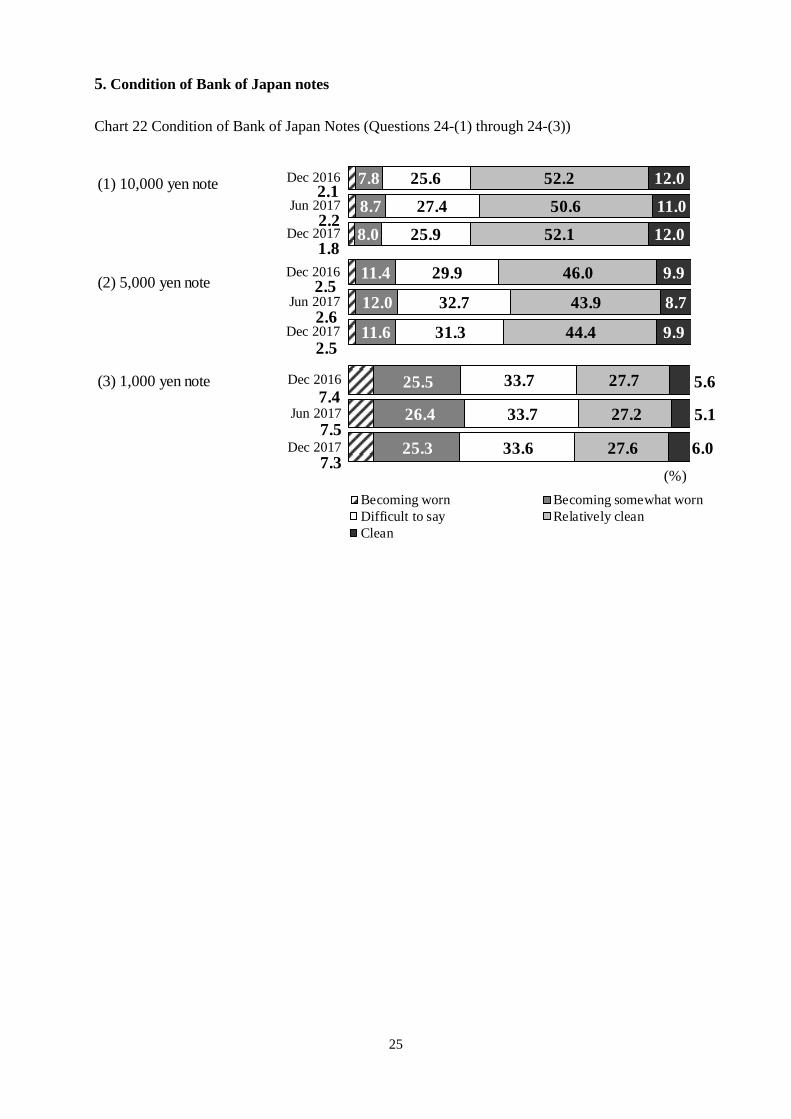
5. Condition of Bank of Japan notes
Chart 22 Condition of Bank of Japan Notes (Questions 24-(1) through 24-(3))
26
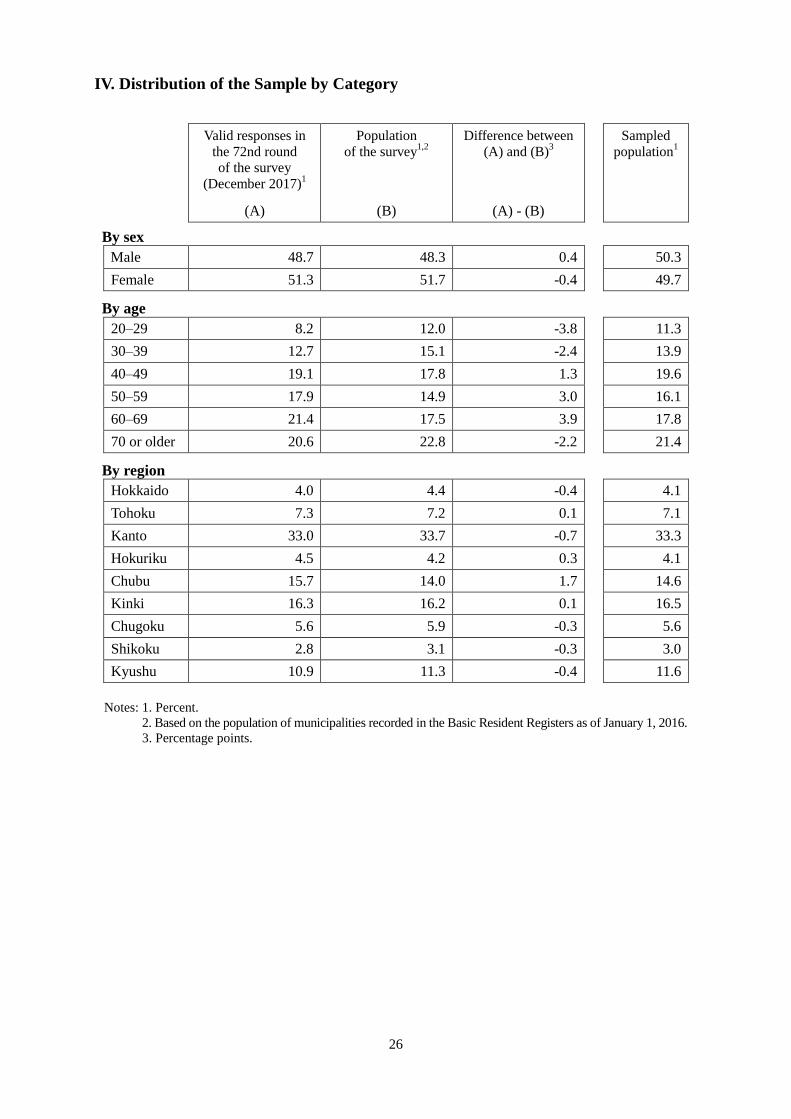
IV. Distribution of the Sample by Category
Valid responses in
the 72nd round
of the survey
(December 2017)1
(A)
Population
of the survey1,2
(B)
Difference between
(A) and (B)3
(A) - (B)
Sampled
population1
By sex
Male 48.7 48.3 0.4 50.3
Female 51.3 51.7 -0.4 49.7
By age
20–29 8.2 12.0 -3.8 11.3
30–39 12.7 15.1 -2.4 13.9
40–49 19.1 17.8 1.3 19.6
50–59 17.9 14.9 3.0 16.1
60–69 21.4 17.5 3.9 17.8
70 or older 20.6 22.8 -2.2 21.4
By region
Hokkaido 4.0 4.4 -0.4 4.1
Tohoku 7.3 7.2 0.1 7.1
Kanto 33.0 33.7 -0.7 33.3
Hokuriku 4.5 4.2 0.3 4.1
Chubu 15.7 14.0 1.7 14.6
Kinki 16.3 16.2 0.1 16.5
Chugoku 5.6 5.9 -0.3 5.6
Shikoku 2.8 3.1 -0.3 3.0
Kyushu 10.9 11.3 -0.4 11.6
Notes: 1. Percent.
2. Based on the population of municipalities recorded in the Basic Resident Registers as of January 1, 2016.
3. Percentage points.
27
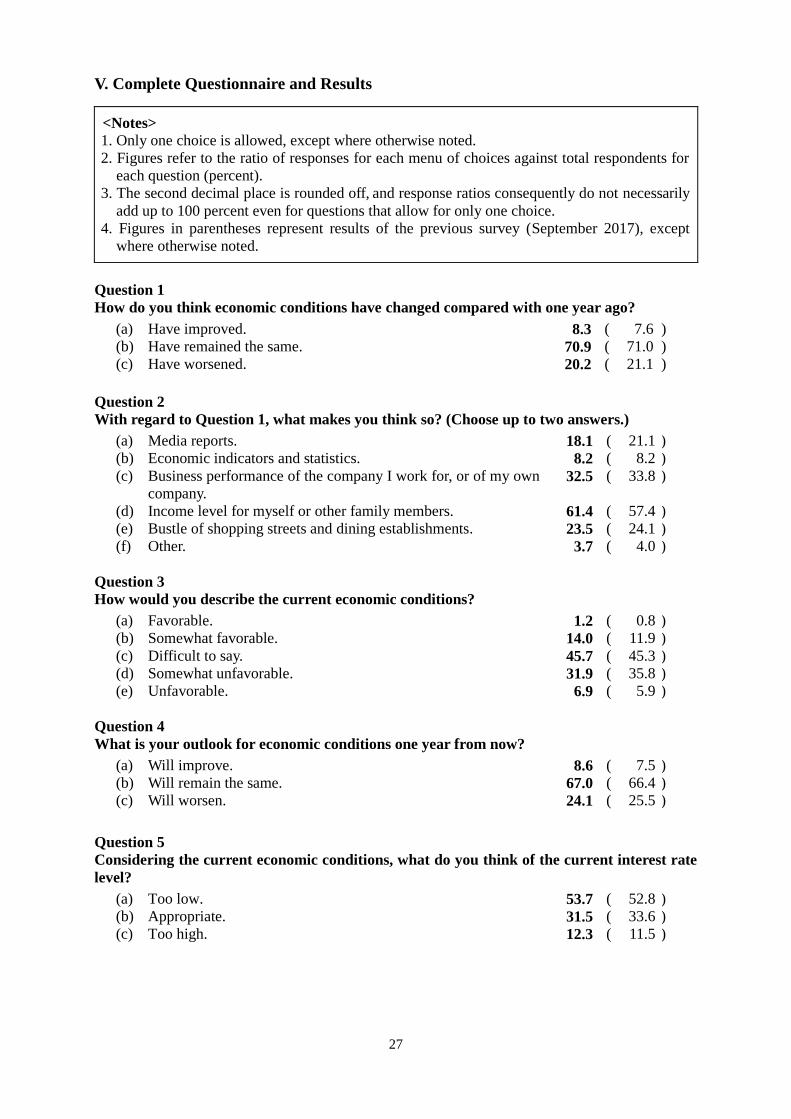
V. Complete Questionnaire and Results
<Notes>
1. Only one choice is allowed, except where otherwise noted.
2. Figures refer to the ratio of responses for each menu of choices against total respondents for
each question (percent).
3. The second decimal place is rounded off, and response ratios consequently do not necessarily
add up to 100 percent even for questions that allow for only one choice.
4. Figures in parentheses represent results of the previous survey (September 2017), except
where otherwise noted.
Question 1
How do you think economic conditions have changed compared with one year ago?
(a) Have improved. 8.3 ( 7.6 )
(b) Have remained the same. 70.9 ( 71.0 )
(c) Have worsened. 20.2 ( 21.1 )
Question 2
With regard to Question 1, what makes you think so? (Choose up to two answers.)
(a) Media reports. 18.1 ( 21.1 )
(b) Economic indicators and statistics. 8.2 ( 8.2 )
(c) Business performance of the company I work for, or of my own
company. 32.5 (
33.8 )
(d) Income level for myself or other family members. 61.4 ( 57.4 )
(e) Bustle of shopping streets and dining establishments. 23.5 ( 24.1 )
(f) Other. 3.7 ( 4.0 )
Question 3
How would you describe the current economic conditions?
(a) Favorable. 1.2 ( 0.8 )
(b) Somewhat favorable. 14.0 ( 11.9 )
(c) Difficult to say. 45.7 ( 45.3 )
(d) Somewhat unfavorable. 31.9 ( 35.8 )
(e) Unfavorable. 6.9 ( 5.9 )
Question 4
What is your outlook for economic conditions one year from now?
(a) Will improve. 8.6 ( 7.5 )
(b) Will remain the same. 67.0 ( 66.4 )
(c) Will worsen. 24.1 ( 25.5 )
Question 5
Considering the current economic conditions, what do you think of the current interest rate
level?
(a) Too low. 53.7 ( 52.8 )
(b) Appropriate. 31.5 ( 33.6 )
(c) Too high. 12.3 ( 11.5 )

28
Question 6
What do you think of your household circumstances compared with one year ago?
(a) Have become better off. 6.5 ( 7.3 )
(b) Difficult to say. 52.4 ( 53.0 )
(c) Have become worse off. 40.2 ( 39.2 )
If you chose (a) in Question 6, please answer Question 6-a. If you chose (c), please answer
Question 6-b. If you chose (b), please go on to Question 7.
Question 6-a: this question is for those who chose (a) in Question 6.
Why do you think your household circumstances have become better off?
(Choose all applicable answers.)
(a) My salary and business income have increased. 64.3 ( 69.2 )
(b) My interest income and dividend payments have increased. 7.7 ( 5.8 )
(c) I gained special income from sales of real estate. 3.5 ( 1.3 )
(d) Prices have declined. 1.4 ( 1.3 )
(e)
The value of my household's assets such as real estate and
stocks has increased. 6.3 (
5.1 )
(f) The number of dependents in my household has decreased. 13.3 ( 16.0 )
(g) Other. 15.4 ( 19.2 )
Question 6-b: this question is for those who chose (c) in Question 6.
Why do you think your household circumstances have become worse off?
(Choose all applicable answers.)
(a) My salary and business income have decreased. 48.5 ( 51.1 )
(b) My interest income and dividend payments have decreased. 16.7 ( 15.0 )
(c) I purchased real estate. 6.1 ( 4.5 )
(d) Prices have risen. 50.7 ( 43.2 )
(e)
The value of my household's assets such as real estate and
stocks has declined. 3.5 (
4.9 )
(f) The number of dependents in my household has increased. 10.3 ( 9.0 )
(g) Other. 25.4 ( 25.7 )
Question 7
How has your household income changed compared with one year ago?
(a) Has increased. 12.9 ( 13.8 )
(b) Has remained the same. 53.3 ( 52.0 )
(c) Has decreased. 33.6 ( 34.0 )
Question 8
What is your outlook for household income one year from now?
(a) Will increase. 9.8 ( 9.5 )
(b) Will remain the same. 57.8 ( 58.9 )
(c) Will decrease. 32.0 ( 30.7 )

29
Question 9
How has your household changed its spending compared with one year ago?
(a) Has increased. 41.5 ( 38.5 )
(b) Has neither increased nor decreased. 42.0 ( 44.8 )
(c) Has decreased. 15.7 ( 15.7 )
If you chose (a) in Question 9, please answer Question 9-a. If you chose (c), please answer
Question 9-b. If you chose (b), please go on to Question 10-(1).
Question 9-a: this question is for those who chose (a) in Question 9.
Why has your household increased its spending? (Choose all applicable answers.)
(a) My income has increased. 7.3 ( 8.6 )
(b) My income is likely to increase in the future. 1.8 ( 2.4 )
(c)
The value of my household's non-financial assets such as real
estate has increased. 0.7 (
1.2 )
(d)
The value of my household's financial assets such as stocks and
bonds has increased.
1.4 (
0.9 )
(e) I purchased real estate such as a house. 5.5 ( 6.1 )
(f) I purchased consumer durable goods such as a car. 22.1 ( 21.1 )
(g)
My spending has risen due to an increased number of
dependents in my household. 26.5 (
22.7 )
(h) The costs of consumer goods and services have risen. 49.5 ( 48.1 )
(i) Other. 25.9 ( 27.3 )
Question 9-b: this question is for those who chose (c) in Question 9.
Why has your household decreased its spending? (Choose all applicable answers.)
(a) My income has decreased. 66.7 ( 67.8 )
(b) My income is not likely to increase in the future. 58.0 ( 46.6 )
(c)
The value of my household's non-financial assets such as real
estate has decreased. 3.2 (
4.8 )
(d)
The value of my household's financial assets such as stocks and
bonds has decreased. 5.5 (
3.3 )
(e)
My spending has fallen due to a decreased number of
dependents in my household. 11.3 (
13.1 )
(f) The costs of consumer goods and services have declined. 6.7 ( ─ )
(g) Other. 12.5 ( 11.9 )
Question 10-(1)
How has your household changed its everyday spending such as on living and educational
expenses compared with one year ago?
(a) Has increased. 18.5 ( 18.6 )
(b) Has neither increased nor decreased. 54.9 ( 54.6 )
(c) Has decreased. 25.5 ( 25.3 )
Question 10-(2)
How has your household changed its selective spending, such as on hobbies and leisure
activities (spending other than asked in Question 10-(1)), compared with one year ago?
(a) Has increased. 9.5 ( 10.3 )
(b) Has neither increased nor decreased. 44.7 ( 42.6 )
(c) Has decreased. 45.2 ( 46.0 )

30
Question 11-(1)
How does your household plan to change its spending within the next twelve months?
(a) Will increase. 7.4 ( 7.5 )
(b) Will neither increase nor decrease. 49.8 ( 49.5 )
(c) Will decrease. 41.8 ( 41.0 )
Question 11-(2)
Which of the following is/are the major factor(s) that your household will consider when
making spending decisions for the next twelve months? (Choose all applicable answers.)
(a) An increase or decrease in my household's income. 57.2 ( 57.5 )
(b)
An increase or decrease in the value of my household's assets such
as savings, stocks, and real estate. 16.2 ( 15.9 )
(c) Progress in loan repayments. 15.9 ( 16.4 )
(d) Future developments in prices. 45.8 ( 40.1 )
(e) An increase or decrease in leisure time and holidays. 25.4 ( 25.8 )
(f) Whether there are appealing goods and services. 20.6 ( 18.6 )
(g) Other. 5.7 ( 5.6 )
Question 11-(3)
Which of the following is/are the major factor(s) in the choice of goods and services on
which to spend for the next twelve months? (Choose up to three answers.)
(a) Low price. 52.4 ( 52.1 )
(b) Safety. 45.7 ( 47.8 )
(c) Reliability. 37.2 ( 38.8 )
(d) Functionality. 31.9 ( 30.8 )
(e) Durability. 40.3 ( 39.0 )
(f) Environmental and social friendliness. 7.0 ( 7.8 )
(g) Design. 7.7 ( 7.7 )
(h) Trend. 0.6 ( 0.7 )
(i) Originality/Innovation. 2.5 ( 2.4 )
(j) After-sales service. 17.5 ( 15.9 )
(k) Curiosity. 3.7 ( 3.5 )
(l) Wholesomeness. 20.4 ( 17.9 )
(m) Brand reputation. 2.3 ( 1.8 )
(n) Other. 0.2 ( 0.5 )
Question 12
How do you think prices1 have changed compared with one year ago?
(a) Have gone up significantly. 7.6 ( 7.8 )
(b) Have gone up slightly. 59.5 ( 55.4 )
(c) Have remained almost unchanged. 30.0 ( 33.1 )
(d) Have gone down slightly. 2.2 ( 2.8 )
(e) Have gone down significantly. 0.1 ( 0.3 )
Note: 1. Defined as overall prices of goods and services you purchase.
If you chose (a) or (b) in Question 12, please answer Question 12-a. If you chose (d) or (e), please
answer Question 12-b. If you chose (c), please go on to Question 13.
31
Question 12-a: this question is for those who chose (a) or (b) in Question 12.
How would you describe your opinion of the price rise?
(a) Rather favorable. 3.2 ( 3.9 )
(b) Rather unfavorable. 80.8 ( 77.8 )
(c) Difficult to say. 15.5 ( 17.3 )
Question 12-b: this question is for those who chose (d) or (e) in Question 12.
How would you describe your opinion of the price decline?
(a) Rather favorable. 45.1 ( 55.4 )
(b) Rather unfavorable. 31.4 ( 27.7 )
(c) Difficult to say. 21.6 ( 15.4 )
Question 13
By what percent do you think prices have changed compared with one year ago? Please
choose "up" or "down" and fill in the box below with a specific figure. If you think that they
have been unchanged, please put a "0."
up
Prices have gone about percent compared with one year ago.
down
Average1 : plus 4.5 (plus 4.2) percent
Median2 : plus 3.0 (plus 2.5) percent
Notes: 1. Calculated by excluding 0.5 percent of the highest and lowest figures, respectively, in order to
avoid extremes. (The simple average of this survey is plus 4.6 percent, and that of the
previous survey was plus 4.4 percent.)
2. The number that appears in the middle when the answers are listed in numerical order.
Question 14
What is your outlook for prices one year from now?
(a) Will go up significantly. 8.4 ( 6.2 )
(b) Will go up slightly. 67.2 ( 64.2 )
(c) Will remain almost unchanged. 21.6 ( 26.7 )
(d) Will go down slightly. 1.8 ( 1.7 )
(e) Will go down significantly. 0.1 ( 0.2 )
Question 15
By what percent do you think prices will change one year from now? Please choose "up" or
"down" and fill in the box below with a specific figure. If you think that they will be
unchanged, please put a "0." up
Prices will go about percent one year from now.
down
Average1 : plus 4.3 (plus 3.8) percent
Median2 : plus 3.0 (plus 2.0) percent
Notes: 1. Calculated by excluding 0.5 percent of the highest and lowest figures, respectively, in order to
avoid extremes. (The simple average of this survey is plus 4.5 percent, and that of the
previous survey was plus 3.9 percent.)
2. The number that appears in the middle when the answers are listed in numerical order.
32
Questions 16 and 17 ask about your outlook for prices. Please answer these questions,
disregarding the effects of the scheduled consumption tax hike.
Question 16
What is your outlook for prices over the next five years?
(a) Will go up significantly. 23.4 ( 20.7 )
(b) Will go up slightly. 58.5 ( 60.7 )
(c) Will remain almost unchanged. 13.1 ( 12.7 )
(d) Will go down slightly. 3.0 ( 3.2 )
(e) Will go down significantly. 0.5 ( 0.6 )
Question 17
By what percent do you think prices will change per year on average over the next five
years? Please choose "up" or "down" and fill in the box below with a specific figure. If you
think that they will be unchanged, please put a "0." up
Prices will go about percent per year on average over the next five years.
down
Average1 : plus 3.9 (plus 3.7) percent
Median2 : plus 2.0 (plus 2.0) percent
Notes: 1. Calculated by excluding 0.5 percent of the highest and lowest figures, respectively, in order to
avoid extremes. (The simple average of this survey is plus 4.1 percent, and that of the
previous survey was plus 4.0 percent.)
2. The number that appears in the middle when the answers are listed in numerical order.
Question 18
What is your outlook for land prices?
(a) Will go up. 29.4 ( 27.4 )
(b) Will remain the same. 36.3 ( 37.9 )
(c) Will go down. 32.7 ( 32.8 )
Question 19
How do you view the Japanese economy's growth potential in the long term?
(a)
Has greater potential to grow compared to the current level of
growth. 3.0 (
2.7 )
(b) Has potential to grow at about the current level of growth. 47.2 ( 46.3 )
(c)
Has less potential to grow compared to the current level of
growth. 48.8 (
49.5 )
Question 20
In consideration of the situation one year from now, are you (or other family members)
worried about employment and working conditions such as pay, job position, and benefits
for the workers1 in your family at their current workplaces?
All respondents Of which: workers
(a) Not particularly. 18.8 ( 21.5 ) 19.6 ( 23.2 )
(b) Slightly. 51.9 ( 49.9 ) 50.4 ( 50.4 )
(c) Quite. 27.1 ( 25.4 ) 30.0 ( 26.1 )
Note: 1. Company employees, executives, civil servants, and part-timers.
33
Questions 21-(1) through 24-(3) ask about your recognition and credibility of the Bank of
Japan.
1. In principle, asked semiannually in the June and December surveys, with the exception of the 46th
round of the survey, conducted in June 2011.
2. Figures in parentheses for Questions 21-(2) through 21-(4) represent results of the previous survey
(September 2017).
3. Figures in parentheses for questions other than the three above indicate the results of the 70th round of
the survey (June 2017).
Questions 21-(1) through 21-(4) ask about price stability, which is one of the Bank's two
objectives. Please make the most applicable choice relative to these questions.
Question 21-(1)
Do you know that one of the Bank's objectives is to achieve price stability?
(a) Know about it. 30.5 ( 32.4 )
(b) Have read or heard of it, but do not know much about it. 46.0 ( 45.0 )
(c) Have never heard of it. 23.3 ( 22.3 )
Question 21-(2)
Do you know that the Bank has set the price stability target at 2 percent in terms of the
year-on-year rate of change in the consumer price index (CPI)?
(a) Know about it. 27.3 ( 26.7 )
(b) Have read or heard of it, but do not know much about it. 33.0 ( 35.7 )
(c) Have never heard of it. 39.4 ( 36.7 )
Question 21-(3)
Do you know that the Bank has been implementing aggressive monetary easing measures to
achieve the price stability target of 2 percent?
(a) Know about it. 41.0 ( 28.1 )
(b) Have read or heard of it, but do not know much about it. 36.6 ( 38.4 )
(c) Have never heard of it. 22.1 ( 32.1 )
Question 21-(4)
Specifically, do you know that the Bank has been conducting "Quantitative and Qualitative
Monetary Easing with Yield Curve Control"?
(a) Know about it. 22.3 ( 16.5 )
(b) Have read or heard of it, but do not know much about it. 36.3 ( 33.1 )
(c) Have never heard of it. 40.8 ( 49.1 )
Question 22
Do you know that the other of the Bank's two objectives is to ensure the stability of the
financial system?
(a) Know about it. 26.1 ( 27.8 )
(b) Have read or heard of it, but do not know much about it. 38.9 ( 35.8 )
(c) Have never heard of it. 34.6 ( 35.9 )
34
Questions 23-(1) through 23-(5) ask about your view of the Bank. Please make the most
applicable choice relative to these questions.
Question 23-(1)
How would you describe your level of interest in the Bank's activities?
(a) Interested. 4.6 ( 5.2 )
(b) Somewhat interested. 17.8 ( 19.3 )
(c) Difficult to say. 29.3 ( 30.9 )
(d) Not particularly interested. 33.2 ( 31.3 )
(e) Not interested. 14.4 ( 13.0 )
Question 23-(2)
How would you describe the Bank's relationship to our lives?
(a) Related. 34.0 ( 33.8 )
(b) Somewhat related. 36.9 ( 37.8 )
(c) Difficult to say. 17.9 ( 19.0 )
(d) Not particularly related. 7.5 ( 6.8 )
(e) Not related. 3.2 ( 2.3 )
Question 23-(3)
How would you describe the Bank's contribution to our lives?
(a) Significant. 15.4 ( 15.4 )
(b) Somewhat significant. 25.9 ( 29.9 )
(c) Difficult to say. 43.7 ( 42.3 )
(d) Not particularly significant. 9.3 ( 8.1 )
(e) Not significant. 5.0 ( 4.0 )
Question 23-(4)
How would you describe the Bank's explanations to the public?
(a) Clear. 0.7 ( 0.8 )
(b) Somewhat clear. 4.5 ( 4.8 )
(c) Difficult to say. 36.9 ( 39.4 )
(d) Somewhat unclear. 40.0 ( 37.9 )
(e) Unclear. 16.6 ( 15.9 )
Question 23-a: this question is for those who chose (d) or (e) in Question 23-(4).
Why do you think the Bank's explanations are unclear? (Choose up to two answers.)
(a)
Terms used in the Bank's explanations are too technical and
difficult. 41.7 (
42.8 )
(b) I do not have basic knowledge about the Bank. 43.5 ( 41.9 )
(c)
I have difficulty understanding the mechanisms of the
financial system and the economy. 37.5 (
39.6 )
(d)
I have never had the opportunity to read or hear the Bank's
explanations. 30.2 (
27.3 )
(e) I do not know how to obtain information about the Bank. 16.0 ( 14.0 )
(f) The Bank's website is inconvenient. 0.8 ( 1.0 )
(g) Other. 1.8 ( 2.9 )
35
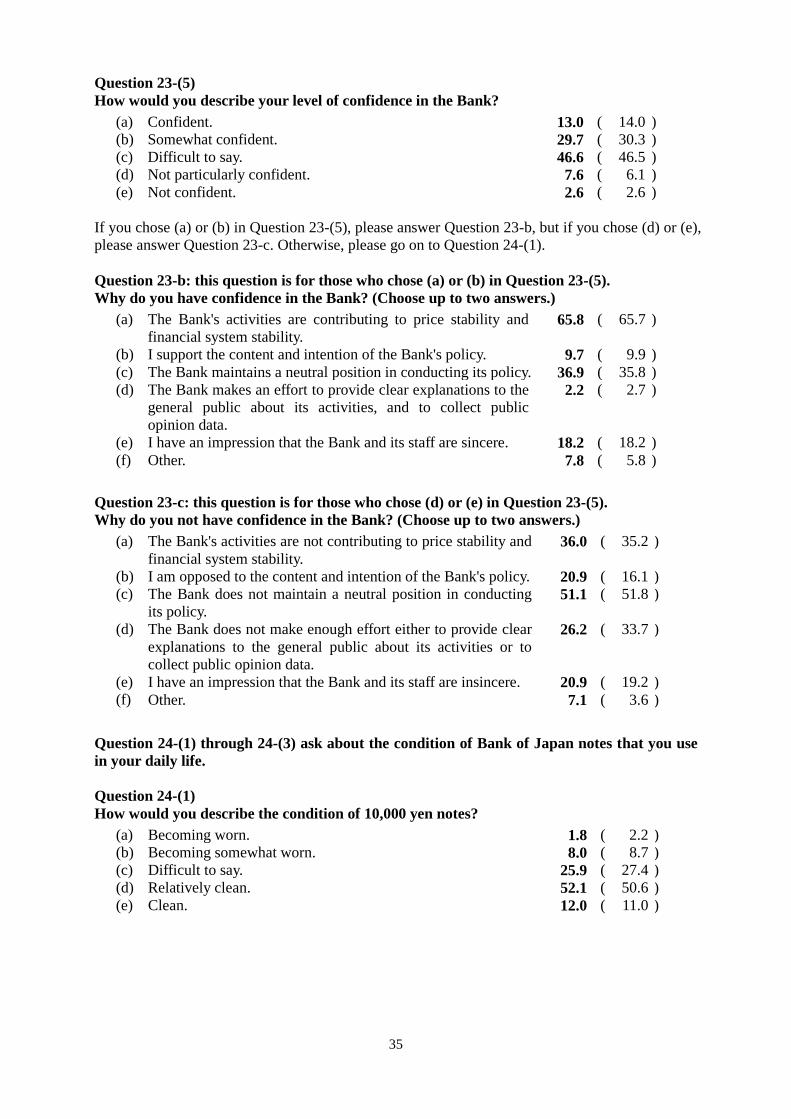
Question 23-(5)
How would you describe your level of confidence in the Bank?
(a) Confident. 13.0 ( 14.0 )
(b) Somewhat confident. 29.7 ( 30.3 )
(c) Difficult to say. 46.6 ( 46.5 )
(d) Not particularly confident. 7.6 ( 6.1 )
(e) Not confident. 2.6 ( 2.6 )
If you chose (a) or (b) in Question 23-(5), please answer Question 23-b, but if you chose (d) or (e),
please answer Question 23-c. Otherwise, please go on to Question 24-(1).
Question 23-b: this question is for those who chose (a) or (b) in Question 23-(5).
Why do you have confidence in the Bank? (Choose up to two answers.)
(a)
The Bank's activities are contributing to price stability and
financial system stability. 65.8 (
65.7 )
(b) I support the content and intention of the Bank's policy. 9.7 ( 9.9 )
(c) The Bank maintains a neutral position in conducting its policy. 36.9 ( 35.8 )
(d)
The Bank makes an effort to provide clear explanations to the
general public about its activities, and to collect public
opinion data.
2.2 (
2.7 )
(e) I have an impression that the Bank and its staff are sincere. 18.2 ( 18.2 )
(f) Other. 7.8 ( 5.8 )
Question 23-c: this question is for those who chose (d) or (e) in Question 23-(5).
Why do you not have confidence in the Bank? (Choose up to two answers.)
(a) The Bank's activities are not contributing to price stability and
financial system stability. 36.0 (
35.2 )
(b) I am opposed to the content and intention of the Bank's policy. 20.9 ( 16.1 )
(c) The Bank does not maintain a neutral position in conducting
its policy. 51.1 (
51.8 )
(d) The Bank does not make enough effort either to provide clear
explanations to the general public about its activities or to
collect public opinion data.
26.2 (
33.7 )
(e) I have an impression that the Bank and its staff are insincere. 20.9 ( 19.2 )
(f) Other. 7.1 ( 3.6 )
Question 24-(1) through 24-(3) ask about the condition of Bank of Japan notes that you use
in your daily life.
Question 24-(1)
How would you describe the condition of 10,000 yen notes?
(a) Becoming worn. 1.8 ( 2.2 )
(b) Becoming somewhat worn. 8.0 ( 8.7 )
(c) Difficult to say. 25.9 ( 27.4 )
(d) Relatively clean. 52.1 ( 50.6 )
(e) Clean. 12.0 ( 11.0 )
36
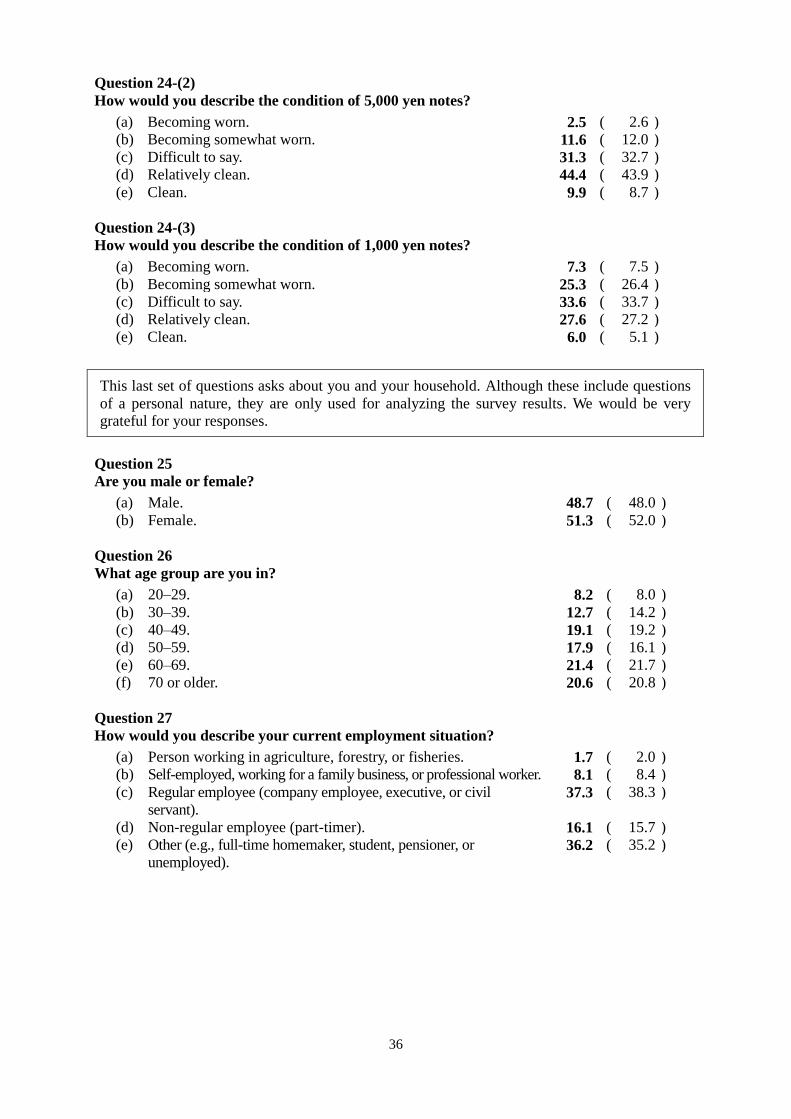
Question 24-(2)
How would you describe the condition of 5,000 yen notes?
(a) Becoming worn. 2.5 ( 2.6 )
(b) Becoming somewhat worn. 11.6 ( 12.0 )
(c) Difficult to say. 31.3 ( 32.7 )
(d) Relatively clean. 44.4 ( 43.9 )
(e) Clean. 9.9 ( 8.7 )
Question 24-(3)
How would you describe the condition of 1,000 yen notes?
(a) Becoming worn. 7.3 ( 7.5 )
(b) Becoming somewhat worn. 25.3 ( 26.4 )
(c) Difficult to say. 33.6 ( 33.7 )
(d) Relatively clean. 27.6 ( 27.2 )
(e) Clean. 6.0 ( 5.1 )
This last set of questions asks about you and your household. Although these include questions
of a personal nature, they are only used for analyzing the survey results. We would be very grateful for your responses.
Question 25
Are you male or female?
(a) Male. 48.7 ( 48.0 )
(b) Female. 51.3 ( 52.0 )
Question 26
What age group are you in?
(a) 20–29. 8.2 ( 8.0 )
(b) 30–39. 12.7 ( 14.2 )
(c) 40–49. 19.1 ( 19.2 )
(d) 50–59. 17.9 ( 16.1 )
(e) 60–69. 21.4 ( 21.7 )
(f) 70 or older. 20.6 ( 20.8 )
Question 27
How would you describe your current employment situation?
(a) Person working in agriculture, forestry, or fisheries. 1.7 ( 2.0 )
(b) Self-employed, working for a family business, or professional worker. 8.1 ( 8.4 )
(c)
Regular employee (company employee, executive, or civil
servant). 37.3 (
38.3 )
(d) Non-regular employee (part-timer). 16.1 ( 15.7 )
(e)
Other (e.g., full-time homemaker, student, pensioner, or
unemployed). 36.2 (
35.2 )
37
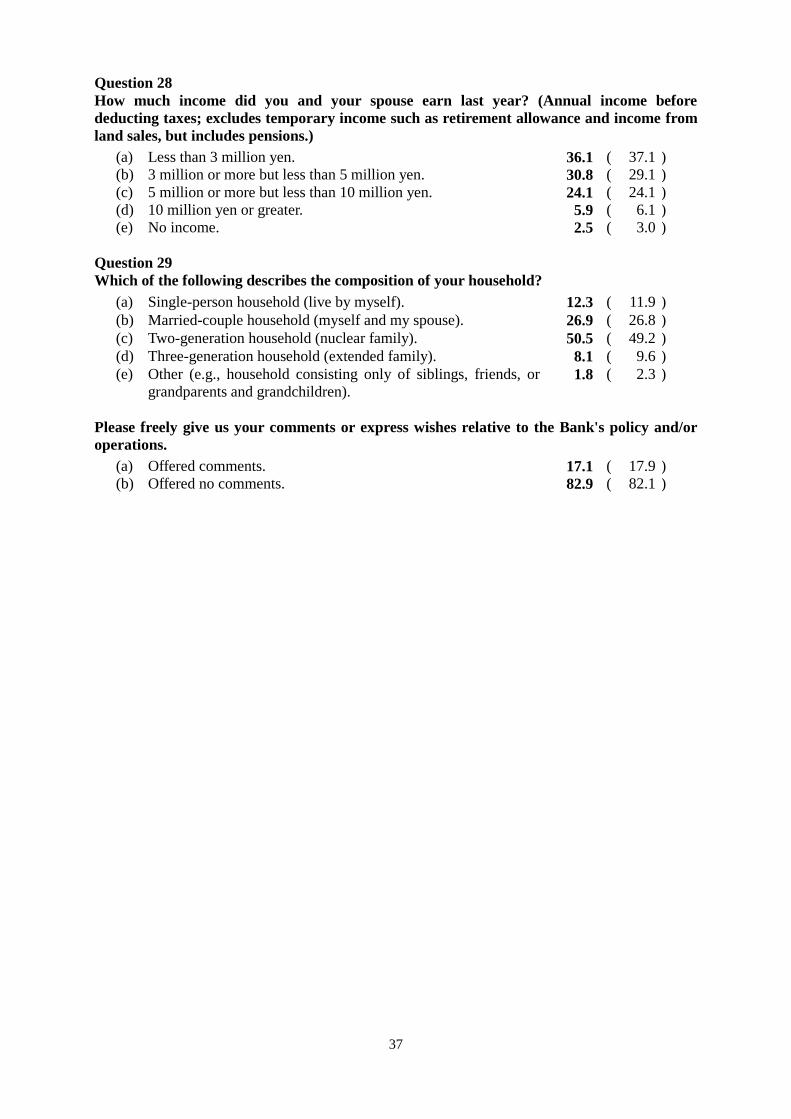
Question 28
How much income did you and your spouse earn last year? (Annual income before
deducting taxes; excludes temporary income such as retirement allowance and income from
land sales, but includes pensions.)
(a) Less than 3 million yen. 36.1 ( 37.1 )
(b) 3 million or more but less than 5 million yen. 30.8 ( 29.1 )
(c) 5 million or more but less than 10 million yen. 24.1 ( 24.1 )
(d) 10 million yen or greater. 5.9 ( 6.1 )
(e) No income. 2.5 ( 3.0 )
Question 29
Which of the following describes the composition of your household?
(a) Single-person household (live by myself). 12.3 ( 11.9 )
(b) Married-couple household (myself and my spouse). 26.9 ( 26.8 )
(c) Two-generation household (nuclear family). 50.5 ( 49.2 )
(d) Three-generation household (extended family). 8.1 ( 9.6 )
(e)
Other (e.g., household consisting only of siblings, friends, or
grandparents and grandchildren). 1.8 (
2.3 )
Please freely give us your comments or express wishes relative to the Bank's policy and/or
operations.
(a) Offered comments. 17.1 ( 17.9 )
(b) Offered no comments. 82.9 ( 82.1 )