Embed Size (px)
Citation preview
Rethinking Firms’ Offshoring Strategy by Listening to the Voice of End Users:
The Impact of Country-of-Origin Cues on Young Montréalers’ Product Evaluation
Xi Chen
A Thesis
in
the John Molson School
of
Business
Presented in Partial Fulfillment of the Requirements
for the Degree of Master of Science in Administration at
Concordia University
Montréal, Québec, Canada
February 2015
© Xi Chen, 2015
CONCORDIA UNIVERSITY
School of Graduate Studies
This is to certify that the thesis prepared
By: Xi Chen
Entitled: Rethinking Firms’ Offshoring Strategy by Listening to the Voice of End Users:
The Impact of Country-of-Origin Cues on Young Montréalers’ Product Evaluation
and submitted in partial fulfillment of the requirements for the degree of
Master of Science in Administration (Management Option)
complies with the regulations of the University and meets the accepted standards with respect to
originality and quality.
Signed by the final examining committee:
____________________________________ Chair
Dr. Thomas Walker
____________________________________ Examiner
Dr. Bianca Grohmann
____________________________________ Examiner
Dr. Jisun Yu
____________________________________ Supervisor
Dr. Muhammad Jamal
Approved by ___________________________________________________
Chair of Department or Graduate Program Director
___________________________________________________
Dean of Faculty
Date ___________________________________________________
iii
Abstract
Rethinking Firms’ Offshoring Strategy by Listening to the Voice of End Users:
The Impact of Country-of-Origin Cues on Young Montréalers’ Product Evaluation
Xi Chen
Aiming to investigate the outcome of firms’ cross-border outsourcing practice from a bottom-up
(customer-centered) approach, this research project leveraged on Mandler (1982, 1983)’s schema
(in)congruity theory to examine young Montréalers’ reaction to products which had various design
and manufacturing origins. With respect to scholars’ previous work, this research proposed that
congruity between a product’s country of design and country of manufacture (Haubl & Elrod,
1999), consumer ethnocentric tendency (Shimp & Sharma, 1987) and product function (Voss,
Spangenberg, & Grohmann, 2003; Wilcox, Kim, & Sen, 2009), respectively, would have positive
impacts on consumers’ product evaluation. According to the questionnaire responses of 278
undergraduate students at Concordia University, no evidence could suggest that consumer
evaluation of branded products were affected by the country-of-manufacture cue. Moreover,
country-of-design effects and consumer ethnocentric tendency were showed to have different
manifestations across product categories. Furthermore, product function was found to be not only
positively related to consumer evaluation but also was an imperative mediator in consumers’
attitude toward, quality perception and purchase intention of branded products. Overall, the present
study contributed to international business research and consumer behavior study by adding
empirical evidence to support scholars’ viewpoint that country-of-origin effects on consumers’
product evaluation may be varied across product categories and by establishing a link between the
construct of product function and country-of-origin effects. The importance of product function in
end users’ evaluation of branded products shall also shed light on firms’ managerial implications.
Keywords: offshoring strategy, country of design, country of manufacture,
schema (in)congruity, product function, consumer ethnocentrism
iv
Acknowledgements and Dedications
I would like to thank my family for their unwavering support and continuous
encouragement during the past two years. I also want to thank all of my supervisory committee
members for their generous help throughout my thesis development. Dr. Muhammad Jamal always
brought me back on the right track and provided valuable advices on my research. Dr. Bianca
Grohmann guided me through the entire phase of research design during which period I learnt
precious knowledge and skills. Dr. Jisun Yu helped me by offering her expertise in and insight
into the field of international business management. The last but not the least, I would like to give
my most sincere thankfulness to all of the undergraduate students who participated in my research;
without them, my project would not be possible. As Henry Ford, the founder of the Ford Motor
Company, once said, “Coming together is the beginning. Keeping together is process. Working
together is success”. I wish to dedicate this paper to all the people who helped me and contributed
in the present study.
v
Table of Contents
List of Tables…………………………………………………………………………………….vii
List of Appendices………………………………………………………………………………viii
Introduction……………………………………………………………………………………......1
Literature Review…………………………………………….........................................................5
Hofstede’s Dimensions of National Culture………………...……………………..….....5
Culture and Consumer Behavior.......………………………………………..…………...7
Schema Theories……….…...…...………………………………………………..……...9
Country of Origin...…...……..………………………………….………………………13
Consumer Ethnocentrism….……………......…………………………………………..16
Country of Design & Manufacture……………...………………….…………………...17
Product Function…………………………………………………………….…………..20
Overview and Hypotheses……………………………………………………………………….22
Country of Design/Manufacture Fit…...……..……..……......……………………..…..22
Consumer Ethnocentrism……………………………………………………………….23
Product Function………………………………………………………………………..24
Methodology……………………………………………………………………………………..25
Research Design…………………………………………………………………...……25
Participants……………………………..……………………………………………….26
Procedures………………………………………..……………………………………..27
Pilot Study: Measures & Scales……………………..………………………………….27
Product Involvement…………………………………………………………...27
Product Function……………………………………………………………….28
Product Attribute……………………………………………………………….29
Brand Familiarity………………………………………………………………29
Brand Attitude……………………………………………………………….…30
Product Quality……….………………………………………………………..30
Consumer Ethnocentrism………………………………………………………30
vi
Manipulation Check………………………………………………..…………..30
Pilot Study: Analyses & Results…………………………………..……………………31
Comparison between Product Categories……………………………………...31
Comparison among Brands………………....…………….……………..……..32
Manipulation Check…………………………………………….…...…………33
Measurement Issue(s)……………………………………………….…………34
Main Study: Measures & Scales…………………………………………………..…….34
Product Function……………………………………………………………….35
Brand Attitude………………………………………………………………….35
Product Quality………………………….……………………………………..35
Purchase Intention……………………………………………….……………..35
Consumer Ethnocentrism………………………………………………………35
Main Study: Analyses & Results………………………………………………………..35
Discussion……………………………………………………………………………….……….40
Limitations………………………………………………………………...……………42
Future Directions ……………………………………………...……………………….44
Practical Implications……………………………….………………………………….45
Conclusion………………………………………………………………………………….……47
References………………………………………………………………………………………..48
vii
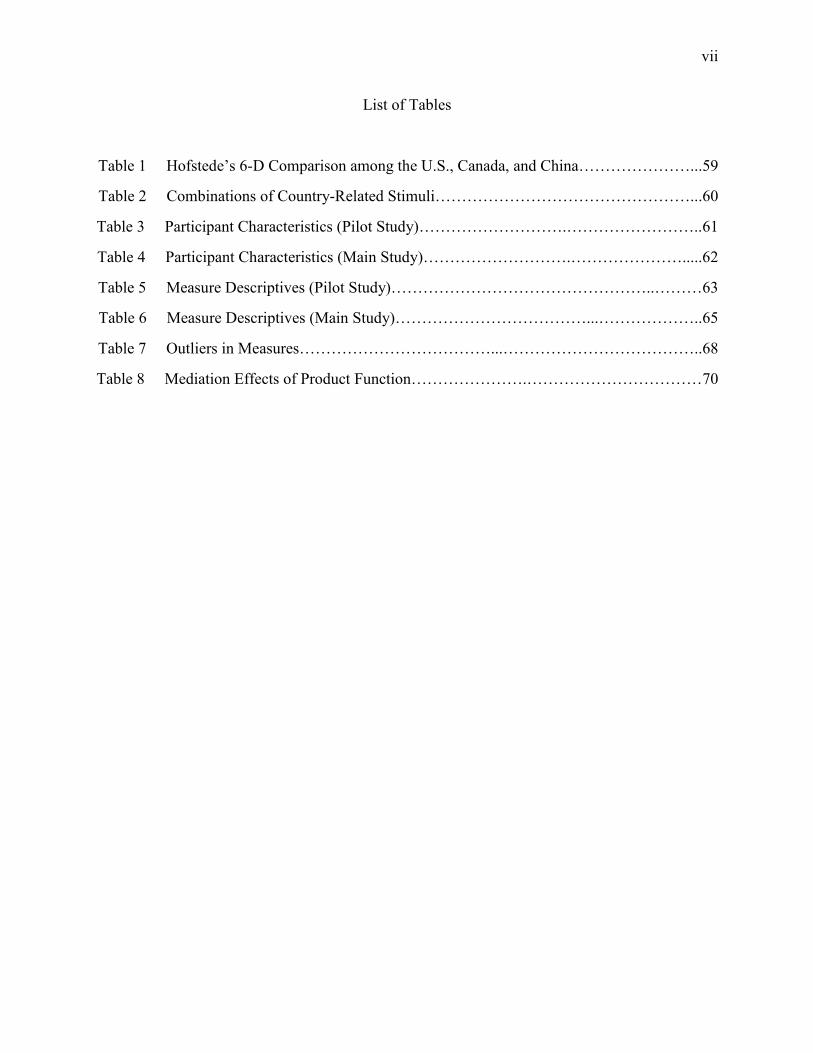
List of Tables
Table 1 Hofstede’s 6-D Comparison among the U.S., Canada, and China…………………...59
Table 2 Combinations of Country-Related Stimuli…………………………………………...60
Table 3 Participant Characteristics (Pilot Study)……………………….……………………..61
Table 4 Participant Characteristics (Main Study)……………………….………………….....62
Table 5 Measure Descriptives (Pilot Study)…………………………………………..………63
Table 6 Measure Descriptives (Main Study)………………………………...………………..65
Table 7 Outliers in Measures………………………………...………………………………..68
Table 8 Mediation Effects of Product Function………………….……………………………70
viii
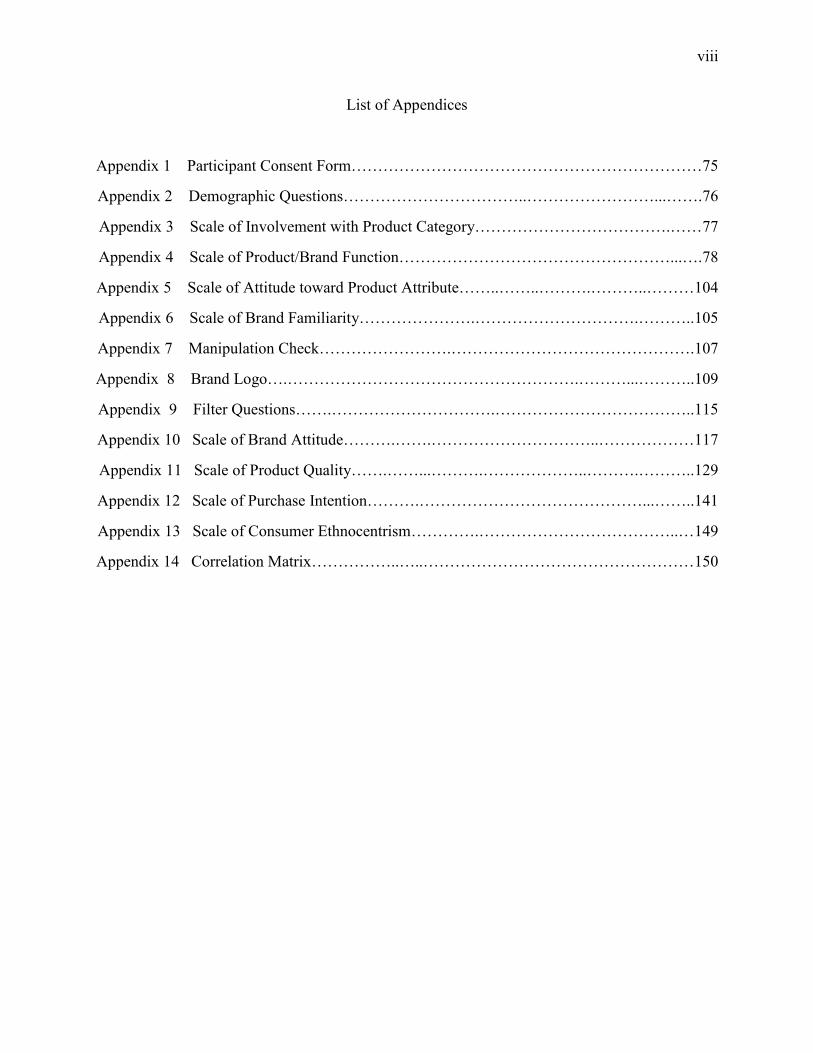
List of Appendices
Appendix 1 Participant Consent Form…………………………………………………………75
Appendix 2 Demographic Questions……………………………..……………………...…….76
Appendix 3 Scale of Involvement with Product Category……………………………….……77
Appendix 4 Scale of Product/Brand Function……………………………………………...….78
Appendix 5 Scale of Attitude toward Product Attribute……..……..……….………..………104
Appendix 6 Scale of Brand Familiarity………………….………………………….………..105
Appendix 7 Manipulation Check…………………….……………………………………….107
Appendix 8 Brand Logo….……………………………………………….………...………..109
Appendix 9 Filter Questions…….………………………….………………………………..115
Appendix 10 Scale of Brand Attitude……….…….…………………………..………………117
Appendix 11 Scale of Product Quality…….……...……….………………..……….………..129
Appendix 12 Scale of Purchase Intention……….……………………………………...……..141
Appendix 13 Scale of Consumer Ethnocentrism………….………………………………..…149
Appendix 14 Correlation Matrix……………..…..……………………………………………150
1
The offshoring phenomenon has been in existence for decades and has witnessed a business
movement that firms contract out partial or all of their value-adding activities and expatriate
talented human resource to counterparts in remote physical locations (Greaver, 1998). Despite the
fact that offshoring has become a very common practice in today’s business environment,
challenges, either financially or culturally, emanated from the implementation of this strategy are
still inevitable (Morgan, 2012; Power, Desouza, & Bonifazi, 2006). In the academy of international
business management, scholars have also devoted considerable efforts to search for more
applicable theories and effective practices by studying the collaboration process between strategic
alliances (Hennart, 1991; Winkler, Dibbern, & Heinzl, 2008), companies’ preference in the
selection process of sourcing partners (Nachum, Zaheer, & Gross, 2008; Schmitt & Van
Biesebroeck, 2013), and multinational enterprises’ choice of entry mode during international
expansions (Fong, Lee, & Du, 2014; Ghemawat, 2001; O’Grady & Lane, 1996).
As firms seek more effective practices to achieve cost benefit and improve profitability as
well as absorb knowledge and skills from partners who have competitive advantage (Anand &
Delios, 1997; Chang, 1995; Gatignon & Anderson, 1988; Porter, 1980, 1985), a product’s design,
manufacturing and assembly work may be done by various companies residing in different
countries. Some scholars are particularly concerned about this type of organization practice, due
to the issues it brings. For instance, the definition of country-of-origin construct is no longer
accurate and precise (Chao, 1993, 1998; Papadopoulos & Heslop, 1993). Country of origin is
defined as the country where the headquarters of the company that manufactures and markets the
product or brand is located (Johansson, Douglas, & Nonaka, 1985). Once firms choose to hand
over value-adding activities, such as design, assembly and manufacturing, to partners located in
other countries, dual (or multiple) country associations are attached to a certain brand’s products,
resulting in the creation of bi-national products. According to Han and Terpstra (1988), bi-national
product involves two countries of origin; for instance, it may be foreign made (manufacturing
origin) but carries a U.S. brand name (brand origin).
Since consumers have their own opinions and perceptions of the countries where value chain
members locate, it is assumed that consumer evaluation of bi-national products is more complex
compared with the decision-making process of uni-national products (Agarwal & Sikri, 1996). For
this reason, scholars argue that it is necessary to decompose the country-of-origin construct and
2
investigate the impacts of its components and their interactions on consumers’ product evaluation
(Hamzaoui-Essoussi, Merunka, & Bartikowski, 2011; Samiee, 2010; Zeugner-Roth &
Diamantopoulos, 2010). From the perspective of firms, one of the main reasons they choose to
contract out value-adding activities is cost benefit; however, the purpose of this strategic decision
will be compromised if doing so results in consumers’ less favorable attitude toward the parent
brand and perception of its branded products. Consequently, it is also crucial for companies to
understand the influence exerted by value chain members’ origin countries on consumers’ reaction
to their brands/products.
Back to academia, scholars have cumulated substantial evidence to demonstrate the
importance of the country-of-origin cue in consumer evaluation of uni-national products (e.g.
Hanne, 1996; Maheswaran, 1994; Papadopoulos, Heslop, & Bamossy, 1990; Roth & Romeo, 1992;
Tse & Gorn, 1993). However, this is not the case for research that have investigated the interaction
effects of the components of the country-of-origin construct on consumers’ brand attitude and
product evaluation. Current findings on this topic are mixed yet very interesting, in a sense that
once the product category and participant population studied in each research changed, the
manifestation of the decomposed country-of-origin effects would differ accordingly.
Chung, Pysarchik, and Hwang (2009) had evidence to suggest a negative correlation
between Malaysia-made LG televisions and Korean consumers’ purchase intention. Dikčius and
Stankevičienė (2010) also observed lower consumer preference and product evaluation of Poland-
made Panasonic and Turkey-made LG televisions among Lithuanian participants. Lee, Phau, and
Roy (2012)’s research findings indicated that Australian consumers had negative attitude toward
and quality perception of made-in-China products from the American luxury brand CK.
Schniederjans, Cao, and Olson (2004) even found that among the 51 product categories (e.g.
Chairs, CD players, shirts) surveyed in their study, made-in-China products’ average quality rating
was below the mean score of products made by other countries of manufacture, and that U.S.
consumers perceived non-China-made products to have greater net value than their China-made
counterparts. However, in the same study, Chung and his co-workers (2009) found that the
Mexico-made cue did not negatively affect Korean consumers’ purchase intention of Ralph Lauren
sweaters. And U.S. participants surveyed by Fetscherin and Toncar (2010) also expressed neutral
attitude toward U.S. automobiles which had parts manufactured in China. Moreover, in Hamzaoui-
3
Essoussi et al. (2011)’s study, Tunisian consumers’ attitude toward and quality judgement of
automobiles from well-known brands (e.g. Mercedes-Benz, Hyundai) were showed to be
unaffected by the manufacturing location.
Following the lead of these scholars, one research objective the present study strived to
achieve was to examine Canadian consumers’ reaction to branded products which were designed
and manufactured in different countries. Based on current knowledge, few country-of-origin
studies have focused on Canadian consumers (Ahmed, d’Astous, & Eljabri, 2002; Ahmed,
d’Astous, & Lemire 1997; Ahmed, Johnson, Ling, Fang, & Hui, 2002; Bruning, 1997; Carvalho,
Samu, & Sivaramakrishnan, 2011; d’Astous & Ahmed, 1999). And none of these research have
examined and compared Canadian consumers’ reaction to real Canadian brands whose products
(jacket and smartphone) were China-made and U.S.-made in the same study.
Moreover, despite the fact that consumers indeed responded unfavorably to brands
originated from and products manufactured in certain countries, scholars cautioned that country-
of-origin effects may be varied across product categories and dependent on product features
(Agarwal & Teas, 2000; Brouthers, 2000; Chung et al., 2009; Insch & McBride, 2004; Roth &
Romeo, 1992). Additionally, Chattalas, Kramer, and Takada (2008) proposed a conceptual
framework in which the authors assumed that hedonic and utilitarian functions (Voss, Spangenberg,
& Grohmann, 2003) of a product may be able to attenuate unfavorable product evaluation caused
by consumers’ opinions and perceptions of the product’s origin countries. Furthermore, it was
evident in several studies that product attribute was positively related to consumers’ attitude
toward the parent brand and quality judgement of the branded products (Ahmed et al., 2002;
Carvalho et al., 2011; Haubl, 1996; Lee et al., 2012). Therefore, with an attempt to validate
scholars’ findings in product categories that have not been tested in previous research, the present
study proposed that product function would have positive influence on Canadian consumers’
evaluation of branded jacket and smartphone products.
Overall, there were four research questions the present study attempted to answer, in terms
of (a) whether Canadian consumers would prefer branded products manufactured in the U.S. over
branded products manufactured in China, (b) whether Canadian consumers would prefer branded
products designed in Canada over branded products designed in the U.S./China, (c) whether
Canadian consumers’ ethnocentric tendency would have positive impact on their preference of

4
branded products designed in Canada over branded products designed in the U.S./China, and (d)
whether product function would have positive influence on Canadian consumers’ evaluation of
branded products.
5
LITERATURE REVIEW
Hofstede’s Dimensions of National Culture
When it came to discuss the impact of cultural differences on human behavior and the
implication of cross-nation business management, Hofstede (1980, 2001, 2010)’s Dimensions of
National Culture is among the most comprehensive models that have been widely studied in
academia and understood in practice. According to Kirkman, Lowe, and Gibson (2006), during
1980 and June 2002, over 180 published empirical research have employed Hofstede (1980,
2001)’s model at various aggregation levels of analysis such as nation, organization, occupation,
ethnic group and individual.
Hofstede (2011)’s most up-to-date version of the definition of culture reads as “culture is
the collective programming of the mind that distinguishes the members of one group or category
of people from others” (p. 1), which is slightly different from the definition of culture appeared in
his Culture’s Consequences book published in 1980 that “culture is the collective programming of
the mind which distinguishes the members of one human group from another” (p. 25).
There were four dimensions in Hofstede’s initial cultural model, in terms of
individualism/collectivism (IDV-COL), uncertainty avoidance (UAI), power distance (PDI), and
masculinity/femininity (MAS-FEM), which were identified through a longitudinal research via
questionnaires administered among 117,000 IBM employees who worked in the company’s
foreign subsidiaries in 50 countries during 1967-1973. The four dimensions were measured by
index scales ranging from 0 to 100, and countries included in the initial IBM survey were scored
on each of the four dimensions.
The fifth element, long-term orientation (LTO) dimension, in Hofstede’s revised cultural
model was inspired by Canadian psychologist Michael H. Bond’s findings discovered through a
research conducted among students from 23 countries by using the Chinese Value Survey (CVS).
Hofstede’s index score for this LTO dimension was transformed from Bond (1988)’s original
factor scores ranging from -1.00 and .91. The LTO dimension describes “how every society has to
maintain some links with its own past while dealing with the challenges of the present and future,
and how societies prioritizes these two existential goals differently” (Hofstede, 2001: 353).
6
In the most recent edition of his book Cultures and Organizations: Software of the Mind:
Intercultural Cooperation and Its Importance for Survival, another dimension called
indulgence/restraint (IVR) appeared in Hofstede’s cultural paradigm to capture a cross-nation
behavioral pattern that he and his colleague Michael Minkov observed from the data collected via
World Values Survey (WVS). The IVR dimension is defined as “the extent to which people try to
control their desires and impulses, based on the way they were raised” (Hofstede, Hofstede, &
Minkov, 2010: 277).
The following is a comparison of Hofstede’s Dimensions of National Culture among the
U.S., Canada, and China (please see Table 1).
Insert Table 1 about here
Observed from Hofstede (1980, 2001, 2010)’s cultural indices, the U.S. and Canada exhibit
very similar cultural characteristics, whereas four of the six dimensional scores of China depart
from the other two countries significantly. Despite the fact that the U.S. and Canada have long
been perceived to belong to the same cultural group, either in the Sociocultural Clusters (Ronen &
Shenkar, 1985) or based on the cultural and psychic distance indices (Nordstrom & Vahlne, 1992),
O’Grady and Lane (1996) found several cultural differences between the two countries through
their observation of the performance of ten Canadian retail companies which also competed in the
U.S. market and comparison of values and attitudes of Chief Executive Officers of Canadian and
U.S. retail companies. Overall, the authors found that Americans are more aggressive,
achievement/action-oriented, competitive, masculine and willing to take risk, while Canadians are
more collectivist, cautious, pessimistic and uncertainty/risk averse.
Additionally, in Rawwas, Rajendran, and Wuehrer (1996)’s work, the authors categorized
Canadian culture into the hybrid culture group whose characteristics include increasingly
appreciative of world sharing and common welfare, empathy and understanding towards other
societies. When it came to examine cultural impacts on consumer behavior, Ahmed et al. (1997)
observed that compared with American research participants, Canadian research participants not
only had relatively more favorable attitude toward branded products (Automobiles, VCR, shoes)
7
designed or assembled in Mexico but also exhibited less nationalistic tendency in their product
evaluation process.
Culture and Consumer Behavior
Hofstede’s European Media & Marketing Survey (EMS) during 1995-1999 revealed a
connection between consumers’ status needs and the cultural dimension Masculinity/Femininity
that the value of watch (e.g. $150 vs. $1,500) and the number of watches a person had were
positively related to the masculinity of a nation’s culture.
Expending the research scope to include 15 European countries (U.K., Switzerland, Sweden,
Spain, Portugal, Norway, Netherlands, Italy, Ireland, Germany, France, Finland, Demark, Belgium
and Austria), De Mooij and Hofstede (2002) observed that individualism was negatively associated
with households’ food expenditure, whereas collectivism had positive effects on consumer
preference of global brands. Moreover, the uncertainty avoidance characteristic of a nation’s
culture was showed to be positively related to spending on clothing/footwear/household equipment,
while the power distance in society negatively affected consumer expenditure on leisure and
entertainment.
Furthermore, scholars who followed the lead of De Mooij and Hofstede (2002) have linked
cultural impacts to consumers’ differential brand perceptions. Foscht, Maloles III, Swoboda,
Morschett, and Sinha (2008) conducted a research among consumers from six countries, in terms
of Austria, Germany, Netherlands, Singapore, U.K. and the U.S., with an attempt to explore the
degree to which cultural differences would affect national brand’s positioning strategy and its
global competitiveness. In their study, researchers observed significant cross-nation variety in the
way consumers interpreted characteristics of a certain brand/product, especially when these
characteristics were related to Hofstede (1980, 2001)’s cultural dimensions of
masculinity/femininity, individualism, and power distance. For instance, Austrian consumers had
the strongest impression of excitement for the energy drink brand Red Bull, whereas Red Bull
received the lowest excitement rating and highest ruggedness score from Singaporeans. In terms
of the interrelation between cultural dimensions and brand perceptions, masculinity was found to
be the most powerful cultural dimension influencing Singaporeans’ brand perception, while
8
collectivism and performance orientation stood out as major contributors to U.K., Austrian and
German consumers’ perception of a brand.
Quite interestingly, Foscht et al. (2008)’s research findings actually provided supportive
evidence to De Mooij and Hofstede (2002)’s assertion that consumers would become more and
more heterogeneous instead of evolving toward homogenization because of the differences in
people’s cultural values, which was in contrary to Levitt (1983)’s viewpoint that people’s taste and
wants would become similar thus prefer standardized products that have high quality and low price
as a result of globalization. De Mooij and Hofstede (2002)’s assumption was due to their concern
that the factor rationality and the motivation to maximize utility may be absent in consumers’
perception and purchase intention of a certain brand/product. As a result, to further study the
degree of behavioral discrepancy among consumers worldwide, De Mooij and Hofstede (2011)
developed a theoretical model called Cross-Cultural Consumer Behavior Framework which was
adapted from Manrai and Manrai (1996)’s original work.
De Mooij and Hofstede (2011)’s Cross-Cultural Consumer Behavior Framework is
comprised of four factors, in terms of attributes (the “who”), income, processes (the “how”), and
cultural values, that each of them would have direct influence on consumer behavior. Additionally,
the authors proposed a mediation role for cultural values to play in the relationship between
consumer behavior and the other three components. For instance, cultural values praised by an
individual’s home country would contribute to explain the lifestyle this person chooses to live (the
“who”) and his/her product ownership and usage. Or, the cultural environment an individual was
raised up could be reflected in the way this person processes information and makes decisions (the
“how”) which would subsequently affect his/her adoption of innovative technology.
To some extent, Lanier and Kirchner (2013)’s study served as an empirical testing of the
Cross-Cultural Consumer Behavior Framework developed by De Mooij and Hofstede (2011),
although the main purpose of the authors’ research was to explore the power of Hofstede (2010)’s
6-D model together with other two factors, urbanization and per capita income, in predicting
volume consumption of Coca-Cola beverage products in four product categories (e.g. sparkling
beverages, juices and juice drinks, coffees and teas, waters) among consumers from 32 countries.
According to the analytical results, Lanier and Kirchner (2013) discovered that at the national level,
Hofstede’s six cultural dimensions alone were able to explain 46 percent of the variance in
9
consumers’ beverage consumption, and that the recently added dimension indulgence/restraint
(IVR) was able to improve the predicting power of Hofstede (1980, 2001, 2010)’s Dimensions of
National Culture model by 10 percent.
Schema Theories
Schema is a mental model representing general and abstract knowledge of a topic (Kellogg,
1995). Schemata could help a person to form expectations about and facilitate interactions with
other people and subjects as well as to guide behavior when lacking detailed information or
resources to process information (Fiske & Taylor, 1991). Among various schemas, cultural
schemas are generalized collections of knowledge obtained from past experience and tend to be
shared by members of the same group (Nishida, 1999).
Van Pham (2006) studied consumer preference of products from various countries, due to
his concern of country stereotyping effects (Gaedeke, 1973; Mohamad, Ahmed, Honeycutt, &
Tyebkhan, 2000; Samiee, 1994) on consumer evaluation of products from certain countries and
the spillover impacts on firms (brands)’ global competitiveness. The author surveyed students at
two U.S. universities for two questions: (1) their perception of products from a particular country
in terms of prestige, innovation, design and workmanship and (2) their ratings of the importance
of the above four product dimensions. Eighteen countries (the U.S., Canada, China, etc.) and four
product categories (televisions, casual clothes, personal computers, and automobiles) were
included in Van Pham (2006)’s survey questionnaire. According to the 167 usable responses, the
author observed very interesting patterns. For televisions, Japan, the U.S. and Germany received
the top three ratings of prestige, innovation and design, and Canada was ranked 6th in the
workmanship dimension. For casual clothes, France, Italy and the U.S. led the dimensions of
prestige, design and innovation respectively, and Canada was ranked the 3rd in workmanship. For
personal computers, the U.S. was the global benchmark followed by Japan, and again Canada was
ranked 6th in the workmanship dimension. In terms of automobiles, Germany, Japan and the U.S.
dominated the product category, and Canada took the 5th position in the workmanship dimension.
Similarly, Torelli and Ahluwalia (2012) found that there was a very strong association between
the electronic producer brand SONY and its origin country Japan in the minds of U.S. consumers.
10
And because of Japanese firms’ reputation as sophisticated and innovative
designers/manufacturers of electronic products, U.S. consumers assigned very favorable product
evaluations to SONY electronic cars, despite the fact that SONY does not make electronic cars but
only batteries for this type of cars. However, in the same study, it was found that U.S. consumers
perceived cappuccino-macchiato makers to have better fit with the Italian culture rather than the
Japanese culture, which negatively affected U.S. consumers’ product evaluations of Japanese
cappuccino-macchiato makers.
In fact, the above consumer behavior could be explained by Mandler (1982, 1983)’ schema
congruity/incongruity theory. Incongruity refers to the extent that structural correspondence is
achieved between the entire configuration of attribute relations associated with an object and the
configuration specified by the schema (Mandler, 1982: 10). Mandler (1982, 1983)’s assumption
was that incongruity between two subjects requires a person to devote substantial cognitive efforts
to resolve unbalanced evaluations. If the incongruity could be resolved satisfactorily, affective
responses are possible and tend to produce positive evaluations; otherwise, it would lead to
negative evaluations due to the individual’s feelings of frustration and uncertainty.
Leveraging Mandler (1982, 1983)’s schema (in)congruity theory on the research interest of
the present study, a logical question was raised that how Canadian consumers would react to and
perceive a brand and its product if there was incongruity between consumers’ schemas of the
brand/product and its countries of origin. For instance, would there be any differences in
consumers’ product evaluation between a China-made and U.S.-made Apple smartphone? Or
between a Roots’ U.S.-made and an Abercrombie & Fitch U.S.-made jacket?
Fortunately, a couple of previous research have utilized Mandler (1982, 1983)’s schema
(in)congruity theory to examine consumers’ reaction to products which had fit issues with either
the product category they belonged to or their countries of origin.
Meyers-Levy and Tybout (1989) conducted three experiments to validate Mandler (1982,
1983)’s theory that compared with scenarios of complete congruity and extreme incongruity,
moderately incongruent schemas between two subjects would result in more favorable evaluation
under the condition that moderate incongruity could be resolved successfully. Eventually the
authors generated affirmative evidence to support Mandler (1982, 1983)’s assumption in the
11
context that a newly introduced product moderately differentiated itself from competitors by
highlighting some attributes that competitors in the same product category did not have (e.g. the
beverage Slice is positioned as a soft drink but contains real fruit juice). Similar phenomena were
observed in Carvalho et al. (2011)’s research that Canadian participants responded to moderately
incongruent combination of countries of brand origin and manufacture more positively compared
with the pair of extreme incongruity. Moreover, in Carvalho et al. (2011)’s study, it was found that
providing additional information about tangible product attributes (e.g. audio-video inputs,
trilingual display) positively affected Canadian consumers’ evaluation of plasma TV sets whose
countries of brand origin and manufacture were perceived to be moderately incongruent (e.g. Peru-
Mexico) and extremely incongruent (e.g. Japan-Mexico).
However, not all scholars agreed upon the positive impacts of moderate incongruity between
a product’s country-related associations on consumers’ product evaluation. Haubl and Elrod (1999)
applied Mandler (1982, 1983)’s theory to investigate the effects of (in)congruity between country
of brand origin and country of production (COP) on consumers’ quality perception of alpine ski
products. In addition to their contribution of introducing the concept of brand-COP congruity
which is defined as the equality of a product’s COP and the home country of the brand, their
findings provided counter evidence to Mandler (1982, 1983) and Meyers-Levy and Tybout
(1989)’s viewpoint by demonstrating that perceived incongruity between a branded product’s
home country and its country of production negatively affected Austrian skiers’ quality
judgements of alpine ski products.
In line with Haubl and Elrod (1999)’s findings, Hui and Zhou (2003) discovered that when
consumers perceived a fit between a product’s country of brand origin and country of manufacture,
the country-of-manufacture cue had no significant impacts on consumers’ product evaluation and
attitude toward the parent brand. However, when the branded product was made in a less reputable
country which was perceived to be at odds with the brand’s origin country, negative influence
exerted by the manufacturer cue on consumers’ product evaluation was evident, and was showed
to have more severe damage on less competitive brands. The authors attributed their findings to
the shielding effects of brand equity (Aaker, 1991; Kim & Chung, 1997) of well-known brands
that “every known brand possesses a certain value which is determined by the popularity,
reputation and associated beliefs of the brand” (p. 133).
12
However, it is worth mentioning that Haubl and Elrod (1999) only tested their assertion on
one type of product which was alpine skis. Hui and Zhou (2003) were interested in finding out the
differential effects of schema incongruity on well-known brands and relatively unfamiliar brands,
and there was also only one product included in their experiments, digital cassette players.
Consequently, the generalizability of their findings shall be interpreted with caution, since whether
their research findings were applicable to products other than alpine skis and digital cassette
players remained a question. Fortunately, researchers have noticed this weakness in research
design and addressed the issue by testing multiple product categories in one study.
Building on Mandler (1982, 1983)’s theory, Hamzaoui and Merunka (2006) developed a
model to test their hypothesis that perceived fit between a country and a product category could
influence consumers’ perceptions of product quality in a way that positive country-of-origin
associations, for instance countries that have strong manufacturing skills or design expertise, may
be projected on consumers’ product evaluation when the product category was perceived to have
a fit with that country. There were two types of product tested in their research, in terms of
television sets and automobiles. The authors’ rationale of choosing these products were from the
consideration that the former was “a private product which offers little social distinction” while
the latter was “a more symbolic product that can communicate status to others” (p. 146). According
to the analytical results, the authors found that perceived quality of automobiles was only affected
by the fit between product and country of design, whereas both product/design country fit and
product/manufacturing country fit exerted significant influence on TV set products. In another
study conducted by Hamzaoui-Essoussi and Merunka (2007) whose purpose was to replicate their
previous research in an emerging country, similar results were obtained. The authors observed that
both perceived product/design country fit and product/manufacturing country fit positively
affected Tunisian consumers’ quality perceptions of TV sets and automobiles.
Quite interestingly, in a recently published empirical paper by Hamzaoui-Essoussi, Merunka,
and Bartikowski (2011), researchers shifted their attention to study the interaction effects of
country of brand origin and country of manufacture on Tunisian consumers’ brand attitude and
quality perception of cars and TV sets whose parent brands have various levels of global awareness
(e.g. Mercedes-Benz versus Opel, SONY versus Sharp). There were two major takeaways from
their study. First, it was found that countries of brand origin and manufacture indeed affected
13
consumers’ brand attitude and quality perception that Tunisian consumers strongly preferred
brands/products from countries that enjoy global reputation and know how to do the job best. The
other interesting finding was that country-of-manufacture effects were showed to have different
manifestations on TV set and automobile products. More specifically, for automobiles from
reputable and popular brands (e.g. Mercedes-Benz), the manufacturing location of their products
did not affect consumers’ brand attitude and quality perception. However, for TV sets, both
countries of brand origin and manufacture were showed to influence Tunisian participants’ attitude
toward the parent brand and quality judgement of the branded products, regardless of whether the
parent brand is well-known (e.g. SONY) or relatively unfamiliar (e.g. Telefunken).
Country of Origin
Country of origin is defined as the country where the headquarters of the company that
manufactures and markets the product or brand is located (Johansson et al., 1985).
Virtually the first country-of-origin study was conducted by Schooler (1965) among
Guatemala participants, with an attempt to compare Guatemala consumers’ opinions of products
from four Central American countries with their reaction to products originated from their home
country. Ever since Schooler (1965)’s first attempt to study the country-of-origin effects on
consumer behavior, a lot of researchers have been attracted to this topic.
In 1982, Bilkey and Nes published a paper qualitatively reviewing findings of previous
studies that had investigated country-of-origin effects on consumer behavior, by means of which
the authors aimed to highlight the importance of understanding how informational cues, such as
the location of brand origin and manufacturer, could affect consumers’ product evaluation and
purchase decision. According to Bilkey and Nes (1982), country-of-origin effects were
generalizable to both brands and products, and stereotyping behavior was evident among the U.S.,
British, Finnish, Swedish, Japanese, Guatemalan, Turkish, Indian and Taiwanese research
participants. Moreover, the authors pointed out that manifestations of country-of-origin effects on
consumer behavior could be influenced by factors such as demographic variables (e.g. education,
ethnicity) and personality variables (e.g. status seeking, conservatism). Furthermore, they urged
future research to conduct multiple-cue experiments (in addition to the country-of-origin cue, also
14
include cues like brand name, manufacturing location, product attribute, etc.), for the sake of
exploring the interrelation between the country-of-origin cue and other informational cues.
Tracing back to the work of scholars who initiated the multiple-cue research as to reply the
call of Bilkey and Nes (1982), Johansson et al. (1985) compared U.S. participants’ product
evaluation of attributes (e.g. safety, driving comfort) of automobiles originated from three
countries, in terms of Japan, the U.S. and Germany, and found that the country-of-origin cue had
some impact on participants’ differential performance ratings of cars. Han (1989) examined the
role of country image on consumer evaluation of TV sets and cars, and observed that consumers
indeed took country image into account when making products’ performance evaluations. In Han’s
follow-up study conducted in 1990, the results indicated that consumers’ willingness to buy a
product (again TV sets and cars were the products tested in his follow-up research) was related to
the product’s origin country’s characteristics in economic and cultural aspects and the similarity
between the country from which research participants came and the product’s country of origin.
Another significant advance in the multiple-cue research was Roth and Romeo (1992)’s
study. The authors proposed a theoretical framework in which they assumed that country-of-origin
effects may be manageable if the features of a product category and consumers’ perception of the
product’s country of origin were matched. According to the analytical results of their study, it was
found that consumers’ willingness to buy a product was indeed varied across product categories
or to some extent dependent on the match between a product category and its country of origin.
For instance, for automobiles and watches, consumers preferred to buy from countries like Japan
and Germany; but for products like beer, leather shoes and crystals, there were no significant
variation observed in consumer preference.
Fast forward to 1995, Peterson and Jolibert (1995) performed a meta-analysis on 52
empirical papers, with an attempt to find out possible reasons causing the variability of effect size
observed in previous country-of-origin studies. Throughout their analyses of the methodologies
and research designs utilized in previous studies, the authors found that country-of-origin cues had
relatively stronger predicting power on consumers’ quality perception than purchase intention, and
employing student sample did not compromise the explanation power of analytical results.
Moreover, the authors had evidence to suggest that studies using single-cue produced larger
country-of-origin effect size than studies using multiple cues, which might lead to a consequence
15
of overstating the influence exerted by the country-of-origin cue on consumers’ product evaluation
when it was used alone. Furthermore, they discovered a positive correlation between sample size
(260 study participants or more) and the size of country-of-origin effects.
Later on, scholars discovered other mechanisms influencing the manifestations of country-
of-origin effects on consumers’ product evaluation, in addition to the factors, such as perceived
country image (Han, 1989, 1990; Roth & Romeo, 1992), product attribute (Johansson et al., 1985;
Roth & Romeo, 1992) and the similarity between consumers’ home country and foreign countries
(Han, 1990), discovered in previous studies.
Hanne (1996) found that Danish firms in industries such as foodstuffs and dairy products as
well as design goods and furniture preferred to emphasize their country-of-origin association when
promoting products to consumers and exporting companies, but played down their country of
origin or “disguised themselves behind a local or global image” for industrial products and
financial services. Agarwal and Sikri (1996) discovered positive transferable effects of consumers’
pre-existing favorable country-of-origin perceptions of Japanese and German cars on new products,
such as trucks and mountain bikes, from these two countries. Manrai, Lascu, and Manrai (1998)
generated affirmative evidence to suggest that perceived level of economic development of a
nation not only positively affected consumer evaluation of products from that country, but also
was able to mediate consumer evaluation of products from different product categories; for
instance, consumer evaluation was showed to be the most favorable for luxury goods from highly-
developed countries (e.g. France). Leonidou, Hadjimarcou, Kaleka, and Stamenova (1999)
enriched the knowledge of country-of-origin effects by including Asian Pacific samples (Japan,
Hong Kong, Singapore, Indonesia and India), and revealed a pattern of consumer behavior that
Bulgarian consumers tend to rely on experiential knowledge coupled with opinions of reference
groups like friends and relatives to make evaluations of products from the above five Asian regions.
The last but not the least, Gurhan-Canli and Maheswaran (2000) examined the impact of cultural
orientation on consumer preference of products from foreign countries, and observed that Japanese
participants favored domestic products over products from the U.S. regardless of product
performance, whereas U.S. participants’ evaluation process appeared to be relatively more rational
that they only favored U.S. products when these products had superior performance.
16
As a matter of fact, Gurhan-Canli and Maheswaran (2000)’s observation of Japanese
consumers’ reaction to domestic products was in line with a behavioral pattern called consumer
ethnocentrism, which has already attracted scholars’ research interest.
Consumer Ethnocentrism
Ethnocentrism is defined as “the view of things in which one’s own group is the centre of
everything, and all others are scaled and rated with reference to it” (Sumner, 1906: 13). Consumer
ethnocentrism is a construct developed by Shimp and Sharma (1987), which is defined as “trait-
like property of an individual’s personality that encompasses the beliefs held by the consumers
about appropriateness, indeed morality, of purchasing foreign-made products” (p. 280).
Watson and Wright (2000) examined New Zealand consumers’ attitude toward products
from foreign countries in product categories that domestic alternatives were not available, and
found that consumers who exhibited relatively strong ethnocentric trait responded to foreign
products from countries which were culturally similar to New Zealand more positively. Likewise,
in Kaynak and Kara (2002)’s study, ethnocentric Turkish consumers expressed more favorable
attitude toward and purchase intention of products from culturally similar countries. Moreover, in
the same study, the authors found that Turkish participants had significantly different perceptions
of attributes of products from foreign countries depending on these countries’ socio-economic and
technological development, which provided affirmative evidence to support Han (1990) and
Manrai et al. (1998)’s viewpoint. Furthermore, consumer ethnocentrism was showed to have
positive influence on Turkish consumers’ willingness to purchase domestic products, even in the
scenario that domestic products were relatively inferior compared with products from foreign
countries. Another interesting finding illustrating the power of consumer ethnocentric tendency on
consumer preference of domestic goods was emanated from Hustvedt, Carroll, and Bernard
(2013)’s study that U.S. consumers, regardless of whether they scored high or low on Shimp and
Sharma (1987)’s CET scale, were willing to pay a significant premium for wool sweaters whose
fibre origin or manufacturing origin was the U.S.
However, Bruning (1997) observed that Canadian consumers’ preference of air travel carrier
was mainly determined by the price factor followed by their national loyalty. Balabanis and
17
Diamantopoulos (2004) also had affirmative evidence to suggest that consumer ethnocentrism may
be contingent. In their study, U.K. participants’ preference of Britain products was varied across
product categories (e.g. U.K. consumers’ first choice of country of origin for TV sets was Japan),
and consumer ethnocentrism was showed to be positively yet marginally related to U.K.
participants’ preference of domestic products. Moreover, Balabanis and Diamantopoulos (2004)
discovered that neither cultural similarity nor economic development/competitiveness of foreign
countries were able to mediate the relationship between U.K. participants’ ethnocentrism and their
preference of foreign products, which served as counter evidence to the findings of previous
studies (Han, 1990; Kayank & Kara, 2002; Manrai et al., 1998).
In spite of the above interesting yet inconsistent findings, the notion that more educated
consumers exhibit lower levels of ethnocentrism was evident in several studies (Javalgi, Khare, &
Gross, 2005; Klein, Ettenso, & Morris, 1998; Sharma, Shimp. & Shin, 1995; Shimp & Sharma,
1987). It was also found that on average, participants from collectivist cultures showed higher
levels of ethnocentric tendency (Javalgi et al., 2005; Sharma et al., 1995; Shimp & Sharma, 1987;
Nishida, 1990). Furthermore, cultural openness was showed to have a negative correlation with
consumer ethnocentrism (Javalgi et al., 2005; Sharma et al., 1995; Shimp & Sharma, 1987).
Relying on scholars’ findings regarding the effects of the country-of-origin cue and
consumer ethnocentric tendency on consumer preference of domestic products, a couple of
hypotheses would be laid out, aiming to explore the impacts of these two factors on Canadian
consumers’ brand attitude, quality perception and purchase intention of branded products designed
in Canada versus branded products designed in foreign countries such as the U.S.
Country of Design & Manufacture
As one of the components of the country-of-origin construct, country of manufacture is
referred to the country that “produces or assembles the branded product” (Laufer, Gillespie, &
Silvera, 2009), which is usually communicated to consumers by means of “made in” labels. In the
present study, the term country of design is interchangeable with the term country of brand origin
which is defined as “the place, region or country to which the brand is perceived to belong by its
target consumers” (Thakor & Kohli, 1996). For instance, Roots and BlackBerry are designed in
18
Canada, Abercrombie & Fitch and Apple are designed in the U.S., and Semir and HUAWEI are
designed in China.
Comparing the definition of country of origin with the definitions of country of manufacture
and country of brand origin, it is apparent that the globalization trend has not only facilitated
international trade and communication among nations, but also affected the way firms make
strategic decisions. With an intensifying competition in the global market, companies strive to
develop their internal competitiveness meanwhile seek every means to improve profitability by
shifting out partial or all of their non-core corporate activities to partners who could provide cost
benefit but may reside in very remote countries. Given the consequence of this organization
practice such as its influence on consumers’ perceptions of product quality and subsequent
purchase intentions, scholars have paid close attention to investigate the effects of the decomposed
country-of-origin construct on consumer behavior and the parent brand.
Haubl (1996) found that both the country-of-manufacture (Czech Republic) cue and brand
name (Mercedes-Benz) had significant impacts on German and French consumers’ attitude toward
a hypothetical new automobile model introduced by the parent brand. To be specific, brand name
was found to have a direct impact on consumers’ brand attitude, while the influence exerted by the
country-of-manufacture cue on consumer attitude and purchase intention was mediated by the
car’s appearance and other features such as infrequent repairs and superb quality. Ahmed, d’Astous,
and Eljabri (2002)’s study revealed that the country-of-manufacture cue had less unfavorable
impacts on consumer evaluation of technologically simple products than technologically complex
products (in their study, technologically simple products were referred to televisions versus
computers which were categorized as technologically complex products). And in the same study,
the authors generated affirmative evidence to support their hypothesis that providing product-
related information such as brand name and warranty was able to attenuate the negative influence
exerted by the country-of-manufacture cue on Canadian consumers’ quality perception of
computer products.
Insch and McBride (2004)’s research findings indicated that country-of-origin effects were
not only product-specific, but also varied between participant populations. More specifically, both
the U.S. and Mexican research participants emphasized country-of-assembly cue for televisions,
country-of-parts-manufactured cue for shoes, and country-of-design cue for bikes. However,
19
unlike U.S. consumers who tend to utilize all of the three country-related informational cues to
make quality evaluations, Mexican participants exhibited a tendency to rely on a single piece of
country-related informational cue to derive quality judgements, for instance, country-of-assembly
cue solely for televisions and country-of-parts-manufactured cue alone for athletic shoes. When
attributing possible explanations to the observed behavioral discrepancy between the U.S. and
Mexican participants, the authors assumed that product functionality may be partially responsible
for the variation in participants’ focus on country-of-origin cues, and raised a research question
that “whether there was a differing country-of-origin effect for fashion (style-related) products as
opposed to more generic and purely functional products” (p. 8).
Before introducing the final construct in the present study, it would be helpful to review the
findings of several relatively recent country-of-origin studies. As mentioned in the introduction of
the present study, Chung and his colleagues (2009) observed that Korean consumers had negative
purchase intention of Malaysia-made LG televisions. Lower consumer preference and unfavorable
product evaluation of Poland-made Panasonic and Turkey-made LG televisions were also evident
among Lithuanian participants approached by Dikčius and Stankevičienė (2010). Moreover,
Australian consumers in Lee et al. (2012)’s study expressed negative attitude toward and quality
perception of made-in-China products from the American luxury brand CK. Schniederjans and his
co-workers (2004) even found that in most product categories surveyed in their study, made-in-
China products’ average quality rating was below the mean score of products made by other
countries of manufacture, and that U.S. consumers perceived non-China-made products to have
greater net value than their made-in-China counterparts.
However, counter evidence did exist. In the same study, Chung and his colleagues (2009)
did not find evidence to suggest that the Mexico-made cue exerted negative influence on Korean
consumers’ purchase intention of Ralph Lauren sweaters. U.S. participants surveyed by Fetscherin
and Toncar (2010) also expressed neutral attitude toward U.S. automobiles which had parts
manufactured in China. Moreover, Hamzaoui-Essoussi et al. (2011)’s analytical results indicated
that for well-known automobile brands (e.g. Mercedes-Bens, Hyundai), the manufacturing
location influenced neither brand image nor product quality in the eyes of Tunisian car owners.
Among the pioneers who studied the country-of-manufacture effects, Tse and Gorn (1993) and
Ulgado and Lee (1993) also observed insignificant influence exerted by the country-of-
20
manufacture cue on consumers’ quality judgements of products from both strong and weak brands.
Leveraging on the knowledge obtained from researchers’ previous work, the present study
was interested in finding out how Canadian consumers would react to the country-of-manufacture
cue by means of comparing Canadian consumers’ brand attitude, quality perception and purchase
intention of branded products made by two countries of manufacture (the U.S. and China), for
instance, Roots’ made-in-China jackets versus made-in-U.S. jackets and BlackBerry’s made-in-
China smartphones versus made-in-U.S. smartphones.
Product Function
Referring to De Mooij and Hofstede (2002), they argue that the factor rationality and the
incentive of utility maximization may be absent when consumers derive product evaluations and
make purchase decisions, and that consumers’ needs and wants will become more and more
heterogeneous because of the differences in people’s cultural values. However, under the
consideration of the present study, there shall be a reason why consumers prefer one brand/product
over another. And in fact, there is evidence in the literature to suggest that consumers make choices
based on justifiable reasons. Previous country-of-origin studies have discovered a variety of factors
influencing consumers’ preference and evaluation of products, such as perceived image of a
product’s countries of origin (Agarwal & Sikri, 1996; Carvalho et al., 2011; Han, 1989, 1990), a
nation’s level of economic development (Han, 1990; Manrai et al., 1998; Kaynak & Kara, 2002),
cultural similarity between consumers’ home country and foreign countries (Han, 1990; Kaynak&
Kara, 2002; Manrai et al., 1998; Watson & Wright, 2000), consumer ethnocentrism (Balabanis &
Diamantopoulos, 2004; Gurhan-Canli & Maheswaran, 2000; Hustvedt et al., 2013; Kaynak & Kara,
2002), brand reputation (Hamzaoui-Essoussi et al., 2011; Haubl, 1996; Hui & Zhou, 2003),
experiential knowledge (Leonidou et al., 1999) and product feature (Ahmed et al., 2002; Hanne,
1996; Haubl, 1996; Insch & McBride, 2004; Roth & Romeo, 1992).
Moreover, scholars have even discovered that some of the above factors were able to
mediate the effects of country-of-origin cues on consumers’ preference and evaluation of branded
products. In Haubl (1996)’s research, the author found that the influence exerted by the country-
of-manufacture cue on German and French consumers’ attitude toward the well-known brand
21
Mercedes-Benz and consumers’ purchase intention of a new automobile model introduced by the
parent brand were mediated by the car’s appearance and product features such as infrequent repairs
and superb quality. Carvalho and his co-workers (2011) examined the interrelation between
tangible product attributes (e.g. audio-video inputs, trilingual display) and country-related
associations, and eventually generated affirmative evidence to suggest that the strength of tangible
product attributes not only had a positive impact on Canadian consumers’ attitude toward plasma
TV set products but also determined Canadian consumers’ attitude toward TV set products when
there was incongruity between the products’ country of brand origin and country of manufacture.
Additionally, Lee and his affiliates (2012) also found that between the two underwear brands
examined in their study (CK versus Bond), status-seeking Australian consumers preferred the
foreign luxury brand CK over the domestic (Australian) brand Bond because of the symbolic/social
meaning (e.g. wealth, status) embedded in the American luxury brand’s name. Furthermore,
Chattalas and his colleagues (2008) proposed a conceptual framework in which the authors
assumed that hedonic and utilitarian functions (Voss et al., 2003) of a product may be able to
attenuate unfavorable consumer evaluation caused by consumers’ opinions and perceptions of the
product’s countries of origin.
Following the footsteps of these scholars, the present study attempted to conduct a
preliminary experiment to explore the relationship between the construct of product function and
Canadian consumers’ evaluation of products which were designed and manufactured in different
countries. The construct of product function would be comprised of three dimensions, in terms of
hedonic, utilitarian and symbolic. Hedonic dimension is “resulted from sensations derived from
the experience using products” (Holbrook & Hirschman, 1982; Voss et al., 2003). Utilitarian
dimension is “derived from functions performed by products” (Holbrook & Hirschman, 1982;
Voss et al., 2003). Symbolic dimension includes two aspects in terms of social-adjustive function
which “helps people maintain relationships and gain approval in social situations” and value-
expressive function which “helps people communicate their central beliefs, attitudes and values to
others” (Wilcox, Kim, & Sen, 2009: 248).
22
OVERVIEW AND HYPOTHESES
Country of Design (Brand Origin)/Manufacture Fit
Previous research findings pointed out that despite their nationality, research participants
had relatively more favorable attitude toward and quality perception of products from
economically advanced countries because of these nations’ trustworthy country image and superior
know-how (e.g. manufacturing, design, innovation) expertise (Han, 1989, 1990; Kaynak & Kara,
2002; Manrai et al., 1998; Van Pham, 2006). Moreover, cultural similarity between research
participants’ home country and a product’s countries of origin was also showed to have positive
impacts on research participants’ preference of and willingness to buy products from foreign
countries (Han, 1990; Kaynak & Kara, 2002; Manrai et al., 1998; Watson & Wright, 2000).
According to available cultural indices (Hofstede, 1980, 2001, 2010; Nordstrom & Vahlne, 1992;
Ronen & Shenkar, 1985), the U.S. and Canada are culturally similar countries, compared with the
cultural distance between Canada and China. And in terms of the economic aspect of country
similarity, the U.S. and Canada shall also be perceived to have a relatively congruent country-
related association, compared with the pair of country association between Canada and China.
Furthermore, studies that have directly assessed the effects of (in)congruity between country
of brand origin and country of manufacture on consumers’ product evaluation had affirmative
evidence to suggest that incongruity between country-related associations negatively affected
consumers’ attitude toward the parent brand and quality judgement of the branded products
(Carvalho et al., 2011; Hamzaoui & Merunka, 2006; Hamzaoui-Essoussi & Merunka, 2007;
Hamzaoui-Essoussi et al., 2011; Haubl & Elrod, 1999; Hui & Zhou, 2003).
Leveraging on the above research findings, the first hypothesis proposed in the present study
was modified based on Haubl and Elrod (1999)’s original hypothesis and was read as:
𝐇1: Consumers’ (a) brand attitude, (b) quality perception and (c) purchase
intention of branded products will be more favorable when there is congruity
between branded products’ country of brand origin (design) and country of
manufacture than when there is not.
23
Consumer Ethnocentrism
Previous research findings regarding the impact of consumer ethnocentric tendency (CET)
on consumer preference of domestic brand/product(s) were mixed in the literature, in a sense that
research participants from certain countries (e.g. Turkey, the U.S.) preferred domestic goods
unconditionally (Gurhan-Canli & Maheswaran, 2000; Hustvedt et al., 2013; Kaynak & Kara, 2002)
whereas in other studies the manifestation of consumer ethnocentric tendency was showed to be
varied across product categories (Balabanis & Diamantopoulos, 2004; Bruning, 1997) and affected
by factors such as a person’s education level (Javalgi et al., 2005; Klein et al., 1998; Sharma et al.,
1995; Shimp & Sharma, 1987) and a nation’s cultural openness (Javalgi et al., 2005; Sharma et al.,
1995; Shimp & Sharma, 1987). For instance, in Balabanis and Diamantopoulos (2004)’s research,
majority of U.K. consumers rated Japan as their first choice of country of origin for TV sets, and
in product categories such as food products and furniture, the correlation between consumer
ethnocentrism and preference of domestic goods was positive yet marginal. Among the limited
number of empirical research that have tested the construct of consumer ethnocentrism in the
Canadian context, Burning (1997) found that Canadian consumers’ national loyalty was ranked
behind the price factor when they were making purchase decisions of international air carriers. As
Balabanis and Diamantopoulos (2004) pointed out, the practical value of the construct of consumer
ethnocentrism may be variable “depending on both the product category under consideration and
the specific (foreign) country of origin involved” (p. 91).
Therefore, to investigate the effect of consumer ethnocentrism in the Canadian context and
on product categories that have not been examined yet, the following two hypotheses, which were
original to Balabanis and Diamantopoulos (2004), were proposed in the present study:
𝐇𝟐 : Consumer ethnocentrism will be positively related to consumers’ (a)
brand attitude, (b) quality perception and (c) purchase intention of branded
products designed domestically.
𝐇𝟑: The magnitude of the positive link between consumer ethnocentrism and
consumers’ (a) brand attitude, (b) quality perception and (c) purchase
intention of branded products designed domestically will vary depending on
the specific product category involved.
24
Product Function
As highlighted previously, Haubl (1996) discovered a mediation effect of automobiles’
features (e.g. infrequent repairs, superb quality) on German and French consumers’ brand attitude
toward the parent brand (Mercedes-Benz) and purchase intention of the branded products.
Chattalas and his colleagues (2008) had an assumption that hedonic and utilitarian functions (Voss
et al., 2003) of a product may be able to attenuate unfavorable consumer evaluation caused by
consumers’ opinions and perceptions of the brand/product’s countries of origin. Carvalho and his
co-workers (2011)’s study results demonstrated a positive impact of tangible product attributes
(e.g. audio-video inputs, trilingual display) on Canadian consumers’ attitude toward plasma TV
sets when there was incongruity between the products’ countries of brand origin and manufacture.
Furthermore, Lee and his affiliates (2012) had evidence to suggest that the symbolic/social
meaning embedded in luxury brand’s name positively affected status-seeking Australian
consumers’ brand/product preference.
Therefore, following the lead of these scholars, similar hypotheses were laid out in the
present study. And from the consideration that the construct of product function has not been
directly measured in previous country-of-origin studies, only main effects between product
function and consumer evaluation of branded products were proposed.
𝐇𝟒𝐚 : Hedonic function will be positively related to consumers’ (a) brand
attitude, (b) quality perception and (c) purchase intention of branded products.
𝐇𝟒𝐛: Utilitarian function will be positively related to consumers’ (a) brand
attitude, (b) quality perception and (c) purchase intention of branded products.
𝐇𝟒𝐜: Symbolic function (value-expressive aspect) will be positively related to
consumers’ (a) brand attitude, (b) quality perception and (c) purchase
intention of branded products.
𝐇𝟒𝐝: Symbolic function (social-adjustive aspect) will be positively related to
consumers’ (a) brand attitude, (b) quality perception and (c) purchase
intention of branded products.
25
METHODLOGY
To explore the interrelation among country of design (brand origin)/manufacture fit,
consumer ethnocentrism, product function and consumers’ product evaluation (brand attitude,
quality perception and purchase intention), the following methodology was utilized. Research
design, participants, procedures, measures, and statistical tools used in the present study were
described below.
Research Design
This research project was a quantitative cross-sectional research comprised of a within-
subjects pilot study and a between-subjects main study. Data was collected from undergraduate
students at Concordia University via two online questionnaires.
There were three independent variables (country of brand origin/manufacture fit, consumer
ethnocentrism, product function) and three dependent variables (brand attitude, quality perception
and purchase intention) examined in the present study. Two types of product (jacket and
smartphone) and six brands (Roots, Abercrombie & Fitch, Semir, BlackBerry, Apple, HUAWEI)
were included in experiments.
The purpose of the pilot study was to assess research participants’ involvement with the two
types of product and familiarity with the six chosen brands as well as to ensure the effectiveness
of the stimuli of country of design (brand origin) and country of manufacture. The rationale of
designing a between-subjects main study was to lower participants’ fatigue, considering the
number of questions they need to answer. More importantly, the country-of-manufacture stimulus
was either made in China or made in the U.S., and the country-of-design (brand origin) stimulus
had three levels in terms of designed in Canada, designed in the U.S., and designed in China,
resulting in six combinations of country of design (brand origin)/manufacture fit association for
each of the two types of product included in the present study.
The following is a table demonstrating the combinations of country-related stimuli used in
this research project (please see Table 2).
26
Insert Table 2 about here
To reduce the effects of assignment bias, randomization of question blocks was implemented
in both the pilot study and the main study (MacKenzie, 2013: 175). For instance, items assessing
participants’ brand attitude toward Roots were grouped into one question block, BlackBerry’s
brand attitude questions were clustered under the same block, so on so forth for all of the six brands
included in the present study. Once participants gave their consent to participate, they would be
randomly assigned a block of questions regarding a certain brand. This randomization process
went through for all of the six brands they need to evaluate.
Participants
Pilot study. The pretest was conducted on March 19th 2014 among 31 undergraduate students at
Concordia University. There was no missing information in the pilot study’s demographic
questions (please see Appendix 2). The mean age of participants was 20.97 years old with a
standard deviation of 2.21 years (𝑀𝑎𝑔𝑒= 20.97, Max= 27, Min= 18, SD= 2.21, N= 31).
The following is a table describing the characteristics of research participants approached in
the pilot study of this research project (please see Table 3).
Insert Table 3 about here
Main study. The main study was carried out over a period from September 17th to September
25th 2014. Data was collected from 278 undergraduate students who registered for the same
commerce course in the 2014 Fall semester at Concordia University. Sixteen participants left the
questionnaire halfway thus did not proceed to the block of demographic questions which was at
the end of the questionnaire. The mean age of participants was 21.46 years old with a standard
deviation of 3.60 years (𝑀𝑎𝑔𝑒= 21.46, Max= 39, Min= 17, SD= 3.60, N= 262).
27
The following is a table describing the characteristics of research participants approached in
the main study of this research project (please see Table 4).
Insert Table 4 about here
Procedures
Anonymous links provided by Qualtrics (www. qualtrics.com) to the questionnaires used
in the present study were posted on participants’ course Moodle. Participants had free access to
the links until survey was closed. Consent form was presented to prospective participants prior to
they started filling out questionnaires (please see Appendix 1). Stated in the consent form,
prospective participants were informed about the topic of the present study and that it was a
student’s research project. The consent form also clearly spelled out that prospective participants
were not obligated to participate in the present study or complete the questionnaire, and they were
free to withdraw from this study without any negative consequences to them.
Measures & Scales
Pilot study. Nine scales and two sets of manipulation check were included in the pretest. Before
conducting analyses, data was first cleaned then examined for missing values by using IBM SPSS
Statistics version 22. The Missing Value Analysis pointed out that there was one missing response
in the dataset, which was in the first item of the brand attitude scale measuring the brand HUAWEI.
To produce unbiased parameter estimates and given the number of usable cases after removing the
missing value was still statistically meaningful, listwise deletion method was utilized.
Involvement with Product Category (Coulter, Price, & Feick, 2003; please see Appendix
3). The nine items original to Coulter et al. (2003) were used to measure a person’s interest in a
certain product category. Participants’ responses to this measure would indicate whether a certain
type of product was appropriate for testing university undergraduate students. Participants were
asked to rate nine statements (e.g. Jackets tell others about me; Smartphones are important to me)
on a 5-point Likert scale (Strongly disagree= 1, Strongly Agree= 5). An alpha of .92 was reported
28
for this scale by Coulter et al. (2003). In the present study, an alpha of .84 was reported for jackets
(𝑀𝑗𝑎𝑐𝑘𝑒𝑡= 27.68, SD= 6.41, N= 31), and an alpha of .85 was reported for smartphones (𝑀𝑝ℎ𝑜𝑛𝑒=
30.48, SD= 5.63, N= 31).
Attitude toward Hedonic Product/Brand (Voss, Spangenberg, & Grohmann, 2003; please
see Appendix 4). The five items measuring a person’s attitude resulting from sensations derived
from experience or sensations one imagines would be experienced were adapted from Voss et al.
(2003)’s original work. Participants were asked to indicate their attitude toward each type of
product on a 5-point semantic differential (e.g. Smartphones are … Not enjoyable= 1, Enjoyable=
5). An alpha of .95 was reported for this scale by Voss et al. (2003). In the present study, an alpha
of .90 was reported for jacket products (𝑀𝑗𝑎𝑐𝑘𝑒𝑡= 17.10, SD= 4.59, N= 31), and an alpha of .81
was reported for smartphone products (𝑀𝑝ℎ𝑜𝑛𝑒= 22.65, SD= 2.63, N= 31).
Attitude toward Utilitarian Product/Brand (Voss, Spangenberg, & Grohmann, 2003;
please see Appendix 4). The five items measuring a person’s attitude resulting from perceptions
of the functional performance of a product/brand or its expected performance were also adapted
from Voss et al. (2003)’s original scale. Sample item from this scale was “Jackets are …” (Not
necessary= 1, Necessary= 5). An alpha of .95 was reported for this scale by Voss et al. (2003). In
the present study, an alpha of .87 was reported for jacket products (𝑀𝑗𝑎𝑐𝑘𝑒𝑡= 23.19, SD= 2.65, N=
31), and an alpha of .76 was reported for smartphone products (𝑀𝑝ℎ𝑜𝑛𝑒= 23.23, SD= 2.36, N= 31).
Attitude toward Symbolic Product/Brand ((Wilcox, Kim, & Sen, 2009; please see Appendix
4). The eight items measuring a person’s attitude toward the symbolic function of a product/brand
were borrowed from Wilcox et al. (2009). Participants were asked to assess eight statements (e.g.
Jackets reflect the kind of person I see myself to be; Using smartphones is a symbol of social status)
on a 5-point Likert scale (Strongly disagree= 1, Strongly Agree= 5). In Wilcox et al. (2009)’s study,
an alpha of .89 was reported for the four items measuring the value-expressive dimension, and an
alpha of .74 was reported for the four items measuring social-adjustive dimension. In the present
study, the value-expressive items had an alpha of .93 for jacket products (𝑀𝑗𝑎𝑐𝑘𝑒𝑡= 12.48, SD=
4.52, N= 31), and an alpha of .89 for smartphone products (𝑀𝑝ℎ𝑜𝑛𝑒= 13.19, SD= 3.85, N= 31); the
social-adjustive dimension generated an alpha of .95 for jacket products (𝑀𝑗𝑎𝑐𝑘𝑒𝑡= 11.29, SD=
4.83, N= 31), and an alpha of .84 for smartphone products (𝑀𝑝ℎ𝑜𝑛𝑒= 13.45, SD= 3.67, N= 31).
29
Attitude toward Product Attribute (Beaudoin, Moore, & Goldsmith, 1998; Phau & Yip,
2008; please see Appendix 5). The original scale was intended to measure the degree of
importance of each of the twelve product attributes when respondents purchase clothes in
Beaudoin et al. (1998) and Phau and Yip (2008)’s studies. In the present study, all of the twelve
product attributes were utilized to measure jacket products, while only eleven items (removal of
the appropriate for occasion item) were used in the case of smartphones. Moreover, in previous
studies which had employed this measure, researchers simply replicated the scale based on the
reasoning that the twelve attributes were ascertained by a review of past research and experts in
the apparel field. Therefore, to determine the reliability of this scale and the appropriateness of
using eleven attributes for smartphone products, this scale was included in the pilot study.
Participants were asked to rate the importance of product attributes (e.g. quality, good price)
for each type of product on a 5-point Likert scale (Not important at all= 1, Extremely important=
5). In the present study, an alpha of .74 was reported for jacket products (𝑀𝑗𝑎𝑐𝑘𝑒𝑡= 49.84, SD=
5.01, N= 31), and an alpha of .79 was reported for smartphone products (𝑀𝑝ℎ𝑜𝑛𝑒= 42.84, SD= 5.84,
N= 31).
Brand Familiarity (Simonin & Ruth, 1998; please see Appendix 6). The three items
measuring a person’s familiarity with brand names were original to Simonin and Ruth (1998). In
the present study, this measure was used to assess whether participants could recognize a certain
brand, from the concern that if participants do not know the brand then it would not make sense to
have them answer questions about their attitude toward and quality perception of that brand.
Participants were asked to indicate the degree of familiarity with the six chosen brands in
the present study on a 5-point Likert scale (e.g. How familiar are you with the brand Roots? Very
unfamiliar= 1, Very familiar= 5). In Simonin and Ruth (1998)’s study, alphas of .80 and .94 were
reported for the scale used with car brands and microprocessor brands respectively. In the present
study, an alpha of .95 for the brand Roots (𝑀𝑅𝑜𝑜𝑡𝑠= 12.26, SD= 3.27, N= 31), an alpha of .94 for
the brand A&F (𝑀𝐴𝐹= 11.48, SD= 3.00, N= 31), an alpha of .96 for the brand Semir (𝑀𝑆𝑒𝑚𝑖𝑟= 3.52,
SD= 1.65, N= 31), an alpha of .77 for the brand BlackBerry (𝑀𝐵𝐵= 12.87, SD= 2.32, N= 31), an
alpha of .85 for the brand Apple (𝑀𝐴𝑝𝑝𝑙𝑒= 14.81, SD= 0.65, N= 31), an alpha of .98 for the brand
HUAWEI (𝑀𝐻𝑈𝐴𝑊𝐸𝐼= 4.06, SD= 2.54, N= 31) were reported.
30
Brand Attitude (Sengupta & Johar, 2002; please see Appendix 10). The three items
measuring a consumer’s opinion of a certain brand’s product were adapted from Sengupta and
Johar (2002)’s work. Participants were asked to evaluate chosen brands’ products on a 5-point
Likert scale (e.g. I think Roots makes very good jackets. Strongly agree= 1, Strongly disagree= 5).
An alpha of .93 was reported for the scale by Sengupta and Johar (2002). In the present study, an
alpha of .90 for Roots (𝑀𝑅𝑜𝑜𝑡𝑠= 10.52, SD= 2.59, N= 31), an alpha of .69 for A&F (𝑀𝐴𝐹= 9.97,
SD= 1.72, N= 31), an alpha of .95 for Semir (𝑀𝑆𝑒𝑚𝑖𝑟= 8.06, SD= 1.95, N= 31), an alpha of .95 for
BlackBerry (𝑀𝐵𝐵= 7.87, SD= 3.37, N= 31), an alpha of .92 for Apple (𝑀𝐴𝑝𝑝𝑙𝑒= 13.16, SD= 2.16,
N= 31) and an alpha of .93 for HUAWEI (𝑀𝐻𝑈𝐴𝑊𝐸𝐼= 7.83, SD= 2.15, N= 30) were reported.
Product Quality (Sprott & Shimp, 2004; please see Appendix 11). The three items from
Sprott and Shimp (2004) were intended to measure a person’s attitude regarding the quality of a
particular brand/product. Participants were asked to indicate how they perceive a certain brand’s
product quality (e.g. All things considered, I would say Roots jackets have ____ overall quality.
Very poor= 1, Very good= 5). In Sprott and Shimp (2004)’s original work, the scale was reported
to have alphas of ≥ .96 and .97. In the present study, an alpha of .89 for Roots, (𝑀𝑅𝑜𝑜𝑡𝑠= 11.87,
SD = 2.06, N= 31), an alpha of .88 for Abercrombie & Fitch (𝑀𝐴𝐹= 10.71, SD = 1.58, N= 31), an
alpha of .91 for Semir (𝑀𝑆𝑒𝑚𝑖𝑟= 8.71, SD = 1.30, N= 31), an alpha of .94 for BlackBerry (𝑀𝐵𝐵=
9.68, SD = 2.93, N= 31), an alpha of .92 for Apple (𝑀𝐴𝑝𝑝𝑙𝑒= 13.19, SD = 1.85, N= 31), and an
alpha of .93 for HUAWEI (𝑀𝐻𝑊= 8.48, SD = 1.36, N= 31) were reported.
Consumer Ethnocentrism (Shimp & Sharma, 1987; please see Appendix 13). In Shimp and
Sharma (1987)’s study, the seventeen items were meant to measure respondents’ attitude toward
the appropriateness of purchasing products made in their home country versus those manufactured
in other countries. This scale has been used in many studies and translated in a variety of languages.
In the present study, this scale was adapted to focus on the Canadian context. Participants were
asked to evaluate seventeen statements (e.g. Purchasing foreign-made products is un-Canadian)
on a 5-point Likert scale (Strongly disagree= 1, Strongly agree= 5). In Shimp and Sharma (1987)’s
study, alphas between .94 and .96 were reported for this scale in the four samples they used. In the
present study, an alpha of .92 was reported (𝑀𝐶𝐸𝑇= 39.65, SD= 9.70, N= 31).
Manipulation Check (please see Appendix 7). To ensure the effectiveness of country-related
stimuli, two sets of manipulation check were administered in the pilot study, in terms of country
31
of design and country of manufacture. The reason for checking whether participants could identify
a brand’s country of design (brand origin) was for the sake of consumer ethnocentrism analysis
that would be performed in the main study later on, while checking the manufacturer stimulus was
to avoid any compromises to the research objective of the present study which was aiming to
investigate how participants would react to brands’ country-of-manufacture cue.
The following is a table illustrating the scale reliability, mean score and standard deviation
of measures used in the pilot study of this research project (please see Table 5).
Insert Table 5 about here
Analyses & Results
Pilot study. In the present study, the pretest had a with-subjects design.
Comparison between product categories. Mauchly’s test was performed to assess participants’
involvement with jacket and smartphone products. Given the small sample size (N= 31), the
Greenhouse-Geisser’s correction was applied (Girden, 1992; Greenhouse & Geisser, 1959). Test
results suggested that participants’ interest in smartphone products was significantly higher than
their interest in jacket products (𝐹1,30= 6.74, p< .05; 𝑀𝑗𝑎𝑐𝑘𝑒𝑡= 3.08, 𝑀𝑝ℎ𝑜𝑛𝑒= 3.39).
Next, the attention was turned to examine how participants evaluate jackets and smartphones
by brand/product function. Mauchly’s tests were performed for the four dimensions of
brand/product function, in terms of hedonic, utilitarian, and the two aspects of symbolic function.
With the application of Greenhouse-Geisser’s correction, insignificant variance was observed in
participants’ opinion of utilitarian and value-expressive functions between jackets and
smartphones (𝐹 (1, 30) ℎ𝑒𝑑= 43.93, p< .000; 𝐹 (1, 30) 𝑢𝑡= .004, p> .05; 𝐹 (1, 30) 𝑠𝑦𝑚_𝑣𝑎𝑙𝑢𝑒= 1.19,
p> .05, 𝐹 (1, 30) 𝑠𝑦𝑚_𝑠𝑜𝑐𝑖𝑎𝑙= 6.41, p< .05). In other words, smartphones appeared to be more
hedonic and social-adjustive than jackets in the eyes of university undergraduate students surveyed
in the present study (𝑀𝑗𝑎𝑐𝑘𝑒𝑡_ℎ𝑒𝑑= 3.42, 𝑀𝑝ℎ𝑜𝑛𝑒_ℎ𝑒𝑑= 4.53; 𝑀𝑗𝑎𝑐𝑘𝑒𝑡_𝑠𝑜𝑐𝑖𝑎𝑙= 2.82, 𝑀𝑝ℎ𝑜𝑛𝑒_𝑠𝑜𝑐𝑖𝑎𝑙=
3.36), but the two types of product were perceived to be equally utilitarian and value-expressive
(𝑀𝑗𝑎𝑐𝑘𝑒𝑡_𝑢𝑡= 4.64, 𝑀𝑝ℎ𝑜𝑛𝑒_𝑢𝑡= 4.65; 𝑀𝑗𝑎𝑐𝑘𝑒𝑡_𝑣𝑎𝑙𝑢𝑒= 3.12, 𝑀𝑝ℎ𝑜𝑛𝑒_𝑣𝑎𝑙𝑢𝑒= 3.30).
32
The last within-subjects comparison between the two product categories was about how
participants rank the importance of product attributes. According to the results of F test (𝐹1,30=
12.12, p< .01), participants’ attitude toward the importance of product attributes of smartphones
was significantly differed from those of jackets (𝑀𝑗𝑎𝑐𝑘𝑒𝑡= 4.15, 𝑀𝑝ℎ𝑜𝑛𝑒= 3.89). Moreover, among
the twelve product attributes of jacket products, noteworthy discrepancy was also observed (𝜒652 =
141.61, p< .000; 𝐹11,330 = 4.65, p< .000) which indicated that quality (𝑀𝑞𝑢𝑎𝑙𝑖𝑡𝑦= 4.61), comfort
(𝑀𝑐𝑜𝑚𝑓𝑜𝑟𝑡= 4.35) and appropriate for occasion (𝑀𝑜𝑐𝑐𝑎𝑠𝑖𝑜𝑛= 4.35) were the top three attributes that
participants care the most for jackets. Among the eleven attributes for smartphone products,
significant variation in attribute importance was also evident (𝜒542 = 119.81, p< .000; 𝐹10,300= 7.61,
p< .000). Participants gave the highest three ratings to quality (𝑀𝑞𝑢𝑎𝑙𝑖𝑡𝑦 = 4.55), ease of use
(𝑀𝑒𝑎𝑠𝑒= 4.32) and durability (𝑀𝑑𝑢𝑟𝑎𝑏𝑖𝑙𝑖𝑡𝑦= 4.23). The attribute good price was ranked the 8th
(𝑀𝑝𝑟𝑖𝑐𝑒= 4.16) and 4th (𝑀𝑝𝑟𝑖𝑐𝑒= 4.06) for jackets and smartphones, respectively.
Comparison among brands. When comparing participants’ brand familiarity with Roots,
Abercrombie & Fitch, and Semir, the F test with the application of Greenhouse-Geisser’s
correction showed significant variance among brands (𝐹2,60= 99.42, p< .000; 𝑀𝑅𝑜𝑜𝑡𝑠 = 4.09, 𝑀𝐴𝐹=
3.83, 𝑀𝑆𝑒𝑚𝑖𝑟= 1.17) which was in contrary to the results obtained from Mauchly’s test (𝜒22= .45,
p> .05). Among the three smartphone brands, a consensus was reached between Mauchly’s test
(𝜒22= 45.45, p< .000) and the Greenhouse-Geisser corrected F test (𝐹2,60= 190.41, p< .000),
suggesting that participants’ familiarity with BlackBerry, Apple and HUAWEI were statistically
different (𝑀𝐵𝐵= 4.29, 𝑀𝐴𝑝𝑝𝑙𝑒= 4.94, 𝑀𝐻𝑊= 1.35). Overall, participants were very unfamiliar with
the two Chinese brands tested in the pretest.
In terms of the scale measuring participants’ attitude toward jacket brands, Mauchly’s test
indicated no violation of the assumption of sphericity (𝜒22= .63, p> .05); however, after applying
the Greenhouse-Geisser’s correction, attitude discrepancy became significant ( 𝐹2,60 = 11.93,
p< .000; 𝑀𝑅𝑜𝑜𝑡𝑠=3.51, 𝑀𝐴𝐹= 3.32, 𝑀𝑆𝑒𝑚𝑖𝑟= 2.69). Inconsistent results between Mauchly’s test
(𝜒22= 3.57, p> .05) and Greenhouse-Geisser corrected F test (𝐹2,60= 49.26, p< .000, N= 31) were
also emerged when analyzing participants’ attitude toward smartphone brands ( 𝑀𝐵𝐵 = 2.62,
𝑀𝐴𝑝𝑝𝑙𝑒= 4.39, 𝑀𝐻𝑊= 2.56). Nevertheless, taking a more conservative approach to interpret test
33
results, participants had more positive attitude toward Roots and A&F than Semir, while Apple
appeared to be the most favorable smartphone brand.
Finally, it came to compare participants’ quality perception of branded products. Among
jacket brands, Mauchly’s test suggested no significant variance (𝜒22= .82, p> .10), whereas the
Greenhouse-Geisser corrected F test pointed to the opposition (𝐹2,60= 23.85, p< .000; 𝑀𝑅𝑜𝑜𝑡𝑠=3.96,
𝑀𝐴𝐹 = 3.57, 𝑀𝑆𝑒𝑚𝑖𝑟 = 2.90). For smartphone brands, there was also a disagreement between
Mauchly’s test (𝜒22= 5.62, p> .05) and Greenhouse-Geiseer corrected F test (𝐹2,60= 43.16, p< .000;
𝑀𝐵𝐵=3.23, 𝑀𝐴𝑝𝑝𝑙𝑒= 4.40, 𝑀𝐻𝑊= 2.83). Again, drawing a conclusion from a more conservative
perspective, participants perceived Roots and Apple to have better product quality than their
competitors’ brands.
Manipulation check. The last part of the pilot study was comprised of two sets of manipulation
check for the country-of-design and country-of-manufacture stimuli. Mauchly’s tests showed that
participants could accurately tell the country of design (brand origin) for Roots (𝜒2 𝑅𝑜𝑜𝑡𝑠_𝑐𝑜𝑜2 =
33.72, p< .000; 𝐹 (2, 60) 𝑅𝑜𝑜𝑡𝑠_𝑐𝑜𝑜 = 175.95, p< .000; 𝑀𝑅𝑜𝑜𝑡𝑠_𝑈𝑆 = 1.48, 𝑀𝑅𝑜𝑜𝑡𝑠_𝐶𝑎𝑛𝑎𝑑𝑎 = 4.48,
𝑀𝑅𝑜𝑜𝑡𝑠_𝐶ℎ𝑖𝑛𝑎= 1. 29) and Abercrombie & Fitch (𝜒2 𝐴𝐹_𝑐𝑜𝑜2 = 21.99, p< .000; 𝐹 (2, 60) 𝑅𝑜𝑜𝑡𝑠_𝑐𝑜𝑜 =
201.21, p< .000; 𝑀𝐴𝐹_𝑈𝑆 = 4.71, 𝑀𝐴𝐹_𝐶𝑎𝑛𝑎𝑑𝑎 = 1.65, 𝑀𝐴𝐹_𝐶ℎ𝑖𝑛𝑎 = 1. 45), but not for Semir
( 𝜒2 𝑆𝑒𝑚𝑖𝑟_𝑐𝑜𝑜2 = 12.44, p< .05; 𝐹 (2, 60) 𝑆𝑒𝑚𝑖𝑟_𝑐𝑜𝑜 = 1.70, p> .10; 𝑀𝑆𝑒𝑚𝑖𝑟_𝑈𝑆 = 2.74,
𝑀𝑆𝑒𝑚𝑖𝑟_𝐶𝑎𝑛𝑎𝑑𝑎= 2.55, 𝑀𝑆𝑒𝑚𝑖𝑟_𝐶ℎ𝑖𝑛𝑎= 3.06).
Surprise was also encountered when assessing participants’ knowledge about smartphone
brands’ country of design (brand origin). While both Mauchly’s test (𝜒2 𝐵𝐵_𝑐𝑜𝑜2 = 50.44, p< .000)
and the Greenhouse-Geisser corrected F test ( 𝐹 (2, 60) 𝐵𝐵_𝑐𝑜𝑜 = 9.14, p< .01) showed that
participants knew for sure that BlackBerry was not a Chinese brand (𝑀𝐵𝐵_𝐶ℎ𝑖𝑛𝑎= 1.42), they were
confused about whether it was from Canada or the U.S. (𝑀𝐵𝐵_𝐶𝑎𝑛𝑎𝑑𝑎= 3.10, 𝑀𝐵𝐵_𝑈𝑆= 2.94). For
the other two smartphone brands, Mauchly’s sphericity test and F test (𝐹 (2, 60) 𝐴𝑝𝑝𝑙𝑒_𝑐𝑜𝑜 = 132.83,
p< .000; 𝐹 (2, 60) 𝐻𝑊_𝑐𝑜𝑜 = 48.20, p< .000) produced consistent results ( 𝑀𝐴𝑝𝑝𝑙𝑒_𝑈𝑆 = 4.77,
𝑀𝐴𝑝𝑝𝑙𝑒_𝐶𝑎𝑛𝑎𝑑𝑎= 1.68, 𝑀𝐴𝑝𝑝𝑙𝑒_𝐶ℎ𝑖𝑛𝑎= 1.74; 𝑀𝐻𝑊_𝑈𝑆= 1.90, 𝑀𝐻𝑊_𝐶𝑎𝑛𝑎𝑑𝑎= 1.90, 𝑀𝐻𝑊_𝐶ℎ𝑖𝑛𝑎= 4.10).
Another interesting phenomenon observed in the analysis of manipulation check was that
participants tend to take China to be chosen brands’ country of manufacture for granted, except
34
for Roots (𝜒2 𝑅𝑜𝑜𝑡𝑠_𝑐𝑜𝑚2 = 13.74, p< .01; 𝐹 (2, 60) 𝑅𝑜𝑜𝑡𝑠_𝑐𝑜𝑚 = 10.83, p< .01, 𝑀𝑅𝑜𝑜𝑡𝑠_𝑈𝑆= 2.26,
𝑀𝐻𝑊_𝐶𝑎𝑛𝑎𝑑𝑎= 3.58, 𝑀𝐻𝑊_𝐶ℎ𝑖𝑛𝑎= 3.10).
Measurement issue(s). According to the analytical results obtained from the pilot study, two
measurement issues were observed. First, the two Chinese brands were significantly lagged behind
their counterparts in terms of brand familiarity. If participants could not recognize a brand, it would
not make sense to have them answer questions related to brand attitude, quality perception and
purchase intention of that brand. Therefore, in the main study, filter questions (please see Appendix
9) assessing whether participants knew the brand Semir and HUAWEI would be administered
prior to they started answering any questions related to these two brands.
The other issue was that participants took China to be brands’ country of manufacture for
granted. Considering that the present study was interested in exploring how different combinations
of country of manufacture and country of design would affect participants’ reaction, the research
objective of this project would be compromised if there was only one level of manufacturer.
Consequently, in the main study, the manufacturer stimulus would be reinforced by showing
participants pictures which were comprised of a certain brand’s logo and a footnote describing the
brand’s country of design and country of manufacture (please see Appendix 7).
Measures & Scales
Main study. Seven scales were included in the main study questionnaire. Prior to initiate
analyses, the raw dataset was first cleaned then examined for missing values. The two Chinese
brands (Semir and HUAWEI) had to be removed from the main study dataset due to statistically
insufficient responses (𝑁𝑆𝑒𝑚𝑖𝑟_𝐶ℎ𝑖𝑛𝑎= 7, 𝑁𝑆𝑒𝑚𝑖𝑟_𝑈𝑆= 12; 𝑁𝐻𝑊_𝐶ℎ𝑖𝑛𝑎= 27, 𝑁𝐻𝑊_𝑈𝑆= 27). As a result,
the main study would only have two levels of country of design (Canada and the U.S.) and two
levels of country of manufacture (China and the U.S.). According to the Missing Value Analysis
performed by SPSS, valid number of usable responses in each treatment ranges from 126 to 136.
Given this statistically sufficient sample size, listwise deletion was also applied in the main study.
The main study questionnaire removed three scales measured in the pilot study, which were
involvement with product category, attitude toward product attributes and brand familiarity, and
added a scale assessing participants’ purchase intention of a certain brand’s product.
35
Purchase Intention (Baker & Churchill, 1977; please see Appendix 12). The original scale
was used to measure the inclination of a consumer to buy a specified good or use a service. In the
present study, participants were asked to evaluate four statements (e.g. Would you like to try this
Roots jacket?) on a 5-point Likert scale (Definitely not= 1, Definitely yes= 5). This scale had been
used in many studies; the lowest alpha reported was .69 in Griffith and Chen (2004)’s study, while
the highest alpha reported was .91 from Kilbourne, Painton and Ridley (1985)’s research. In the
present study, this scale had alphas between .84 and .93.
The following is a table illustrating the scale reliability, mean score and standard deviation
of measures used in the main study of this research project (please see Table 6).
Insert Table 6 about here
Analyses & Results
Before testing the hypotheses proposed in the present study, research participants were
screened for the criterion that whether they are Canadian citizen/immigrant, under the
consideration that this research project was meant to study Canadian consumers’ reaction to bi-
national products. In this research project, Canadian citizen/immigrant is referred to the status of
research participants who either hold a Canadian passport or are Canadian permanent residents.
The rationale of distinguishing Canadian citizen/immigrant (permanent resident) from research
participants who hold temporary (work/study) visa also stems from the definition of the construct
of consumer ethnocentrism which is defined as “trait-like property of an individual’s personality
that encompasses the beliefs held by the consumers about appropriateness, indeed morality, of
purchasing foreign-made products” (Shimp & Sharma, 1987: 280). Therefore, in order to produce
unbiased test results, questionnaire responses of research participants who are international
students were removed from the dataset (N= 31), which left 231 usable responses that would be
used in the main study analyses (𝑀𝑎𝑔𝑒= 21.64, Max= 39, Min= 17, SD= 3.78, 𝑁𝑓𝑒𝑚𝑎𝑙𝑒= 120, N=
231).
Next, outliers in measures were checked and removed. To identify outliners in each measure,
Tukey’s resistant rule was utilized (Hoaglin, Iglewicz, & Tukey, 1986; Hoaglin & Iglewicz, 1987;
Tukey, 1977).
36
F-spread = 𝐹𝑈 - 𝐹𝐿
𝐼𝐹𝐿= 𝐹𝐿 - 1.5 (F-spread)
𝐼𝐹𝑈= 𝐹𝑈 + 1.5 (F-spread)
First, have SPSS to produce Percentiles table for each measure. Then substitute the 1st and
3rd quartile values into the above equations. Index scores that fell outside of the inner fence range
computed by using the above equations were outliers in that particular scale. The reason to choose
1.5 as the multiplier was due to the fact that there would be no outliers in all measures if 2.0 or 2.2
was used in the equation.
The following is a table summarizing the number of outliners in each measure used in the
main study of this research project (please see Table 7).
Insert Table 7 about here
The final step in data preparation was dummy coding the two countries of manufacture
(China = 1, the U.S. =2) and the two countries of design¹ (the U.S. =1, Canada =2). Participants’
consumer ethnocentric tendency (CET) index scores were also divided into a “low ethnocentric
tendency” group (dummy coding “1”) and a “high ethnocentric tendency” group (dummy coding
“2”) by using average CET index scores² (𝑀𝐶𝐸𝑇_𝑗𝑎𝑐𝑘𝑒𝑡_𝐶ℎ𝑖𝑛𝑎_𝑚𝑎𝑑𝑒 = 2.48, 𝑁ℎ𝑖𝑔ℎ= 47, N= 113;
𝑀𝐶𝐸𝑇_𝑗𝑎𝑐𝑘𝑒𝑡_𝑈𝑆_𝑚𝑎𝑑𝑒 = 2.40, 𝑁ℎ𝑖𝑔ℎ= 59, N= 114; 𝑀𝐶𝐸𝑇_𝑝ℎ𝑜𝑛𝑒_𝐶ℎ𝑖𝑛𝑎_𝑚𝑎𝑑𝑒 = 2.46, 𝑁ℎ𝑖𝑔ℎ= 49, N=
103; 𝑀𝐶𝐸𝑇_𝑝ℎ𝑜𝑛𝑒_𝑈𝑆_𝑚𝑎𝑑𝑒 = 2.46, 𝑁ℎ𝑖𝑔ℎ= 50, N= 103).
______________________
¹ Data was re-organized in a way that in each product category there were one brand designed in Canada and one
brand designed in the U.S. Considering that participants were randomly assigned into one of the two manufacturer
treatments, if a participant answered Roots’ made-in-China (U.S.) questions and A&F’s made-in-China (U.S.)
questions in the same questionnaire, this individual’s responses would be discarded, for the sake of preserving a
between-subjects research design.
² Equally dividing participants’ CET index scores into three subgroups (high CET, neutral, and low CET) then
discarding the middle group would result in a smaller sample size and reduce the power to detect effects.
37
Correlation analyses were performed to investigate the interrelation among country of
design/manufacture combinations, consumer ethnocentrism, product function and dependent
variables (please see Appendix 14).
According to the correlation matrices (the first four correlation tables), there was no
evidence to suggest that participants’ brand attitude, quality perception and purchase intention of
branded products were affected by the country-of-manufacture cue (p> .10). In other words,
research participants were indifferent between China-made and U.S.-made jacket and smartphone
products when these products were designed in the same country (or were from the same parent
brand). For instance, participants did not perceive Roots’ made-in-China jackets to have different
product quality from Roots’ made-in-U.S. jackets.
However, when it came to compare branded products which were designed in different
countries, striking results were observed (the last three correlation tables). For jacket products, the
moderately incongruent country association between designed-in-Canada (Roots) and made-in-
U.S. produced a significant variance in research participants’ quality perception (𝐹1,115 = 7.458,
p< .01; 𝑀𝑈.𝑆._𝑑𝑒𝑠𝑖𝑔𝑛𝑒𝑑= 3.43, 𝑀𝐶𝑎𝑛𝑎𝑑𝑎_𝑑𝑒𝑠𝑖𝑔𝑛𝑒𝑑= 3.79) compared with the complete congruent pair
between designed-in-U.S. (Abercrombie & Fitch) and made-in-U.S. Moreover, for smartphone
products, the overwhelming influence exerted by the country-of-design (brand origin) cue was
even more manifest. To be specific, designed-in-U.S. (Apple) and made-in-China smartphone
products received superior consumer evaluation over their designed-in-Canada (BlackBerry) and
made-in-China counterparts in all of the three criteria, in terms of brand attitude (𝐹1,99= 76.312,
p< .000; 𝑀𝑎𝑡𝑡𝑖𝑡𝑢𝑑𝑒_𝑈𝑆_𝑑𝑒𝑠𝑖𝑔𝑛𝑒𝑑= 4.25, 𝑀𝑎𝑡𝑡𝑖𝑡𝑢𝑑𝑒_𝐶𝑎𝑛𝑎𝑑𝑎_𝑑𝑒𝑠𝑖𝑔𝑛𝑒𝑑= 2.86), quality perception (𝐹1,99=
46.579, p< .000; 𝑀𝑞𝑢𝑎𝑙𝑖𝑡𝑦_𝑈𝑆_𝑑𝑒𝑠𝑖𝑔𝑛𝑒𝑑 = 4.36, 𝑀𝑞𝑢𝑎𝑙𝑖𝑡𝑦_𝐶𝑎𝑛𝑎𝑑𝑎_𝑑𝑒𝑠𝑖𝑔𝑛𝑒𝑑 = 3.35), and purchase
intention (𝐹1,103= 54.019, p< .000; 𝑀𝑝𝑢𝑟𝑐ℎ𝑎𝑠𝑒_𝑈𝑆_𝑑𝑒𝑠𝑖𝑔𝑛𝑒𝑑= 3.66, 𝑀𝑝𝑢𝑟𝑐ℎ𝑎𝑠𝑒_𝐶𝑎𝑛𝑎𝑑𝑎_𝑑𝑒𝑠𝑖𝑔𝑛𝑒𝑑= 2.21).
Similar results were obtained from the comparison between U.S.-made smartphone products which
were designed-in-U.S. (Apple) and designed-in-Canada (BlackBerry), suggesting that there was
also significant discrepancy in research participants’ brand attitude (𝐹1,102= 58.578, p< .000;
𝑀𝑎𝑡𝑡𝑖𝑡𝑢𝑑𝑒_𝑈𝑆_𝑑𝑒𝑠𝑖𝑔𝑛𝑒𝑑= 4.15, 𝑀𝑎𝑡𝑡𝑖𝑡𝑢𝑑𝑒_𝐶𝑎𝑛𝑎𝑑𝑎_𝑑𝑒𝑠𝑖𝑔𝑛𝑒𝑑= 2.74), quality perception (𝐹1,103= 49.642,
p< .000; 𝑀𝑞𝑢𝑎𝑙𝑖𝑡𝑦_𝑈𝑆_𝑑𝑒𝑠𝑖𝑔𝑛𝑒𝑑 = 4.32, 𝑀𝑞𝑢𝑎𝑙𝑖𝑡𝑦_𝐶𝑎𝑛𝑎𝑑𝑎_𝑑𝑒𝑠𝑖𝑔𝑛𝑒𝑑 = 3.25), and purchase intention
( 𝐹1,102 = 64.666, p< .000; 𝑀𝑝𝑢𝑟𝑐ℎ𝑎𝑠𝑒_𝑈𝑆_𝑑𝑒𝑠𝑖𝑔𝑛𝑒𝑑 = 3.72, 𝑀𝑝𝑢𝑟𝑐ℎ𝑎𝑠𝑒_𝐶𝑎𝑛𝑎𝑑𝑎_𝑑𝑒𝑠𝑖𝑔𝑛𝑒𝑑 = 2.13).
According to the above test results, 𝐻1may be rejected given the fact that other than the congruent
38
country association between U.S.-designed/U.S.-made smartphones received superior consumer
evaluation over Canada-designed/U.S.-made counterparts, the other two advanced pairs of
country-related associations both had various degrees of incongruity (Canada-designed/U.S.-made
jackets, U.S.-designed/China-made smartphones).
In terms of the effects of consumer ethnocentric tendency on research participants’ product
evaluation, the correlation analyses (the last four tables) also produced very interesting results. For
jacket products, highly ethnocentric participants indicated significantly stronger purchase intention
of products designed in Canada (Roots) over products designed in the U.S. (Abercrombie & Fitch),
regardless of whether the products were made in China (𝐹1,112= 12.270, p< .01; 𝑀𝑙𝑜𝑤 𝐶𝐸𝑇= 2.45,
𝑀ℎ𝑖𝑔ℎ 𝐶𝐸𝑇= 2.99) or made in the U.S. (𝐹1,112= 11.025, p< .01; 𝑀𝑙𝑜𝑤 𝐶𝐸𝑇= 2.41, 𝑀ℎ𝑖𝑔ℎ 𝐶𝐸𝑇= 3.03).
However, in the case of smartphone products, consumer ethnocentric tendency was showed to
have insignificant effects on participants’ product evaluation (p> .10). Therefore, both 𝐻2and
𝐻3were supported.
Finally, it came to examine the interrelation between product function and consumer
evaluation. First of all, in all of the eight correlation tables, product function (hedonic, utilitarian,
value-expressive and social-adjustive) was showed to be positively correlated with brand attitude,
quality perception and purchase intention (p< .01). For this reason, 𝐻4𝑎through 𝐻4𝑑were fully
supported.
Paying close attention to the last three correlation matrices, it was found that potential
mediation paradigms may exist among country-related associations, product function and
consumer evaluation. There was one pair of three-way interaction for jacket products among U.S.-
/Canada-designed (Roots versus Abercrombie & Fitch) U.S.-made country associations, hedonic
function and consumers’ quality perception, and two pairs of three-way interaction for smartphone
products among (1) U.S.-/Canada-designed (Apple versus BlackBerry) China-made country
associations, product function (hedonic, utilitarian, value-expressive and social-adjustive) and
consumer evaluation (brand attitude, quality perception and purchase intention) and (2) U.S.-
/Canada-designed (Apple versus BlackBerry) U.S.-made country associations, product function
(hedonic, utilitarian, value-expressive and social-adjustive) and consumer evaluation (brand
attitude, quality perception and purchase intention). To further explore the interrelation among
these variables, Linear Regression analyses were performed.
39
The following is a table illustrating the mediation effects of the variable product function
(please see Table 8).
Insert Table 8 about here
According to the above test results, there were partial mediation relationships between
design/manufacturing country associations and consumers’ product evaluation. More specifically,
with the presence of hedonic function, country association was able to explain 31 percent of the
variance in research participants’ differential quality perception between U.S.-designed
(A&F)/U.S.-made and Canada-designed (Roots)/U.S.-made jacket products (𝐹1,115 = 7.458, p< .01;
𝑀𝑈.𝑆._𝑑𝑒𝑠𝑖𝑔𝑛𝑒𝑑= 3.43, 𝑀𝐶𝑎𝑛𝑎𝑑𝑎_𝑑𝑒𝑠𝑖𝑔𝑛𝑒𝑑= 3.79). In terms of smartphone products, when hedonic
and utilitarian functions were taken into account, country association was able to explain 73
percent of the variance in consumers’ differential brand attitude between U.S.-designed
(Apple)/China-made and Canada-designed (BlackBerry)/China-made smartphones (𝐹1,99= 76.312,
p< .000; 𝑀𝑎𝑡𝑡𝑖𝑡𝑢𝑑𝑒_𝑈𝑆_𝑑𝑒𝑠𝑖𝑔𝑛𝑒𝑑= 4.25, 𝑀𝑎𝑡𝑡𝑖𝑡𝑢𝑑𝑒_𝐶𝑎𝑛𝑎𝑑𝑎_𝑑𝑒𝑠𝑖𝑔𝑛𝑒𝑑= 2.86). And with the presence of
utilitarian and symbolic functions (value-expressive and social-adjustive), country association was
able to explain 70 percent of the variance in consumers’ purchase intention of U.S.-designed
(Apple)/China-made smartphones over Canada-designed (BlackBerry)/China-made smartphones
( 𝐹1,103 = 54.019, p< .000; 𝑀𝑝𝑢𝑟𝑐ℎ𝑎𝑠𝑒_𝑈𝑆_𝑑𝑒𝑠𝑖𝑔𝑛𝑒𝑑 = 3.66, 𝑀𝑝𝑢𝑟𝑐ℎ𝑎𝑠𝑒_𝐶𝑎𝑛𝑎𝑑𝑎_𝑑𝑒𝑠𝑖𝑔𝑛𝑒𝑑 = 2.21).
Similarly, when the utilitarian and value-expressive functions were present, country association
was able to explain 74 percent of variance in research participants’ purchase intention of U.S.-
designed (Apple)/U.S.-made smartphones over Canada-designed (BlackBerry)/U.S.-made
smartphones (𝐹1,102= 64.666, p< .000; 𝑀𝑝𝑢𝑟𝑐ℎ𝑎𝑠𝑒_𝑈𝑆_𝑑𝑒𝑠𝑖𝑔𝑛𝑒𝑑= 3.72, 𝑀𝑝𝑢𝑟𝑐ℎ𝑎𝑠𝑒_𝐶𝑎𝑛𝑎𝑑𝑎_𝑑𝑒𝑠𝑖𝑔𝑛𝑒𝑑=
2.13).
40
DISCUSSION
This research project sought to investigate the outcome of firms’ cross-border outsourcing
practice by examining the effects of (in)congruity between country of design (brand origin) and
country of manufacture, consumer ethnocentric tendency and product function, respectively, on
young Montréalers’ reaction to bi-national products from two product categories (jacket and
smartphone). There were four research questions the present study attempted to answer, in terms
of (a) whether young Montréalers would prefer branded products manufactured in the U.S. over
branded products manufactured in China (𝐻1 ), (b) whether young Montréalers would prefer
branded products designed in Canada over branded products designed in the U.S. (𝐻1), (c) whether
young Montréalers’ ethnocentric tendency could positively affect their preference of branded
products designed in Canada over branded products designed in the U.S. (𝐻2, 𝐻3), and (d) whether
product function would have positive influence on young Montréalers’ evaluation of branded
products (𝐻4𝑎 through 𝐻4𝑑).
As to answer the first two research questions which were aimed to explore the effects of
(in)congruity between country of design and country of manufacture on research participants’
product evaluation, mixed results were obtained. To be specific, it was found that when controlling
the country-of-design stimulus, research participants were indifferent between China-made and
U.S.-made products. When fixing the country-of-manufacture stimulus, the effects of
(in)congruity between country associations started becoming manifest. For jacket products, the
moderately incongruent country association between Canada-designed/U.S.-made received more
favorable evaluation of product quality compared with the complete congruent country association
between U.S.-designed/U.S.-made. In the case of smartphone products, research participants had
more favorable attitude toward, quality perception and purchase intention of branded products
which were U.S.-designed/China-made or U.S.-designed/U.S.-made over branded products which
were Canada-designed/China-made or Canada-designed/U.S.-made, respectively. In other words,
as long as the branded smartphone products were designed in the U.S., research participants were
also indifferent between China-made and U.S.-made products.
The above test results regarding the insignificant influence exerted by the country-of-
manufacture cue on research participants’ product evaluation were consistent with the findings of
41
previous studies (Chung et al., 2009; Hamzaoui-Essoussi et al., 2011; Hui & Zhou, 2003) and
could be attributed to the shielding effects of brand equity (Aaker, 1991; Kim & Chung, 1997) of
the brands included in the present study (Roots, BlackBerry, Abercrombie & Fitch and Apple) that
“every known brand possesses a certain value which is determined by the popularity, reputation
and associated beliefs of the brand” (Hui & Zhou, 2003: 133). In terms of the positive impact of
congruent country association (U.S.-designed/U.S.-made smartphones) on consumer evaluation,
it provided empirical support to one of Mandler (1982, 1983)’s assumptions that congruity
between two subjects shall produce favorable evaluation because it conforms to people’s
expectations and allows predictability. And the positive impact of moderately incongruent country
association (Canada-designed/U.S.-made) on research participants’ favorable quality perception
of branded jacket products was also evident in Meyers-Levy and Tybout (1989) and Carvalho et
al. (2011)’s studies that as long as the moderate incongruity between two subjects could be
resolved successfully, favorable evaluation was possible.
When it came to examine the impact of consumer ethnocentric tendency on young
Montréalers’ reaction to branded products designed in different countries, the test results indicated
that consumer ethnocentric behavior was contingent and varied across product categories. To be
specific, research participants who exhibited strong ethnocentric personality trait showed higher
purchase intention of branded jacket products designed in Canada over branded jacket products
designed in the U.S. regardless of whether the products were China-made or U.S.-made. However,
in the case of smartphone products, there was no statistically significant correlation between
consume ethnocentrism and young Montréalers’ product evaluation observed in the present study.
This test result was in line with scholars’ previous findings (Balabanis & Diamantopoulos, 2004;
Bruning, 1997) and may be attributable to research participants’ education level (Javalgi et al.,
2005; Klein et al., 1998; Sharma et al., 1995; Shimp & Sharma, 1987) and the cultural openness
of the city of Montréal (Javalgi et al., 2005; Sharma et al., 1995; Shimp & Sharma, 1987).
The surprise of the present study was emanated from the discovery of the role that product
function played in the relationship between country associations and young Montréalers’ product
evaluation. According to the test results, all of the four dimensions of product function, in terms
of hedonic, utilitarian, value-expressive and social-adjustive, were positively related to research
participants’ brand attitude, quality perception and purchase intention of branded products. It was
42
also found that some dimensions of product function were able to mediate the main effects of
country associations on research participants’ product evaluation. For instance, with the presence
of hedonic function, country association was able to explain 31 percent of the variance in research
participants’ differential quality perception between Canada-designed/U.S.-made jackets and
U.S.-designed/U.S.-made jackets. Even more striking, with the presence of utilitarian and value-
expressive functions, country association was able to explain more than 70 percent of the variance
in research participants’ purchase intention of smartphone products which were U.S.-
designed/U.S.-made over smartphone products which were Canada-designed/U.S.-made.
Although none of previous country-of-origin research have directly measured the construct of
product function, scholars have discovered several factors, such as automobiles’
appearance/product feature and plasma TV sets’ tangible product attribute, as mediators in the
interrelation between country associations and consumers’ product evaluation (Carvalho et al.,
2011; Haubl, 1996). Moreover, the test results of this study partially supported Chattalas and his
colleagues (2008)’s proposition by demonstrating that hedonic and utilitarian functions (Voss et
al., 2003) of a product indeed had positive impacts on research participants’ product evaluation.
Limitations
This research project had several limitations. First, it is a cross-sectional research, so that no
causality or direction between variables could be inferred. Additionally, research participants’
responses were measured at a single time, which may lead to a consequence that findings of the
present study may change over time (Mook, 2001). Moreover, there were only two types of product
(jacket and smartphone) examined in experiments; consequently, research findings of the present
study may not be generalizable to other product categories. Furthermore, the brands used in the
present study are all real and have certain degrees of brand equity (Aaker, 1991; Kim & Chung,
1997); as a result, its research findings suffered the same issue as previous studies which employed
real brands, in a sense that it could not eliminate the influence exerted by well-known brands’
name on research participants’ product evaluation. Although Peterson and Jolibert (1995) came to
a conclusion that employing student sample would not significantly affect the explanation power
of test results, given the characteristics of research participants approached in the present study
who are first- or second-year university undergraduate students from diverse ethnic background,
43
caution is required when interpreting the findings of the present study.
In addition, it is worth mentioning that there was supposed to be a third country of design,
China. The purpose of including China as one of the design countries was to create another two
pairs of country association, in terms of complete congruity (China-designed/China-made) and
extreme incongruity (China-designed/U.S.-made). It was hoped that through the comparison
between the above two country associations, the present study could empirically examine Mandler
(1982, 1983)’s assumption regarding the negative evaluation caused by schema incongruity.
However, given the fact that research participants were too unfamiliar with the two Chinese brands
(Semir and HUAWEI), the present study could not generate statistically sufficient cases to perform
meaningful analyses; as a result, the two Chinese brands had to be dropped, which is probably a
weakness of collecting data via standardized questionnaires.
Also, several methods used in the present study to deal with data had shortcomings and
influence on research findings. For instance, research participants approached in the present study
could be categorized into three groups (Canadian citizens, Canadian permanent residents, and
international students) based on their legal status in Canada. When deciding which groups may be
defined as Canadian consumers, responses of both Canadian citizens and Canadian permanent
residents (immigrants) were retained to prevent substantial loss of data points. However, scholars
have noticed that immigrants may need to overcome challenges such as forming cultural identity
and sense of belongingness (Berry, 1997) during the process of acculturation, which may cause
variation in the strength of consumer ethnocentrism between Canadian citizens and Canadian
immigrants. And by using mean split to distinguish highly ethnocentric research participants from
those with a relatively low ethnocentric tendency, it created uneven number of research
participants in the two groups, increasing the probability of both Type I and Type II errors. The
last but not the least, research findings of the present study may be subject to the issue of common
method variance. It is suggested that people have a tendency to maintain consistency between their
cognitions and behaviors (Podsakoff & Organ, 1986; Salancik & Pfeffer, 1977); consequently,
using self-report questionnaires to collect data measuring the independent and dependent variables
from the same rater may produce not only “true” but also artifactual relationships.
Despite the above limitations, this research project was able to show that the country-of-
manufacture cue had statistically insignificant impacts on young Montréalers’ product evaluation
44
of branded jacket and smartphone products, the country-of-design (brand origin) cue had
significant influence on young Montréalers’ product evaluation of branded jacket and smartphone
products, consumer ethnocentric tendency had positive effects on young Montréalers’ purchase
intention of branded jacket products designed in Canada, and product function was not only
positively related to young Montréalers’ product evaluation but also was an imperative mediator
in the relationship between country association and young Montréalers’ quality perception of
branded jacket products designed in Canada as well as attitude toward and purchase intention of
branded smartphone products designed in the U.S.
Future Directions
This research project served as an exploratory study by establishing a link between the
construct of product function and country-of-origin effects. Given the explanation power of
product function in research participants’ product evaluation with the presence of combinations of
country association, more empirical research may consider to include the construct of product
function in theoretical frameworks and operational experiments.
Future research could also investigate the effects of extreme incongruent country
associations on consumers’ product evaluation, which was a task could not be accomplished by
this research project. Nevertheless, the present study has generated affirmative evidence to
demonstrate a positive impact of moderately incongruent country associations on research
participants’ quality perception of branded jacket products. Valuable insights may be offered if
future research could examine the influence exerted by the moderate incongruity between
countries of origin on consumers’ product evaluation by using fictional brand names, for the
purpose of enriching the knowledge of schema (in)congruity effects on consumer behavior and
better preparing firms in scenarios of new product introduction and brand extension.
Furthermore, the test results of this research project supported scholars’ viewpoint that the
manifestation of country-of-origin effects may be varied across product categories. Future research
may consider to include types of product that have not been examined in previous studies in
operational experiments. As a matter of fact, in the majority of country-of-origin studies up to date,
researchers tested hypotheses on physical products. Few have empirically examined the effects of
45
country-of-origin cues on research participants’ evaluation of service products such as air travel
carrier (Bruning, 1997) and financial service (Hanne, 1996). Interesting findings may be obtained
if future research could compare and contrast end users’ reaction to and perception of service
products offered by firms with different countries of origin. Likewise, conducting country-of-
origin research among different groups of research participants may also be a promising direction
of future studies, for instance, between research participants from different countries or between a
nation’s citizens and immigrants.
Practical Implications
According to the analytical results of this research project, the country-of-manufacture cue
was showed to have insignificant impacts on research participants’ evaluation of products from
well-known brands. Consistent with the findings of previous studies (Chung et al., 2009;
Hamzaoui-Essoussi et al., 2011; Hui & Zhou, 2003), it may provide firms more confidence in their
decision-making process of the production outsourcing practice. As long as firms appropriately
emphasize the country-of-design (brand origin) cue in consumers’ information processing and
maintain the reputation of their brand names, the manufacturing location of their branded products
shall not be a major concern of their offshoring practice. In this case, Apple’s linguistic tactic may
be a good example to follow that on the back of each of its smartphone products, it is engraved
that “Designed by Apple in California, Assembled in China”. Leveraging on the reputation and
image of its brand, Apple successfully highlights the country-of-design association with its
branded products, which serves as a guarantee for product quality and reliability in the perception
of end users and mitigates potential negative evaluations caused by the manufacturer cue.
Moreover, consumer ethnocentric tendency was found to have positive impacts on young
Montréalers’ purchase intention of branded jacket products designed in Canada, regardless of
whether the jacket products were China-made or U.S.-made. For this reason, Canadian companies
(brands) in the garment industry may promote their country-of-design (brand origin) association
by means of advertising and marketing campaigns, in order to reinforce their national identity in
the minds of Canadian consumers. For instance, Roots designed its brand logo to be one of
Canada’s symbolic animals, the Beaver, which genuinely links the brand to its country of origin.
In addition to brand logos, consumer ethnocentrism and other emotional reactions may also be
46
triggered by company history and founder’s biography (Paharia, Keinan, Avery, & Schor, 2011).
In the case of foreign brands, consumer ethnocentrism is also possible through strategic activities
such as co-branding with local brands.
The last but not the least, this research project underscored the importance of product
function in end users’ brand attitude toward the parent brand as well as their quality perception
and purchase intention of branded products, which shall help firms to understand why or why not
end users prefer their branded products over competitors’ branded products. Such information
could be used to either change or improve the approach of their strategic activities, such as
Research & Development, marketing, industrial positioning and cross-border outsourcing practice.
For instance, BlackBerry may consider to enhance their smartphone products’ hedonic and
utilitarian functions by developing more user-friendly features and reliable operational systems.
Speaking of the means to strengthen its smartphone products’ symbolic function in the eyes of end
users, BlackBerry may consider to create favorable associations between their products and
celebrity spokespersons or prestigious social events (Keller, 1993).
47
CONCLUSION
This research project sought to explore the outcome of firms’ cross-border outsourcing
practice by examining the effects of (in)congruity between branded products’ countries of
design/manufacture, consumer ethnocentric tendency and product function on end users’ product
evaluation, respectively. The analytical results of the present study supported Mandler (1982,
1983)’s theoretical assumptions and scholars’ previous findings by demonstrating positive effects
of complete congruity and moderate incongruity between country associations, consumer
ethnocentric tendency and product function on end users’ reaction to products which were
designed and manufactured in different countries. Additionally, product function was
unexpectedly found to be able to mediate the interrelation between country associations and end
users’ evaluation of branded products. Moreover, by establishing a link between the construct of
product function and country-of-origin effects, this research project contributed to the literature as
it may be the first to examine the interrelation between the construct of product function and
consumers’ evaluation of bi-national products. The test results of the present study shall also shed
light on future research and managerial implications.
48
REFERENCES
Aaker, D. A. 1991. Managing Brand Equity. New York: The Free Press.
Agarwal, S., & Sikri, S. 1996. Country Image: Consumer Evaluation of Product Country
Extensions, Journal of Marketing Review, 13 (4), 23-39.
Agarwal, S., & Teas, R. K. 2000. The Effects of Extrinsic Product Cues on Consumers’ Perception
of Quality, Sacrifice and Value, Journal of International Consumer Marketing, 28 (2),
278-300.
Ahmed, S. A., d’Astous, A., & Eljabri, J. 2002. The Impact of Technological Complexity on
Consumers’ Perceptions of Products Made in Highly and Newly Industrialized
Countries, International Marketing Review, 19 (4), 387-407.
Ahmed, S. A., d’Astous, A., & Lemire, S. 1997. Country-of-Origin Effects in the U.S. and Canada:
Implications for the Marketing of Products Made in Mexico, Journal of International
Consumer Marketing, 10 (1-2), 73-92.
Ahmed, Z. U., Johnson, J. P., Ling, C. P., Fang, T. W., & Hui, A. K. 2002. Country-of-Origin and
Brand Effects on Consumers’ Evaluation of Cruise Lines, International Marketing
Review, 19 (3), 279-302.
Anand, J., & Delios, A. 1997. Location Specificity and the Transferability of Downstream Assets
to Foreign Subsidiaries, Journal of International Business Studies, 28 (3), 579-603.
Baker, M. J., & Churchill, G. A. 1977. The Impact of Physically Attractive Models on Advertising
Evaluations, Journal of Marketing Research, 14 (November), 538-555.
Balabanis, G., & Diamantopoulos, A. 2004. Domestic Country Bias, Country-of-Origin Effects,
and Consumer Ethnocentrism: A Multidimensional Unfolding Approach, Journal of
the Academy of Marketing Science, 32 (1), 80-95.
Beaudoin, P., Moore, M. A., & Goldsmith, R. E. 1998. Young Fashion Leaders’ and Followers’
Attitudes toward American and Imported Apparel, Journal of Product and Brand
Management, 7 (3), 193-207.
49
Berry, J. W. 1997. Immigration, Acculturation, and Adaptation. Applied Psychology: An
International Review, 46 (1), 5-68.
Bilkey, W. J., & Nes, E. 1982. Country-of-Origin Effects on Product Evaluations, Journal of
International Business Studies, 13 (1), 83-99.
Bond, M. H. 1988. Finding Universal Dimensions of Individual Variation in Multicultural Studies
of Values: The Rokeach and Chinese Value Surveys, Journal of Personality and Social
Psychology, 55 (6), 1009-1015.
Brouthers, E. L. 2000. The Influence of Triad Nations’ Environments on Price-Quality Product
Strategies and MNC Performance, Journal of International Business Studies, 31 (1),
39-64.
Bruning, E. R. 1997. Country of Origin, National Loyalty and Product Choice: The Case of
International Air Travel, International Marketing Review, 14 (1), 59-63.
Carvalho, S. W., Samu, S., & Sivaramakrishnan, S. 2011. The Effect of Country-Related Brand
Associations and Product Attributes on Attitude toward Unfamiliar Foreign Brands: A
Schema Congruity Perspective, Journal of International Consumer Marketing, 23 (2),
135-150.
Chang, S. J. 1995. International Expansion Strategy of Japanese Firms: Capability Building
through Sequential Entry, Academy of Management Journal, 38 (2), 383-407.
Chao, P. 1993. Partitioning Country of Origin Effects: Consumer Evaluations of a Hybrid Product,
Journal of International Business Studies, 24 (2), 291-306.
Chao, P. 1998. Impact of Country-of-Origin Dimensions on Product Quality and Design Quality
Perceptions, Journal of Business Research, 42 (1), 1-6.
Chattalas, M., Kramer, T., & Takada, H. 2008. The Impact of National Stereotypes on the Country
of Origin Effect: A Conceptual Framework, Journal of Marketing Review, 25 (1), 54-
74.
50
Chung, J. E., Pysarchik, D. T., & Hwang, S. J. 2009. Effects of Country-of-Manufacture and Brand
Image on Korean Consumers’ Purchase Intention, Journal of Global Marketing, 22
(1), 21-41.
Coulter, R. A., Price, L. L., & Feick, L. 2003. Rethinking the Origins of Involvement and Brand
Commitment: Insights from Postsocialist Central Europe, Journal of Consumer
Research, 30 (September), 151-169.
d’Astous, A., & Ahemd, S. A. 1999. The Importance of Country Images in the Formation of
Consumer Product Perceptions, International Marketing Review, 16 (2), 108-125.
De Mooij, M., & Hofstede, G. H. 2002. Convergence and Divergence in Consumer Behavior:
Implications for International Retailing, Journal of Retailing, 78 (1), 61-69.
De Mooij, M., & Hofstede, G. H. 2011. Cross-Cultural Consumer Behavior: A Review of Research
Findings, Journal of International Consumer Marketing, 23 (3-4), 181-192.
Dikčius, V., & Stankevičienė, G. 2010. Perception of Country of Brand Origin and Country of
Product Manufacturing among Lithuanians and Emigrants from Lithuania,
Organizations and Markets in Emerging Economies, 1 (2), 108-122.
Fetscherin, M., & Toncar, M. 2010. The Effects of the Country of Brand and the Country of
Manufacturing of Automobiles: An Experimental Study of Consumers’ Brand
Personality Perceptions, International Marketing Review, 27 (2), 164-178.
Fiske, S. T., & Taylor, S. E. 1991. Social Cognition. New York: McGraw-Hill.
Fong, C. M., Lee, C. L., & Du, Y. Z. 2014. Consumer Animosity, Country of Origin, and Foreign
Entry-Mode Choice: A Cross-Country Investigation, Journal of International
Marketing, 22 (1), 62-76.
Foscht, T., Maloles III, C., Swoboda, B., Morschett, D., & Sinha, I. 2008. The Impact of Culture
on Brand Perceptions: A Six-Nation Study, Journal of Product & Brand Management,
17 (3), 131-142.
Gaedeke, R. 1973. Customer Attitude towards Products “Made in” Developing Countries, Journal
of Retailing, 49 (Summer), 13-24.
51
Gatignon, H., & Anderson, E. 1988. The Multinational Corporations’ Degree of Control over
Foreign Subsidiaries: An Empirical Test of a Tramsaction Cost Explanation, Journal
of Law, Economics, & Organization, 4 (2), 306-336.
Ghemawat, P. 2001. Distance Still Matters. The Hard Reality of Global Expansion, Harvard
Business Review, 79 (8), 137-147.
Girden, E. 1992. ANOVA: Repeated Measures. Newbury Park, CA: Sage.
Greaver II, M. F. 1998. Strategic Outsourcing: A Structured Approach to Outsourcing Decisions
and Initiatives. New York: AMACOM.
Greenhouse, S. W., & Geisser, S. 1959. On Methods in the Analysis of Profile Data,
Psychometrika, 24 (2), 95-112.
Griffith, D. A. & Chen, Q. M. 2004. The Influence of Virtual Direct Experience (VDE) on On-
Line Ad Message Effectiveness, Journal of Advertising, 33 (1), 55-68.
Gurhan-Canli, Z., & Maheswaran, D. 2000. Cultural Variations in Country of Origin Effects,
Journal of Marketing Research, 37 (3), 309-318.
Hamzaoui, L., & Merunka, D. 2006. The Impact of Country of Design and Country of Manufacture
on Consumer Perceptions of Bi-National Products’ Quality: An Empirical Model
Based on the Concept of Fit, Journal of Consumer Marketing, 23 (3), 145-155.
Hamzaoui-Essoussi, L., & Merunka, D. 2007. Consumers’ Product Evaluations in Emerging
Markets: Does Country of Design, Country of Manufacturer, or Brand Image Matter?
International Marketing Review, 24 (4), 409-426.
Hamzaoui-Essoussi, L., Merunka, D., & Bartikowski, B. 2011. Brand Origin and Country of
Manufacture Influences on Brand Equity and the Moderating Role of Brand Typicality,
Journal of Business Research, 64 (9), 973-978.
Han, C. M. 1989. Country Image: Halo or Summary Construct? Journal of Marketing Research,
26 (May), 222-229.
Han, C. M. 1990. Testing the Role of Country Image in Consumer Choice Behavior, European
Journal of Marketing, 24 (6), 24-39.
52
Han, C. M., & Terpstra, V. 1988. Country-of-Origin Effects for Uni-National and Bi-National
Products, Journal of International Business Studies, 19 (2), 235-255.
Hanne, N. 1996. Country of Origin Marketing over the Product Life Cycle: A Danish Case Study,
European Journal of Marketing, 30 (3), 6-22.
Haubl, G. 1996. A Cross-National Investigation of the Effects of Country of Origin and Brand
Name on the Evaluation of a New Car, International Marketing Review, 13 (5), 76-97.
Haubl, G., & Elrod, T. 1999. The Impact of Congruity between Brand Name and Country of
Production on Consumers’ Product Quality Judgements, International Journal of
Research in Marketing, 16 (3), 199-215.
Hennart, J. F. 1991. The Transaction Costs Theory of Joint Ventures: An Empirical Study of
Japanese Subsidiaries in the United States, Management Science, 37 (4), 482-497.
Hoaglin, D. C., & Iglewicz, B. 1987. Fine-Tuning Some Resistant Rules for Outlier Labelling,
Journal of American Statistical Association, 82 (400), 1147-1149.
Hoaglin, D. C., Iglewicz, B., & Tukey, J. W. 1986. Performance of Some Resistant Rules for
Outlier Labelling, Journal of American Statistical Association, 81 (396), 991-999.
Hofstede, G. H. 1980. Culture’s Consequences: International Differences in Work-Related Values.
Beverly Hills, CA: SAGA Publications, Inc.
Hofstede, G. H. 2001. Culture’s Consequences: Comparing Values, Behaviors, Institutions and
Organizations across Nations. Thousand Oaks, CA: SAGA Publications, Inc.
Hofstede, G. H. 2011. Dimensionalizing Cultures: The Hofstede Model in Context. Online
Readings in Psychology and Culture, 2 (1).
http://scholarworks.gvsu.edu/orpc/vol2/iss1/8, retrieved September 29, 2014.
Hofstede, G. H., Hofstede, G. J., & Minkov, M. 2010. Cultures and Organizations: Software of
the Mind: Intercultural Cooperation and Its Importance for Survival. New York:
McGraw Hill.
Holbrook, M. B., & Hirschman, E. C., 1982. The Experiential Aspects of Consumption: Consumer
Fantasies, Feelings, and Fun, Journal of Consumer Research, 9 (September), 132-140.
53
Hui, M. K., & Zhou, L.X. 2003. Country-of-Manufacture Effects for Known Brands, European
Journal of Marketing, 37 (1-2), 133-153.
Hustvedt, G., Carroll, K. A., & Bernard, J. C. 2013. Consumer Ethnocentricity and Preference for
Wool Products by Country of Origin and Manufacture, International Journal of
Consumer Studies, 37 (5), 498-506.
Insch, G. S., & McBride, J. B. 2004. The Impact of Country-of-Origin Cues on Consumer
Perceptions of Product Quality: A Binational Test of the Decomposed Country-of-
Origin Construct, Journal of Business Research, 57 (3), 256-265.
Javalgi, R. G., Khare, V. P., & Gross, A. C. 2005. An Application of the Consumer Ethnocentrism
Model to French Consumers, International Business Review, 14 (3), 325-344.
Johansson, J. K., Douglas, S. P., & Nonaka, I. 1985. Assessing the Impact of Country of Origin
on Product Evaluations: A New Methodological Perspective, Journal of Marketing
Research, 22 (4), 388-396.
Kaynak, E., & Kara, A. 2002. Consumer Perceptions of Foreign Products, European Journal of
Marketing, 36 (7-8), 928-949.
Keller, K. L. 1993. Conceptualizing, Measuring, and Managing Customer-Based Brand Equity,
Journal of Marketing, 57 (January), 1-22.
Kellogg, R. T. 1995. Cognitive Psychology. Thousand Oaks, CA: Sage Publications.
Kilbourne, W. E., Painton, S., & Ridley, D. 1985. The Effect of Sexual Embedding on Responses
to Magazine Advertisements, Journal of Advertising, 14 (2), 48-56.
Kim, C. K., & Chung, J. Y. 1997. Brand Popularity, Country Image and Market Share: An
Empirical Study, Journal of International Business Studies, 28 (2), 361-386.
Kirkman, B. L., Lowe, K. B., & Gibson, C. B. 2006. A Quarter Century of “Culture’s
Consequences”: A Review of Empirical Research Incorporating Hofstede’s Cultural
Values Framework, Journal of International Business Studies, 37 (3), 285-320.
54
Klein, J. G., Ettenson, R., & Morris, M. D. 1998. The Animosity Model of Foreign Product
Purchase: An Empirical Test in the People’s Republic of China, Journal of Marketing,
62 (January), 89-100.
Lanier, C., & Kirchner, M. 2013. Cultural Receptivity: Predicting Consumption in the
International Beverage Market, Global Journal of Business Research, 7 (4), 61-70.
Laufer, D., Gillespie, K., & Silvera, D. 2009. The Role of Country of Manufacture in Consumers’
Attribution of Blame in an Ambiguous Product-Harm Crisis, Journal of International
Consumer Marketing, 21 (3), 189-201.
Lee, W. J., Phau, I., & Roy, R. 2012. Status and Nonstatus Consumers’ Attitude toward Foreign
and Domestic Luxury Brands of Underwear, Journal of International Consumer
Marketing, 24 (1-2), 43-56.
Leonidou, L.C., Hadjimarcou, J., Kaleka, A., & Stamenova, G. T. 1999. Bulgarian Consumers’
Perceptions of Products Made in Asia Pacific, International Marketing Review, 16 (2),
126-142.
Levitt, T. 1983. The Globalization of the Markets, Harvard Business Review, 61 (May-June), 2-
11.
MacKenzie, I. S. 2013. Human-Computer Interaction: An Empirical Research Perspective.
Waltham, MA: Elsevier.
Maheswaran, D. 1994. Country of Origin as a Stereotype: Effects of Consumer Expertise and
Attitude Strength on Product Evaluations, Journal of Consumer Research, 21 (2), 354-
365.
Mandler, G. 1982. The Structure of Value: Accounting for Taste. In M. S. Clarke & S. T. Fiske
(Eds.), Affect and Cognition: The 17th Annual Carnegie Symposium on Cognition: 3-
36. Hillsdale, NJ: Erlbaum.
Mandler, G. 1983. Approaches to a Psychology of Value. In M. Hechter, L. Nadel & R. E. Michod
(Eds.), The Origin of Values: 229-258. New York: Aldine De Gruyter.
55
Manrai, L. A., & Manrai, A. K. 1996. Current Issues in Cross-Cultural and Cross-National
Consumer Research. In L. A. Manrai & A. K. Manrai (Eds.) Global Perspectives in
Cross-Cultural and Cross-National Consumer Research. New York: International
Business Press/Haworth Press.
Manrai, L. A., Lascu, D., & Manrai, A. K. 1998. Interactive Effects of Country of Origin and
Product Category on Product Evaluations, International Business Review, 7 (6), 591-
615.
Meyers-Levy, J., & Tybout, A. M. 1989. Schema Congruity as a Basis for Product Evaluation,
Journal of Consumer Research, 16 (1), 39-54.
Mohamad, O. Z. U., Ahmed, Z. U., Honeycutt Jr, E. D., & Tyebkhan, T. Z. 2000. Does “Made
in …” Matter to Consumers: A Malaysian Study of Country of Origin Effect,
Multinational Business Review, 8 (2), 69-73.
Mook, D. G. 2001. Psychological Research: The Ideas behind the Methods. New York: W. W.
Norton & Company.
Morgan, S. J. 2012. The Human Side of Outsourcing: Psychological Theory and Management
Practice. Hoboken, NJ: Wiley-Blackwell.
Nachum, L., Zaheer, S., & Gross, S. 2008. Does It Matter Where Countries Are? Proximity to
Knowledge, Markets and Resources, and MNE Location Choices, Management
Science, 54 (7), 1252-1265.
Nishida, H. 1999. A Cognitive Approach to International Communication Based on Schema
Theory, International Journal of Intercultural Relations, 23 (5), 753-777.
Nordstrom, K. A., & Vahlne, J-E. 1992. Is the Globe Shrinking? Psychic Distance and the
Establishment of Swedish Sales Subsidiaries during the Last 100 Years. Paper
presented at the International Trade and Finance Association’s Annual Conference,
April 22-25, Laredo, Texas.
O’Grady, S., & Lane, H. 1996. The Psychic Distance Paradox, Journal of International Business
Studies, 27 (2), 309-333.
56
Paharia, N., Keinan, A., Avery, J., & Schor, J. B. 2011. The Underdog Effect: The Marketing of
Disadvantage and Determination through Brand Biography, Journal of Consumer
Research, 37 (February), 755-790.
Papadopoulos, N., & Heslop, L. A. 1993. Product and Country Images: Research and Strategy.
New York: The Haworth Press.
Papadopoulos, N., Heslop, L. A., & Bamossy, G. 1990. A Comparative Analysis of Domestic
versus Imported Products, International Journal of Research in Marketing, 7 (4), 283-
294.
Peterson, R. A., & Jolibert, A. J. P. 1995. A Meta-Analysis of Country-of-Origin Effects, Journal
of International Business Studies, 26 (4), 883-900.
Phau, I., & Yip, S. L. 2008. Attitudes toward Domestic and Foreign Luxury Brand Apparel: A
Comparison between Status and Non-Status Seeking Teenagers, Journal of Fashion
Marketing and Management, 12 (1), 68-89.
Podsakoff, P. M., & Organ, D. W. 1986. Self-reports in Organizational Research: Problems and
Prospects. Journal of Management, 12 (4), 531-544.
Porter, M. 1980. Competitive Strategy. New York: Free Press.
Porter, M. 1985. Competitive Advantage. New York: Free Press.
Power, M. J., Desouza, K. C., & Bonifazi, C. 2006. The Outsourcing Handbook: How to
Implement a Successful Outsourcing Process. London: Kogan Page.
Rawwas, M. Y. A., Rajendran, K. N., & Wuehrer, G. A. 1996. The Influence of Worldmindedness
and Nationalism on Consumer Evaluation of Domestic and Foreign Products,
International Marketing Review, 13 (2), 20-38.
Ronen, S., & Shenkar, O. 1985. Clustering Countries on Attitudinal Dimensions: A Review and
Synthesis, Academy of Management Review, 10 (3), 435-454.
Roth, M. S., & Romeo, J. B. 1992. Matching Product Category and Country Image Perceptions:
A Framework for Managing Country-of-Origin Effects, Journal of International
Business Studies, 23 (3), 477-497.
57
Salancik, G. R., & Pfeffer, J. 1977. An Examination of the Need-Satisfaction Models of Job
Attitudes. Administrative Science Quarterly, 22 (September), 427-456.
Samiee, S. 1994. Customer Evaluation of Products in a Global Market, Journal of International
Business Studies, 25 (3), 579-604.
Samiee, S. 2010. Advancing the Country Image Construct: A Commentary Essay, Journal of
Business Research, 63 (4), 442-445.
Schmitt, A., & Van Biesebroeck, J. 2013. Proximity Strategies in Outsourcing Relations: The Role
of Geographical, Cultural, and Relational Proximity in the European Automotive
Industry, Journal of International Business Studies, 44 (5), 451-474.
Schniederjans, M. J., Cao, Q., & Olson, J. R. 2004. Consumer Perceptions of Product Quality:
Made in China, Quality Management Journal, 11 (3), 8-19.
Schooler, R. D. 1965. Product Bias in the Central American Common Market, Journal of
Marketing Research, 2 (4), 394-397.
Sengupta, J., & Johar, G. V. 2002. Effects of Inconsistent Attribute Information on the Predictive
Value of Product Attitudes: Toward a Resolution of Opposing Perspectives, Journal
of Consumer Research, 29 (June), 39-56.
Sharma, S., Shimp, T. A., & Shin, J. 1995. Consumer Ethnocentrism: A Test of Antecedents and
Moderators, Journal of the Academy of Marketing Science, 23 (1), 26-37.
Shimp, T. A., & Sharma, S. 1987. Consumer Ethnocentrism: Construction and Validation of the
CETSCALE, Journal of Marketing Research, 25 (June), 78-90.
Simonin, B. L., & Ruth, J. A. 1998. Is A Company Known by the Company It Keeps? Assessing
the Spillover Effects of Brand Alliances on Consumer Brand Attitudes, Journal of
Consumer Research, 35 (February), 30-42.
Sprott, D. E., & Shimp, T. A. 2004. Using Product Sampling to Augment the Perceived Quality of
Store Brands, Journal of Retailing, 80 (4), 305-315.
Sumner, W. G. 1906. Folkways: The Sociological Importance of Usages, Manners, Customs,
Mores, and Morals. New York: Ginn.
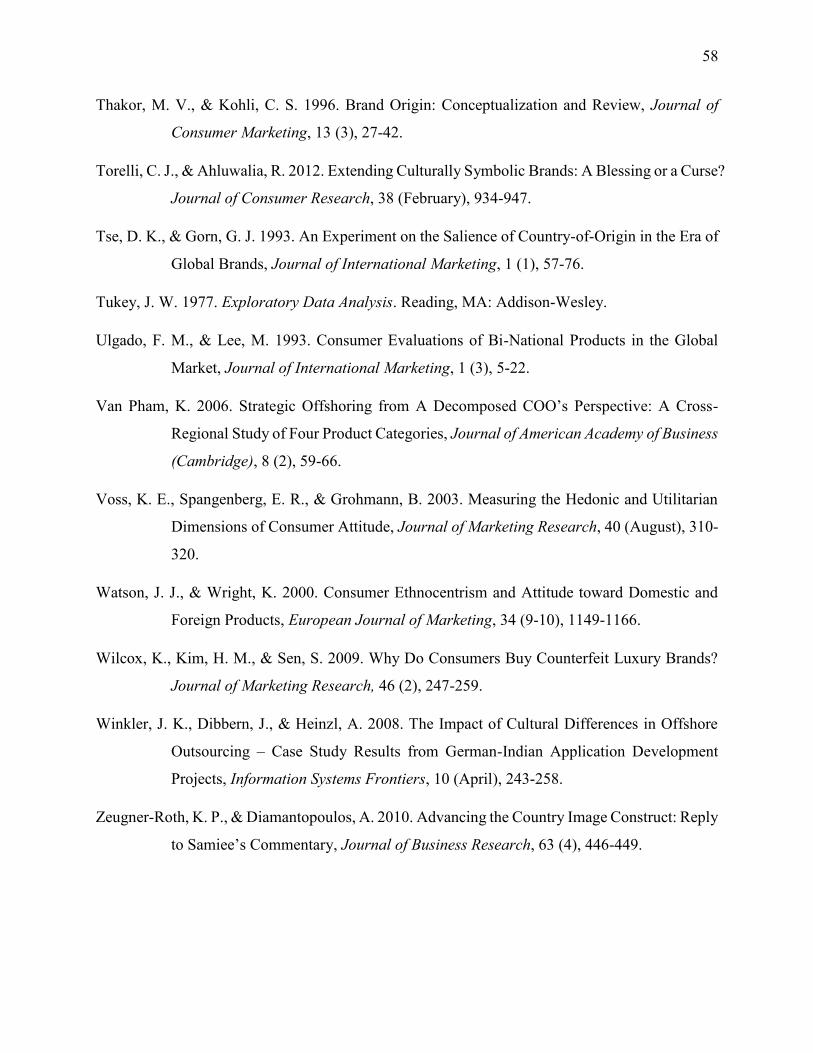
58
Thakor, M. V., & Kohli, C. S. 1996. Brand Origin: Conceptualization and Review, Journal of
Consumer Marketing, 13 (3), 27-42.
Torelli, C. J., & Ahluwalia, R. 2012. Extending Culturally Symbolic Brands: A Blessing or a Curse?
Journal of Consumer Research, 38 (February), 934-947.
Tse, D. K., & Gorn, G. J. 1993. An Experiment on the Salience of Country-of-Origin in the Era of
Global Brands, Journal of International Marketing, 1 (1), 57-76.
Tukey, J. W. 1977. Exploratory Data Analysis. Reading, MA: Addison-Wesley.
Ulgado, F. M., & Lee, M. 1993. Consumer Evaluations of Bi-National Products in the Global
Market, Journal of International Marketing, 1 (3), 5-22.
Van Pham, K. 2006. Strategic Offshoring from A Decomposed COO’s Perspective: A Cross-
Regional Study of Four Product Categories, Journal of American Academy of Business
(Cambridge), 8 (2), 59-66.
Voss, K. E., Spangenberg, E. R., & Grohmann, B. 2003. Measuring the Hedonic and Utilitarian
Dimensions of Consumer Attitude, Journal of Marketing Research, 40 (August), 310-
320.
Watson, J. J., & Wright, K. 2000. Consumer Ethnocentrism and Attitude toward Domestic and
Foreign Products, European Journal of Marketing, 34 (9-10), 1149-1166.
Wilcox, K., Kim, H. M., & Sen, S. 2009. Why Do Consumers Buy Counterfeit Luxury Brands?
Journal of Marketing Research, 46 (2), 247-259.
Winkler, J. K., Dibbern, J., & Heinzl, A. 2008. The Impact of Cultural Differences in Offshore
Outsourcing – Case Study Results from German-Indian Application Development
Projects, Information Systems Frontiers, 10 (April), 243-258.
Zeugner-Roth, K. P., & Diamantopoulos, A. 2010. Advancing the Country Image Construct: Reply
to Samiee’s Commentary, Journal of Business Research, 63 (4), 446-449.
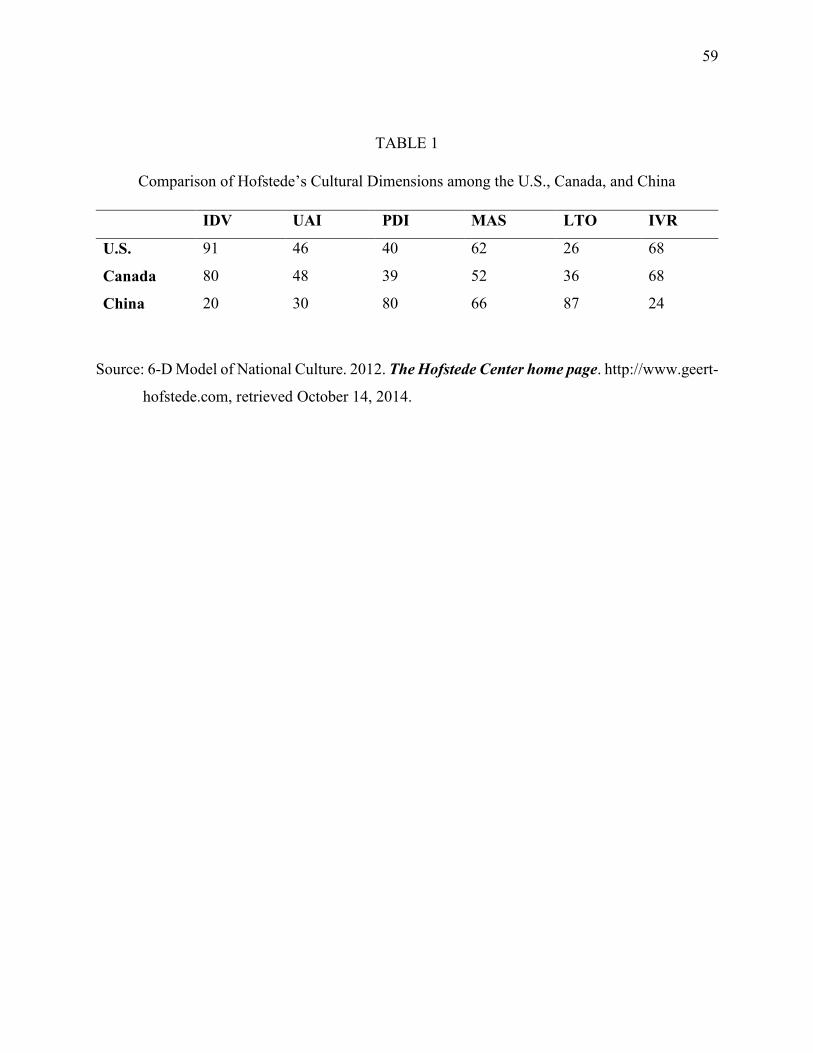
59
TABLE 1
Comparison of Hofstede’s Cultural Dimensions among the U.S., Canada, and China
IDV UAI PDI MAS LTO IVR
U.S. 91 46 40 62 26 68
Canada 80 48 39 52 36 68
China 20 30 80 66 87 24
Source: 6-D Model of National Culture. 2012. The Hofstede Center home page. http://www.geert-
hofstede.com, retrieved October 14, 2014.
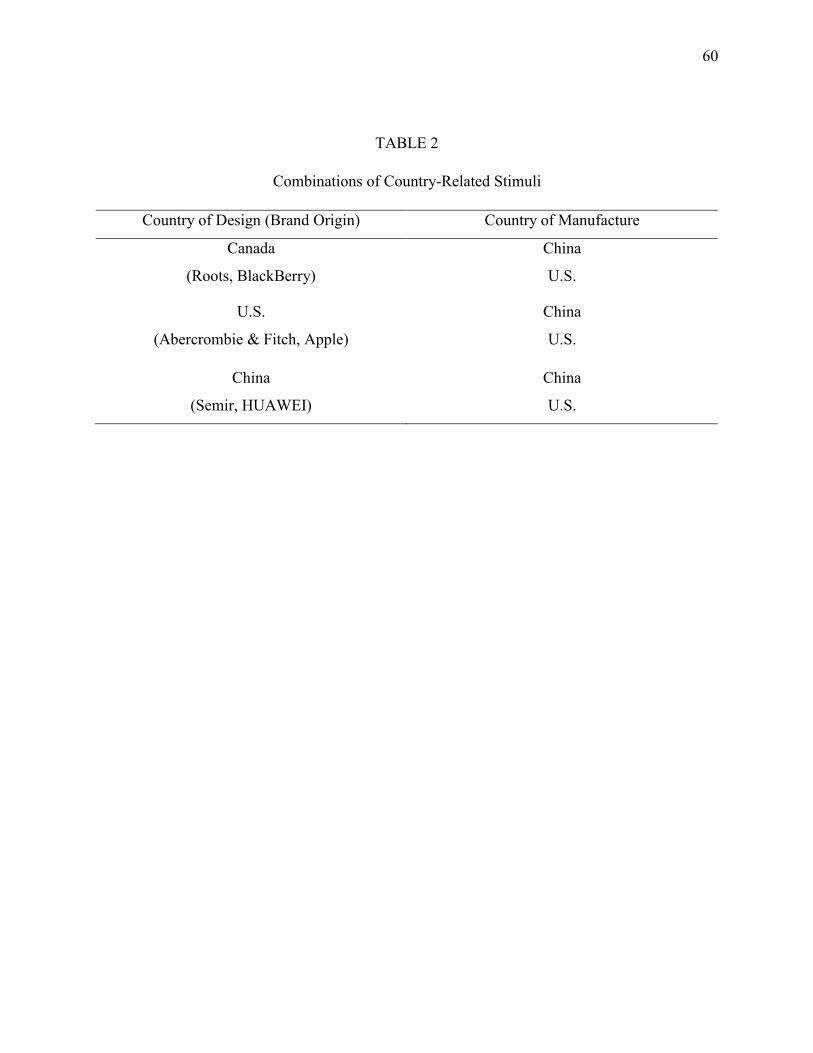
60
TABLE 2
Combinations of Country-Related Stimuli
Country of Design (Brand Origin) Country of Manufacture
Canada China
(Roots, BlackBerry) U.S.
U.S. China
(Abercrombie & Fitch, Apple) U.S.
China China
(Semir, HUAWEI) U.S.

61
TABLE 3
Participant Characteristics (Pilot Study, N= 31)
Demographic Variables Absolute Frequency Relative Frequency (%)
Gender
Female
Male
21
10
67.7
32.3
Status in Canada
Canadian Citizen
Immigrant
Person who holds visa
24
0
7
77.4
0
22.6
Ethnic background
North American
Asian
Others
11
7
13
32.5
22.6
44.9
Years in Canada
Under 15 years
15-30 years
5
26
16.1
83.9
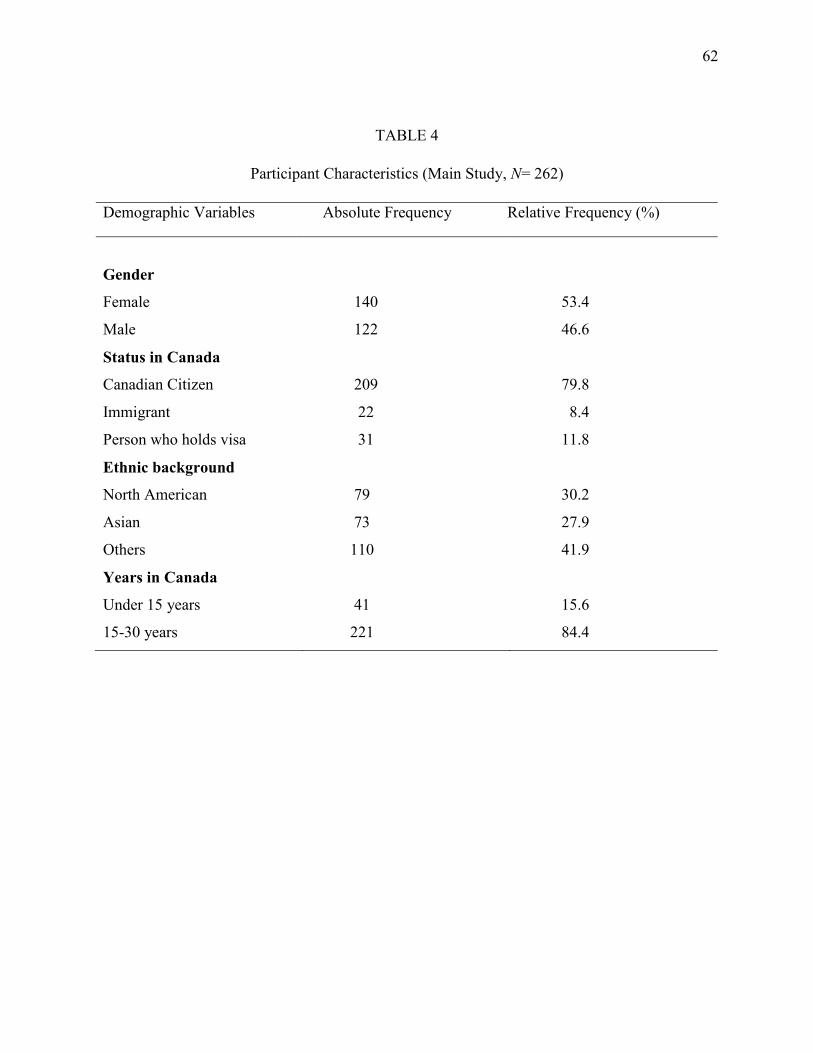
62
TABLE 4
Participant Characteristics (Main Study, N= 262)
Demographic Variables Absolute Frequency Relative Frequency (%)
Gender
Female
Male
140
122
53.4
46.6
Status in Canada
Canadian Citizen
Immigrant
Person who holds visa
209
22
31
79.8
8.4
11.8
Ethnic background
North American
Asian
Others
79
73
110
30.2
27.9
41.9
Years in Canada
Under 15 years
15-30 years
41
221
15.6
84.4
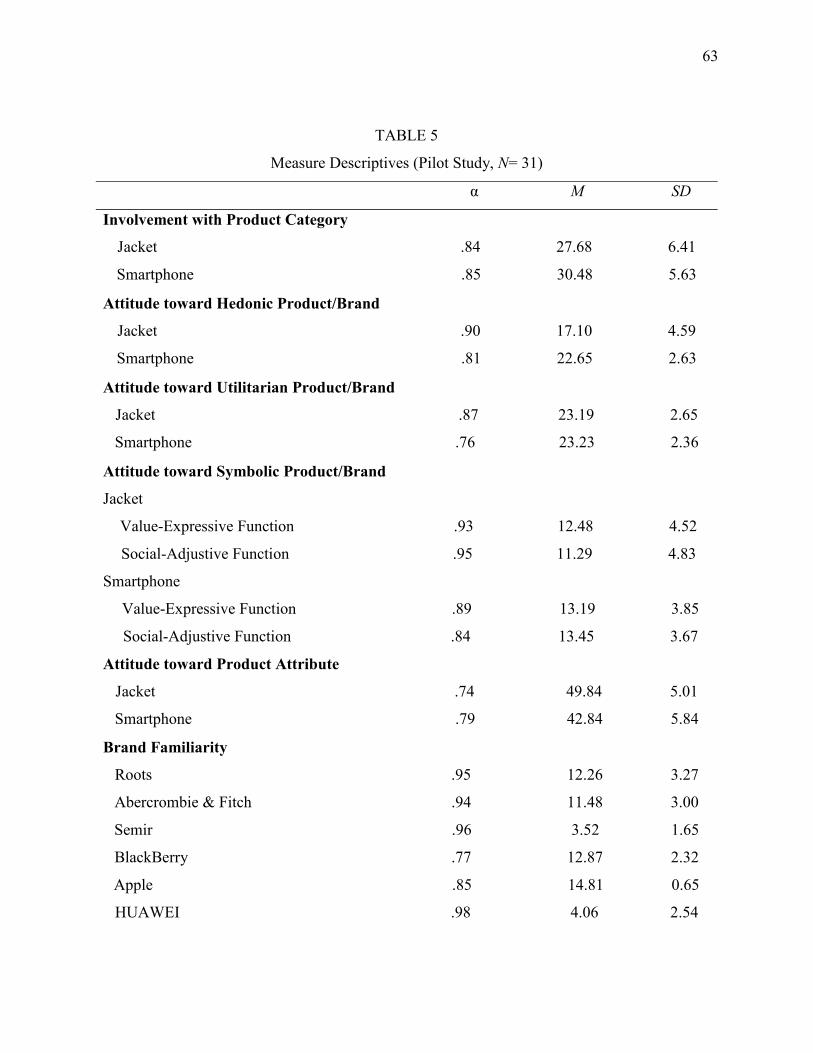
63
TABLE 5
Measure Descriptives (Pilot Study, N= 31)
α M SD
Involvement with Product Category
Jacket .84 27.68 6.41
Smartphone .85 30.48 5.63
Attitude toward Hedonic Product/Brand
Jacket .90 17.10 4.59
Smartphone .81 22.65 2.63
Attitude toward Utilitarian Product/Brand
Jacket .87 23.19 2.65
Smartphone .76 23.23 2.36
Attitude toward Symbolic Product/Brand
Jacket
Value-Expressive Function .93 12.48 4.52
Social-Adjustive Function .95 11.29 4.83
Smartphone
Value-Expressive Function .89 13.19 3.85
Social-Adjustive Function .84 13.45 3.67
Attitude toward Product Attribute
Jacket .74 49.84 5.01
Smartphone .79 42.84 5.84
Brand Familiarity
Roots .95 12.26 3.27
Abercrombie & Fitch .94 11.48 3.00
Semir .96 3.52 1.65
BlackBerry .77 12.87 2.32
Apple .85 14.81 0.65
HUAWEI .98 4.06 2.54
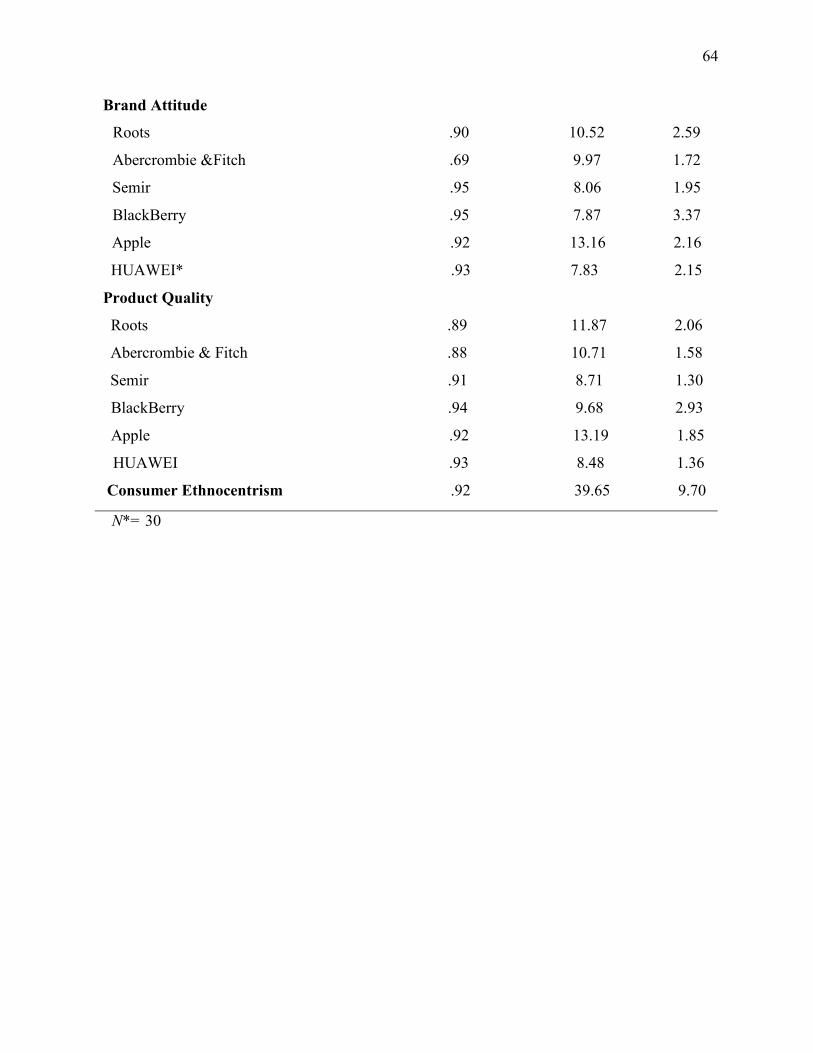
64
Brand Attitude
Roots .90 10.52 2.59
Abercrombie &Fitch .69 9.97 1.72
Semir .95 8.06 1.95
BlackBerry .95 7.87 3.37
Apple .92 13.16 2.16
HUAWEI* .93 7.83 2.15
Product Quality
Roots .89 11.87 2.06
Abercrombie & Fitch .88 10.71 1.58
Semir .91 8.71 1.30
BlackBerry .94 9.68 2.93
Apple .92 13.19 1.85
HUAWEI .93 8.48 1.36
Consumer Ethnocentrism .92 39.65 9.70
N*= 30
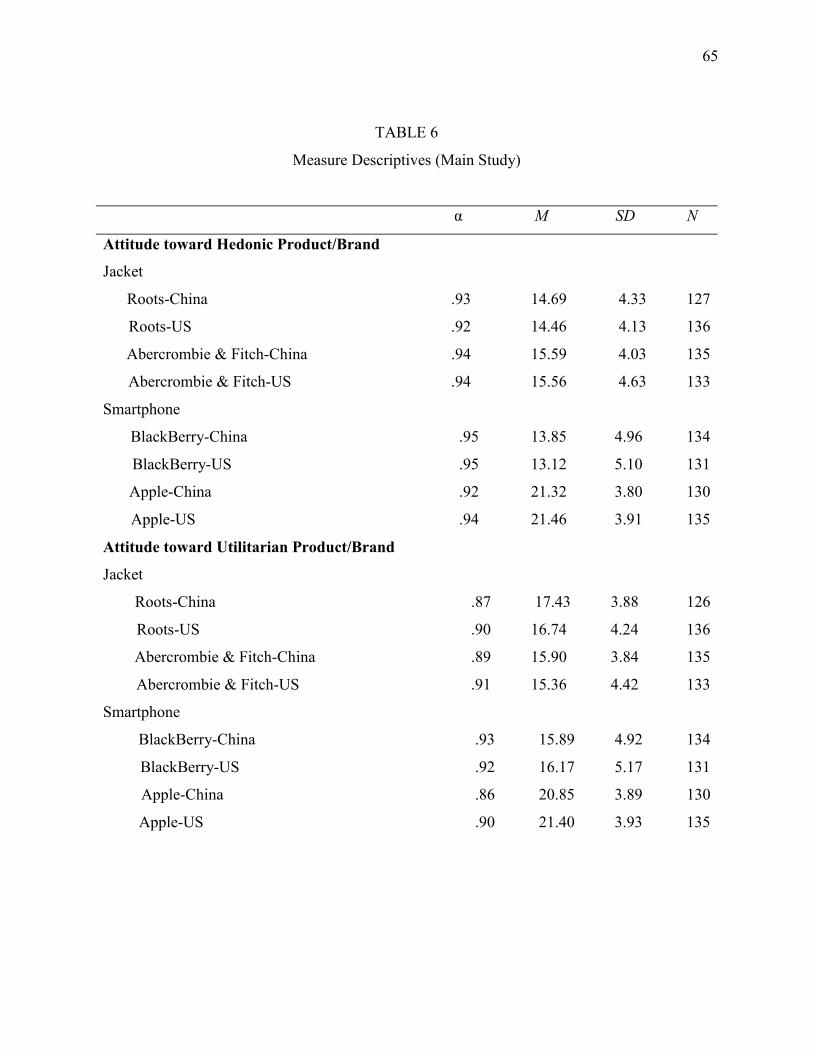
65
TABLE 6
Measure Descriptives (Main Study)
α M SD N
Attitude toward Hedonic Product/Brand
Jacket
Roots-China .93 14.69 4.33 127
Roots-US .92 14.46 4.13 136
Abercrombie & Fitch-China .94 15.59 4.03 135
Abercrombie & Fitch-US .94 15.56 4.63 133
Smartphone
BlackBerry-China .95 13.85 4.96 134
BlackBerry-US .95 13.12 5.10 131
Apple-China .92 21.32 3.80 130
Apple-US .94 21.46 3.91 135
Attitude toward Utilitarian Product/Brand
Jacket
Roots-China .87 17.43 3.88 126
Roots-US .90 16.74 4.24 136
Abercrombie & Fitch-China .89 15.90 3.84 135
Abercrombie & Fitch-US .91 15.36 4.42 133
Smartphone
BlackBerry-China .93 15.89 4.92 134
BlackBerry-US .92 16.17 5.17 131
Apple-China .86 20.85 3.89 130
Apple-US .90 21.40 3.93 135
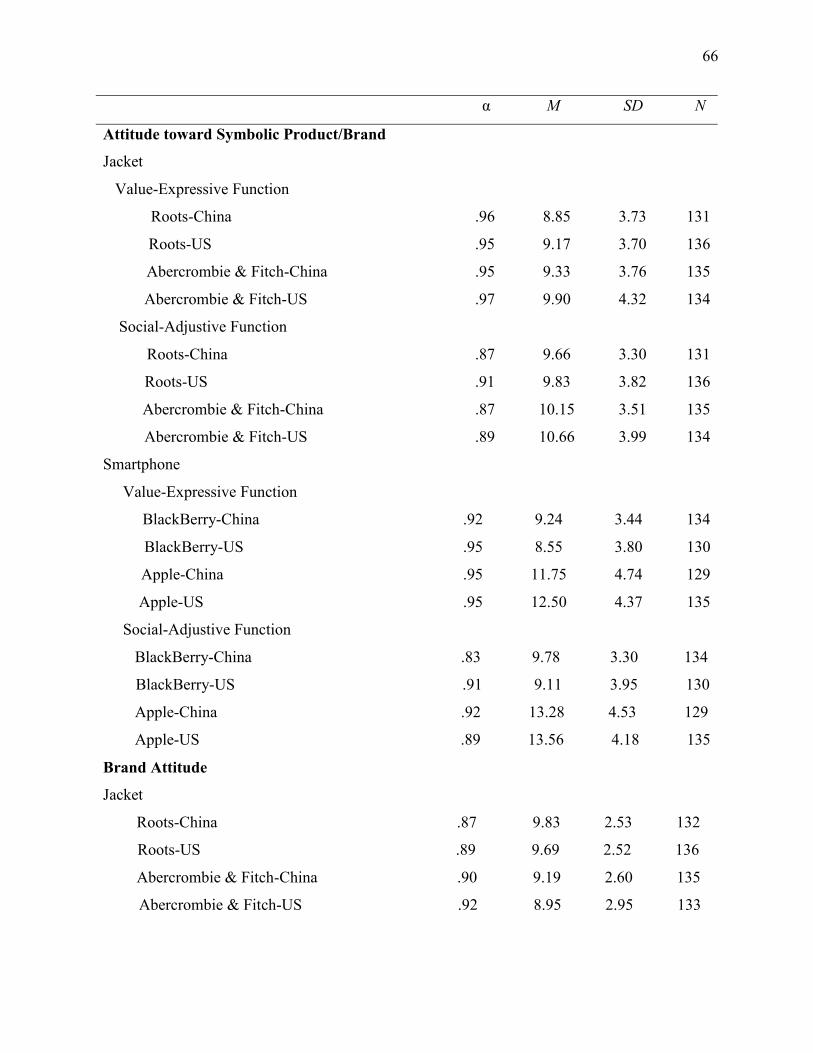
66
α M SD N
Attitude toward Symbolic Product/Brand
Jacket
Value-Expressive Function
Roots-China .96 8.85 3.73 131
Roots-US .95 9.17 3.70 136
Abercrombie & Fitch-China .95 9.33 3.76 135
Abercrombie & Fitch-US .97 9.90 4.32 134
Social-Adjustive Function
Roots-China .87 9.66 3.30 131
Roots-US .91 9.83 3.82 136
Abercrombie & Fitch-China .87 10.15 3.51 135
Abercrombie & Fitch-US .89 10.66 3.99 134
Smartphone
Value-Expressive Function
BlackBerry-China .92 9.24 3.44 134
BlackBerry-US .95 8.55 3.80 130
Apple-China .95 11.75 4.74 129
Apple-US .95 12.50 4.37 135
Social-Adjustive Function
BlackBerry-China .83 9.78 3.30 134
BlackBerry-US .91 9.11 3.95 130
Apple-China .92 13.28 4.53 129
Apple-US .89 13.56 4.18 135
Brand Attitude
Jacket
Roots-China .87 9.83 2.53 132
Roots-US .89 9.69 2.52 136
Abercrombie & Fitch-China .90 9.19 2.60 135
Abercrombie & Fitch-US .92 8.95 2.95 133
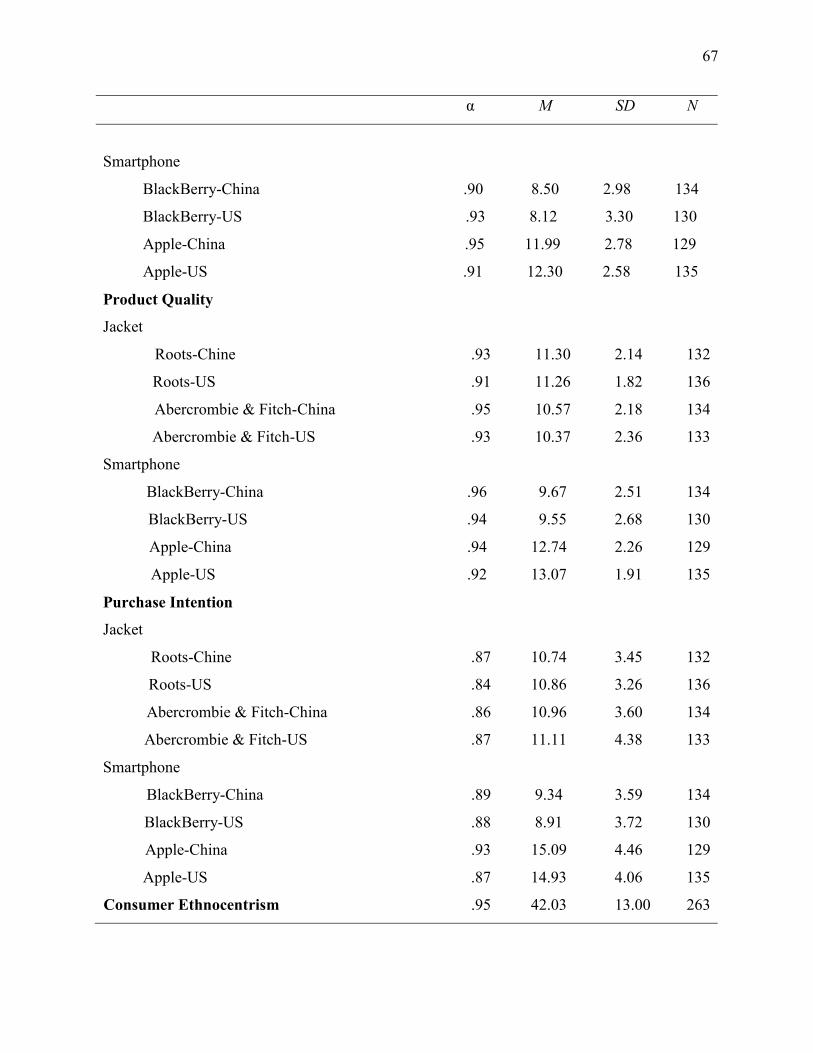
67
α M SD N
Smartphone
BlackBerry-China .90 8.50 2.98 134
BlackBerry-US .93 8.12 3.30 130
Apple-China .95 11.99 2.78 129
Apple-US .91 12.30 2.58 135
Product Quality
Jacket
Roots-Chine .93 11.30 2.14 132
Roots-US .91 11.26 1.82 136
Abercrombie & Fitch-China .95 10.57 2.18 134
Abercrombie & Fitch-US .93 10.37 2.36 133
Smartphone
BlackBerry-China .96 9.67 2.51 134
BlackBerry-US .94 9.55 2.68 130
Apple-China .94 12.74 2.26 129
Apple-US .92 13.07 1.91 135
Purchase Intention
Jacket
Roots-Chine .87 10.74 3.45 132
Roots-US .84 10.86 3.26 136
Abercrombie & Fitch-China .86 10.96 3.60 134
Abercrombie & Fitch-US .87 11.11 4.38 133
Smartphone
BlackBerry-China .89 9.34 3.59 134
BlackBerry-US .88 8.91 3.72 130
Apple-China .93 15.09 4.46 129
Apple-US .87 14.93 4.06 135
Consumer Ethnocentrism .95 42.03 13.00 263
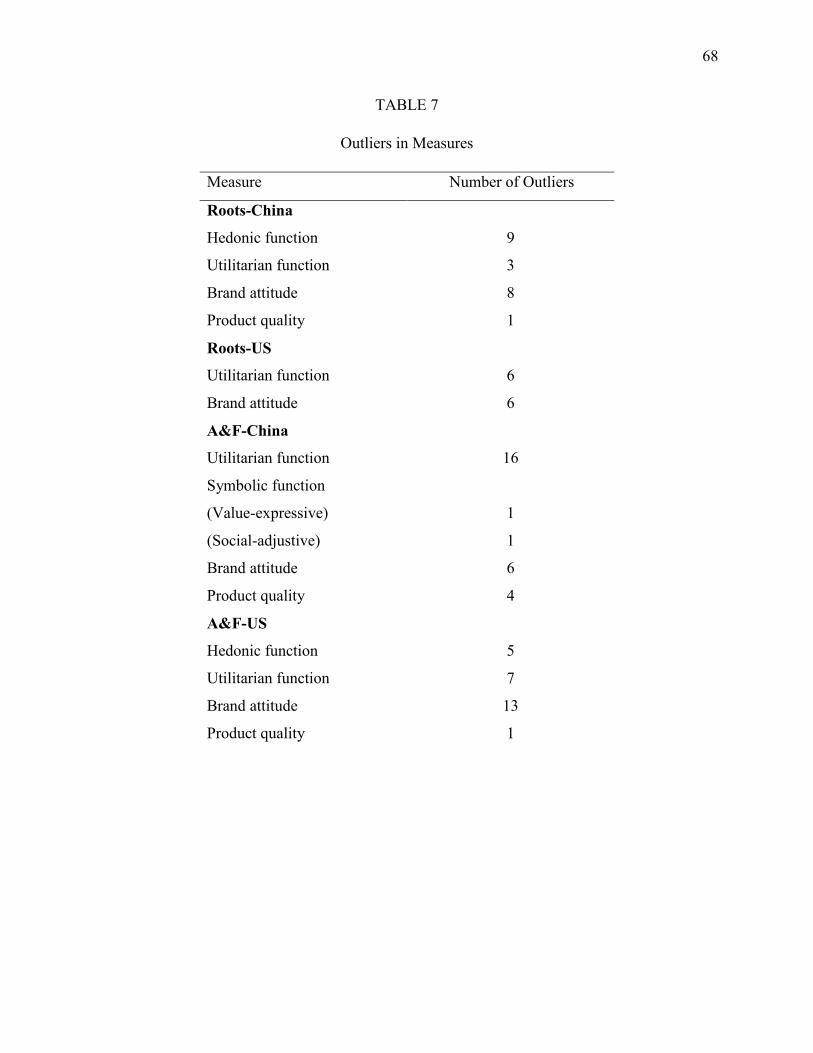
68
TABLE 7
Outliers in Measures
Measure Number of Outliers
Roots-China
Hedonic function
Utilitarian function
Brand attitude
Product quality
Roots-US
Utilitarian function
Brand attitude
9
3
8
1
6
6
A&F-China
Utilitarian function
Symbolic function
(Value-expressive)
(Social-adjustive)
Brand attitude
Product quality
A&F-US
Hedonic function
Utilitarian function
Brand attitude
Product quality
16
1
1
6
4
5
7
13
1
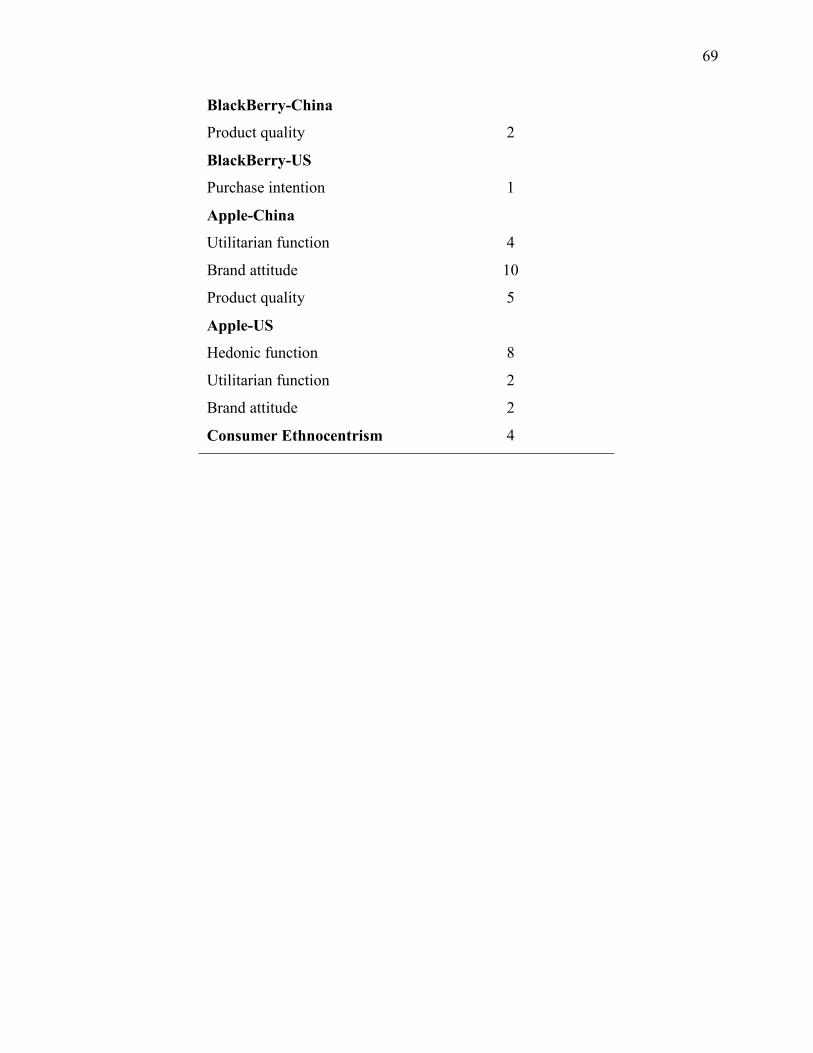
69
BlackBerry-China
Product quality
BlackBerry-US
Purchase intention
2
1
Apple-China
Utilitarian function
Brand attitude
Product quality
Apple-US
Hedonic function
Utilitarian function
Brand attitude
4
10
5
8
2
2
Consumer Ethnocentrism 4
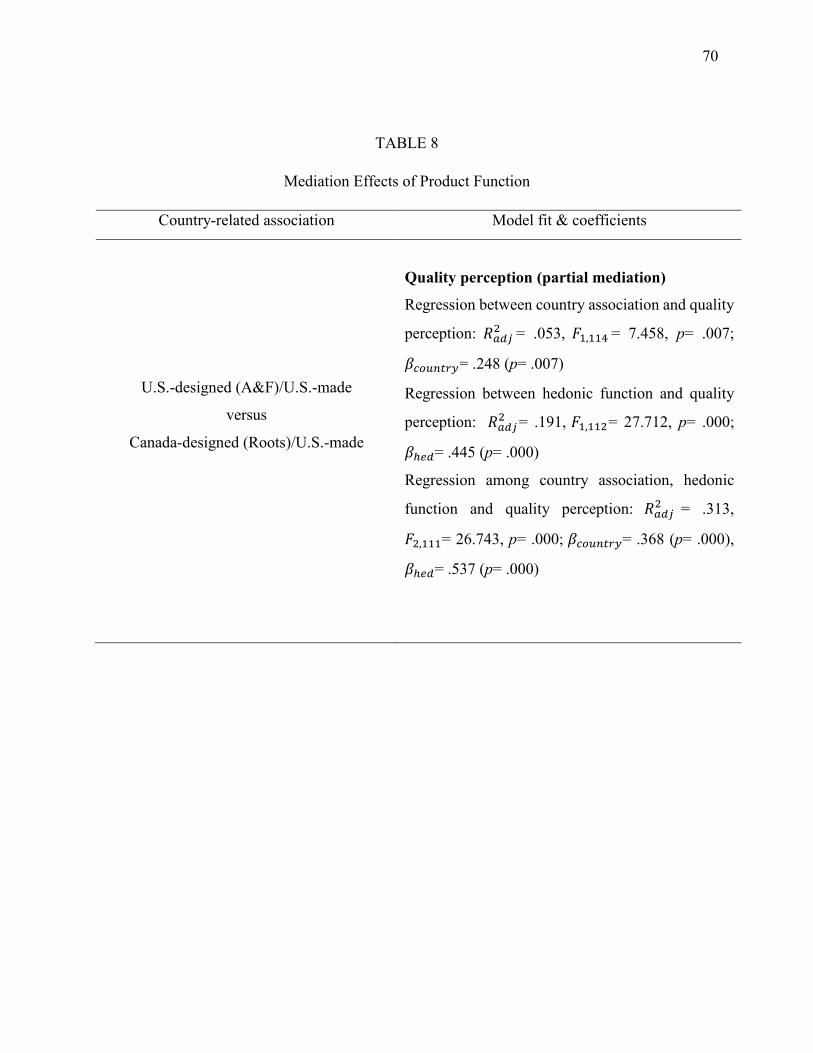
70
TABLE 8
Mediation Effects of Product Function
Country-related association Model fit & coefficients
U.S.-designed (A&F)/U.S.-made
versus
Canada-designed (Roots)/U.S.-made
Quality perception (partial mediation)
Regression between country association and quality
perception: 𝑅𝑎𝑑𝑗2 = .053, 𝐹1,114 = 7.458, p= .007;
𝛽𝑐𝑜𝑢𝑛𝑡𝑟𝑦= .248 (p= .007)
Regression between hedonic function and quality
perception: 𝑅𝑎𝑑𝑗2 = .191, 𝐹1,112= 27.712, p= .000;
𝛽ℎ𝑒𝑑= .445 (p= .000)
Regression among country association, hedonic
function and quality perception: 𝑅𝑎𝑑𝑗2 = .313,
𝐹2,111= 26.743, p= .000; 𝛽𝑐𝑜𝑢𝑛𝑡𝑟𝑦= .368 (p= .000),
𝛽ℎ𝑒𝑑= .537 (p= .000)
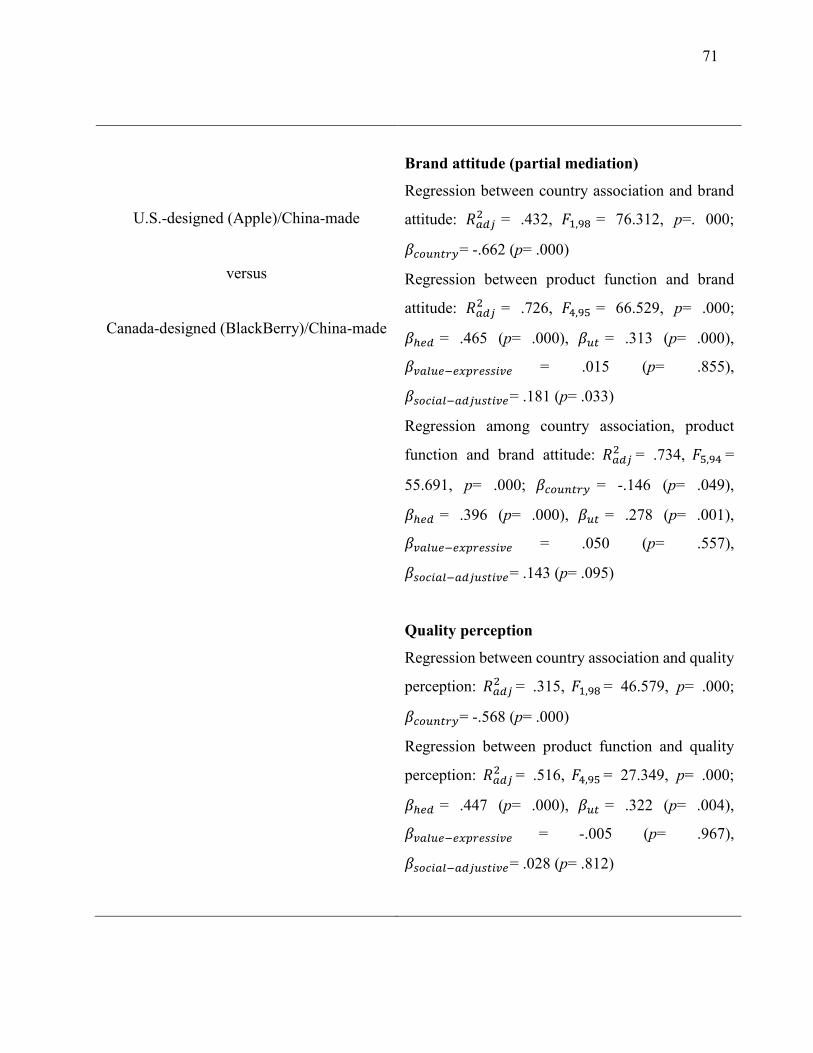
71
U.S.-designed (Apple)/China-made
versus
Canada-designed (BlackBerry)/China-made
Brand attitude (partial mediation)
Regression between country association and brand
attitude: 𝑅𝑎𝑑𝑗2 = .432, 𝐹1,98 = 76.312, p=. 000;
𝛽𝑐𝑜𝑢𝑛𝑡𝑟𝑦= -.662 (p= .000)
Regression between product function and brand
attitude: 𝑅𝑎𝑑𝑗2 = .726, 𝐹4,95 = 66.529, p= .000;
𝛽ℎ𝑒𝑑 = .465 (p= .000), 𝛽𝑢𝑡 = .313 (p= .000),
𝛽𝑣𝑎𝑙𝑢𝑒−𝑒𝑥𝑝𝑟𝑒𝑠𝑠𝑖𝑣𝑒 = .015 (p= .855),
𝛽𝑠𝑜𝑐𝑖𝑎𝑙−𝑎𝑑𝑗𝑢𝑠𝑡𝑖𝑣𝑒= .181 (p= .033)
Regression among country association, product
function and brand attitude: 𝑅𝑎𝑑𝑗2 = .734, 𝐹5,94 =
55.691, p= .000; 𝛽𝑐𝑜𝑢𝑛𝑡𝑟𝑦 = -.146 (p= .049),
𝛽ℎ𝑒𝑑 = .396 (p= .000), 𝛽𝑢𝑡 = .278 (p= .001),
𝛽𝑣𝑎𝑙𝑢𝑒−𝑒𝑥𝑝𝑟𝑒𝑠𝑠𝑖𝑣𝑒 = .050 (p= .557),
𝛽𝑠𝑜𝑐𝑖𝑎𝑙−𝑎𝑑𝑗𝑢𝑠𝑡𝑖𝑣𝑒= .143 (p= .095)
Quality perception
Regression between country association and quality
perception: 𝑅𝑎𝑑𝑗2 = .315, 𝐹1,98 = 46.579, p= .000;
𝛽𝑐𝑜𝑢𝑛𝑡𝑟𝑦= -.568 (p= .000)
Regression between product function and quality
perception: 𝑅𝑎𝑑𝑗2 = .516, 𝐹4,95 = 27.349, p= .000;
𝛽ℎ𝑒𝑑 = .447 (p= .000), 𝛽𝑢𝑡 = .322 (p= .004),
𝛽𝑣𝑎𝑙𝑢𝑒−𝑒𝑥𝑝𝑟𝑒𝑠𝑠𝑖𝑣𝑒 = -.005 (p= .967),
𝛽𝑠𝑜𝑐𝑖𝑎𝑙−𝑎𝑑𝑗𝑢𝑠𝑡𝑖𝑣𝑒= .028 (p= .812)
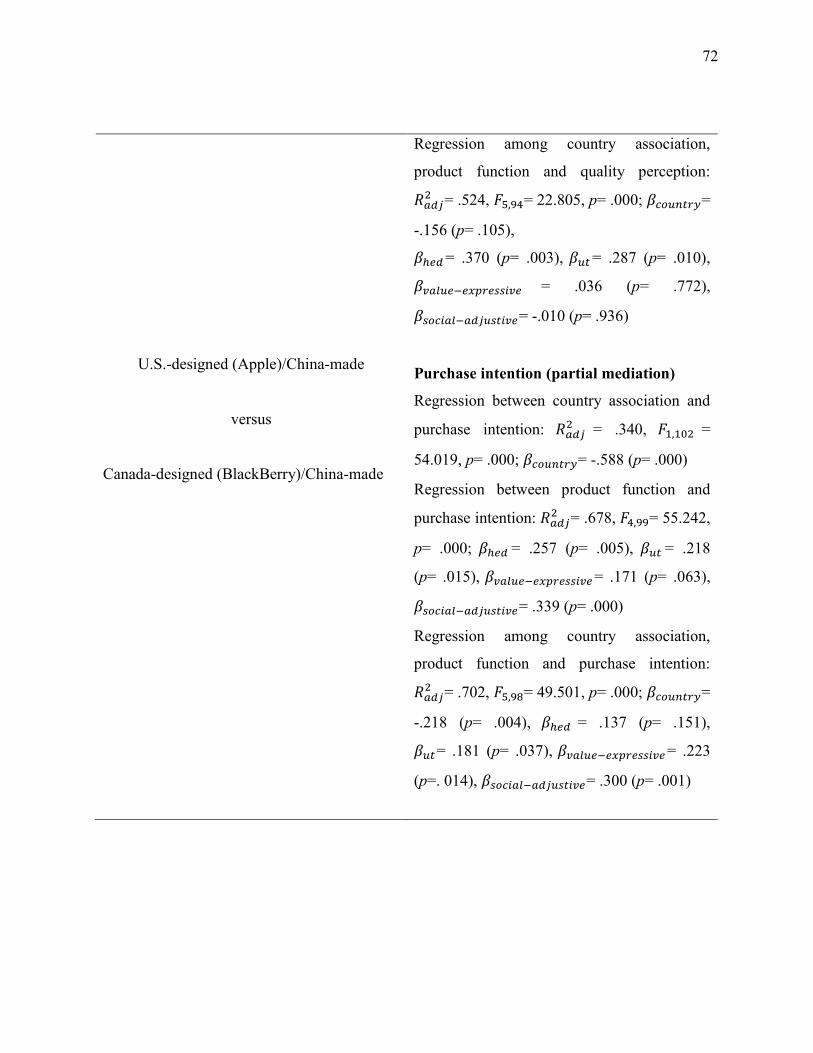
72
U.S.-designed (Apple)/China-made
versus
Canada-designed (BlackBerry)/China-made
Regression among country association,
product function and quality perception:
𝑅𝑎𝑑𝑗2 = .524, 𝐹5,94= 22.805, p= .000; 𝛽𝑐𝑜𝑢𝑛𝑡𝑟𝑦=
-.156 (p= .105),
𝛽ℎ𝑒𝑑 = .370 (p= .003), 𝛽𝑢𝑡 = .287 (p= .010),
𝛽𝑣𝑎𝑙𝑢𝑒−𝑒𝑥𝑝𝑟𝑒𝑠𝑠𝑖𝑣𝑒 = .036 (p= .772),
𝛽𝑠𝑜𝑐𝑖𝑎𝑙−𝑎𝑑𝑗𝑢𝑠𝑡𝑖𝑣𝑒= -.010 (p= .936)
Purchase intention (partial mediation)
Regression between country association and
purchase intention: 𝑅𝑎𝑑𝑗2 = .340, 𝐹1,102 =
54.019, p= .000; 𝛽𝑐𝑜𝑢𝑛𝑡𝑟𝑦= -.588 (p= .000)
Regression between product function and
purchase intention: 𝑅𝑎𝑑𝑗2 = .678, 𝐹4,99= 55.242,
p= .000; 𝛽ℎ𝑒𝑑 = .257 (p= .005), 𝛽𝑢𝑡 = .218
(p= .015), 𝛽𝑣𝑎𝑙𝑢𝑒−𝑒𝑥𝑝𝑟𝑒𝑠𝑠𝑖𝑣𝑒 = .171 (p= .063),
𝛽𝑠𝑜𝑐𝑖𝑎𝑙−𝑎𝑑𝑗𝑢𝑠𝑡𝑖𝑣𝑒= .339 (p= .000)
Regression among country association,
product function and purchase intention:
𝑅𝑎𝑑𝑗2 = .702, 𝐹5,98= 49.501, p= .000; 𝛽𝑐𝑜𝑢𝑛𝑡𝑟𝑦=
-.218 (p= .004), 𝛽ℎ𝑒𝑑 = .137 (p= .151),
𝛽𝑢𝑡= .181 (p= .037), 𝛽𝑣𝑎𝑙𝑢𝑒−𝑒𝑥𝑝𝑟𝑒𝑠𝑠𝑖𝑣𝑒 = .223
(p=. 014), 𝛽𝑠𝑜𝑐𝑖𝑎𝑙−𝑎𝑑𝑗𝑢𝑠𝑡𝑖𝑣𝑒= .300 (p= .001)
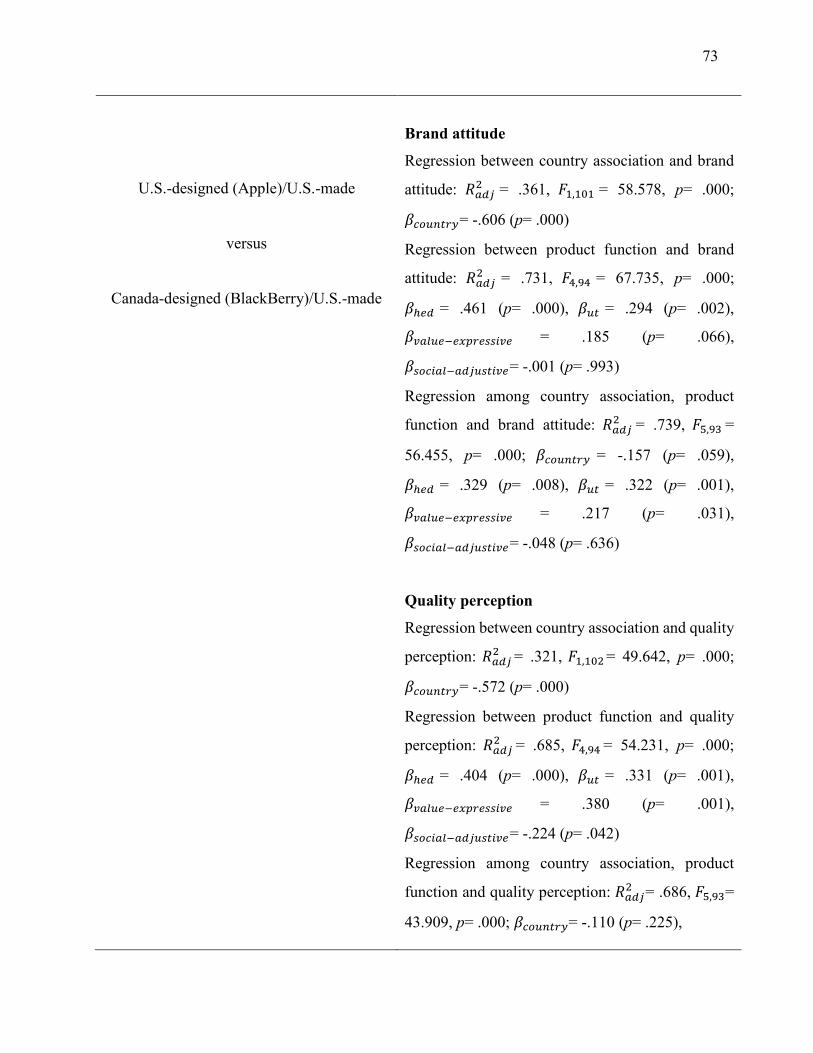
73
U.S.-designed (Apple)/U.S.-made
versus
Canada-designed (BlackBerry)/U.S.-made
Brand attitude
Regression between country association and brand
attitude: 𝑅𝑎𝑑𝑗2 = .361, 𝐹1,101 = 58.578, p= .000;
𝛽𝑐𝑜𝑢𝑛𝑡𝑟𝑦= -.606 (p= .000)
Regression between product function and brand
attitude: 𝑅𝑎𝑑𝑗2 = .731, 𝐹4,94 = 67.735, p= .000;
𝛽ℎ𝑒𝑑 = .461 (p= .000), 𝛽𝑢𝑡 = .294 (p= .002),
𝛽𝑣𝑎𝑙𝑢𝑒−𝑒𝑥𝑝𝑟𝑒𝑠𝑠𝑖𝑣𝑒 = .185 (p= .066),
𝛽𝑠𝑜𝑐𝑖𝑎𝑙−𝑎𝑑𝑗𝑢𝑠𝑡𝑖𝑣𝑒= -.001 (p= .993)
Regression among country association, product
function and brand attitude: 𝑅𝑎𝑑𝑗2 = .739, 𝐹5,93 =
56.455, p= .000; 𝛽𝑐𝑜𝑢𝑛𝑡𝑟𝑦 = -.157 (p= .059),
𝛽ℎ𝑒𝑑 = .329 (p= .008), 𝛽𝑢𝑡 = .322 (p= .001),
𝛽𝑣𝑎𝑙𝑢𝑒−𝑒𝑥𝑝𝑟𝑒𝑠𝑠𝑖𝑣𝑒 = .217 (p= .031),
𝛽𝑠𝑜𝑐𝑖𝑎𝑙−𝑎𝑑𝑗𝑢𝑠𝑡𝑖𝑣𝑒= -.048 (p= .636)
Quality perception
Regression between country association and quality
perception: 𝑅𝑎𝑑𝑗2 = .321, 𝐹1,102 = 49.642, p= .000;
𝛽𝑐𝑜𝑢𝑛𝑡𝑟𝑦= -.572 (p= .000)
Regression between product function and quality
perception: 𝑅𝑎𝑑𝑗2 = .685, 𝐹4,94 = 54.231, p= .000;
𝛽ℎ𝑒𝑑 = .404 (p= .000), 𝛽𝑢𝑡 = .331 (p= .001),
𝛽𝑣𝑎𝑙𝑢𝑒−𝑒𝑥𝑝𝑟𝑒𝑠𝑠𝑖𝑣𝑒 = .380 (p= .001),
𝛽𝑠𝑜𝑐𝑖𝑎𝑙−𝑎𝑑𝑗𝑢𝑠𝑡𝑖𝑣𝑒= -.224 (p= .042)
Regression among country association, product
function and quality perception: 𝑅𝑎𝑑𝑗2 = .686, 𝐹5,93=
43.909, p= .000; 𝛽𝑐𝑜𝑢𝑛𝑡𝑟𝑦= -.110 (p= .225),
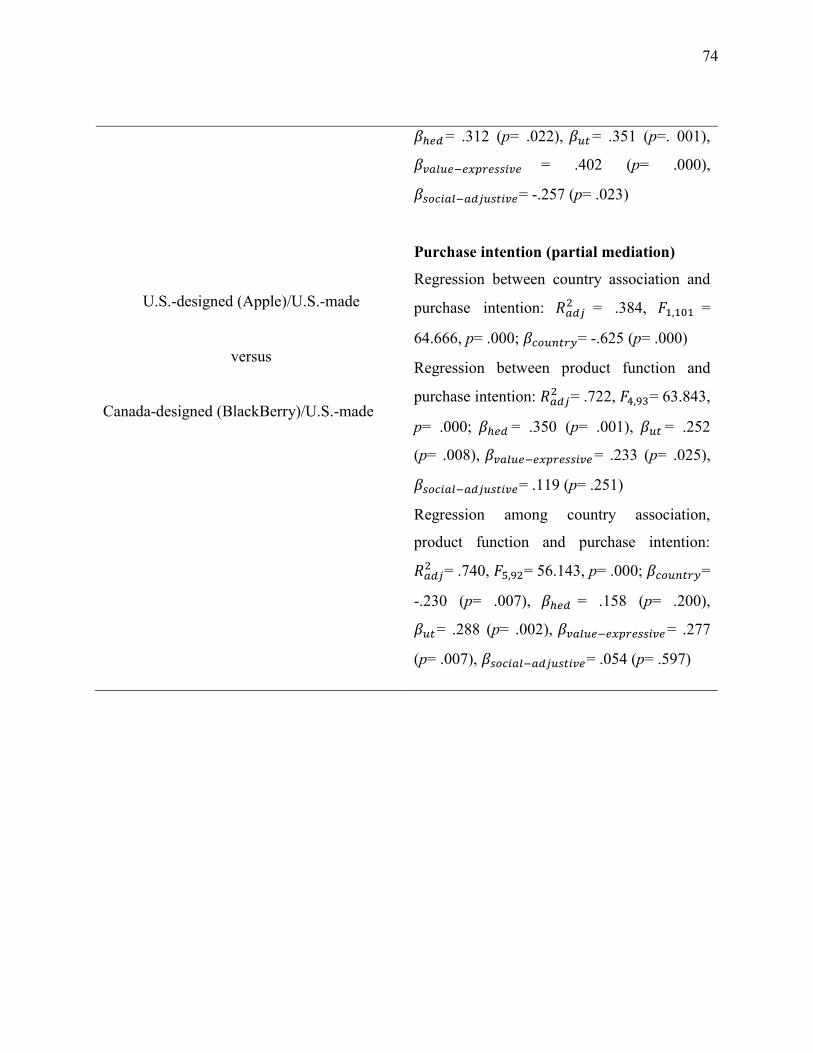
74
U.S.-designed (Apple)/U.S.-made
versus
Canada-designed (BlackBerry)/U.S.-made
𝛽ℎ𝑒𝑑 = .312 (p= .022), 𝛽𝑢𝑡 = .351 (p=. 001),
𝛽𝑣𝑎𝑙𝑢𝑒−𝑒𝑥𝑝𝑟𝑒𝑠𝑠𝑖𝑣𝑒 = .402 (p= .000),
𝛽𝑠𝑜𝑐𝑖𝑎𝑙−𝑎𝑑𝑗𝑢𝑠𝑡𝑖𝑣𝑒= -.257 (p= .023)
Purchase intention (partial mediation)
Regression between country association and
purchase intention: 𝑅𝑎𝑑𝑗2 = .384, 𝐹1,101 =
64.666, p= .000; 𝛽𝑐𝑜𝑢𝑛𝑡𝑟𝑦= -.625 (p= .000)
Regression between product function and
purchase intention: 𝑅𝑎𝑑𝑗2 = .722, 𝐹4,93= 63.843,
p= .000; 𝛽ℎ𝑒𝑑 = .350 (p= .001), 𝛽𝑢𝑡 = .252
(p= .008), 𝛽𝑣𝑎𝑙𝑢𝑒−𝑒𝑥𝑝𝑟𝑒𝑠𝑠𝑖𝑣𝑒 = .233 (p= .025),
𝛽𝑠𝑜𝑐𝑖𝑎𝑙−𝑎𝑑𝑗𝑢𝑠𝑡𝑖𝑣𝑒= .119 (p= .251)
Regression among country association,
product function and purchase intention:
𝑅𝑎𝑑𝑗2 = .740, 𝐹5,92= 56.143, p= .000; 𝛽𝑐𝑜𝑢𝑛𝑡𝑟𝑦=
-.230 (p= .007), 𝛽ℎ𝑒𝑑 = .158 (p= .200),
𝛽𝑢𝑡= .288 (p= .002), 𝛽𝑣𝑎𝑙𝑢𝑒−𝑒𝑥𝑝𝑟𝑒𝑠𝑠𝑖𝑣𝑒 = .277
(p= .007), 𝛽𝑠𝑜𝑐𝑖𝑎𝑙−𝑎𝑑𝑗𝑢𝑠𝑡𝑖𝑣𝑒= .054 (p= .597)
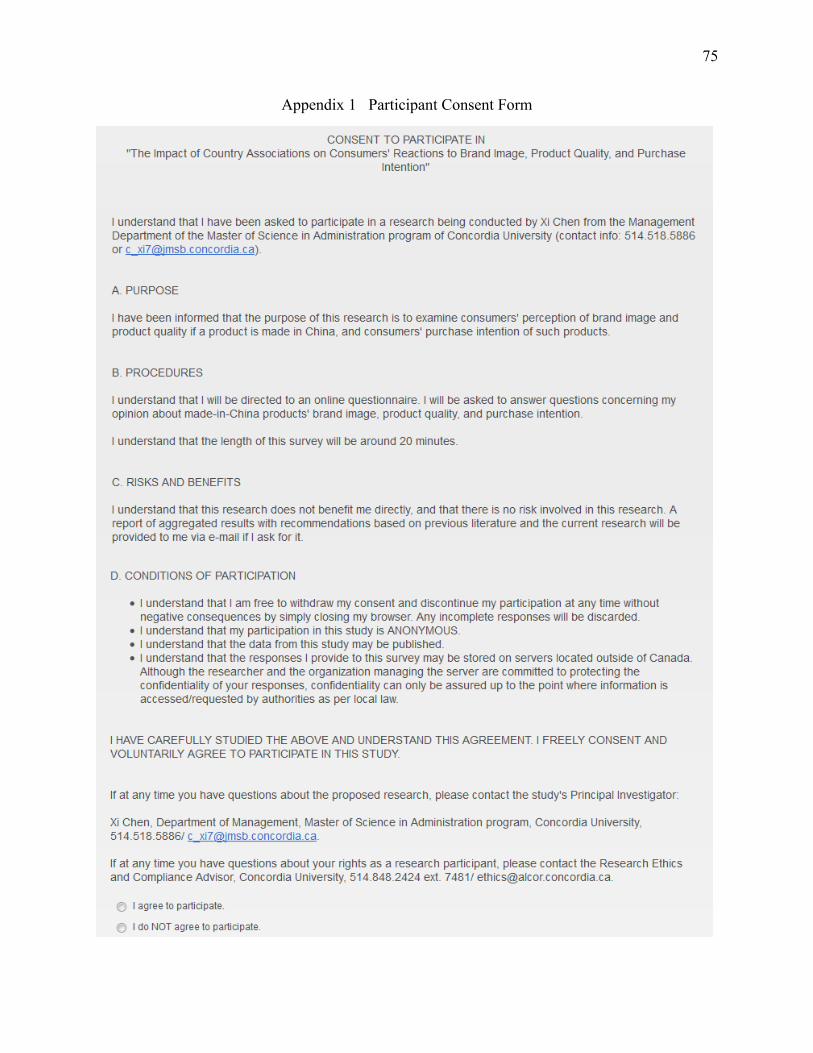
75
Appendix 1 Participant Consent Form
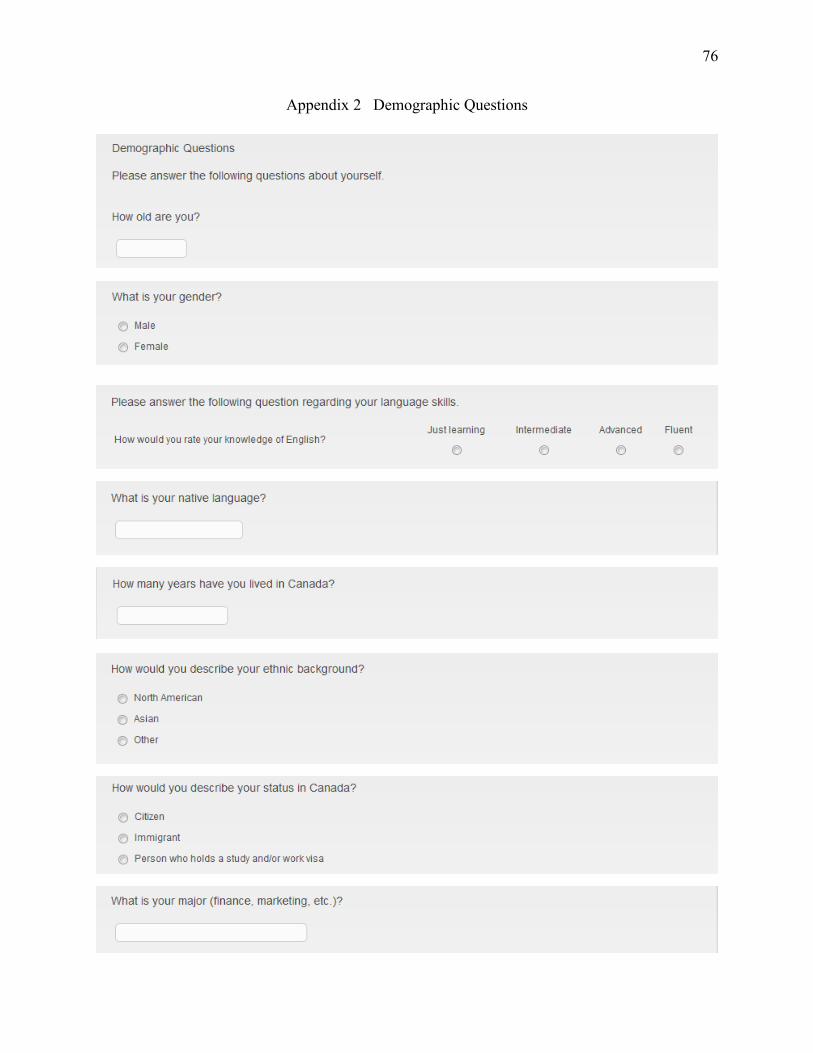
76
Appendix 2 Demographic Questions
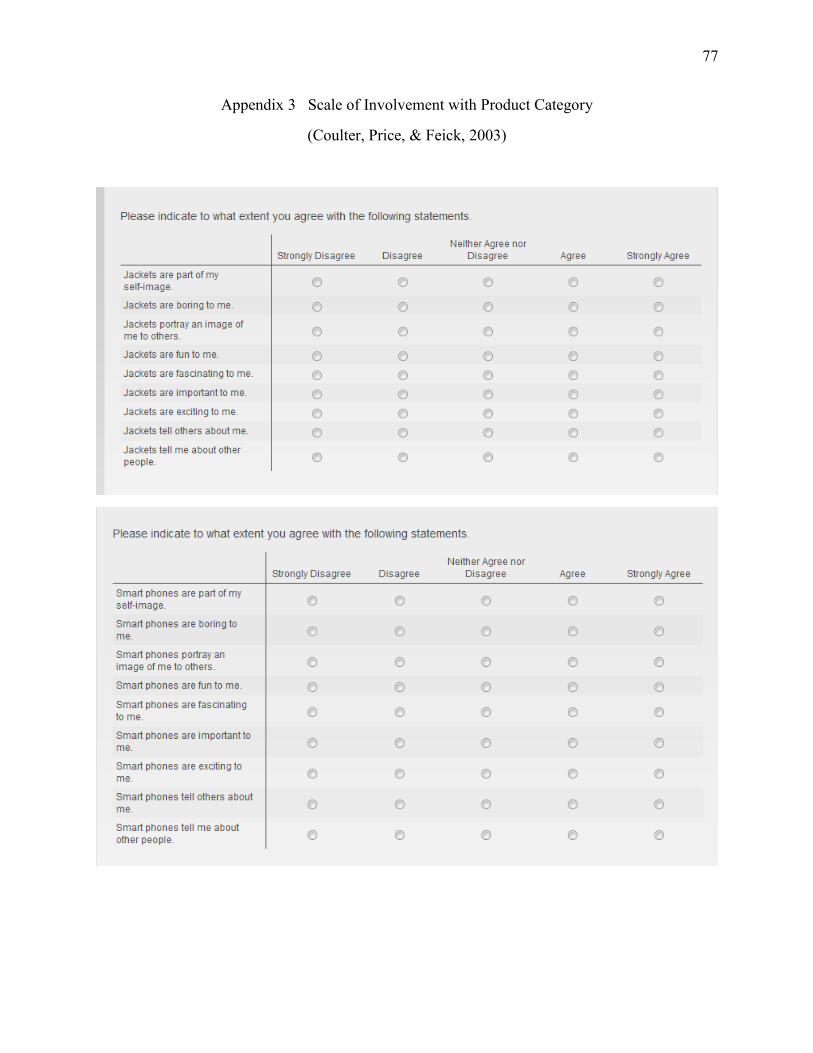
77
Appendix 3 Scale of Involvement with Product Category
(Coulter, Price, & Feick, 2003)
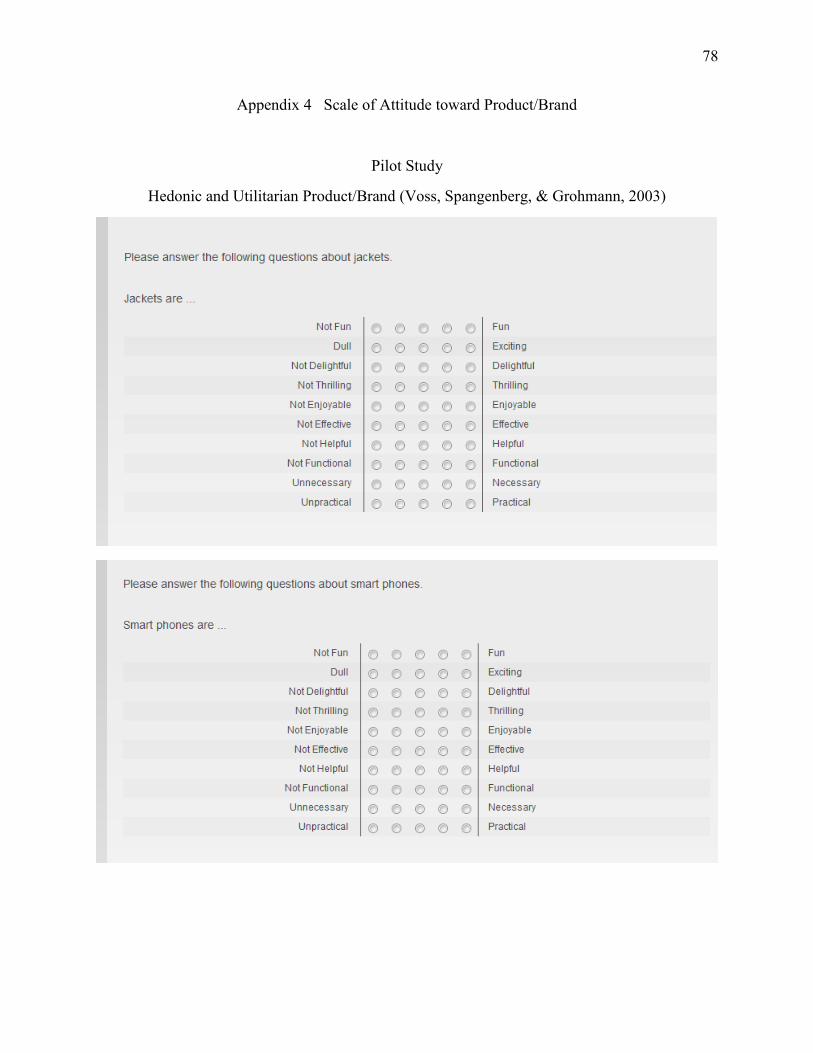
78
Appendix 4 Scale of Attitude toward Product/Brand
Pilot Study
Hedonic and Utilitarian Product/Brand (Voss, Spangenberg, & Grohmann, 2003)
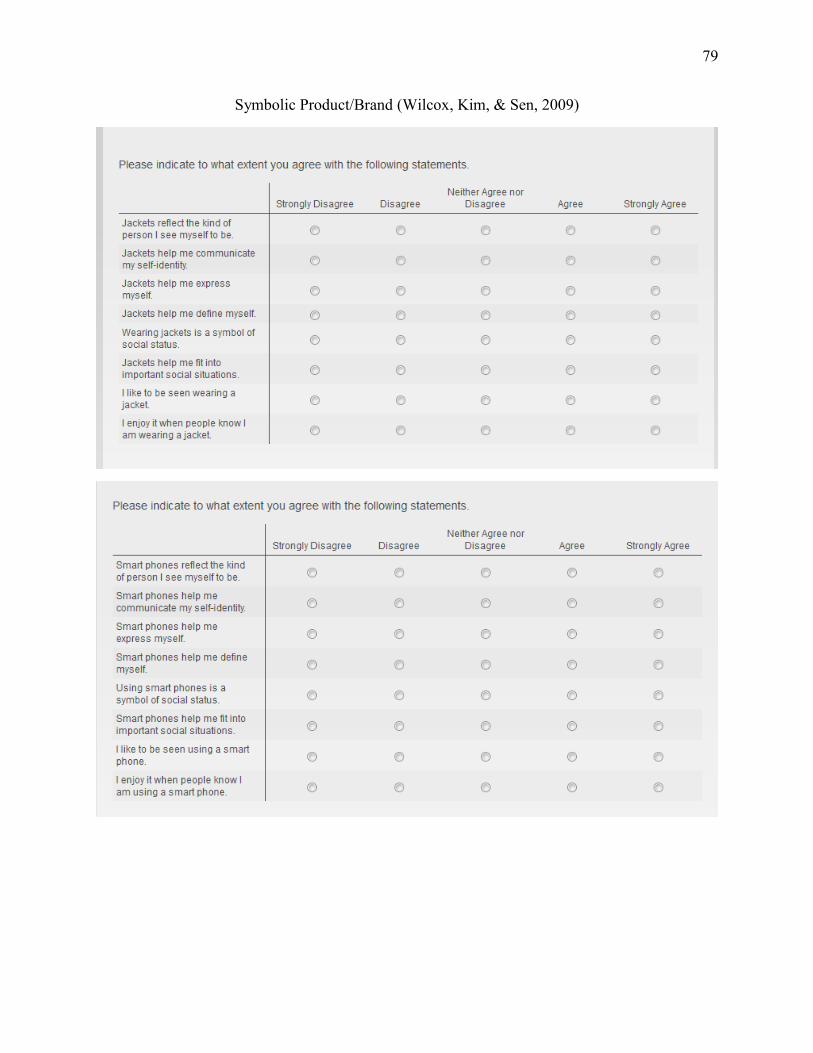
79
Symbolic Product/Brand (Wilcox, Kim, & Sen, 2009)
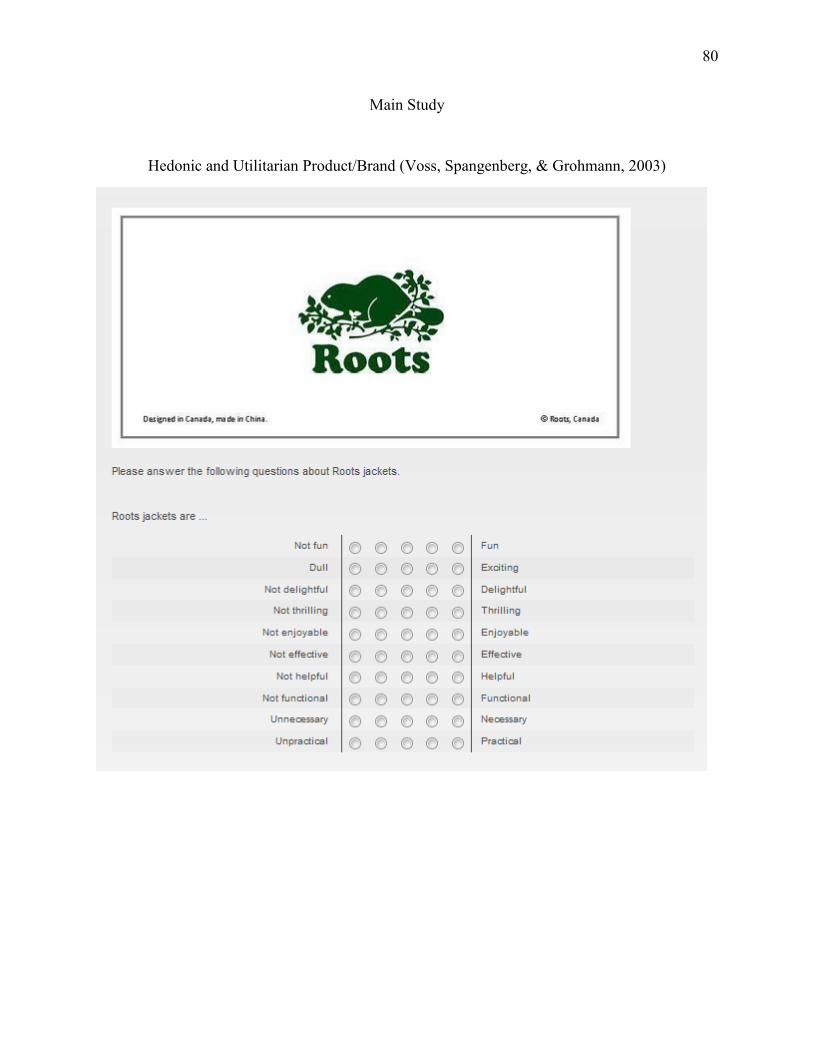
80
Main Study
Hedonic and Utilitarian Product/Brand (Voss, Spangenberg, & Grohmann, 2003)

81

82
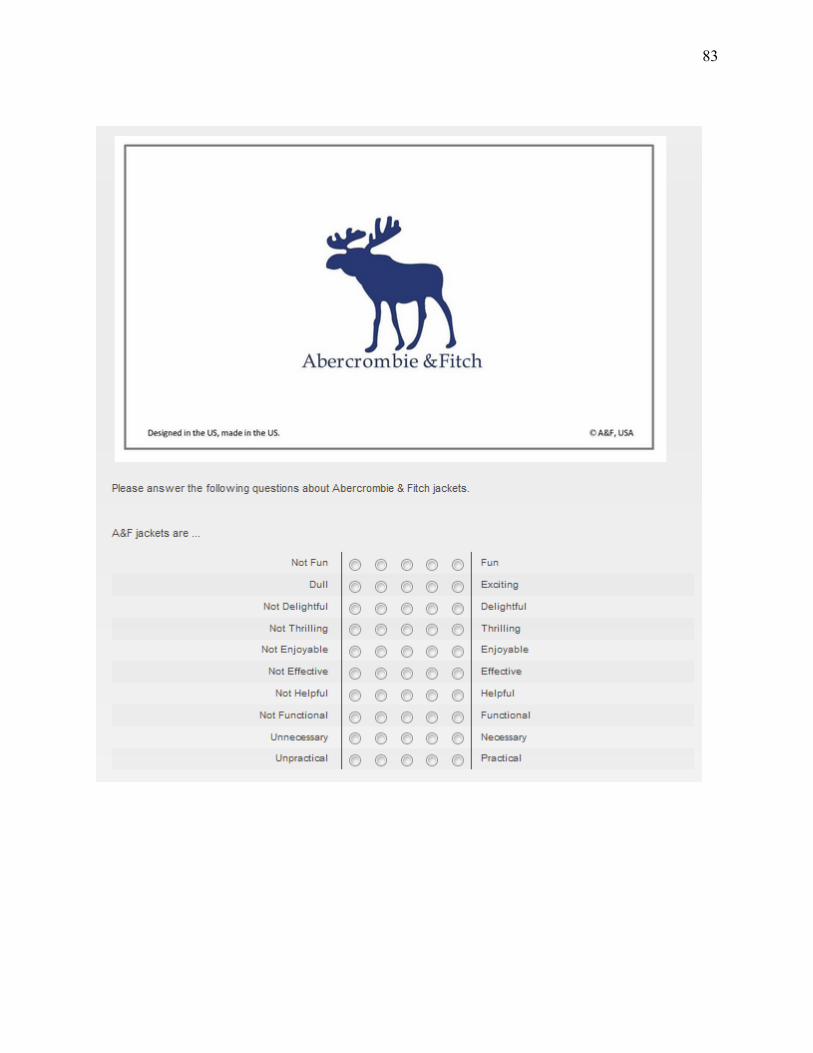
83
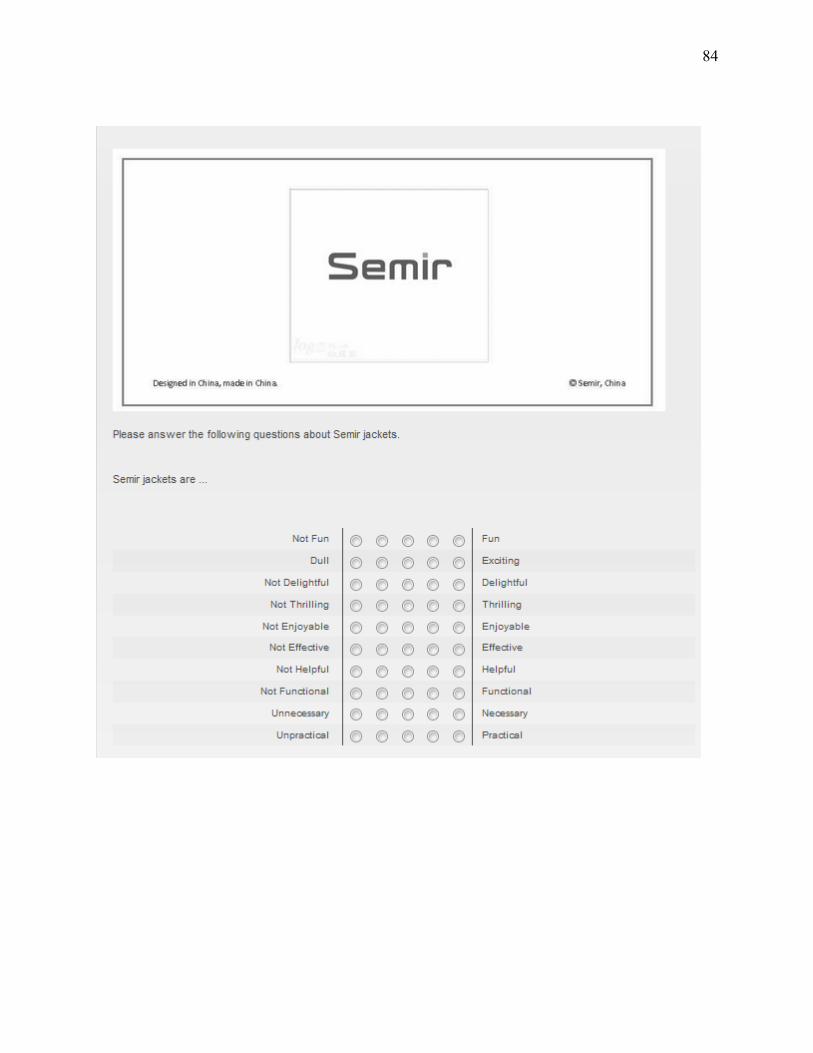
84
85

86
87
88
89
90
91
92
Symbolic Product/Brand (Wilcox, Kim, & Sen, 2009)

93
94
95
96
97

98
99
100
101

102
103
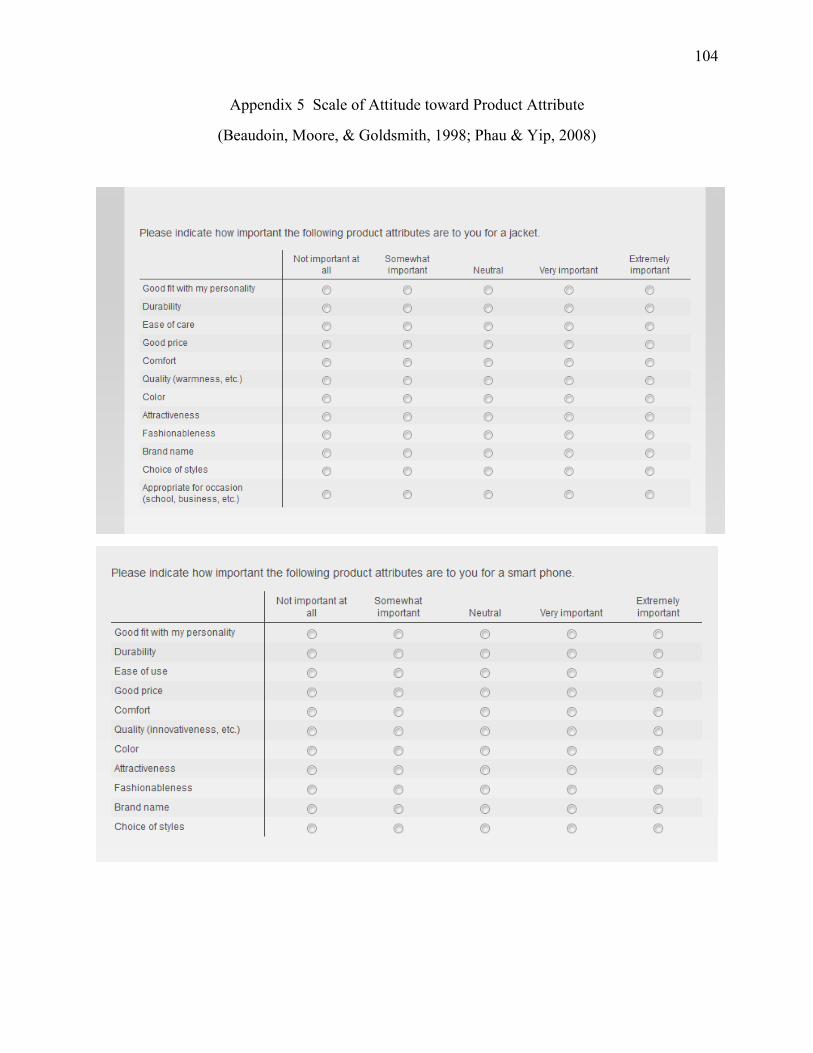
104
Appendix 5 Scale of Attitude toward Product Attribute
(Beaudoin, Moore, & Goldsmith, 1998; Phau & Yip, 2008)
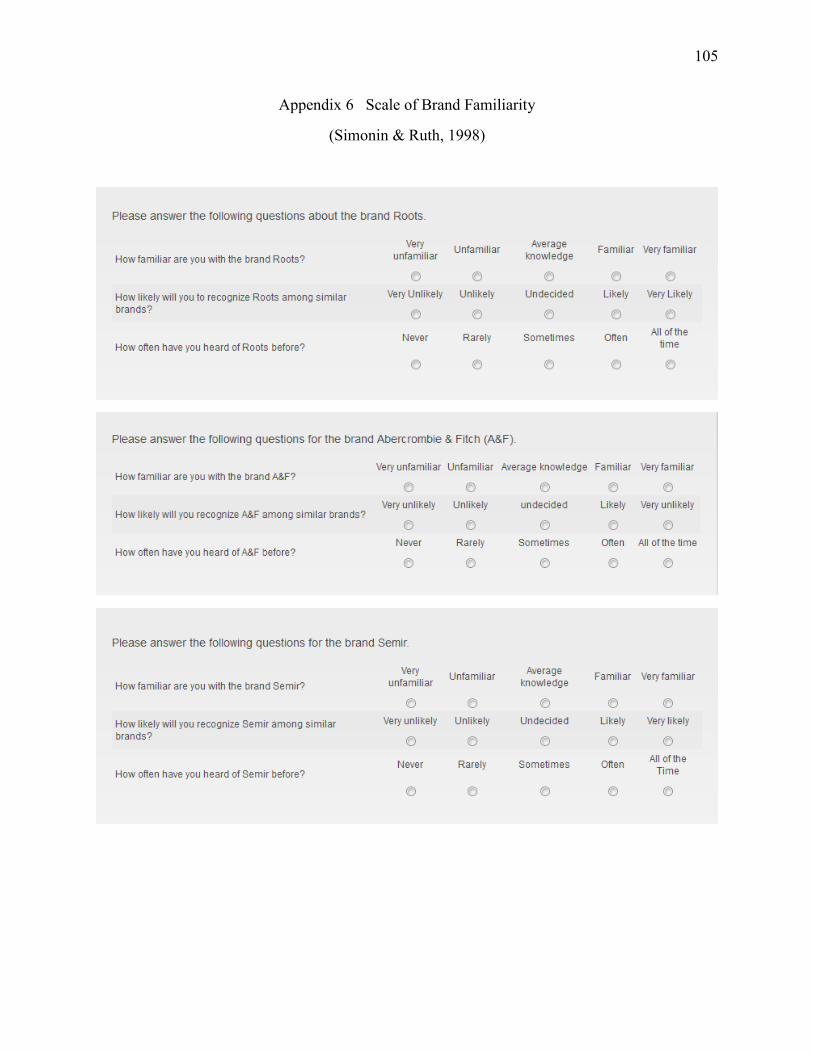
105
Appendix 6 Scale of Brand Familiarity
(Simonin & Ruth, 1998)
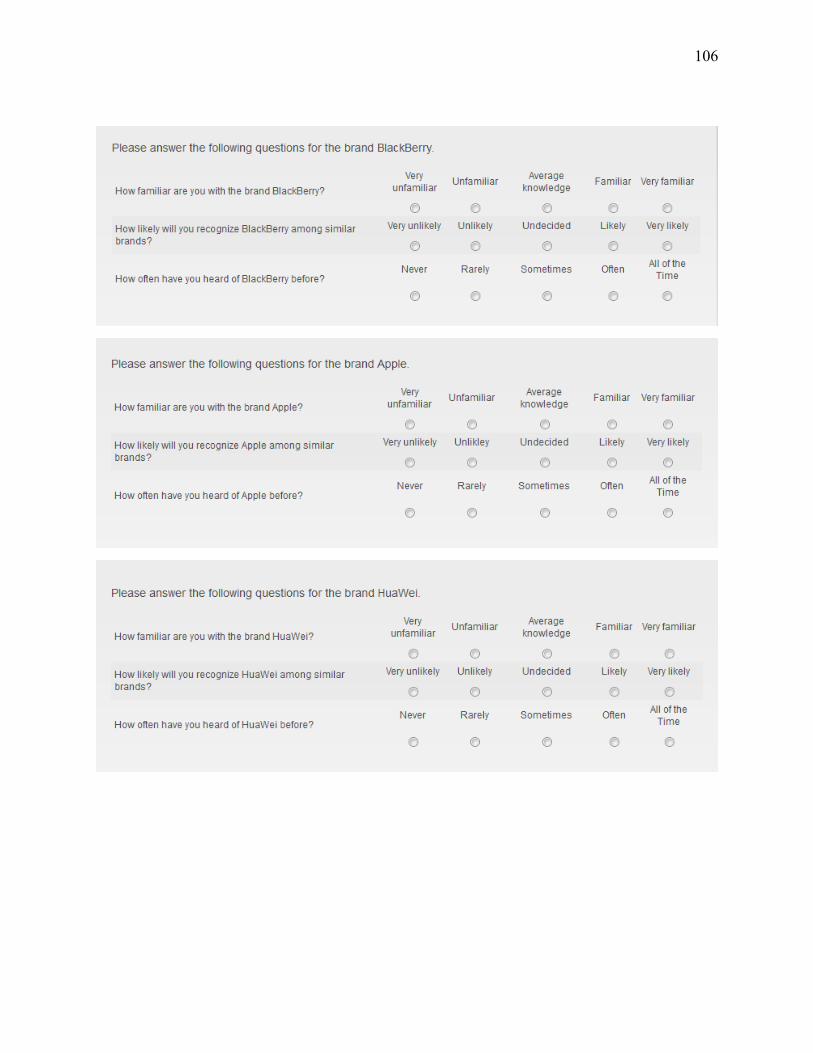
106
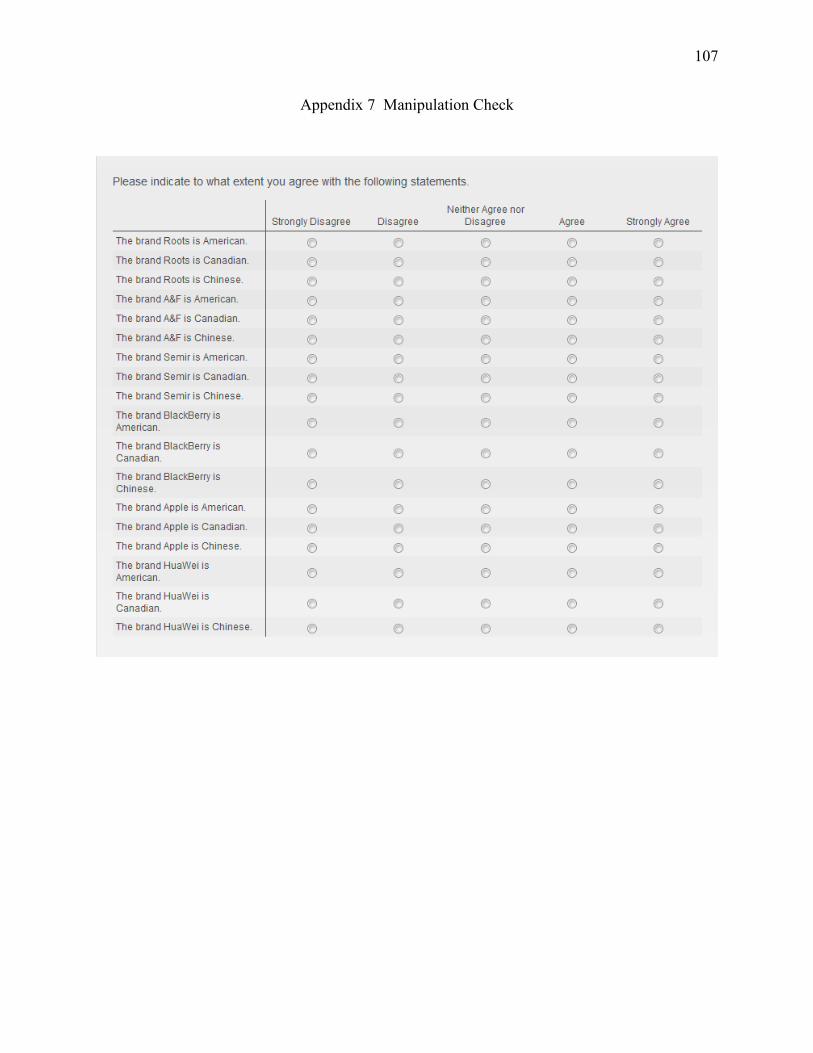
107
Appendix 7 Manipulation Check
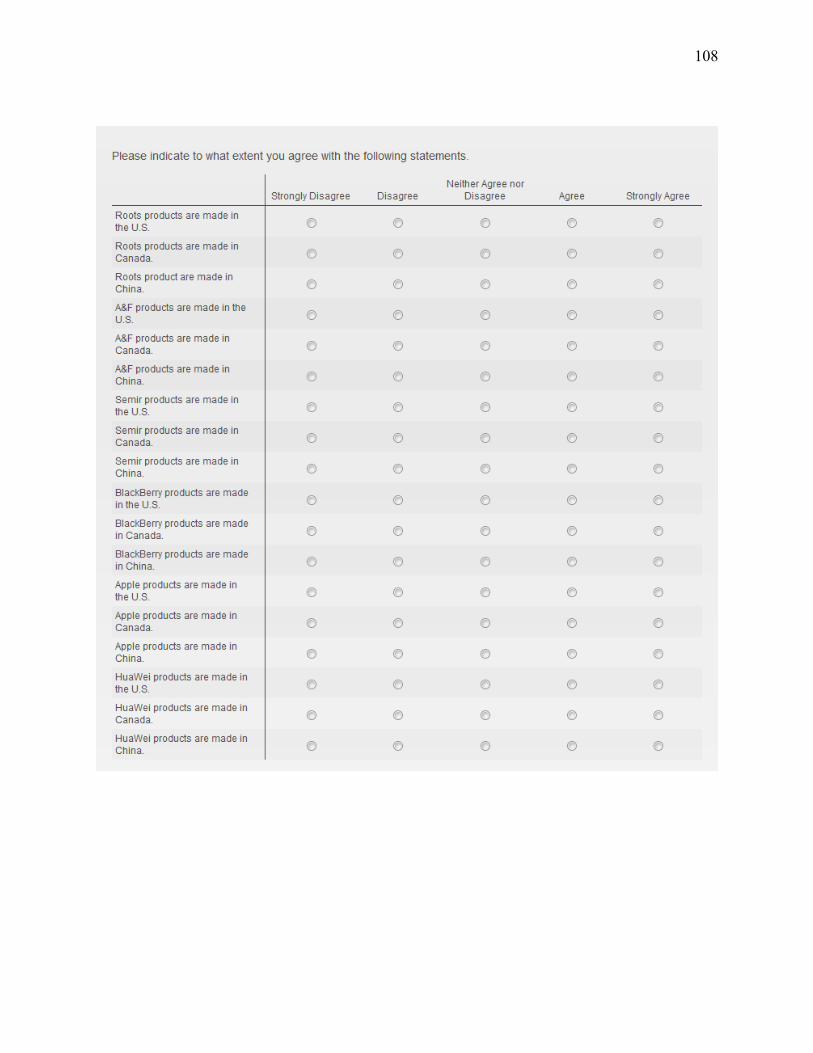
108
109
Appendix 8 Brand Logo
110
111
112
113
114
115
Appendix 9 Filter Questions
116
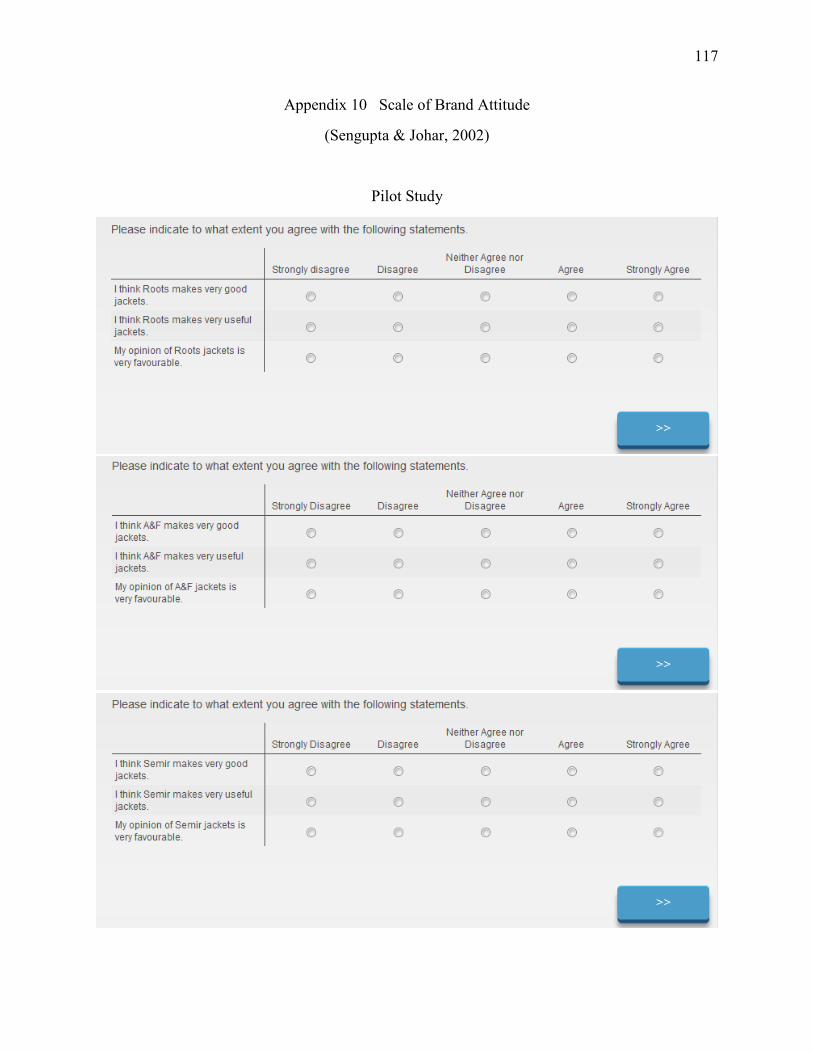
117
Appendix 10 Scale of Brand Attitude
(Sengupta & Johar, 2002)
Pilot Study
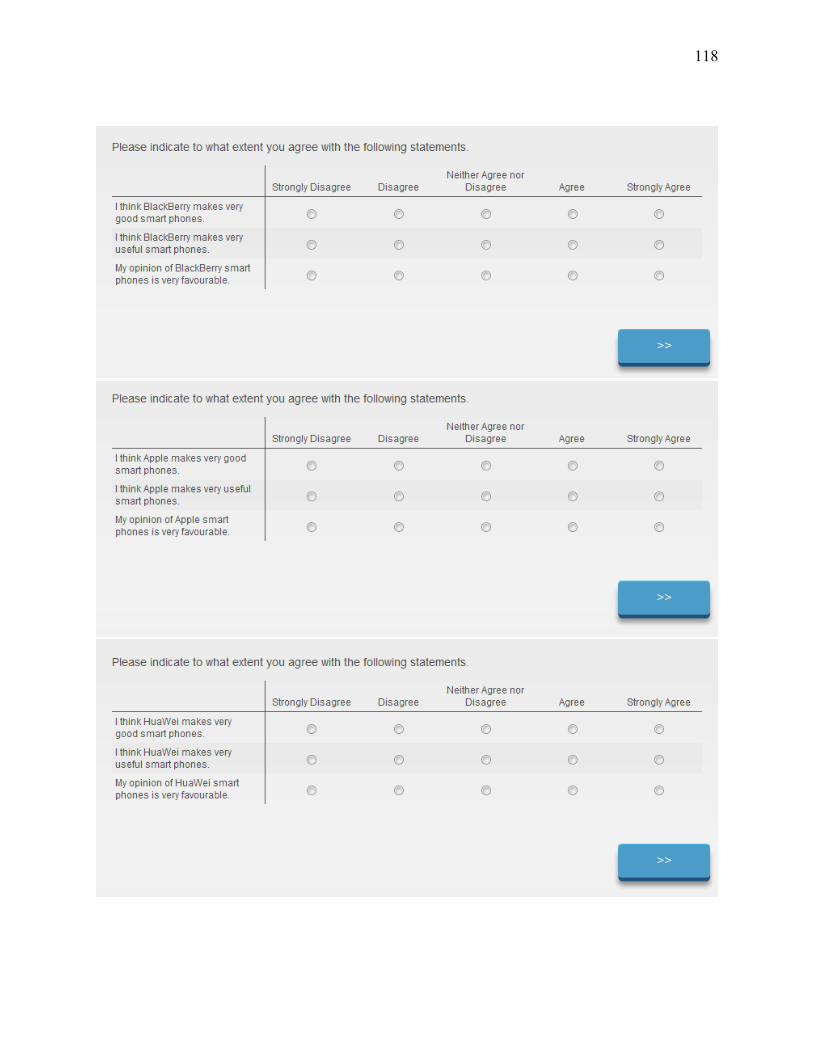
118
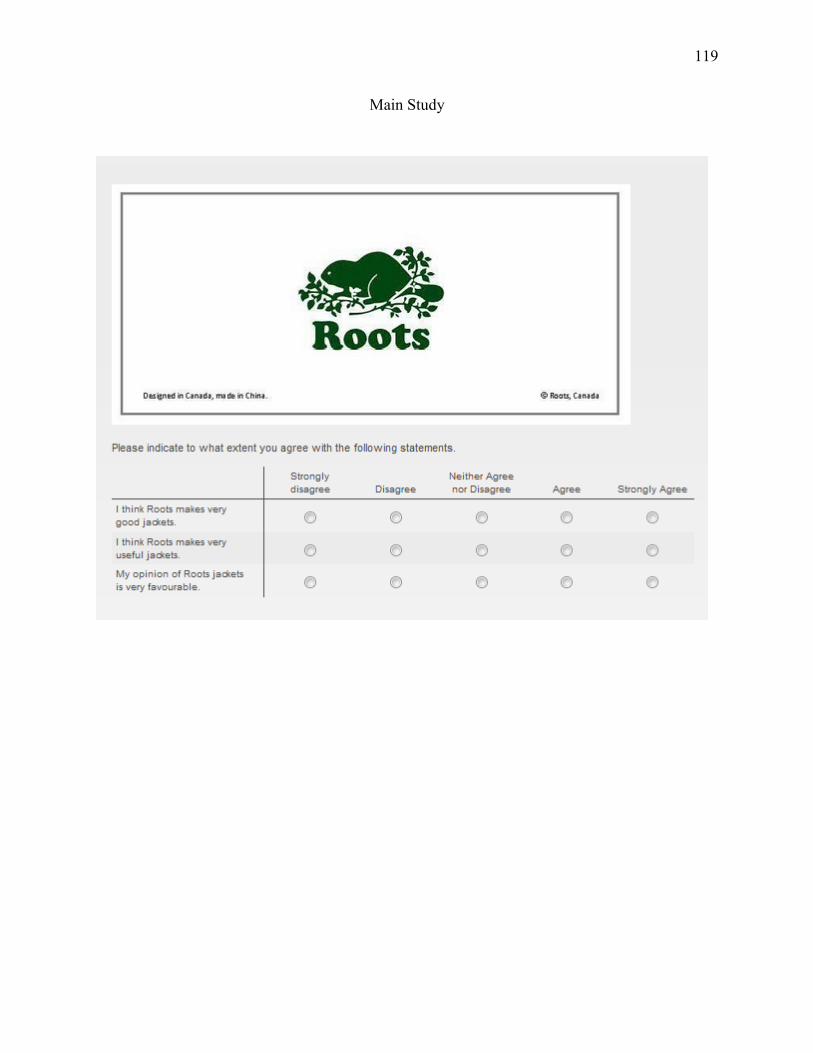
119
Main Study

120
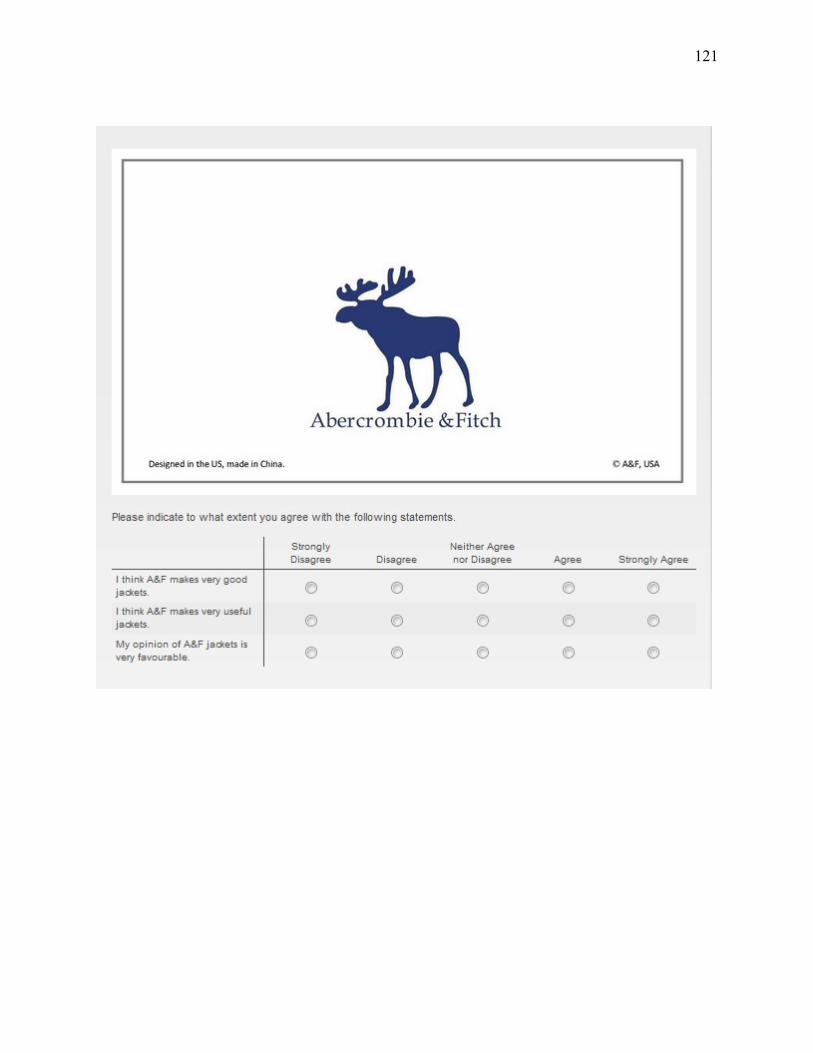
121
122
123
124
125
126
127
128
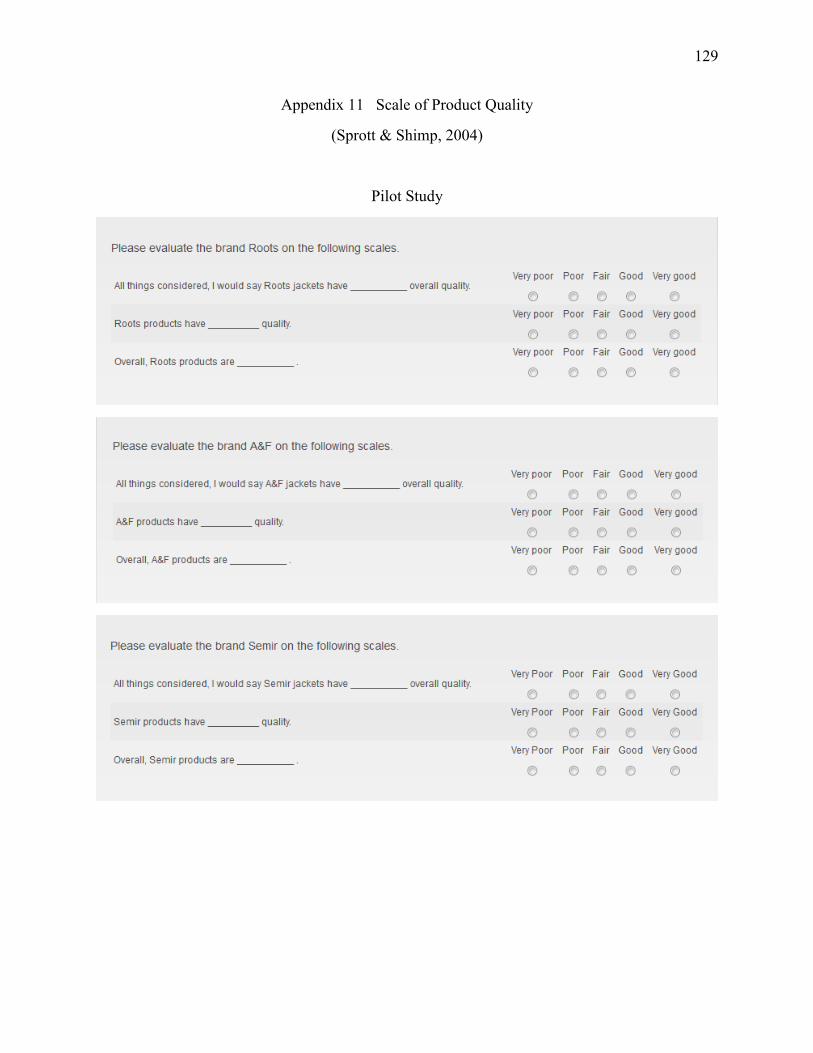
129
Appendix 11 Scale of Product Quality
(Sprott & Shimp, 2004)
Pilot Study
130

131
Main Study

132
133

134
135
136
137
138
139

140

141
Appendix 12 Scale of Purchase Intention
(Baker & Churchill, 1977)

142
143
144
145
146

147
148
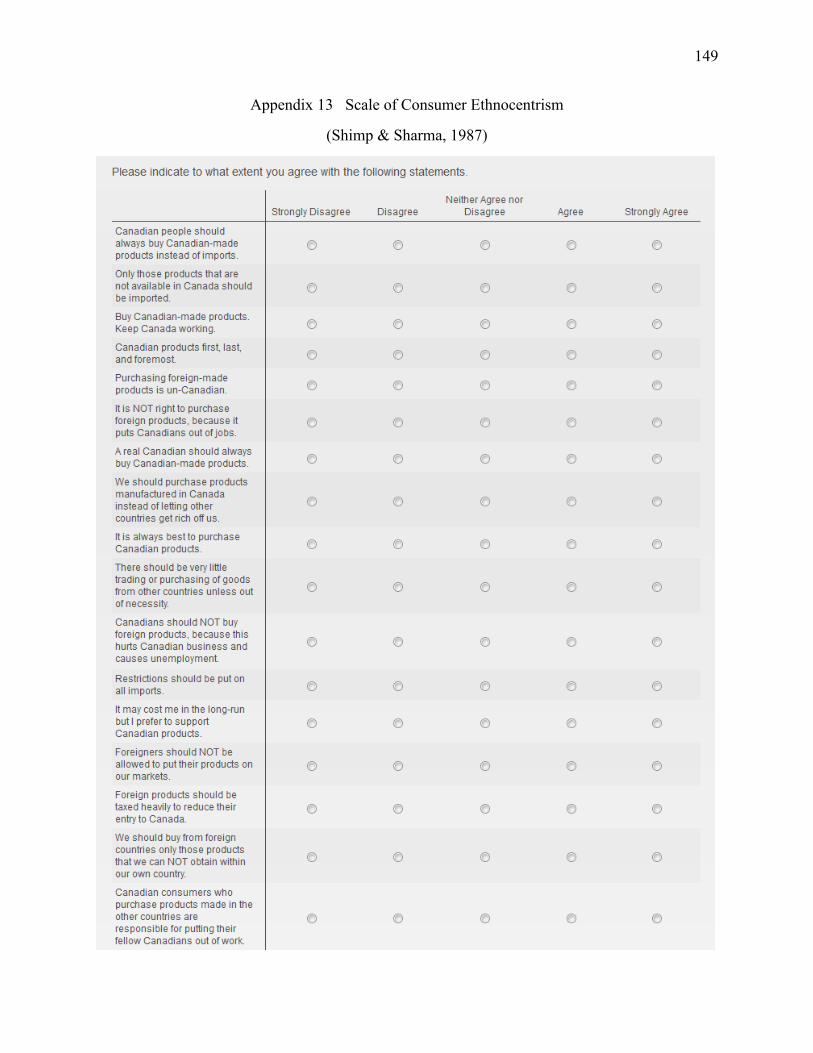
149
Appendix 13 Scale of Consumer Ethnocentrism
(Shimp & Sharma, 1987)
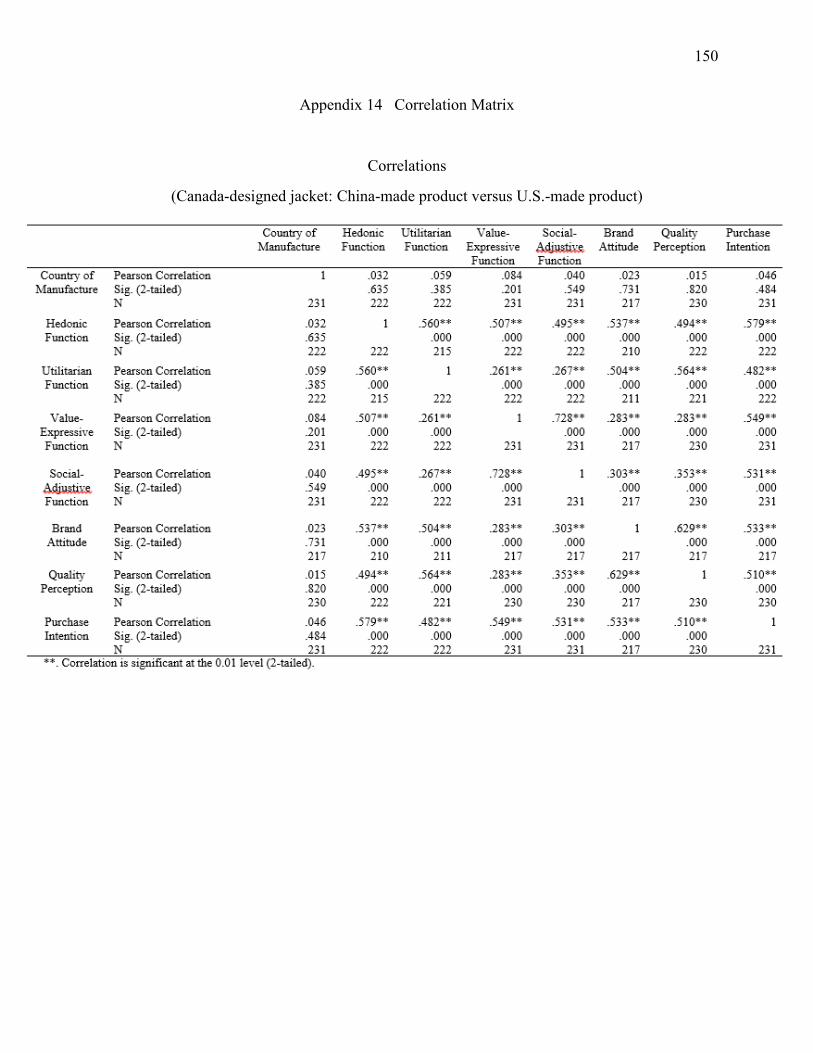
150
Appendix 14 Correlation Matrix
Correlations
(Canada-designed jacket: China-made product versus U.S.-made product)
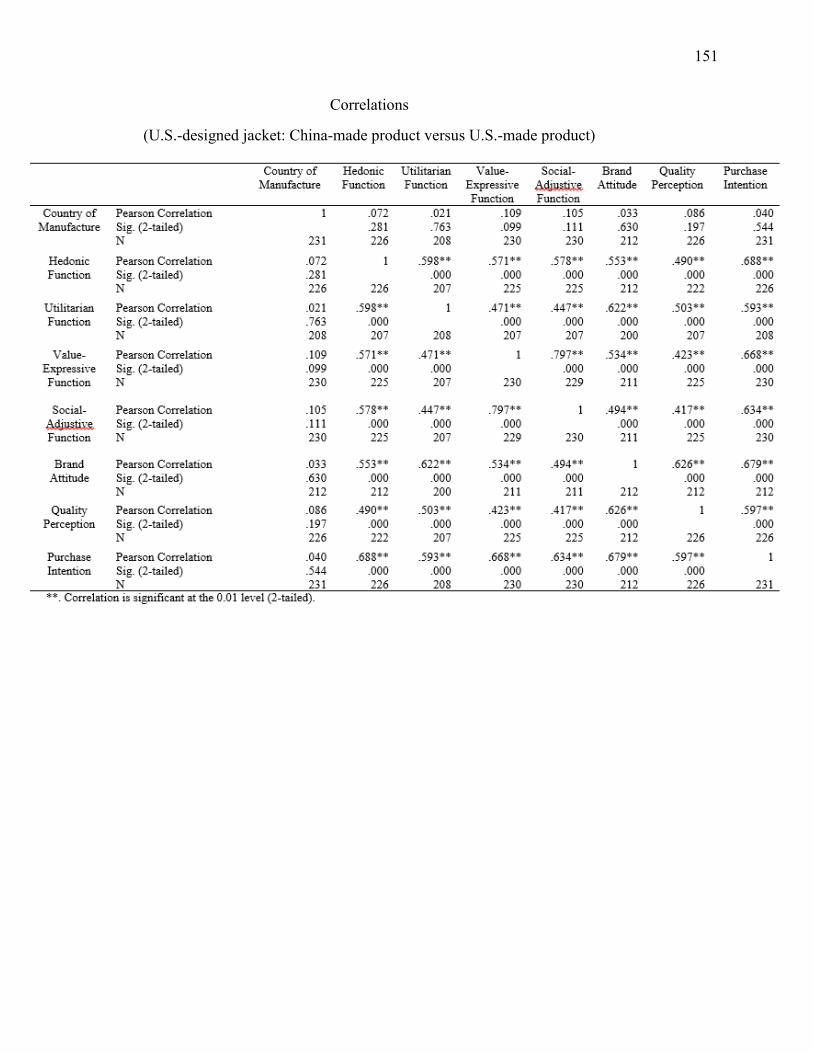
151
Correlations
(U.S.-designed jacket: China-made product versus U.S.-made product)
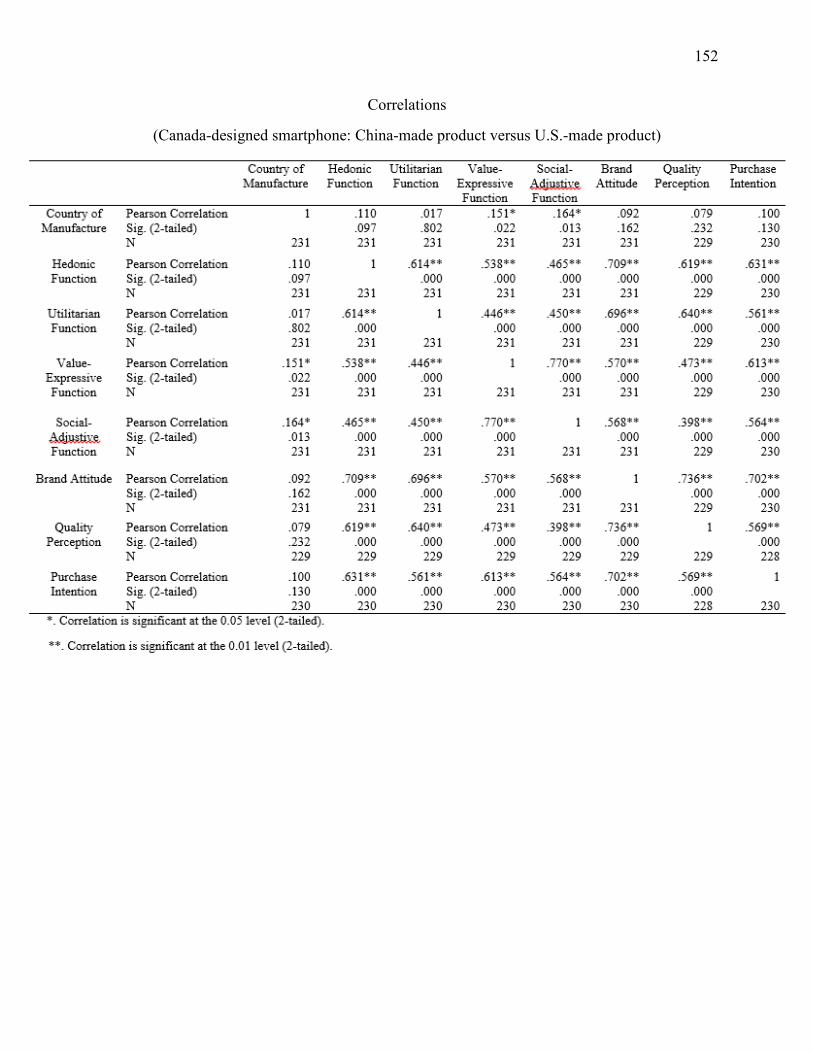
152
Correlations
(Canada-designed smartphone: China-made product versus U.S.-made product)
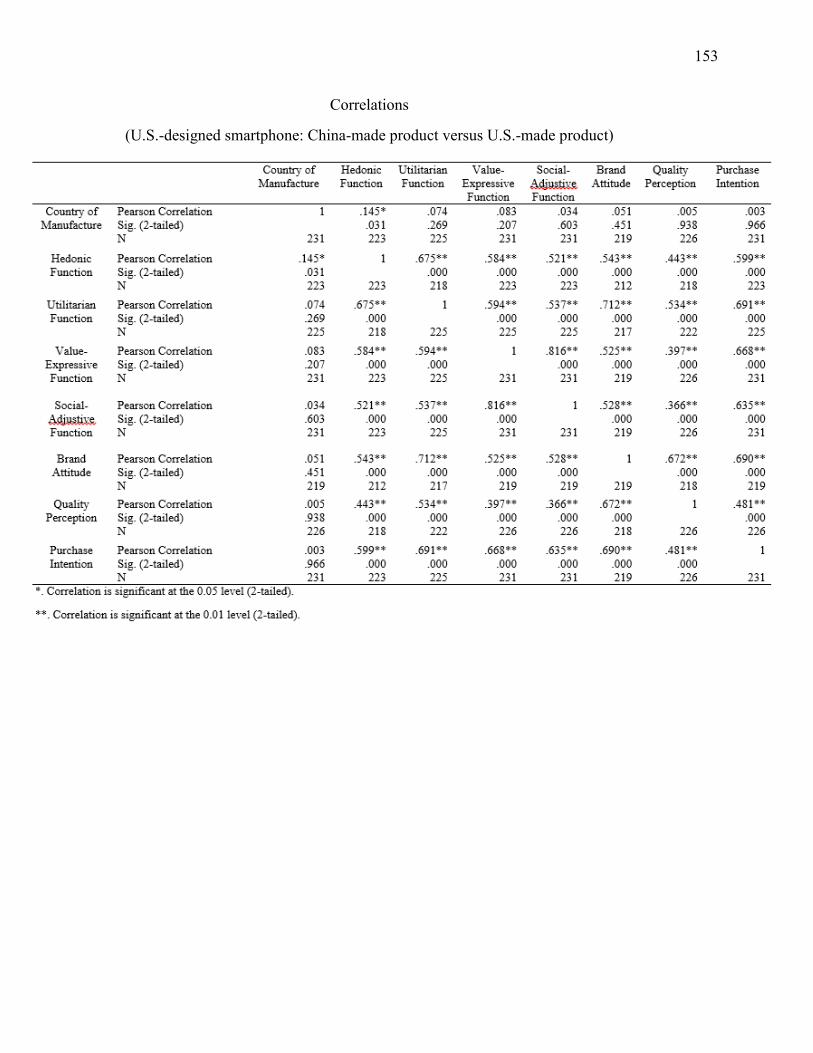
153
Correlations
(U.S.-designed smartphone: China-made product versus U.S.-made product)
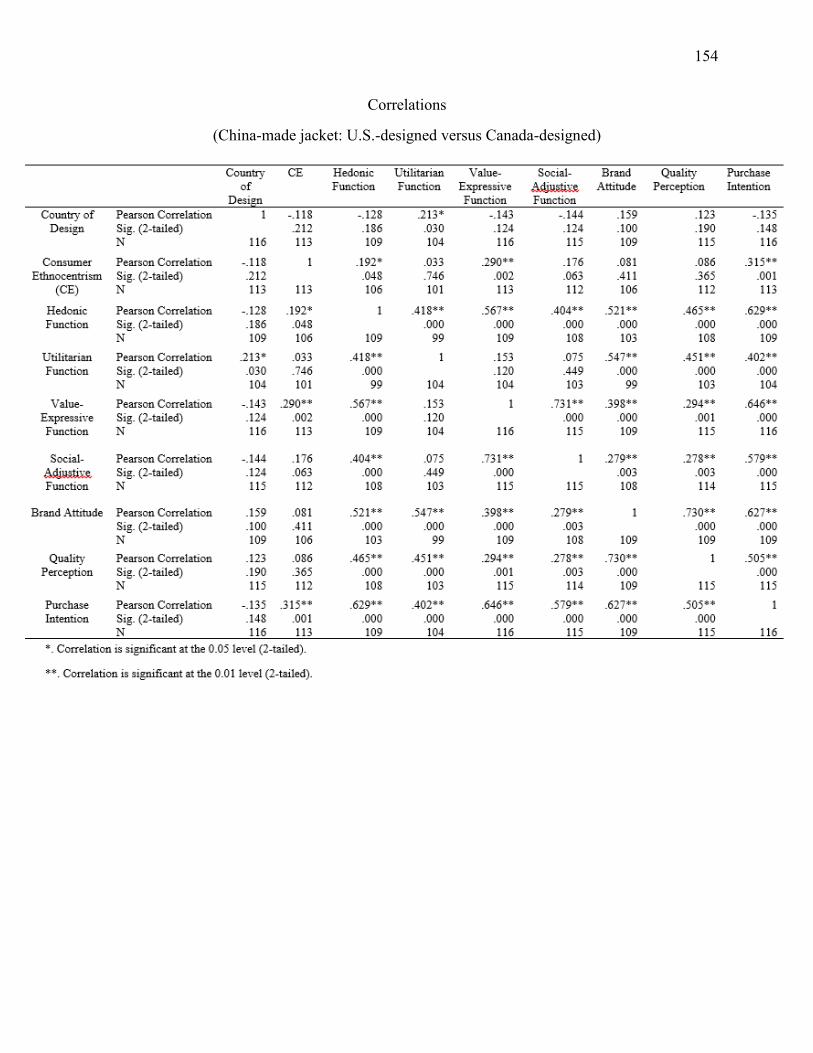
154
Correlations
(China-made jacket: U.S.-designed versus Canada-designed)
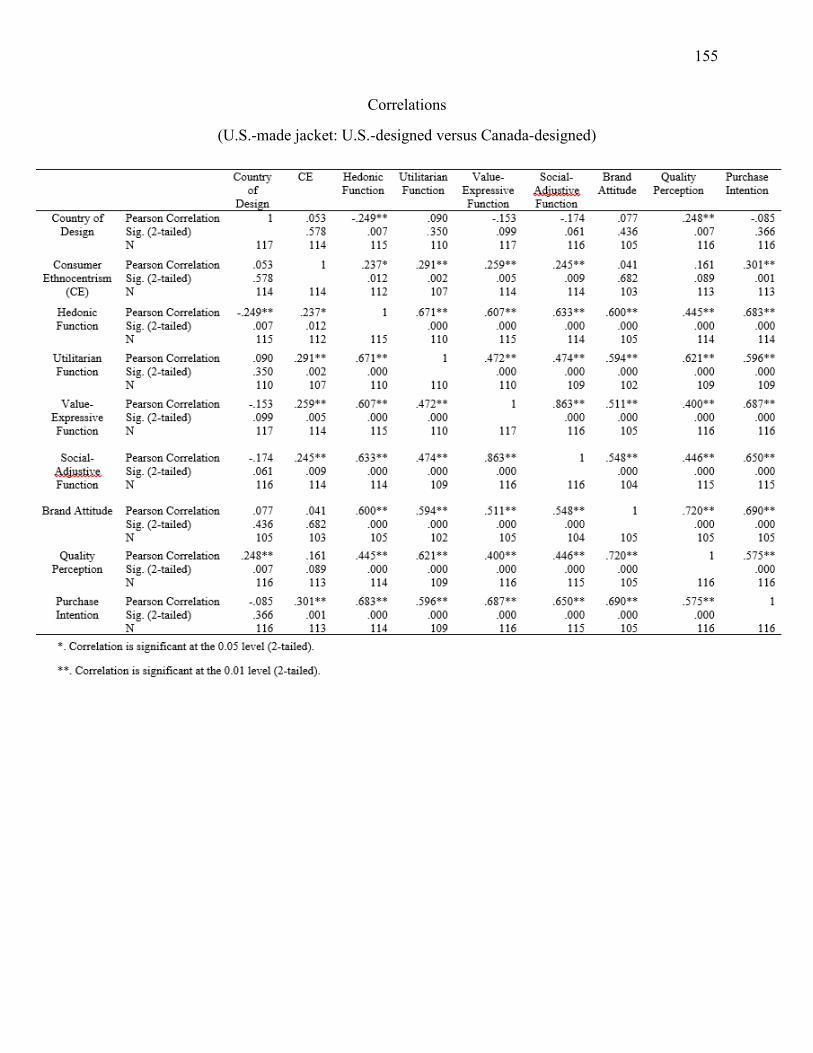
155
Correlations
(U.S.-made jacket: U.S.-designed versus Canada-designed)
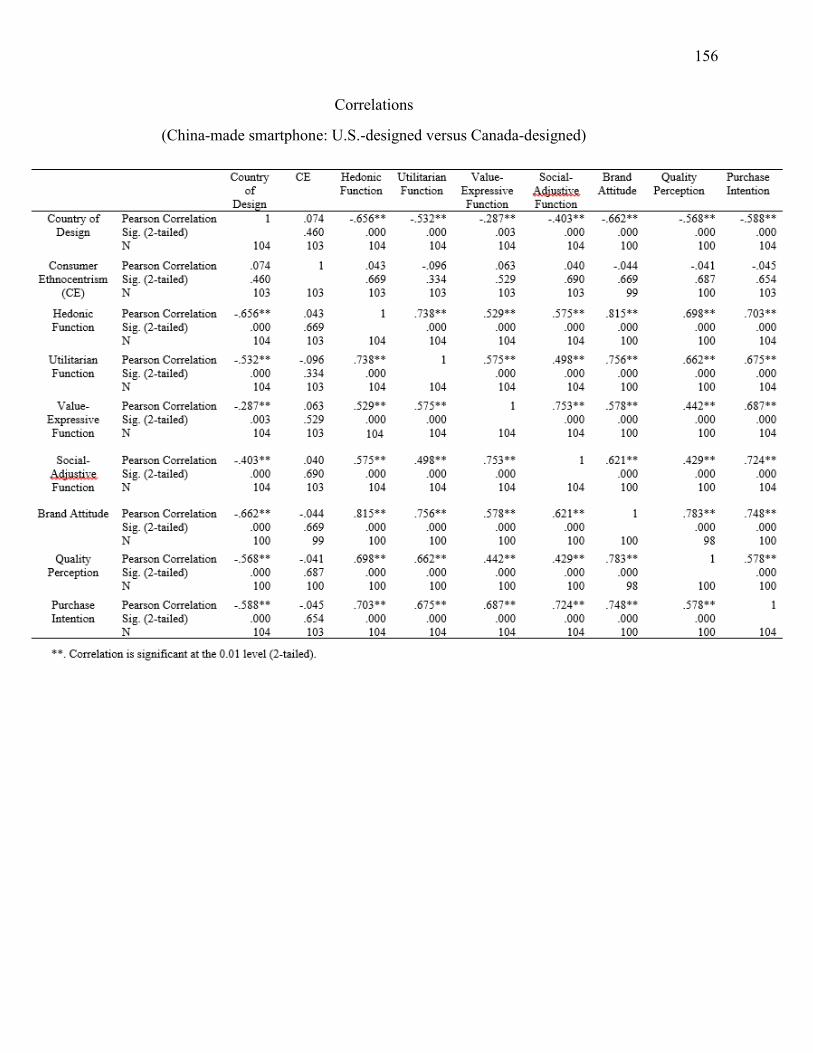
156
Correlations
(China-made smartphone: U.S.-designed versus Canada-designed)
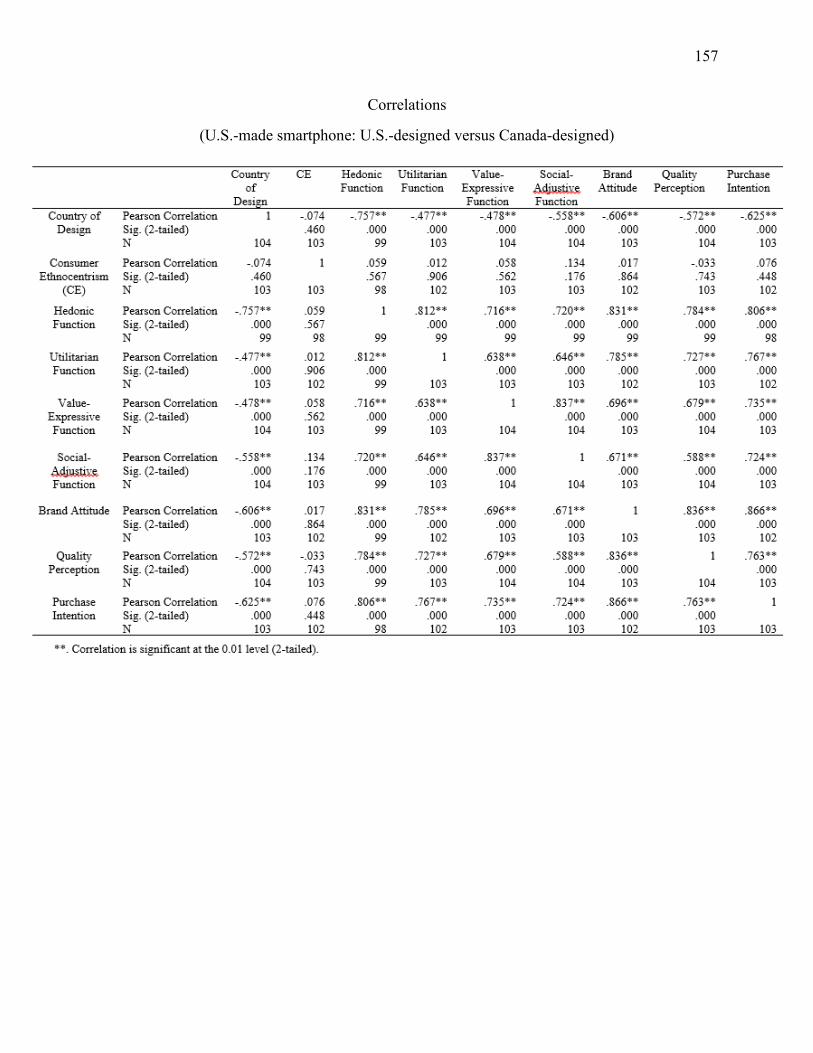
157
Correlations
(U.S.-made smartphone: U.S.-designed versus Canada-designed)