Embed Size (px)
Citation preview

RETURN T0 CIRCUlATING COPY Report No. WH-179a
REPORTS DE-S BE RETURNED TO REPORTS DESK
OWITHIN IN CENTRAL FILESONE WLEEK ______________
This report was prepared for use within the Bank and its affiliated organizations.They do not accept responsibility for its accuracy or completeness. The report maynot be published nor may it be quoted as representing their views.
INTERNATIONAL BANK FOR RECONSTRUCTION AND DEVELOPMENT
INTERNATIONAL DEVELOPMENT ASSOCIATION
CURRENT ECONOMIC POSITION
AND PROSPECTS
OF
NICARAGUA
May 3, 1968
Western Hemisphere Department
Pub
lic D
iscl
osur
e A
utho
rized
Pub
lic D
iscl
osur
e A
utho
rized
Pub
lic D
iscl
osur
e A
utho
rized
Pub
lic D
iscl
osur
e A
utho
rized

CURRENCY EqUIVALENTS
U.S. $1.00 = Cordobas 7.0 (C$)C$ 1 14 U.S. centsC$ 1 mill. = U.S. $142, 857

TAMJ5 OF CO1oT1r\JETS
Page No.
BASIC DATA i -
SULT'FARY AND CONCLUSIONS i - iii
I. HISTORICAL PERSPECTIVE 1
II. MAJOR DEVELOPMENTS, 1958 - 1967 3
A. Public Sector Finances and Fiscal Policy 4
Public Sector Revenues 4Public Sector Current Expenditures 5Public Sector Savings and Investment 6
B. Monetary and Credit Policies 8
C. Development and Trade Policies 10
Development Policies Affecting the Private Sector 10Public Sector Development Programs 11
III. PROSPECTS FOR 1968 - 1970 13
A. The Fiscal Situation Outlook 13
B. External Finance and Creditworthiness 15
TABIES
HAP
This report is based on the findings of a mission to Nicaragua inNovember-December 1967 composed of Mr. Marto Ballesteros (IBRD).

BASIC DATA
Aa anp tionArea 50,000 sq. milesPopulation (mid-1967) 1.7 millionPopulation density per sq. mile 30Annual rate of population increase (1963-67) 2.9 percent
GP_percaita (19R 7 US$357
Orign of GDP at market prices (C$4U320 million in 1967) (percent)Agriculture 30Manufacturing 14Commerce 21Other 35
Ratios to GDP (1967)Exports of goods and services 28.1Imports of goods and services 39.1Central government revenues 11.4Central government expenditures 12.7External public debt (end of year) 15.7Savings ...Investment ...Money and quasi-money (end of year) 18.5
Annual changes in selected economic Average 1967indicators 1963-65 1966 (Est.)
(percent)Real GDP 7.9 3.6 j4.2Real GDP per capita 4.8 0o6 1.3Domestic expenditure (at constant prices) 4.0 9.8 ..
Investment (15.9) (23.1) (O)Consumption (5.9) (7.0) G.)
Cost of living (Managua) 3.4 4.8 ...
Central government revenues 16.0 7.1 4.5Central government expenditures 12.1 20.5 5.5
Money and quasi-money 26.1 11.3 -1.0Money (16.1) (4.7) (-.40)Quasi-money (96.3) (33.2) (14.O)
Net domestic bank assets 18.4 30.3 24.0Credit to public sector (net) (-u.o) (3.2) (3.7)Credit to private sector (22.5) (30.4) (17.6)
Merchandise exports (f.o.b.) 18.1 -5.1 1.5Merchandise imports (c.i.f.) 17.8 13.5 7.2
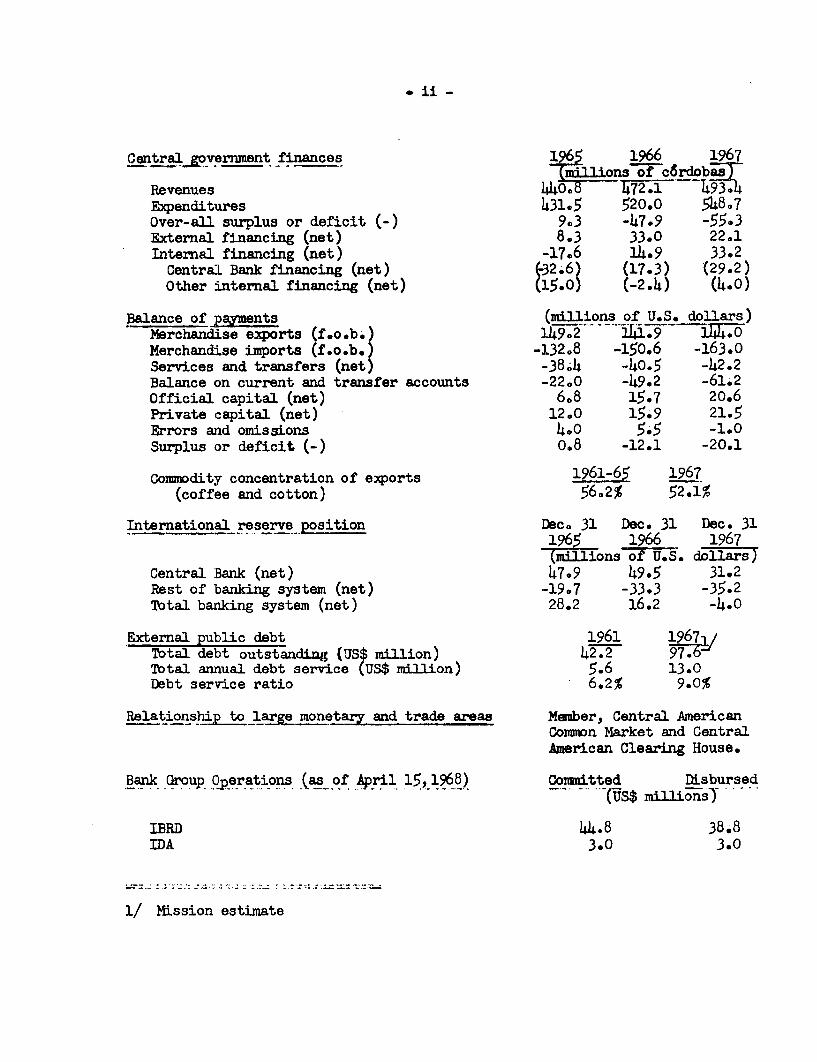
Central government finances 196 1966 1967N(m1.3i.ons of c6rdobas7
Revenues 440e8l&72.l 79.4Expenditures 431.5 520.0 548.7Over-all surplus or deficit (-) 9.3 -47.9 -55.3External financing (net) 8.3 33.0 22.1Internal financing (net) -17.6 14.9 33.2Central Bank financing (net) 32.6 (17.3) (29.2)Other internal financing (net) (15.0 (-2.4) (4.0)
Balance of payments (millions of U.S. doIlars)Merchandise exports (f.o.b. 149.2 11.9 144.0Merchandise imports (f.o.b. -132.8 -150.6 -163.0Services and transfers (net) -380.4 -40.5 -42.2Balance on current and transfer accounts *.22a0 -49.2 -61.2Official capital (net) 6.8 15.7 20.6Private capital (net) 12.0 15*9 21.5Errors and omissions 4.0 5.5 -1.0Surplus or deficit (-) o.8 -12.1 -20.1
Comwdity concentration of exports 1961-65 1967(coffee and cotton) 56.2% 52.1%
International reserve pssition Dec. 31 Dec. 31 Dec. 311965 1966 1967(miillions of U.S. dollars)
Central Bank (net) 47.9 49.5 31.2Rest of banking system (net) -19.7 -33.3 -35.2Total banking system (net) 28.2 16.2 -4.0
External public debt 1961 1967Total debt outstanding (US$ million) 42.2 97-WTbtal annual debt service (US$ million) 5.6 13.0Debt service ratio 6.2% 9.0%
Relationshjptp to.lae net2a and trade areas Member, Central AmericanComwn Market and CentralAmerican Clearing House.
Bank Group qperations (as of April 15,1968) Committed Disbursed(US$ millions)
IBRD 44.8 38.8IDA 3.0 3.0
1/ Mission estimate

SUMMARY ETD COMCITUJO0TS
1. The Nicaraguan economy has grown substantially during the lastdecade0 Between 1957 and 1967, per capita income rose by approximately23 percent. However, given the heavy dependence of the economy onexports of coffee and cotton, changes in production and world marketconditions for these products have resulted in periods of considerablyrising and falling rates of growth. The latest boom started in 1961and was almost entirely traceable to sharp increases in cotton productionand exports, facilitated by the expansion of road and port facilitieswhich constituted the major area of public investment during the mid andlate 1950ts. The latest doirswing started in 1966 as unfavorableweather and spread of disease greatly reduced cotton production andexports.
2. With a responsive private sector, the economic base has beenbroadened on each upturn, so that the Nicaraguan economy of the mid-1960tsis a considerably more diverse economy, with much more developed infra-structure and industry, than it was a decade ealier. Outside of agricul-ture, private investment had played a modest and stationary role ineconomic activity until the late fifties. It began to expand in 1959,and gained momentum after 1962, once government policy in this area wasclearly defined. It was the increase in private investment which accoun-ted for most of the impressive growth in total investment since the early19601s; 14.5 percent of GDP in 1962 and 21.3 percent in 1966. In 1958,legislation was passed guaranteeing the repatriation of capital and profitson foreign investments, and the Industrial Development Law was enacted,granting numerous tax exemptions and favored treatment to industrial acti-vities. Nicaragua's entry into the Central American Common Market in1961 undoubtedly provided additional encouragement to private investment.The ratio of private investment to GDP fluctuated from 9 to 10 percentfrom 1957 to 1961, and rose thereafter to 13,5 percent in 1965 and 16.2percent in 1966.
3. During the last decade the propensity to import of the INicaraguaneconomy has been high and rising. Periods of lagging exports have accor-dingly tended to be accompanied by fiscal and balance of payments deficits.Credit restriction measures bave been the normal response to these periodsof financial difficulty, but in 1948 and 1955 the exchange rate also hadto be adjusted to further dampen import growth and stimulate exports.
4. The 1966 slowdown brought about the appearance of new govern-ment deficits, and a new policy of credit restraint. Within this frame-work, credit policy was aimed at a selective expansion in medium andlong-term loans for agriculture and industry designed to increase anddiversify production and exports and reduce the traditional dependence oncoffoe and cotton. Overall credit expansion, however, was far largerthan anticipated by the Central Bank owing to noncompliance by privatecommercial banks and the state-owned National Bank with establishedceilings. Furthermore, the production diversification program wasinadequately carried out, and credits granted to that effect did not showand do not promise appreciable results. As a consequence, import growth

- ii -
continued high while exports stagncrted, creating a sharp deteriorationin the bal&nce of payments, loss of resei-es and sharp increase inshort-term external debt. These developments promptecd the Nicaraguanauthorities to request an IMF standby agreement for US$19 million inDecember 1967.
5. The standby request has been approved. As part of the agree-ment, the Nicaraguan authorities have expressed their intention to reduceconsiderably domestic credit and short-term foreign borrowing during 1968.As a consequence some public agencies, particularly the National Bank,will experience a marked decline in funds available to carry out theirdevelopment programs. The fiscal situation of the Central Government isexpected to remain tight, and under present policies current savings willnot be sufficiently large to allow budgetary transfers to those agenciesto substitute for limited access to bank credit.
6. The outlook for government savings in 1968 is that they willbe maintained at approximately the 1967 level. Looking beyond to 1969and 1970, the prospects uncler present policies are equally little promi-sing. Current expenditures cannot be expected to be held down indefine-tely to 1967 levels, as they are to be in 1968, and new transfer programs,such as price supports for grains may impose an additional burden on theGovernment. Growth of current revenues will continue to be hindered byexisting tax exemptions, and may be halted and even reversed if the Govern-ment in fact goes ahead with its plan to establish new tax incentives foragricultural production.
7. Public investmenlt decisions were taken during the last decadewithout the existence of an effective mechanism to coordinate projects,determine priorities and supervise execution. These deficiencies werenot serious when the bulk of Nicaragua's public investment was in largediscrete projects in transportation and power, and was complemented byexternal financial and technical assistance. More recently, however,as public investment reached away from infrastructure projects into morecomplex sectors such as agriculture and industry, the efficiency of expen-ditures has declined sharply and their financing has become increasinglyuncertain.
8. Efforts to mobilize additional resources simply to accomodateexisting programs would perpetuate existing inefficiencies in expenditures.However, improvement in the mechanism for project preparation, executionand coordination is beginning. There is certainly awareness of the pro-blem among the authoritiesO Major reorganizations in some agencies area]ready in motion. But given the very limited scope for growth of savingsunder the present revenue structure, the effort presently being made togenerate the additional revenues and savings required by an expanded invest-ment program needs to be considerably strengthened.
9, The outlook for the balance of payments in 1968-70 is not bright.Some improverment in exports may be expected from development of new productsand expansion of minor ones, but cotton exports, which were again affectedby bad weather in 1968, will be increasingly subject to pressures fromrising domestic costs and prices of inputs necessary to fight the spread

- iii -
of' disease. Cotton accounts for over one-third of total e:.ports.Growth in import demand may be cliecked in 1968 by the credit restrictionpolicies, but continued restraint may be difficult to enforce in view ofthe markedly high propensity to import consumer goods as well as capitalgoods and raw materials necessary for increasing domestic production.The financial program agreed upon with the International Monetary Fundbars the introduction of any restrictions on payments and transfers, aswell as the imposition of uny prohibitions or quantitative restrictionson imports. Increased drawings on official long-term loans are contem-plated for 1968-70, but it is doubtful that the increase envisaged willmaterialize fully unless measures are taken to increase domestic savingssufficiently to complement the expected increase in foreign borrowing.
10. The debt service ratio is approximately 9 percent of exportearnings in 1967. Even if the substantial increase in utilization ofexternal loans expected in 1968 and beyond materializes fully, the increa-sed drawings will be virtually entirely from official sources at long-termand the debt service ratio is not expected to rise above 10-11 percent inthe early 1970's.
11. Nicaragua is creditworthy at this time for additional lendingon conventional terms. But its ability to borrow will be severelylimited quite soon if needed measures to raise public savings and topromote growth of exports are not taken shortly. Its longer term pros-pects which are considerable given its vigorous private sector and resourcepotential, depend equall.y on these same measures; they are necessary ifmuch needed development expenditures as well as continued growth of privateinvestment are to be carried out and achieved without further weakeningNicaragua's external finances.
I. HIsm7nBICAL P7-s-,CTIvv
1. Nicaragua's economic fortunes during the last three decades havebeen closely dependent on developments in coffee and cotton production andworld markets. Soon after the end of W4orld War II, deterioration in coffeemarkets and production, and declines in output of cotton owing to risingincidence of disease, brought about a marked reduction in export earnings,budgetary deficits, and a foreign exchange crisis. With exchange rateadjustments, import restrictions and surcharges, and an upturn in coffeeand cotton prices after 1950, prosperity returned. By 1955 export earningsreached US$80 million, compared to US$24 million in 19490 But anotherdownswing in cotton and coffee prices started in 1956, whdch initiated acorresponding period of financial problems and economic decline with fallingper capita incomes, and the need for another exchange rate adjustment. Anew period of recovery and rapid growth began in 1961, following a vigorousexpansion in cotton cultivation and output. Export earnings more thandoubled between 1960 and 1965, and gross domestic product grew at an averagerate in excess of 8 percent; annually during the period. However, unfavor-able weather, weakening export markets, and spreading disease combined tobring about yet another downswing in production and exports of Nicaragua'stwo major crops in 1966, causing still another slowdown in economic activity,which Nicaragua is still experiencing.
2. This vulnerability of the Nicaraguan economy to developments inher two major crops has persisted in spite of deep structural changes whichtook place during the period. Heavy public investment outlays during the1950's and early 60's resulted in vast improvements in the country's infra-structure, particularly in highways, power and port facilities. The net-work of paved roads expanded from 150 kms in 1950 to 675 kms in 1960 and880 kms in 1965, and the total road network from 3,690 kms in 1955 to6,165 kms in 1960 and 6,480) kms in 1965. Power generating capacity rosefrom 28 NW in 1950 to 77 M14 in 1960 and 135 Orl in 1965. The port ofCorinto, on the Pacific coast, was expanded during the years 1957-62, re-sulting in a doubling of cargo handling capacity. These capital expendi-tures, which were partly financed with external loans from internationalagencies (IBRD, Eximbank), opened the road network and export facilitieswhich were undoubtedly a major factor behind the notable expansion incotton cultivation.
3. Outside of agriculture, private investment had played a modestand stationary role in economic activity until the late fifties. It beganto expand in 1959, and gained momentum after 1962, once government po'licyin this area was clearly defined, It was the increase in private invest-ment which accounted for most of the impressive growth in total investmentsince the early 1960's; 145 percent of GDP in 1962 and 21.3 percent in1966. In 1958, legislation was passed guaranteeing the repatriation ofcapital and profits on foreign investments, and the Industrial DevelopmentLaw was enacted, granting numerous tax exemptions and favored treatmentto industrial activities. Nicaragua's entry into the Central AmericanCommon Market in 1961 undoubtedly provided additional encouragement toprivate investment. The ratio of private investment to GDP fluctuated from9 to 10 percent from 1957 to 1961, and rose thereafter to 13.5 percent in1965 and 16.2 percent in 1966.

4. Public sector consumption movemorets have roughly parallelledthose in public investnment, althiough the intensity of relative changes isconsiderably smaller. In general, public consumption and investment ex-penditures increased in proportion to GDP during the early fifties, de-clined during the late fifties and early sixties, and began a new increaseafter 1962. In 1967 public investment declined considerably, but consump-tion expenditures continued to increase at a rate far in excess of that ofGDP, aggravating the fiscal imbalance that had already been felt in 1966.Restraint in the growth of current expenditures and improvement in thelevel and quality of public investment loom large as problems to be con-fronted by Nicaraguan authorities in the years ahead. Public investmentin 1966 represented 5.1 percent of GDP.
5. Total exports of goods and services have reflected the fortunesof cotton and coffee, and imports have followed, with a lag, Starting in1962, the level of both exports and imports increased notably, reflectingthe cotton boom and the impact of rapidly rising income and of industrial-ization and credit policies respectively. Export growth tapered off in1965 and ceased in 1966. Imports, however, continued rising into 1967,creating a new balance of payments problem.
6. The ratio of exports of goods and services to gross domesticproduct experienced marked swings in response to changed conditions incoffee and cotton markets, without any apparent underlying upward ordownward trend. The ratio, which stood at 36.6 percent in 1955, declinedto 22.9 percent in 1957 and rose to 33,0 percent in 1966. Imports of goodsancd services show swings which parallel with a lag those of exports. Overthe period, however, and particularly since 1962 the average propensityto import increased appreciably: the ratio of imports to GDP, which stoodat 26.6 percent in 1955, 27.7 percent in 1958, and 23.4 percent in 1961,rose sharply and steadily thereafter, reaching 38.3 percent in 1966. Thisincrease in the average propensity to import, at a pace beyond that whichcarL be supported by Nicaragua's current export performance, warrants earlyre-examination of the policies which have contributed to the extraordinarygrowth of imports in the past few years.
7. Population has been growing during the last decade at a rate ofapproximately 3 percent. Given the considerable still unexploited re-sources of the country, this rate of population growth has elicited noconcern on the part of the authorities.

II. MAJOR DEJET,OPK4','NrS ; 1958 - 1967
8. The preceding chapter described the cyclical export-inducedpattern followed by the Nicaraguan economy during the last three decades.Periods of rapidly rising exports have led to rapid increases in publicrevenues, savings and investment. The growth in revenues has been duenot only to increases in import tax collections derived from growing im-ports during the upswings, but also to far-reaching tax reforms intro-duced during expansionary periods. Downswings in exports have led todiminished growth of public revenues, and declines in savings and invest-ment.
9O Development policy since 1960 has been dominated by measures toencourage industrialization and substitution of imports from outside theCentral American Common Market. Available evidence suggests that onlymodest gains in employment and value added domestically have resulted fromthese policies, and that growth in tax collections has been hindered bythe increasing level of revenues foregone as a consequence of exemptionfrom customs duties under Central American treaties and the IndustrialDevelopment Law. Current expenditures, on the other hand, have increasedrapidly, particularly since 1965, thus further limiting possible growthof savings.
10. Monetary and credit developments have likewise reflected closelythe marked swings in exports. In years of growing exports, private commer-cial bank deposits have increased rapidly and so has banking system creditto the private sector. Relative price stability has been maintained,however, partly because of the anti-inflationary impact of public sectorsurpluses, and partly because the increase in private demand has largelybeen directed to imports of goods and services. In years of declining ex-ports, growth of private deposits has slackened, the public sector hasincurred deficits, and restrictive policies have been put into effect incredit extension to the private sector. In addition, specific measuresto discourage imports have occasionally been adopted.
ill, Since 1965 credit policy has been primarily oriented to encourag-ing. diversification of agricultural and industrial production and exports,while curtailing commercial credit expansion. The policy has not beensuccessful, even though the objectives were the right ones. First, thesubstantial expansion in agricultural and industrial credit has thus farhad a negligible impact on production and exports. Second, the commercialcredit restriction has not been successfully enforced. There was insteadexcessive overall credit expansion, resulting in a marked increase inimports and a serious balance of payments problem which the authoritiesare now seeking to overcome by more effective credit limitation. In viewof the modest prospects for export growth during the next two or threeyears, the credit restraint that will be needed to keep the externalfinances orderly may well depress for a time the level of overall domes-tic activity.

- 4 -
A. Public Sector Finances and Fiscal Policy 1/
Public sector revenues
12. Approximately two-thirds of public sector revenues consist oftax collections which accrue largely to the Central Government. However,non-tax revenues, consisting mostly of fees or rates charged by publicenterprises, have been assuming increasing importance in the last decade,reflecting the growth in demand for electric power, use of port facilities,etc., and the sound pricing practices followed by the agencies providingthose services, which have been able to operate without subsidies.
13. The tax structure of the Central Government has undergone con-siderable changes since 1950. The most significant improvements concernedincome taxation, which was introduced in 1952, whose enforcement was con-siderably strengthened in 1961-62 with the adoption of export retentionsas advance payment of income tax liabilities. Property taxation was alsoconsiderably improved in 1962, separating real and personal property,raising the rates and strengthening the adiministration of the tax. As aconsequence, the ratio of income and property tax collections to grossdomestic product doubled between 1961 and 1967, although it still standsat a modest 2.4 percent.
14. Internal indirect taxation has undergone fewer changes during thelast decade; in general they have consisted in increased rates on someexisting excises, such as those affecting cigarettes and alcoholic beverages,and assessment of excise duties on domestic production of a few previouslyimported goods, notably petroleum products and detergents, in an effort topartially compensate the Treasury for import tax revenues foregone. Theratio of internal indirect tax collections to gross domestic product in-creased from 2.5 percent in 1961 to 4.1 percent in 1967.
1/ The public sector of Nicaragua consists at present of the CentralGovernment, centralizecl public enterprises (Post Office, NationalRadio, National Lottery, and fiscal monopolies), decentralized enter-prises (Power Company (ENALUF), Corinto Port Authority, PacificRailroad, and Managua WATater Company), financial intermediaries(National Development Institute (INFONAC), National Bank, HousingBank, National Institute of External and Internal Trade (INCEI),Popular Credit Bank, and Social Security Institute), and a number oflocal and municipal governments. The present structure evolvedlargely during the 1950's, when some of the largest autonomousagencies were created (INFONAC in 1954, Corinto Port Authority in1956), others were reorganized (ENALUF), and the Central Governmentitself underwent a considerable expansion and reorganization, withthe creation of new basic departments such as the Bureau of Roadsand the Budget Bureau. Many of these initiatives were adoptedfollowing the recommendations of an IBRD mission which visitedNicaragua in 1951 and prepared guidelines for a development programfor the period 1952-1957. Until 1961 Central Bank functions wereperformed by the Issue Department of the National Bank of Nicaragua.With the creation in 1961 of an independent Central Bank, the processof institutional build-up of the public sector was largely completed,

- 5 -
150 Collections from import duties have failed in recent years togrow apace with the growth of imports; indeed, there was a decline inactual yield since 1964. Since import taxes constituted the largestsource of government revenue, their stagnation has limited the increasein the ratio of total tax collections to gross domestic product between1961 and 1967, in spite of the gains achieved through internal directand indirect taxes: the overall tax ratio rose from 9.4 percent in 1961to 10.6 percent in 1965 and has declined slightly since.
16. The unresponsivensss of import tax collections to import growthcan largely be traced to the growing proportion of imports exempted underCentral American treaties and industrial incentive legislation. Tradewith the rest of Central Ame-ica has growm rapidly since the establishmentof the Common Market in 1961; Nicaragua's imports from the other CommonMarket countries increased from US$209 million in 1961 (3.9 percent oftotal imports) to US$35r8 in 1967 (183 percent of total). Since theseimports are not subject to duty, their growth has implied increasing reven-ues foregone by the Treasury, the estimated loss in 1967 being C$172million, compared with actual import tax collections of C$158 million.The application of the Industrial Development Law, which grants exemptionfrom customs duties to capital goods and raw materials imported by thebenefitted firms, has likewise resulted in growing revenues foregone,estimated at C$59 million in 1967.
17. The record of the last twenty years shows two periods of rapidlygrowing tax revenues, the early 1950's and the early 1960's. Growth inrevenue resulted not only from accelerated increase in income and economicactivity, but from the introduction of deep structural and administrativereforms as well. Tax revenues fell off in the second half of the 1950'sas exports declined and the economy stagnated. The slowdown that startedagain in 1966 brought about a corresponding deceleration in growth of taxcollections, partly as a consequence of the diminished rate of increase ofinternal direct and indirect tax yields in the face of declining growthin income, and, particularly, as a consequence of the reduction in importduities collection due to exemptions granted to Central American productsand industrial inputs. Looking ahead to the next two or three years, thetax system as it now stands should be expected to generate levels ofrevenues increasing only in about the same proportion as aggregate income.
Public sector current expenditures
18. Public sector current expenditures expanded rapidly during theearly fifties, reflecting primarily the growth in public sector activity:employment is estimated to have grown from 26,000 persons in 1950 to43,000 in 1957, the largest relative increase occurring in the workingforce employed in public works projects which went from 5,000 to 13,000during those years. Growth of current expenditures slowed down duringthe late 1950's, and regained momentum once more after 1962, reflectingagain to a large extent changes in the level of employment and, particular-ly since 1963, increasing levels of wages and salaries.

- 6 -
19. Current expenditures appear, therefore, to have followed theswings in growth of public sector current revenues, although at somewhatlower year-to-year rates of change. Consequently, current account sur-pluses have tended to increase during periods of rapidly rising revenuesand to decline when the latter levelled off. Central Government figures,however, indicate that this behavior may not have held true after 1963,when substantially larger rates of growth are observable for current ex-penditures than for revenues, While Nicaragua does not have the pressingfiscal problems at this moment that most of its Common Market partnershave, this trend cannot continue in the face of modest revenue growthprospects without giving rise to serious problems quite soon. The author-ities recognize the extent to which such a deterioration would underminetheir present investment plans, and have expressed a firm intention tocontain current expenditure growth. Given the strong position of theGovernment, there is reason to expect considerable success in implementingthis decision.
Public sector savings and investment
20. During the entire period under review the public sector has beenable consistently to generate surpluses on current account although theirmagnitude has varied considerably with the rate of growth of current reven-ues. Because of the cyclical savings and lags so characteristic ofNicaragua in past years, these savings were adequate to finance investmentexpenditures in boom years, but not in others.
21. Public sector investment grew rapidly from 1950 to 1957, declinedsomewhat between 1958 and 1961, and increased again substantially after1962. As proportion of gross domestic product, public investment increasedfrom 1.4 percent in 1950 to 5.2 percent in 1957, declined to 2.9 percentin 1960 and rose again to 5.1 percent in 1966. A considerable deteriora-tion in the quality and effectiveness of public investment has, however,accompanied its growth during the mid-1960's.
22. The bulk of this investment has consistently been financeddomestically. In no instance have external funds financed as much as 40percent of public investment expenditures. During the boom period 1950-56,rapidly growing public savings kept well ahead of rapidly increasing in-vestment expenditures, resulting in an overall surplus in every year.This, in combination with net drawings on foreign loans, permitted a build-up of considerable cash balances by the public sector. During the slowperiod 1957-1961, public savings fell below investment expenditures, re-sulting in an overall deficit in every year. WTithout exception, the deficitexceeded net foreign loan utilization and recourse to internal credit wasnecessary. aDring the boom period 1962-1965, savings exceeded investmentexpenditures in some years and fell short in others, but drawings of ex-ternal loans were more than sufficient to compensate any emerging overalldeficit and there was again a substantial accumulation of cash balances.Road construction and power were the main components of public investment.Starting in 1962-1963, housing, water supply and education projects beganto receive increasing attention. Since 1965 substantial outlays have beenmade in agricultural investment projects in efforts to diversify the pro-ductive and export base of the economy.

- 7 -
23g. With this pattern of surpluses and deficit, public sector activitymay have had a considerable countercyclical stabilizing impact over thisperiod, one that was sustainable externally because of the appropriateoffsetting savings in import levels. Recent developments suggest thatthis self-adjusting pattern of response is no longer functioning as it did.
24.. One of the reasons the investment effort since the late 1950'shas been lagging has been shortcomings in project preparation and execu-tion. Recently, the Planning Office made a special study to ascertain theextent to which projects budgeted for 1965 and 1966 had been carried outand to identify causes for lags and delays. The investigation revealedsubstantial shortfalls in actual project execution in both years, particu-larly in the field of road construction,
25. The Planning Office attributes the lag in road building projectsto lack of machinery and materials, insufficiency of funds for the Bureauof Studies and Projects, and problems arising in connection with adjudica-tion of the work to private contractors. Traditionally, road constructionhad been carried out in Nicaragua directly by the Highway Department ofthes Ministry of Public lWorks, advised and assisted by the U.S. Bureau ofPublic Roads. In the early sixties, however, execution by private contrac-tors became more widespread, partly in response to the requirements by someinternational lending agencies as prerequisite for their loans. As therecord shows, the changeover has been far from smooth.
26, Shortfalls in project execution were not limited to CentralGovernment investments. The Planning Office evaluation report points outthat lags also existed in some of the autonomous public agencies, althoughon the whole their performance was more satisfactory than the CentralGovernment's.
27. The performance of Managua Water Company and ENALUF was quitesatisfactory in both years. INCEI, however, proved unable to make headwayin its grain storage program, for which the Export-Import Bank had granteda loan in 1963. No progreais was made in 1967 either; the failure is ex-plained by INCEI s management as due to disagreement with the recommenda-tions of the Consultant's report,
28. The significance of these findings is that, rather than lack ofadequate financing, problems of coordination and organization have beenthe serious limitation to the public sector's capacity to implement exist-ing investment projects during the past three or four years, There areindications that steps have been taken to overcome some of these problems,particularly in the field of road-building, where a number of private con-tracting firms have finally been formed which are expected to carry on thebulk of construction activity in the future. Much remains to be done,however, to strengthen the project preparation capacity in this and othersectors, and to coordinate activities of different Ministries of CentralGovernment and autonomous agencies, principally the financial intermediaries(National Bank and INFONAC) on which much of Production Development Programeffort rest, as the following sections indicate. But as improvements aremade, and development expenditure capacity increased, the internal develop-ment financing problems in prospect will, without new fiscal measures, be-come correspondingly more acute.
- 8 -
B. Monetary and Credit Pclicies
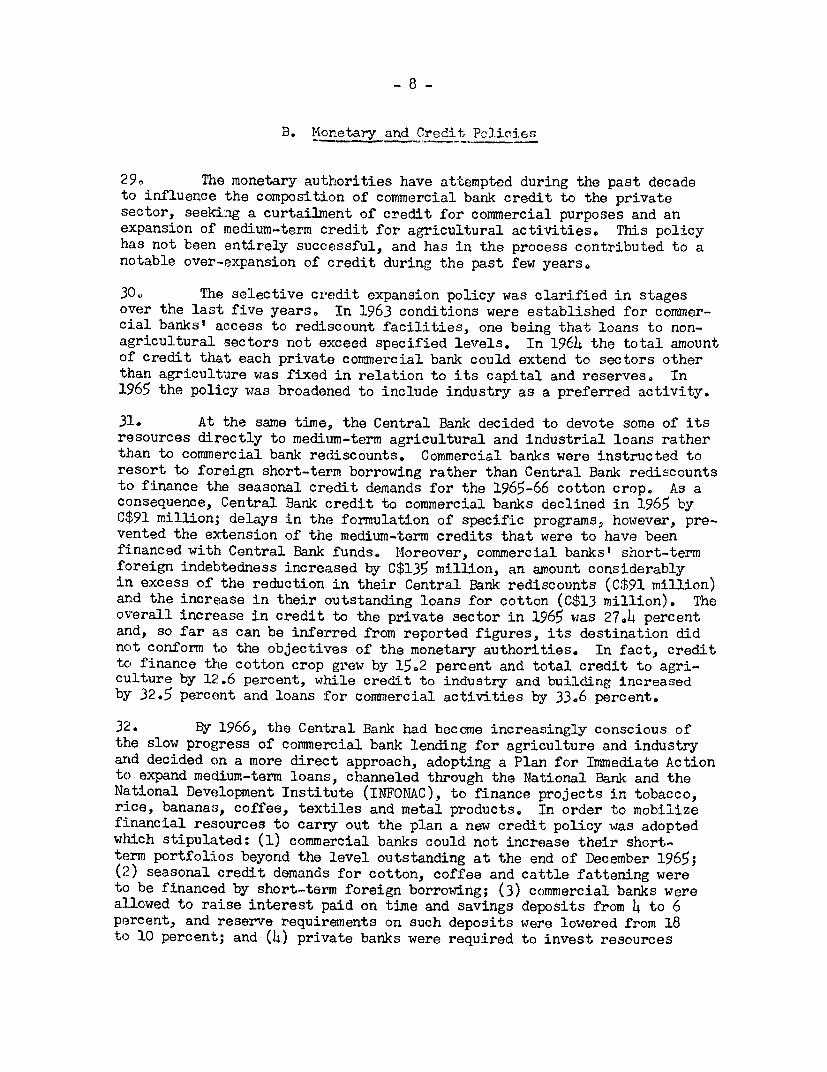
29. The monetary authorities have attempted during the past decadeto influence the composition of commercial bank credit to the privatesector, seeking a curtailment of credit for commercial purposes and anexpansion of medium-term credit for agricultural activities. This policyhas not been entirely successful, and has in the process contributed to anotable over-expansion of credit during the past few years.
309 The selective credit expansion policy was clarified in stagesover the last five years. In 1963 conditions were established for commer-cial banks' access to rediscount facilities, one being that loans to non-agricultural sectors not exceed specified levels. In 1964 the total amountof credit that each private commercial bank could extend to sectors otherthan agriculture was fixed in relation to its capital and reserves. In1965 the policy was broadened to include industry as a preferred activity.
31. At the same time, the Central Bank decided to devote some of itsresources directly to medium-term agricultural and industrial loans ratherthan to commercial bank rediscounts. Commercial banks were instructed toresort to foreign short-term borrowing rather than Central Bank rediscountsto finance the seasonal credit demands for the 1965-66 cotton crop. As aconsequence, Central Bank credit to commercial banks declined in 1965 byC$91 million; delays in the formulation of specific programs, however, pre-vented the extension of the medium-term credits that were to have beenfinanced with Central Bank funds. Moreover, commercial banks' short-termforeign indebtedness increased by C$135 million, an amount considerablyin excess of the reduction in their Central Bank rediscounts (C$91 milLion)and the increase in their outstanding loans for cotton (C$13 million). Theoverall increase in credit to the private sector in 1965 was 27.4 percentand, so far as can be inferred from reported figures, its destination didnot conform to the objectives of the monetary authorities. In fact, credittc, finance the cotton crop grew by 15.2 percent and total credit to agri-culture by 12.6 percent, while credit to industry and building increasedby 32.5 percent and loans for commercial activities by 33.6 percent.
32. By 1966, the Central Bank had beccme increasingly conscious ofthe slow progress of commercial bank lending for agriculture and industryand decided on a more direct approach, adopting a Plan for Immediate Actionto expand medium-term loans, channeled through the National Bank and theNational Development Institute (INFONAC), to finance projects in tobacco,rice, bananas, coffee, textiles and metal products. In order to mobilizefinancial resources to carry out the plan a new credit policy was adoptedwhich stipulated: (1) commercial banks could not increase their short-term portfolios beyond the level outstanding at the end of December 1965;(2) seasonal credit demands for cotton, coffee and cattle fattening wereto be financed by short-term foreign borrowing; (3) commercial banks werea:Llowed to raise interest paid on time and savings deposits from 4 to 6percent, and reserve requirements on such deposits were lowered from 18to 10 percent; and (4) private banks were required to invest resources

-9-
released by the reduction in re5erve racu memnents and credit ceilings aswell as any acdditional resources they might receive in 8 percent five-yearNational Development Bonds issued by the Central Bank. The Central Bankin turn would make these funds available to National Bank and INFONAC formeclium-term loans for projects within the plan.
33. Falling exports and a diminished rate of economic expansion in1966 resulted in less than expected growth in holdings of money and quasi-money by the private sector, and the Central Bank was able to place withbanks only C$56 million of Development Bonds instead of the C$75 millionanticipated. The 1966 government deficit, moreover, caused a drawing downof Treasury deposits at the Central Bank and a consequent drain on itsresources. Commercial banks increased their short-term foreign borrowingby C$107 million during the year, in spite of an increase of only C$17million in their seasonal loans for cotton, coffee, and cattle, and con-tiniued to expand credit outside the ceilings established by the CentralBanik 0 OveraLl bank credit increased by nearly 29 percent during 1966;credit to the private sector by 24 percent.
34. A rapid deterioration followed in 1967. A new fiscal deficitcaused further demands on the Central Bank by the Government. A loss ofconfidence and possibly capital flight may be the reason for the muchsmaller rate of increase than in previous years of time and savings de-posits and the actual decline in currency in circulation and sight deposits,The Central Bank was able to place only C$16 million of Development Bondswith private banks until April, and nothing since. The National Bank,faced with withdrawals of deposits and non-repayment of loans followingtwo successive bad harvests, recurred to the Central Banlk for fuinds to meetits short-term foreign obligations, obtaining C$75 million. During thetwelve-month period ended October 1967, total bank credit increased by24 percent, and credit to the private sector by 16 percent.
35., The sharp deterioration of the current account of the balance ofpayments in 1966 and 1967, and the considerable increase in short-termforeign liabilities during 1965-67 caused net international reserves tovanish and, in fact, become negative by approximately US$4 million at the
end of 1967. The Nicaraguan authorities requested in December 1967 astandby agreement for US$19 million from the International Monetary Fund,which has now been approved. As part of the agreement, the Nicaraguanauthorities will limit bank credit expansion to approximately 10 percentduring 1968, and allow no appreciable increase in net short-term foreignborrowing by commercial banks.
36. Monetary and credit policy during the past three years has thusbeen heavily oriented toward expansion of medium and long-term creditsfor agriculture and industry primarily under the auspices of the two pub-lic financial agencies, the National Bank and INFONAC. The efforts, ascrystallized in the execution of the Plan for Immediate Action, have notproved altogether successful. Agricultural projects, in particular, wereapparently not sufficiently studied in advance, and production, super-vision and marketing problems precluded expected progress. At the sametime, the Central Bank was not successful in enforcing the credit limitsset for National Bank as well as private banks, and credit expansion was

- 10 -
substantially larger than anticipated, with the corresponding impact onimport demand.
C. Development and Trade Policies
37. Development effort during the 1950's consisted by and large ofpublic investmnent projects, mainly in roads, power and port facilities,from which emerged an infrastructure which permitted rapid expansionduring the 1960's in agricultural production and exports0 More recently,the Govermnent has sought to influence private activity by more directmeasures, of which industrial incentives - the Industrial Promotion Law(1958) - and selective credit policy - the Plan for Immediate Action (1966) -were the principal examples.
Development policies affecting the private sector
38. The 1952 income tax law already allowed complete deduction fromtaxable income of profits invested in agricultural and industrial activities.The 1958 Industrial Promotion Law established the usual distinction between"fundamental", "necessary" and "convenient" industries, and granted thecustomary exemptions from import and income taxes for correspondinglymeasured periods. When the Central American Common Market (CACM) came intoeffect in 1961 with Nicaragua as a member, an additional stimulus was pro-vided to domestic production by the greatly heightened protective customsbarrier built around CACMo
39. Import substitution within the context of CACM may have imposeda considerable burden on the Nicaraguan economy. It appears to have broughtforth the customary quality deterioration, price increases and governmentrevenue foregone with only modest gains in increased employment and valueadded domestically. The available information does not permit an assess-ment of changes in prices or quality of import-substitutes nor a completequantification of taxes foregone. Import duties remitted alone, however,were substantial in 1967, exceeding in fact duties actually collected.
40. The Plan for Immediate Action, described in the previous section,was an effort to speed up expansion and diversification of agriculturalproduction and exports and to promote industries allegedly using primarilydomestic raw materials. The mechanism for implementing the plan was acredit program whereby funds obtained from domestic private banks andforeign banks were made available for approved programs by the NationalBank and the Development Institute. The exact amount of resources madeavailable under the Plan is not known: in addition to the US$10.5 millionof development bonds placed by the Central Bank with private banks, theNational Bank contracted short-term foreign loans to finance some of itsmedium-term credits for Plan activities in an undefined amount.
41. The immediate impact of the credit program on increased outputwas extremely modest. In some of the favored activities, particularly inthe field of agriculture (rice, tobacco) project preparation, selectionand execution do not appear to have been sufficiently sound, and no large

- 11 -
medium or long-term response is expectad. The beaana program seems tohave had limited success but marketing problems may limit continued growth.The two industrial activities under the Plan, textiles and metal products,were designed to modernize and expand existing plants, and effects onproduction should be gradually felt in the years ahead.
42. Agricultural development ranks high among economic policy goalsof the Nicaraguan Government. A new set of incentives for producers to
expand output and improve productivity is under consideration, includingprice supports for grains, income tax exemptions and duty free importa-tion of farm machinery. There is no evidence that much consideration has
been given to likely side effects of these measures, such as further lossesof government revenues and increased levels of transfer payments. Nor is
there evidence that compatibility of policies within the public sector is
being carefully considered: a case in point is the INFONAC-sponsoredpetrochemical complex which has already progressed to the insecticide pro-duction stage and is expected to eventually reach production of fertilizers,among other products. Insecticide prices are expected to go up by approxi-mately 20 percent as a consequence of import substitution and in view ofthe high incidence of this input within total costs of growing some crops,
notably cotton, some adverse effect on production seems unavoidable.
43. On the whole, the impact of public policies on private invest-ment appears to have been either negligible, as in the case of the creditprogram, or of doubtful value for the overall economy, as in the case ofindustrial tax exemptions and import substitution. A re-examination of
these policies appears to be in order if the private sector and its con-tribution to the growth of the economy are to be strengthened withoutfurther isolating it from the world economy.
Public sector development programs
44. A comprehensive development program setting forth coordinatedinvestment projects and priorities in different sectors does not exist inNicaragua. Individual agencies prepare and execute their own projectswLth varying degrees of success, but no overall coordination exists among
them. This lack of coordination has not been a serious problem in thepast, but promises to become one as the need to allocate funds to an ex-
panding investment effort becomes more pressing.
45. The bulk of infrastructure investment outside the Central Govern-ment has been carried out by the Power Company (ENALUF) and the Corinto
Port Authority. They have shown a high level of competence and efficiency.A project to expand power generation capacity has been prepared by ENALUF,
and is ready for immediate execution. The Port Authority has underway
studies to increase facilities at Corinto, and a definite project should
be available early in 1969. In both instances, external financing is being
sought from the World Bank.
46. The Government has announced its intention to give high priorityto investment in agriculture. Agricultural projects in general present a
higher degree of complexity than infrastructure, and their preparation and
execution are far more demanding processes. Insufficient attention tothese problems undoubtedly lies behind the quite limited success of agri-cultural projects undertaken in Nicaragua during the past few years.

- 12 -
47. Development of the Atlantic Coast also ra.jk- high among generalgovernment plans. The National Bank has been put in charge of the prepara-tion of a program which presumably would include road and port construc-tion, agricultural production and fisheries projects. Little progress hasbeen made to date, aside from identifying bananas as a possible crop to begrown in the area. Given the scope of the program, and the complexity anddiversity of projects that it would encompass, it would appear that itspreparation and execution would require skills and competence beyond thosepresently at the command of any single agency.
48. Industrial investment is carried out principally by INFONAC,which identifies and prepares projects and seeks financing from internationalagencies, and domestic and foreign private banks to supplement its own re-sources. The largest single project to date is the petrochemical complex,the first stage of which, leading to the production of insecticides, wascompleted in 1967. INFONAC has secured for this project the classifica-tion of "integration industry", which gives it a virtual monopoly positionin all of Central America. Production of the first and of future stagesof this complex is exclusively geared to the Central American market.Total investment in the two plants already built has exceeded US$9.1 mill-ion; it has created employment for 145 persons. The likelihood of someadvrerse impact on agricultural production through an increase in the priceof basic inputs has already been mentioned; in fact, in anticipation oflocal insecticide production and the accompanying boost in customs dutiesanci domestic prices, a six-month supply had been stocked up throughoutCentral America by December 1967.
49., INF0NiAC is also engaged in the preparation of projects that maylead to new exports outside the Central American market expected to yieldan increase in export earnings of US$6-8 million by 1970. There are twoprojects dealing with wood products which are expected to start operationsin 1969, as well as several smaller projects to expand capacity to catchand process seafood (shrimp and lobster) which are expected to acceleratethe rhythm of export growth achieved since 1961. Exports of seafood haveincreased from US$o.5 million in 1961 to US$5.o million in 1967, and mar-ket prospects for increased exports appear good.
50. Investment activities of the Central Government for 1968 and be-yond are dominated by road and school construction projects and the prepara-tion of a national cadaster. Most of the bottlenecks that greatly delayedexecution of these projects in previous years appear to have now beenalleviated, and actual construction is expected to be close to targets.
51. Looking at the development policies of the Nicaraguan Governmentas a whole, a number of shortcomings and deficiencies in project prepara-tion and execution have become apparent during the last few years, as theinvestment effort underwent substantial growth and branched out into morecomplex fields such as agriculture and industry. Since government policycontemplates increasing efforts in these areas and others of similar com-plexity like education, there is a need to strengthen project preparationand execution capacity, particularly in the agencies on which the responsib-ility for those more complex projects rests. Also, an expanding investmentprogram will make necessary the adoption of adequate revenue measures as wellas the establishment of an effective coordinating mechanism that can beginto set project priorities and allocate limited local funds.

III. P'ROSPECTS FOR 1908 - 1I70
520 Nicaragua faces in 1968 a year where major policy decisionsmust be taken in order to set the stage for recovery from the slump thatstarted in 1966. Most of the decisions center around the public invest-ment planning effort as outlined in the previous chapter. Others con-cern trade and balance of payments policyQ
Aa The Fiscal Situation Outlook
53. Exposition and analysis has been limited here to the CentralGovernment, since information is unavailable for the autonomous sector.
Central Government Finances 1965 - 19687Ml-lion o`rdobas)
Estimate BUdget1965 1966 1967 1968
Revenues 4h1 h72 493 5h3Current expenditures -316 -357 -428 -463
Savings 125 115 65 71External debt amortization -5 -6 -14 -17
Savings available forinvestment 120 109 51 54
Investment expenditures 115 163 120 169
Overall surplus or deficit 5 -54 -69 -115
Financing -5 54 69 115
Internal borrowing (net) -18 15 33 15External borrowing (gross) 13 39 36 100
Sources: Tables 15, 16, 18
54. The 1968 budget envisages some improvement in the fiscal situa-tion with respect to 1967. On the basis of an expected growth of GDP ofapproximately 8 percent, improvements in tax administration and increasesin warehousing fees at the customs, an increase of 8.2 percent in currentrevenues is projected. The projection is probably an overestimate, sincethe yield of direct taxes should respond to the much smaller growth inGDP in 1967, while that of indirect taxes, particularly customs duties,will probably decline if the proposed credit policies succeed in curbingimport growth. The underlying 8 percent rate of growth of GDP is itselfoptimistic.
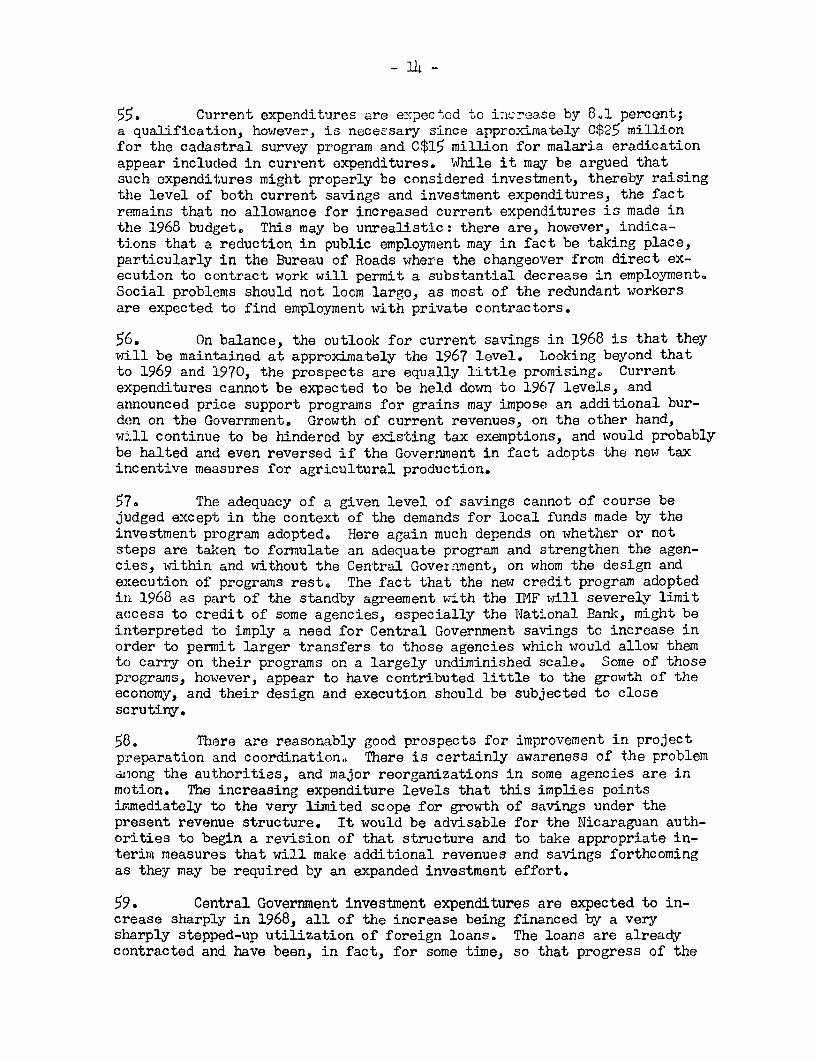
5';. Current expenditures are expectod to increase by 841 percent;a qualification, however, is necessary since approximately C$25 millionfor the cadastral survey program and C$15 million for malaria eradicationappear inclucled in current expenditures. While it may be argued thatsuch expenditures might properly be considered investment, thereby raisingthe level of both current savings and investment expenditures, the factremains that no allowance for increased current expenditures is made inthe 1968 budget. This may be unrealistic: there are, however, indica-tions that a reduction in public employment may in fact be taking place,particularly in the Bureau of Roads where the changeover from direct ex-ecution to contract work will permit a substantial decrease in employment.Social problems should not loom large, as most of the redundant workersare expected to find employment with private contractors.
56. On balance, the outlook for current savings in 1968 is that theywill be maintained at approximately the 1967 level. Looking beyond thatto 1969 and 1970, the prospects are equally little promising. Currentexpenditures cannot be expected to be held down to 1967 levels, andanmounced price support programs for grains may impose an additional bur-den on the Government. Growth of current revenues, on the other hand,will continue to be hindered by existing tax exemptions, and would probablybe halted andl even reversed if the Government in fact adopts the new taxirncentive measures for agricultural production.
57. The adequacy of a given level of savings carnot of course bejudged except in the context of the demands for local funds made by theinvestment program adopted. Here again much depends on whether or notsteps are taken to formulate an adequate program and strengthen the agen-cies, wTithin and without the Central Government, on whom the design andexecution of programs rest. The fact that the new credit program adoptedin 1968 as part of the standby agreement wiflth the IMF will severely limitaccess to credit of some agencies, especially the National Bank, might beinterpreted to imply a need for Central Government savings to increase inorder to permit larger transfers to those agencies which would allow themto carry on their programs on a largely undiminished scale. Some of thoseprograms, however, appear to have contributed little to the growth of theeconomy, and their design and execution should be subjected to closescrutiny.
58. There are reasonably good prospects for improvement in projectpreparation and coordination0 There is certainly awareness of the problemEaqong the authorities, and major reorganizations in some agencies are inmotion. The increasing expenditure levels that this implies pointsimmediately to the very limited scope for growth of savings under thepresent revenue structure. It would be advisable for the Nicaraguan auth-orities to begin a revision of that structure and to take appropriate in-terim measures that will malce additional revenues and savings forthcomingas they may be required by an expanded investment effort,
59. Central Government investment expenditures are expected to in-crease sharply in 1968, all of the increase being financed by a verysharply stepped-up utilization of foreign loans. The loans are alreadycontracted and have been, in fact, for some time, so that progress of the

investment program during 1968 should not be impeded by lack of credits.The expected level of local funds appears adequate to accommodate in-vestment at the level planned. But even in these circumstances, con-tinued effort will be required to prevent administrative difficulties ofthte kind which prevailed in previous years from leading again to lowerthan programmed utilization of external loans or from a diversion oflocal funds for planned expenditures into activities not contemplated inthe budget. Central Government investment projects and expendituresafter 1968 are still undefined at the time of this writing. It is clear,however, that the cost-sharing implicit in the 1968 budget is not sus-tainable and that an expanded investment program should be accompaniedby measures to increase considerably the level of domestic savings.
60. Domestic borrowing in the 1968 budget is limited to payment inbonds of some obligations, especially contributions to the Social SecurityInstitute. No bank borrowing is contemplated, in accordance with thestandby provisions.
B. External Finance and Creditworthiness
61. The outlook for the balance of payments in 1968 is unpromising.Some growth is expected in export earnings from coffee as a consequenceof a larger quota under the Coffee Agreement and largely unchanged prices,and in some minor products like bananas and seafood. Cotton exports,however, will fall short of the 1967 volume as production was considerablydamaged by unseasonal rains, and the expected increase in prices will notbe sufficient to compensate the decline in volume. Thus, on balance, ex-port earnings may approach US$150 million, barely above 1967 levels andlower than originally projected. Unless import demand is correspondinglyfurther restrained, Nicaragua may face a new loss of international reservesin 1968.
62. Some improvement in exports may be expected from development ofnew products and expansion of existing minor ones in the next two or threeyears, but cotton exports will be increasingly subject to pressures fromrising domestic costs and prices of inputs necessary to fight the spreadof disease. Overall, export values may at best increase by 4 to 5 percentannually, and approximate US$160 million by, say, 1971. Import demandhas been increasing at more than three times this rate over the past fewyears.
63. VWhile it may be feasible to restrain import demand during arelatively short period of time, it is clear that the Nicaraguan economyhas undergone structural changes as a consequence of industrializationpolicies and adoption of improved production techniques in agricultureand other sectors which have rendered it relatively more dependent onimports for sustained economic growth. The authorities are well aware ofthis and have during the past few years strived to achieve an expansionand diversification of exports. There is a clear need to push ahead morevigorously with export-promoting programs, particularly the Atlantic Coastproject now under study, and to focus fiscal, monetary, development and

trade policies more clearly toward expansion of exports than merely towardcontainment of imports as they are at present.
64ho During 1966 and 1967 drawings on external medium and long-termloans to the public sector were stepped up considerably, increasing fromUS$13 million in 1965 to US$26 million in 1966 and US$28 million in 1967.Most of the increase represented growing utilization of IDB and U.S.AIDloans by National Bank and INFONAC for their agricultural and industrialprograms, and of Export-Import Bank, UoS.AID, U.S. commercial banks andprivate suppliers' credits by the Central Government to finance importa-tion of road building equipment, expansion of the Managua water supply,construction of the new Managua international airport and installation ofthe automatic telephone network respectively.
65. Debt service payments are estimated by the Central Bank atUS$13 million in 1968, equivalent to approximately 8-9 percent of expectedexport earnings, and are scheduled to increase to US$14o5 million in 1970,without any substantial rise in the debt service ratio. Given a reasonabledegree of success in credit and production diversification policies and inthe adoption of additional measures along the lines outlined above, thelonger run prospects are equally satisfactory.
66. Nicaragua is creditworthy at this time for additional lendingonl conventional terms. But its ability to borrow will be severely limitedquite soon if needed measures to raise public savings and to promotegrowth of exports are not taken shortly. Its longer term prospects de-pend equally on these same measures, which are necessary if much neededdevelopment expenditures as well as continued growth of private invest-ment are to be carried out and achieved without further weakeningNicaragua's external finances.

LIST OF TAIThES
Table No.
1 External Medi.um- and Long-Term Public Debt OutstandingIncluding Undisbursed as of June 30, 1967
2 Estimated Contractual Service Payments Due in Future onExternal Medium- and Long-Term Public Debt Outstand-ing including Undisbursed as of June 30, 1967
3 External Public Debt, 1961-19674 Population, Gross Domestic Product, and GDP per
capita, 1957-19675 Gross Domestic Product by Major Sectors, 1957-19676 Composition of Gross Domestic Product, 1957-19677 CGross Domestic Expenditure, 1957-19668 Crop, Industrial and Mining Output, 1964-19679 Money and Quasi-Money
10 Summary Accounts of the Banking System -Four parts: I. Central Bank
IIe National BankIII. Private BanksIV. Banking System
11 Origin, Destination, and Financing of Bank Credit,1963-1967
12 Bank Credit Flows, 1964-196713 Consumer Price Index14 Indices of W1ages in Managua15 Current Revenues of the Central Government, 1961-196816 Central Government Expenditures, 1963-196817 Expenditures of the Central Government by Department18 Financing of Central Government Investment, 1963-196819 Central Government Revenues and Expenditures as
Percentage of Gross Domestic Product, 1961-196720 Operations of the Central Government and Centralized
State Enterprises21 Operations of Decentralized Agencies22 Consolidated Public Sector Finances, 1950-196523 Balance of Payments, 1961-196724 Exports by Principal Products, 1961-196725 I'mports by Economic Category, 1961-196726 Trade with Central America, 1961-196727 Drawings on Medium- and Long-Term Loans, 1961-196728 International Reserves of the Banking System, 1961-1967

Table 1: NICARAGUA: External Medium- and Long-Term 1/Public Debt Outstanding Including Undisbursed
as of June 30, 1967
Debt Repayabe in Foreign Currency
(In thousands of U,S dollars)
Debt OutstandingJune 30, 1967
Item DisburseTTi7Tudingonly undisbursed
TCTAL EXTERNAL PUBLIC DEBT 63,608 107,356
Privately-placed debt 114. 10 15 716Suppliers' credits 3^i -- T 3Private bank credits 10,h445 ll>82
IBRD loans 2,g356 2h 004
IDA credit 2,995 2,995
IDB loans 5,304 13,302
Loans from Banco Centroamericano deIntegracion Economica 2;900 10,112
U.S. Government loans 15,743 41,227
Export-Import Bank 5501 5,986AID loans 11,242 35,241
1/ Debt with an original or extended maturity of one year or more.
Source: IBRD, Statistical Services Division
Note: Information regarding some loans, particu'arly those made to CentralGovernment by commercial banks and suppliers, was not made avail-able until early in 1968, and consequently the historical externaldebt series prepared on the bases of previous reporting under-estimate the actual. amount of debt outstanding at the end of 1967.On the basis of information provided by the Central Bank and thelending agencies, a revised table has been prepared (Table 3)which shows debt outstanding in December 1967 to be US$97.6 million.
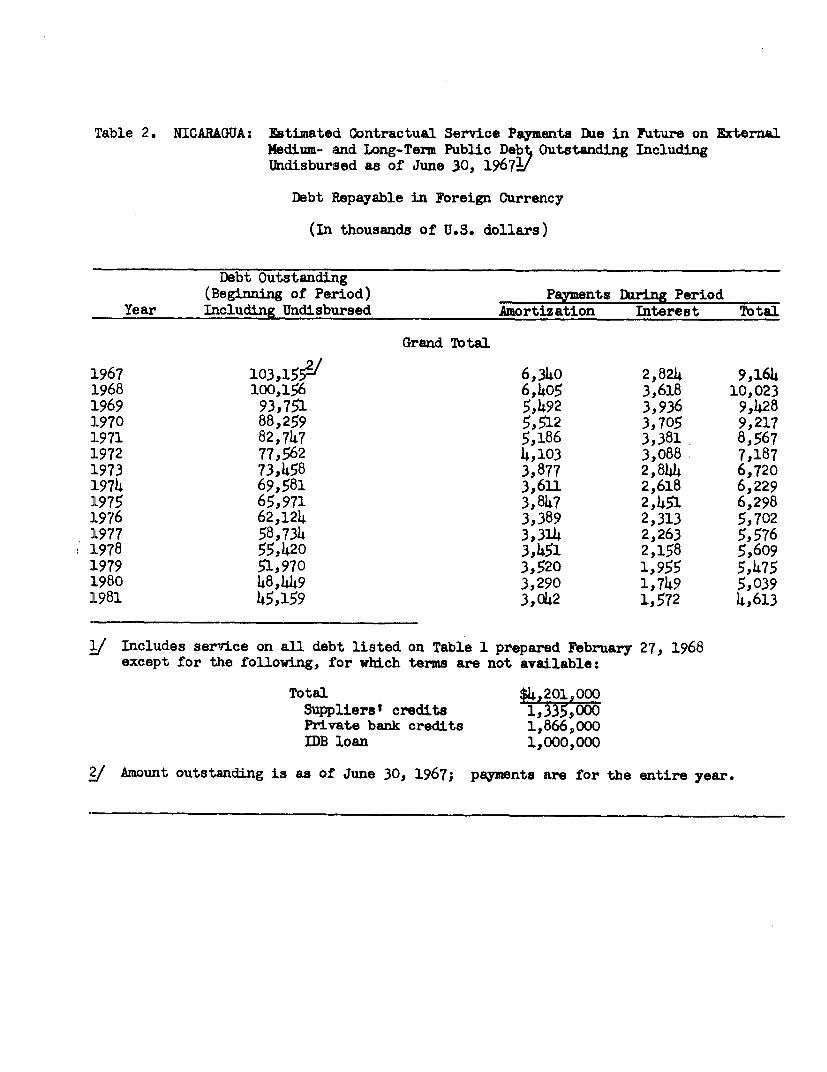
T'able 2. NICARAGUA: Estimated Contractual Service Payments Due in Future on ExternalMedium- and Long-Term Public Debt, Outstanding IncludingUndisbursed as of June 30, 19671/
Debt Repayable in Foreign Currency
(In thousands of U.S. dollars)
Debt Outstanding(Beginning of Period) Payments During Period
Year Including Undisbursed Amortization Interest Total
Grand Total
1.967 1 03,155 J 6,340 2,824 9,1641968 100,156 6,405 3,618 10,0231969 93,751 5,492 3,936 9,4281.970 88,259 5,512 3,705 9,2171.971 82,747 5,186 3,381 8,5671.972 77,562 4,103 3,088 7,1871.973 73,458 3,877 2,844 6,7201974 69,581 3,6LL 2,618 6,229JL975 65,971 3,847 2,,451 6,298]L976 62,124 3,389 2,313 5,7021977 58,734 3,314 2,263 5,5761978 55,1420 3,1451 2,158 5,6091979 51,970 3,520 1,955 5,4751980 4 8,1449 3,290 1,749 5,039]L981 45,159 3,0Q42 1,572 4,613
V2 Includes service on all debt listed on Table 1 prepared February 27, 1968except for thie following, for which terms are not available:
Total $4,201,000Suppliers' credits 1,335,000Private bank credits 1,866,000IDB loan 1,000,000
2 Amount outstanding is as of June 30, 1967; payments are for the entire year.
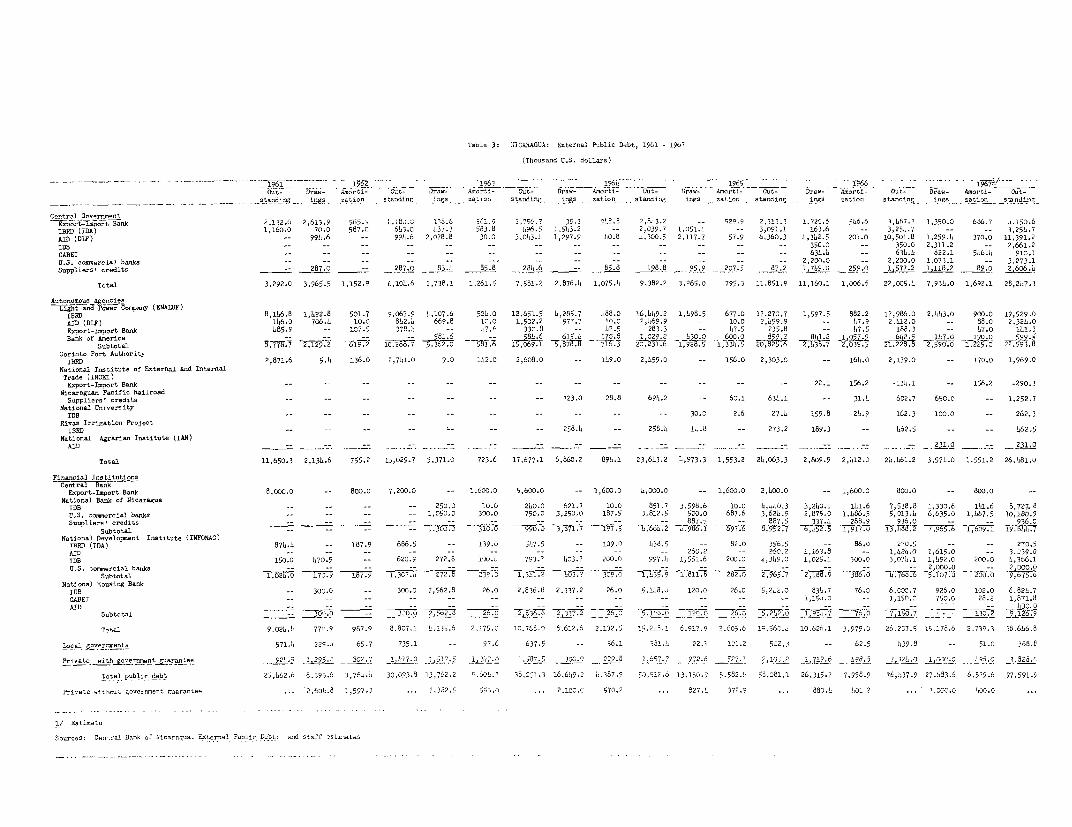
Table 3: NICARAGUA: D0tor-l. Pblic Debt, osi-1967
(Thocoand U.S. dollars)
-- - ~~~~~~~~~~~~~~''~~~~~~~Th~~~~~~~6 Y 962-~~~~~~~~~~~~~~1963 __--_ ' 2766.Y•' -- -- _565_'-__ __-- - '' 966-f96T .Oat- Draw- A,eortl- Dot- Draw- Onorti- One Draw- Ariorti- Dot- Draw- SnortS- Dot Draw- - -- d,lorti- Got- Draw- Snort!- Oat-ti- Ot--- -- -~ - ~ standing 189 - . caton . . staning logo___ cation ___standing inns -datgnistanding - ingsd--gation staning - lowstcaion standitiflowt caion smudin
2.132. 2,61.9 56. i L -j.- ' 5- 7 -3 L -,iJ,. 525.9 2. 313.3 1.72C.6 546,6 3,097.3 1,350.1 686.7 1,150.6IBecD (IDA) 1,160.0 70.0 587.0 613.0 .3_7._3 963.8 196.9~ 1,513.2 -- 2,039.7 1,051.14 3,091.1 163.6 -- 3, 2590.7 -- 3,251.7AID (D8.2) - 991..6 q- 59.6 3,078.8 30.0 3,013.4 1,297.9 10. 8 31,30.5 2,117.3 57.9 6,360.3 1,312.5 201.0 10, 501.8 1,259.1 370.0 11,391.2IDB ~~~- - - - - - - - - - -- -- 350.0 -- 350.0 2,311.2 -- 2,661.2coC rla - - B - - - - -I- - -- - - 631. - 631.1 822 .1 516.,. 910.1US.D. -. i. banks - - - - --- - -- - - 2,200.0 -- 2,200.0 1,073.1 -- 3,273.1Suppliorn' oredit - 870 .. 287.0 83.3 85.8 20.6 -- 85.8- 098.8 95.9 207.5 87.2~ 17)a9.0 259.0 _1,77-2 1.118,2 89.0. 2.60)6 4Total 3,292,0 3,965.5 1,152.9 6,101.6 2,738.1 1,261.5 7,581.2 2.876.1, 1,075.., 9,382.2 3,265.0 795.3 11,851.9 11,160.1 1,006.6 22,005.1 7,331.0 1,692.1 28,217.3
188RD 8,116.8 1,622.8 501.7 9,067.9 1,107.6 521.0 12,651.5 1,285.7 1,88.0 16,1,19.2 1,198.5 677.0 17,270.7 1,597.5 882.2 17,986.0 2,1,13.0 900.0 19,529.0AID (D12) 1l,6.0 7o6.1 10.0 81,2.3 665.8 10.0 1,502.2 977.7 17.0 2,1,69.9 -- 10.0 2,159.9 - 1,7.9 2.112,0 -- 88.0 2,321.0x-p-rt-Icoport Bank 185. -- 107.5 37. - ,.6 337.8 h-17.5 283.3 4-17.5 235.8 -- 7.5 188.3 0-1.0 11,.3Bank of A.erica .- - - 581t.6 -- 584.6 615.o 170.8 ,,L029.2 1,30.0 600.0 859,2 8b1,3.2 1,053.7 610.9 1137.0 190.0 Corinto Port Authority
IBRD 2,871.6 5.1 136.0 2,741.0 9.0) 11,2.0 2,608.0 - 11.9.0 2,1,59.0 156.0 2,303.0 -- 161.0 2,139.0 -- 170.0 1,969.0National Inotintet of Botersal and InternalTrads (INCEI)Exp-ot-l,sport Bank -- - - - - - - - -- - - - 22.1 156.2 -13.,.1 -- 156.2 -290.3Njcaraga PacifIc RaIlroadSuppli,rs credits - - - -- - -- 723.0 28.8 694.2 -- 6o.1 631.1 -- 31.1 602.7 650.0 -- 1,252.NeIana Unrriy- - - - - -- - - 30.0 2.6 27.1 159.8 21.9 162.3 100.0 -- 262.3NIecBRrD aiarjc
258.i - 258.1, 0,.8 -- 273.2 189.3 -- 62.5 4-- 67.5National Agrarian Iotitute (IAN) - - - - - - - - -- - -- - - - 310- 210AID0 ------ _ __3 ,2 _ ___7 _ _?_
Total 11,650.3 2,131.6 755.2 13,029.7 5,371.0 736 17,677.1 6,860.2 891.1 23,61,3.2 1,973.3 1,553.2 21,063.3 2,809.9 2,112.0 21,161.2 3,571.0 1,551.2 26,1,81.0
E.port-Oseport Bank 8,ooo.o -- Bo.o 7,200.0 -- 1,600.0 5,600.0 -- 1,600.0 1,000.0 -- 1,600.0 2,40(3.0 -- ,600.0 800.0 -- 800. National Bank of Nlarag,aaIDNB- -- -- 250.0 10.0 21lo.0 621.7 10.0 851.7 3.598,6 10.0 1,~i0.3 3,21,0.1 1.1.6 7,538.8 1,330.6 111.6 8, 727. 8U.S., corsralkank 1- - - - i050.0 300.0 750.0 3,290.0 187.5 3.812,5 500.0 687.6 3,621.9 0,875.0 1,186.5 9,013. 6,635.0 1,167.5 10,180. 9-uotrs rditto- - - - -- - - - - 887.5 -- 887.5 337.1 288.9 936.0o __ -- 936.0Subtotal -- -- -- -- ~~~~~~~~~~~~~~ ~~~~~~~~~~1.303,0. 310.0 992.0 3,717 19.5 66E1,3 2W986.-o -69•7.6 8,937 297T 1917.0 13Yw.o 7,913 169.1 32National Develop-at 1sotitate (INFONA818)86RD (IDA) 871.1 - 187.9 686.5 -- 139.1 51,75 -- 109,0 1,38.5 -- 82.0 356.5 -- 86.0 270.5 - 270.5AID -- -6- - - - - -2-- 260.2 0,163.8 -- 1,,21.0 s.~6o5;.O 3,139.0IDB iso.o 170.59 - 620.5 272.8 17)0.1 793.7 103.7 200.0 997.I, 1,551.6 200.0 2,3o9.0 1,025.1 300.0) 3,071.1 1,192.0 2050.0 1,366.1U.2.cossserckalbaoka -- -- -- -- -- -- -- -- -- -- -- -- -- -- -- 2,000.0 -- 2700.01 7-2 -,JUFSubtotal TSS0EZS. ~E7;; 187.6 1,307.1 200 091 1312 32 309.1 3T, .9 ,1.7220 295.,,8. 356:; 725 3407.0 200.0 9,National jousin,g Bank0DB -- 300.0 -- 300.0 2,562.5 26.0c 2,536.6 2,337.2 26.o0 ,1,. 120.0 21.0 3,2L2.0 131.7 76.7 6,cox.7 926.0 102.0 6,82-1.7GABEI - - - --- - - - - 1,153.0 -- 1,150.7 357. 25.2 1,071.8
Total 9. 0212: 770.9 987.9 88 07.1 1! ,135.6 2,175.1 0710.71. 6.612,6 2,132.5 1.2L,. .1 6,917.9 2.605.6 19,561.a 10, 626.-1 3,979.1) 26,207.5 15,176.6 2.7391,7 38.61,6.0Local g6 0 yor,a,ee.ts 571.1, 229.1! 66.7 735.1 97 5.6 637.5 -- 56.1 021... 22,0 i171.0 50223 -- 62.5 1,39.8 -. 51.1 38.8.
_______ -- . ___~~~~~~~~~~~~~~~~~~~~~~1 _____ - .- ?. .i 175.3 t -*- -i L70.2 _ 06.0 3,822.0Pr1vo8tl5 5 ef7nfl__rat 21.5 1,295. 202.-7 2t337 2975 3961~2 1,i .5 307 2. 1,677 272.6 9t' 2 IQ,.2 7 7c9C 6 ,9 Tst4 pakllc debt 253,162.6 8.395,6 3,76L-, 30,093.8 171,762.0 1,6001.0 3,2,01.3 16,61~9.2 1,387.9 51,515.26 13.1500, p.532_1 50,001.1 26,31-5.7 7,9558.9 76,1,7.5 07,683.5 6,579.6 97,591.9
Priva.te ottbnat- govr-cOloccrno ... 2,611.3 1,597.3, ... 2,322.5 z 971.1 .. . 2,100.1 570.2 .. 27.1 372.5 ... 388,1- .1.2 ... 3I.71, C. 2.0 o..
I/ Ecti-tis
S-arcn Central Bank of Nic..ragua. -nenlPuRDb:ad staff ostinala

Table 4: NICARAGUA: Population, Gross Domestic Product, and GDP per capita, 1957 - 1967
2Percentage changePopulation Gross Domes ic GDP per Capita:/ from previous ea
(Thousands) Product GDP GDP/Capita
1957 1,293 2 396 1.85358 1.330 2.404 1.807 1.0 -2.559 1.369 2,440 1.782 1.5 -1i4
1960 1.409 2.472 1.754 1.3 -1.661 1.453 2.633 1.812 6.5 3.362 1.496 2.91 1.946 10.6 7.463 1.541 3.125 2.028 7.3 4. 2
64 1.587 3.324 2.094 6.3 3.265 1.634 3.654 2.236 9.9 6.866 1.682 3.786 2.251 3.6 0.667L/ 1*731 3.945 2.279 4.2 1.2
/ Million C6rdobas, at 1958 pricesg/ Co5rdobas
2/ Preliminary figures
Sources: Planning Office and Central Bank
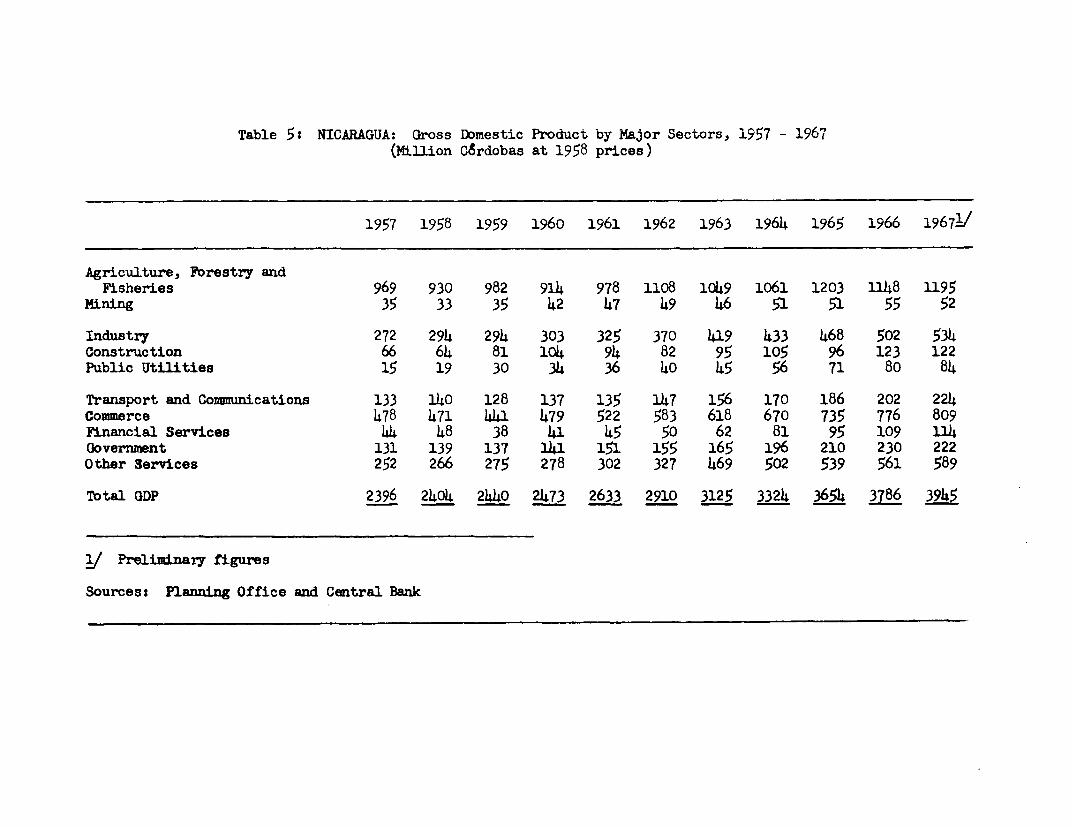
Table 5: NICARAGUA: Gross Domestic Product by Major Sectors, 1957 - 1967(Million Cordobas at 1958 prices)
1957 1958 1959 1960 1961 1962 1963 1964 1965 1966 19671/
Agriculture, Fbrestry andFisheries 969 930 982 914 978 1108 1049 1061 1203 1148 1195
Mining 35 33 35 42 47 49 46 51 51 55 52
Industry 272 294 294 303 325 370 419 433 468 502 534Construction 66 64 81 104 94 82 95 105 96 123 122Public Utilities 15 19 30 34 36 40 45 56 71 80 84
Transport and Communications 133 140 128 137 135 147 156 170 186 202 224Commerce 478 471 441 479 522 583 618 670 735 776 809Financial Services 44 48 38 41 45 50 62 81 95 109 114Government 131 139 137 141 151 155 165 196 210 230 222Other Services 252 266 275 278 302 327 469 502 539 561 589
Totalb GDP 2396 2404 2440 2473 2633 2910 3125 3324 3654 3786 3945
v/ PreliminAry figures
Sourcest Planning Office and Central Bank

Table 6: NICARAGUA: Composition of Gross Domestic Product, 1957 - 1967(Percentages)
Average Average! Average Average
___________.__ 1957-59 1960-62 1963-65 1966-67
Agriculture, Forestry andFisheries 39.8 37.4 32.8 30.3
Mi.ning 1.4 1.7 1.5 1.h
Industr-y 11.9 12.4 13.1 13.4Construction 2.9 3.5 2.9 3.2Ptublic Utilities 0.9 1.4 1.7 2.1
Transport and Conmnrnications 5.5 5.2 5.1 5.5Commerce 19.2 19.8 20.0 20.5Financial Services 1.8 1.7 2.4 2.9Governuent 5.6 5.6 5.6 5.8Other Services 11.0 11.3 14.9 14.9
Total GDP 100.0 100.0 100.0 100.0
Source: Table 5

Table 7: NICARAGUA: Gross Domestic Expenditure, 1957 - 1966
1957 1958 1959 1960 1961 1962 1963 1964 1965 1966
I. In millions of C6rdobas at 1958 prices
Consumption Expenditure 2144 2139 1939 2158 2279 2522 2606 2741 3070 3182Private sector 1942 1935 1739 19-5 2507 2300 2359 21 2770Public sector 202 204 200 204 212 222 247 260 300 345
Gross Domestic Investment 347 334 359 331 360 422 523 604 657 808Private sector 220 220 29 67 311 383 -3 592 T613Public sector 123 114 104 72 93 111 140 169 165 195
Trade Balance -95 -69 142 -15 -6 -33 -4 -21 -73 -204Imports of goods and services 645 665 579 591 617 77 931 1121 1294 1451Exports of goods and services 550 596 721 576 611 763 927 1100 1221 1247
Gross Domestic Product 2396 2404 2440 2473 2633 2911 3125 3324 3654 3786
II. As percentage of Gross Domestic Product
Consumption Expenditures 89.5 89.0 79.5 87.3 86.6 86.6 86.4 82.5 84.o 84.0Private sector 7510 T 71.3 79.0 79.0 775.57W 75 kPublic sector 8.5 8.5 8.2 8.3 8.1 7.6 7.9 7.9 8.2 9.1
Gross Domestic Investment 114.5 13.9 14.7 13.4 13.7 14.5 16.7 18.2 18.0 21.3Private sector 9.3 9.1 10. 10.5 10.1 10.7 12.3 13.1 13.5 1Public sector 5.2 4.8 4.3 2.9 3.6 3.8 4.4 5.1 4.5 5.1
Trade Balance -4.0 -2.9 5.8 -0.7 -0.3 -1.1 -0.1 -0.7 -2.0 -5.3Imports of goods and services 26 27.7 23.7 23.9 23.14 27.3 33.7 .4 3B. 3Exports of goods and services 22.9 24.8 29.5 23.2 23.1 26.2 29.7 33.0 33.4 33.0
Sources: Planning Office

Table 8: Nicaragua: Crop, Industrial and Mining Output, 196b - 1967
1960 1961 1962 1963 196L 1965 1966 1967
Crops
Cotton (1.000 q) 641 721 1,208 1,568 2,038 2,712 2,398 2,L89Coffee . It 516 571 540 601 642 682 701 70hSesame " " 182 177 135 56 102 126 115 122Rice " " 442 L62 525 501 633 657 727 813Beans " 1479 48L 696 627 701 785 851 912Corn ' II 2,150 2,588 2,678 2,735 3,095 3,437 3,451 3,827Sorghum " " 853 847 1,086 1,067 907 1,025 1,075 1,114Sugar cane (1.000 tons) 1,038 1,138 1,421 1,195 1,101 1,109 833 1,110
Industrial Products (million units)
Vegetable oils (lbs) 15.3 12.1 13.1 19.2 15.0 15.5 25.8 42.0Sugar (q) 1.4 1.7 1.9 1.8 2.2 2.2 1.6 2.1Beer (liters) 4.1 4.2 5.7 7.6 9.7 12.0 13.7 14.8Rum (liters) 4.0 6.0 6.4 7.0 9.1 8.6 9.1 9.6Soft drinks (liters) 21.8 23.0 31.3 26.4 31.2 37.1 46.0 48.2Cigarettes (number) 819.0 809.0 825.0 891.0 933.1 1,002.0 1,063.2 1,064.8
Matches (boxes) 21.7 21.6 24.5 26.3 28.4 32.4 30.0 33.0Instant coffee (lbs) n.a. 2.0 3.5 3.3 2.6 2.2 1.6 0.5Soap (lbs) 9.5 11.4 14.8 15.3 15.3 15.2 16.7 17.5Textiles (yards) 10.7 9.3 9.3 12.2 12.5 12.4 13.0 11.0Shoes (pairs) 0.6 0.5 0.5 o.6 0.7 0.7 0.7 0.7Cement (bags) 0.7 0.9 0.9 1.7 1.4 1.8 1.9 2.0Sawmill lumber (board feet) 51.6 55.9 61.4 50.2 51.6 45.5 54.1 55.9Milk 13.9 20.0 20.7 24.5 24.3 39.8 32.3 40.2
Electric power (Kw/h) 184.0 195.0 212.0 251.0 281.5 316.0 359.5 413.7
Mining Products
Gold (1.000 troy oz.) n.a. n.a. 222.0 204.8 211.9 198.1 199.1 178.8Silver (1.000 troy oz.) n.a. n.a. 500.5 405.3 332.4 380.4 447.0 296.8Copper (million lbs.) n.a. n.a. 16.0 16.1 20.2 22.5 21.5 21.7
1/ Preliminary figures
Source: Central Bank

Table 9. Nicaragua: Money and Quasi-Money
Did of Year October
1961 1962 1963 1964 1965 1966 1966 1967
I. In millions of cordobas
Banking systemCurrency in circulation 131.4 166.6 177.2 185.4 197.9 227.2 199.6 198.4Sight deposits 129.6 164.1 200.9 257.1 320.2 315.5 291.1 270.2
Money 261.0 330.7 378.1 442.5 518.1 542.7 490.7 468.6
Time and savings deposits 13.1 13.5 26.7 56.6 99.3 146.6 145.6 176.2Other quasi-money 11.3 12.8 12.0 16.6 23.8 37.1 30.8 26.7
Quasi-money 24.4 26.3 38.7 73.2 123.1 183.7 176.4 202.9
Money and quasi-moneyirn banking system ;285.4 357.0 416.8 515.7 641.2 726.4 667.1 671.5
SePtember1966 1967
Other, financial institutionsDeposits in INFONAC ... ... 10.6 14.7 19.5 27.4 24.6 24.1Deposits in savings andlcian associations ... ... ... 51.1 53.3 51.0 52.1 47.7
Mortgage bonds ... ... ... 2.7 2.6 2.4 2.5 0.4
Quasi-money in otherinstitutions ... ... 10.6 68.5 75.4 80.8 79.2 72.2
II. As percentage of GDP
Currency 5.2 5.9 5.7 5.4 5.2 5.6Sight; deposits 5.2 5.9 6.5 7.5 8.4 7.8Money 10.4 11.8 12.2 12.9 13.6 13.4Quasi.-money in bankingsystem 1.0 1.0 1.2 2.1 3.2 4.6
Money and quasi-money inbanking system 11.4 12.8 13.4 15.0 16.8 18.0
Quasi-money in otherfinancial institutions ... ... ... 2.0 2.0 2.0
Total 11.4 12.8 13.4 17.0 18.8 20.0
Source: Central Bank of Nicaragua, and IMF

Table 10: Nicaragua: Summary Accounts of the Banking System(Million C6rdobas)
End of Period October1963 196h 1965 1966 196 1967
I. Central Bank
Net international reservesLiquid foreign assets 222.7 272.6 1)3.1.2 406.9 395.7 229.2Net IMF position -53.8 -59.2 -59.3 -45L.7 -45.8 21.7Short-term liabilities -3.7 -4.8 -6.9 -14.h -30.9 -28.0
Total 165.2 208.6 335.0 346.8 319.0 222.9
Domestic creditTo Central Government
Consolidated debt 83.3 82.0 80.7 79.0 79.1 77.3Subscriptions to internationalagencies 37.8 39.1 37.5 38.3 38.3 33.0
Subtotal 121.1 121.1 I1TT2 117.3 117TIT 110.3
To INCEI 7.3 1.4 4.0 10.0 9.0 7.0To other official entities 0.1 0.10-- To INFONAC 13.7 9.8 7.0 25.5 18.5 35.5To National Bank 90.9 93.9 11.4 h0.8 42.8 96.7To private banks 2.9 8.3 - -- -- --
Unclassified assets 22.0 31.3 36.3 33.8 40.1 31.5
Total 258.2 265.9 176.9 227.h 227.8 281.0
Foreign liabilities (medium- andlong-term) 39.2 28.0 16.8 6.6 6.7 1.0
Liabilities to BanksCurrency 30.3 34.0 34.0 38.8 36.1 39.0Deposits 53.0 72.7 90.1 86.7 69.4 71.1Development bonds - -- -- 56.0 48.2 73.1
Total 83.3 106e7 124h1 181.5 153.7 183.2
Liabilities to private sectorCurrency in circulation 177.2 185.4 197.9 227.2 199.6 198.4Foreign currency deposits 0.8 1.6 2.6 2.7 1.9 1.6Other liabilities -- 1.1 0.2 5.7 1.7 1.0
Total 176.0 188.1 200.7 235.6 203.2 201.0
(continued)

Table 10 (cortd.): Nicaragua: Summary Accounts of the Banking System(Million C6rdobas)
End of Period October1963 1964 1965 -96 1966 1967
Government depositsBudgetary deposits ... 46.1 72.3 44.2 85.3 20.0Agency and other deposits .. 10.9 19.7 26.7 13.0 20.3
Total 32.5 57.0 92.0 70.9 98.3 40.3
Deposits of official entities 2.4 3.1 4.6 3.8 3.8 6.7Official capital and reserves 21.8 2h.6 24.5 25.6 24.5 25.6Advance import deposits 22.2 22.6 4.3 0.2 0.2 --Obligations to international agencies 20.9 20.7 19.7 20.9 20.9 19.2Unclassified liabilities 22.9 23.7 25.2 29.2 35.6 26.9
(continued)

Table 10 (contd,)s Nicaragua: Summary Accounts of the Banking System(Million C6rdobas)
End of Period October1963 1964 1965 1966 1966 1967
II. National Bank
Net international. reservesAssets 9.5 9.2 17.5 11.0 7.3 8.1Liabilities -18.1 -35.9 -137.6 -199.7 -143.7 -162.7
Total -8.6 -26.7 -120.1 -188.7 -136.4 -154.6
Currency and reserve deposits 27.4 41.7 38.0 42.0 30.6 34.1
Domestic creditTb official entities 5.9 5.4 5.3 5.2 5.3 5.2To private sector 314.6 377.4 454.5 581.2 535.9 650.0Unclassified assets 33.3 40.4 52.5 71.4 55.5 80.3
Total 353.8 423.2 512.3 657.8 596.7 735.5
Foreign liabilities(medium- and long-term) 6.9 33.7 62.7 98.7 88.9 142.9
Liabilities to Central Bank 90.9 93.9 11.4 39.8 39.7 94.3
Liabilities to private sectorSight deposits 62.3 85.9 103.8 86.4 87.1 79.1Time and savings deposits 23.0 35.6 54.8 73-1 69.7 Z0.3
Total 85.3 121.5 158.6 159.5 156.8 149.4
Government deposits 1.6 0.1 -- -- -- --Deposits of official entities 31.3 29.9 26.7 29.9 28.0 38.9Official capital and reserves 133.9 135.9 140.2 142.7 142.0 146.6Unclassified liabilities 22.7 23.2 30.6 40.5 35.5 43.0
(continued)

Table 10 (Contd.): Nicaragua: Summary Accounts of the Banking System(Million C6rdobas)
End of Period October1963 1964 1965 1966 1966 1967
III. Private Banks
Net international reservesAssets 3.3 13.1 19.9 37.9 22.5 16.9Liabilities -2.7 -3.6 -37.2 -82.1 -58.8 -82.5
Total o.6 9.5 -17.3 -44.2 -36.3 -65.6
C:Laims on Central BankCurrency and reserve deposits 55.7 64.8 86.6 84.4 74.2 75.0Deve:Lopment bonds -- 5-- _ 60o 48.2 73.1
Total 55.7 64.8 864.6 140.4 122.5 148.1
Domestic creditPrivate sector 137.7 182.1 258.3 304.4 290.3 306.5Unclassified assets 26.9 33.5 44.0 59.6 50.6 66.6
Tbtal 164.6 215.6 302.3 364.0 340.9 373.1
Foreign liabilities(medium- and long-term) -- -- 2.3 1.8 2.0 1.4
Liabilities to Central Bank 2.9 8.2 -- -- -- --
Liabilities to private sectorSight deposits 138.6 171.2 216.4 229.1 204.0 191.1Time and savings deposits 14.9 34.9 65.5 102.2 103.1 130.0Capital and reserves 54.4 64.3 73.6 101.2 99.7 108.2
Total 207.9 270.4 355.5 432.5 406.8 429*3
Unclassified liabilities 10.1 11.3 13.8 25.9 18.2 24.8
(continued)
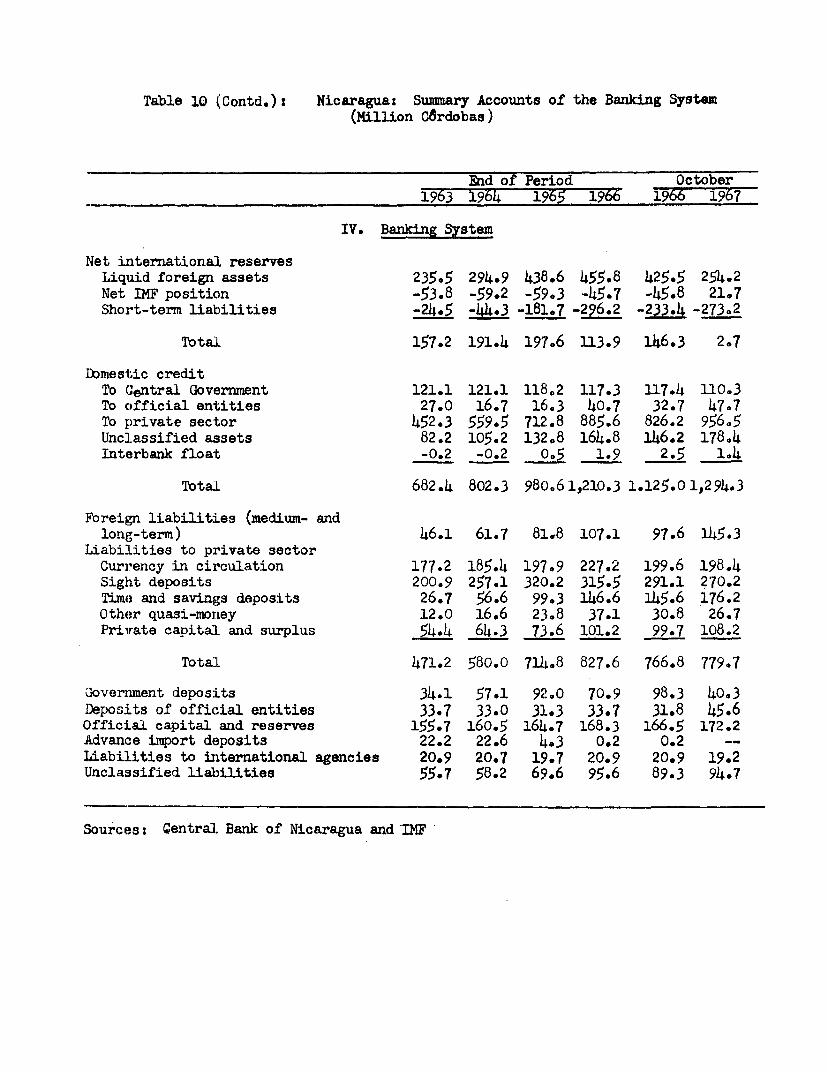
Table 10 (Contd.): Nicaragua: Summary Accounts of the Banking System(Million C6rdobas)
End of Period October1963 1964 1965 1966 1966 1967
IV. Banking System
Net international reservesLiquid foreign assets 235.5 294.9 438.6 455.8 425.5 254.2Net IMF position -53.8 -59.2 -59.3 -45.7 -45.8 21.7Short-term liabilities -24.5 -44.3 -181.7 -296.2 -233.4 -273.2
Total 157.2 191.4 197.6 113.9 146.3 2.7
Dbmestic creditTo Central Government 121.1 121.1 118.2 117.3 117.4 110.3To official entities 27.0 16.7 16.3 40.7 32.7 47,7To private sector 452.3 559.5 712.8 885.6 826.2 956.5Unclassified assets 82.2 105.2 132,8 164.8 146.2 178,4Interbank float -0.2 -0.2 0.5 1.9 2.5 1.4
Total 682.4 802.3 980.61,210.3 1.125.0 1,294.3
Fbreign liabilities (medium- andlong-term) 46.1 61.7 81.8 107.1 97.6 145.3
Liabilities to private sectorCurrency in circulation 177.2 185.4 197.9 227.2 199.6 198.4Sight deposits 200.9 257.1 320.2 315.5 291.1 270.2Time and savings deposits 26.7 56.6 99.3 146.6 145.6 176.2Other quasi-money 12.0 16.6 23.8 37.1 30.8 26.7Private capital and surplus 54.4 64.3 73.6 101.2 99.7 108.2
Total 471.2 580.0 714.8 827.6 766.8 779.7
Govenument deposits 34.1 57.1 92.0 70.9 98.3 40.3Deposits of official entities 33.7 33.0 31.3 33.7 31.8 45.6Official capital and reserves 155.7 160.5 164.7 168.3 166.5 172.2Advance import deposits 22.2 22.6 4.3 0.2 0.2 --Liabilities to initernational agencies 20.9 20.7 19.7 20.9 20.9 19.2Unclassified liabilities 55.7 58.2 69.6 95.6 89.3 94.7
Sources: Central Bank of Nicaragua and IMF

Table lls Nicaragua: Origin, Destination, and Financing of Bank Credit, 1963 - 1967
(Million C6rdobas)
End of Year October
1963 1964 1965 1966 1966 1967
OriginCentral Bank 179.3 161.4 35.4 102.6 69.2 187.9National Bank 207.3 276.1 443.6 546.6 490.4 556.9
Total operations (298.2) (370.0) (455.0) (587.4) (533.2) (653.6)With Central Bank credit (90.9) (93.9) (114.) (40.8) (42.8) (96.7)
Private Banks 151.6 196.0 288.5 338.1 322.6 348.3Total operations (154l5) (204.3) (288.5) (338.1) (322.6) (348-3)With Central Bank credit (2.9) (8.3) ( _ ) ( _ ) ( _ ) C _
Interbank float -0.2 -0.2 0.5 1.9 2.5 1.4
Total 538.0 633.3 768.0 989.2 884.7 1,094.5
DestinationtoCent'ral Government (net) 87.0 64.o 26.2 46.4 19.1 70.0To official entities (net) -6.7 -16.3 -15.0 7.0 0.9 2.1To private sector 452.3 559.5 712.8 885.6 826.2 956.5Unclassified assets (net) 5.6 26.3 43.5 48.3 36.0 64.5Interbank float -0.2 -0.2 0.5 1.9 2.5 1.4
Total 538.o 633.3 768.0 989.2 884.7 1,094.5
FinancingForeign credits (medium- andlong-term) 46.1 61.7 81.8 107.1 97.6 145.3
Official capital and reserves 155.7 160.5 164.7 168.3 166.5 172.2Advance import deposits 22.2 22.6 4.3 0.2 0.2 -Private sector claims on banks 471.2 580.0 714.8 827.6 766.8 779.7
Money (378.1) (442.5) (518.1) (542-7) (490.7) (468.6)Quasi-money (38.7) (73.2) (123.1) (183.7) (176.4) (202.9)Bank capital and reserves (54.4) (64h3) (73.6) (101.2) (99.7) (108.2)
Sub-total 695.2 824.8 965.6 1,103.2 1,031.1 1,097.2
Net international reserves -157.2 -191.4 -197.6 -113.9 -146.3 -2.7
Total 538.0 633.4 768.0 989.3 884.8 1,094.5
Source: Table I0
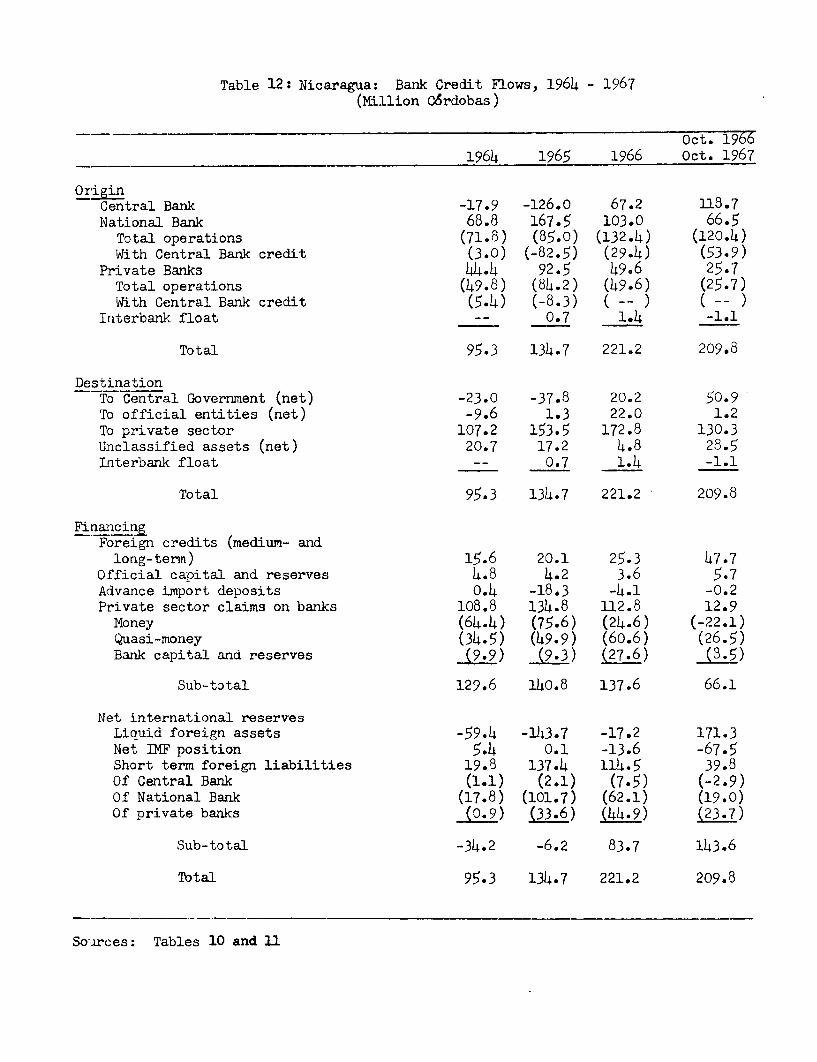
Table 12: Nicaragua: Bank Credit Flows, 1964 - 1967(Million C6rdobas)
Oct. 19661964 1965 1966 Oct. 1967
OriginCentral Bank -17.9 -126.0 67.2 118.7National Bank 68.8 167.5 103.0 66.5
Total operations (71-8) (85.0) (132-4) (120.4)With Central Bank credit (3.0) (-82.5) (29.4) (53.9)
Private Banks 44.4 92.5 49.6 25.7Total operations (49.8) (84.2) (49.6) (25.7)With Central Bank credit (5.4) (-8.3) ( -- ) ( -- )
Iaterbank float -- 0.7 1.4 -1.1
Total 95.3 134.7 221.2 209.8
DestinationTo Central Government (net) -23.0 -37.8 20.2 50.9To official entities (net) -9.6 1.3 22.0 1.2To private sector 107.2 153.5 172.8 130.3Unclassified assets (net) 20.7 17.2 4.8 28.5IEnterbank float -- 0.7 1.4 -1.1
Total 95.3 134.7 221.2 209.8
FinancinForeign credits (medium- andlong-tenn) 15.6 20.1 25.3 47.7
Official capital and reserves 4.8 4.2 3.6 5.7Advance import deposits 0.4 -18.3 -4.1 -0.2Private sector claims on banks 108.8 134.8 112.8 12.9
Money (64.4) (75.6) (24.6) (-22.1)Quasi-money (34.5) (49.9) (60.6) (26.5)Bank capital and reserves (9.9) (9.3) (27.6) (3.5)
Sub-total 129.6 140.8 137.6 66.1
Net international reservesLiquid foreign assets -59.4 -143.7 -17.2 171.3Net IMF position 5.4 0.1 -13.6 -67.5Short term foreign liabilities 19.8 137.4 114.5 39.8Of Central Bank (1.1) (2.1) (7.5) (-2.9)Of National Bank (17.8) (101.7) (62.1) (19.0)Of private banks (0X9) (33.6) (44.9) (23.7)
Sub-total -34.2 -6.2 83.7 143.6
Total 95.3 134.7 221.2 209.8
Solurces: Tables 10 and 11

Table 13: NICARAGUA: CONSUMER PRICE INDEXLa
(1958 = 100)
Monthly TotalAverages Index Food Housing Fuels Clothing Other
1957 95.4 92.9 101.2 - 100.0 97.11958 100.0 100.0 100.0 100.0 100.0 100.01959 97.1 94.8 101.0 - 100.0 100.51960 95.2 91.4 100.5 105.6 100.1 100.41961 95.4 91.4 101.9 104.5 101.0 104.51962 95.1 90.7 101.9 104.0 100.3 101.51963 95.9 91.8 101.9 104.0 100.3 102.41964 100.3 100.5 101.9 112.6 101.5 96.01965 103.2 104.5 102.6 124.0 101.9 96.41966, 106.6 108.5 101.9 136.9 101.5 99.4
'a Wage earners in the city of Managua.
Sources: Ministry of Economy, and Central Bank.
Table 14: NICARAGUA: INDICES OF WAGES IN MANAGUA
(1960 = 100)
Conrierce Manufacturing Services Construction Total
1960 100 100 100 100 1001961 100 102 193 114 1021962 103 109 105 139 107
1963 108 122 115 158 1151964 112 128 125 157 1221965 120 139 144 173 1291966 133 151 160 186 142
Source: Social Security Institute of Nicaragua.

Table 15: Nicaragua: Current Revenues of the
Central Government, 1961 - 1968
(Million c6rdobas)
Actual Prel. Budget1961 1962 1963 1964 1965 1966 1967 1968
Direct taxes
Income taxes 20.9 21.1 30.3 32.1 53.2 61.3 69.3 70.4Property taxes 8.4 9.9 18.2 21.3 27.5 30.8 34.0 33.2Inheritance tax - o.8 0.7 1.0 1.2 1.5 2.2 2.5
Sub-total 29.3 31.8 49.2 54.4 81.9 93.6 105.5 111.1
Taxes on foreign trade
Import taxes 136.2 152.6 161.9 153.5 169.,2 161.2 157.9 165.5Export t-axes 7.0 6.0 6.2 5.7 7.6 9.8 13.7 14.4
Sub-total 113.2 158.6 168.1 159.2 176.,8 171.0 171.6 179.9
Internal indirect taxes
Excise taxes 47.2 54.9 79.9 108.9 121.9 131.7 169.7 157.9Stamp taxes 5.0 6.4 7.0 7.0 9.2 9.8 11.5 12.3Sales tax 2.2 2.1 2.3 2.7 3.2 3.4 4.4 h.2Other 7.3 7.0 10.1 9.9 11.1 12.2 10.0 10.7
S3ub-total 61.7 70.4 99.3 128.5 145.4 157.1 175.6 185.1
Total tax revenue 234.2 260.8 316.6 342.1 040h1 421.7 452.7 476.l
Nontax revesnue
Services 11.5 12.9 16.3 20.5 20,,5 20.3 25.7 35.8Monopolies 4.o 5.4 6.o 6.7 6.8 7.2 7.5 8.7Other 4.5 3.3 4.6 7.2 8.0 22.5 7.5 13.2
Sub-total 20.8 21.6 26.9 34.4 35.3 50.0 Lo.7 57.7
Total ordinaryrevenues 255.0 282.4 343.5 376.5 439,4 471.7 493.4 533.8
Sources: Court of Accounts; and Budget Office.

Table 16b NICARAGUA: Central Government Expenditures, 1963 - 1968(Million C6rdobas)
Actual Prel. Budget1963 196 4 1965 1966 1967 1968
Current ExpendituresWages and salaries 137.8 164.2 182.7 206.4 256.5 260.3Goods and services 38.5 52.1 62.2 70.6 74.5 80.0Current transfers 48.4 45.2 56.4 61.5 75.4 96.1
to other public agencies (27.1) (20.6) (31.8) 35.2) (.) ( .)outside the public sector (21-3) (24.6) (24.6) 26.3) (.) (...)
Interest on debt 6.7 6.7 5.8 6.9 8.5 13.7Other expenditures -- -- 9.3 11.6 13.3 13.0
Total current expenditures 231.5 268.2 316.4 357.0 428 .2 463.1
Capitil ExpenLituresReal investment; 74.7 84.3 87.2 128.3 89.3 139.9Capital transfers 12.3 21.4 21.2 20.5 23.5 26.3Other financiaL investment 12.0 4.o 6.7 14.2 7.7 2.7
Total capital expenditures 99.0 109.7 115.1 163.0 120.5 168.9
Total expenditures 330.5 377.9 431.5 520.0 548.7 632.0
Sources: Court of Accounts; 'Budget Office; Planning Office; and staffestimates.

Table 17: NICARAGUA: Expenditures of the Central Goverrment by Department(Million C6rdobas)
Actual Estimate Budget1961 1962 1963 1964 1965 1966 1967 1967 1968
Legislature 3.2 3.2 4.2 5.3 6.4 7.1 7.0 7.0 6.7Judiciary 5.0 5.2 5.5 6.6 10.3 13.1 10.1 9.7Electoral tribunal - 2.1 2.6 1.6 1.6 4.5 3.8 3.9 1.7Executive
Presidential office 4.5 5.1 7.0 5.6 6.o 8.4 7.5 5.4 8.2Interior 19.5 20.5 20.8 25.5 30.2 34.2 35.0 37.8 29.8Foreign affairs 9.4 8.9 10.6 11.0 12.3 16.2 15.5 15.2 14.6Economy 4.1 3.1 5.0 8.5 8.0 17.2 25.0 25.5 29.7Finance 37.4 40.4 41.1 37.2 41.8 42.5 36.5 35.9 47.2Education 31.7 37.9 46.4 55.2 62.9 74.8 91.5 90.8 104.3Public works 40.1 64.9 53.3 70.0 80.4 112.7 101.0 159.9 127.6Defense and communications 42.5 43.8 46.3 50.8 55.3 58.3 61.0 61.7 67.4Agriculture 8.7 9.1 9.5 9.7 10.8 13.1 18.0 15.1 12.9Health 7.8 7.6 9.3 11.6 15.8 19.3 23.0 27.9 39.5Labor 1.4 1.6 2.6 2.6 2.9 3.3 3.5 3.7 3.5
Subtotal 207.4 242.9 251.9 28787 326.4 400.0 417.5 478 .-9 877Transfers
In cash 33.0 40.2 51.9 65.4 73.9 77.6 82.9 113.8 93.9In bonds 17.8 8.5 7.7 4.6 7.1 10.8 18.8 18.9 21.6
Subtotal 50 4 70.0 101.7 132.7 115.5Interest on public debt 3.0 4.4 6.7 6.7 5.8 6.9 8.5 7.5 13.7
Total expenditure 269.4 306.5 330.5 377.9 431.5 520.0 548.7 640.1 632.0
Sources: Court of Accounts; Budget Office; and staff estimates

Table 18: NICARAGUA: Financing of Central Government Investment, 1963 - 1968
Prel. Budget1963 1964 1965 1966 1967 1968
(Million C6rdobas)
Total Capital Expenditures 99.0 109.7 115.1 163.0 120.5 168.9
Sources of Funds
I. Central Government Savings 112.0 108.3 124.4 115.1 652 70.7Current Account surplus 112.0 1-077X 123.0 114.7 70.7Capital revenues - - 1.4 0.4 - -
II. Domestic Credit -16.8 -3.7 -17.6 14.9 33.2 14.6Central Bank (net) -22. -26.1 17.3 29.2 -1.0Rest of public sector (net) 8.1 3.6 2.3 -3.0 11.0 11.1Other -2.1 18.8 12.7 o.6 -7.0 4.5
III. External Credit 3.8 5.1 8.3 33.0 22.1 83.6Loan disbursements 12.6 I2.6 13.4 39.3 35.7 100.57Amortization 8.8 7.5 5.1 6.3 13.6 16.9
(Percentages of total capital expenditures)
Central Government Savings 113.1 98.7 108.1 70.6 54.1 41.9Domestic Credit -16.9 -3.4 -15.3 9.1 27.6 8.6External Credit 3.8 4.7 7.2 20.3 18.3 49.5
Total Capital Expenditures 100.0 100.0 100.0 100.0 100.0 100.0
Sources: Court of Accounts; Budget Office; IMF and staff estimates

Table 19: NICARAGUA: Central Government Revenues and Expenditures as Percentageof Gross Domestic Product, 1961 - 1967
1961 1962 1963 1964 1965 1966 1967
I. Current Revenues 10.2 10.1 11.1 11.0 11.5 11.7 11.4
Tax revenues 9.4 9.3 10.2 10.0 10.6 10.4 10.5Direct taxes 1.2 1.1 17 -ris 2.1 2.3 2.7h
Taxes on foreign trade 5.7 5.7 5.4 4.6 4.6 4.2 4.0
Internal indirect taxes 2.5 2.5 3.2 3.8 3.9 3.9 4.1
Non-tax revenues 0.8 0.8 0.9 1.0 0,9 1e3 0.9
II. Expenditures 10.8 10.9 10.7 ll.Q 11.3 12.9 12.7
Current expenditures n.a. n.a. 7.5 7.8 8.3 8.8 9.9
Wages and salaries 4. 4 0i7 3.1 9
Other 3.1 3.4 3.5 3.7 4.0
Capital expenditures n.a. n.a. 3.2 3.2 3.0 4.1 2.8
Gross Domestic Products at currentpricesy p ~ 2.500 2.800 3.100 3.427 3.810 4.039 4.320
v Million C6rdobas
Sources: Tables 15 - 17; for GDP at current prices, IMF.

Table 20t NICARAGUA: Operations of the Central Gov Q ent andCentralized State Enterprisesi/
(Million C6rdobas)
Estimate Estimate1963 1964 1965 1966 1967_
RevenueTax Revenue 316.6 342.1 404.1 421.7 452.7Sales of goods and services 29.2 32.6 38.8Income from property 0.2 0.2 0.2Profits of Central IBank/ 5.6 8.6 6.6 9.7 7.0Transfers from decentralized agencies o.6 1.0 0.9Foreign donations 8.7 2.6 1.8 ... ...Other receipts 12.4 7.0 9.8 56.4 55.7
Tbtal 373.3 394.1 462.2 487.8 515.4(of which budgetary receipts) (343-5) (376-5) (439-4) (471.7) (493.4)
Current expenditureSalaries 157.8 174.3 193.8 206.4 260.3Other goods and services 46.5 49.9 61.4 58.3 64.8Other consumption -- -- -- 26.2 29.1
subtotal consumption 204.3 224.2 2-'. 290.9Transf'ers to decentrialized agencies 18.9 21.0 29.0Transf'ers to nonconsolidated agencies 4.3 5.6 7.5 ) 47.9 ) 84.2Transf'ers to financial institutions 6.2 4.6 7.0Other transfers 21.3 24.6 24.6 26.3Other expenditures 6.7 5.8 5.8 6.9 8.5
Total 261.8 285.8 329.1 372.0 446.9(of which budgetary expenditure) (231.5) (268.2) (316.4) 357.0 (428.2)
Current account surplus 111.5 108.3 133.1 115.8 68.5
Capital receipts -- 1.2 l.4 ... ...
Investment expenditureReal investment 74.7 89.2 100.6 128.3 89.3Loans to decentralized agencies 1.7 12.8 9.1 2.1Transl'ers to decentralized agencies 7.1 11.3 14.9 12.0Transi'ers to nonconsolidated agencies 2.2 3.6 -- 1.0 ) 31.2Transfers to financial institutions 3.0 4.5 4.6 6.5Other financial investment 7.6 6.6 3.1 14.2 _
Total 96.3 128.0 132.3 164.1 120.5,'of which budgetary expenditure) (99.0) (109.7) (115.1) (163.0) (120.5)
Over-all surplus or deficit (-) 15.2 -18.5 2.2 -48.3 -52.0
External financingLoans 15.6 21.4 25.9 40.4 35.7Amort:izations -11.3 -9.6 -7.0 -6.3 -13.6
lNet 4.3 11.8 18.9 34.1 22.1
Internal financingCentral Bank (net)! -24.7 -24.5 -37.9 20.2 37.1National Social Security Institute (net) 9.1 4.6 3.3 -1.1 11.8National Development Institute (net) -1.0 -1.0 -1.0 -1W -0.5Deposits in other institutions (inc. -) -6.9 2.2 -- --Use of trust fund balances 17.3 17.8 12.6 9.1 ...Adjustment to preceding budget -12.3 1.7 2.1 5.1Other (residual) -1.0 5.9 -0.2 -18.1 -18.5
Net -19.5 6.7 -21.1 14.2 29.9
1/ Post Offices National Radio, National Lottery, and fiscal monopolies2/ IncLudes movements of all Central Government deposits
Sources: Planning Office; Budget Office; and IMF
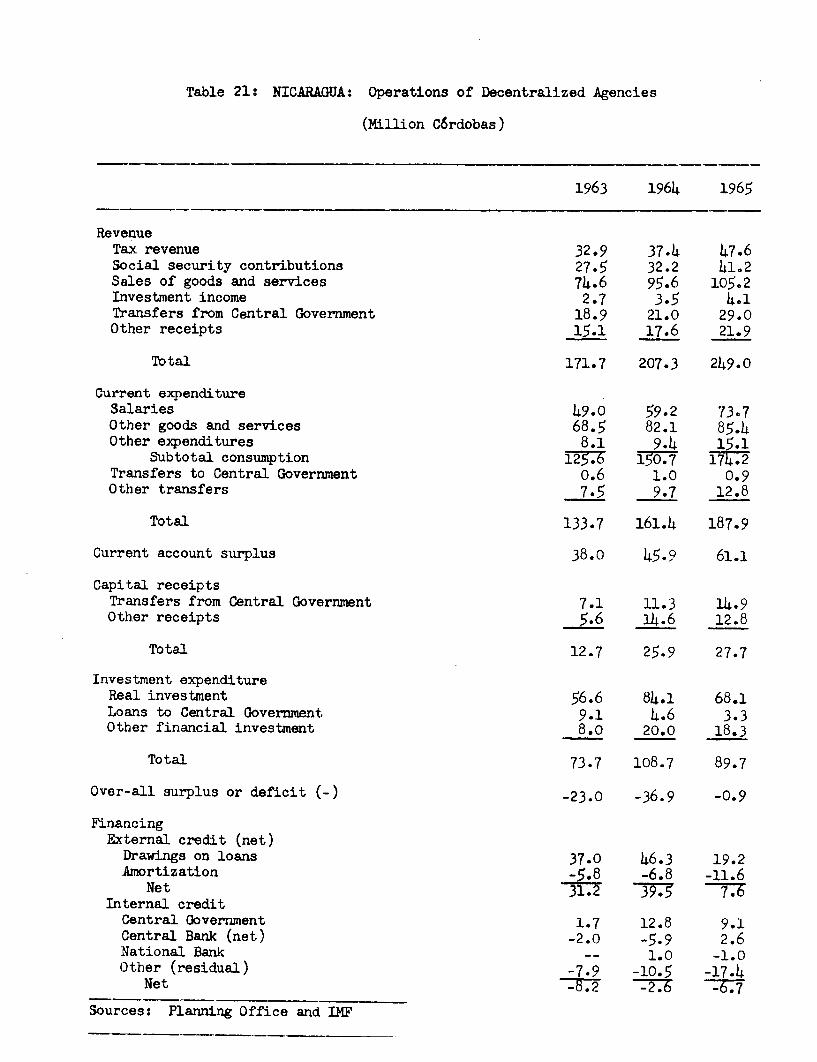
Table 21: NICARAGUA: Operations of Decentralized Agencies
(Million C6rdobas)
1963 1964 1965
RevenueTax revenue 32.9 37.4 47.6Social security contributions 27.5 32.2 41.2Sales of goods and services 74.6 95.6 105.2Investment income 2.7 3.5 4.1Transfers from Central Government 18.9 21.0 29.0Other receipts 15.1 17.6 21.9
Total 171.7 207.3 249.0
Current expenditureSalaries 49.0 59.2 73.7Other goods and services 68.5 82.1 85.4Other expenditures 8.1 9_ 4 1
Subtotal consumption 125.6 150.7Transfers to Central Government o.6 1.0 0.9Other transfers 7.5 9.7 12.8
Total 133.7 161.4 187.9
Current account surplus 38.0 45.9 61.1
Capital receiptsTransfers from Central Government 7.1 11.3 14.9Other receipts 5.6 14.6 12.8
Total 12.7 25.9 27.7
Investment expenditureReal investment 56.6 84.1 68.1Loans to Central Government 9.1 4.6 3.3Other financial investment 8.o 20.0 18.3
Total 73.7 108.7 89.7
Over-all surplus or deficit (-) -23.0 -36.9 -0.9
FinancingExternal credit (net)
Drawings on loans 37.0 46.3 19.2Amortization -8 -6.8 -11.6
Net 3395 7.6Internal credit
Central Government 1.7 12.8 9.1Central Bank (net) -2.0 -5.9 2.6National Bank -- 1.0 -1.0Other (residual) -7.9 -10.5 -17.4
Net -2 6 -6.7Sources: Planning Office and IMF

Table 22: NICARAGUA: Consolidated Public Sector Finances, 1950 - 1965
(Million C6rdobas)
Overall FinancingCurrent Revenues Current Funds available for Invest. Investment Surplus External Internal
Tax Non-tax Expendi- Current Capital Expendi- or Borrowing BorrowingRevenue Revenue Tbtal tures Surplus Receipts Total ture Deficit (net) (net)
1950 75.0 45.3 120.3 94.5 25.8 4.4 30.2 20.6 9.6 -5.8 -3.851 98.4 57.0 155.4 114.6 40.8 3.7 44.5 25.8 18.7 -2.0 -16.752 126.5 67.0 193.5 140.6 52.9 11.2 64.1 44.9 19.2 8.4 -27.653 162.3 73.5 235.8 169.1 66.7 13.6 80.3 ,5.8 24.5 2.7 -27.254 193.9 89.4 283.3 215.8 67.5 9.1 76.6 66.5 10.1 10.7 -20.855 245.4 108.5 353.9 260.8 93.1 6.8 99.9 79.1 20.8 9.7 -30.556 265.2 111.5 376.7 285.6 91.1 9.8 100.9 97.9 3.0 3.8 -6.857 263.0 114.9 377.8 306.2 71.6 16.2 87.8 120.1 -32.3 16.5 15.858 263.6 121.3 384.9 322.4 62.5 11.0 73.5 114.1 -40.6 25.3 15.359 257.1 112.1 369.2 326.9 42.3 7.6 49.9 103.0 -53.1 11.9 41.260 272.1 116.5 388.6 333.5 55.0 8.3 63.3 73.6 -10.3 3.8 6.561 276.2 120.9 397.1 347.0 50.1 7.5 57.6 96.5 -38.9 28.8 10.162 322.7 130.4 453.1 365.2 87.9 9.0 96.9 116.5 -19.6 45.5 -25.963 349.5 176.1 525.6 376.1 149.5 5.6 155.1 152.1 3.0 35.5 -32.564 381.5 198.1 579.6 425.4 154.2 15.8 170.0 208.0 -38.0 51.3 -13.365 453.0 228.3 681.3 487.1 194.2 14.2 208.4 194.7 13.7 26.5 -40.2
Sources: 1950 - 1962: Consejo Nacional de Econori{aOficina de Planificaci6n: Estudio del Sector Pdblico de Nicaragua 1950 - 19621963 - 1965: Planning Office, IMF and staff estimates

Table 23: Nicaragua: Balance of Payments, 1961 - 1967
(Million U.S. dollars)
Estimate1961 1962 1963 1964 1965 1966 1967
Exports, f.o.b. 69.9 90.4 106.6 125.5 149.2 141.9 144.0Imports, f.o.b. -58.7 -78.7 -91.0 -109.8 -132.8 -150.6 -163.0
Trade balance 11.2 11.7 15.6 15.7 16.4 -8.7 -19.0Services (net) -18.5 -25.0 -24.6 -30.2 -44.9 -47.5 -49.2Transfer payments (net) 3.8 3.5 4.1 5.4 6.5 7.0 7.0
Balance on current account -3.5 -9.8 -4.9 -9.1 -22.0 -49.2 -61.2
irect investment 6.o 5.4 4.6 9.4 8.2 12.2 13.5Medium- -and long-termborrowing (net) 3.2 5.6 l10o 13.8 8.1 18.8 23.7
Private short-term capital (net) -4.2 7.6 0.3 -4.7 2.9 2.0 4.9Subscriptions to internationalirLstitutions -0.6 -0.5 -1.2 -1.4 -0.4 -1.4 4
Capital movements 4.4 18.1 13.7 17.1 18.8 31.6 42.1
Net, errors and omissions 0.5 -4.1 -3.1 -3.0 4.0 5.6 -1.0
Net, international reserves(increase -) -1.14 -4.2 -5.7 -5.0 -0.8 12.0 20.1
Sources: International Monetary Fund, Balance of Payments Yearbook, Volume 18;Central Bank of Nicaragua; and staff estimates.

Table 24: NICARAGWA: Exports by Principal Products, 1961 - 1967
(Values in million U.S. dollars)
Estimate196) 1962 1963 1964 1965 1966 1967
CottorLValue 18.3 31.3 39.8 51.5 66.1 56.7 56.oVolume (in thousands of
bales) 141. 242 318 406 544 484 479Unit price 130 129 125 127 121 117 117
CoffeeValue 17.4 15.4 17.5 21.1 26.3 21.7 19.0Volume (in thousands of
bags) 350 344 402 389 471 388 395Unit price 50 45 44 54 56 56 48
Other exportsGold 7.7 7.3 7.1 6.9 5.4 5.2 5.0Copper ore 2.9 3.7 4.0 4.5 6.1 7.2 8.3Meat 4.1 6.0 8.4 7.5 6.7 10.2 11.0Sesame 2.4 2.0 2.2 2.3 2.1 2.0 2.3Sugar 2.8 4.5 6.o 5.7 5.5 2.1 5.7Bananas ] o.8 1.4 2.1 0.7 1.0 2.5Shrimp 1.5 1.6 1.7 2.1 3.9 4.9Cottonseed 2.6 4.6 5.2 6.6 8.7 8.2 6.oEdible oils -- -- -- 0.1 0.3 1.5 2.0Concentrated fodders -- -- -- -- 1.0 1.9 2.0Soluble coffee 2.2 3.7 3.7 4.0 2.3 1.4 0.3Lumber 2.9 2.7 2.3 2.1 1.9 2.5 2.1Manufactured goods -- ... ... 3.3 6.7 7.4 8.9Other products 6.6 7.0 7.4 58 7.0 8.8 8.0
Subtotal 34.2 43.77 49.3 D279 Z. 8 63.5 69.0
Total exports 69.9 90.4 106.6 125.2 148.9 141.7 144.0
Balance of paymentsadjustments -- -- _ 0.3 0.3 0.2 --
Total export receipts 69.9 90.4 106.6 125.5 149.2 141.9 144.0
2/ Included in "other products".
Source: Central Bank of Nicaragua

Table 25: Nicaragua: Imports by Economic Category, 1961 - 1967
(Million U.S. dollars)
Estimat1961 1962 1963 1964 1965 1966 1967
Consumer goodsDurablesj/ 7.0 9.2 11.1 14.3 15.7 17.2Nondurables 18.1 21.0 26.0 30.8 36.7 37.3
Sub-total n.a. 25.1 30.2 37.1 45.1 52.4 54.5
Raw materialsNonmetal products 31.8 34.4 41.4 47. 8 52.1 48.5Metal products 2.8 2.7 3.0 3.7 4.5 4.3
Sub-total n.a, 34.6 37.1 44.4 51.5 56.6 52.8
Capital goodsManufacturing and mining?/ 11.5 13.9 16.4 19.2 27.8 32.8Agriculture 5.5 6.2 9.0 11.2 9.3 9.7Transport andcommunications2/ 6.7 8.4 10.9 14.3 16.2 17.3
Sub-total n.a. 23.7 28.5 36.3 44.7 53.3 59.8
Fuels and lubricants n.a. 7.3 8.0 8.0 7.4 7.2 10.3
Construction materials n.a. 6.7 6.6 10.0 10.9 12.2 15.8
Other n.a. o.8 0.4 1.2 0.7 0.2 1.8
Total imports (c.i.f.) 74.4 98.2 110.8 137.0 160.3 181.9 195.0
j Includes passenger cars.j Includes electrical generating equipment.3/ Includes tractors, and other vehicles for commercial use.
Source: Central Bank of Nicaragua.

Table 26: NICARAGUA: Trade with Central America, 1961 - 1967
Estimate1961 1962 1963 196 4 1965 1966 1967
(Million U.S. dollars)
Imports (c.i.f.) from:
EL Salvador 1.4 3.1 2.4 4.2 6.7 10.0 11.7Guatemala 0.9 1.6 2.9 5.1 6.5 8.9 10.7Costa Rica 0.5 0.5 1.6 4.1 6.9 10.6 11.1Honduras 0.1 0.2 0.4 1.0 1.3 2,2 2.3
Excports (f.o.b.) to: 2.9 5.3 7.4 14.3 21.4 31.7 35.8
El Salvador 0.7 1.9 2.1 2.3 3.9 5.3 4.6Guatemala 0.1 0.4 o.6 0.7 1.7 2.3 2.2Costa Rica 0.9 1.0 1.4 2.9 4.2 5.6 7.0Honduras 0.1 0.2 o.6 1.2 2.6 3.0 3.8
Total 1.8 3.5 4.8 7.1 12.4 16.2 17.6
(As percentage of total trade)
Imports 3.9 5.4 6.7 10.4 13.3 17.4 18.3
Exports 2.6 3.9 4.5 5.7 8.3 11.4 12.2
Source: Central Bank of Nicaragua

Table 27: NICARAGUA: Drawings on Medium- and Long-Term Loans, 1961 - 1967
(Millions U.S. dollars)
Estimate1961 1962 1963 1964 1965 1966 1967
Central Government 0.5 4.0 2.7 2.8 3.3 11.2 7.9DecerLtralized agencies
Nat,ional Light and PowerCompany 1.3 2.1 5.4 5.9 1.9 2.4 2.5
Other agencies 0.4 -- -- 1.0 0.1 0.4 1.0Subtotal 1.7 2.1 -6.9 2.0 T-
Financial institutionsNat;ional Bank of Nicaragua 4.0 -- 1.3 3.9 5-0 6.4 8.0National Development
Institute -- 0.5 0.3 0.4 1.8 2.2 5.1Nicaraguan Housing Bank2/ -- 0.3 2.6 2.3 0.1 2.0 2.1
Subtotal 14.0 0.8 4.2 6. 6. 10.6 15.2Local government-s 0.3 0.2 -- -- -- -- --
Private sector 0.4 3.9 3.9 2.4 1.8 2.6 4.0Total. Drawings T979 11.0 1-67 17.7 14.0 27.2 307.Amortizations -3.7 -5.4 -6.2 -4.9 -5.9 -8.4 -6.9
Total - net drawings 3.2 5.6 lo. 13.8 8.1 18.8 23.7
/ T'hrough 1965 National Housing Institute
Source: Central. Bank, IMF, and staff estimates

Table 28: NICARAGUA: International Reserves of the Banking System, 1961 - 1967
(Millions U.S. dollars)
End of Period1961 1962 1963 1964 96 1966 196
Central BankGold and foreign exchange 13.6 17.3 31.8 38.9 57.3 58.1 27.3Net IIF position -1.7 -1.7 -7.7 -8.4 -8.4 -6.5 4.7Short-term liabilities -0.2 -0.3 -0.5 -0.7 -1.0 -2.1 -o.8
Net reserves 11.7 15.3 23.6 29.8 47.9 49.5 31.2
Other banksReserve assets 09 1. 1.8 3.2 5.3 7.0 g. Short-term liabilities 0.1 -0. -3.0 -5-6 -250 -40.3 -3.5
Net reserves 0.8 1.4 -1.2 -2.4 -19.7 -33.3 -35.2
of which:National Bank ( ) (..) (-1.2) (-3.8) (-17.2) (-27.0) (-25 8
Private banks (.) C..) (--) (1X4) (-2.5) (-6.3) (-9.4)2/
Banking system netforeign reserves 12.5 16.7 22.4 27.4 28.2 16.2 -4.o
1/ Estimate
Sourceis: Central. Bank of Nicaragua and IKF

/ r5 .'
NICARAGUA | \ E C-
ROAD NETWORK AND PROGRAM
1SS~~~~~~~~~~~~ - 0000 = QuA
C -TAL"
OTE A 70AD5 r _
4 -, RAL ROW ADHS -1-59'
_ _ _ _ ROADS UNOER CONSIQUCIION o -g) Htb 0< <
__ '
o STEP o Z xttl - 8 C O S T A R I C A
ACIA8RA 1966
I BAD-SASS