Embed Size (px)
Citation preview
Fishery Manuscript Series No. 10-06
Review of Salmon Escapement Goals in Upper Cook Inlet, Alaska, 2011
by
Lowell F. Fair,
T. Mark Willette,
Jack W. Erickson,
Richard J. Yanusz,
and
Timothy R. McKinley
December 2010
Alaska Department of Fish and Game Divisions of Sport Fish and Commercial Fisheries
Symbols and Abbreviations The following symbols and abbreviations, and others approved for the Système International d'Unités (SI), are used without definition in the following reports by the Divisions of Sport Fish and of Commercial Fisheries: Fishery Manuscripts, Fishery Data Series Reports, Fishery Management Reports, and Special Publications. All others, including deviations from definitions listed below, are noted in the text at first mention, as well as in the titles or footnotes of tables, and in figure or figure captions. Weights and measures (metric) centimeter cm deciliter dL gram g hectare ha kilogram kg kilometer km liter L meter m milliliter mL millimeter mm Weights and measures (English) cubic feet per second ft3/s foot ft gallon gal inch in mile mi nautical mile nmi ounce oz pound lb quart qt yard yd Time and temperature day d degrees Celsius °C degrees Fahrenheit °F degrees kelvin K hour h minute min second s Physics and chemistry all atomic symbols alternating current AC ampere A calorie cal direct current DC hertz Hz horsepower hp hydrogen ion activity pH (negative log of) parts per million ppm parts per thousand ppt, ‰ volts V watts W
General Alaska Administrative Code AAC all commonly accepted abbreviations e.g., Mr., Mrs.,
AM, PM, etc. all commonly accepted professional titles e.g., Dr., Ph.D., R.N., etc. at @ compass directions:
east E north N south S west W
copyright © corporate suffixes:
Company Co. Corporation Corp. Incorporated Inc. Limited Ltd.
District of Columbia D.C. et alii (and others) et al. et cetera (and so forth) etc. exempli gratia (for example) e.g. Federal Information Code FIC id est (that is) i.e. latitude or longitude lat. or long. monetary symbols (U.S.) $, ¢ months (tables and figures): first three letters Jan,...,Dec registered trademark ® trademark ™ United States (adjective) U.S. United States of America (noun) USA U.S.C. United States
Code U.S. state use two-letter
abbreviations (e.g., AK, WA)
Mathematics, statistics all standard mathematical signs, symbols and abbreviations alternate hypothesis HA base of natural logarithm e catch per unit effort CPUE coefficient of variation CV common test statistics (F, t, χ2, etc.) confidence interval CI correlation coefficient (multiple) R correlation coefficient (simple) r covariance cov degree (angular ) ° degrees of freedom df expected value E greater than > greater than or equal to ≥ harvest per unit effort HPUE less than < less than or equal to ≤ logarithm (natural) ln logarithm (base 10) log logarithm (specify base) log2, etc. minute (angular) ' not significant NS null hypothesis HO percent % probability P probability of a type I error (rejection of the null hypothesis when true) α probability of a type II error (acceptance of the null hypothesis when false) β second (angular) " standard deviation SD standard error SE variance population Var sample var
FISHERY MANUSCRIPT SERIES NO. 10-06
REVIEW OF SALMON ESCAPEMENT GOALS IN UPPER COOK INLET, ALASKA, 2011
by Lowell F. Fair
Alaska Department of Fish and Game, Division of Commercial Fisheries, Anchorage
T. Mark Willette Alaska Department of Fish and Game, Division of Commercial Fisheries, Soldotna
Jack W. Erickson
Alaska Department of Fish and Game, Division of Sport Fish, Anchorage
Richard J. Yanusz, Alaska Department of Fish and Game, Division of Sport Fish, Palmer
and
Timothy R. McKinley
Alaska Department of Fish and Game, Division of Sport Fish, Soldotna
Alaska Department of Fish and Game Division of Sport Fish, Research and Technical Services 333 Raspberry Road, Anchorage, Alaska, 99518-1565
December 2010
The Fishery Manuscript series was established in 1987 by the Division of Sport Fish for the publication of technically-oriented results of several years' work undertaken on a project to address common objectives, provide an overview of work undertaken through multiple projects to address specific research or management goal(s), or new and/or highly technical methods, and became a joint divisional series in 2004 with the Division of Commercial Fisheries. Fishery Manuscripts are intended for fishery and other technical professionals. Fishery Manuscripts are available through the Alaska State Library and on the Internet: http://www.sf.adfg.state.ak.us/statewide/divreports/html/intersearch.cfm This publication has undergone editorial and peer review.
Lowell F. Fair and Jack W. Erickson Alaska Department of Fish and Game, Division of Commercial and Sport Fisheries,
333 Raspberry Road, Anchorage, AK 99518, USA
T. Mark Willette and Timothy R. McKinley Alaska Department of Fish and Game, Division of Commercial and Sport Fisheries,
43961 Kalifornsky Beach Road, Suite B, Soldotna, AK 99669-8367, USA and
Richard J. Yanusz
Alaska Department of Fish and Game, Division of Sport Fish, 1800 Glenn Highway, Suite 4, Palmer, AK 99645-6736, USA
This document should be cited as: Fair, L. F., T. M. Willette, J. W. Erickson, R. J. Yanusz, and T. R. McKinley. 2010. Review of salmon escapement
goals in Upper Cook Inlet, Alaska, 2011. Alaska Department of Fish and Game, Fishery Manuscript Series No. 10-06, Anchorage.
The Alaska Department of Fish and Game (ADF&G) administers all programs and activities free from discrimination based on race, color, national origin, age, sex, religion, marital status, pregnancy, parenthood, or disability. The department administers all programs and activities in compliance with Title VI of the Civil Rights Act of 1964, Section 504 of the Rehabilitation Act of 1973, Title II of the Americans with Disabilities Act (ADA) of 1990, the Age Discrimination Act of 1975, and Title IX of the Education Amendments of 1972.
If you believe you have been discriminated against in any program, activity, or facility please write: ADF&G ADA Coordinator, P.O. Box 115526, Juneau, AK 99811-5526
U.S. Fish and Wildlife Service, 4401 N. Fairfax Drive, MS 2042, Arlington, VA 22203 Office of Equal Opportunity, U.S. Department of the Interior, 1849 C Street NW MS 5230, Washington DC 20240
The department’s ADA Coordinator can be reached via phone at the following numbers: (VOICE) 907-465-6077, (Statewide Telecommunication Device for the Deaf) 1-800-478-3648, (Juneau TDD) 907-
465-3646, or (FAX) 907-465-6078 For information on alternative formats and questions on this publication, please contact:
ADF&G Division of Sport Fish, Research and Technical Services, 333 Raspberry Road, Anchorage AK 99518 (907) 267-2375.
TABLE OF CONTENTS Page
LIST OF TABLES ......................................................................................................................................................... ii
LIST OF FIGURES ....................................................................................................................................................... ii
LIST OF APPENDICES ............................................................................................................................................. iii
ABSTRACT .................................................................................................................................................................. 1
INTRODUCTION ......................................................................................................................................................... 1
METHODS .................................................................................................................................................................... 3
Data Available to Define Escapement Goals ................................................................................................................. 3 Chinook Salmon ....................................................................................................................................................... 3 Chum and Coho Salmon ........................................................................................................................................... 4 Sockeye Salmon........................................................................................................................................................ 4
Escapement Goal Determination ................................................................................................................................... 6 Stock-Recruitment Analysis ..................................................................................................................................... 6
Evaluation of Kasilof River Sockeye Salmon Escapement Goal .................................................................... 6 Evaluation of Kenai River Sockeye Salmon Escapement Goal ...................................................................... 6
Yield Analysis .......................................................................................................................................................... 8 Percentile Approach .................................................................................................................................................. 8 Risk Analysis ............................................................................................................................................................ 9
RESULTS AND DISCUSSION .................................................................................................................................... 9
Chinook Salmon ............................................................................................................................................................ 9 Campbell Creek ........................................................................................................................................................ 9 Deshka River .......................................................................................................................................................... 10 Kenai River ............................................................................................................................................................. 10
Coho Salmon ............................................................................................................................................................... 11 Fish Creek ............................................................................................................................................................... 11
Sockeye Salmon .......................................................................................................................................................... 11 Kasilof River ........................................................................................................................................................... 11 Kenai River ............................................................................................................................................................. 12 Russian River Early Run ......................................................................................................................................... 13 Yentna River ........................................................................................................................................................... 14
SUMMARY ................................................................................................................................................................ 14
ACKNOWLEDGEMENTS ......................................................................................................................................... 15
REFERENCES CITED ............................................................................................................................................... 16
TABLES AND FIGURES ........................................................................................................................................... 19
APPENDIX A. SUPPORTING INFORMATION FOR UPPER COOK INLET CHINOOK SALMON ESCAPEMENT GOALS ............................................................................................................................................. 47
APPENDIX B. SUPPORTING INFORMATION FOR UPPER COOK INLET COHO SALMON ESCAPEMENT GOALS ............................................................................................................................................. 71
APPENDIX C. SUPPORTING INFORMATION FOR UPPER COOK INLET SOCKEYE SALMON ESCAPEMENT GOALS ............................................................................................................................................. 75
APPENDIX D. SUPPORTING INFORMATION FOR UPPER COOK INLET CHUM SALMON ESCAPEMENT GOALS ............................................................................................................................................. 87
i
LIST OF TABLES Table Page 1. List of members on the Alaska Department of Fish and Game Upper Cook Inlet salmon escapement
goal committee who assisted with the 2010/2011 escapement goal review. ................................................. 20 2. Summary of current escapement goals and recommended escapement goals for salmon stocks in Upper
Cook Inlet, 2010. ........................................................................................................................................... 21 3. Current escapement goals, escapements observed from 2007 through 2009 for Chinook, chum, coho,
and sockeye salmon stocks of Upper Cook Inlet. .......................................................................................... 23 4. Model parameters, negative log-likelihoods, escapements producing MSY, and 90% MSY escapement
ranges for 2 stock-recruitment models fit to the Kasilof River sockeye salmon data, brood years 1969–2005 and 1979–2005. .................................................................................................................................... 25
5. Markov yield table for Kasilof River sockeye salmon, brood years 1969–2005 (numbers in thousands of fish). .......................................................................................................................................................... 26
6. Summary of adult stock-recruitment models evaluated for Kenai River late-run sockeye salmon (brood years 1969–2005).. ........................................................................................................................................ 27
7. Summary of stock-recruitment models evaluated for Kenai River late-run sockeye salmon (brood years 1979–2005). .................................................................................................................................................. 28
8. Simulation results from a brood-interaction model for Kenai River late-run sockeye salmon (numbers of fish in thousands).. .................................................................................................................................... 29
9. Markov yield table for Kenai River late-run sockeye salmon constructed using data from brood years 1969–2005 (numbers in thousands of fish). .................................................................................................. 30
10. Summary of stock-recruitment model for Russian River early-run sockeye salmon, brood years 1970–2003. .............................................................................................................................................................. 31
LIST OF FIGURES Figure Page 1. Map of Upper Cook Inlet showing locations of the Northern and Central districts and the primary
salmon spawning drainages. .......................................................................................................................... 32 2. Campbell Creek Chinook salmon risk analysis summary showing the risk of an unwarranted
management action and the estimated risk that a drop in various levels of mean escapement would not be detected. .................................................................................................................................................... 33
3. Time series of spawner abundance (escapement), adult returns, yields, and returns-per-spawner for Kasilof River sockeye salmon, 1969–2010. .................................................................................................. 34
4. Scatter plots of Kasilof River sockeye spawner-return data (in thousands of fish), including adult returns (solid line) and yields (dashed line) predicted by the classic Ricker and autoregressive Ricker models fit to data from brood years 1969–2005 and 1979–2005.. ................................................................ 35
5. Likelihood profiles for Kasilof River sockeye salmon spawner abundances (escapements) that produced MSY estimated by the classic Ricker and autoregressive Ricker models fit to data from brood years 1969–2005 and 1979–2005. ....................................................................................................... 36
6. Kasilof River sockeye salmon yields related to spawner abundances (escapements) in brood years 1969–2005. Solid vertical lines are the recommended SEG range. .............................................................. 37
7. Time series of spawner abundance (escapement), adult returns, yields, and returns-per-spawner for Kenai River late-run sockeye salmon, 1969–2010. ....................................................................................... 38
8. Scatter plots of Kenai River late-run sockeye spawner-return data (in thousands of fish), including adult returns (solid line) and yields (dashed line) predicted by the classic Ricker model fit to data from brood years 1969–2005 and 1979–2005. ....................................................................................................... 39
9. Kenai late-run sockeye salmon (a) spawner-return data (brood years 1969–2005) plotted with spawner abundance (escapement) in brood year-1, and (b) simple brood-interaction model predicted adult returns. Numbers are in thousands of fish. ................................................................................................... 40
10. Time series of actual Kenai River late-run sockeye salmon returns and returns predicted by the classic Ricker and brood-interaction models, brood years 1969–2005. .................................................................... 41
ii
LIST OF FIGURES (Continued) Figure Page 11. Likelihood profiles for Kenai River late-run sockeye salmon spawner abundances (escapements) that
produced high sustained yields estimated by the classic Ricker and simple brood interaction models (assuming a constant escapement goal policy) fit to data from brood years 1969–2005 and 1979–2005. .... 42
12. Kenai River late-run sockeye salmon yields related to spawner abundances (escapement; in thousands of fish) in brood years 1969–2005 and the previous year (brood year -1)..................................................... 43
13. Observed number of recruits with a line of replacement plotted against escapement and fitted Ricker curve for early-run Russian River sockeye salmon, brood years 1970–2003. ............................................... 44
14. Probability that sustained yields are greater than 90% MSY at various levels of escapement using a Ricker stock-recruitment model, Russian River early run sockeye salmon. ................................................. 45
LIST OF APPENDICES Appendix Page A1. Data available for analysis of Alexander Creek Chinook salmon escapement goal. ..................................... 48 A2. Data available for analysis of Campbell Creek Chinook salmon escapement goal. ...................................... 49 A3. Data available for analysis of Chuitna River Chinook salmon escapement goal. ......................................... 50 A4. Data available for analysis of Chulitna River Chinook salmon escapement goal. ........................................ 51 A5. Data available for analysis of Clear Creek Chinook salmon escapement goal. ............................................. 52 A6. Data (by return year) available for analysis of Crooked Creek Chinook salmon escapement goal. .............. 53 A7. Data (by brood year) available for analysis of Crooked Creek Chinook salmon escapement goal. .............. 54 A8. Data available for analysis of Deshka River Chinook salmon escapement goal. .......................................... 55 A9. Data available for analysis of Goose Creek Chinook salmon escapement goal. ........................................... 56 A10. Data available for analysis of Kenai River early-run Chinook salmon escapement goal. ............................. 57 A11. Data available for analysis of Kenai River late-run Chinook salmon escapement goal. ............................... 58 A12. Data available for analysis of Lake Creek Chinook salmon escapement goal. ............................................. 59 A13. Data available for analysis of Lewis River Chinook salmon escapement goal. ............................................ 60 A14. Data available for analysis of Little Susitna River Chinook salmon escapement goal. ................................. 61 A15. Data available for analysis of Little Willow Creek Chinook salmon escapement goal. ................................ 62 A16. Data available for analysis of Montana Creek Chinook salmon escapement goal. ....................................... 63 A17. Data available for analysis of Peters Creek Chinook salmon escapement goal. ............................................ 64 A18. Data available for analysis of Prairie Creek Chinook salmon escapement goal. ........................................... 65 A19. Data available for analysis of Sheep Creek Chinook salmon escapement goal. ............................................ 66 A20. Data available for analysis of Talachulitna River Chinook salmon escapement goal. .................................. 67 A21. Data available for analysis of Theodore River Chinook salmon escapement goal. ....................................... 68 A22. Data available for analysis of Willow Creek Chinook salmon escapement goal. ......................................... 69 B1. Data available for analysis of Fish Creek coho salmon escapement goal. .................................................... 72 B2. Data available for analysis of Jim Creek coho salmon escapement goal....................................................... 73 B3. Data available for analysis of Little Susitna River coho salmon escapement goal. ....................................... 74 C1. Data available for analysis of Chelatna Lake sockeye salmon escapement goal. .......................................... 76 C2. Data available for analysis of Crescent River sockeye salmon escapement goal. ......................................... 77 C3. Data available for analysis of Fish Creek sockeye salmon escapement goal. ............................................... 78 C4. Data available for analysis of Judd Lake sockeye salmon escapement goal. ................................................ 79 C5. Data available for analysis of Kasilof River sockeye salmon escapement goal. ........................................... 80 C6. Data available for analysis of Kenai River sockeye salmon escapement goal (excludes late-run Russian
River escapement through the weir and Hidden Lake enhanced).................................................................. 81 C7. Data available for analysis of Larson Lake sockeye salmon escapement goal. ............................................. 82 C8. Data available for analysis of Packers Creek sockeye salmon escapement goal. .......................................... 83 C9. Table of data available for analysis of early-run Russian River sockeye salmon escapement goal. ............. 84 C10. Data available for analysis of late-run Russian River sockeye salmon escapement goal. ............................. 85 D1. Data available for analysis of Clearwater Creek chum salmon escapement goal. ......................................... 88
iii

iv
ABSTRACT The Alaska Department of Fish and Game interdivisional escapement goal review committee for the Southcentral Region reviewed Pacific salmon Oncorhynchus spp. escapement goals for the major river systems in Upper Cook Inlet. Escapement goals were evaluated for 21 Chinook salmon, 1 chum salmon, 3 coho salmon, and 10 sockeye salmon stocks. The committee recommended to the Commercial Fisheries and Sport Fish division directors that most escapement goals remain status quo. However, the committee recommended reinstating the previous Fish Creek coho salmon sustainable escapement goal (SEG) of 1,200–4,400 dropped during the 2004–2005 review. A risk-based lower bound SEG of 380 is proposed to replace the existing SEG range of 50–700 for the Campbell Creek Chinook salmon stock. The Kenai River sockeye salmon SEG range of 500,000–800,000 based on Bendix sonar should change to an SEG range of 700,000–1,200,000 based on DIDSON sonar, and the Kasilof sockeye salmon biological escapement goal (BEG) of 150,000–250,000 based on Bendix sonar should change to a BEG range of 160,000–340,000 based on DIDSON sonar. Due to the amount of uncertainty associated with escapement estimates, the committee recommended changing early- and late-run Kenai River Chinook salmon goal type from BEGs to SEGs. Similarly, uncertainty in Deshka River Chinook salmon commercial harvests prompted a change from a BEG to SEG-type goal. Lastly, returns from 2001 to 2003 brood years provided sufficient information to develop a BEG of 22,000–42,000 (previously an SEG of 14,000–37,000) for early-run Russian River sockeye salmon.
Key words: Upper Cook Inlet, escapement goal, biological escapement goal, BEG, sustainable escapement goal, SEG, sockeye salmon, Oncorhynchus nerka, Chinook salmon, O. tshawytscha, coho salmon, O. kisutch, chum salmon, O. keta, Alaska Board of Fisheries.
INTRODUCTION Upper Cook Inlet (UCI), Alaska, supports 5 species of Pacific salmon Oncorhynchus spp. The UCI commercial fisheries management unit consists of that portion of Cook Inlet north of Anchor Point and is divided into Central and Northern districts (Figure 1). The Central District is approximately 120 km (75 miles) long, averages 50 km (32 miles) in width, and is further subdivided into 6 subdistricts. The Northern District is 80 km (50 miles) long, averages 32 km (20 miles) in width, and is divided into 2 subdistricts. Commercial salmon fisheries primarily target sockeye salmon (O. nerka) with secondary catches of Chinook (O. tshawytscha), coho (O. kisutch), chum (O. keta), and pink (O. gorbuscha) salmon. Sport fishery management is divided into Northern Kenai Peninsula, Northern Cook Inlet, and Anchorage management areas. These areas offer diverse subsistence, commercial, personal use, and recreational fishing opportunities for all 5 species of Pacific salmon.
The Alaska Department of Fish and Game (ADF&G) reviews escapement goals for UCI salmon stocks on a schedule corresponding to the Alaska Board of Fisheries (BOF) 3-year cycle for considering area regulatory proposals. Management of these stocks is based on achieving escapements for each system within a specific escapement goal range or above a lower bound. Escapement refers to the annual estimated size of the spawning salmon stock, and is affected by a variety of factors including exploitation, predation, disease, and physical and biological changes in the environment.
This report describes UCI salmon escapement goals reviewed in 2010 and presents information from the previous 3 years in the context of these goals. The purpose of this report is to inform the BOF about the review of UCI salmon escapement goals and the review committee’s recommendations to the Commercial Fisheries and Sport Fish division directors. Many salmon escapement goals in UCI have been set and evaluated at regular intervals since statehood. Due
1
to the thoroughness of previous analyses by Bue and Hasbrouck1, Clark et al. (2007), Hasbrouck and Edmundson (2007), and Fair et al. (2007), this review reanalyzed only those goals with recent (2007–2009) data that could potentially result in a substantially different escapement goal from the last review, or those that should be eliminated or established.
ADF&G reviews escapement goals based on the Policy for the Management of Sustainable Salmon Fisheries (SSFP; 5 AAC 39.222) and the Policy for Statewide Salmon Escapement Goals (EGP; 5 AAC 39.223). The Alaska Board of Fisheries adopted these policies into regulation during the 2000/2001 cycle to ensure that the state’s salmon stocks are conserved, managed, and developed using the sustained yield principle. For this review, there are 2 important terms defined in the SSFP:
5 AAC 39.222 (f)(3) "biological escapement goal" or "(BEG)" means the escapement that provides the greatest potential for maximum sustained yield; BEG will be the primary management objective for the escapement unless an optimal escapement or inriver run goal has been adopted; BEG will be developed from the best available biological information, and should be scientifically defensible on the basis of available biological information; BEG will be determined by the department and will be expressed as a range based on factors such as salmon stock productivity and data uncertainty; the department will seek to maintain evenly distributed salmon escapements within the bounds of a BEG; and
5 AAC 39.222 (f)(36) "sustainable escapement goal" or "(SEG)" means a level of escapement, indicated by an index or an escapement estimate, that is known to provide for sustained yield over a 5 to 10 year period, used in situations where a BEG cannot be estimated or managed for; the SEG is the primary management objective for the escapement, unless an optimal escapement or inriver run goal has been adopted by the board; the SEG will be developed from the best available biological information; and should be scientifically defensible on the basis of that information; the SEG will be determined by the department and will take into account data uncertainty and be stated as either an "SEG range" or "lower bound SEG"; the department will seek to maintain escapements within the bounds of the SEG range or above the level of a lower bound SEG.
During the 2010 review process, the committee evaluated escapement goals for various Chinook, chum, coho, and sockeye salmon stocks:
• Chinook salmon: Alexander, Campbell, Clear, Crooked, Goose, Lake, Little Willow, Montana, Peters, Prairie, Sheep, and Willow creeks; and Chuitna, Chulitna, Deshka, Kenai (early and late run), Lewis, Little Susitna, Talachulitna, and Theodore rivers
• Chum salmon: Clearwater Creek
• Coho salmon: Fish and Jim creeks; and Little Susitna River
• Sockeye salmon: Fish and Packers creeks; Chelatna, Judd, and Larson lakes; and Crescent, Kasilof, Kenai, and Russian (early and late run) rivers
1 Bue, B. G. and J. J. Hasbrouck. Unpublished. Escapement goal review of salmon stocks of Upper Cook Inlet. Alaska Department of Fish and
Game, Report to the Alaska Board of Fisheries, November 2001 (and February 2002), Anchorage. Subsequently referred to as Bue and Hasbrouck (Unpublished).
2
In February 2010, ADF&G established an escapement goal review committee (hereafter referred to as the committee). The committee consisted of 9 Division of Commercial Fisheries and 11 Division of Sport Fish personnel (Table 1). The committee recommended the appropriate type of escapement goal (BEG or SEG) and provided an analysis for recommending escapement goals. All committee recommendations are reviewed by ADF&G regional and headquarters staff prior to adoption as escapement goals per the SSFP and EGP.
METHODS Available escapement, harvest, and age data for each stock were compiled from research reports, management reports, and unpublished historical databases. The committee determined the appropriate goal type (BEG or SEG) for each salmon stock with an existing goal and considered other monitored, exploited stocks without an existing goal. The committee evaluated the type, quality, and quantity of data for each stock to determine the appropriate type of escapement goal as defined in regulation. Generally speaking, an escapement goal for a stock should provide escapement that produces sustainable yields. Escapement goals for salmon are typically based on stock-recruitment relations (e.g., Beverton and Holt 1957; Ricker 1954), representing the productivity of the stock and estimated carrying capacity. In this review, the information sources for stock-recruitment models are spawner-return data. However, specific methods to determine escapement goals vary in their technical complexity, and are largely determined by the quality and quantity of the available data. Thus, escapement goals are evaluated and revised over time as improved methods of assessment and goal setting are developed, and when new and better information become available.
DATA AVAILABLE TO DEFINE ESCAPEMENT GOALS For most stocks in this review we used data through 2009. For Kenai and Kasilof river sockeye salmon, however, we used data through 2010 because part of their runs originated from very large, and potentially influential escapements in the mid-2000s. Estimates or indices of salmon escapement were obtained with a variety of methods such as foot and aerial surveys, mark–recapture experiments, weir counts, and hydroacoustics (sonar). Weir data tends to be the most reliable assessment tool, providing a count of the total number of fish in the escapement. Depending on its location, mark–recapture and sonar projects typically provide the next most reliable abundance estimates. Differences in methods among years can affect the comparability and reliability of data. Data available for escapement goal analysis for all UCI stocks are found in this report (Appendices A–D).
Chinook Salmon Escapements for most Chinook salmon stocks in UCI have been monitored by single aerial (rotary wing or helicopter) or foot surveys. Such surveys provide an index of escapement. The indices are a measurement that provides information only about the relative level of escapement. These measurements provide a ranking of escapement magnitude across years, but alone these measurements provide little information on the total number of fish in the escapement. Hydroacoustics (sonar) were used to assess early- and late-run Chinook salmon inriver runs to the Kenai River (Miller et al. 2010). An associated gillnetting program samples Chinook salmon to estimate age, sex, and size composition (Eskelin 2010). Since 1995, a weir project counts and samples the Deshka River Chinook salmon escapement, although previously (1974–1994) it was indexed annually by single aerial surveys. To estimate total escapement for those early years, we
3
expanded aerial surveys using their relationship to weir counts (Yanusz In prep). A weir project also operates on Crooked Creek to count and sample Chinook salmon (Begich and Pawluk 2007).
Chum and Coho Salmon Peak aerial fixed-wing surveys are used to index escapement of chum salmon in Clearwater Creek, the only chum salmon stock in UCI monitored by ADF&G (Tobias and Willette 2010). For coho salmon stocks, escapements are monitored with single foot surveys on Jim Creek and weirs on Fish Creek and Little Susitna River (Bue and Hasbrouck Unpublished).
Sockeye Salmon Sonar is used to estimate sockeye salmon abundance passing specific locations in the Crescent, Kasilof, Kenai, and Yentna rivers where high glacial turbidity precludes visual enumeration (Westerman and Willette 2010). In 2002, studies compared salmon abundance estimated using the historical Bendix sonar and the more modern dual-frequency identification sonar (DIDSON; Maxwell and Gove 2007). Similar comparison studies occurred on the Kenai River from 2004 to 2007, and on the Kasilof River from 2007 to 2009. For this review, to revise Kenai and Kasilof abundance estimates from Bendix sonar to DIDSON, regression equations relating the daily estimates (Maxwell et al. In prep) developed from comparison studies adjusted historical daily Bendix sonar abundance to DIDSON units. Next, we estimated daily sockeye salmon abundance from sonar and fish wheel catches. We used mean annual ratios between the 2 sonar estimates (Kasilof=1.022, Kenai=1.406) to adjust annual sockeye salmon abundance prior to 1979 on the Kenai and prior to 1983 on the Kasilof because daily sonar estimates were unavailable by bank and sonar configurations were different. Sonar counts are apportioned to species using fish wheel catches, which also supply information about age, sex, and size (Westerman and Willette 2010). Beginning in 2010, the Yentna River sonar project ceased producing salmon estimates for inseason management, although the project continues operating to determine if it is feasible to reconstruct the historical record of escapements measured with a Bendix sonar (Maxwell et al. In prep) while adjusting for species selectivity.
In clear-water systems of UCI, fish are counted with weirs or video cameras. Weirs are used to count and sample adult sockeye salmon escapements in the Susitna River drainage (Chelatna, Judd, and Larson lakes; Fair et al. 2009), Russian River (Begich and Pawluk 2007), and Fish Creek (Oslund and Ivey 2010). Historically at Packers Creek, escapement has been counted with both video cameras and weirs. In 2009 and 2010, we operated a video camera to estimate escapement (Shields 2010).
The Kasilof River sockeye salmon escapement goal is based on reconstructions of the total return by brood year, and the total number of sockeye salmon spawning (wild and hatchery) within the watershed. Escapement is estimated by subtracting (a) the number of sockeye salmon harvested in recreational fisheries upstream of the sonar site, and (b) when applicable, the number of sockeye salmon removed for hatchery brood stock from the sockeye salmon sonar count. The sonar has operated near the Tustumena Lake outlet from 1968 to 1982 and at rkm 12.1 immediately upstream of the Sterling Highway bridge since 1983 (Figure 1). Although sockeye salmon hatchery stocking has occurred in the Kasilof system, hatchery fish were not removed from the total return estimate. The hatchery run to the Kasilof River averaged about 32,000 fish, or 3–6% of the total return. However, the last adults returned from the 2004 Tustumena Lake fry release (Shields 2007) in 2010.
4
The Kenai River late-run sockeye salmon escapement goal is based on reconstructions of the total return by brood year, and the number of wild sockeye salmon spawning within the watershed. Escapement is estimated by subtracting (a) the number of sockeye salmon harvested in recreational fisheries upstream of the sonar site, and (b) the number of hatchery-produced sockeye salmon passing the Hidden Creek weir from the sockeye salmon sonar (measured at rkm 30.9) count (Tobias and Willette 2010). The number of sockeye salmon harvested in recreational fisheries upstream of the sonar site is estimated annually using the Statewide Harvest Survey (SWHS; Jennings et al. 2010) and creel surveys (1994, 1995) conducted during the fishery (King 1995, 1997). Prior to 1999, we estimated the number of hatchery-produced sockeye salmon passing the Hidden Creek weir from the ratio of hatchery to wild smolt by brood year (Tobias and Willette 2010); after 1999, it was determined from the recovery of otolith thermal-marked salmon.
Commercial catch statistics are compiled from ADF&G fish ticket information. The majority of sockeye salmon returning to UCI are caught in mixed stock fisheries (Shields 2010). Prior to 2005, a weighted age composition apportionment model estimated stock-specific harvests of sockeye salmon in commercial gillnet fisheries (Tobias and Willette 2010). This method assumes age-specific exploitation rates are equal among stocks in the gillnet fishery (Bernard 1983) and is dependent upon accurate and precise escapement measures for all contributing stocks. Harvest allocation for each stock was estimated by harvest location and age composition. The age composition catch apportionment method utilizes 4 data types: (1) commercial harvests, (2) escapements into major UCI drainages, (3) age composition of harvests, and (4) age composition of escapements. Since 2006, the primary means for estimating stock-specific sockeye salmon harvests has been the use of genetic markers (Habicht et al. 2007; Barclay et al. 2010). Sockeye salmon harvest age composition is estimated annually using a stratified systematic sampling design (Tobias and Willette 2010). A minimum sample (n=403) of readable scales is sufficient to estimate sockeye salmon age composition in each stratum within 5% of the true proportion 90% of the time (Thompson 1987). Estimates of sport harvest originate from the postal SWHS conducted annually by the Division of Sport Fish (Jennings et al. 2010).
DIDSON-adjusted historical escapement estimates for Kasilof and Kenai river sockeye salmon were used to construct brood tables for these 2 stocks using the weighted age composition apportionment model (Tobias and Tarbox 1999) beginning with brood year 1969. Genetic stock-specific harvest estimates (2006–2009) were incorporated into the brood tables (Barclay et al. 2010) by assuming that the age composition of stock-specific harvests was the same as stock-specific escapements (i.e., no age-dependent gear selectivity). Because the catch allocation model uses escapements for all major UCI sockeye salmon stocks (Kenai, Kasilof, Susitna, Crescent, Fish Creek, and unmonitored stocks) and because historical Bendix sonar estimates may not reliably index Susitna sockeye salmon abundances (Fair et al. 2009), we used mark–recapture estimates of Susitna sockeye salmon escapement (Yanusz et al. 2007; Yanusz et al. In prep a-b) for 2006–2009, and an average of these escapement estimates for the years prior to 2006 in the weighted age composition apportionment model. For the 2010 sockeye salmon run estimates, the catch allocation model used DIDSON estimates for Kenai and Kasilof, and a 4-year average (2006–2009) mark–recapture estimate for Susitna River sockeye salmon escapement.
5
ESCAPEMENT GOAL DETERMINATION For the purposes of this review, all references to “significance” use an alpha-level of 0.05.
Stock-Recruitment Analysis We used a Ricker (1954) stock-recruitment model to estimate maximum sustainable yield (MSY) and develop escapement goal ranges. Results were not used if the model fit the data poorly (p≥0.20) or model assumptions were violated. Hilborn and Walters (1992), Quinn and Deriso (1999), and the CTC (1999) provide clear descriptions of the Ricker model and diagnostics to assess model fit. We tested all stock-recruitment models for serial correlation of residuals, and corrected them when necessary. Additionally, the Ricker α parameter was corrected for the logarithm transformation bias induced into the model as described in Hilborn and Walters (1992) from fitting a linear regression line to ln(recruits/spawners) versus spawners.
We fit additional stock-recruitment models (described below) to examine stock productivity and evaluate escapement goals for Kenai and Kasilof river sockeye salmon, similar to Clark et al. (2007).
Evaluation of Kasilof River Sockeye Salmon Escapement Goal We applied the same methods used in a previous Kasilof River sockeye salmon escapement goal review (Hasbrouck and Edmundson 2007) to the updated brood table (Appendix C5) described above. We conducted 2 different analyses to examine the fit of 2 stock-recruitment models. In the first analysis, we fit the 2 models to data from brood years 1969–2005 (i.e., all available spawner-return data). In the second analysis, we fit the 2 models to data from brood years 1979–2005 because more consistent methods were used to estimate sockeye salmon escapements, age compositions, and total returns during this period.
We first fit a classic Ricker model to the Kasilof stock-recruitment data:
Rt = St exp(α – βSt + ε)
where Rt is number of recruits, St is number of spawners, α is a density-independent parameter, β is a density-dependent parameter, and t indicates the brood year. Next, we examined serial correlation in process error with a lag of one year using a time series regression of the simple model. In this autoregressive Ricker model, process errors are not independent, but serially dependent on process error from the previous brood year:
Rt = St exp(α – βSt + φεt-1)
where φ is a lag-1 autoregressive parameter. Adjustments to αln for asymmetric log-normal process error were applied and calculated as described by Clark et al. (2007). We evaluated model fits using likelihood ratio tests for hierarchal models (Hilborn and Mangel 1997). Escapement goal ranges were derived that provided for 90–100% of MSY.
MSYS
Evaluation of Kenai River Sockeye Salmon Escapement Goal Following methods from a previous Kenai River sockeye salmon escapement goal review (Clark et al. 2007), we conducted 2 different analyses to examine the fit of 7 stock-recruitment models to the DIDSON-adjusted spawner-return data (Appendix C6). In the first set, we fit the 7 models to data from brood years 1969–2005 because these data were used in earlier stock-recruitment analyses for this system (Carlson et al. 1999; Clark et al. 2007). In the second set, we fit the 7
6
models to data from brood years 1979–2005 because more consistent methods were used to estimate sockeye salmon escapements, age compositions, and total returns for all major UCI river systems during this period. In both sets of analyses, we first fit a general Ricker model that provides for depensation at low stock size and compensation at high stock size (Reisch et al. 1985; Hilborn and Walters 1992; Quinn and Deriso 1999):
( )tttt SSR εβαγ +−= exp ,
where Rt is number of recruits, St is number of wild spawners, α is a density-independent parameter, γ and β are density-dependent parameters, and t indicates the brood year. In all models, density-independent survival is given by εt, which is assumed to be a random variable with a mean of zero and a constant variance, σ2. When γ<1, the stock-recruitment curve is dome shaped like the Ricker model (Quinn and Deriso 1999). Depensation is indicated if γ is significantly greater than 1.0. Hilborn and Walters (1992) suggest that γ should be 2.0 or larger for strong depensatory effects. The classic Ricker model (Ricker 1954, 1975) is a special case when β<0 and γ=1, and the autoregressive Ricker model includes serial dependence of process error from the previous brood year as previously described.
The Cushing model (Cushing 1971, 1973) is a special case when β=0 and γ >0:
ttt SR εα γ += .
However, the Cushing model is not used much in practice because it predicts infinite recruitment for infinite spawning stock (Quinn and Deriso 1999). The case when γ ≤0 does not correspond to a valid stock-recruitment model because it does not go through the origin (Quinn and Deriso 1999).
Several authors have examined density-dependent models that include interaction terms between brood-year spawners and prior year spawners with lags from 1–3 years (Ward and Larkin 1964; Larkin 1971; Collie and Walters 1987; and Welch and Noakes 1990). However, Myers et al. (1997) examined data from 34 sockeye salmon stocks and found no evidence for brood interactions at lags exceeding one year. We fit the Kenai River sockeye salmon data to a modified Ricker model (Clark et al. 2007) used by many of these investigators with only a 1-year lag:
( )ttttt SSSR εββα +−−= −121exp
where St-1 is spawners from the previous year. We then used a general Ricker model (Clark et al. 2007) with brood-interaction that also included a statistical interaction (multiplicative) term between brood year spawners (St) and spawners from the previous brood year (St-1):
[ ]ttttttt SSSSSR εβββαγ +−−−= −− 13121exp .
To develop the most parsimonious brood-interaction model, we utilized a stepwise multiple regression procedure. The F and t statistics aided the selection of variables for inclusion in the model. To provide a comparison of fit among models, we calculated the coefficient of determination and model P-values by regressing observed on predicted recruits (natural logarithm transformed). Akaike’s Information Criteria (AIC; Akaike 1973) compared goodness of fit among models.
The current SEG was based on a brood-interaction simulation model (Carlson et al. 1999) and Markov yield analysis (Fried 1999). We ran 2 sets of simulations using brood-interaction model
7
parameters obtained from 2 different regression analyses applied to the full and reduced data sets as previously described. Each set consisted of 29 simulations of the population dynamics of the stock over 1,000 generations. In each simulation, the number of spawners remained constant, i.e., a constant escapement goal policy. Escapement was incremented by 50,000 spawners from a range of 100,000 to 1,500,000 (n=29 simulations).
The current SEG of 500,000–800,000 based on simulation results indicates that escapements maintained within this range sustain high yields and have a low probability (about once every 20 years) of producing poor yields less than 1,000,000 sockeye salmon (Fried 1999). This corresponded to a <6% risk level in the simulation. As in the original analysis, we estimated mean yield, the coefficient of variation of yields, and the probabilities of yields <1 million. Escapement goal ranges corresponding to a <6% risk (about once every 20 years) of a yield <1 million sockeye salmon and 90–100% of MSY (assuming a constant escapement goal policy) are compared.
Yield Analysis For the Kenai River sockeye salmon stock, Clark et al. (2007) conducted a Markov yield analysis (Hilborn and Walters 1992) to further evaluate the escapement goal range. In this review, we developed a Markov yield table for Kenai and Kasilof river sockeye salmon data sets. We constructed the yield table by partitioning the data into overlapping intervals of 100,000 (Kasilof) or 200,000 (Kenai) spawners. The mean numbers of spawners, mean returns, mean return per spawner, mean yield, and the range of yields were calculated for each interval of spawner abundance. A more simplistic approach that was also employed examined a plot of the relationship between yield and spawners, looking for escapements that on average produce the highest yields.
Percentile Approach Many salmon stocks in UCI have an SEG developed using the percentile approach. In 2001, Bue and Hasbrouck (Unpublished) developed an algorithm using percentiles of observed escapements, whether estimates or indices, that incorporated contrast in the escapement data and exploitation of the stock. Percentile ranking is the percent of all escapement values that fall below a particular value. To calculate percentiles, escapement data are ranked from the smallest to the largest value, with the smallest value the 0th percentile (i.e., none of the escapement values are less than the smallest). The percentile of all remaining escapement values is cumulative, or a summation, of 1/(n-1), where n is the number of escapement values. Contrast in the escapement data is the maximum observed escapement divided by the minimum observed escapement. As contrast increases, meaning more information about the run size are known, the percentiles used to estimate the SEG are narrowed, primarily from the upper end, to better utilize the yields from the larger runs. For exploited stocks with high contrast, the lower end of the SEG range is increased to the 25th percentile as a precautionary measure for stock protection:
Escapement Contrast and Exploitation SEG Range Low Contrast (<4) 15th Percentile to maximum observation Medium Contrast (4 to 8) 15th to 85th Percentile High Contrast (>8); Low Exploitation 15th to 75th Percentile High Contrast (>8); Exploited Population 25th to 75th Percentile
8
For this review, the SEG ranges of all stocks with existing percentile-based goals were re-evaluated using the percentile approach with updated or revised escapement data. If the estimated SEG range was consistent with the current goal (i.e., a high degree of overlap), the committee recommended no change to the goal.
Risk Analysis For stocks that are passively managed and coincidentally harvested, we calculated lower bound SEGs following methods outlined in Bernard et al. (2009). For this review, Campbell Creek Chinook salmon was the only applicable stock. Although the risk analysis approach to setting escapement goals has not previously been applied to UCI stocks, it is common practice for other areas of Alaska (Munro and Volk 2010). In essence, recommended lower bound SEGs are chosen based on minimizing risk for triggering an unwarranted management concern and an approximately equal risk of failing to detect the maximum allowed percentage drop in mean escapement.
The escapement time series was first log-transformed and tested for deviations from normality using a one-sample Kolmogorov-Smirov test. The log-transformed escapement time series did not contain serial correlation, so further modeling was unnecessary. Because the BOF meets on a 3-year cycle for each regulatory area, the number of consecutive years to warrant a management action (k) was set at 3. For consistency with other risk-based goals in Central Region (Bristol Bay, Cook Inlet, and Prince William Sound), recommended escapement thresholds were chosen based on an estimated risk of 15% or less for triggering an unwarranted management action and an approximately equal risk of failing to detect the maximum percentage drop in mean escapement.
RESULTS AND DISCUSSION From this review, the majority of salmon escapement goals in UCI remain unchanged (Table 2). The committee recommended changes to 3 BEGs and one SEG of the total 21 goals for Chinook salmon, one of the 3 SEGs for coho salmon, and one BEG and 2 SEGs of the 10 sockeye salmon goals. Details on the recommendations are provided below. Only stocks having goals that were modified, added, or deleted since the previous review are discussed in this section. Any goals not listed here remained status quo. Munro and Volk (2010) provide a comprehensive review of goal performance from 2001 to 2009 (for 2007–2009, see Table 3).
CHINOOK SALMON Campbell Creek In 1993 ADF&G established an escapement threshold of 250 Chinook salmon for Campbell Creek, prior to any legal harvests. In 2002 the threshold became an SEG of 50–700 Chinook salmon. During the 2004/2005 review, the goal was eliminated because no fishery existed. In January of 2005 however, the BOF created a small youth-only fishery, warranting an escapement goal. Therefore, ADF&G re-instated the SEG of 50–700 during the 2007/2008 review. In this review, we developed a lower bound SEG of 380 using risk analysis because Campbell Creek Chinook salmon are passively managed (i.e., postseason assessment of escapement coupled with low harvest rate).
Foot survey escapement data for Campbell Creek Chinook salmon have been collected sporadically since 1958. The risk analysis only used data since 1982 (Appendix A2) because
9
prior to this, survey methodology was inconsistent (Appendix A2). The 1982–2009 (n=25) average escapement is 701 (SD=283). A lower bound SEG of 380 (autocorrelation not detected) results in a 1% estimated risk of an unwarranted management action, with a 1% estimated risk that a drop in mean escapement of 90% (Figure 2) will not be detected in 3 years. Similar to other risk-based goals, the desire is to maintain the median escapement at 730.
Deshka River ADF&G has indexed Deshka River Chinook salmon escapements with single aerial surveys in most years since 1974 (Appendix A8). However, a weir project started in 1995 has been the cornerstone for inseason management of this fishery. The relationship between weir and aerial counts from 1995 to 2009 was used to estimate the escapements from 1974 to 1994, when only aerial surveys were done. In 2002 an updated stock-recruitment model using expanded aerial surveys prompted a change from a point goal of 17,500, established in 1999, to a BEG of 13,000–28,000 (Bue and Hasbrouck Unpublished).
For this review, uncertainty in Deshka River Chinook salmon marine harvests has prompted a recommended change from a BEG to SEG-type goal, although the range of 13,000–28,000 remains the same. When calculating total return for brood tables, Deshka River Chinook salmon average harvest from the Statewide Harvest Survey (Jennings et al. 2010) is typically used as an estimate of sport harvest, while marine harvest is estimated by taking a proportion of the combined catches in the Northern District directed commercial setnet, Tyonek subsistence, and Kustatan Subdistrict commercial setnet fisheries. That proportion is the aerial survey of the Deshka Chinook salmon escapement divided by the sum of all aerial Chinook salmon in the Northern Cook Inlet area (Oslund and Ivey 2010). This approach assumes that Northern Cook Inlet area stocks are equally vulnerable to these fisheries. The sources of uncertainty in this procedure probably centers on the estimation of the proportion, calculated using single aerial surveys, which tend to be biased and highly variable from the true abundance (Jones et. al 1998; Holt and Cox 2008), and the assumption of equal exploitation. Other factors that affect aerial survey abundance estimates, and hence the estimated proportion of Deshka River Chinook salmon, are differences in stream morphology and the lack of assessment for all Chinook salmon systems. The sport harvest may also be biased, as a substantial portion of the sport fishing effort appears to be located at the confluence of the Deshka and Susitna rivers, possibly causing some of the Deshka River reported harvest to contain migrating Chinook salmon from stocks bound farther up the Susitna River.
Kenai River Two stocks of Chinook salmon return to the Kenai River to spawn, classified as early (Appendix A10) and late (Appendix A11) runs. In 2005 the early-run BEG of 7,200–14,400 changed to 4,000–9,000 (McKinley and Fleischman 2010). The late-run BEG of 17,800–35,700 has not changed since 1999.
Since 1988, sonar (dual- and split-beam) has been the primary means of estimating inriver run. Results of a comprehensive research program initiated in the mid-1990s indicate that the current estimates based on split-beam sonar are subject to substantial measurement error and bias. In addition, mixed-stock harvest estimates for the late run in the commercial eastside setnet fishery and Deep Creek marine recreational fishery introduce additional uncertainty into estimates of total run.
10
Studies have concluded that DIDSON sonar and genetic stock identification (GSI) techniques have much promise for improved estimates of abundance and harvest composition. Plans are currently being developed for a transition to, and developing escapement goals for management based on, DIDSON-based estimates of abundance. In the interim, based on the amount of uncertainty associated with current abundance estimates, the committee recommended changing early- and late-run Kenai River Chinook salmon BEGs to SEGs.
COHO SALMON Fish Creek
In most years since 1969, ADF&G counted Fish Creek coho salmon with a weir (Appendix B1). In 1994 ADF&G established a point goal of 2,700. The goal was changed to an SEG of 1,200–4,400 in 2002 (Bue and Hasbrouck Unpublished) and dropped in 2005 (Hasbrouck and Edmundson 2007) because the weir was no longer operated during the coho salmon migration. In 2009 and 2010, funding obtained by a grant from the U.S. Fish and Wildlife Service allowed weir operations to continue through the coho salmon migration. Because future funding opportunities may allow weir operations through the entire coho salmon run, we recommended that the previous SEG of 1,200–4,400 be reinstated.
SOCKEYE SALMON Kasilof River The current BEG of 150,000–250,000 was implemented in 1986. Results from this review use DIDSON as the estimate of inriver abundance. Over the past 42 years, Kasilof River sockeye salmon escapement ranged from approximately 39,000 to 522,000 (Figure 3, Appendix C5). During this same time span, recruit/spawner values ranged from approximately 0.7 to 8.4 (Figure 3). The classic Ricker model had significant fits to the DIDSON-adjusted Kasilof spawner-return data with both the full (1969–2005: R2=0.243, P=0.002) and reduced (1979–2005: R2=0.295, P=0.003) datasets. However, analysis of model residuals showed significant lag-1 autocorrelation. Likelihood ratio tests demonstrated that an autoregressive Ricker model provided the best fit, and escapements that provided for 90–100% of MSY were 160,000–340,000 based on the full dataset and 160,000–350,000 based on the reduced dataset (Table 4, Figure 4). The narrower likelihood profiles of escapements that produced MSY also indicated the autoregressive Ricker model best described the stock-recruitment relationship for this stock (Figure 5). A Markov yield table (Table 5, Figure 6) predicts escapements ranging from 160,000–340,000 will produce yields averaging approximately 760,600 (range 340,100–1,598,500), whereas escapements below this range will produce yields averaging approximately 344,000 (range: 64,000–629,900), and escapements above this range will produce yields averaging 649,100 (range: -138,200–1,257,300).
The committee recommended that the Kasilof River sockeye salmon BEG be set at 160,000–340,000 spawners as modeled using the full data set. This goal range is also supported by higher producing yields from the raw data (Figure 6). The primary advantage of using the full data set is that it includes small escapements (<100,000), giving it greater contrast and more information for model development. This escapement goal will be assessed with DIDSON.
11
Kenai River ADF&G adopted the current escapement goal range of 500,000–800,000 in 1999. In 2005 the goal changed from a BEG to an SEG (Clark et al. 2007). The goal does not include hatchery-produced sockeye salmon passing through the Hidden Creek weir. Results from this review use DIDSON as the estimate of inriver abundance.
Over the past 43 years, Kenai River sockeye salmon escapements ranged from about 73,000 to about 2.0 million (Figure 7, Appendix C6). During this same time span, recruit/spawner estimates ranged from approximately 1.4 to 12.7 (Figure 7). The second highest estimated escapement level occurred in 1987 and produced recruits at the rate of about 5 to 1, while a similar escapement in 1989 produced recruits at a rate of about 2 to 1. The highest estimate of recruits/spawner (12.7) came from the 1982 escapement (755,413).
Using the full data set, 1969–2005, the general Ricker model was significant (P<0.001) for the Kenai sockeye salmon spawner-return data. However, the density-dependent parameter (β) did not significantly differ from zero (P=0.157), and γ was not different from one (P=0.897; Table 6). For the classic Ricker model (Figure 8), β was significantly different from zero (P=0.004), but a lag-1 autoregressive (φ) parameter was not significant (P=0.079; Table 6). The density-dependent parameter (γ) in the Cushing model significantly differed from one (P=0.014). Finally, the density-dependent parameters in the classic Ricker model with a single brood-interaction term (Carlson et al. 1999) did not significantly differ from zero (P≥0.100). A stepwise regression procedure revealed a brood-interaction model describing the stock-recruitment relationship. The β parameter was significantly different from zero (P=0.006) in a 3-parameter model, but γ was not significantly different from one (P=0.824). A simplified 2-parameter brood-interaction model best described (P<0.001) the stock-recruitment relationship for this stock (Table 6, Figure 9). The improved fit of the simple brood-interaction model over the classic Ricker was primarily due to brood years 1988–1990, which followed the largest escapements ever observed in 1987 and 1989 (Figure 10). The improved fit of the simple brood-interaction model was also due to brood years 2004 and 2005, produced by the 3rd and 5th largest escapements.
Using the 1979–2005 data, the Ricker and Cushing models did not fit the spawner-return data for Kenai River sockeye salmon (Table 7). For the classic Ricker model, β was significantly different from zero (P=0.016), but the R2 for a regression of observed versus predicted adult returns was only 0.06. For the autoregressive Ricker model, β did not significantly differ from zero (P=0.839), but the lag-1 autoregressive parameter was significantly different from zero (P=0.003). For the autoregressive Ricker model, the R2 for a regression of observed versus predicted adult returns increased to 0.23, and the likelihood ratio test demonstrated a significant (P<0.05) improvement in model fit over the classic Ricker model. For the classic Ricker model with a single brood-interaction term, the first density-dependent parameter (β1) did not significantly differ from zero (P=0.088), but β2 was different from zero (P=0.021). As before, a stepwise regression procedure revealed a simplified 2-parameter brood-interaction model that best fit the spawner-return data (Table 7). Likelihood profiles of escapements that produced high sustained yields further showed the simple brood interaction model as the best described stock-recruitment relationship for this stock (Figure 11).
Applying the same criteria (<6% risk of a yield <1 million sockeye salmon) used to establish the current SEG (Carlson et al. 1999), simulations of the brood-interaction model using parameters
12
from analysis of the 1969–2005 data suggest a goal range of 650,000–950,000 (Table 8). Simulations using parameters from analysis of the 1979–2005 data suggest a goal range of 500,000–1,000,000. Using escapements that represent 90–100% MSY (1969–2005: MSY = 3,103,000; 1979–2005: MSY = 3,378,000), the ranges were 700,000–1,200,000 and 650,000–1,100,000 spawners for the full and reduced data sets (Table 8).
A simple 2-parameter brood-interaction model (Carlson et al. 1999) best fit the Kenai River sockeye salmon spawner-return data based on R2 and AIC values (Tables 6 and 7). Edmundson et al. (2003) hypothesized that brood interactions likely result from food limitation and subsequent mortality of fry immediately following emergence and during the first winter. Large fry populations from the previous brood year cause reduced copepod (zooplankton) density the following spring, limiting food resources for subsequent fry. The effect that fry grazing on copepod biomass has the following spring is caused by the 2-year lifecycle of the dominant copepod species in this system.
Using the full data set (1969–2005), a Markov yield analysis indicated highest (>3.9 million) mean yields occur within a range of 600,000–900,000 spawners (Table 9), and that escapements from 500,000–1,200,000 also produce high (>2.3 million) yields. Escapements below 400,000 salmon never produced yields exceeding 948,000. The highest yields (Figure 12) originated from escapements of 755,000, 792,000, and 1,983,000 sockeye salmon (brood years 1982, 1983, and 1987). When escapements exceeded 900,000, yields were highly variable, ranging from 513,000–8,396,000. In this updated data set, 4 year classes (2002–2005) were added to the upper escapement interval (Appendix C6). Yield from the 2002 year class (2,543,500) was above average (2,459,400), whereas yields from 2003 to 2005 year classes (513,500, 1,551,300, and 1,003,300) were below average. This pattern of reduced yield from consecutive large escapements is consistent with the brood interaction observed in brood years 1987–1990.
We recommend that the Kenai River late-run sockeye salmon SEG be set at 700,000–1,200,000 spawners as estimated using the brood-interaction model fit to the full data set. The related inriver goal will be assessed with DIDSON. The range approximately represents the escapement that on average will produce 90–100% of MSY. We also recommend using the 90–100% range to set the SEG because it results in a broader interval with the highest predicted yield near its center. Basing a goal range from a model’s prediction of escapements that produce 90–100% MSY is common practice throughout Alaska. Finally, this goal is supported by a plot of yield versus escapement, showing that escapements in this range generally produce the highest yields (Figure 12).
Russian River Early Run The Russian River sockeye salmon early run has an SEG of 14,000–37,000, developed in the 2001/2002 review using the 25th and 75th percentile of the 1965–2000 weir escapement data. We currently have escapement, total return, and exploitation data for 40 years (1970–2009; Appendix C9).
During the 2007 escapement goal review, inclusion of escapement data for the past 6 years into the original SEG percentile analysis resulted in a slight increase in both the lower and upper values of the SEG range due to large escapements between 2001–2006 that were in excess of the upper goal range. During this same review, a Ricker model was fit to the brood year data (1970–1999); however, the β parameter was not significant, probably because the large escapements from 2001 to 2006 were not included since their brood years were still incomplete. Therefore,
13
the goal remained status quo because the committee believed that returns from these larger escapements may provide better information to estimate SMSY in the near future as more data are added.
During this review, the committee’s recommendation was to revise the Russian River early-run sockeye salmon escapement goal based on a stock-recruitment analysis. Returns from large escapements from 2001 to2003 provided a fit to estimate the Ricker β parameter, and hence, SMSY (Table 10). To develop a revised escapement goal range we bootstrapped (1,000 replications) the residuals of the Ricker model (1970–2003 brood years) to estimate the uncertainty of all parameters and calculations, including the range that produced 90% or more of MSY; the model estimated SMSY at 36,255 (Figure 13). The outcome of the simulation was the probability of achieving 90% or more of MSY for a range of escapements (Figure 14). Given the strong defining shape of the 90% probability curve and the desire to include SMSY within the goal range, an appropriate escapement goal is 22,000–42,000. Escapements within this range have a probability greater than 40% of producing sustained yields at least 90% of MSY. Lastly, the committee recommended changing the goal from an SEG to a BEG because the new range of escapements includes SMSY and has the greatest probability of producing the highest and most consistent expected sustained yields.
Yentna River Prior to 2009, Yentna River sockeye salmon had a sonar-based SEG of 90,000–160,000, adopted in 2001. Considerable uncertainty was associated with the sonar escapement assessment and productivity of the stock (Fair et al. 2009), which was designated as a stock of yield concern by the BOF in 2008. A thorough review of the goal determined it to be inappropriate given the escapement uncertainties associated with the Bendix sonar program. In particular, based on mark-recapture studies since 2006, comparisons between Bendix sonar and DIDSON, weir counts from various lakes in the Yentna River drainage, and previous studies suggesting pink salmon are more vulnerable to fish wheels than other salmon, we believe that the most likely cause of historically inaccurate Bendix-based sockeye salmon abundance estimates is the fish wheel species apportionment program. Hence, we applied the percentile approach to escapement information for Chelatna, Judd, and Larson lakes within the Susitna River drainage to establish 3 new SEGs (Fair et al. 2009). We eliminated the Yentna River sockeye salmon SEG and replaced it with 2 SEGs represented by Chelatna (20,000–65,000) and Judd (25,000–55,000) lakes. Additionally, for the Susitna River mainstem, we developed a Larson Lake SEG of 15,000–50,000 spawners.
SUMMARY The committee recommended that most escapement goals for UCI salmon stocks remain status quo (Table 2). Through their respective time frames, data in the appendices were used in the review of escapement goals and development of SEGs of UCI salmon stocks in 2001 (Bue and Hasbrouck Unpublished), 2004 (Clark et al. 2007; Hasbrouck and Edmundson 2007), 2007 (Fair et al. 2007), and in this review.
In summary, the escapement goal committee reviewed 34 UCI salmon escapement goals with recommendations to reinstate one previous goal, change one goal from an SEG range to a lower bound SEG, change the ranges of 2 goals, change 3 goals from BEGs to SEGs, and, change one goal from an SEG to a BEG and its range.
14

ACKNOWLEDGEMENTS The authors wish to thank the members of the escapement goal committee and participants in the escapement goal review. We also recognize all the hard work both in the field and from the office that has gone into collecting the vast amount of data upon which these goals are based.
15
REFERENCES CITED Akaike, H. 1973. Information theory and an extension of the maximum likelihood principle. 2nd. Int. Symp. Inf.
Theory (B.N. Petrov and F. Csaki, eds.). Budapest: Akademiai Kiado: 267–281.
Barclay, A. W., C. Habicht, W. D. Templin, H. A. Hoyt, T. Tobias, and T. M. Willette. 2010. Genetic stock identification of Upper Cook Inlet sockeye salmon harvest, 2005-2008. Alaska Department of Fish and Game, Fishery Manuscript No. 10-01, Anchorage.
Begich, R. N., and J. A. Pawluk. 2007. 2007 Recreational fisheries overview and historic information for North Kenai Peninsula: fisheries under consideration by the Alaska Board of Fisheries, February 2008. Alaska Department of Fish and Game, Fishery Management Report No. 07-66, Anchorage.
Bernard, D. R. 1983. Variance and bias of catch allocations that use the age composition of escapements. Alaska Department of Fish and Game, Division of Commercial Fisheries, Informational Leaflet No. 227, Anchorage.
Bernard, D. R., J. J. Hasbrouck, B. G. Bue, and R. A. Clark. 2009. Estimating risk of management error from precautionary reference points (PRPs) for non-targeted salmon stocks. Alaska Department of Fish and Game, Special Publication No. 09-09, Anchorage.
Beverton, R. J. H., and S. J. Holt. 1957. On the dynamics of exploited fish populations. Fisheries Investment Series 2, Vol. 19 U.K. Ministry of Agriculture and Fisheries, London.
Carlson, S. R., K. E. Tarbox, and B. G. Bue. 1999. The Kenai sockeye salmon simulation model: a tool for evaluating escapement and harvest levels. Alaska Department of Fish and Game, Division of Commercial Fisheries, Regional Information Report 2A99-08, Anchorage.
Clark, J. H., D. M. Eggers, and J. A. Edmundson. 2007. Escapement goal review for Kenai River late-run sockeye salmon: Report to the Alaska Board of Fisheries, January 2005. Alaska Department of Fish and Game, Special Publication No. 07–12, Anchorage.
Collie, J. S., and C. J. Walters. 1987. Alternative recruitment models of Adams River sockeye salmon, Oncorhynchus nerka. Canadian Journal of Fisheries and Aquatic Sciences. 44: 1551–1561.
CTC (Chinook Technical Committee). 1999. Maximum sustained yield of biologically sustained escapement goals for selected Chinook stocks used by the Pacific Salmon Commission's Joint Technical Committee for escapement assessment, Volume 1. Pacific Salmon Commission Joint Technical Committee Report No. TCCHINOOK (99)-3, Vancouver, British Columbia, Canada.
Cushing, D. H. 1971. Dependence of recruitment on parent stock in different groups of fishes. Journal du Conseil. Conseil International pour l'Exloration de la Mer. 33: 340–362.
Cushing, D.H. 1973. Dependence of recruitment on parent stock. Journal of the Fisheries Research Board of Canada. 30: 1965–1976.
Edmundson, J. A., T. M. Willette, J. M. Edmundson, D. C. Schmidt, S. R. Carlson, B. G. Bue, and K. E. Tarbox. 2003. Sockeye salmon overescapement (Kenai River component). Exxon Valdez Restoration Project 96258A-1 Final Report 49p.
Eskelin, A. 2010. Chinook salmon creel survey and inriver gillnetting study, lower Kenai River, Alaska, 2007. Alaska Department of Fish and Game, Fishery Data Series No. 10-63, Anchorage.
Fair, L. F., R. A. Clark, and J. J. Hasbrouck. 2007. Review of salmon escapement goals in Upper Cook Inlet, Alaska, 2007. Alaska Department of Fish and Game, Fishery Manuscript No. 07-06, Anchorage.
Fair, L. F, T. M. Willette, and J. W. Erickson. 2009. Escapement goal review for Susitna River sockeye salmon, 2009. Alaska Department of Fish and Game, Fishery Manuscript Series No. 09-01, Anchorage.
Fried, S. M. 1999. Upper Cook Inlet Pacific salmon biological escapement goal review: department findings and recommendations to the Alaska Board of Fisheries. Alaska Department of Fish and Game, Commercial Fisheries Division, Regional Information Report 2A99-05, Anchorage.
16
REFERENCES CITED (Continued) Habicht, C., W.D. Templin, T.M Willette, L. F. Fair, S. W. Raborn, and L. W. Seeb. 2007. Postseason stock
composition analysis of Upper Cook Inlet sockeye salmon harvest, 2005–2007. Alaska Department of Fish and Game, Fishery Manuscript No. 07-07, Anchorage.
Hasbrouck, J. J., and J. A. Edmundson. 2007. Escapement goals for salmon stocks in Upper Cook Inlet, Alaska: report to the Alaska Board of Fisheries, January 2005. Alaska Department of Fish and Game, Special Publication No. 07-10, Anchorage.
Hilborn, R., and C. J. Walters. 1992. Quantitative fisheries stock assessment. Chapman and Hall, New York.
Hilborn, R. and M. Mangel. 1997. The Ecological Detective: Confronting Models with Data. Princeton University Press, Princeton, N.J.
Holt, K. R., and S. P. Cox. 2008. Evaluation of visual survey methods for monitoring Pacific salmon (Oncorhynchus spp.) escapement in relation to conservation guidelines. Canadian Journal Fisheries and Aquatic Science 65:212–226.
Jennings, G. B., K. Sundet, and A. E. Bingham. 2010. Estimates of participation, catch, and harvest in Alaska sport fisheries during 2007. Alaska Department of Fish and Game, Fishery Data Series No. 10-02, Anchorage.
Jones, E. L., T. J. Quinn, and B. W. Van Alen. 1998. Observer accuracy and precision in aerial and foot survey counts of pink salmon in a Southeast Alaska stream. North American Journal of Fisheries Management 18:832–846.
King, M. A. 1995. Fishery surveys during the recreational fishery for late-run sockeye salmon in the Kenai River, 1994. Alaska Department of Fish and Game, Sport Fish Division, Fishery Data Series No. 95-28, Anchorage.
King, M. A. 1997. Fishery surveys during the recreational fishery for late-run sockeye salmon in the Kenai River, 1995. Alaska Department of Fish and Game, Division of Sport Fish, Fishery Data Series No. 97-4, Anchorage.
Larkin, P. A. 1971. Simulation studies of the Adams River sockeye salmon, Oncorhynchus nerka. Journal of Fisheries Research Board of Canada. 28:1493–1502.
Maxwell, S. L., A. V. Faulkner, L. F. Fair, and X. Zhang. In prep. A comparison of estimates from 2 hydroacousic systems used to assess sockeye salmon escapement in 5 Alaskan rivers. Alaska Department of Fish and Game, Fishery Manuscript, Anchorage.
Maxwell, S. L., and N. E. Gove. 2007. Assessing a dual-frequency identification sonar’s fish counting accuracy, precision, and turbid river range capability. Journal of the Acoustical Society of America 122(6):3364-3377.
McKinley, T. R., and S. J. Fleischman. 2010. Stock assessment of early-run Chinook salmon in the Kenai River, 2002–2006. Alaska Department of Fish and Game, Fishery Data Series No. 10-19, Anchorage.
Miller, J. D. D. L. Burwen, and S. J. Fleischman. 2010. Estimates of Chinook salmon passage in the Kenai River using split-beam sonar, 2006. Alaska Department of Fish and Game, Fishery Data Series No. 10-40, Anchorage.
Myers, R. A., M. J. Bradford, J. M. Bridson, and G. Mertz. 1997. Estimating delayed density-dependent mortality in sockeye salmon (Oncorhynchus nerka): a meta-analysis approach. Canadian Journal of Fisheries and Aquatic Sciences. 54: 2449–2462.
Munro, A. R., and E. C. Volk. 2010. Summary of Pacific salmon escapement goals in Alaska with a review of escapements from 2001 to 2009. Alaska Department of Fish and Game, Special Publication No. 10-12, Anchorage.
Oslund, S. and S. Ivey. 2010. Recreational fisheries of Northern Cook Inlet, 2009-2010: Report to the Alaska Board of Fisheries, February 2011. Alaska Department of Fish and Game, Fishery Management Report No. 10-50, Anchorage.
Quinn, T. J., II, and R. Deriso. 1999. Quantitative fish dynamics. Oxford University Press, New York.
Reisch, R. L., R. B. Deriso, D. Ruppert, and R. J. Carroll. 1985. An investigation of the population dynamics of Atlantic menhaden (Brevoortia tyrannus). Canadian Journal of Fisheries and Aquatic Sciences. 42:147–157.
Ricker, W. E. 1954. Stock and recruitment. Journal of Fisheries and Research Board of Canada 11:559–623.
17
18
REFERENCES CITED (Continued) Ricker, W.E. 1975. Computation and interpretation of biological statistics of fish populations. Bulletin of the
Fisheries Research Board of Canada. Bulletin 191. 382 p.
Shields, P. 2007. Upper Cook Inlet commercial fisheries annual management report, 2007. Alaska Department of Fish and Game, Fishery Management Report No. 07-64, Anchorage.
Shields, P. 2010. Upper Cook Inlet commercial fisheries annual management report, 2009. Alaska Department of Fish and Game, Fishery Management Report No. 10-27, Anchorage.
Thompson, S. K. 1987. Sample size for estimating multinomial proportions. American Statistician. 41: 42–46.
Tobias, T., and K. E. Tarbox. 1999. An estimate of total return of sockeye salmon to Upper Cook Inlet, Alaska 1976–1998. Alaska Department of Fish and Game, Commercial Fisheries Division, Regional Information Report 2A99-11, Anchorage.
Tobias, T. M., and T. M. Willette. 2010. Abundance, age, sex, and size of Chinook, sockeye, coho and chum salmon returning to Upper Cook Inlet, Alaska, 2008. Alaska Department of Fish and Game, Fishery Data Series No. 10-42, Anchorage.
Ward, F. J., and P. A. Larkin. 1964. Cyclic dominance in Adams River sockeye salmon. International Pacific Salmon Fisheries Commission Progress Report. 11: 166 p.
Welch, D. W. and D. J. Noakes. 1990. Cyclic dominance and the optimal escapement of Adams River sockeye salmon (Oncorhynchus nerka). Canadian Journal of Fisheries and Aquatic Sciences 47:838–849.
Westerman, D. L., T. M. Willette. 2010. Upper Cook Inlet salmon escapement studies, 2008. Alaska Department of Fish and Game, Fishery Data Series No. 10-16, Anchorage.
Yanusz, R. In prep. Productivity of the Deshka River Chinook salmon stock during 1974 to 2003. Alaska Department of Fish and Game, Fishery Data Series, Anchorage.
Yanusz, R., R. Merizon, M. Willette, D. Evans, and T. Spencer. In prep a. Inriver abundance and distribution of spawning Susitna River sockeye salmon Oncorhynchus nerka, 2007. Alaska Department of Fish and Game, Fishery Data Series, Anchorage.
Yanusz, R., R. Merizon, M. Willette, D. Evans, and T. Spencer. In prep b. Inriver abundance and distribution of spawning Susitna River sockeye salmon Oncorhynchus nerka, 2008. Alaska Department of Fish and Game, Fishery Data Series, Anchorage.
Yanusz, R., R. Merizon, D. Evans, M. Willette, T. Spencer, and S. Raborn. 2007. Inriver abundance and distribution of spawning Susitna River sockeye salmon Oncorhynchus nerka, 2006. Alaska Department of Fish and Game, Fishery Data Series No. 07-83, Anchorage.

TABLES AND FIGURES
19
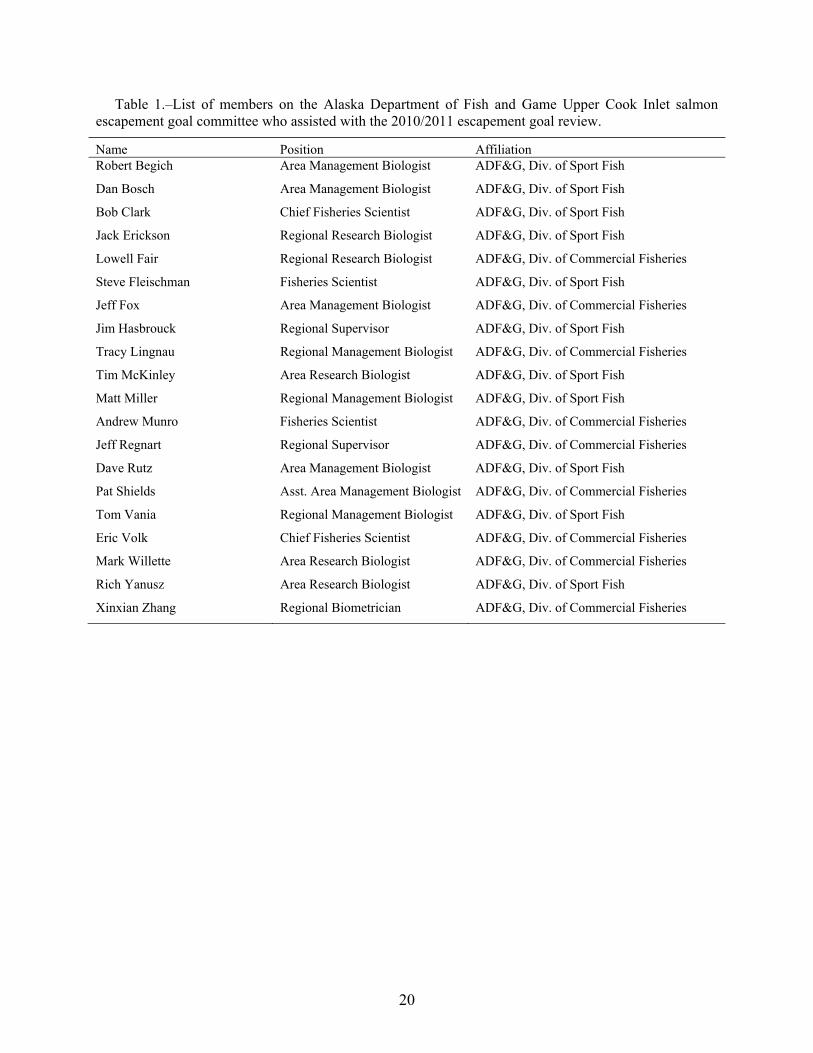
Table 1.–List of members on the Alaska Department of Fish and Game Upper Cook Inlet salmon escapement goal committee who assisted with the 2010/2011 escapement goal review.
Name Position Affiliation Robert Begich Area Management Biologist ADF&G, Div. of Sport Fish
Dan Bosch Area Management Biologist ADF&G, Div. of Sport Fish
Bob Clark Chief Fisheries Scientist ADF&G, Div. of Sport Fish
Jack Erickson Regional Research Biologist ADF&G, Div. of Sport Fish
Lowell Fair Regional Research Biologist ADF&G, Div. of Commercial Fisheries
Steve Fleischman Fisheries Scientist ADF&G, Div. of Sport Fish
Jeff Fox Area Management Biologist ADF&G, Div. of Commercial Fisheries
Jim Hasbrouck Regional Supervisor ADF&G, Div. of Sport Fish
Tracy Lingnau Regional Management Biologist ADF&G, Div. of Commercial Fisheries
Tim McKinley Area Research Biologist ADF&G, Div. of Sport Fish
Matt Miller Regional Management Biologist ADF&G, Div. of Sport Fish
Andrew Munro Fisheries Scientist ADF&G, Div. of Commercial Fisheries
Jeff Regnart Regional Supervisor ADF&G, Div. of Commercial Fisheries
Dave Rutz Area Management Biologist ADF&G, Div. of Sport Fish
Pat Shields Asst. Area Management Biologist ADF&G, Div. of Commercial Fisheries
Tom Vania Regional Management Biologist ADF&G, Div. of Sport Fish
Eric Volk Chief Fisheries Scientist ADF&G, Div. of Commercial Fisheries
Mark Willette Area Research Biologist ADF&G, Div. of Commercial Fisheries
Rich Yanusz Area Research Biologist ADF&G, Div. of Sport Fish
Xinxian Zhang Regional Biometrician ADF&G, Div. of Commercial Fisheries
20
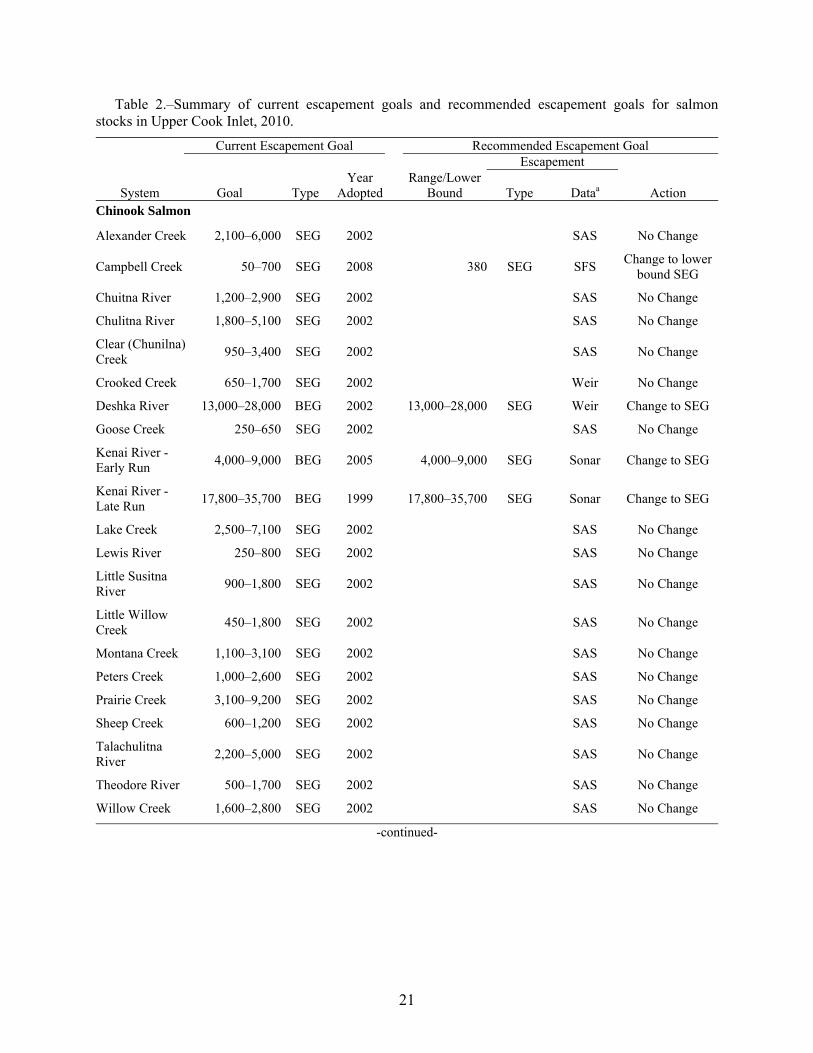
Table 2.–Summary of current escapement goals and recommended escapement goals for salmon stocks in Upper Cook Inlet, 2010.
Current Escapement Goal Recommended Escapement Goal Escapement
System Goal Type Year
Adopted Range/Lower
Bound Type Dataa Action Chinook Salmon
Alexander Creek 2,100–6,000 SEG 2002 SAS No Change
Campbell Creek 50–700 SEG 2008 380 SEG SFS Change to lower bound SEG
Chuitna River 1,200–2,900 SEG 2002 SAS No Change
Chulitna River 1,800–5,100 SEG 2002 SAS No Change
Clear (Chunilna) Creek 950–3,400 SEG 2002 SAS No Change
Crooked Creek 650–1,700 SEG 2002 Weir No Change
Deshka River 13,000–28,000 BEG 2002 13,000–28,000 SEG Weir Change to SEG
Goose Creek 250–650 SEG 2002 SAS No Change
Kenai River - Early Run 4,000–9,000 BEG 2005 4,000–9,000 SEG Sonar Change to SEG
Kenai River - Late Run 17,800–35,700 BEG 1999 17,800–35,700 SEG Sonar Change to SEG
Lake Creek 2,500–7,100 SEG 2002 SAS No Change
Lewis River 250–800 SEG 2002 SAS No Change
Little Susitna River 900–1,800 SEG 2002 SAS No Change
Little Willow Creek 450–1,800 SEG 2002 SAS No Change
Montana Creek 1,100–3,100 SEG 2002 SAS No Change
Peters Creek 1,000–2,600 SEG 2002 SAS No Change
Prairie Creek 3,100–9,200 SEG 2002 SAS No Change
Sheep Creek 600–1,200 SEG 2002 SAS No Change
Talachulitna River 2,200–5,000 SEG 2002 SAS No Change
Theodore River 500–1,700 SEG 2002 SAS No Change
Willow Creek 1,600–2,800 SEG 2002 SAS No Change
-continued-
21
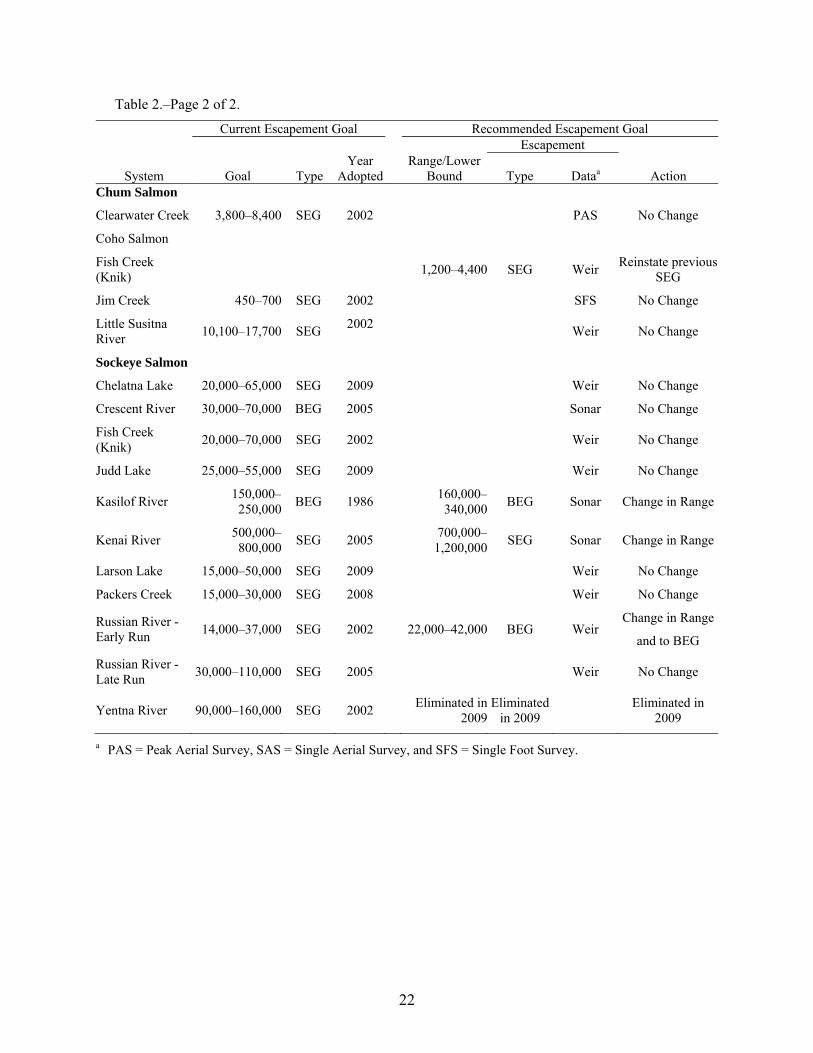
Table 2.–Page 2 of 2.
Current Escapement Goal Recommended Escapement Goal Escapement
System Goal Type Year
Adopted Range/Lower
Bound Type Dataa Action Chum Salmon
Clearwater Creek 3,800–8,400 SEG 2002 PAS No Change
Coho Salmon
Fish Creek (Knik) 1,200–4,400 SEG Weir Reinstate previous
SEG
Jim Creek 450–700 SEG 2002 SFS No Change
Little Susitna River 10,100–17,700 SEG 2002 Weir No Change
Sockeye Salmon
Chelatna Lake 20,000–65,000 SEG 2009 Weir No Change
Crescent River 30,000–70,000 BEG 2005 Sonar No Change
Fish Creek (Knik) 20,000–70,000 SEG 2002 Weir No Change
Judd Lake 25,000–55,000 SEG 2009 Weir No Change
Kasilof River 150,000–250,000 BEG 1986 160,000–
340,000 BEG Sonar Change in Range
Kenai River 500,000–800,000 SEG 2005 700,000–
1,200,000 SEG Sonar Change in Range
Larson Lake 15,000–50,000 SEG 2009 Weir No Change
Packers Creek 15,000–30,000 SEG 2008 Weir No Change
Russian River - Early Run 14,000–37,000 SEG 2002
22,000–42,000 BEG Weir
Change in Range
and to BEG
Russian River - Late Run 30,000–110,000 SEG 2005 Weir No Change
Yentna River 90,000–160,000 SEG 2002 Eliminated in 2009
Eliminated in 2009 Eliminated in
2009
a PAS = Peak Aerial Survey, SAS = Single Aerial Survey, and SFS = Single Foot Survey.
22
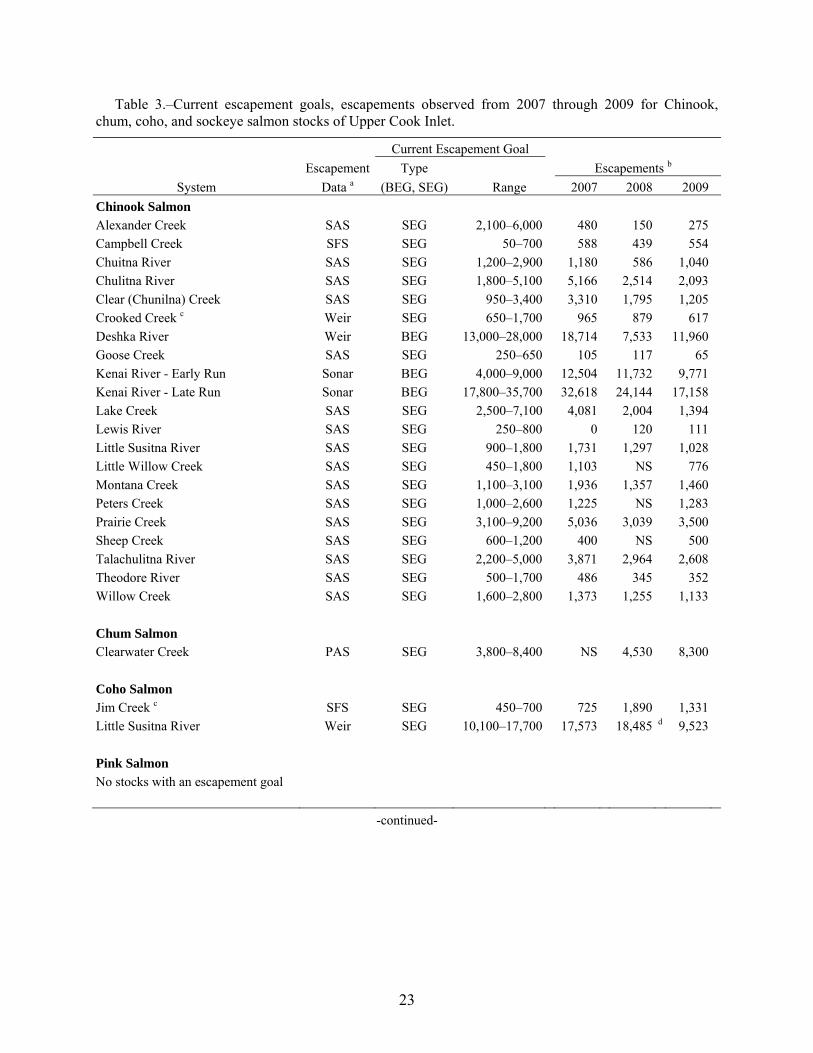
23
Table 3.–Current escapement goals, escapements observed from 2007 through 2009 for Chinook, chum, coho, and sockeye salmon stocks of Upper Cook Inlet.
Current Escapement Goal Escapement Type Escapements b
System Data a (BEG, SEG) Range 2007 2008 2009 Chinook Salmon Alexander Creek SAS SEG 2,100–6,000 480 150 275 Campbell Creek SFS SEG 50–700 588 439 554 Chuitna River SAS SEG 1,200–2,900 1,180 586 1,040 Chulitna River SAS SEG 1,800–5,100 5,166 2,514 2,093 Clear (Chunilna) Creek SAS SEG 950–3,400 3,310 1,795 1,205 Crooked Creek c Weir SEG 650–1,700 965 879 617 Deshka River Weir BEG 13,000–28,000 18,714 7,533 11,960 Goose Creek SAS SEG 250–650 105 117 65 Kenai River - Early Run Sonar BEG 4,000–9,000 12,504 11,732 9,771
Kenai River - Late Run Sonar BEG 17,800–35,700 32,618 24,144 17,158 Lake Creek SAS SEG 2,500–7,100 4,081 2,004 1,394 Lewis River SAS SEG 250–800 0 120 111 Little Susitna River SAS SEG 900–1,800 1,731 1,297 1,028 Little Willow Creek SAS SEG 450–1,800 1,103 NS 776 Montana Creek SAS SEG 1,100–3,100 1,936 1,357 1,460 Peters Creek SAS SEG 1,000–2,600 1,225 NS 1,283 Prairie Creek SAS SEG 3,100–9,200 5,036 3,039 3,500 Sheep Creek SAS SEG 600–1,200 400 NS 500 Talachulitna River SAS SEG 2,200–5,000 3,871 2,964 2,608 Theodore River SAS SEG 500–1,700 486 345 352 Willow Creek SAS SEG 1,600–2,800 1,373 1,255 1,133 Chum Salmon Clearwater Creek PAS SEG 3,800–8,400 NS 4,530 8,300 Coho Salmon Jim Creek c SFS SEG 450–700 725 1,890 1,331 Little Susitna River Weir SEG 10,100–17,700 17,573 18,485 d 9,523 Pink Salmon No stocks with an escapement goal
-continued-
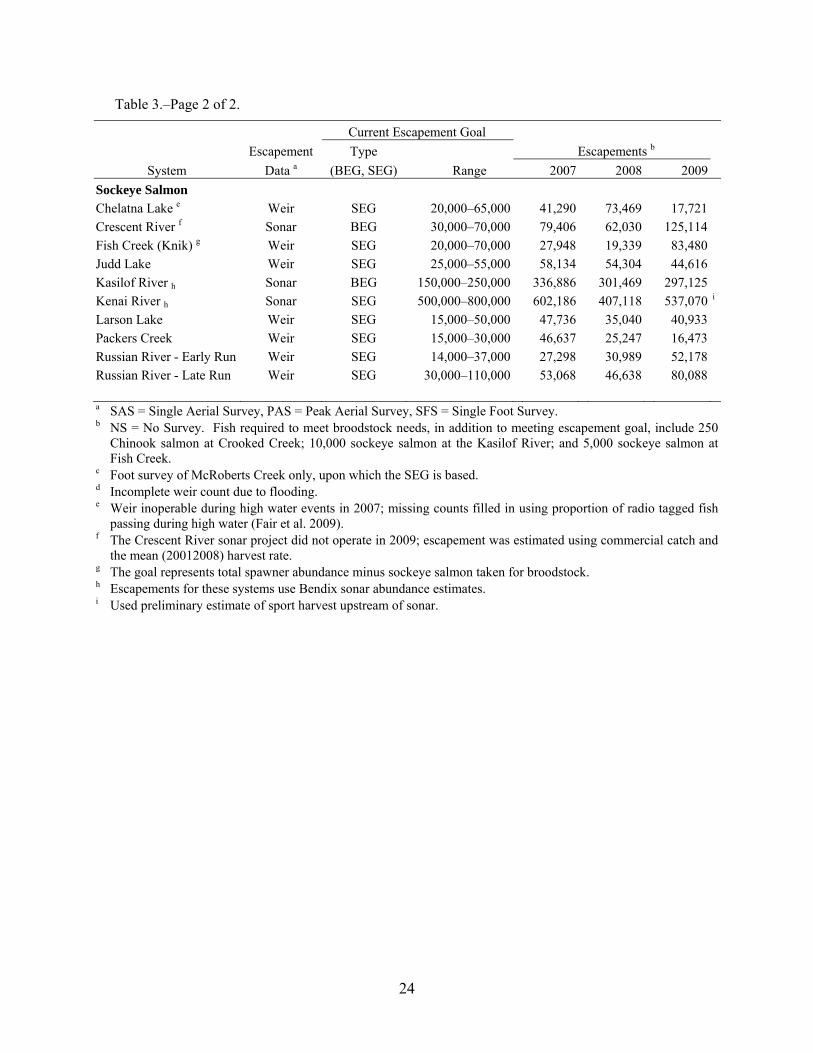
Table 3.–Page 2 of 2.
Current Escapement Goal Escapement Type Escapements b
System Data a (BEG, SEG) Range 2007 2008 2009 Sockeye Salmon Chelatna Lake e Weir SEG 20,000–65,000 41,290 73,469 17,721 Crescent River f Sonar BEG 30,000–70,000 79,406 62,030 125,114 Fish Creek (Knik) g Weir SEG 20,000–70,000 27,948 19,339 83,480 Judd Lake Weir SEG 25,000–55,000 58,134 54,304 44,616 Kasilof River h Sonar BEG 150,000–250,000 336,886 301,469 297,125 Kenai River h Sonar SEG 500,000–800,000 602,186 407,118 537,070 i
Larson Lake Weir SEG 15,000–50,000 47,736 35,040 40,933 Packers Creek Weir SEG 15,000–30,000 46,637 25,247 16,473 Russian River - Early Run Weir SEG 14,000–37,000 27,298 30,989 52,178 Russian River - Late Run Weir SEG 30,000–110,000 53,068 46,638 80,088 a SAS = Single Aerial Survey, PAS = Peak Aerial Survey, SFS = Single Foot Survey. b NS = No Survey. Fish required to meet broodstock needs, in addition to meeting escapement goal, include 250
Chinook salmon at Crooked Creek; 10,000 sockeye salmon at the Kasilof River; and 5,000 sockeye salmon at Fish Creek.
c Foot survey of McRoberts Creek only, upon which the SEG is based. d Incomplete weir count due to flooding. e Weir inoperable during high water events in 2007; missing counts filled in using proportion of radio tagged fish
passing during high water (Fair et al. 2009). f The Crescent River sonar project did not operate in 2009; escapement was estimated using commercial catch and
the mean (20012008) harvest rate. g The goal represents total spawner abundance minus sockeye salmon taken for broodstock. h Escapements for these systems use Bendix sonar abundance estimates. i Used preliminary estimate of sport harvest upstream of sonar.
24
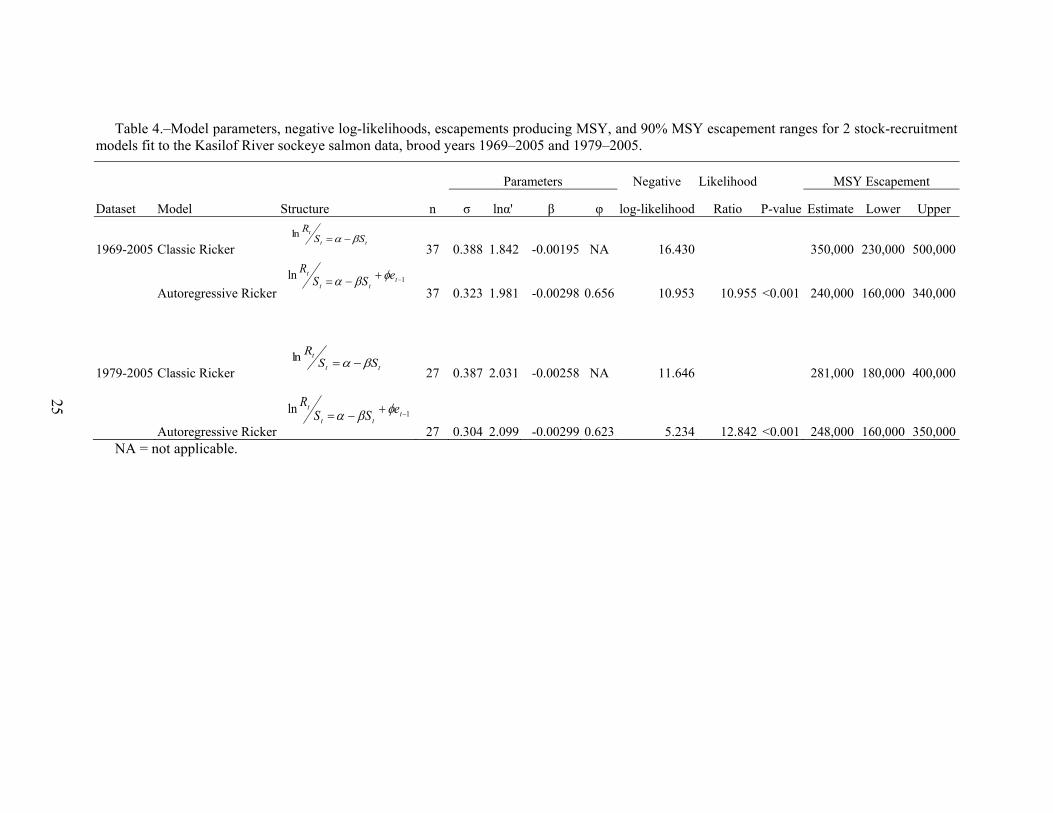
Table 4.–Model parameters, negative log-likelihoods, escapements producing MSY, and 90% MSY escapement ranges for 2 stock-recruitment models fit to the Kasilof River sockeye salmon data, brood years 1969–2005 and 1979–2005.
Parameters Negative Likelihood MSY Escapement
Dataset Model Structure n σ lnα' β φ log-likelihood Ratio P-value Estimate Lower Upper
1969-2005 Classic Ricker
37 0.388 1.842 -0.00195 NA 16.430 350,000 230,000 500,000
Autoregressive Ricker
37 0.323 1.981 -0.00298 0.656 10.953 10.955 <0.001 240,000 160,000 340,000
1979-2005 Classic Ricker 27 0.387 2.031 -0.00258 NA 11.646 281,000 180,000 400,000
Autoregressive Ricker
27 0.304 2.099 -0.00299 0.623 5.234 12.842 <0.001 248,000 160,000 350,000
tt
tSS
Rβα −=ln
1ln −+−= ttt
t eSSR φβα
tt
tSS
Rβα −=ln
1ln −+−= ttt
t eSSR φβα
25
NA = not applicable.
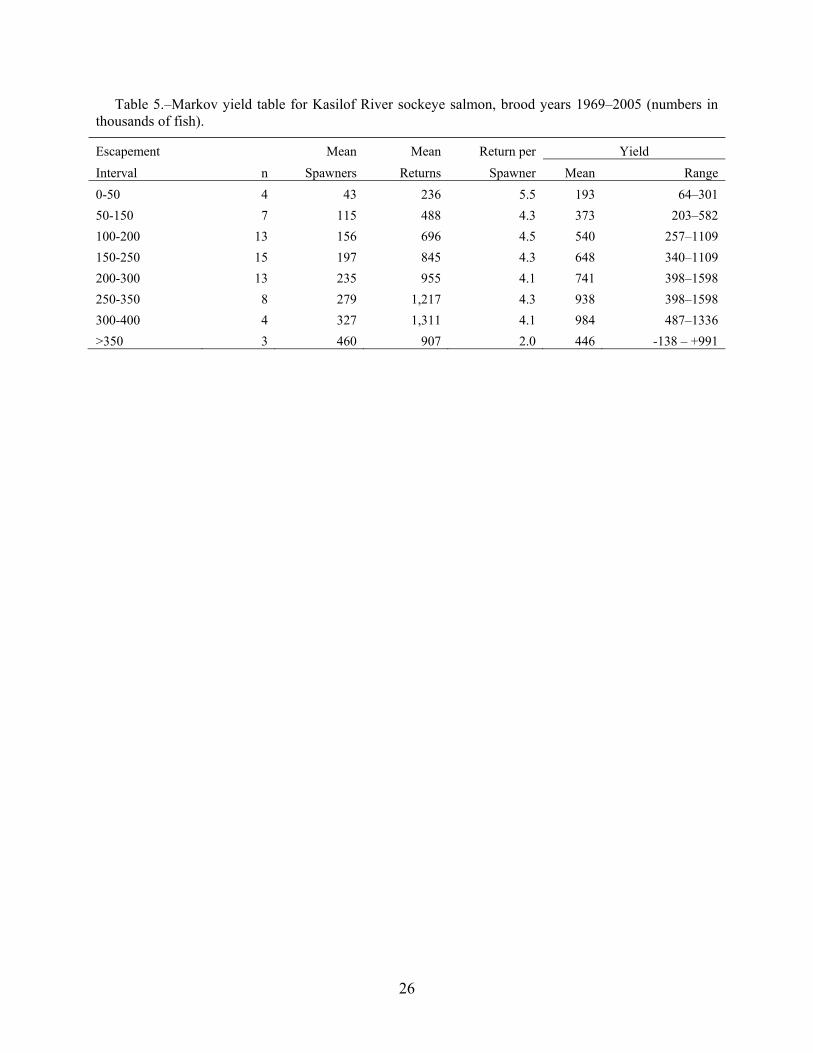
Table 5.–Markov yield table for Kasilof River sockeye salmon, brood years 1969–2005 (numbers in thousands of fish).
Escapement Mean Mean Return per Yield Interval n Spawners Returns Spawner Mean Range 0-50 4 43 236 5.5 193 64–301 50-150 7 115 488 4.3 373 203–582 100-200 13 156 696 4.5 540 257–1109 150-250 15 197 845 4.3 648 340–1109 200-300 13 235 955 4.1 741 398–1598 250-350 8 279 1,217 4.3 938 398–1598 300-400 4 327 1,311 4.1 984 487–1336 >350 3 460 907 2.0 446 -138 – +991
26

Table 6.–Summary of adult stock-recruitment models evaluated for Kenai River late-run sockeye salmon (brood years 1969–2005).
Residual Model Parameter Estimate P-value R2 AIC White noise test General Ricker model <0.001 0.528 59.68 0.549 σ 0.52
lna 1.60 0.266 b 5.75E-04 0.157 g 1.03 0.897 Classic Ricker model <0.001 0.528 57.32 0.523 σ 0.51
lna 1.78 <0.001 b 5.29E-04 0.004 Autoregressive Ricker model <0.001 0.556 57.59 0.642 σ 0.50 lna 1.64 <0.001 b 3.60E-04 0.112 φ 0.28 0.079 Cushing model <0.001 0.499 59.52 0.182 σ 0.52
lna 3.33 <0.001 g 0.69 0.014 Classic Ricker model <0.001 0.561 57.17 0.499 with brood interaction σ 0.50 lna 1.89 <0.001
b1 3.49E-04 0.100 b2 3.24E-04 0.130 General Ricker model <0.001 0.600 53.55 0.667 with brood interaction σ 0.48 lna 1.48 0.125
b3 4.69E-07 0.006 g 1.04 0.824 Simple brood <0.001 0.600 51.23 0.652 interaction model σ 0.47 lna 1.69 <0.001 b3 4.43E-07 <0.001 Note: Significance levels for γ test whether the parameter was different from 1.0.
27
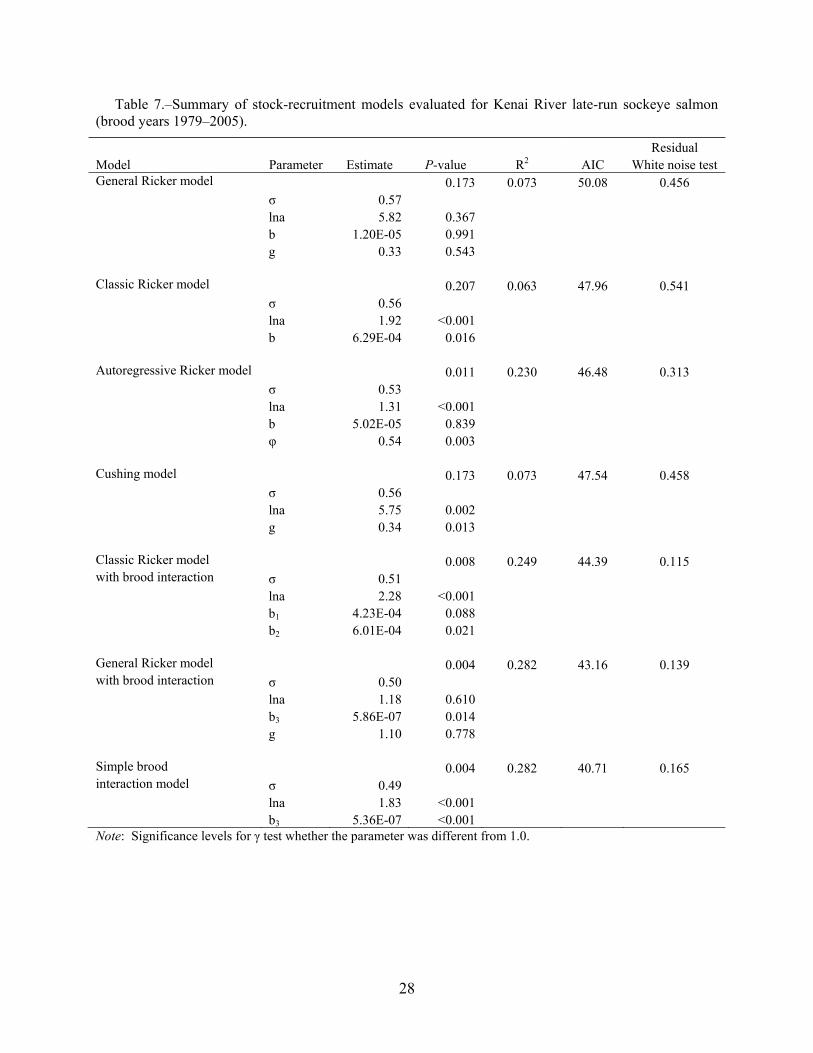
28
Table 7.–Summary of stock-recruitment models evaluated for Kenai River late-run sockeye salmon (brood years 1979–2005).
Residual Model Parameter Estimate P-value R2 AIC White noise test General Ricker model 0.173 0.073 50.08 0.456 σ 0.57
lna 5.82 0.367 b 1.20E-05 0.991 g 0.33 0.543 Classic Ricker model 0.207 0.063 47.96 0.541 σ 0.56
lna 1.92 <0.001 b 6.29E-04 0.016 Autoregressive Ricker model 0.011 0.230 46.48 0.313 σ 0.53 lna 1.31 <0.001 b 5.02E-05 0.839 φ 0.54 0.003 Cushing model 0.173 0.073 47.54 0.458 σ 0.56
lna 5.75 0.002 g 0.34 0.013 Classic Ricker model 0.008 0.249 44.39 0.115 with brood interaction σ 0.51 lna 2.28 <0.001
b1 4.23E-04 0.088 b2 6.01E-04 0.021 General Ricker model 0.004 0.282 43.16 0.139 with brood interaction σ 0.50 lna 1.18 0.610
b3 5.86E-07 0.014 g 1.10 0.778 Simple brood 0.004 0.282 40.71 0.165 interaction model σ 0.49 lna 1.83 <0.001 b3 5.36E-07 <0.001 Note: Significance levels for γ test whether the parameter was different from 1.0.
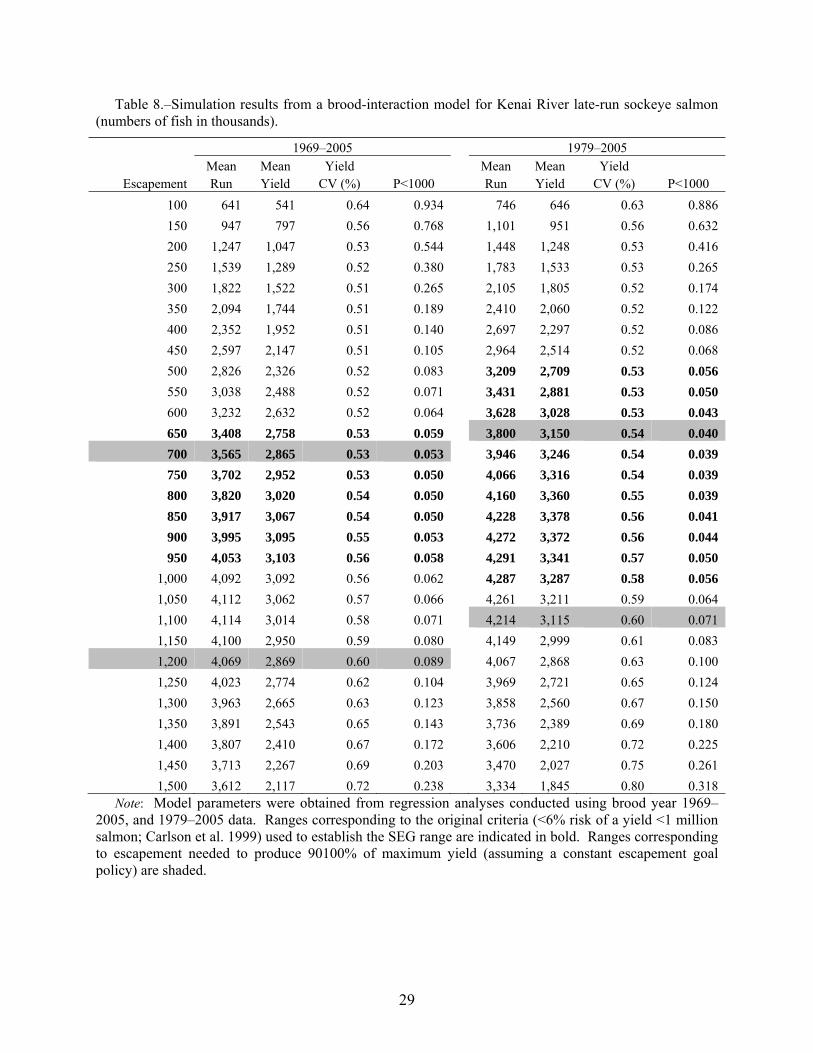
Table 8.–Simulation results from a brood-interaction model for Kenai River late-run sockeye salmon (numbers of fish in thousands).
1969–2005 1979–2005 Mean Mean Yield Mean Mean Yield
Escapement Run Yield CV (%) P<1000 Run Yield CV (%) P<1000 100 641 541 0.64 0.934 746 646 0.63 0.886 150 947 797 0.56 0.768 1,101 951 0.56 0.632 200 1,247 1,047 0.53 0.544 1,448 1,248 0.53 0.416 250 1,539 1,289 0.52 0.380 1,783 1,533 0.53 0.265 300 1,822 1,522 0.51 0.265 2,105 1,805 0.52 0.174 350 2,094 1,744 0.51 0.189 2,410 2,060 0.52 0.122 400 2,352 1,952 0.51 0.140 2,697 2,297 0.52 0.086 450 2,597 2,147 0.51 0.105 2,964 2,514 0.52 0.068 500 2,826 2,326 0.52 0.083 3,209 2,709 0.53 0.056 550 3,038 2,488 0.52 0.071 3,431 2,881 0.53 0.050 600 3,232 2,632 0.52 0.064 3,628 3,028 0.53 0.043 650 3,408 2,758 0.53 0.059 3,800 3,150 0.54 0.040 700 3,565 2,865 0.53 0.053 3,946 3,246 0.54 0.039 750 3,702 2,952 0.53 0.050 4,066 3,316 0.54 0.039 800 3,820 3,020 0.54 0.050 4,160 3,360 0.55 0.039 850 3,917 3,067 0.54 0.050 4,228 3,378 0.56 0.041 900 3,995 3,095 0.55 0.053 4,272 3,372 0.56 0.044 950 4,053 3,103 0.56 0.058 4,291 3,341 0.57 0.050
1,000 4,092 3,092 0.56 0.062 4,287 3,287 0.58 0.056 1,050 4,112 3,062 0.57 0.066 4,261 3,211 0.59 0.064 1,100 4,114 3,014 0.58 0.071 4,214 3,115 0.60 0.071 1,150 4,100 2,950 0.59 0.080 4,149 2,999 0.61 0.083 1,200 4,069 2,869 0.60 0.089 4,067 2,868 0.63 0.100 1,250 4,023 2,774 0.62 0.104 3,969 2,721 0.65 0.124 1,300 3,963 2,665 0.63 0.123 3,858 2,560 0.67 0.150 1,350 3,891 2,543 0.65 0.143 3,736 2,389 0.69 0.180 1,400 3,807 2,410 0.67 0.172 3,606 2,210 0.72 0.225 1,450 3,713 2,267 0.69 0.203 3,470 2,027 0.75 0.261 1,500 3,612 2,117 0.72 0.238 3,334 1,845 0.80 0.318
Note: Model parameters were obtained from regression analyses conducted using brood year 1969–2005, and 1979–2005 data. Ranges corresponding to the original criteria (<6% risk of a yield <1 million salmon; Carlson et al. 1999) used to establish the SEG range are indicated in bold. Ranges corresponding to escapement needed to produce 90100% of maximum yield (assuming a constant escapement goal policy) are shaded.
29
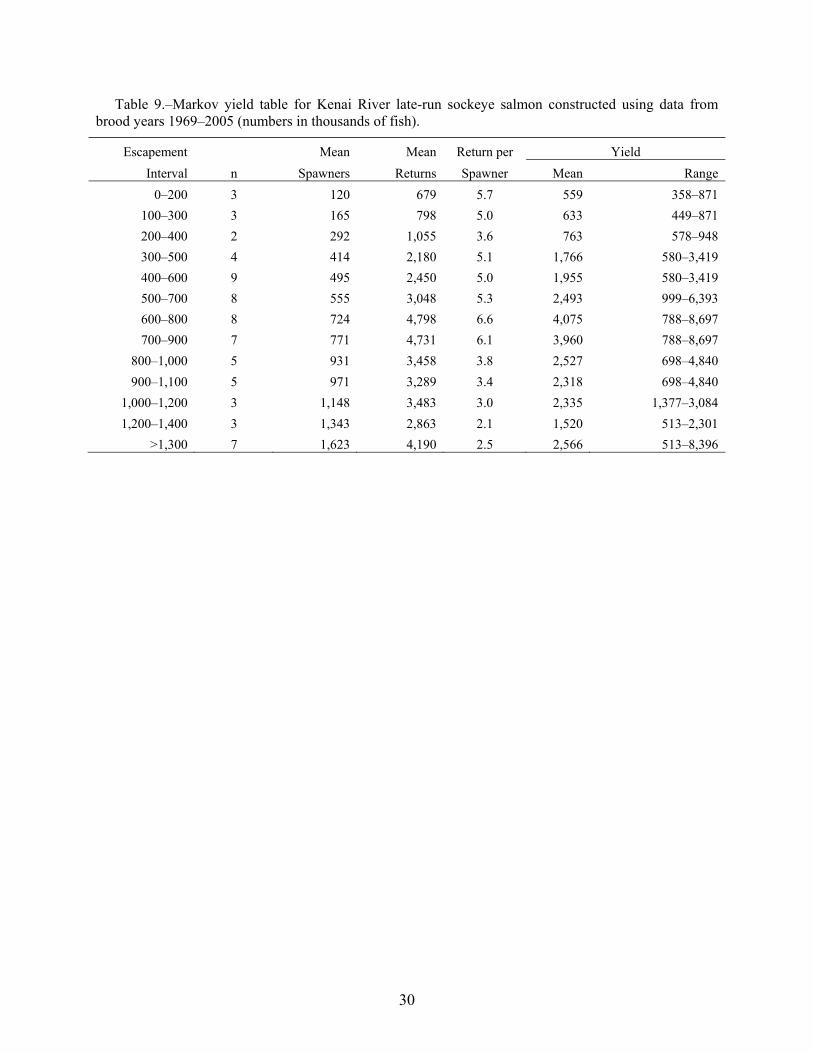
Table 9.–Markov yield table for Kenai River late-run sockeye salmon constructed using data from brood years 1969–2005 (numbers in thousands of fish).
Escapement Mean Mean Return per Yield Interval n Spawners Returns Spawner Mean Range
0–200 3 120 679 5.7 559 358–871 100–300 3 165 798 5.0 633 449–871 200–400 2 292 1,055 3.6 763 578–948 300–500 4 414 2,180 5.1 1,766 580–3,419 400–600 9 495 2,450 5.0 1,955 580–3,419 500–700 8 555 3,048 5.3 2,493 999–6,393 600–800 8 724 4,798 6.6 4,075 788–8,697 700–900 7 771 4,731 6.1 3,960 788–8,697
800–1,000 5 931 3,458 3.8 2,527 698–4,840 900–1,100 5 971 3,289 3.4 2,318 698–4,840
1,000–1,200 3 1,148 3,483 3.0 2,335 1,377–3,084 1,200–1,400 3 1,343 2,863 2.1 1,520 513–2,301
>1,300 7 1,623 4,190 2.5 2,566 513–8,396
30
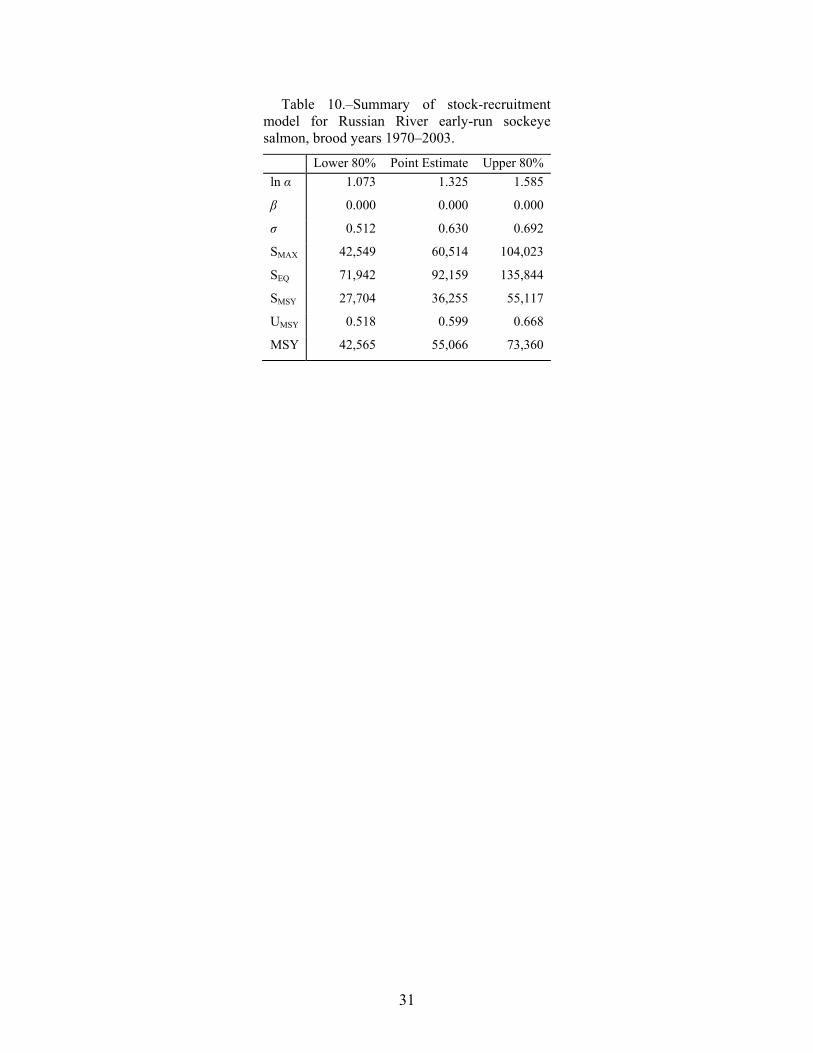
31
Table 10.–Summary of stock-recruitment model for Russian River early-run sockeye salmon, brood years 1970–2003.
Lower 80% Point Estimate Upper 80% ln α 1.073 1.325 1.585
β 0.000 0.000 0.000
σ 0.512 0.630 0.692
SMAX 42,549 60,514 104,023
SEQ 71,942 92,159 135,844
SMSY 27,704 36,255 55,117
UMSY 0.518 0.599 0.668
MSY 42,565 55,066 73,360
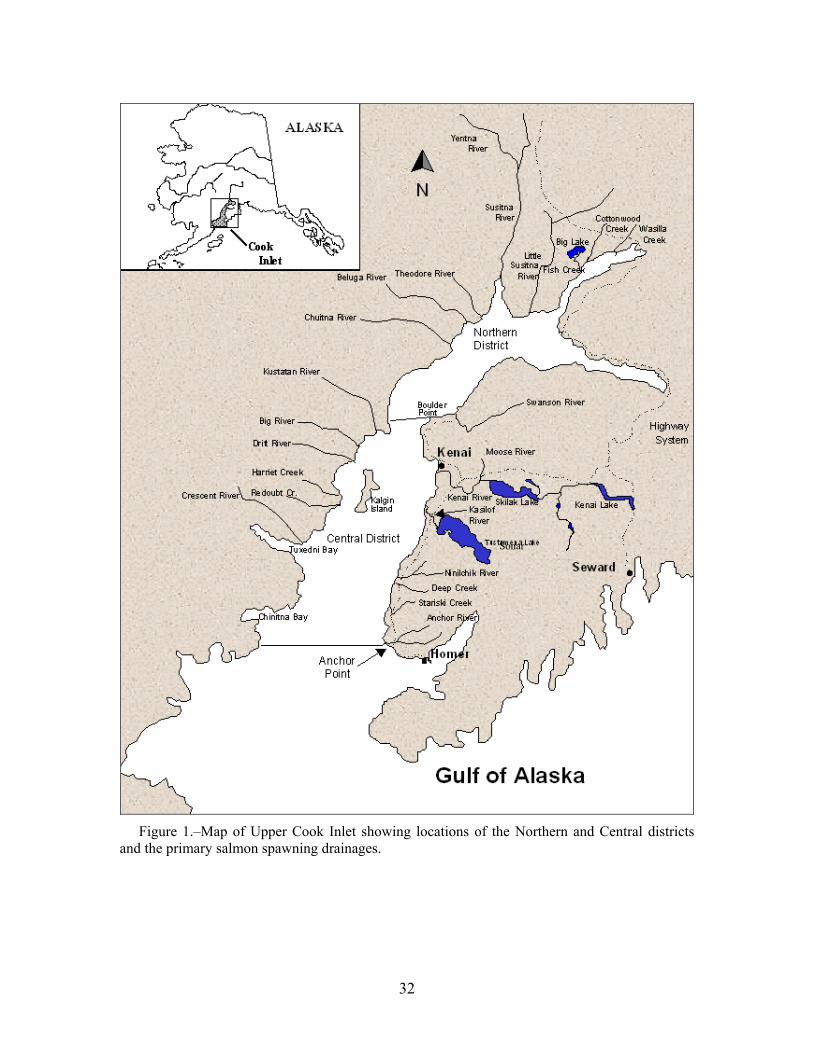
Sonar
Figure 1.–Map of Upper Cook Inlet showing locations of the Northern and Central districts and the primary salmon spawning drainages.
32
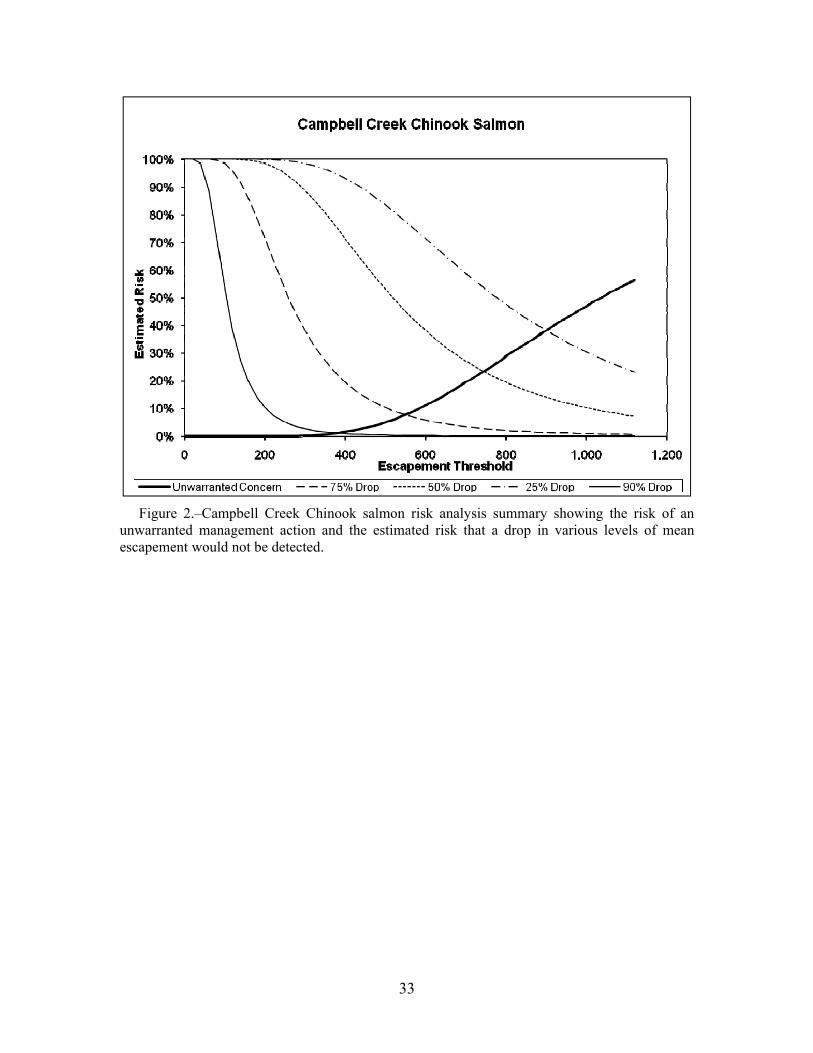
Figure 2.–Campbell Creek Chinook salmon risk analysis summary showing the risk of an
unwarranted management action and the estimated risk that a drop in various levels of mean escapement would not be detected.
33
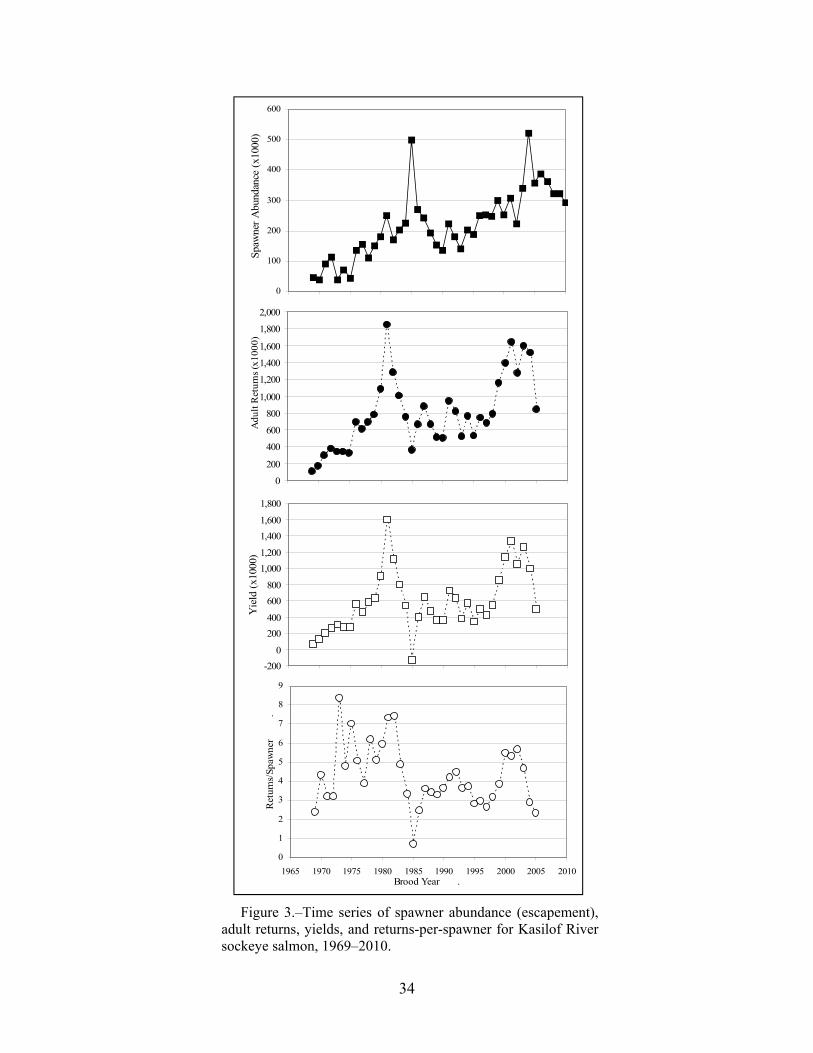
34
0
100
200
300
400
500
600
1965 1970 1975 1980 1985 1990 1995 2000 2005 2010
Spaw
ner A
bund
ance
(x10
00)
0
200
400
600
800
1,000
1,200
1,400
1,600
1,800
2,000
1965 1970 1975 1980 1985 1990 1995 2000 2005 2010
Adu
lt R
etur
ns (x
1000
)
-2000
200400
600800
1,0001,200
1,4001,600
1,800
1965 1970 1975 1980 1985 1990 1995 2000 2005 2010
Yie
ld (x
1000
)
0
1
2
3
4
5
6
7
8
9
1965 1970 1975 1980 1985 1990 1995 2000 2005 2010Brood Year .
Ret
urns
/Spa
wne
r
.
Figure 3.–Time series of spawner abundance (escapement), adult returns, yields, and returns-per-spawner for Kasilof River sockeye salmon, 1969–2010.
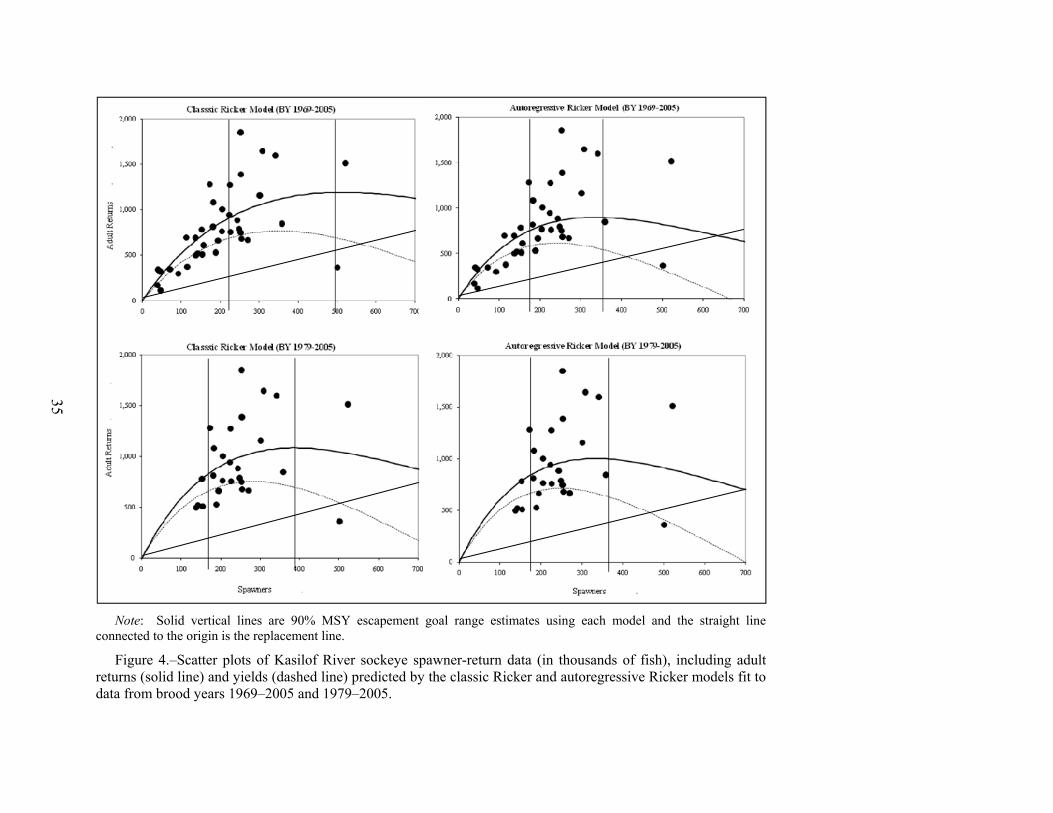
35
Note: Solid vertical lines are 90% MSY escapement goal range estimates using each model and the straight line
connected to the origin is the replacement line.
Figure 4.–Scatter plots of Kasilof River sockeye spawner-return data (in thousands of fish), including adult returns (solid line) and yields (dashed line) predicted by the classic Ricker and autoregressive Ricker models fit to data from brood years 1969–2005 and 1979–2005.
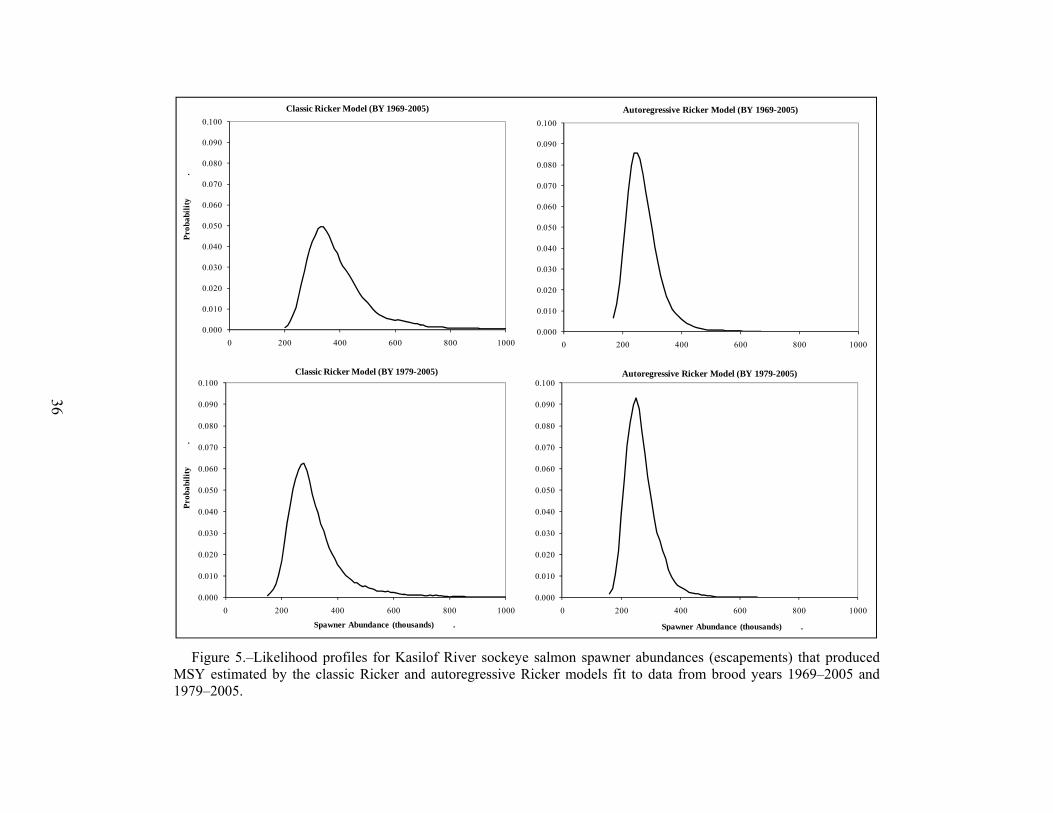
Figure 5.–Likelihood profiles for Kasilof River sockeye salmon spawner abundances (escapements) that produced MSY estimated by the classic Ricker and autoregressive Ricker models fit to data from brood years 1969–2005 and 1979–2005.
0.000
0.010
0.020
0.030
0.040
0.050
0.060
0.070
0.080
0.090
0.100
0 200 400 600 800 1000
Prob
abili
ty
.
Classic Ricker Model (BY 1969-2005)
0.000
0.010
0.020
0.030
0.040
0.050
0.060
0.070
0.080
0.090
0.100
0 200 400 600 800 1000
Autoregressive Ricker Model (BY 1969-2005)
0.000
0.010
0.020
0.030
0.040
0.050
0.060
0.070
0.080
0.090
0.100
0 200 400 600 800 1000
Prob
abili
ty
.
Spawner Abundance (thousands) .
Classic Ricker Model (BY 1979-2005)
0.000
0.010
0.020
0.030
0.040
0.050
0.060
0.070
0.080
0.090
0.100
0 200 400 600 800 1000
Spawner Abundance (thousands) .
Autoregressive Ricker Model (BY 1979-2005)
36
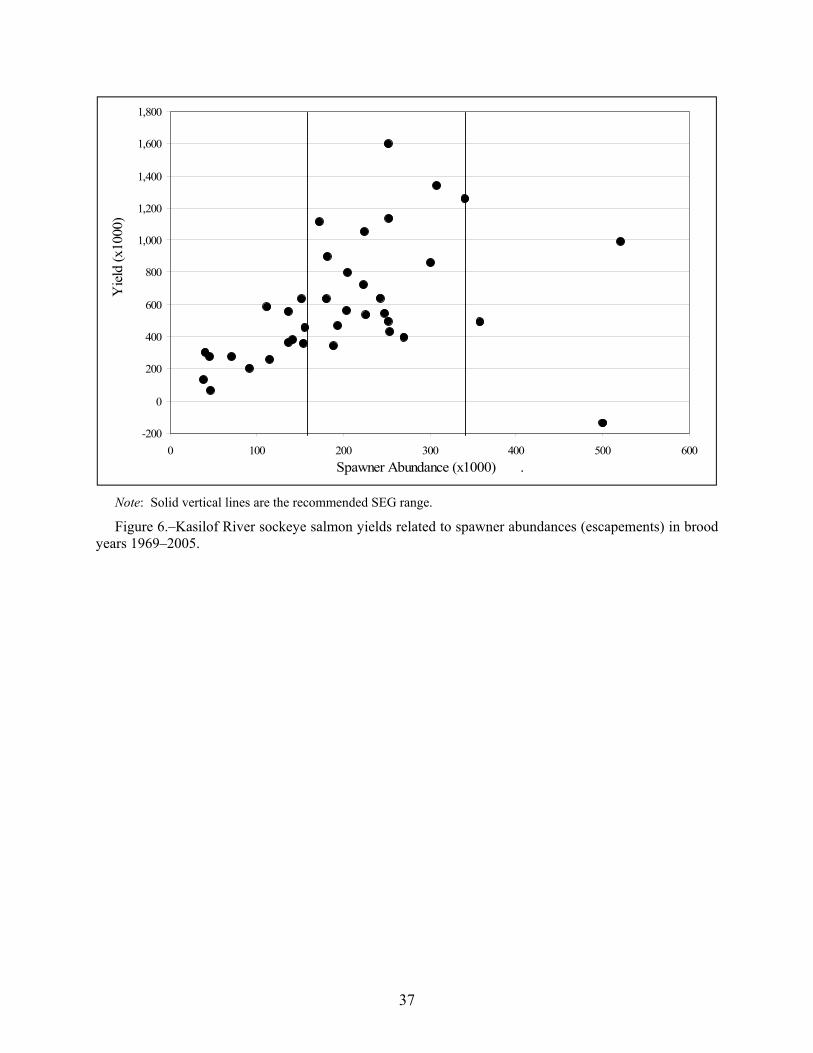
-200
0
200
400
600
800
1,000
1,200
1,400
1,600
1,800
0 100 200 300 400 500 600Spawner Abundance (x1000) .
Yie
ld (x
1000
)
Note: Solid vertical lines are the recommended SEG range.
Figure 6.–Kasilof River sockeye salmon yields related to spawner abundances (escapements) in brood years 1969–2005.
37
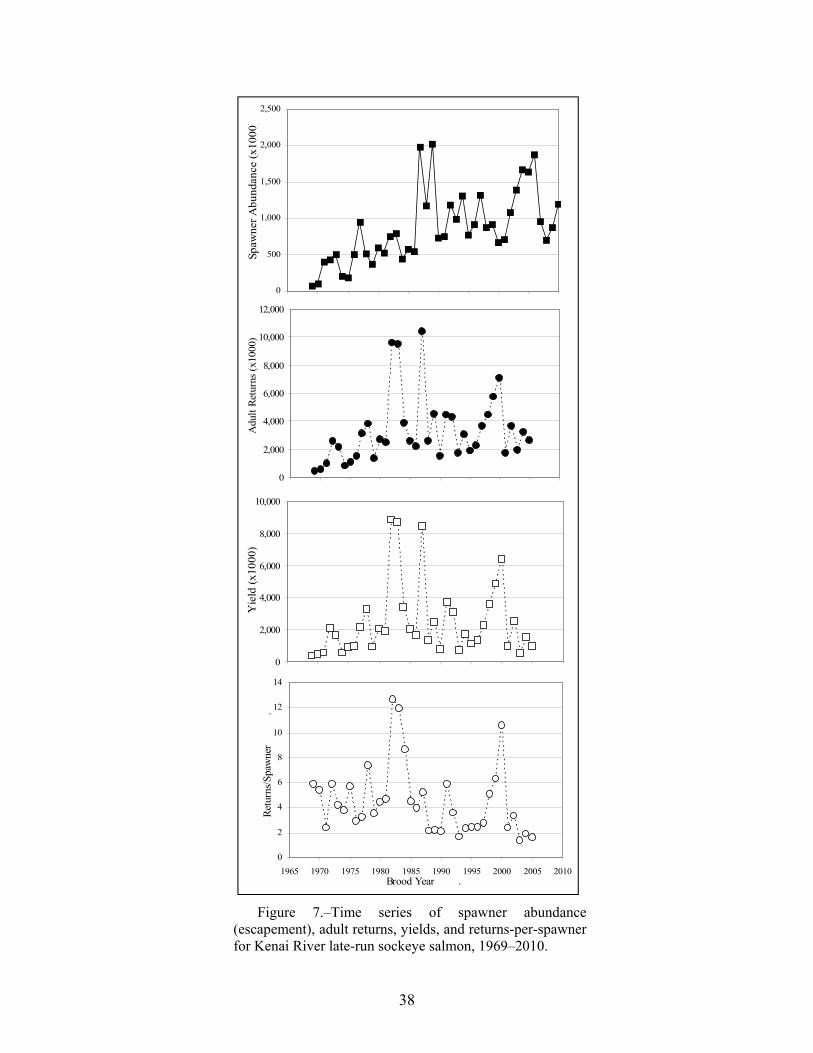
0
500
1,000
1,500
2,000
2,500
1965 1970 1975 1980 1985 1990 1995 2000 2005 2010
Spaw
ner A
bund
ance
(x10
00)
0
2,000
4,000
6,000
8,000
10,000
12,000
1965 1970 1975 1980 1985 1990 1995 2000 2005 2010
Adu
lt Re
turn
s (x1
000)
0
2,000
4,000
6,000
8,000
10,000
1965 1970 1975 1980 1985 1990 1995 2000 2005 2010
Yie
ld (x
1000
)
0
2
4
6
8
10
12
14
1965 1970 1975 1980 1985 1990 1995 2000 2005 2010Brood Year .
Retu
rns/S
paw
ner
.
Figure 7.–Time series of spawner abundance
(escapement), adult returns, yields, and returns-per-spawner for Kenai River late-run sockeye salmon, 1969–2010.
38
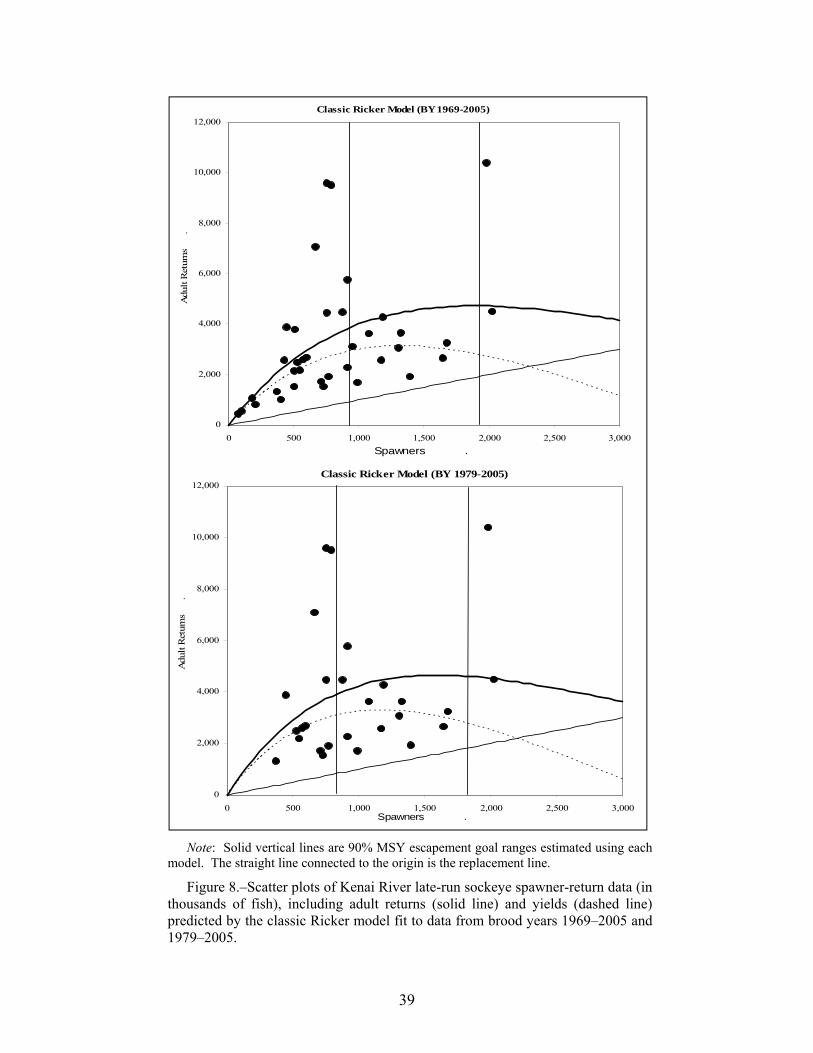
39
Classic Ricker Model (BY 1969-2005)
0
2,000
4,000
6,000
8,000
10,000
12,000
0 500 1,000 1,500 2,000 2,500 3,000Spawners .
Adu
lt R
etur
ns
.
Classic Ricker Model (BY 1979-2005)
0
2,000
4,000
6,000
8,000
10,000
12,000
0 500 1,000 1,500 2,000 2,500 3,000Spawners .
Adu
lt R
etur
ns
.
Note: Solid vertical lines are 90% MSY escapement goal ranges estimated using each
model. The straight line connected to the origin is the replacement line.
Figure 8.–Scatter plots of Kenai River late-run sockeye spawner-return data (in thousands of fish), including adult returns (solid line) and yields (dashed line) predicted by the classic Ricker model fit to data from brood years 1969–2005 and 1979–2005.
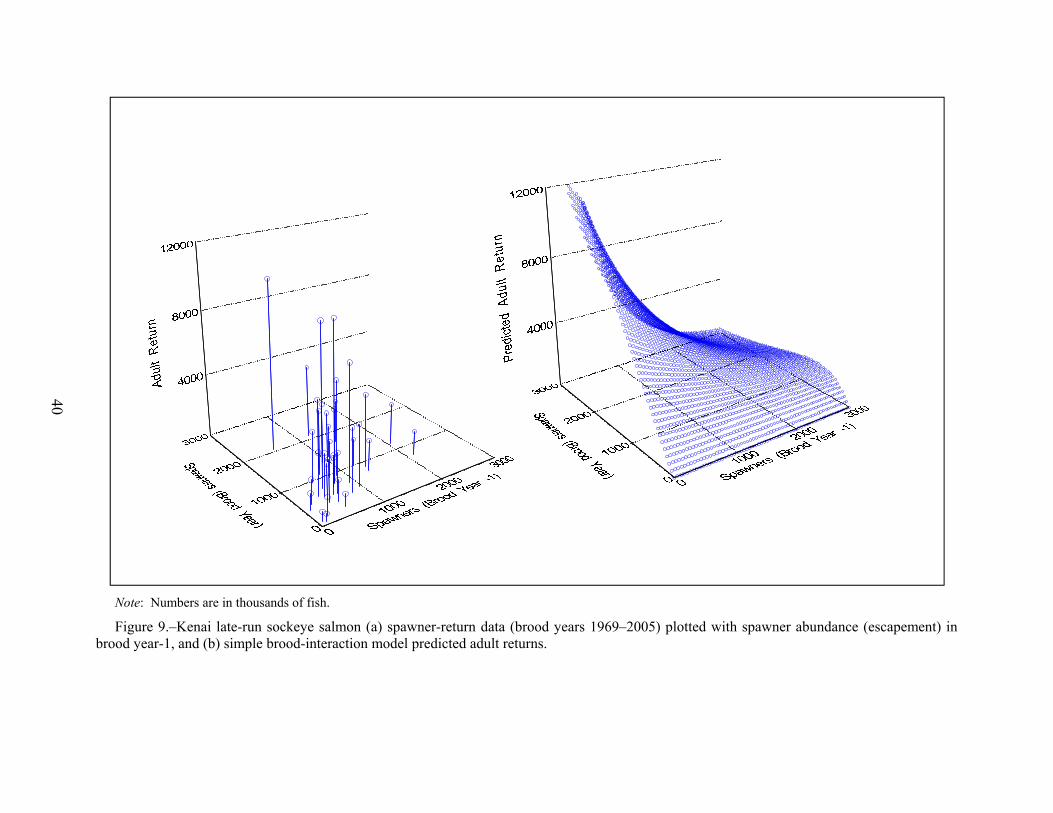
40
Note: Numbers are in thousands of fish.
Figure 9.–Kenai late-run sockeye salmon (a) spawner-return data (brood years 1969–2005) plotted with spawner abundance (escapement) in brood year-1, and (b) simple brood-interaction model predicted adult returns.
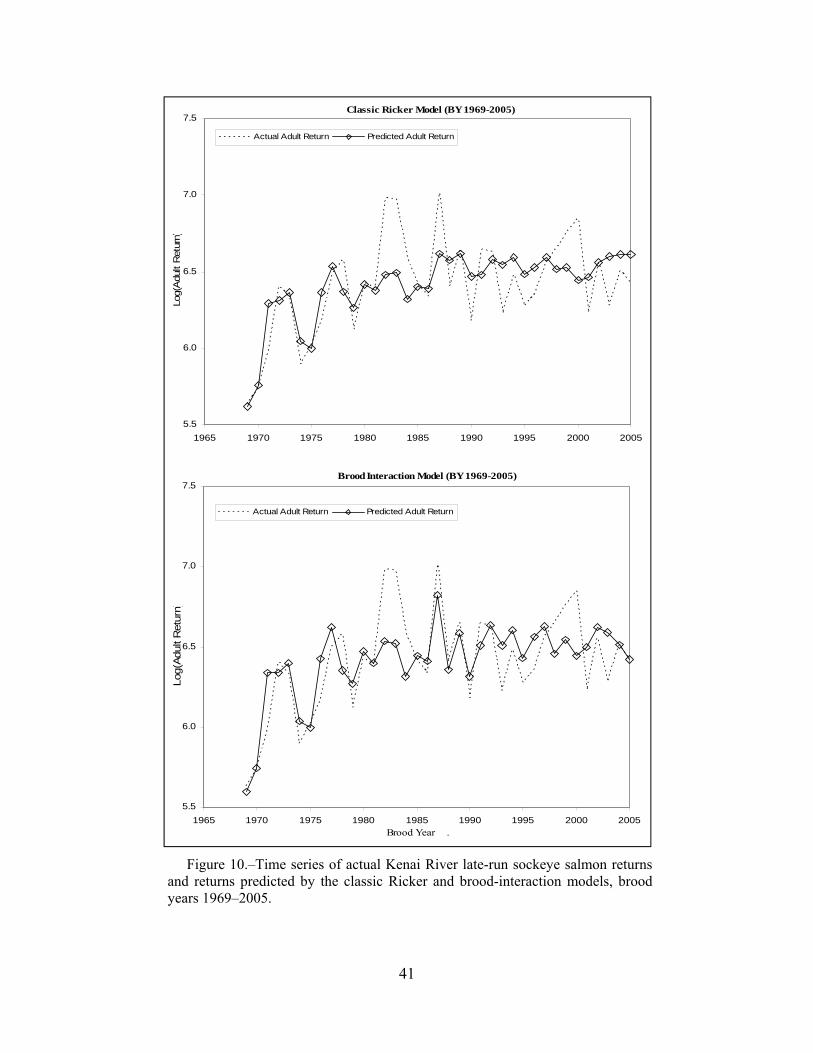
Brood Interaction Model (BY 1969-2005)
5.5
6.0
6.5
7.0
7.5
1965 1970 1975 1980 1985 1990 1995 2000 2005Brood Year .
Log(
Adul
t Ret
urn)
Actual Adult Return Predicted Adult Return
Classic Ricker Model (BY 1969-2005)
5.5
6.0
6.5
7.0
7.5
1965 1970 1975 1980 1985 1990 1995 2000 2005
Log(
Adu
lt R
etur
n)
Actual Adult Return Predicted Adult Return
Figure 10.–Time series of actual Kenai River late-run sockeye salmon returns and returns predicted by the classic Ricker and brood-interaction models, brood years 1969–2005.
41
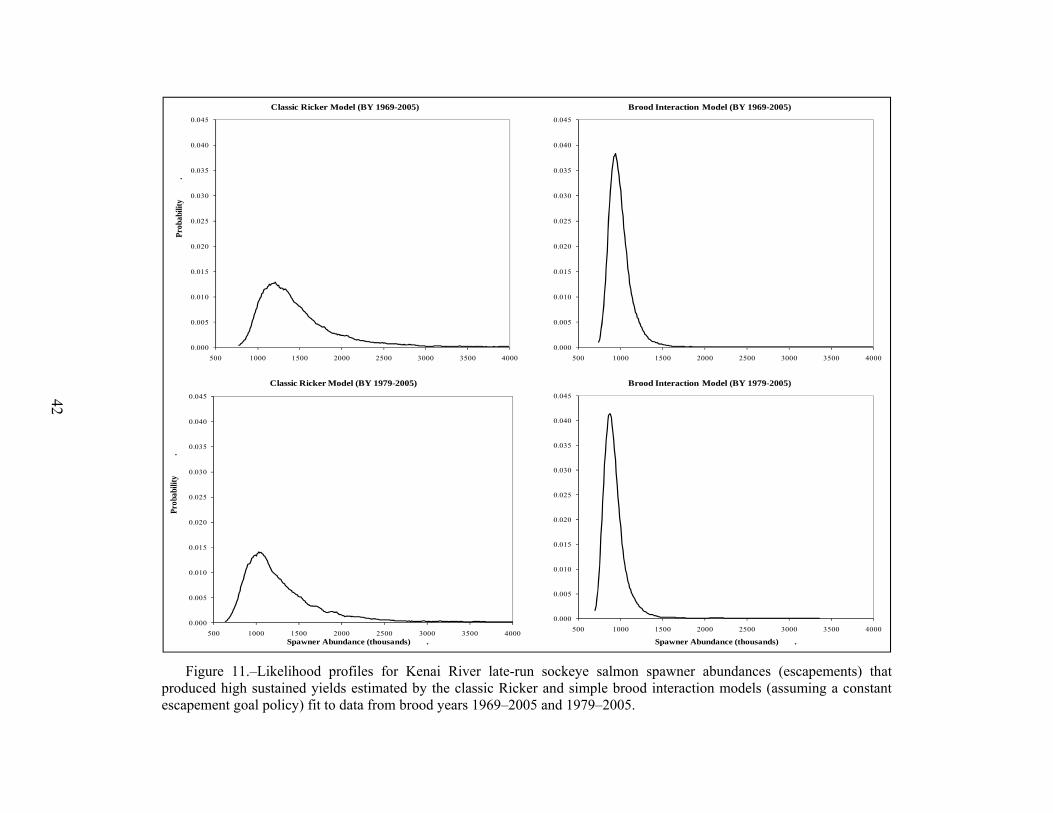
42
0.000
0.005
0.010
0.015
0.020
0.025
0.030
0.035
0.040
0.045
500 1000 1500 2000 2500 3000 3500 4000
Prob
abili
ty
.
Classic Ricker Model (BY 1969-2005)
0.000
0.005
0.010
0.015
0.020
0.025
0.030
0.035
0.040
0.045
500 1000 1500 2000 2500 3000 3500 4000
Brood Interaction Model (BY 1969-2005)
0.000
0.005
0.010
0.015
0.020
0.025
0.030
0.035
0.040
0.045
500 1000 1500 2000 2500 3000 3500 4000
Prob
abili
ty
.
Spawner Abundance (thousands) .
Classic Ricker Model (BY 1979-2005)
0.000
0.005
0.010
0.015
0.020
0.025
0.030
0.035
0.040
0.045
500 1000 1500 2000 2500 3000 3500 4000
Spawner Abundance (thousands) .
Brood Interaction Model (BY 1979-2005)
Figure 11.–Likelihood profiles for Kenai River late-run sockeye salmon spawner abundances (escapements) that produced high sustained yields estimated by the classic Ricker and simple brood interaction models (assuming a constant escapement goal policy) fit to data from brood years 1969–2005 and 1979–2005.
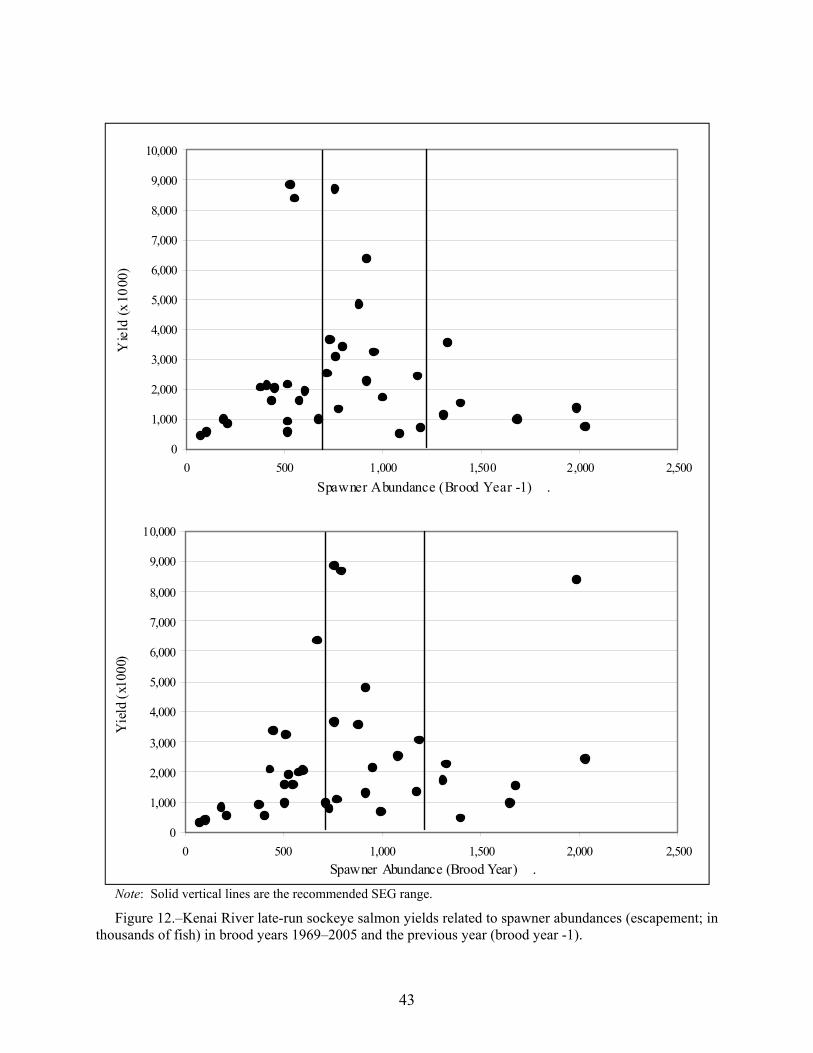
Note: Solid vertical lines are the recommended SEG range.
0
1,000
2,000
3,000
4,000
5,000
6,000
7,000
8,000
9,000
10,000
0 500 1,000 1,500 2,000 2,500Spawner Abundance (Brood Year -1) .
Yie
ld (x
1000
)
0
1,000
2,000
3,000
4,000
5,000
6,000
7,000
8,000
9,000
10,000
0 500 1,000 1,500 2,000 2,500Spawner Abundance (Brood Year) .
Yie
ld (
x100
0)
Figure 12.–Kenai River late-run sockeye salmon yields related to spawner abundances (escapement; in thousands of fish) in brood years 1969–2005 and the previous year (brood year -1).
43
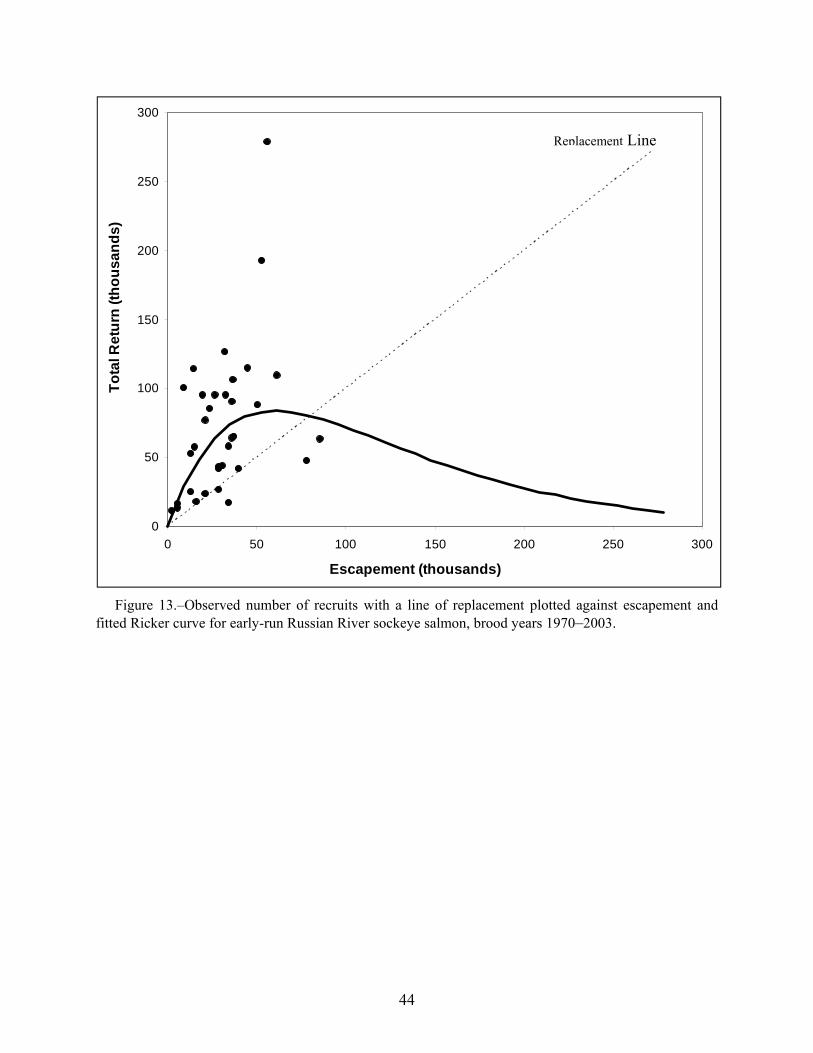
0
50
100
150
200
250
300
0 50 100 150 200 250 300
Escapement (thousands)
Tota
l Ret
urn
(thou
sand
s)Replace mentReplacement Line
Figure 13.–Observed number of recruits with a line of replacement plotted against escapement and
fitted Ricker curve for early-run Russian River sockeye salmon, brood years 1970–2003.
44
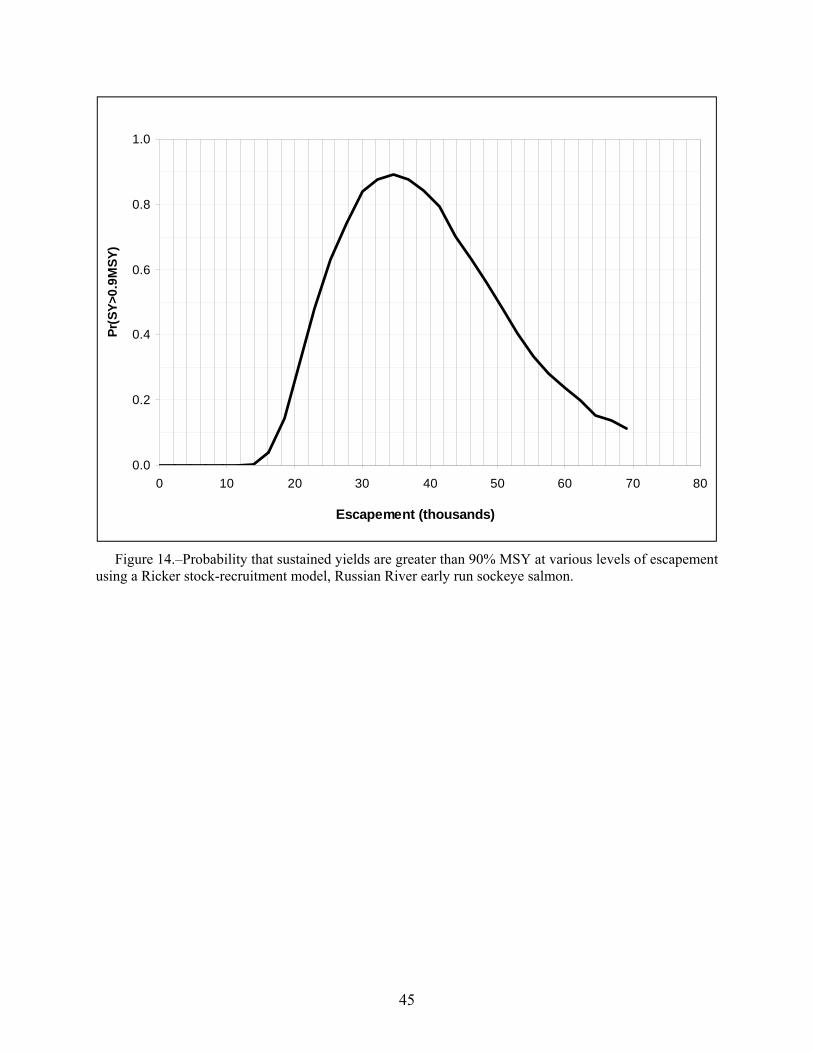
45
0.0
0.2
0.4
0.6
0.8
1.0
0 10 20 30 40 50 60 70 8
Escapement (thousands)
Pr(S
Y>0.
9MSY
)
0
Figure 14.–Probability that sustained yields are greater than 90% MSY at various levels of escapement using a Ricker stock-recruitment model, Russian River early run sockeye salmon.

46
APPENDIX A. SUPPORTING INFORMATION FOR UPPER COOK INLET
CHINOOK SALMON ESCAPEMENT GOALS
47
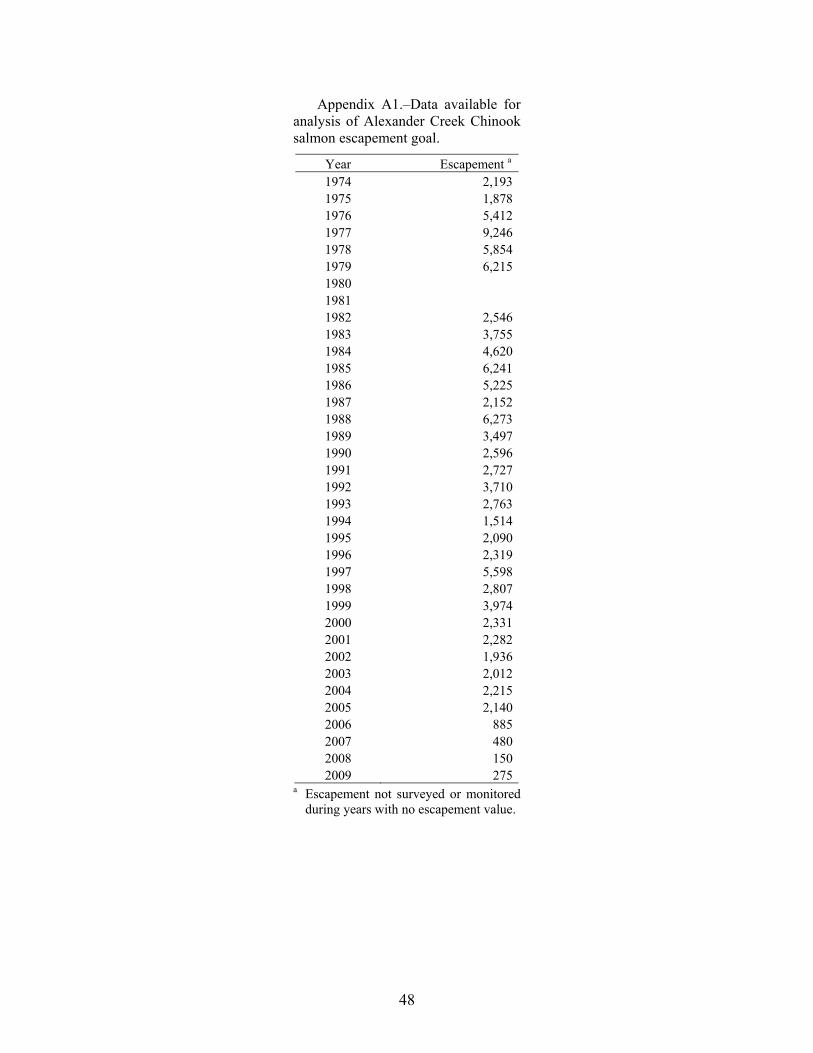
Appendix A1.–Data available for analysis of Alexander Creek Chinook salmon escapement goal.
Year Escapement a 1974 2,1931975 1,8781976 5,4121977 9,2461978 5,8541979 6,2151980 1981 1982 2,5461983 3,7551984 4,6201985 6,2411986 5,2251987 2,1521988 6,2731989 3,4971990 2,5961991 2,7271992 3,7101993 2,7631994 1,5141995 2,0901996 2,3191997 5,5981998 2,8071999 3,9742000 2,3312001 2,2822002 1,9362003 2,0122004 2,2152005 2,1402006 8852007 4802008 1502009 275
a Escapement not surveyed or monitored during years with no escapement value.
48
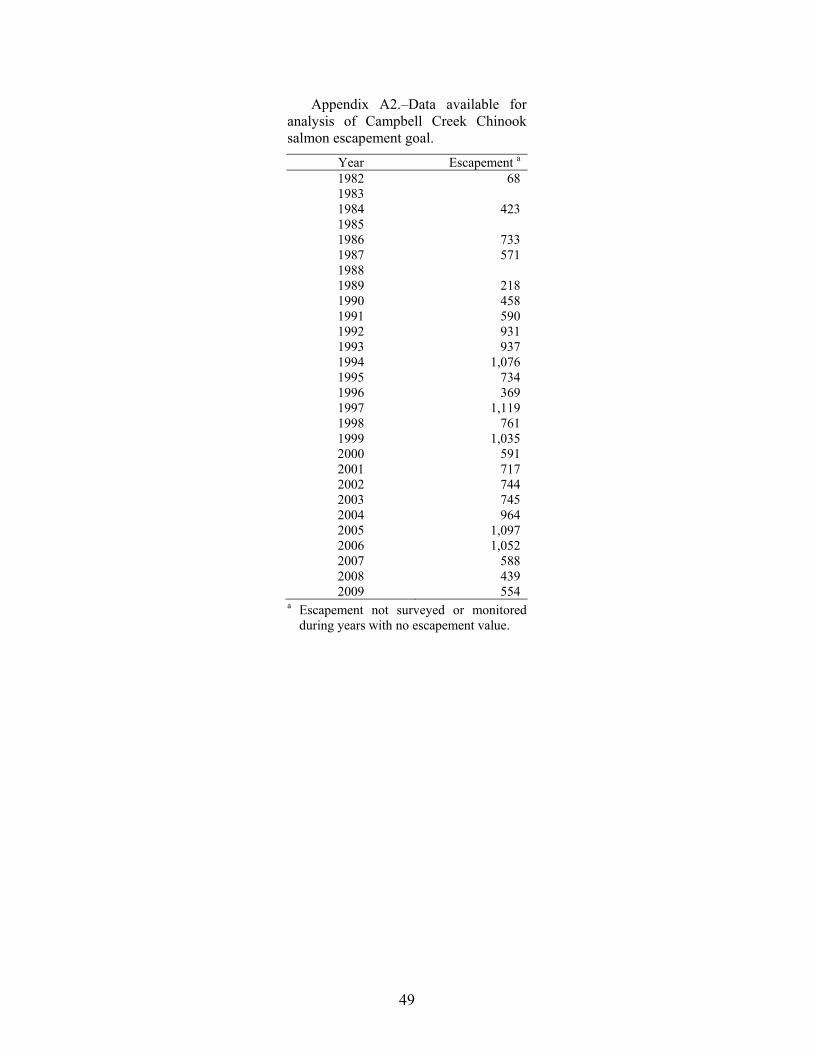
49
Appendix A2.–Data available for analysis of Campbell Creek Chinook salmon escapement goal.
Year Escapement a 1982 68 1983 1984 423 1985 1986 733 1987 571 1988 1989 218 1990 458 1991 590 1992 931 1993 937 1994 1,076 1995 734 1996 369 1997 1,119 1998 761 1999 1,035 2000 591 2001 717 2002 744 2003 745 2004 964 2005 1,097 2006 1,052 2007 588 2008 439 2009 554
a Escapement not surveyed or monitored during years with no escapement value.
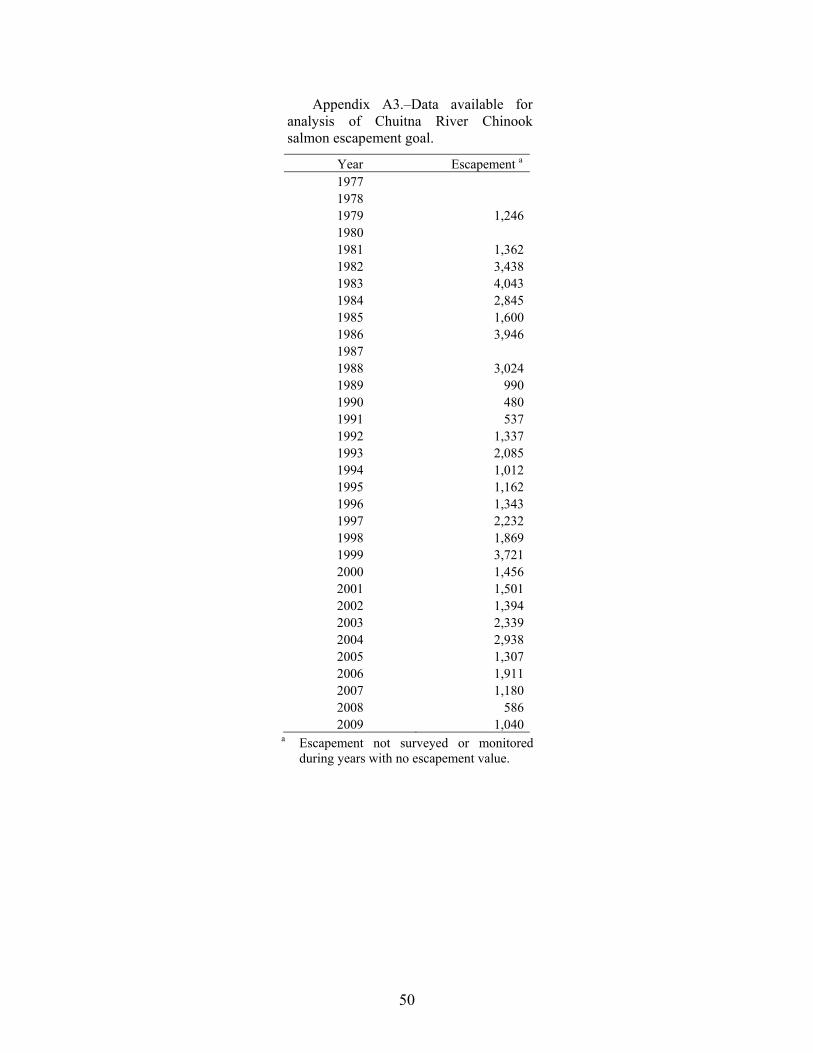
Appendix A3.–Data available for analysis of Chuitna River Chinook salmon escapement goal.
Year Escapement a 1977 1978 1979 1,2461980 1981 1,3621982 3,4381983 4,0431984 2,8451985 1,6001986 3,9461987 1988 3,0241989 9901990 4801991 5371992 1,3371993 2,0851994 1,0121995 1,1621996 1,3431997 2,2321998 1,8691999 3,7212000 1,4562001 1,5012002 1,3942003 2,3392004 2,9382005 1,3072006 1,9112007 1,1802008 5862009 1,040
a Escapement not surveyed or monitored during years with no escapement value.
50
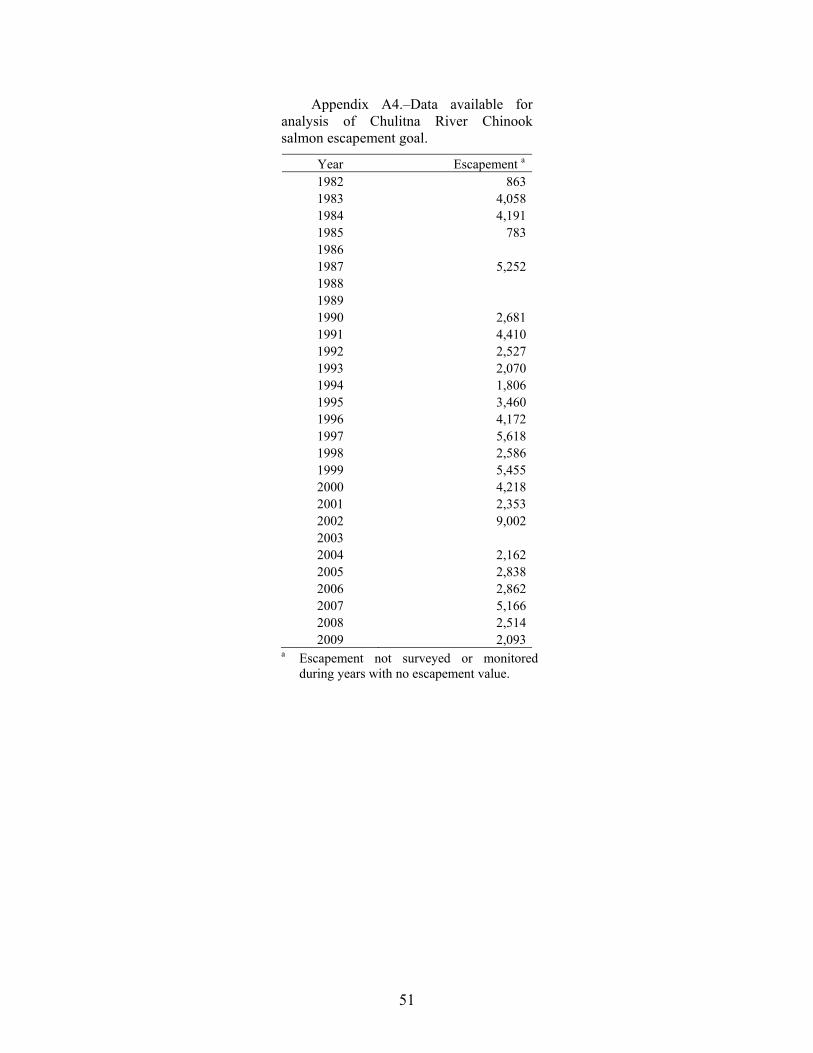
Appendix A4.–Data available for analysis of Chulitna River Chinook salmon escapement goal.
Year Escapement a 1982 8631983 4,0581984 4,1911985 7831986 1987 5,2521988 1989 1990 2,6811991 4,4101992 2,5271993 2,0701994 1,8061995 3,4601996 4,1721997 5,6181998 2,5861999 5,4552000 4,2182001 2,3532002 9,0022003 2004 2,1622005 2,8382006 2,8622007 5,1662008 2,5142009 2,093
a Escapement not surveyed or monitored during years with no escapement value.
51
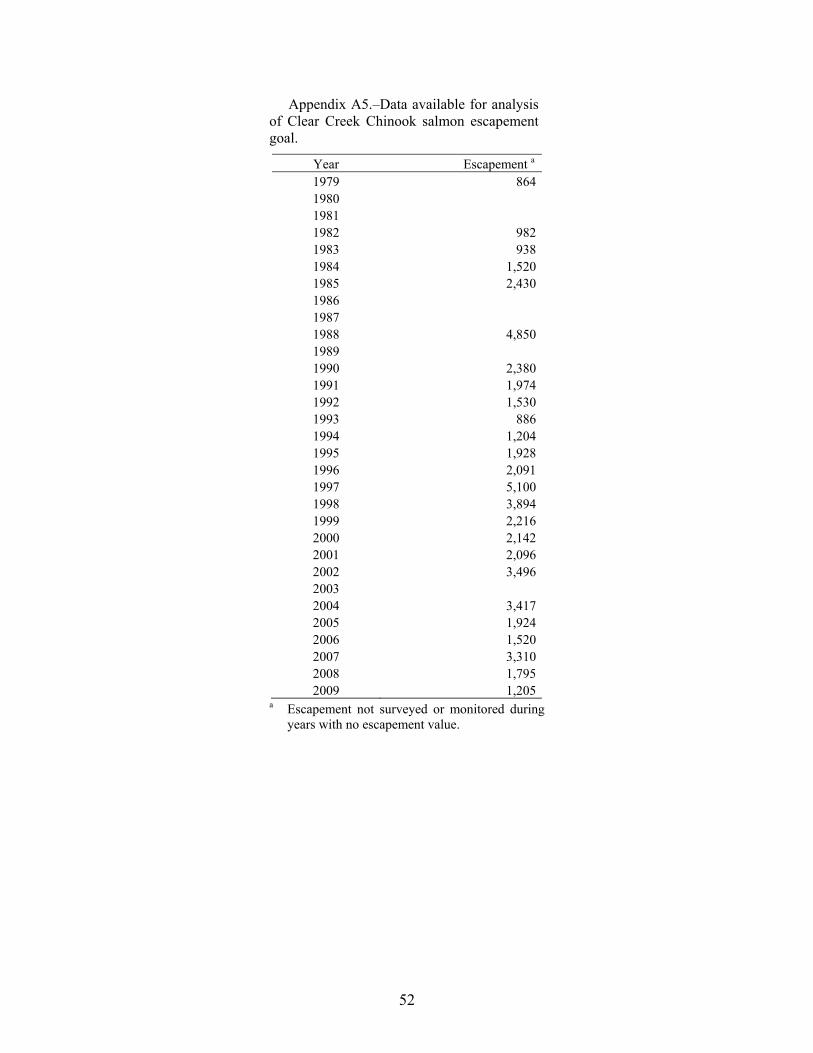
Appendix A5.–Data available for analysis of Clear Creek Chinook salmon escapement goal.
Year Escapement a 1979 8641980 1981 1982 9821983 9381984 1,5201985 2,4301986 1987 1988 4,8501989 1990 2,3801991 1,9741992 1,5301993 8861994 1,2041995 1,9281996 2,0911997 5,1001998 3,8941999 2,2162000 2,1422001 2,0962002 3,4962003 2004 3,4172005 1,9242006 1,5202007 3,3102008 1,7952009 1,205
a Escapement not surveyed or monitored during years with no escapement value.
52
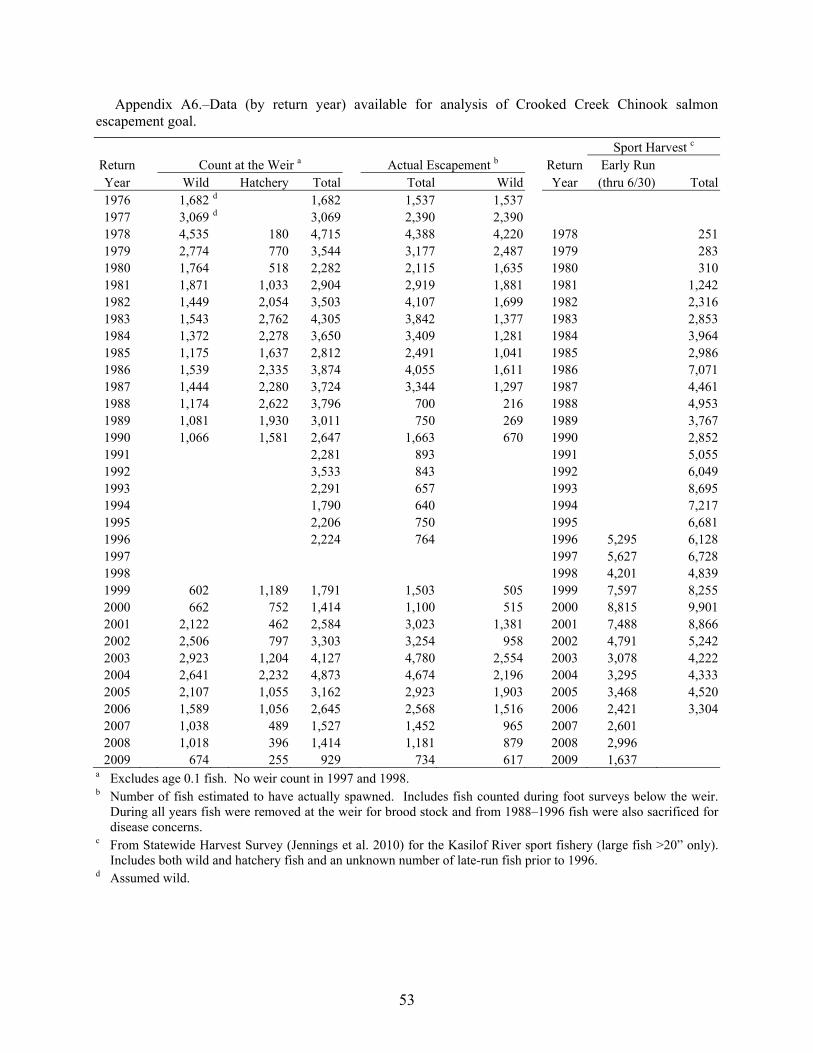
Appendix A6.–Data (by return year) available for analysis of Crooked Creek Chinook salmon escapement goal.
Sport Harvest c Return Count at the Weir a Actual Escapement b Return Early Run Year Wild Hatchery Total Total Wild Year (thru 6/30) Total1976 1,682 d 1,682 1,537 1,537 1977 3,069 d 3,069 2,390 2,390 1978 4,535 180 4,715 4,388 4,220 1978 2511979 2,774 770 3,544 3,177 2,487 1979 2831980 1,764 518 2,282 2,115 1,635 1980 3101981 1,871 1,033 2,904 2,919 1,881 1981 1,2421982 1,449 2,054 3,503 4,107 1,699 1982 2,3161983 1,543 2,762 4,305 3,842 1,377 1983 2,8531984 1,372 2,278 3,650 3,409 1,281 1984 3,9641985 1,175 1,637 2,812 2,491 1,041 1985 2,9861986 1,539 2,335 3,874 4,055 1,611 1986 7,0711987 1,444 2,280 3,724 3,344 1,297 1987 4,4611988 1,174 2,622 3,796 700 216 1988 4,9531989 1,081 1,930 3,011 750 269 1989 3,7671990 1,066 1,581 2,647 1,663 670 1990 2,8521991 2,281 893 1991 5,0551992 3,533 843 1992 6,0491993 2,291 657 1993 8,6951994 1,790 640 1994 7,2171995 2,206 750 1995 6,6811996 2,224 764 1996 5,295 6,1281997 1997 5,627 6,7281998 1998 4,201 4,8391999 602 1,189 1,791 1,503 505 1999 7,597 8,2552000 662 752 1,414 1,100 515 2000 8,815 9,9012001 2,122 462 2,584 3,023 1,381 2001 7,488 8,8662002 2,506 797 3,303 3,254 958 2002 4,791 5,2422003 2,923 1,204 4,127 4,780 2,554 2003 3,078 4,2222004 2,641 2,232 4,873 4,674 2,196 2004 3,295 4,3332005 2,107 1,055 3,162 2,923 1,903 2005 3,468 4,5202006 1,589 1,056 2,645 2,568 1,516 2006 2,421 3,3042007 1,038 489 1,527 1,452 965 2007 2,601 2008 1,018 396 1,414 1,181 879 2008 2,996 2009 674 255 929 734 617 2009 1,637
a Excludes age 0.1 fish. No weir count in 1997 and 1998. b Number of fish estimated to have actually spawned. Includes fish counted during foot surveys below the weir.
During all years fish were removed at the weir for brood stock and from 1988–1996 fish were also sacrificed for disease concerns.
c From Statewide Harvest Survey (Jennings et al. 2010) for the Kasilof River sport fishery (large fish >20” only). Includes both wild and hatchery fish and an unknown number of late-run fish prior to 1996.
d Assumed wild.
53
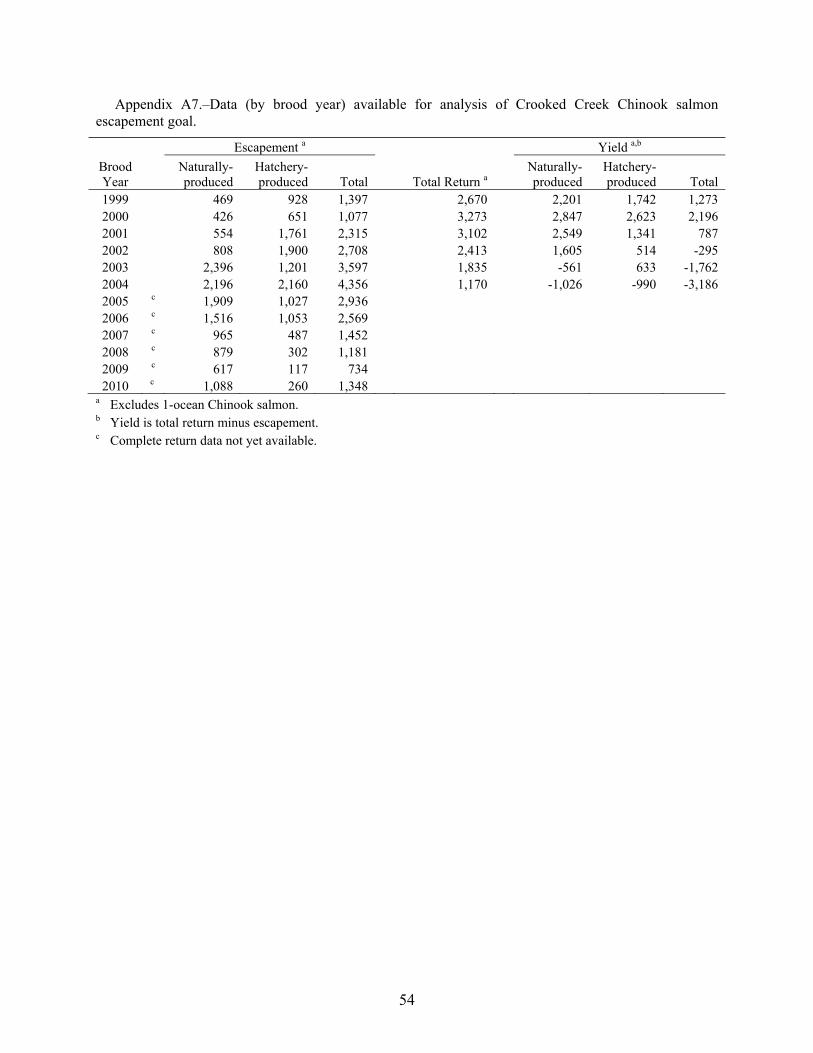
54
Appendix A7.–Data (by brood year) available for analysis of Crooked Creek Chinook salmon escapement goal.
Escapement a Yield a,b Brood Year
Naturally-produced
Hatchery-produced Total Total Return a
Naturally-produced
Hatchery-produced Total
1999 469 928 1,397 2,670 2,201 1,742 1,273 2000 426 651 1,077 3,273 2,847 2,623 2,196 2001 554 1,761 2,315 3,102 2,549 1,341 787 2002 808 1,900 2,708 2,413 1,605 514 -295 2003 2,396 1,201 3,597 1,835 -561 633 -1,762 2004 2,196 2,160 4,356 1,170 -1,026 -990 -3,186 2005 c 1,909 1,027 2,936 2006 c 1,516 1,053 2,569 2007 c 965 487 1,452 2008 c 879 302 1,181 2009 c 617 117 734 2010 c 1,088 260 1,348
a Excludes 1-ocean Chinook salmon. b Yield is total return minus escapement. c Complete return data not yet available.
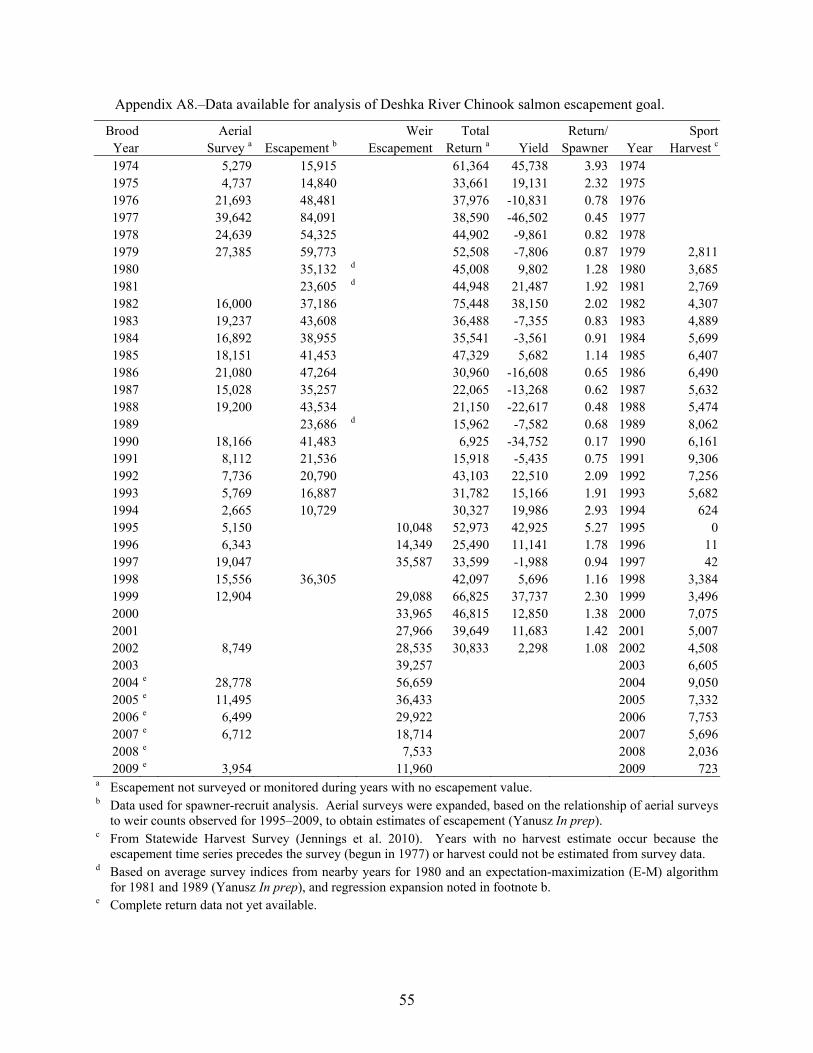
Appendix A8.–Data available for analysis of Deshka River Chinook salmon escapement goal.
Brood Aerial Weir Total Return/ SportYear Survey a Escapement b Escapement Return a Yield Spawner Year Harvest c
1974 5,279 15,915 61,364 45,738 3.93 1974 1975 4,737 14,840 33,661 19,131 2.32 1975 1976 21,693 48,481 37,976 -10,831 0.78 1976 1977 39,642 84,091 38,590 -46,502 0.45 1977 1978 24,639 54,325 44,902 -9,861 0.82 1978 1979 27,385 59,773 52,508 -7,806 0.87 1979 2,8111980 35,132 d 45,008 9,802 1.28 1980 3,6851981 23,605 d 44,948 21,487 1.92 1981 2,7691982 16,000 37,186 75,448 38,150 2.02 1982 4,3071983 19,237 43,608 36,488 -7,355 0.83 1983 4,8891984 16,892 38,955 35,541 -3,561 0.91 1984 5,6991985 18,151 41,453 47,329 5,682 1.14 1985 6,4071986 21,080 47,264 30,960 -16,608 0.65 1986 6,4901987 15,028 35,257 22,065 -13,268 0.62 1987 5,6321988 19,200 43,534 21,150 -22,617 0.48 1988 5,4741989 23,686 d 15,962 -7,582 0.68 1989 8,0621990 18,166 41,483 6,925 -34,752 0.17 1990 6,1611991 8,112 21,536 15,918 -5,435 0.75 1991 9,3061992 7,736 20,790 43,103 22,510 2.09 1992 7,2561993 5,769 16,887 31,782 15,166 1.91 1993 5,6821994 2,665 10,729 30,327 19,986 2.93 1994 6241995 5,150 10,048 52,973 42,925 5.27 1995 01996 6,343 14,349 25,490 11,141 1.78 1996 111997 19,047 35,587 33,599 -1,988 0.94 1997 421998 15,556 36,305 42,097 5,696 1.16 1998 3,3841999 12,904 29,088 66,825 37,737 2.30 1999 3,4962000 33,965 46,815 12,850 1.38 2000 7,0752001 27,966 39,649 11,683 1.42 2001 5,0072002 8,749 28,535 30,833 2,298 1.08 2002 4,5082003 39,257 2003 6,6052004 e 28,778 56,659 2004 9,0502005 e 11,495 36,433 2005 7,3322006 e 6,499 29,922 2006 7,7532007 e 6,712 18,714 2007 5,6962008 e 7,533 2008 2,0362009 e 3,954 11,960 2009 723
a Escapement not surveyed or monitored during years with no escapement value. b Data used for spawner-recruit analysis. Aerial surveys were expanded, based on the relationship of aerial surveys
to weir counts observed for 1995–2009, to obtain estimates of escapement (Yanusz In prep). c From Statewide Harvest Survey (Jennings et al. 2010). Years with no harvest estimate occur because the
escapement time series precedes the survey (begun in 1977) or harvest could not be estimated from survey data. d Based on average survey indices from nearby years for 1980 and an expectation-maximization (E-M) algorithm
for 1981 and 1989 (Yanusz In prep), and regression expansion noted in footnote b. e Complete return data not yet available.
55
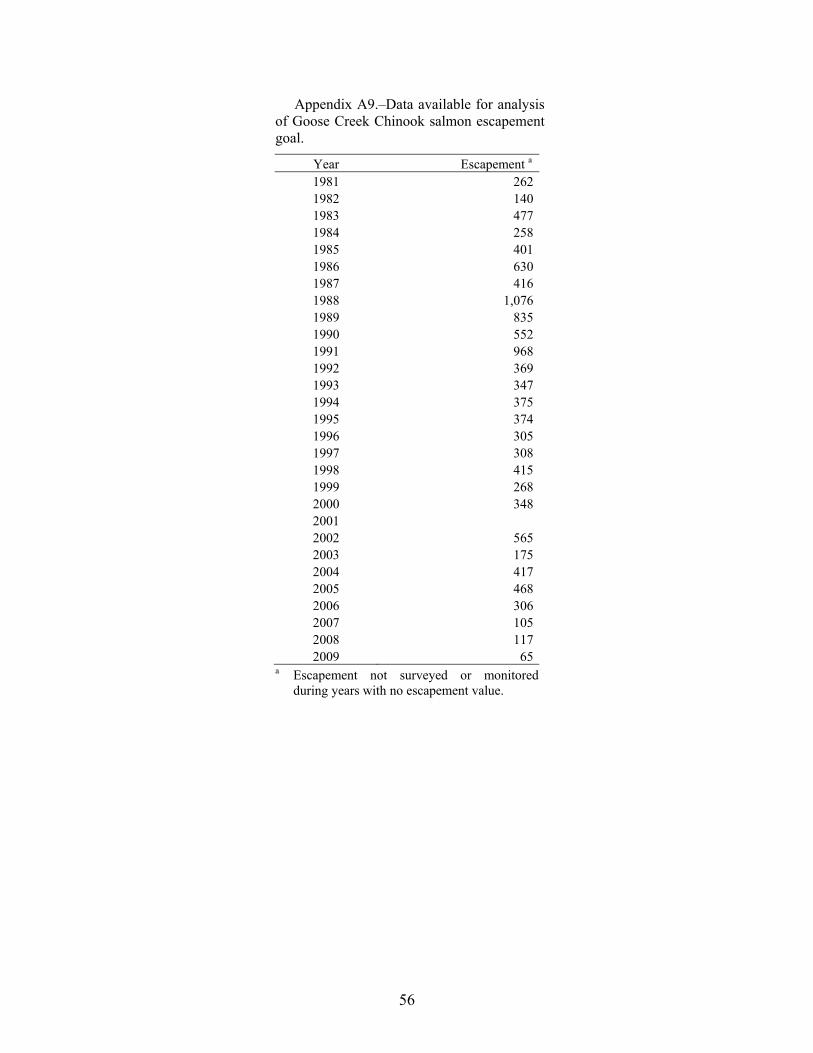
Appendix A9.–Data available for analysis of Goose Creek Chinook salmon escapement goal.
Year Escapement a 1981 2621982 1401983 4771984 2581985 4011986 6301987 4161988 1,0761989 8351990 5521991 9681992 3691993 3471994 3751995 3741996 3051997 3081998 4151999 2682000 3482001 2002 5652003 1752004 4172005 4682006 3062007 1052008 1172009 65
a Escapement not surveyed or monitored during years with no escapement value.
56
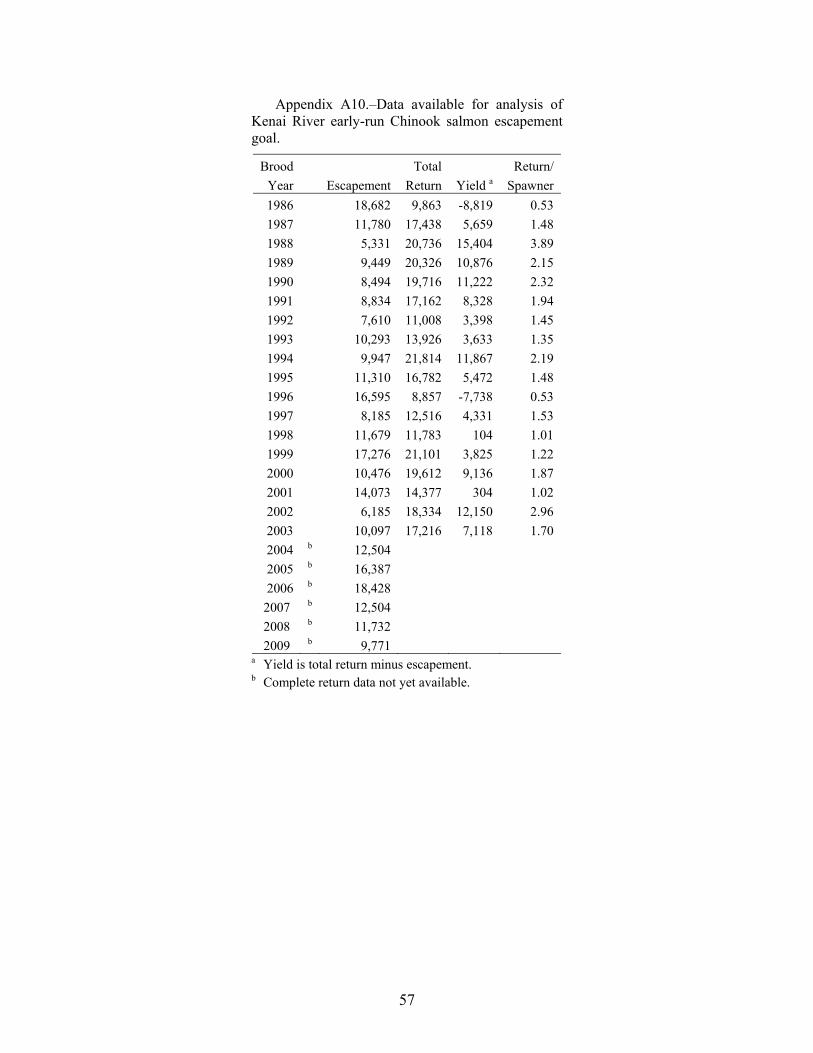
Appendix A10.–Data available for analysis of Kenai River early-run Chinook salmon escapement goal.
Brood Total Return/ Year Escapement Return Yield a Spawner 1986 18,682 9,863 -8,819 0.53 1987 11,780 17,438 5,659 1.48 1988 5,331 20,736 15,404 3.89 1989 9,449 20,326 10,876 2.15 1990 8,494 19,716 11,222 2.32 1991 8,834 17,162 8,328 1.94 1992 7,610 11,008 3,398 1.45 1993 10,293 13,926 3,633 1.35 1994 9,947 21,814 11,867 2.19 1995 11,310 16,782 5,472 1.48 1996 16,595 8,857 -7,738 0.53 1997 8,185 12,516 4,331 1.53 1998 11,679 11,783 104 1.01 1999 17,276 21,101 3,825 1.22 2000 10,476 19,612 9,136 1.87 2001 14,073 14,377 304 1.02 2002 6,185 18,334 12,150 2.96 2003 10,097 17,216 7,118 1.70 2004 b 12,504 2005 b 16,387 2006 b 18,428
2007 b 12,504 2008 b 11,732 2009 b 9,771
a Yield is total return minus escapement. b Complete return data not yet available.
57
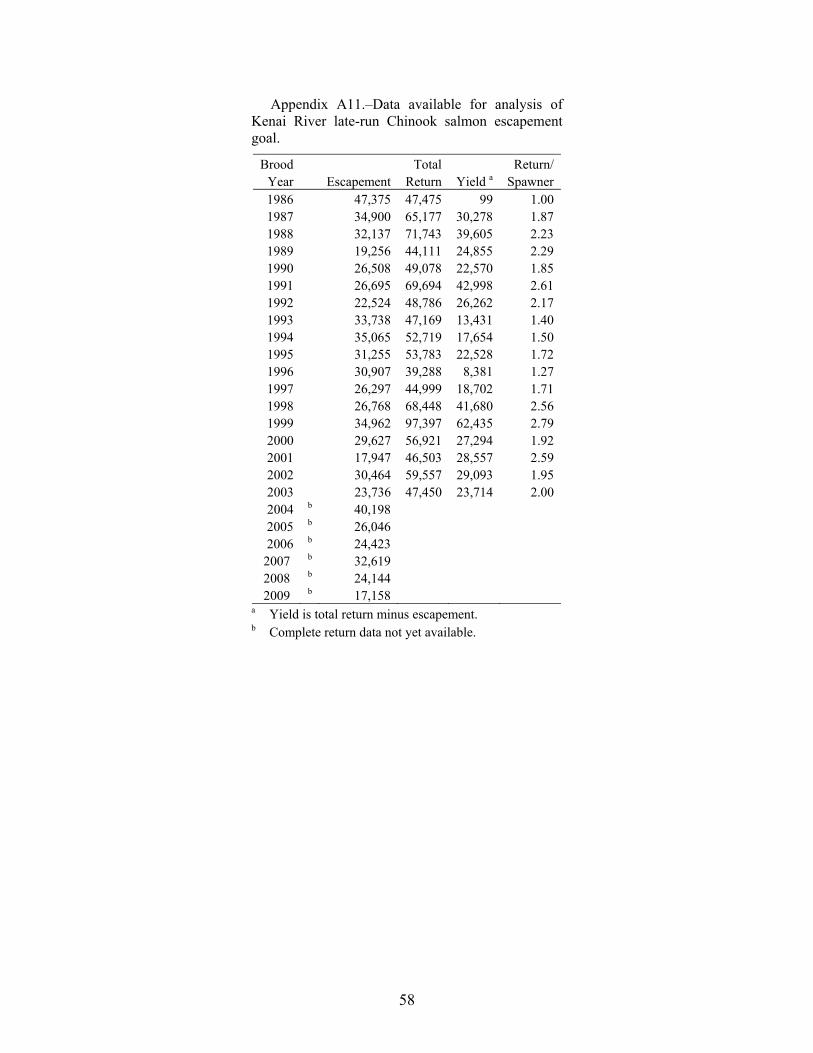
Appendix A11.–Data available for analysis of Kenai River late-run Chinook salmon escapement goal.
Brood Total Return/ Year Escapement Return Yield a Spawner 1986 47,375 47,475 99 1.00 1987 34,900 65,177 30,278 1.87 1988 32,137 71,743 39,605 2.23 1989 19,256 44,111 24,855 2.29 1990 26,508 49,078 22,570 1.85 1991 26,695 69,694 42,998 2.61 1992 22,524 48,786 26,262 2.17 1993 33,738 47,169 13,431 1.40 1994 35,065 52,719 17,654 1.50 1995 31,255 53,783 22,528 1.72 1996 30,907 39,288 8,381 1.27 1997 26,297 44,999 18,702 1.71 1998 26,768 68,448 41,680 2.56 1999 34,962 97,397 62,435 2.79 2000 29,627 56,921 27,294 1.92 2001 17,947 46,503 28,557 2.59 2002 30,464 59,557 29,093 1.95 2003 23,736 47,450 23,714 2.00 2004 b 40,198 2005 b 26,046 2006 b 24,423
2007 b 32,619 2008 b 24,144 2009 b 17,158
a Yield is total return minus escapement. b Complete return data not yet available.
58
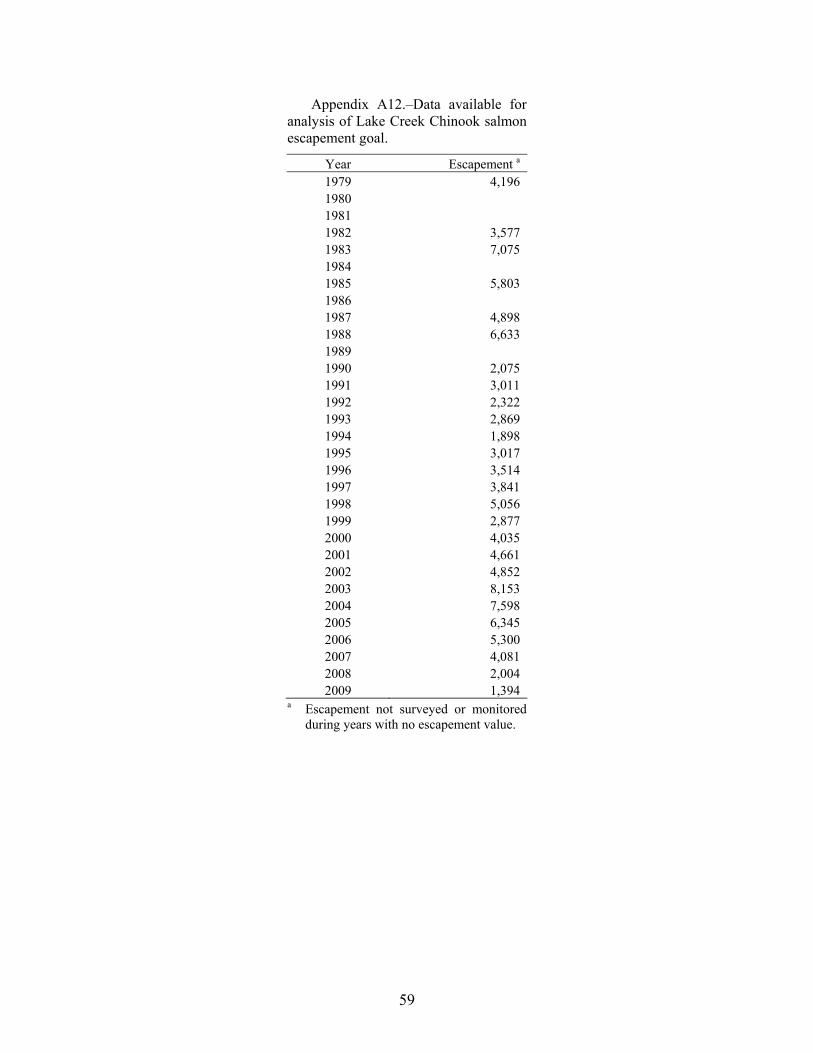
Appendix A12.–Data available for analysis of Lake Creek Chinook salmon escapement goal.
Year Escapement a 1979 4,196 1980 1981 1982 3,577 1983 7,075 1984 1985 5,803 1986 1987 4,898 1988 6,633 1989 1990 2,075 1991 3,011 1992 2,322 1993 2,869 1994 1,898 1995 3,017 1996 3,514 1997 3,841 1998 5,056 1999 2,877 2000 4,035 2001 4,661 2002 4,852 2003 8,153 2004 7,598 2005 6,345 2006 5,300 2007 4,081 2008 2,004 2009 1,394
a Escapement not surveyed or monitored during years with no escapement value.
59
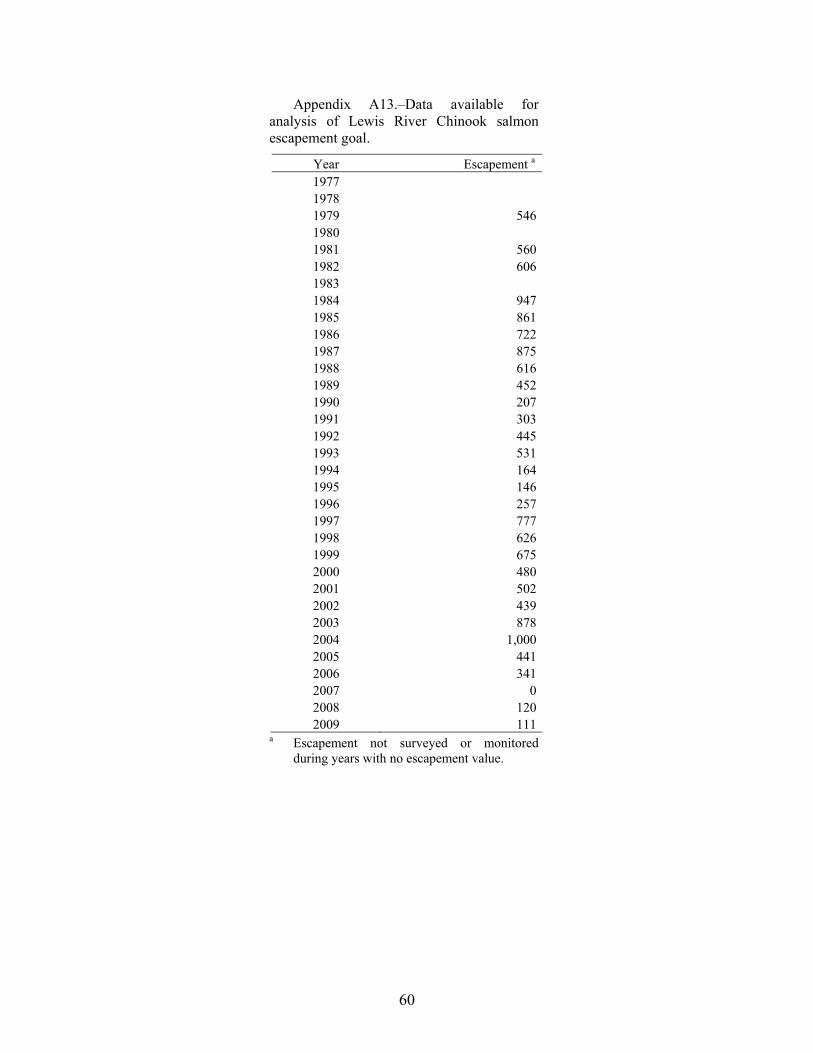
Appendix A13.–Data available for analysis of Lewis River Chinook salmon escapement goal.
Year Escapement a 1977 1978 1979 5461980 1981 5601982 6061983 1984 9471985 8611986 7221987 8751988 6161989 4521990 2071991 3031992 4451993 5311994 1641995 1461996 2571997 7771998 6261999 6752000 4802001 5022002 4392003 8782004 1,0002005 4412006 3412007 02008 1202009 111
a Escapement not surveyed or monitored during years with no escapement value.
60
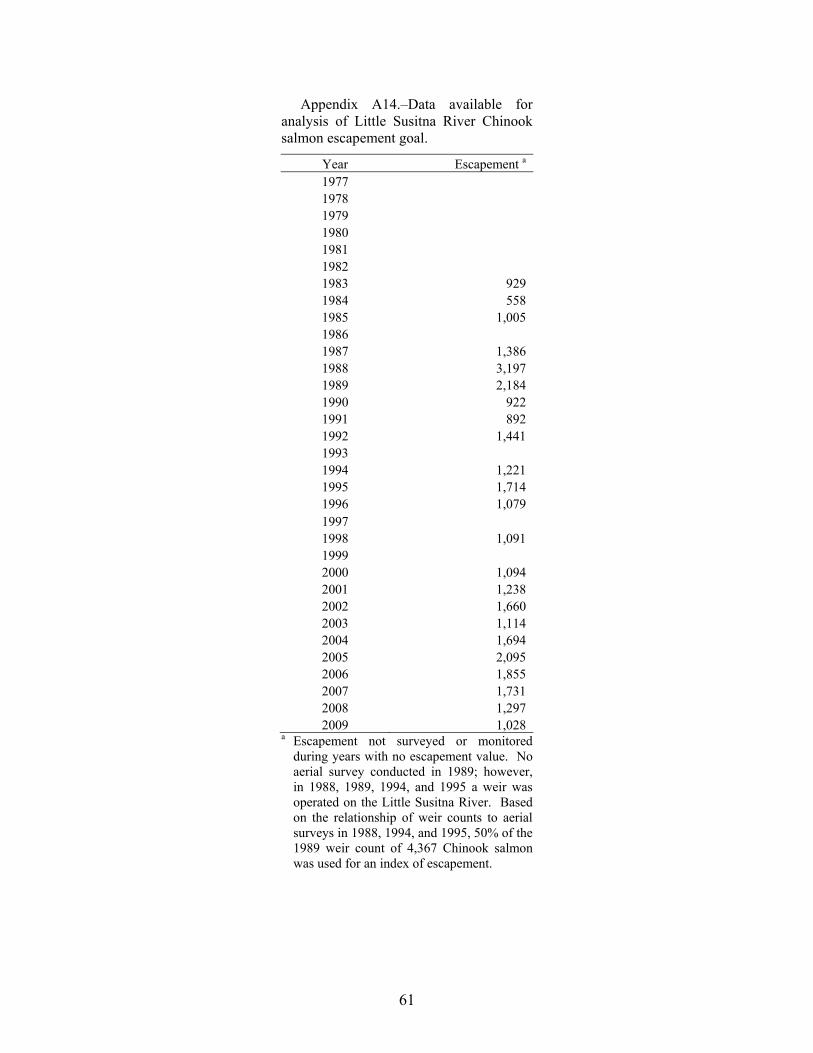
Appendix A14.–Data available for analysis of Little Susitna River Chinook salmon escapement goal.
Year Escapement a 1977 1978 1979 1980 1981 1982 1983 929 1984 558 1985 1,005 1986 1987 1,386 1988 3,197 1989 2,184 1990 922 1991 892 1992 1,441 1993 1994 1,221 1995 1,714 1996 1,079 1997 1998 1,091 1999 2000 1,094 2001 1,238 2002 1,660 2003 1,114 2004 1,694 2005 2,095 2006 1,855 2007 1,731 2008 1,297 2009 1,028
a Escapement not surveyed or monitored during years with no escapement value. No aerial survey conducted in 1989; however, in 1988, 1989, 1994, and 1995 a weir was operated on the Little Susitna River. Based on the relationship of weir counts to aerial surveys in 1988, 1994, and 1995, 50% of the 1989 weir count of 4,367 Chinook salmon was used for an index of escapement.
61
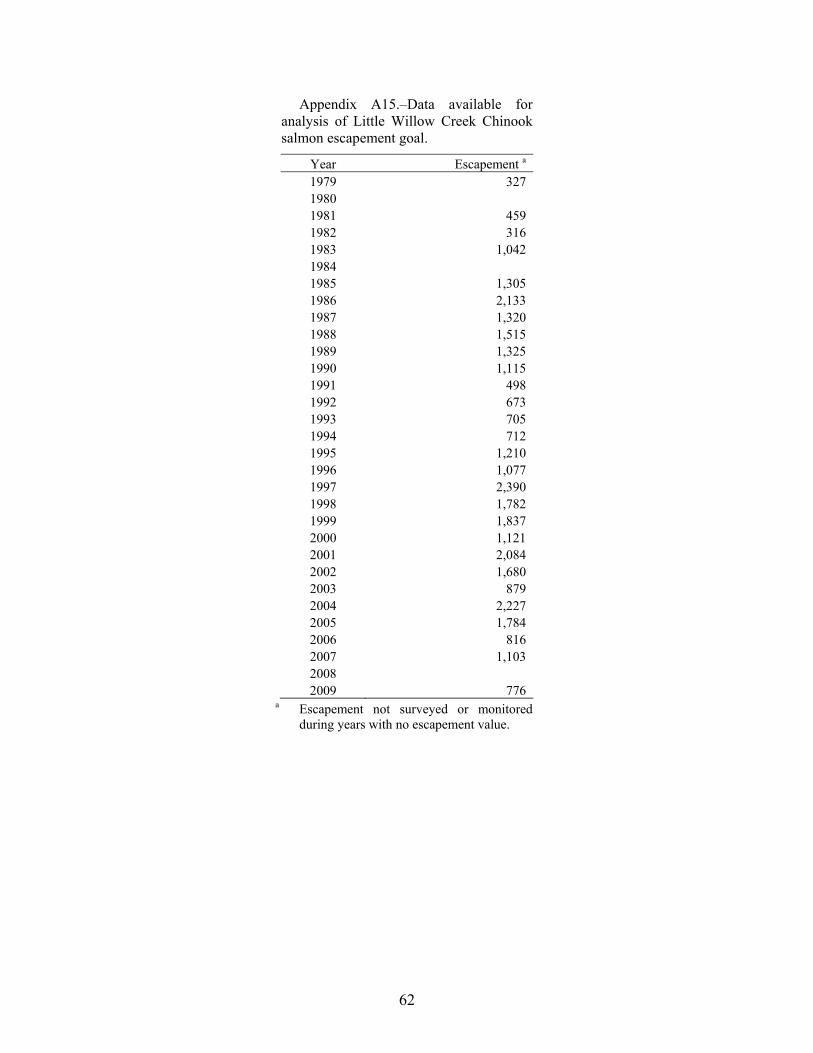
Appendix A15.–Data available for analysis of Little Willow Creek Chinook salmon escapement goal.
Year Escapement a 1979 327 1980 1981 459 1982 316 1983 1,042 1984 1985 1,305 1986 2,133 1987 1,320 1988 1,515 1989 1,325 1990 1,115 1991 498 1992 673 1993 705 1994 712 1995 1,210 1996 1,077 1997 2,390 1998 1,782 1999 1,837 2000 1,121 2001 2,084 2002 1,680 2003 879 2004 2,227 2005 1,784 2006 816 2007 1,103 2008 2009 776
a Escapement not surveyed or monitored during years with no escapement value.
62
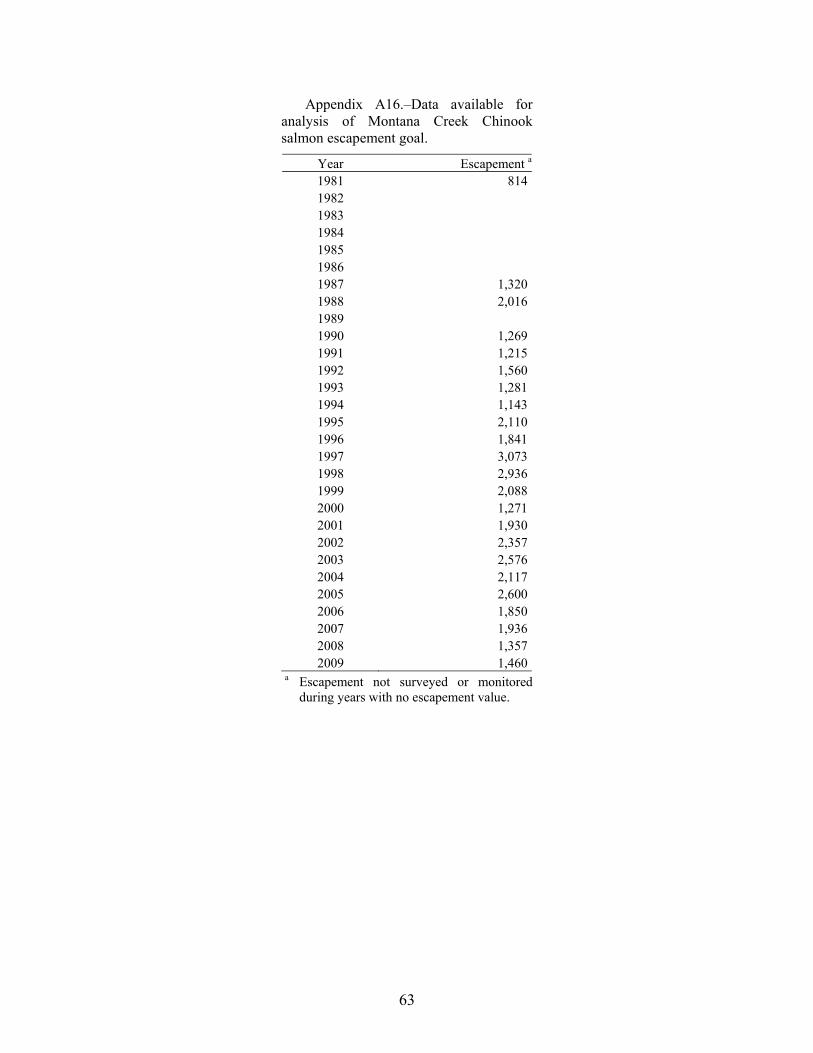
Appendix A16.–Data available for analysis of Montana Creek Chinook salmon escapement goal.
Year Escapement a
1981 8141982 1983 1984 1985 1986 1987 1,3201988 2,0161989 1990 1,2691991 1,2151992 1,5601993 1,2811994 1,1431995 2,1101996 1,8411997 3,0731998 2,9361999 2,0882000 1,2712001 1,9302002 2,3572003 2,5762004 2,1172005 2,6002006 1,8502007 1,9362008 1,3572009 1,460
a Escapement not surveyed or monitored during years with no escapement value.
63
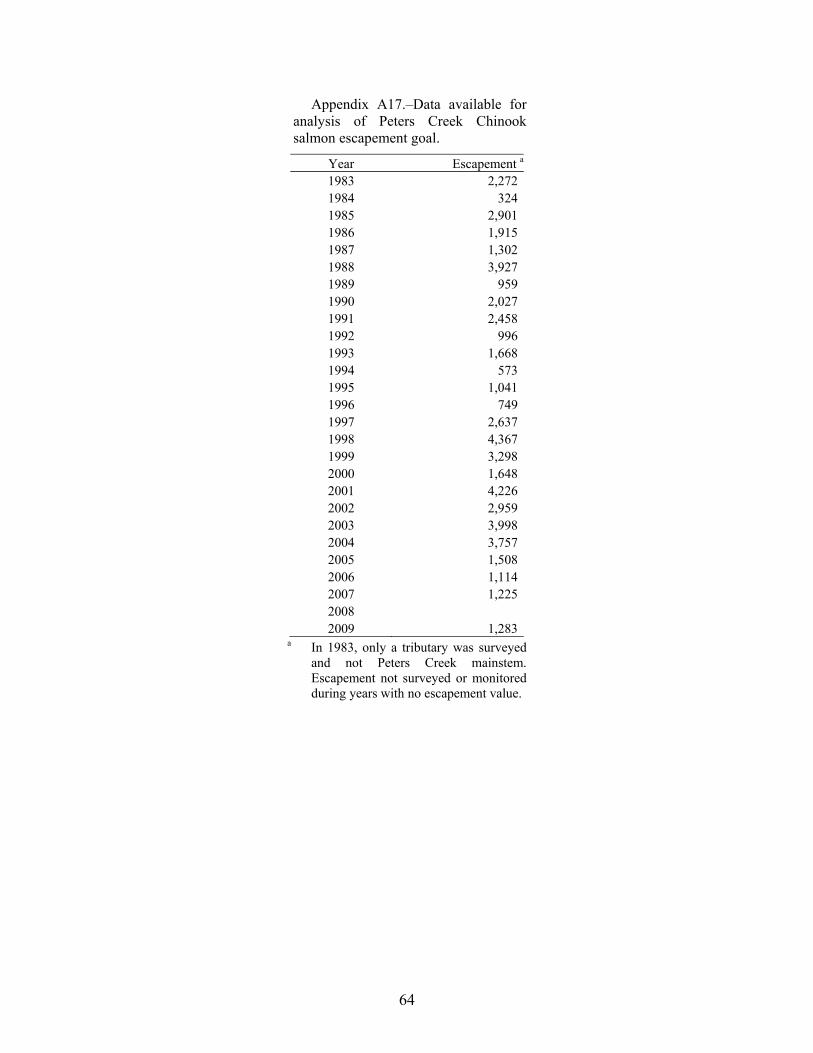
Appendix A17.–Data available for analysis of Peters Creek Chinook salmon escapement goal.
Year Escapement a
1983 2,2721984 3241985 2,9011986 1,9151987 1,3021988 3,9271989 9591990 2,0271991 2,4581992 9961993 1,6681994 5731995 1,0411996 7491997 2,6371998 4,3671999 3,2982000 1,6482001 4,2262002 2,9592003 3,9982004 3,7572005 1,5082006 1,1142007 1,2252008 2009 1,283
a In 1983, only a tributary was surveyed and not Peters Creek mainstem. Escapement not surveyed or monitored during years with no escapement value.
64
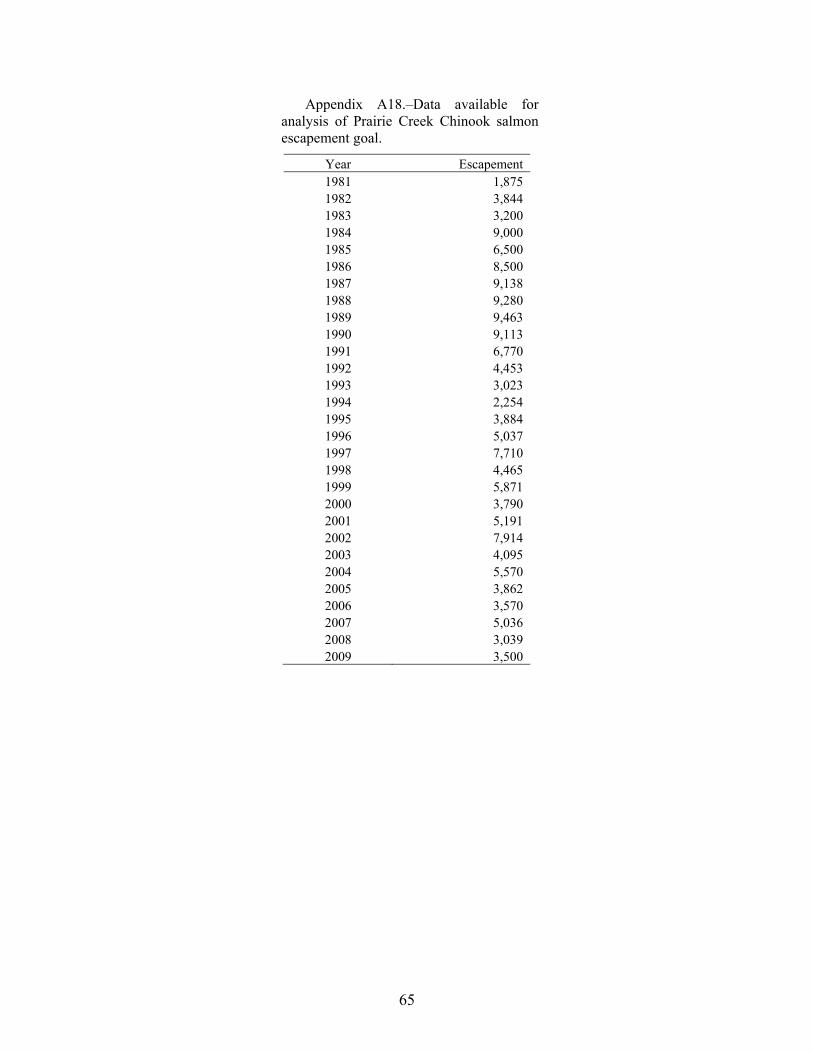
65
Appendix A18.–Data available for analysis of Prairie Creek Chinook salmon escapement goal.
Year Escapement 1981 1,875 1982 3,844 1983 3,200 1984 9,000 1985 6,500 1986 8,500 1987 9,138 1988 9,280 1989 9,463 1990 9,113 1991 6,770 1992 4,453 1993 3,023 1994 2,254 1995 3,884 1996 5,037 1997 7,710 1998 4,465 1999 5,871 2000 3,790 2001 5,191 2002 7,914 2003 4,095 2004 5,570 2005 3,862 2006 3,570 2007 5,036 2008 3,039 2009 3,500
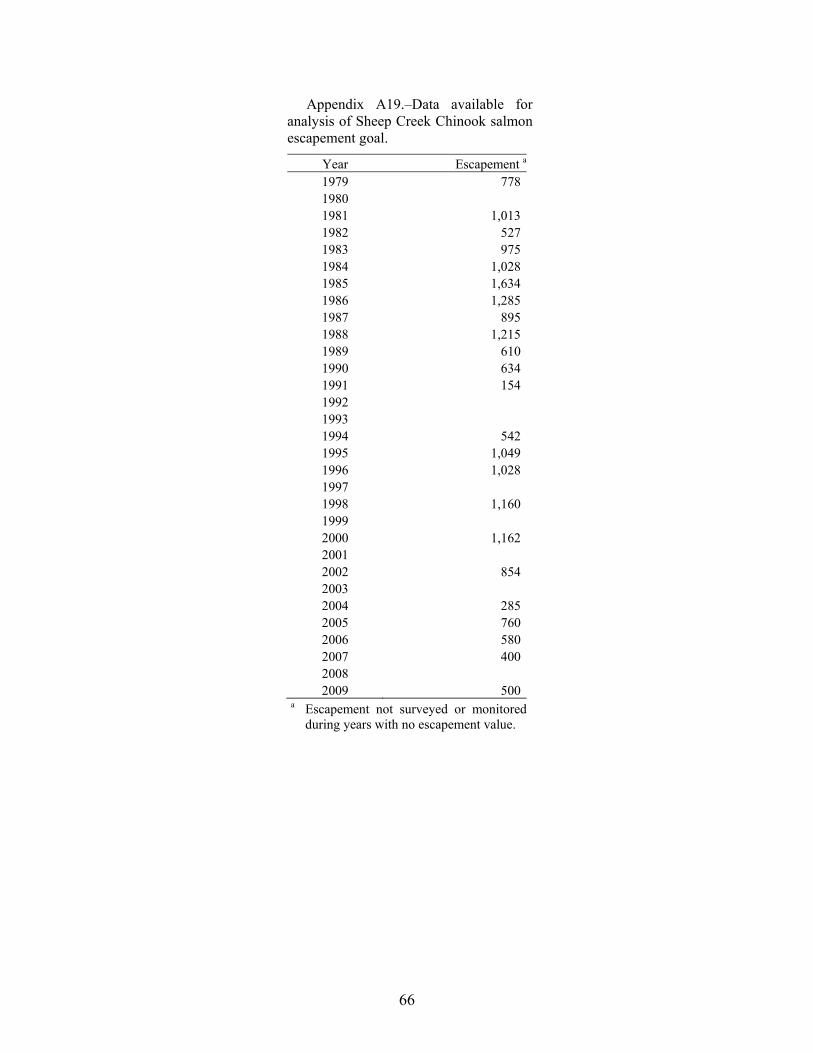
Appendix A19.–Data available for analysis of Sheep Creek Chinook salmon escapement goal.
Year Escapement a
1979 7781980 1981 1,0131982 5271983 9751984 1,0281985 1,6341986 1,2851987 8951988 1,2151989 6101990 6341991 1541992 1993 1994 5421995 1,0491996 1,0281997 1998 1,1601999 2000 1,1622001 2002 8542003 2004 2852005 7602006 5802007 4002008 2009 500
a Escapement not surveyed or monitored during years with no escapement value.
66
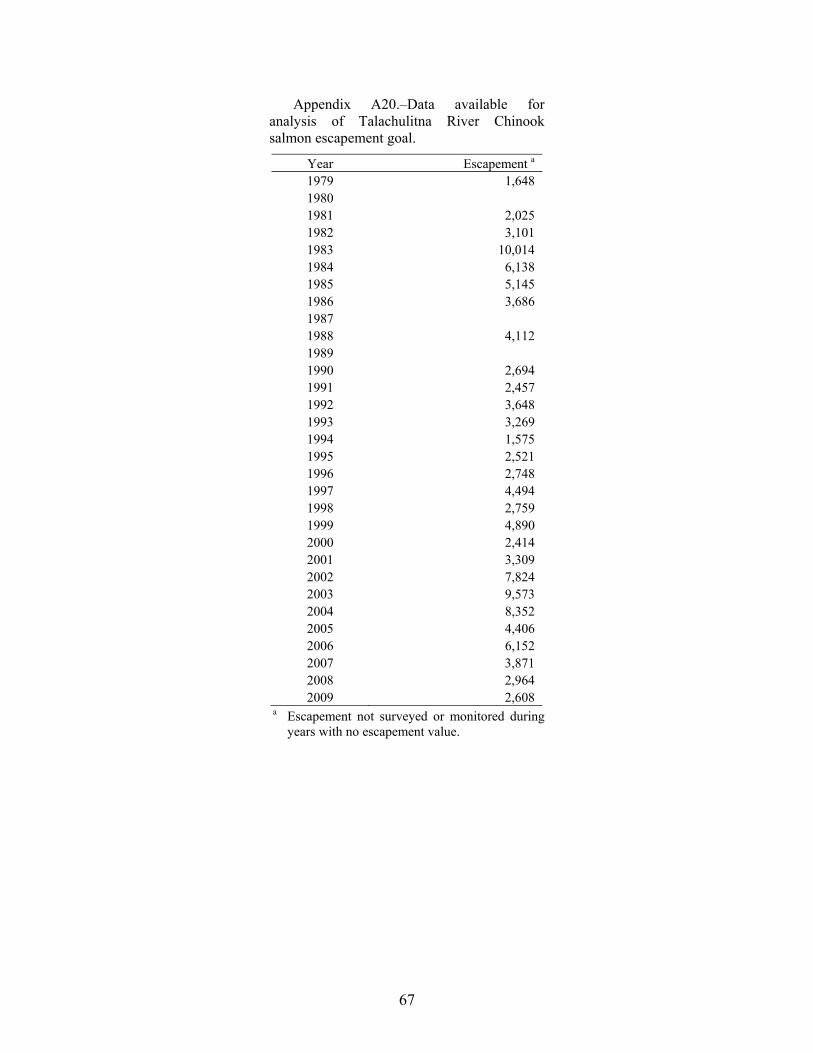
67
Appendix A20.–Data available for analysis of Talachulitna River Chinook salmon escapement goal.
Year Escapement a 1979 1,648 1980 1981 2,025 1982 3,101 1983 10,014 1984 6,138 1985 5,145 1986 3,686 1987 1988 4,112 1989 1990 2,694 1991 2,457 1992 3,648 1993 3,269 1994 1,575 1995 2,521 1996 2,748 1997 4,494 1998 2,759 1999 4,890 2000 2,414 2001 3,309 2002 7,824 2003 9,573 2004 8,352 2005 4,406 2006 6,152 2007 3,871 2008 2,964 2009 2,608
a Escapement not surveyed or monitored during years with no escapement value.
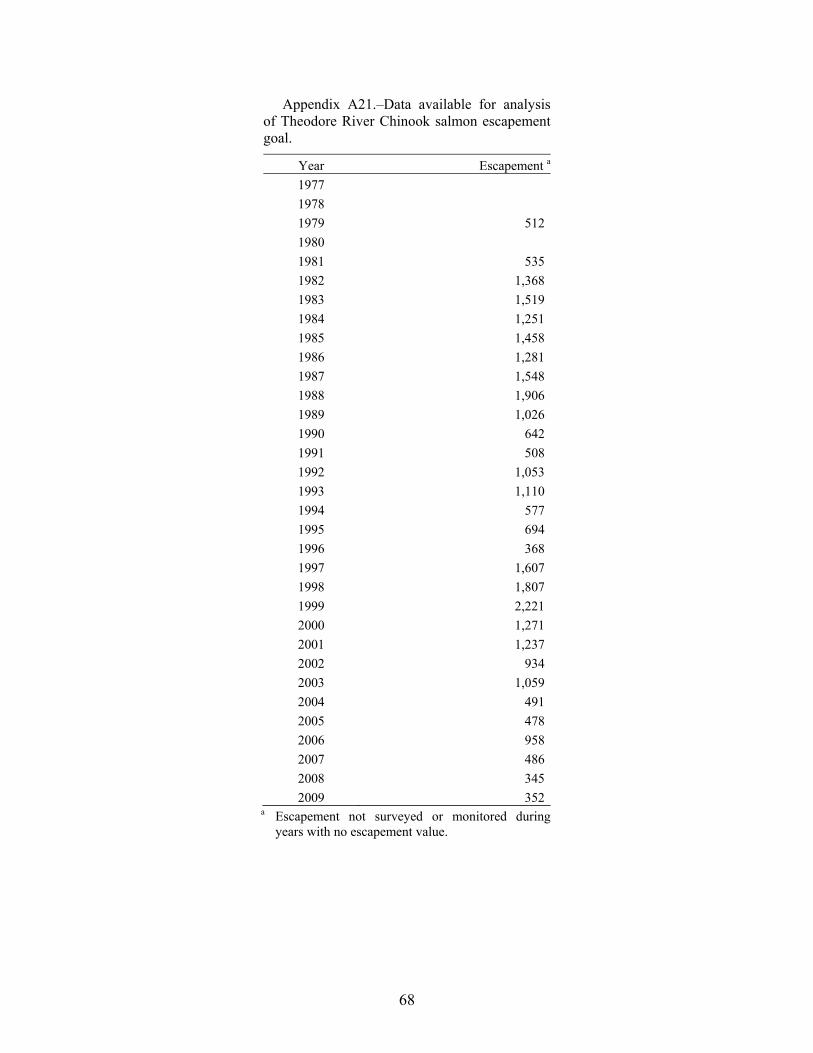
Appendix A21.–Data available for analysis of Theodore River Chinook salmon escapement goal.
Year Escapement a
1977 1978 1979 5121980 1981 5351982 1,3681983 1,5191984 1,2511985 1,4581986 1,2811987 1,5481988 1,9061989 1,0261990 6421991 5081992 1,0531993 1,1101994 5771995 6941996 3681997 1,6071998 1,8071999 2,2212000 1,2712001 1,2372002 9342003 1,0592004 4912005 4782006 9582007 4862008 3452009 352
a Escapement not surveyed or monitored during years with no escapement value.
68
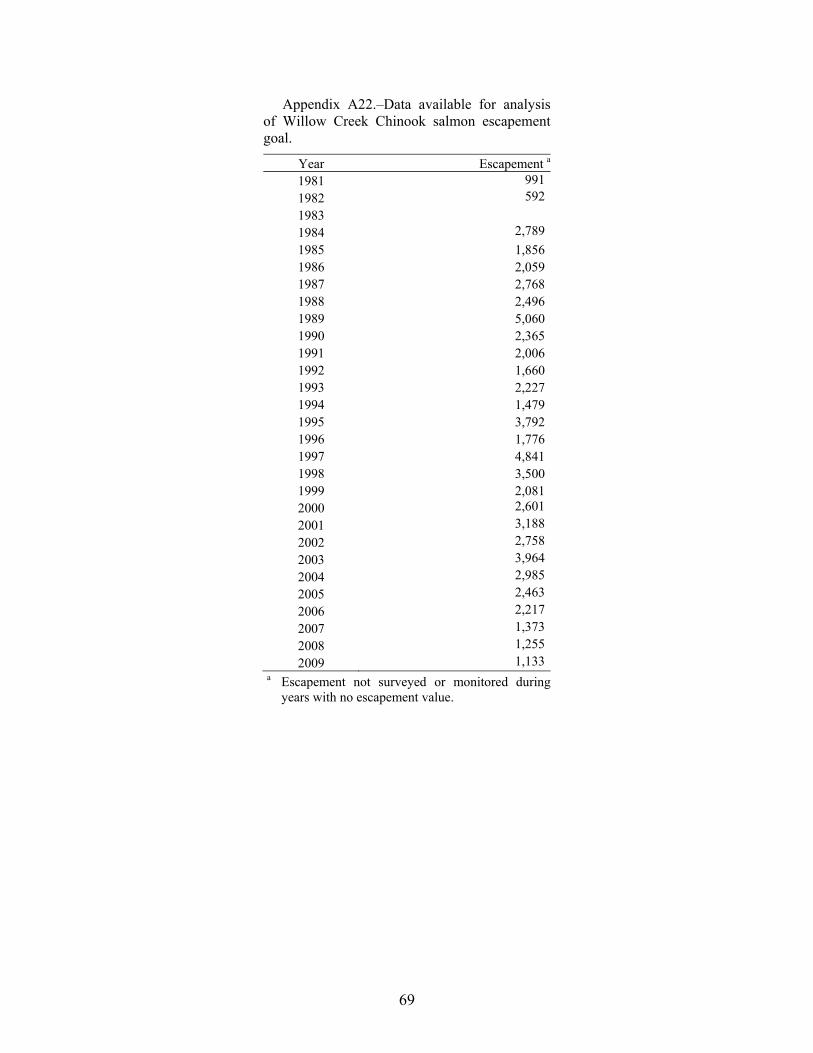
69
Appendix A22.–Data available for analysis of Willow Creek Chinook salmon escapement goal.
Year Escapement a
1981 9911982 5921983 1984 2,7891985 1,8561986 2,0591987 2,7681988 2,4961989 5,0601990 2,3651991 2,0061992 1,6601993 2,2271994 1,4791995 3,7921996 1,7761997 4,8411998 3,5001999 2,0812000 2,6012001 3,1882002 2,7582003 3,9642004 2,9852005 2,4632006 2,2172007 1,3732008 1,2552009 1,133
a Escapement not surveyed or monitored during years with no escapement value.

70
APPENDIX B. SUPPORTING INFORMATION FOR UPPER COOK INLET
COHO SALMON ESCAPEMENT GOALS
71
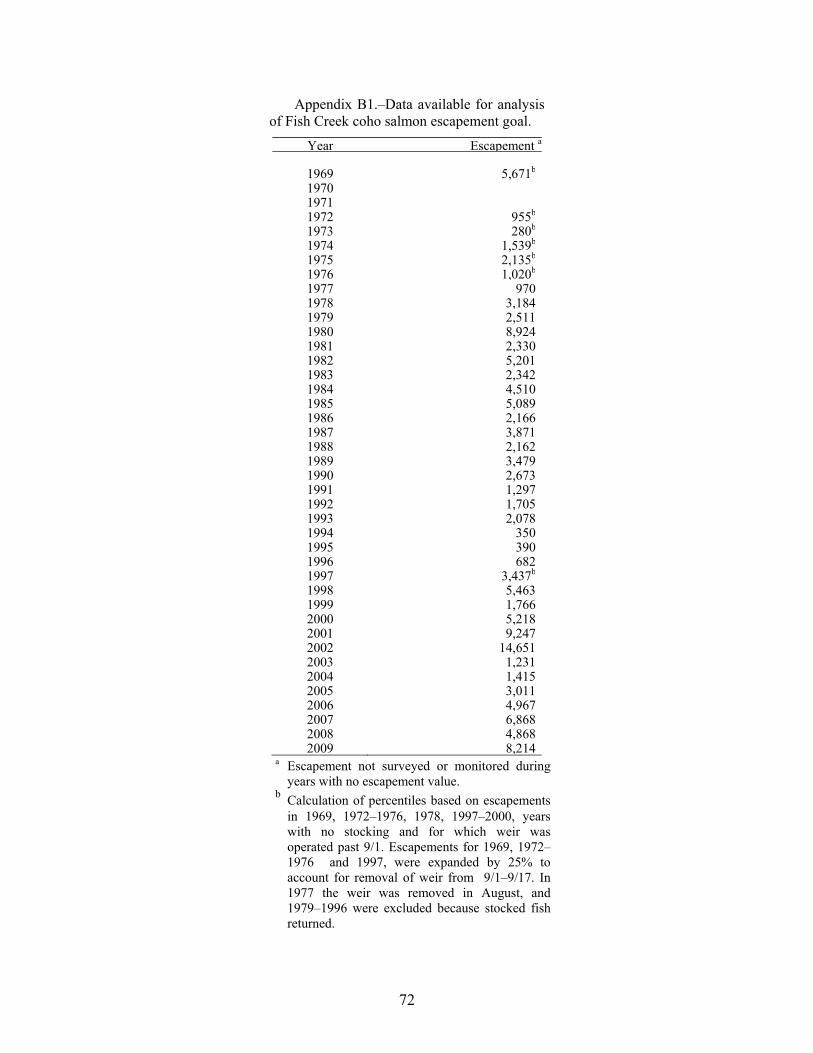
Appendix B1.–Data available for analysis of Fish Creek coho salmon escapement goal.
Year Escapement a
1969 5,671b
197019711972 955b
1973 280b
1974 1,539b
1975 2,135b
1976 1,020b
1977 9701978 3,1841979 2,5111980 8,9241981 2,3301982 5,2011983 2,3421984 4,5101985 5,0891986 2,1661987 3,8711988 2,1621989 3,4791990 2,6731991 1,2971992 1,7051993 2,0781994 3501995 3901996 6821997 3,437b
1998 5,4631999 1,7662000 5,2182001 9,2472002 14,6512003 1,2312004 1,4152005 3,0112006 4,9672007 6,8682008 4,8682009 8,214
a Escapement not surveyed or monitored during years with no escapement value.
b Calculation of percentiles based on escapements in 1969, 1972–1976, 1978, 1997–2000, years with no stocking and for which weir was operated past 9/1. Escapements for 1969, 1972–1976 and 1997, were expanded by 25% to account for removal of weir from 9/1–9/17. In 1977 the weir was removed in August, and 1979–1996 were excluded because stocked fish returned.
72
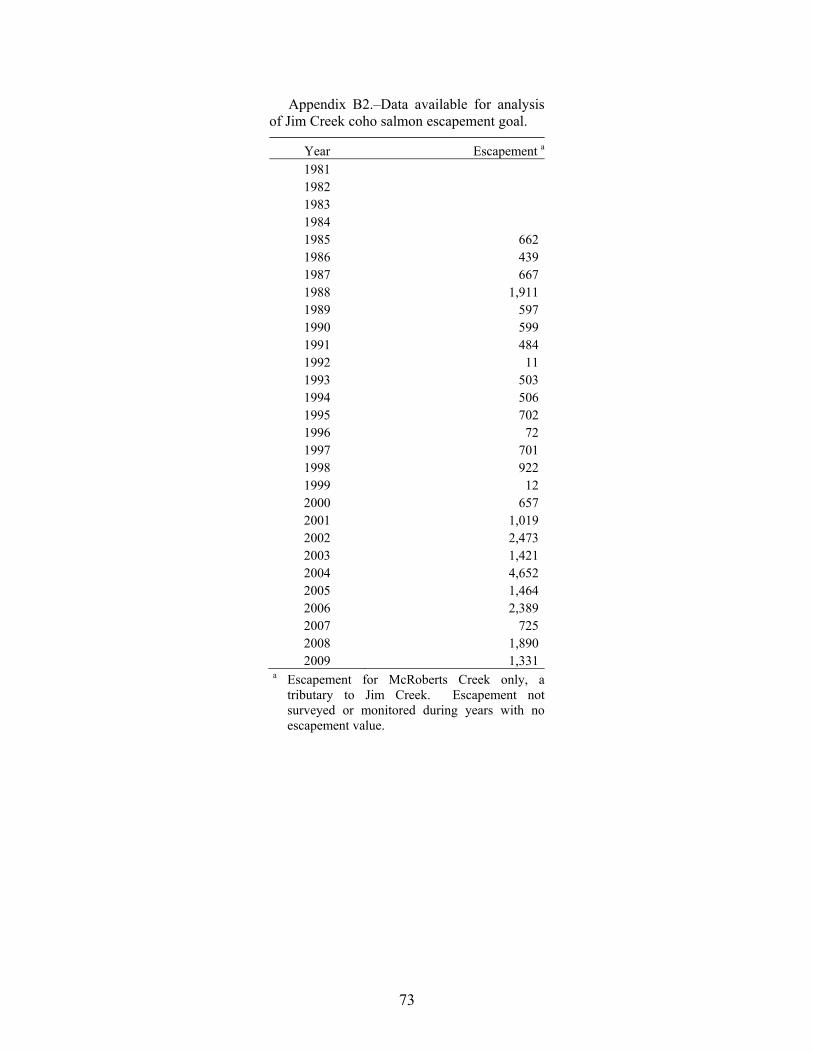
73
Appendix B2.–Data available for analysis of Jim Creek coho salmon escapement goal.
Year Escapement a
1981 1982 1983 1984 1985 6621986 4391987 6671988 1,9111989 5971990 5991991 4841992 111993 5031994 5061995 7021996 721997 7011998 9221999 122000 6572001 1,0192002 2,4732003 1,4212004 4,6522005 1,4642006 2,3892007 7252008 1,8902009 1,331
a Escapement for McRoberts Creek only, a tributary to Jim Creek. Escapement not surveyed or monitored during years with no escapement value.
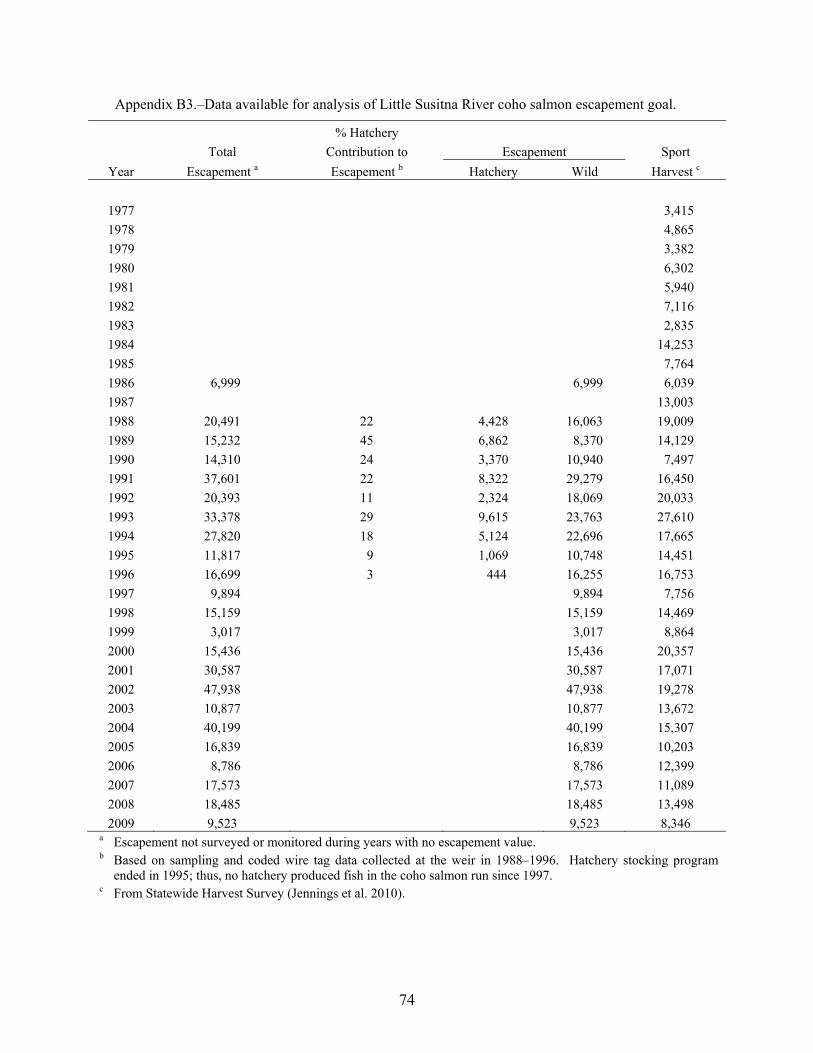
Appendix B3.–Data available for analysis of Little Susitna River coho salmon escapement goal.
% Hatchery Total Contribution to Escapement Sport
Year Escapement a Escapement b Hatchery Wild Harvest c
1977 3,415 1978 4,865 1979 3,382 1980 6,302 1981 5,940 1982 7,116 1983 2,835 1984 14,253 1985 7,764 1986 6,999 6,999 6,039 1987 13,003 1988 20,491 22 4,428 16,063 19,009 1989 15,232 45 6,862 8,370 14,129 1990 14,310 24 3,370 10,940 7,497 1991 37,601 22 8,322 29,279 16,450 1992 20,393 11 2,324 18,069 20,033 1993 33,378 29 9,615 23,763 27,610 1994 27,820 18 5,124 22,696 17,665 1995 11,817 9 1,069 10,748 14,451 1996 16,699 3 444 16,255 16,753 1997 9,894 9,894 7,756 1998 15,159 15,159 14,469 1999 3,017 3,017 8,864 2000 15,436 15,436 20,357 2001 30,587 30,587 17,071 2002 47,938 47,938 19,278 2003 10,877 10,877 13,672 2004 40,199 40,199 15,307 2005 16,839 16,839 10,203 2006 8,786 8,786 12,399 2007 17,573 17,573 11,089 2008 18,485 18,485 13,498 2009 9,523 9,523 8,346
a Escapement not surveyed or monitored during years with no escapement value. b Based on sampling and coded wire tag data collected at the weir in 1988–1996. Hatchery stocking program
ended in 1995; thus, no hatchery produced fish in the coho salmon run since 1997. c From Statewide Harvest Survey (Jennings et al. 2010).
74
APPENDIX C. SUPPORTING INFORMATION FOR UPPER COOK INLET
SOCKEYE SALMON ESCAPEMENT GOALS
75
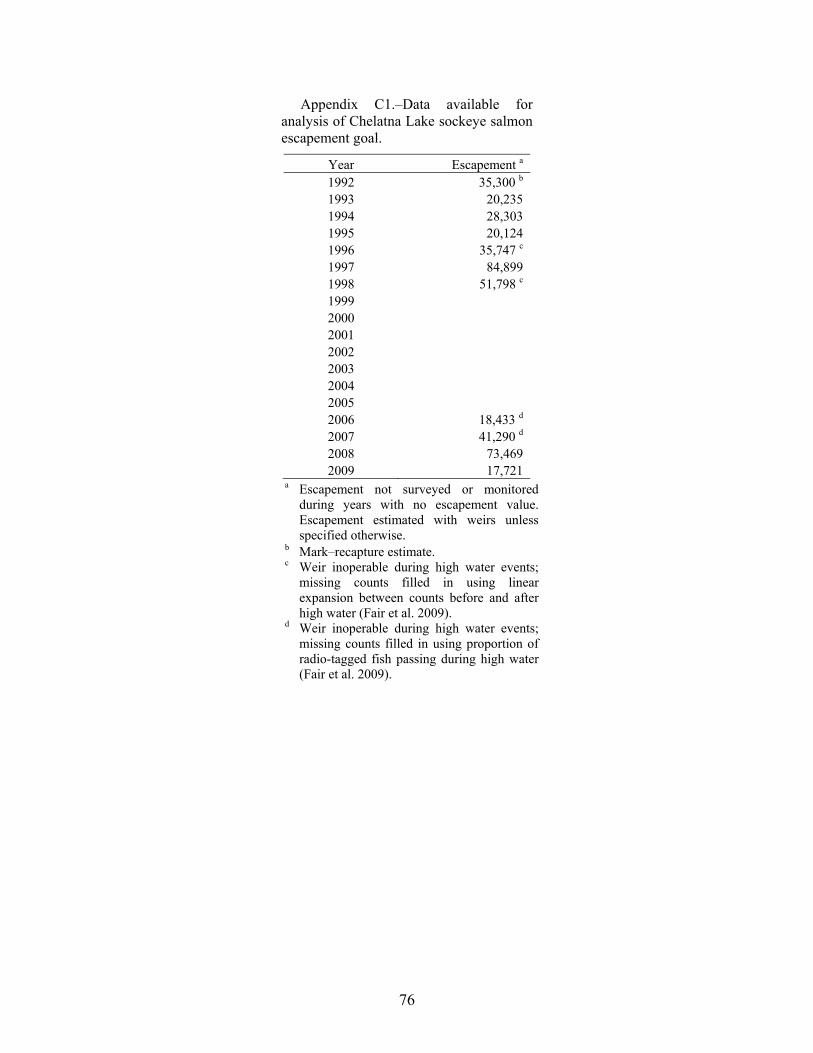
Appendix C1.–Data available for analysis of Chelatna Lake sockeye salmon escapement goal.
Year Escapement a 1992 35,300 b 1993 20,235 1994 28,303 1995 20,124 1996 35,747 c 1997 84,899 1998 51,798 c 1999 2000 2001 2002 2003 2004 2005 2006 18,433 d 2007 41,290 d 2008 73,469 2009 17,721
a Escapement not surveyed or monitored during years with no escapement value. Escapement estimated with weirs unless specified otherwise.
b Mark–recapture estimate. c Weir inoperable during high water events;
missing counts filled in using linear expansion between counts before and after high water (Fair et al. 2009).
d Weir inoperable during high water events; missing counts filled in using proportion of radio-tagged fish passing during high water (Fair et al. 2009).
76
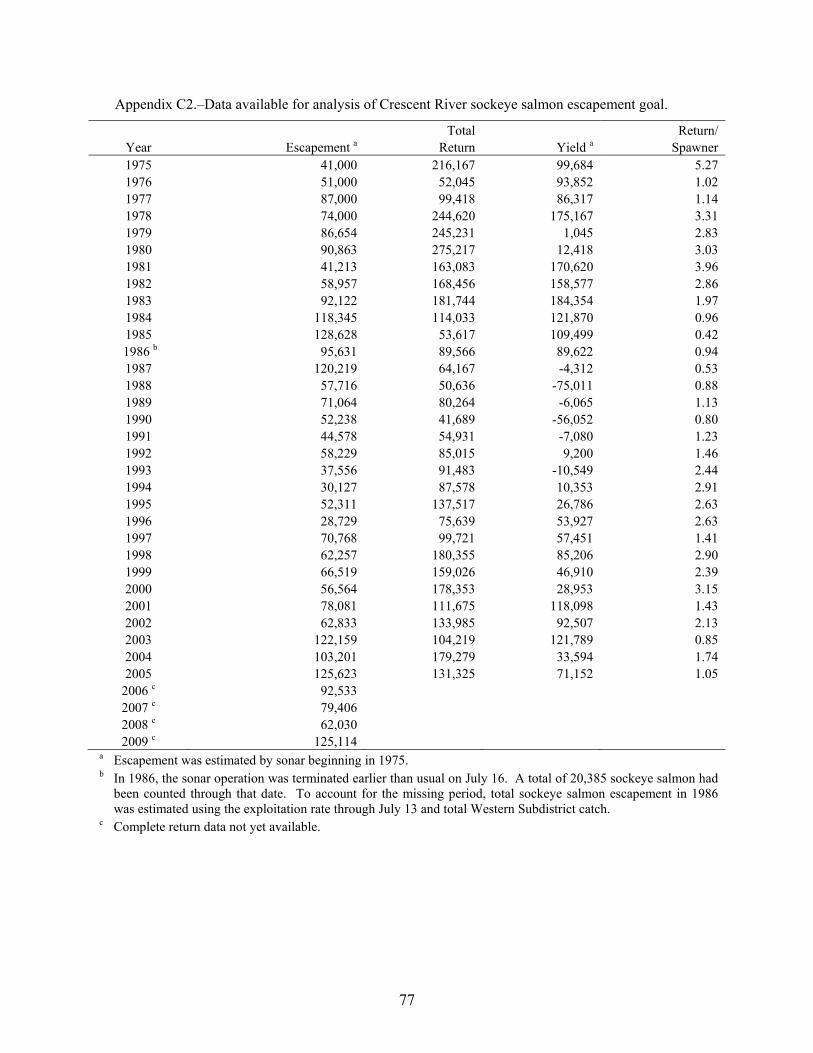
77
Appendix C2.–Data available for analysis of Crescent River sockeye salmon escapement goal.
Total Return/ Year Escapement a Return Yield a Spawner 1975 41,000 216,167 99,684 5.27 1976 51,000 52,045 93,852 1.02 1977 87,000 99,418 86,317 1.14 1978 74,000 244,620 175,167 3.31 1979 86,654 245,231 1,045 2.83 1980 90,863 275,217 12,418 3.03 1981 41,213 163,083 170,620 3.96 1982 58,957 168,456 158,577 2.86 1983 92,122 181,744 184,354 1.97 1984 118,345 114,033 121,870 0.96 1985 128,628 53,617 109,499 0.42
1986 b 95,631 89,566 89,622 0.94 1987 120,219 64,167 -4,312 0.53 1988 57,716 50,636 -75,011 0.88 1989 71,064 80,264 -6,065 1.13 1990 52,238 41,689 -56,052 0.80 1991 44,578 54,931 -7,080 1.23 1992 58,229 85,015 9,200 1.46 1993 37,556 91,483 -10,549 2.44 1994 30,127 87,578 10,353 2.91 1995 52,311 137,517 26,786 2.63 1996 28,729 75,639 53,927 2.63 1997 70,768 99,721 57,451 1.41 1998 62,257 180,355 85,206 2.90 1999 66,519 159,026 46,910 2.39 2000 56,564 178,353 28,953 3.15 2001 78,081 111,675 118,098 1.43 2002 62,833 133,985 92,507 2.13 2003 122,159 104,219 121,789 0.85 2004 103,201 179,279 33,594 1.74 2005 125,623 131,325 71,152 1.05
2006 c 92,533 2007 c 79,406 2008 c 62,030 2009 c 125,114
a Escapement was estimated by sonar beginning in 1975. b In 1986, the sonar operation was terminated earlier than usual on July 16. A total of 20,385 sockeye salmon had
been counted through that date. To account for the missing period, total sockeye salmon escapement in 1986 was estimated using the exploitation rate through July 13 and total Western Subdistrict catch.
c Complete return data not yet available.
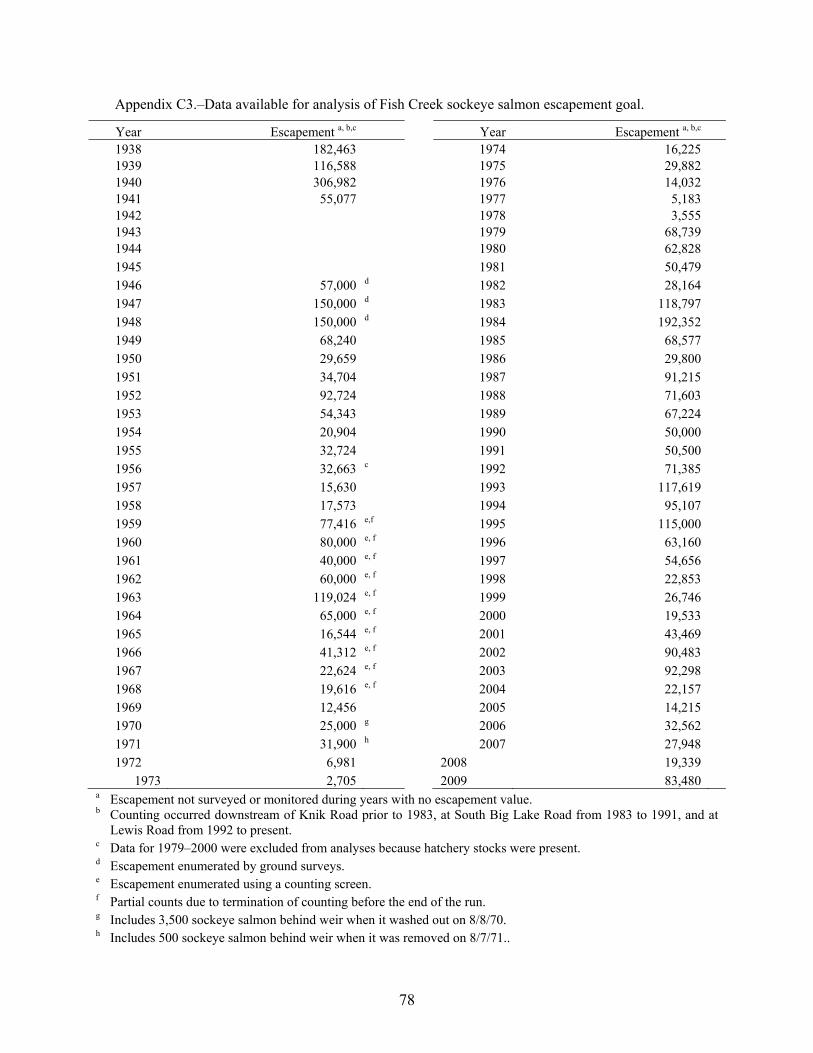
Appendix C3.–Data available for analysis of Fish Creek sockeye salmon escapement goal.
Year Escapement a, b,c Year Escapement a, b,c 1938 182,463 1974 16,225 1939 116,588 1975 29,882 1940 306,982 1976 14,032 1941 55,077 1977 5,183 1942 1978 3,555 1943 1979 68,739 1944 1980 62,828 1945 1981 50,479 1946 57,000 d 1982 28,164 1947 150,000 d 1983 118,797 1948 150,000 d 1984 192,352 1949 68,240 1985 68,577 1950 29,659 1986 29,800 1951 34,704 1987 91,215 1952 92,724 1988 71,603 1953 54,343 1989 67,224 1954 20,904 1990 50,000 1955 32,724 1991 50,500 1956 32,663 c 1992 71,385 1957 15,630 1993 117,619 1958 17,573 1994 95,107 1959 77,416 e,f 1995 115,000 1960 80,000 e, f 1996 63,160 1961 40,000 e, f 1997 54,656 1962 60,000 e, f 1998 22,853 1963 119,024 e, f 1999 26,746 1964 65,000 e, f 2000 19,533 1965 16,544 e, f 2001 43,469 1966 41,312 e, f 2002 90,483 1967 22,624 e, f 2003 92,298 1968 19,616 e, f 2004 22,157 1969 12,456 2005 14,215 1970 25,000 g 2006 32,562 1971 31,900 h 2007 27,948 1972 6,981 2008 19,339
1973 2,705 2009 83,480 a Escapement not surveyed or monitored during years with no escapement value. b Counting occurred downstream of Knik Road prior to 1983, at South Big Lake Road from 1983 to 1991, and at
Lewis Road from 1992 to present. c Data for 1979–2000 were excluded from analyses because hatchery stocks were present. d Escapement enumerated by ground surveys. e Escapement enumerated using a counting screen. f Partial counts due to termination of counting before the end of the run. g Includes 3,500 sockeye salmon behind weir when it washed out on 8/8/70. h Includes 500 sockeye salmon behind weir when it was removed on 8/7/71..
78
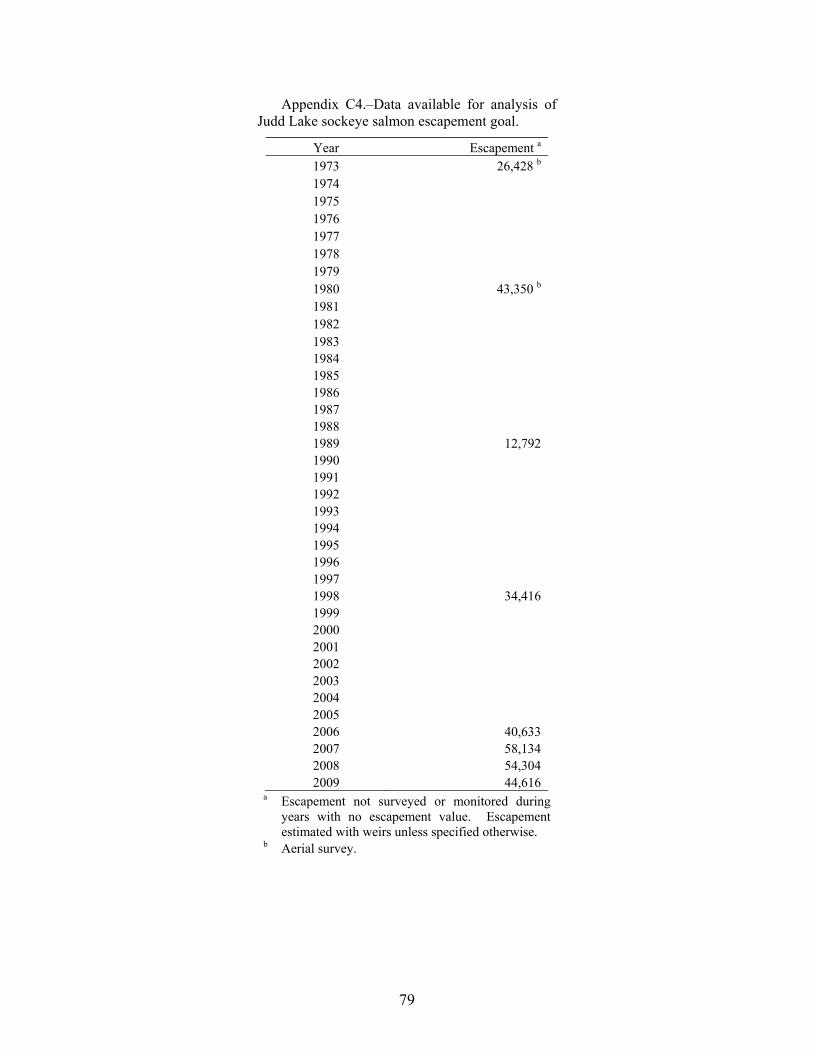
Appendix C4.–Data available for analysis of Judd Lake sockeye salmon escapement goal.
Year Escapement a 1973 26,428 b 1974 1975 1976 1977 1978 1979 1980 43,350 b 1981 1982 1983 1984 1985 1986 1987 1988 1989 12,792 1990 1991 1992 1993 1994 1995 1996 1997 1998 34,416 1999 2000 2001 2002 2003 2004 2005 2006 40,633 2007 58,134 2008 54,304 2009 44,616
a Escapement not surveyed or monitored during years with no escapement value. Escapement estimated with weirs unless specified otherwise.
b Aerial survey.
79
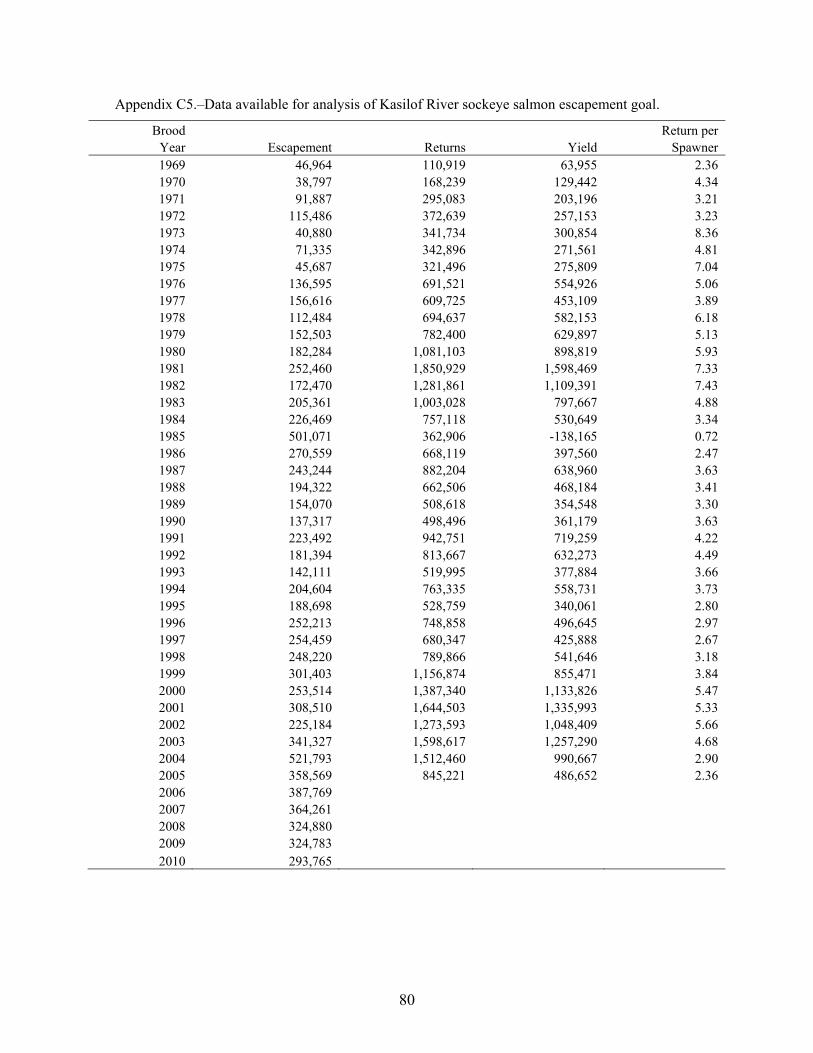
80
Appendix C5.–Data available for analysis of Kasilof River sockeye salmon escapement goal.
Brood Return per Year Escapement Returns Yield Spawner 1969 46,964 110,919 63,955 2.36 1970 38,797 168,239 129,442 4.34 1971 91,887 295,083 203,196 3.21 1972 115,486 372,639 257,153 3.23 1973 40,880 341,734 300,854 8.36 1974 71,335 342,896 271,561 4.81 1975 45,687 321,496 275,809 7.04 1976 136,595 691,521 554,926 5.06 1977 156,616 609,725 453,109 3.89 1978 112,484 694,637 582,153 6.18 1979 152,503 782,400 629,897 5.13 1980 182,284 1,081,103 898,819 5.93 1981 252,460 1,850,929 1,598,469 7.33 1982 172,470 1,281,861 1,109,391 7.43 1983 205,361 1,003,028 797,667 4.88 1984 226,469 757,118 530,649 3.34 1985 501,071 362,906 -138,165 0.72 1986 270,559 668,119 397,560 2.47 1987 243,244 882,204 638,960 3.63 1988 194,322 662,506 468,184 3.41 1989 154,070 508,618 354,548 3.30 1990 137,317 498,496 361,179 3.63 1991 223,492 942,751 719,259 4.22 1992 181,394 813,667 632,273 4.49 1993 142,111 519,995 377,884 3.66 1994 204,604 763,335 558,731 3.73 1995 188,698 528,759 340,061 2.80 1996 252,213 748,858 496,645 2.97 1997 254,459 680,347 425,888 2.67 1998 248,220 789,866 541,646 3.18 1999 301,403 1,156,874 855,471 3.84 2000 253,514 1,387,340 1,133,826 5.47 2001 308,510 1,644,503 1,335,993 5.33 2002 225,184 1,273,593 1,048,409 5.66 2003 341,327 1,598,617 1,257,290 4.68 2004 521,793 1,512,460 990,667 2.90 2005 358,569 845,221 486,652 2.36 2006 387,769 2007 364,261 2008 324,880 2009 324,783 2010 293,765
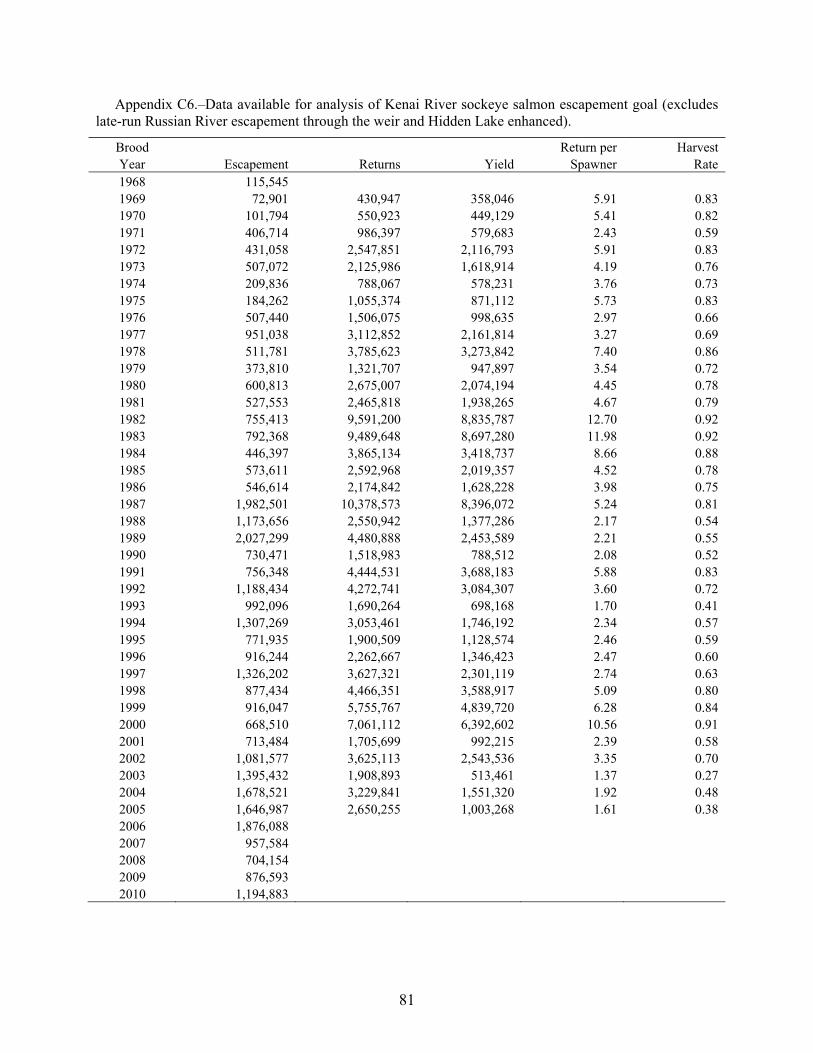
Appendix C6.–Data available for analysis of Kenai River sockeye salmon escapement goal (excludes late-run Russian River escapement through the weir and Hidden Lake enhanced).
Brood Return per Harvest Year Escapement Returns Yield Spawner Rate 1968 115,545 1969 72,901 430,947 358,046 5.91 0.83 1970 101,794 550,923 449,129 5.41 0.82 1971 406,714 986,397 579,683 2.43 0.59 1972 431,058 2,547,851 2,116,793 5.91 0.83 1973 507,072 2,125,986 1,618,914 4.19 0.76 1974 209,836 788,067 578,231 3.76 0.73 1975 184,262 1,055,374 871,112 5.73 0.83 1976 507,440 1,506,075 998,635 2.97 0.66 1977 951,038 3,112,852 2,161,814 3.27 0.69 1978 511,781 3,785,623 3,273,842 7.40 0.86 1979 373,810 1,321,707 947,897 3.54 0.72 1980 600,813 2,675,007 2,074,194 4.45 0.78 1981 527,553 2,465,818 1,938,265 4.67 0.79 1982 755,413 9,591,200 8,835,787 12.70 0.92 1983 792,368 9,489,648 8,697,280 11.98 0.92 1984 446,397 3,865,134 3,418,737 8.66 0.88 1985 573,611 2,592,968 2,019,357 4.52 0.78 1986 546,614 2,174,842 1,628,228 3.98 0.75 1987 1,982,501 10,378,573 8,396,072 5.24 0.81 1988 1,173,656 2,550,942 1,377,286 2.17 0.54 1989 2,027,299 4,480,888 2,453,589 2.21 0.55 1990 730,471 1,518,983 788,512 2.08 0.52 1991 756,348 4,444,531 3,688,183 5.88 0.83 1992 1,188,434 4,272,741 3,084,307 3.60 0.72 1993 992,096 1,690,264 698,168 1.70 0.41 1994 1,307,269 3,053,461 1,746,192 2.34 0.57 1995 771,935 1,900,509 1,128,574 2.46 0.59 1996 916,244 2,262,667 1,346,423 2.47 0.60 1997 1,326,202 3,627,321 2,301,119 2.74 0.63 1998 877,434 4,466,351 3,588,917 5.09 0.80 1999 916,047 5,755,767 4,839,720 6.28 0.84 2000 668,510 7,061,112 6,392,602 10.56 0.91 2001 713,484 1,705,699 992,215 2.39 0.58 2002 1,081,577 3,625,113 2,543,536 3.35 0.70 2003 1,395,432 1,908,893 513,461 1.37 0.27 2004 1,678,521 3,229,841 1,551,320 1.92 0.48 2005 1,646,987 2,650,255 1,003,268 1.61 0.38 2006 1,876,088 2007 957,584 2008 704,154 2009 876,593 2010 1,194,883
81
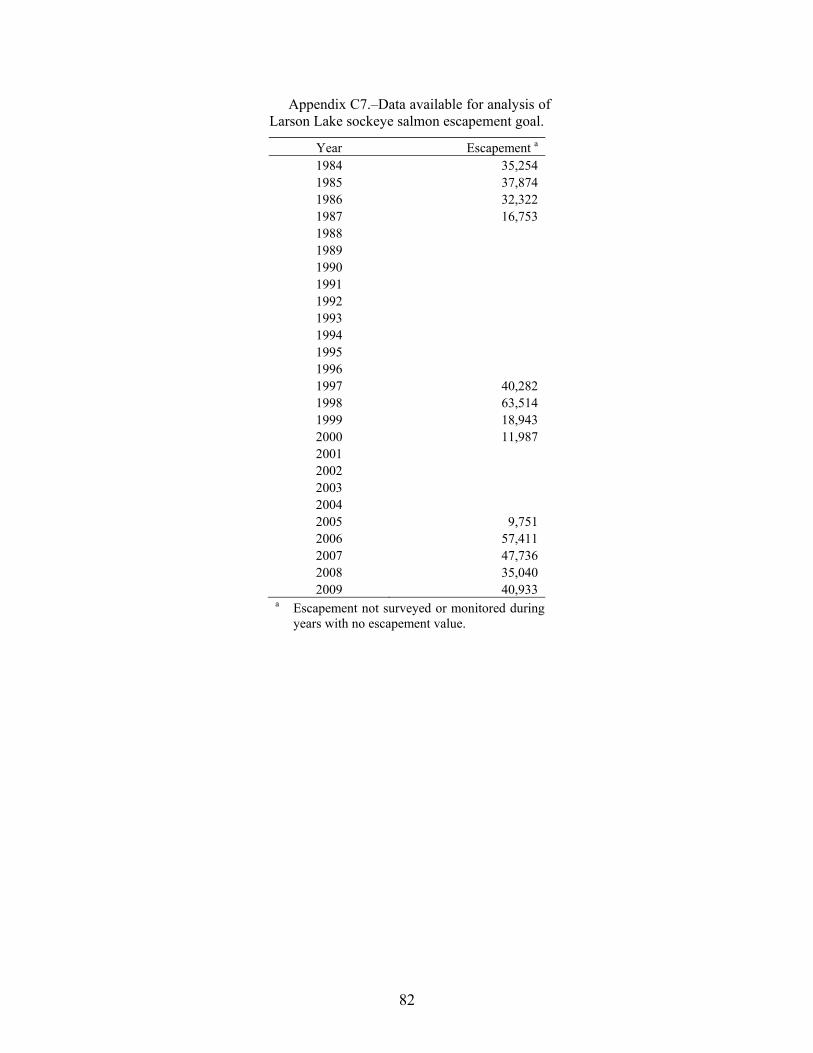
Appendix C7.–Data available for analysis of Larson Lake sockeye salmon escapement goal.
Year Escapement a 1984 35,254 1985 37,874 1986 32,322 1987 16,753 1988 1989 1990 1991 1992 1993 1994 1995 1996 1997 40,282 1998 63,514 1999 18,943 2000 11,987 2001 2002 2003 2004 2005 9,751 2006 57,411 2007 47,736 2008 35,040 2009 40,933
a Escapement not surveyed or monitored during years with no escapement value.
82
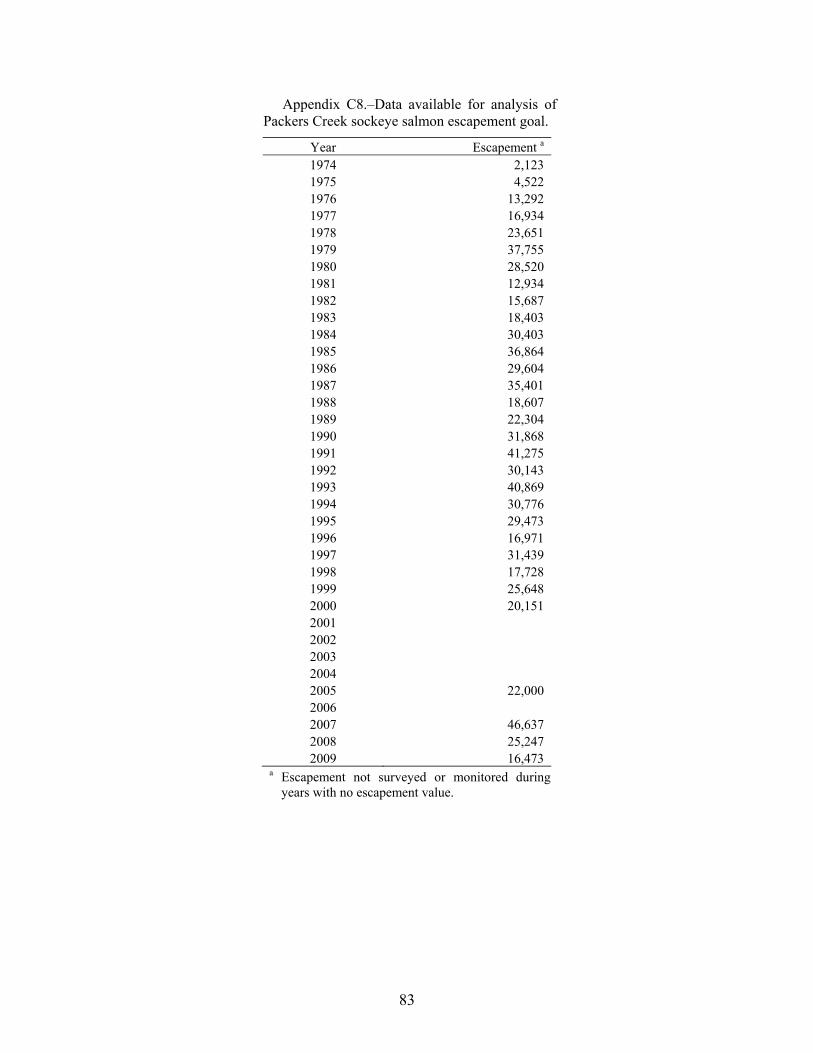
Appendix C8.–Data available for analysis of Packers Creek sockeye salmon escapement goal.
Year Escapement a 1974 2,123 1975 4,522 1976 13,292 1977 16,934 1978 23,651 1979 37,755 1980 28,520 1981 12,934 1982 15,687 1983 18,403 1984 30,403 1985 36,864 1986 29,604 1987 35,401 1988 18,607 1989 22,304 1990 31,868 1991 41,275 1992 30,143 1993 40,869 1994 30,776 1995 29,473 1996 16,971 1997 31,439 1998 17,728 1999 25,648 2000 20,151 2001 2002 2003 2004 2005 22,000 2006 2007 46,637 2008 25,247 2009 16,473
a Escapement not surveyed or monitored during years with no escapement value.
83
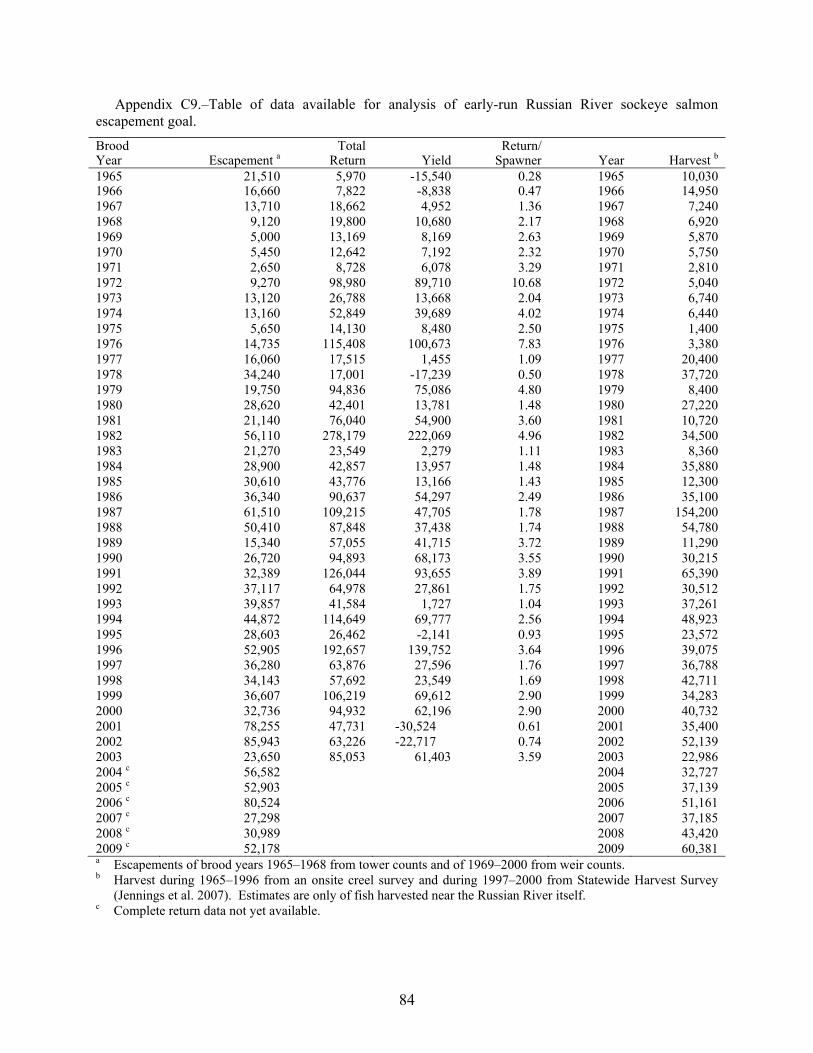
84
Appendix C9.–Table of data available for analysis of early-run Russian River sockeye salmon escapement goal.
Brood Total Return/ Year Escapement a Return Yield Spawner Year Harvest b 1965 21,510 5,970 -15,540 0.28 1965 10,0301966 16,660 7,822 -8,838 0.47 1966 14,950 1967 13,710 18,662 4,952 1.36 1967 7,240 1968 9,120 19,800 10,680 2.17 1968 6,920 1969 5,000 13,169 8,169 2.63 1969 5,870 1970 5,450 12,642 7,192 2.32 1970 5,750 1971 2,650 8,728 6,078 3.29 1971 2,810 1972 9,270 98,980 89,710 10.68 1972 5,040 1973 13,120 26,788 13,668 2.04 1973 6,740 1974 13,160 52,849 39,689 4.02 1974 6,440 1975 5,650 14,130 8,480 2.50 1975 1,400 1976 14,735 115,408 100,673 7.83 1976 3,380 1977 16,060 17,515 1,455 1.09 1977 20,400 1978 34,240 17,001 -17,239 0.50 1978 37,720 1979 19,750 94,836 75,086 4.80 1979 8,400 1980 28,620 42,401 13,781 1.48 1980 27,220 1981 21,140 76,040 54,900 3.60 1981 10,720 1982 56,110 278,179 222,069 4.96 1982 34,500 1983 21,270 23,549 2,279 1.11 1983 8,360 1984 28,900 42,857 13,957 1.48 1984 35,880 1985 30,610 43,776 13,166 1.43 1985 12,300 1986 36,340 90,637 54,297 2.49 1986 35,100 1987 61,510 109,215 47,705 1.78 1987 154,200 1988 50,410 87,848 37,438 1.74 1988 54,780 1989 15,340 57,055 41,715 3.72 1989 11,290 1990 26,720 94,893 68,173 3.55 1990 30,215 1991 32,389 126,044 93,655 3.89 1991 65,390 1992 37,117 64,978 27,861 1.75 1992 30,512 1993 39,857 41,584 1,727 1.04 1993 37,261 1994 44,872 114,649 69,777 2.56 1994 48,923 1995 28,603 26,462 -2,141 0.93 1995 23,572 1996 52,905 192,657 139,752 3.64 1996 39,075 1997 36,280 63,876 27,596 1.76 1997 36,788 1998 34,143 57,692 23,549 1.69 1998 42,711 1999 36,607 106,219 69,612 2.90 1999 34,283 2000 32,736 94,932 62,196 2.90 2000 40,732 2001 78,255 47,731 -30,524 0.61 2001 35,400 2002 85,943 63,226 -22,717 0.74 2002 52,139 2003 23,650 85,053 61,403 3.59 2003 22,986 2004 c 56,582 2004 32,727 2005 c 52,903 2005 37,139 2006 c 80,524 2006 51,161 2007 c 27,298 2007 37,185 2008 c 30,989 2008 43,420 2009 c 52,178 2009 60,381 a Escapements of brood years 1965–1968 from tower counts and of 1969–2000 from weir counts. b Harvest during 1965–1996 from an onsite creel survey and during 1997–2000 from Statewide Harvest Survey
(Jennings et al. 2007). Estimates are only of fish harvested near the Russian River itself. c Complete return data not yet available.
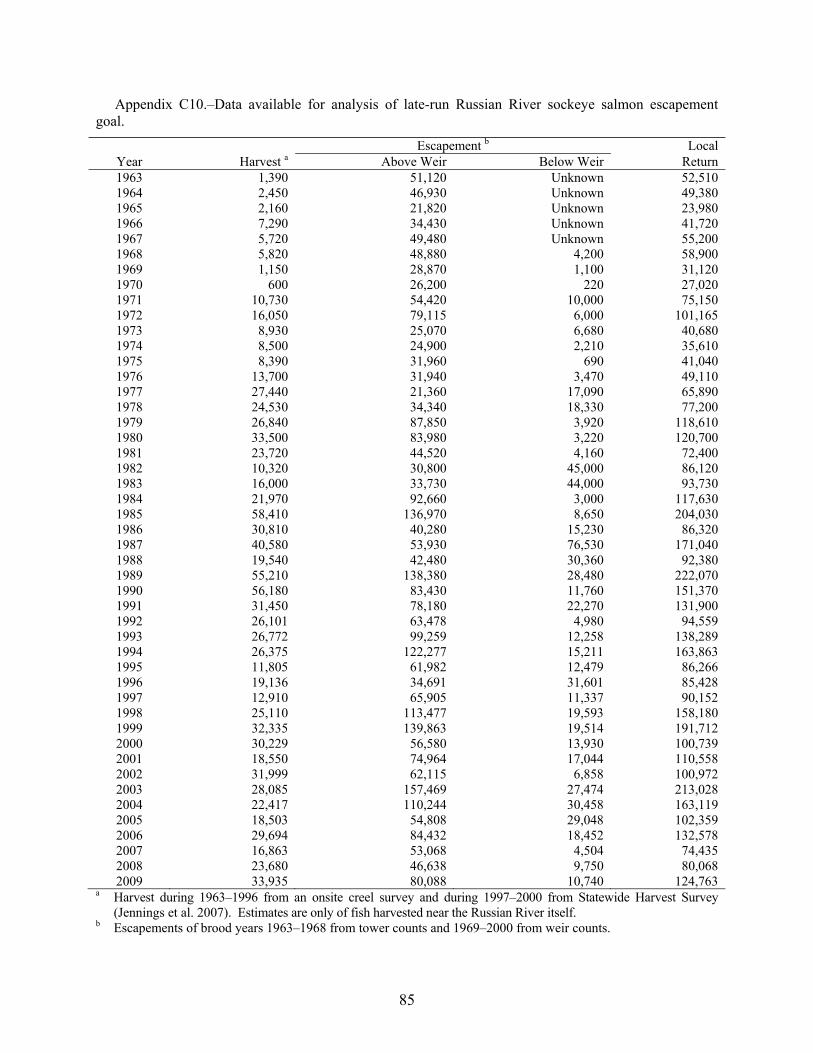
Appendix C10.–Data available for analysis of late-run Russian River sockeye salmon escapement goal.
Escapement b Local Year Harvest a Above Weir Below Weir Return 1963 1,390 51,120 Unknown 52,510 1964 2,450 46,930 Unknown 49,380 1965 2,160 21,820 Unknown 23,980 1966 7,290 34,430 Unknown 41,720 1967 5,720 49,480 Unknown 55,200 1968 5,820 48,880 4,200 58,900 1969 1,150 28,870 1,100 31,120 1970 600 26,200 220 27,020 1971 10,730 54,420 10,000 75,150 1972 16,050 79,115 6,000 101,165 1973 8,930 25,070 6,680 40,680 1974 8,500 24,900 2,210 35,610 1975 8,390 31,960 690 41,040 1976 13,700 31,940 3,470 49,110 1977 27,440 21,360 17,090 65,890 1978 24,530 34,340 18,330 77,200 1979 26,840 87,850 3,920 118,610 1980 33,500 83,980 3,220 120,700 1981 23,720 44,520 4,160 72,400 1982 10,320 30,800 45,000 86,120 1983 16,000 33,730 44,000 93,730 1984 21,970 92,660 3,000 117,630 1985 58,410 136,970 8,650 204,030 1986 30,810 40,280 15,230 86,320 1987 40,580 53,930 76,530 171,040 1988 19,540 42,480 30,360 92,380 1989 55,210 138,380 28,480 222,070 1990 56,180 83,430 11,760 151,370 1991 31,450 78,180 22,270 131,900 1992 26,101 63,478 4,980 94,559 1993 26,772 99,259 12,258 138,289 1994 26,375 122,277 15,211 163,863 1995 11,805 61,982 12,479 86,266 1996 19,136 34,691 31,601 85,428 1997 12,910 65,905 11,337 90,152 1998 25,110 113,477 19,593 158,180 1999 32,335 139,863 19,514 191,712 2000 30,229 56,580 13,930 100,739 2001 18,550 74,964 17,044 110,558 2002 31,999 62,115 6,858 100,972 2003 28,085 157,469 27,474 213,028 2004 22,417 110,244 30,458 163,119 2005 18,503 54,808 29,048 102,359 2006 29,694 84,432 18,452 132,578 2007 16,863 53,068 4,504 74,435 2008 23,680 46,638 9,750 80,068 2009 33,935 80,088 10,740 124,763
a Harvest during 1963–1996 from an onsite creel survey and during 1997–2000 from Statewide Harvest Survey (Jennings et al. 2007). Estimates are only of fish harvested near the Russian River itself.
b Escapements of brood years 1963–1968 from tower counts and 1969–2000 from weir counts.
85

86

APPENDIX D. SUPPORTING INFORMATION FOR UPPER COOK INLET
CHUM SALMON ESCAPEMENT GOALS
87
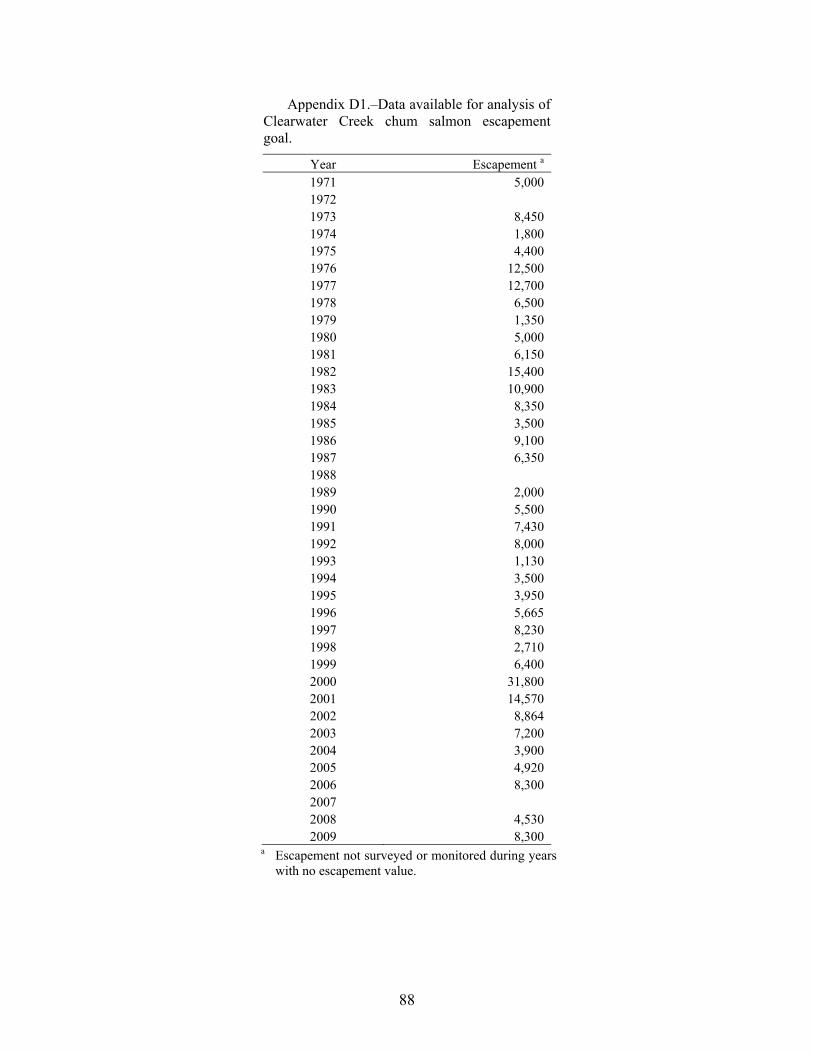
Appendix D1.–Data available for analysis of Clearwater Creek chum salmon escapement goal.
Year Escapement a 1971 5,000 1972 1973 8,450 1974 1,800 1975 4,400 1976 12,500 1977 12,700 1978 6,500 1979 1,350 1980 5,000 1981 6,150 1982 15,400 1983 10,900 1984 8,350 1985 3,500 1986 9,100 1987 6,350 1988 1989 2,000 1990 5,500 1991 7,430 1992 8,000 1993 1,130 1994 3,500 1995 3,950 1996 5,665 1997 8,230 1998 2,710 1999 6,400 2000 31,800 2001 14,570 2002 8,864 2003 7,200 2004 3,900 2005 4,920 2006 8,300 2007 2008 4,530 2009 8,300
a Escapement not surveyed or monitored during years with no escapement value.
88