Embed Size (px)
Citation preview
Revising State Child Support Incentive System Could Promote Improved Performance of County
Programs
Final Report to the Joint Legislative Program Evaluation Oversight Committee
Report Number 2014-08
July 16, 2014
Program Evaluation Division
North Carolina General Assembly Legislative Office Building, Suite 100
300 North Salisbury Street Raleigh, NC 27603-5925
919-301-1404 www.ncleg.net/PED
75 copies of this public document were printed at a cost of $49.65 or $0.66 per copy.
A limited number of copies are available for distribution through the Legislative Library: Rooms 2126, 2226 Room 500
State Legislative Building Legislative Office Building Raleigh, NC 27601 Raleigh, NC 27603
919-733-7778 919-733-9390
The report is also available online at www.ncleg.net/PED.
Program Evaluation Division 300 N. Salisbury Street, Suite 100 Raleigh, NC 27603-5925 Tel. 919-301-1404 Fax 919-301-1406
John W. Turcotte Director
NORTH CAROLINA GENERAL ASSEMBLY Legislative Services Office
George R. Hall, Legislative Services Officer
July 16, 2014
Senator Fletcher L. Hartsell, Jr., Co-Chair, Joint Legislative Program Evaluation Oversight Committee Representative Julia Howard, Co-Chair, Joint Legislative Program Evaluation Oversight Committee
North Carolina General Assembly Legislative Building 16 West Jones Street Raleigh, NC 27601
Honorable Co-Chairs:
The 2013–15 Program Evaluation Division work plan directed the division to review operational effectiveness and efficiency efforts by county child support programs.
I am pleased to report that the Child Support Services State Office cooperated with us fully and was at all times courteous to our evaluators during the evaluation.
Sincerely,
John W. Turcotte Director
AN EQUAL OPPORTUNITY/AFFIRMATIVE ACTION EMPLOYER
PROGRAM EVALUATION DIVISION NORTH CAROLINA GENERAL ASSEMBLY
July 2014 Report No. 2014-08
Revising State Child Support Incentive System Could Promote Improved Performance of County Programs
Summary
As directed by the North Carolina General Assembly’s Joint Legislative Program Evaluation Oversight Committee, this evaluation examines the North Carolina Child Support Services program. The state-supervised, county-administered program is responsible for providing federally-mandated child support services.
Based on federal performance measures, the North Carolina Child Support Services program ranks only 24th among the 50 states. Program performance has stagnated and is not improving.
Although success depends on the cumulative performance of county programs, the Child Support Services State Office does not effectively use its federal incentive award to promote improved county program performance. The incentive goals the CSS State Office develops for county child support programs are not connected to the incentive payments awarded to county programs. Additionally, the CSS State Office cannot ensure federal incentive payments are being used to improve county programs because it has not established specific spending guidelines and does not track incentive payment expenditures.
Limited resources hinder the CSS State Office’s centralized services. To improve these services, the CSS State Office could retain a portion of the federal incentive money it receives.
To address these findings, the General Assembly should stipulate that 15% of federal incentive payments be retained by
the CSS State Office to enhance centralized child support services; stipulate that 10% of federal incentive payments be retained for
incentive bonuses for employees of county programs that meet or exceed incentive goals;
direct the CSS State Office to distribute the remaining 75% of federal incentive payments to county programs based on the existing methodology and to determine whether an alternative formula would be appropriate in the future;
direct the CSS State Office to require county child support programs to document that federal incentive payments are being used to improve program effectiveness and efficiency; and
require counties to maintain county expenditures for child support services at a level not less than the average level of such expenditures for the two previous state fiscal years.
Child Support Services Report No. 2014-08
Page 2 of 43
Purpose and Scope
The North Carolina Joint Legislative Program Evaluation Oversight Committee directed this evaluation in its 2013–15 Work Plan. This report examines the operational effectiveness and efficiency of county child support programs with regard to five, nationally-utilized performance measurements: current support collection rate, payment on accounts that are past due, rate of paternity establishment, percentage of cases under order, and cost effectiveness. This evaluation also identifies factors that affect the performance of county child support programs, evaluates the effectiveness of the centralized services provided by the North Carolina Child Support Services State Office, describes methods used by other states to overcome performance issues, and recommends improvements at the state level with regards to overseeing the financial and administrative performance of county programs.
Four research questions guided this evaluation:
1. How are child support services structured and delivered in North Carolina?
2. How effective and efficient are the county child support programs at establishing child support orders and collecting child support payments?
3. How can county programs be financially and administratively monitored to improve the effectiveness and efficiency of child support services?
4. What child support services in other states could be applied to North Carolina to improve its performance?
The Program Evaluation Division collected data from several sources including
interviews with and data queries of the Department of Health and Human Services;
a survey of each county child support office; site visits to 13 county and tribal child support services programs;1 a literature review of professional associations and academic
journals; and interviews with program administrators in other states.
1 The Program Evaluation Division visited 12 North Carolina county child support services offices: Albemarle (Camden County, Gates County, Pasquotank County, and Perquimans County), Buncombe County, Cabarrus County, Cumberland County, Greene County, Macon County, Mecklenburg County, Onslow County, Orange County, Plymouth (Hyde County, Tyrell County, and Washington County), Wake County, and Wilkes County. The division also visited the Eastern Band of Child Support Services program. During site visits, the Program Evaluation Division interviewed the manager in each office and interviewed more than 40 case agents in total.
Child Support Services Report No. 2014-08
Page 3 of 43
Background Congress established the federal-state Child Support Enforcement (CSE) program in 1975 under Title IV-D of the Social Security Act. The program’s goals are to secure financial support for children from their noncustodial parent,2 to help families remain self-sufficient, and to keep families off public assistance. One in four children receives child support services at some point in his or her life.
Under Title IV-D, states must provide the following mandated child support services:
1. location of noncustodial parents; 2. paternity establishment; 3. establishment of child support orders; 4. review and modification of child support orders; 5. collection of child support payments; 6. distribution of child support payments; and 7. establishment and enforcement of medical support.
Title IV-D was enacted because some families with an absent parent depended on public assistance, now called Temporary Assistance to Needy Families (TANF). Accordingly, the child support program was designed to decrease the amount of money spent on TANF and to use child support payments to reimburse federal public assistance programs.3 As the number of TANF cases decreased, the program’s emphasis shifted to effectively delivering child support services and promoting responsible parental support of children.
North Carolina Child Support Services. Each state is responsible for administering a child support program and offering federally-mandated services. The North Carolina Child Support Services program is administered by the North Carolina Department of Health and Human Services, Division of Social Services, and is governed by N.C. Gen. Stat. § 110, Article 9.4 The program’s mission statement is, “To consistently collect as much child support as possible for the benefit of North Carolina’s children.” North Carolina’s child support program operates under a state-supervised, county-administered model. Counties are responsible for providing most child support services; the State provides some centralized services and supervises and oversees the county programs. In total, 104 offices provide child support services in North Carolina: 97 of North Carolina’s 100 counties have one office, three counties have
2 “Noncustodial parent” refers to a parent who does not have custody of a child and is under a child support order. “Custodial parent” refers to the parent who has custody of the child. 3 Pursuant to Sec. 457 of 42 U.S.C. 657, child support clients must assign their rights to the State as a condition of receiving child support services so that child support money paid is first applied to any debt owed to the federal and state government for TANF. 4 Throughout the report, the term “North Carolina Child Support Services program” will be used to refer to the overall state-supervised, county-administered child support program in North Carolina, which includes the county child support services programs and the supervisory state office of child support services located within the Division of Social Services in the North Carolina Department of Health and Human Services. This supervisory state office of child support services will be referred to as the “North Carolina Child Support Services State Office” or the “CSS State Office.”
Child Support Services Report No. 2014-08
Page 4 of 43
two offices,5 and the Eastern Band of Cherokee operates a tribal office.6 The North Carolina Child Support Services State Office (CSS State Office) supervises 100 child support services programs. The counties with two offices each operate as one county program. The tribal office is supervised by the federal government and is not under state jurisdiction.
North Carolina is one of eight states with a state-supervised, county-administered child support program.7 Most states do not delegate child support services to counties but instead choose to organize their child support program under a state agency. Some states organize their program under their human services agency; others operate through the state courts, the attorney general’s office, or revenue department.
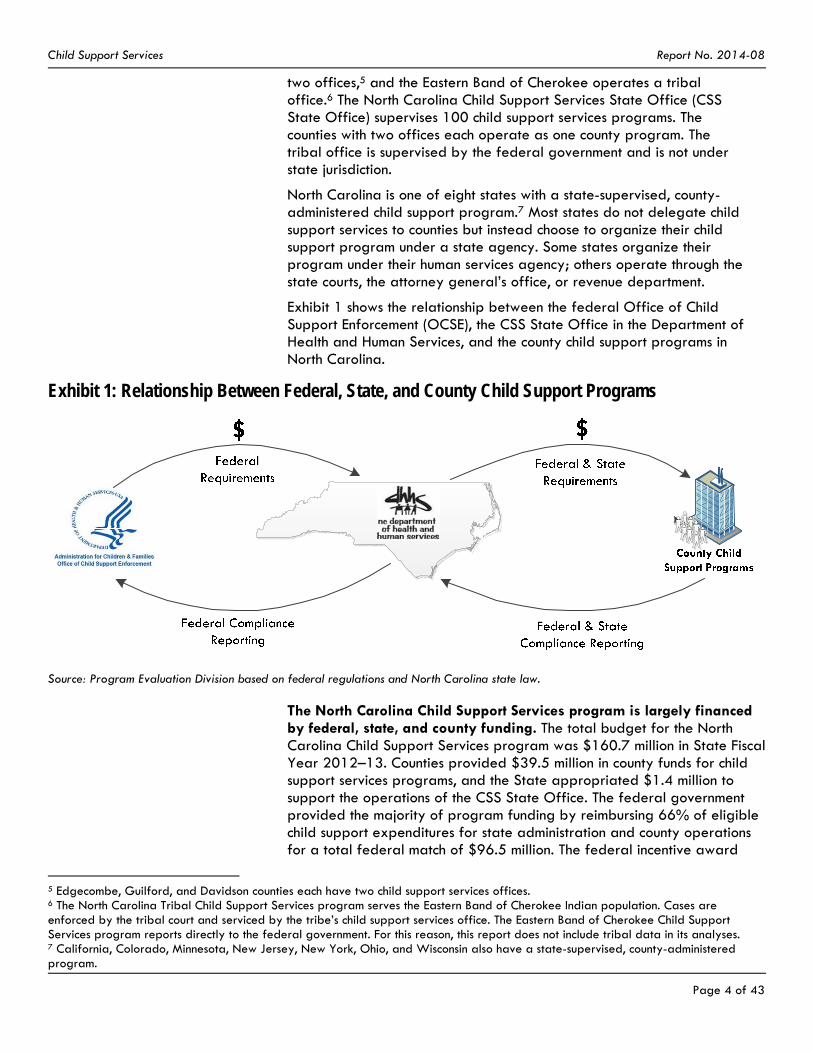
Exhibit 1 shows the relationship between the federal Office of Child Support Enforcement (OCSE), the CSS State Office in the Department of Health and Human Services, and the county child support programs in North Carolina.
Exhibit 1: Relationship Between Federal, State, and County Child Support Programs
Source: Program Evaluation Division based on federal regulations and North Carolina state law.
The North Carolina Child Support Services program is largely financed by federal, state, and county funding. The total budget for the North Carolina Child Support Services program was $160.7 million in State Fiscal Year 2012–13. Counties provided $39.5 million in county funds for child support services programs, and the State appropriated $1.4 million to support the operations of the CSS State Office. The federal government provided the majority of program funding by reimbursing 66% of eligible child support expenditures for state administration and county operations for a total federal match of $96.5 million. The federal incentive award
5 Edgecombe, Guilford, and Davidson counties each have two child support services offices. 6 The North Carolina Tribal Child Support Services program serves the Eastern Band of Cherokee Indian population. Cases are enforced by the tribal court and serviced by the tribe’s child support services office. The Eastern Band of Cherokee Child Support Services program reports directly to the federal government. For this reason, this report does not include tribal data in its analyses. 7 California, Colorado, Minnesota, New Jersey, New York, Ohio, and Wisconsin also have a state-supervised, county-administered program.
Child Support Services Report No. 2014-08
Page 5 of 43
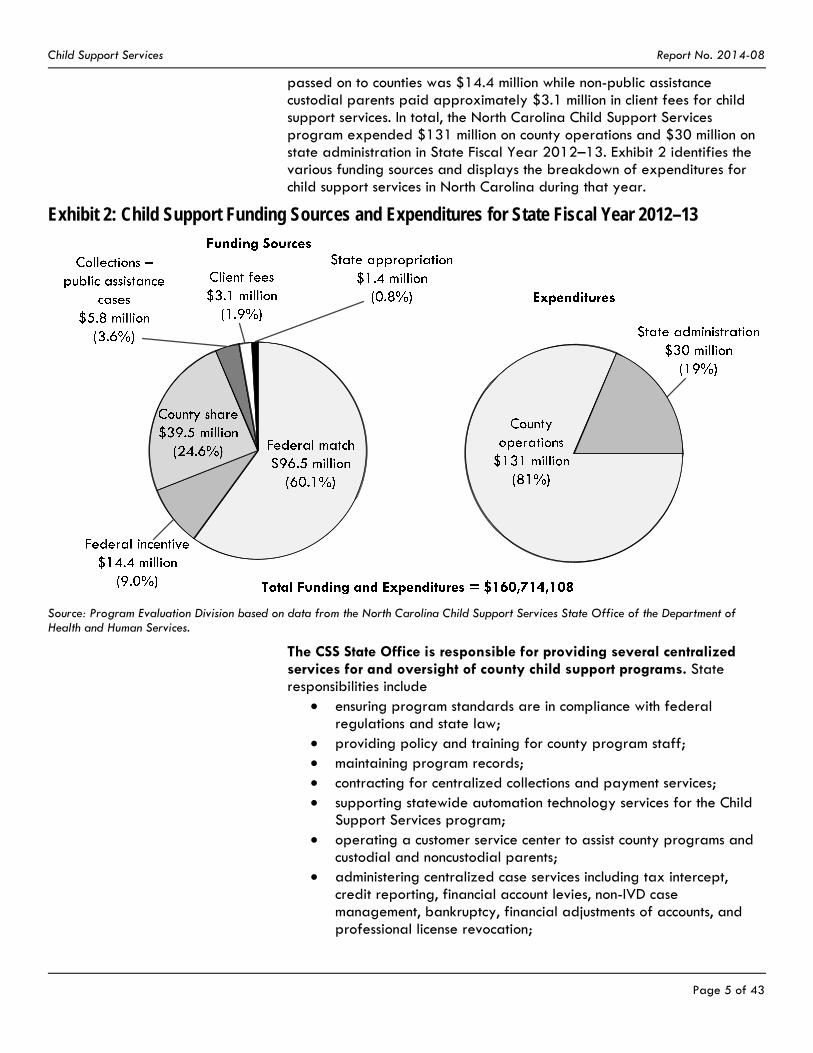
passed on to counties was $14.4 million while non-public assistance custodial parents paid approximately $3.1 million in client fees for child support services. In total, the North Carolina Child Support Services program expended $131 million on county operations and $30 million on state administration in State Fiscal Year 2012–13. Exhibit 2 identifies the various funding sources and displays the breakdown of expenditures for child support services in North Carolina during that year.
Exhibit 2: Child Support Funding Sources and Expenditures for State Fiscal Year 2012–13
Source: Program Evaluation Division based on data from the North Carolina Child Support Services State Office of the Department of Health and Human Services.
The CSS State Office is responsible for providing several centralized services for and oversight of county child support programs. State responsibilities include
ensuring program standards are in compliance with federal regulations and state law;
providing policy and training for county program staff; maintaining program records; contracting for centralized collections and payment services; supporting statewide automation technology services for the Child
Support Services program; operating a customer service center to assist county programs and
custodial and noncustodial parents; administering centralized case services including tax intercept,
credit reporting, financial account levies, non-IVD case management, bankruptcy, financial adjustments of accounts, and professional license revocation;
Child Support Services Report No. 2014-08
Page 6 of 43
responding to program inquiries, complaints, and information requests; and
cooperating with other states through the centralized registry for interstate cases.
Prior to 2010, the North Carolina Child Support Services program administered child support services for 29 counties whose boards of county commissioners opted not to administer their own program, as well as for the Eastern Band of Cherokee tribal office. Under this arrangement, the State administered services and funded the nonfederal share of the child support program for 30 programs. To reduce state appropriations, the General Assembly began requiring that all boards of county commissioners administer or arrange for the administration of child support services as of July 1, 2010. Accordingly, counties decide what size and scope is necessary for their child support services programs to be able to provide federally-required services. Current state law directs boards of county commissioners to determine the management of child support services for their residents.8 Counties have chosen to operate under three different management models.
1. County department of social services (76 counties). The child support program is located within the county department of social services (DSS). The department director oversees the program and reports either to the county social services board or the county manager.
2. County manager (7 counties). The child support program is managed by a county director or program manager(s). The child support office supervisor reports to the county manager.
3. Private vendor (17 counties). A private vendor contracts with the county to operate the child support program. The vendor’s site manager reports to the county contract administrator, who is usually the DSS director or the county manager. Private vendors either have contracts based on a flat fee or performance-based compensation based on a percentage of collections.
County programs are responsible for administering child support services and processing individual child support cases. Over 1,300 local child support employees, including managers, agents, and clerical staff, process several types of child support cases in North Carolina.
Non-public assistance cases. Non-public assistance cases are those in which the child does not receive public assistance in the form of Temporary Assistance for Needy Families (TANF) or Medicaid. About 46% of child support cases in North Carolina are non-public assistance cases.
Medical assistance cases. Medical assistance cases are those in which the custodial parent and/or child receive Medicaid benefits. Custodial parents may choose to receive medical support or both medical and child support services. About 42% of child support cases in North Carolina are for medical assistance only.
8 N. C. Gen. Stat. § 110-141.
Child Support Services Report No. 2014-08
Page 7 of 43
Public assistance cases. Public assistance cases are those in which the custodial parent and/or children receive financial assistance from the county department of social services. Public assistance clients waive their right to receive child support payments in exchange for TANF benefits, which are administered by the Work First program in North Carolina. The support collected from the noncustodial parent is returned to the State to help reimburse the public assistance debt. About 12% of child support cases in North Carolina are public assistance cases.
Locate-only cases. A small number of cases target location of the noncustodial parent.
County child support programs also handle interstate cases. In interstate cases, one participant lives in North Carolina and the other participant lives in another state, tribe, or country. The two types of interstate cases are initiating and responding. In an initiating case, the custodial parent lives in North Carolina and the noncustodial parent lives in another state or country. The North Carolina case agent sends a child support order to the child support office in the other state or country to be established and enforced. In a responding case, the custodial parent requesting child support services lives in another state and a request is sent to North Carolina, where the noncustodial parent lives. The North Carolina case agent establishes and enforces the child support order.
County programs manage the day-to-day operations of delivering child support services. Program staff work closely with clients on individual cases by
receiving client applications and initiating cases, locating noncustodial parents, establishing paternity, establishing child support orders, reviewing and modifying child support orders, and enforcing child support orders when the noncustodial parent’s
payments are delinquent.
Case initiation originates in one of the following three ways:
1. A custodial parent who does not receive public assistance applies for child support services from a county program. The parent pays a $25 application fee and a $25 annual fee for services.
2. A custodial parent who applies for cash assistance is referred to the county’s child support services program and is mandated to cooperate as a condition of receiving public assistance. The Work First recipient does not pay child support services fees.
3. A county program receives an interstate case from the State’s Central Registry. The office works with the initiating state to locate the noncustodial parent and establish a child support order.
Cases enter the system at various phases of the process. Once a case is initiated, the case progresses to the locate phase, unless the location of the noncustodial parent is known. The case then moves directly to the paternity
Child Support Services Report No. 2014-08
establishment phase. In some cases, this phase is not necessary because an affidavit of parentage exists that identifies the child’s parents. A case agent also might receive a case that already has a support order established. In this circumstance, the agent needs to enforce the order if a noncustodial parent becomes delinquent on payments.
Once location of the noncustodial parent is determined and paternity is established, a case agent can begin to establish a support order. Child support order determinations are based on North Carolina’s Schedule of Basic Child Support Obligations.9 If the custodial and noncustodial parents both agree on a deviation from the support order calculated from the standard obligation schedule, a case agent can assist the parents in creating a Voluntary Support Agreement for the court to approve.
If the noncustodial parent regularly pays child support, the Automated Collections and Tracking System (ACTS) will process the child support order without intervention by a case agent. The collected child support money is distributed to the custodial parent. If the custodial parent receives Work First benefits, the payment first goes to reimburse the State for public assistance debt, and any remaining money is then distributed to the custodial parent.
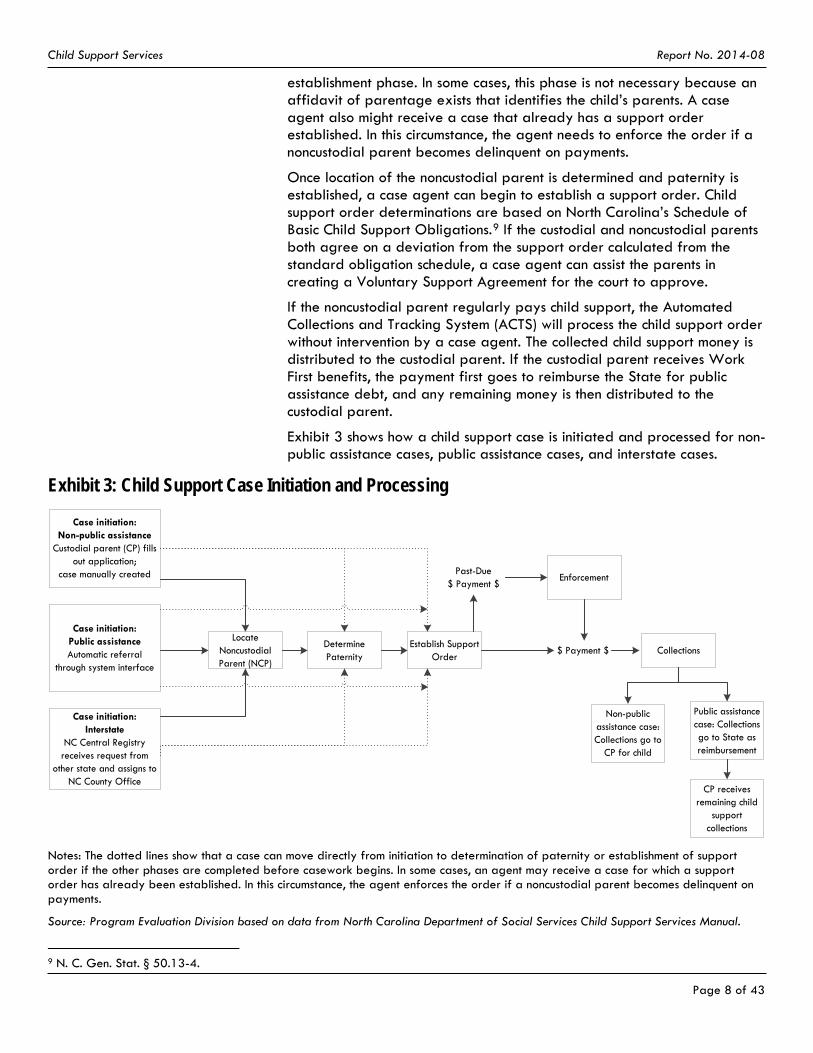
Exhibit 3 shows how a child support case is initiated and processed for non-public assistance cases, public assistance cases, and interstate cases.
Exhibit 3: Child Support Case Initiation and Processing
Case initiation: Non-public assistance
Custodial parent (CP) fills out application;
case manually created
Case initiation: Public assistanceAutomatic referral
through system interface
Case initiation: Interstate
NC Central Registry receives request from
other state and assigns to NC County Office
Locate Noncustodial Parent (NCP)
Determine Paternity
Establish Support Order
Collections
Enforcement
$ Payment $
Past-Due$ Payment $
Public assistance case: Collections go to State as reimbursement
CP receives remaining child
support collections
Non-public assistance case: Collections go to
CP for child
Notes: The dotted lines show that a case can move directly from initiation to determination of paternity or establishment of support order if the other phases are completed before casework begins. In some cases, an agent may receive a case for which a support order has already been established. In this circumstance, the agent enforces the order if a noncustodial parent becomes delinquent on payments.
Source: Program Evaluation Division based on data from North Carolina Department of Social Services Child Support Services Manual.
9 N. C. Gen. Stat. § 50.13-4.
Page 8 of 43
Child Support Services Report No. 2014-08
Page 9 of 43
When a noncustodial parent does not comply with a child support order, several different enforcement mechanisms are available. Case managers use automated and manual resources to monitor compliance with support orders. When payments become past-due, case managers must determine appropriate enforcement remedies based on the individual case circumstances and initiate legal action to correct the delinquency. The North Carolina Child Support Services program has a number of tools to properly enforce child support orders through the courts. Examples of enforcement tools include
garnishment of wages or other income sources; interception of tax refunds, lottery winnings, and unclaimed
property; revocation/suspension of driver’s license, hunting/fishing licenses, or
professional licenses; placement of liens on property or insurance settlements; and legal action (up to and including incarceration of noncustodial
parent) for failure to pay.
County child support programs choose whether to use a specialist, generalist, or hybrid operational model to deliver child support services. With a specialist model, which is used by the majority of county child support programs, different case agents handle the case as it progresses from one processing stage to the next. For instance, one case agent might be in charge of case establishment while another agent deals with enforcement for the same case. Under the generalist model, a single case manager handles the case from intake through all phases of case processing until the case terminates. Finally, some programs utilize a hybrid operational model in which certain types of cases, like interstate cases, are assigned to one agent from start to finish while other cases are passed from one stage to the next by specialist agents.
The North Carolina Child Support Services program has an important role in maintaining financial support for families. In State Fiscal Year 2012–13, the program processed approximately 426,000 active child support cases, and county child support programs collected more than $709 million in payments for custodial parents. Since 2010, the program has undergone significant operational changes; as previously discussed, 30 programs operated by the CSS State Office transitioned into 29 county programs and one tribal office. To ensure high program performance, the Joint Legislative Program Evaluation Oversight Committee directed the Program Evaluation Division to describe the North Carolina Child Support Services program, identify factors affecting performance, investigate programs used by other states to overcome performance issues, and recommend improvements at the state level to oversee the operations and performance of county child support programs.
Child Support Services Report No. 2014-08
Page 10 of 43
Findings Finding 1. Based on federal performance measures, the North Carolina Child Support Services program ranks only 24th among the 50 states.
The Program Evaluation Division compared North Carolina to other states based on the five performance measures used by the federal Office of Child Support Enforcement (OCSE) to evaluate state performance.
1. Current collections. This measure is calculated by dividing the total dollars collected for current support payments by the total current amount owed on support for these cases (excluding past-due payments). Child support programs aspire to collect 100% of the total amount owed on cases with current support payments.
2. Past-due payments (arrearages). This measure is calculated by dividing the number of cases in which there were some past-due payments collected during the fiscal year by the total number of cases in which past-due support is owed. Child support programs aspire to collect some past-due payments on 100% of the cases in which past-due support is owed.
3. Paternity establishment. OCSE offers states two options for measuring paternity establishment. States can choose to use a Paternity Establishment Percentage (PEP) based on data for the child support services program or a PEP based on data that pertain to the state population as a whole. North Carolina uses the PEP based on data from the child support services program. This measure is calculated by dividing the total number of children in the child support caseload during the fiscal year born outside of marriage and for whom paternity has been established by the total number of children in the caseload as of the end of the preceding fiscal year who were born outside of marriage. This calculation can exceed 100%.10 Child support programs aspire to establish paternity for 100% of the children in the caseload.
4. Cases under order. This measure is calculated by dividing the number of cases in the child support caseload for which there is a support order by the total number of cases in the program. Child support programs aspire to establish support orders for 100% of the cases in the program.
5. Cost effectiveness. This measure is calculated by dividing the total amount of money collected through the child support program by the total amount of money spent by the program to make these collections. Child support programs aspire to increase the amount of money collected by the child support program per each dollar spent on the program.
10 A PEP of 100% or more generally means that the state has established paternity for more than just the newborns who were born outside of marriage in the specified year (i.e., the state has established paternity for many older children as well).
Child Support Services Report No. 2014-08
Page 11 of 43
The ranking of the North Carolina Child Support Services program compared to other states based on these five measures shows that its overall performance is average. The Program Evaluation Division compared North Carolina’s performance to other states by ranking the 50 state child support programs on the five performance measures. To calculate the overall ranking of the 50 state child support programs, the Program Evaluation Division added together each state’s ranking for the five performance measures. The state child support program with the lowest combined score was ranked 1st, and the state child support program with the highest combined score was ranked 50th.11 The results of this analysis, as shown in Exhibit 4, reveal that the North Carolina child support program ranks only 24th overall when compared to programs operated by other states.
The North Carolina Child Support Services program does not perform as well as other states with a state-supervised, county-administered program. The Program Evaluation Division identified seven other states with state-supervised, county-administered child support programs and compared their overall performance to that of the North Carolina Child Support Services program. Exhibit 4 shows that four states with state-supervised and county-administered child support programs rank higher than North Carolina: Wisconsin (4th), Minnesota (12th), Colorado (15th), and Ohio (21st). Three states with state-supervised and county-administered child support programs rank lower than North Carolina: California (26th), New Jersey (34th), and New York (37th).
11 Whereas the federal Office of Child Support Enforcement (OCSE) weights the five performance measures differently in determining federal incentive payments, the Program Evaluation Division applied an equal weighting to all five federal performance measures in its ranking of state child support programs.
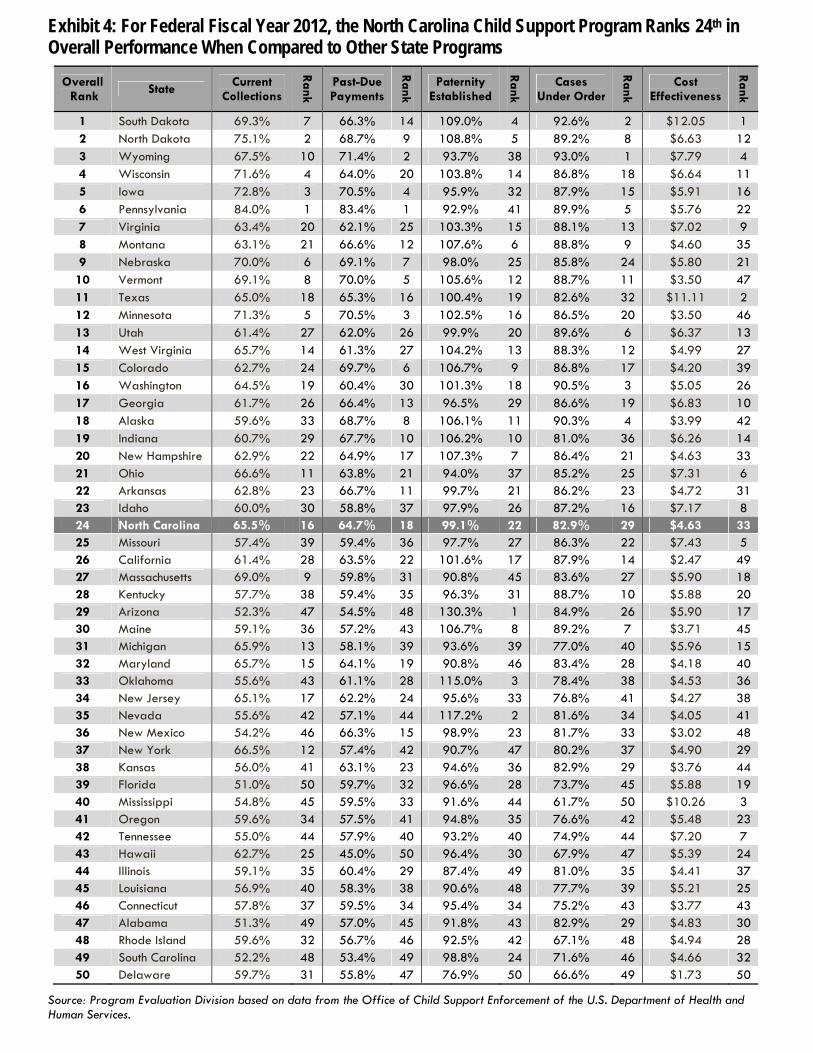
Exhibit 4: For Federal Fiscal Year 2012, the North Carolina Child Support Program Ranks 24th in Overall Performance When Compared to Other State Programs
Overall Rank State
Current Collections
Rank
Past-Due Payments
Rank
Paternity Established
Rank
Cases Under Order
Rank
Cost Effectiveness
Rank
1 South Dakota 69.3% 7 66.3% 14 109.0% 4 92.6% 2 $12.05 1 2 North Dakota 75.1% 2 68.7% 9 108.8% 5 89.2% 8 $6.63 12 3 Wyoming 67.5% 10 71.4% 2 93.7% 38 93.0% 1 $7.79 4 4 Wisconsin 71.6% 4 64.0% 20 103.8% 14 86.8% 18 $6.64 11 5 Iowa 72.8% 3 70.5% 4 95.9% 32 87.9% 15 $5.91 16 6 Pennsylvania 84.0% 1 83.4% 1 92.9% 41 89.9% 5 $5.76 22 7 Virginia 63.4% 20 62.1% 25 103.3% 15 88.1% 13 $7.02 9 8 Montana 63.1% 21 66.6% 12 107.6% 6 88.8% 9 $4.60 35 9 Nebraska 70.0% 6 69.1% 7 98.0% 25 85.8% 24 $5.80 21
10 Vermont 69.1% 8 70.0% 5 105.6% 12 88.7% 11 $3.50 47 11 Texas 65.0% 18 65.3% 16 100.4% 19 82.6% 32 $11.11 2 12 Minnesota 71.3% 5 70.5% 3 102.5% 16 86.5% 20 $3.50 46 13 Utah 61.4% 27 62.0% 26 99.9% 20 89.6% 6 $6.37 13 14 West Virginia 65.7% 14 61.3% 27 104.2% 13 88.3% 12 $4.99 27 15 Colorado 62.7% 24 69.7% 6 106.7% 9 86.8% 17 $4.20 39 16 Washington 64.5% 19 60.4% 30 101.3% 18 90.5% 3 $5.05 26 17 Georgia 61.7% 26 66.4% 13 96.5% 29 86.6% 19 $6.83 10 18 Alaska 59.6% 33 68.7% 8 106.1% 11 90.3% 4 $3.99 42 19 Indiana 60.7% 29 67.7% 10 106.2% 10 81.0% 36 $6.26 14 20 New Hampshire 62.9% 22 64.9% 17 107.3% 7 86.4% 21 $4.63 33 21 Ohio 66.6% 11 63.8% 21 94.0% 37 85.2% 25 $7.31 6 22 Arkansas 62.8% 23 66.7% 11 99.7% 21 86.2% 23 $4.72 31 23 Idaho 60.0% 30 58.8% 37 97.9% 26 87.2% 16 $7.17 8 24 North Carolina 65.5% 16 64.7% 18 99.1% 22 82.9% 29 $4.63 33 25 Missouri 57.4% 39 59.4% 36 97.7% 27 86.3% 22 $7.43 5 26 California 61.4% 28 63.5% 22 101.6% 17 87.9% 14 $2.47 49 27 Massachusetts 69.0% 9 59.8% 31 90.8% 45 83.6% 27 $5.90 18 28 Kentucky 57.7% 38 59.4% 35 96.3% 31 88.7% 10 $5.88 20 29 Arizona 52.3% 47 54.5% 48 130.3% 1 84.9% 26 $5.90 17 30 Maine 59.1% 36 57.2% 43 106.7% 8 89.2% 7 $3.71 45 31 Michigan 65.9% 13 58.1% 39 93.6% 39 77.0% 40 $5.96 15 32 Maryland 65.7% 15 64.1% 19 90.8% 46 83.4% 28 $4.18 40 33 Oklahoma 55.6% 43 61.1% 28 115.0% 3 78.4% 38 $4.53 36 34 New Jersey 65.1% 17 62.2% 24 95.6% 33 76.8% 41 $4.27 38 35 Nevada 55.6% 42 57.1% 44 117.2% 2 81.6% 34 $4.05 41 36 New Mexico 54.2% 46 66.3% 15 98.9% 23 81.7% 33 $3.02 48 37 New York 66.5% 12 57.4% 42 90.7% 47 80.2% 37 $4.90 29 38 Kansas 56.0% 41 63.1% 23 94.6% 36 82.9% 29 $3.76 44 39 Florida 51.0% 50 59.7% 32 96.6% 28 73.7% 45 $5.88 19 40 Mississippi 54.8% 45 59.5% 33 91.6% 44 61.7% 50 $10.26 3 41 Oregon 59.6% 34 57.5% 41 94.8% 35 76.6% 42 $5.48 23 42 Tennessee 55.0% 44 57.9% 40 93.2% 40 74.9% 44 $7.20 7 43 Hawaii 62.7% 25 45.0% 50 96.4% 30 67.9% 47 $5.39 24 44 Illinois 59.1% 35 60.4% 29 87.4% 49 81.0% 35 $4.41 37 45 Louisiana 56.9% 40 58.3% 38 90.6% 48 77.7% 39 $5.21 25 46 Connecticut 57.8% 37 59.5% 34 95.4% 34 75.2% 43 $3.77 43 47 Alabama 51.3% 49 57.0% 45 91.8% 43 82.9% 29 $4.83 30 48 Rhode Island 59.6% 32 56.7% 46 92.5% 42 67.1% 48 $4.94 28 49 South Carolina 52.2% 48 53.4% 49 98.8% 24 71.6% 46 $4.66 32 50 Delaware 59.7% 31 55.8% 47 76.9% 50 66.6% 49 $1.73 50
Source: Program Evaluation Division based on data from the Office of Child Support Enforcement of the U.S. Department of Health and Human Services.
Child Support Services Report No. 2014-08
Page 13 of 43
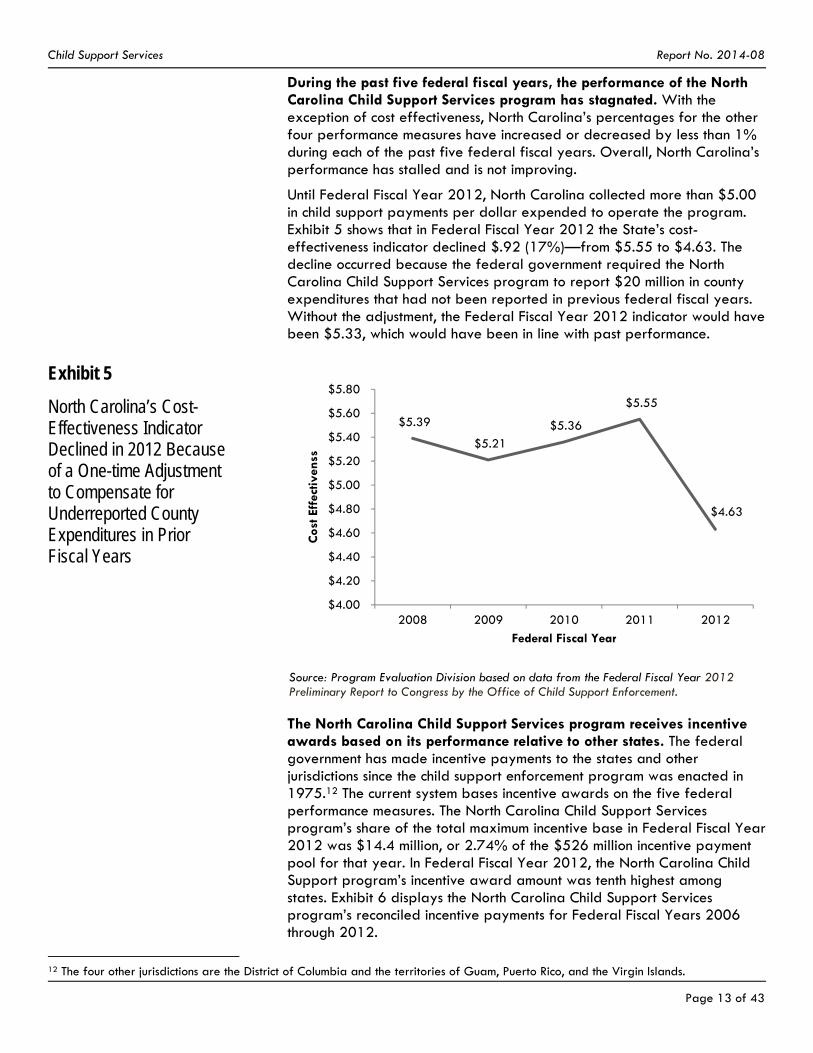
During the past five federal fiscal years, the performance of the North Carolina Child Support Services program has stagnated. With the exception of cost effectiveness, North Carolina’s percentages for the other four performance measures have increased or decreased by less than 1% during each of the past five federal fiscal years. Overall, North Carolina’s performance has stalled and is not improving.
Until Federal Fiscal Year 2012, North Carolina collected more than $5.00 in child support payments per dollar expended to operate the program. Exhibit 5 shows that in Federal Fiscal Year 2012 the State’s cost-effectiveness indicator declined $.92 (17%)—from $5.55 to $4.63. The decline occurred because the federal government required the North Carolina Child Support Services program to report $20 million in county expenditures that had not been reported in previous federal fiscal years. Without the adjustment, the Federal Fiscal Year 2012 indicator would have been $5.33, which would have been in line with past performance.
Exhibit 5
North Carolina’s Cost-Effectiveness Indicator Declined in 2012 Because of a One-time Adjustment to Compensate for Underreported County Expenditures in Prior Fiscal Years
Source: Program Evaluation Division based on data from the Federal Fiscal Year 2012 Preliminary Report to Congress by the Office of Child Support Enforcement.
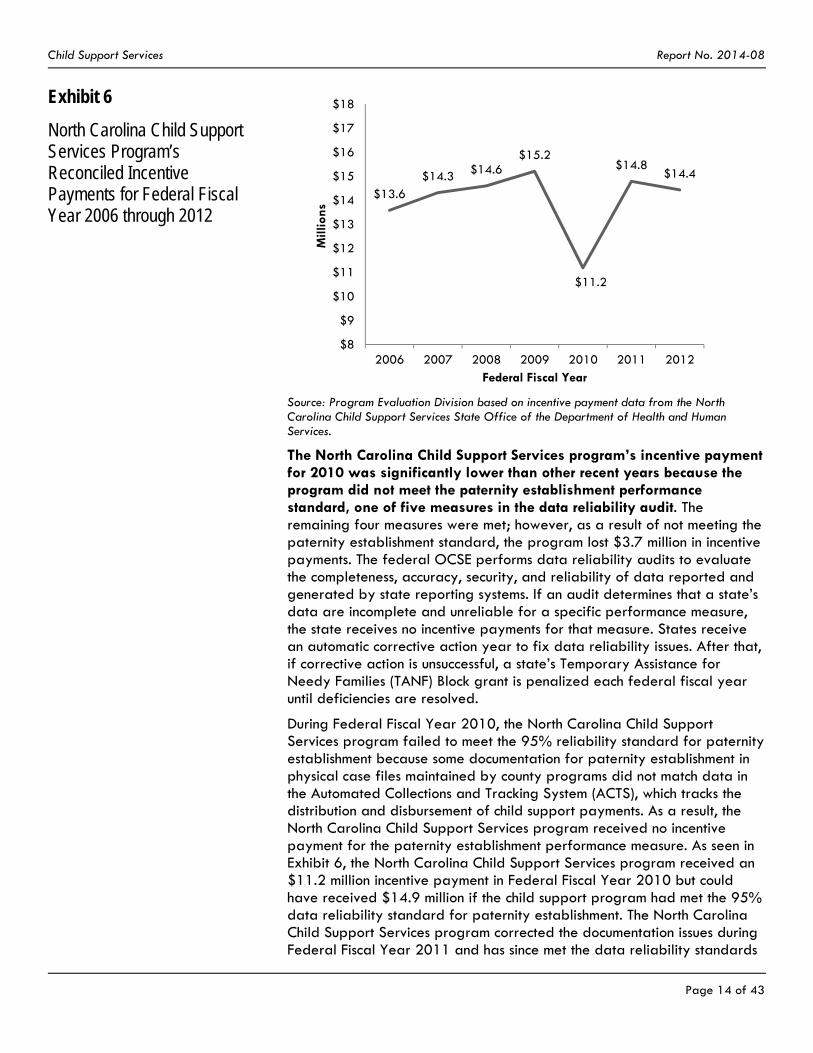
The North Carolina Child Support Services program receives incentive awards based on its performance relative to other states. The federal government has made incentive payments to the states and other jurisdictions since the child support enforcement program was enacted in 1975.12 The current system bases incentive awards on the five federal performance measures. The North Carolina Child Support Services program’s share of the total maximum incentive base in Federal Fiscal Year 2012 was $14.4 million, or 2.74% of the $526 million incentive payment pool for that year. In Federal Fiscal Year 2012, the North Carolina Child Support program’s incentive award amount was tenth highest among states. Exhibit 6 displays the North Carolina Child Support Services program’s reconciled incentive payments for Federal Fiscal Years 2006 through 2012.
12 The four other jurisdictions are the District of Columbia and the territories of Guam, Puerto Rico, and the Virgin Islands.
$5.39
$5.21 $5.36
$5.55
$4.63
$4.00
$4.20
$4.40
$4.60
$4.80
$5.00
$5.20
$5.40
$5.60
$5.80
2008 2009 2010 2011 2012
Cos
t Eff
ectiv
enss
Federal Fiscal Year
Child Support Services Report No. 2014-08
Page 14 of 43
Exhibit 6
North Carolina Child Support Services Program’s Reconciled Incentive Payments for Federal Fiscal Year 2006 through 2012
Source: Program Evaluation Division based on incentive payment data from the North Carolina Child Support Services State Office of the Department of Health and Human Services.
The North Carolina Child Support Services program’s incentive payment for 2010 was significantly lower than other recent years because the program did not meet the paternity establishment performance standard, one of five measures in the data reliability audit. The remaining four measures were met; however, as a result of not meeting the paternity establishment standard, the program lost $3.7 million in incentive payments. The federal OCSE performs data reliability audits to evaluate the completeness, accuracy, security, and reliability of data reported and generated by state reporting systems. If an audit determines that a state’s data are incomplete and unreliable for a specific performance measure, the state receives no incentive payments for that measure. States receive an automatic corrective action year to fix data reliability issues. After that, if corrective action is unsuccessful, a state’s Temporary Assistance for Needy Families (TANF) Block grant is penalized each federal fiscal year until deficiencies are resolved.
During Federal Fiscal Year 2010, the North Carolina Child Support Services program failed to meet the 95% reliability standard for paternity establishment because some documentation for paternity establishment in physical case files maintained by county programs did not match data in the Automated Collections and Tracking System (ACTS), which tracks the distribution and disbursement of child support payments. As a result, the North Carolina Child Support Services program received no incentive payment for the paternity establishment performance measure. As seen in Exhibit 6, the North Carolina Child Support Services program received an $11.2 million incentive payment in Federal Fiscal Year 2010 but could have received $14.9 million if the child support program had met the 95% data reliability standard for paternity establishment. The North Carolina Child Support Services program corrected the documentation issues during Federal Fiscal Year 2011 and has since met the data reliability standards
$13.6$14.3 $14.6
$15.2
$11.2
$14.8$14.4
$8
$9
$10
$11
$12
$13
$14
$15
$16
$17
$18
2006 2007 2008 2009 2010 2011 2012
Mill
ions
Federal Fiscal Year
Child Support Services Report No. 2014-08
Page 15 of 43
and annually earned incentive payments for all five performance measures.13
In summary, the federal OCSE uses five measures to evaluate states’ child support program performance. The North Carolina Child Support Services program ranks only 24th overall when compared to programs operated by other states. During the past five federal fiscal years, the performance of the North Carolina Child Support Services program has stagnated and is not improving. The North Carolina Child Support Services program receives annual incentive awards based on its performance. In Federal Fiscal Year 2010, it received a reduced incentive award because it failed the data reliability audit in paternity establishment, but the program has since passed the data reliability audit.
Finding 2. The methodology used by the Child Support Services State Office to distribute federal incentive payments does not promote improved county child support program performance.
North Carolina state law directs the Department of Health and Human Services (DHHS) to implement and maintain performance standards for county child support programs.14 The performance standards established under state law are similar to federal performance measures. Pursuant to statute, the CSS State Office monitors the performance of each county child support program and administers a reporting system that allows each county program to review its performance as well as the performance of other county programs. The CSS State Office also uses federal performance measures to track county performance in each state fiscal year.15
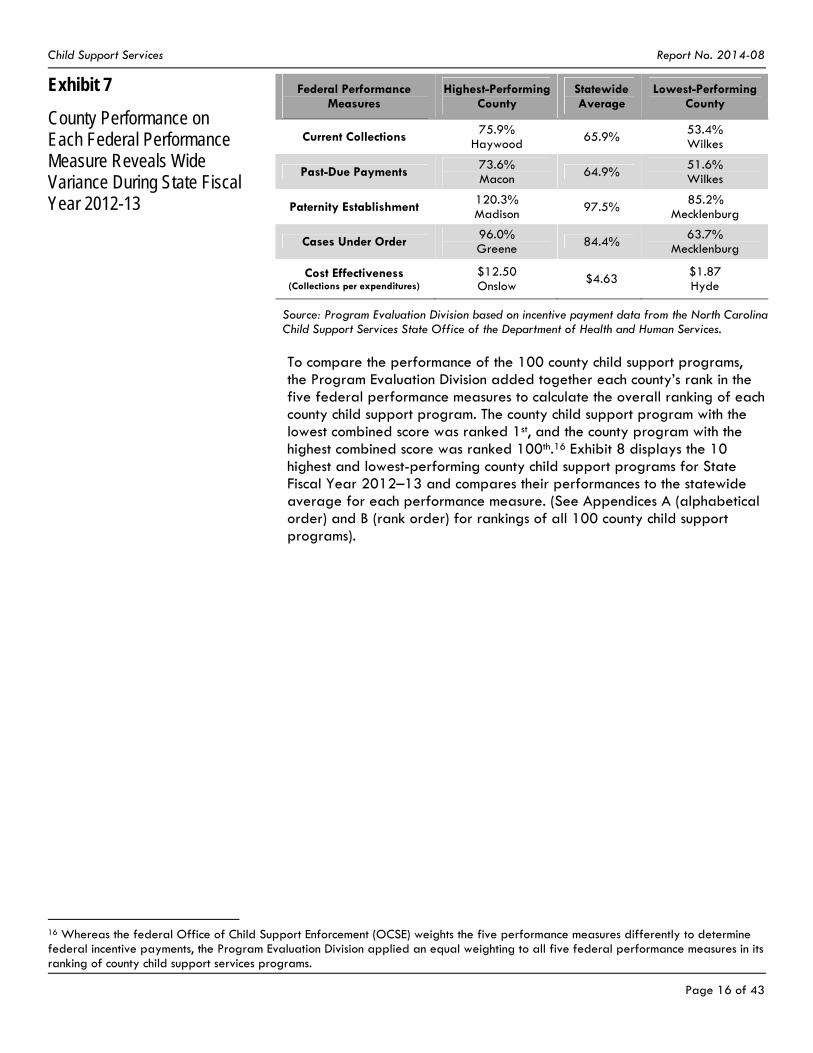
Performance on federal performance measures reveals wide variance among the highest- and lowest-performing counties. The Program Evaluation Division analyzed performance data for State Fiscal Year 2012–13 to determine how county programs performed. Exhibit 7 compares the performance of the highest- and lowest-performing county for each federal performance measure. The data reveals significant variance. For each of the four performance measures using percentages for measurement, county performance varied over 20% between the highest- and lowest-performing county.
13 When the North Carolina Child Support program was penalized, the CSS State Office had already received $13.7 million in estimated incentive payments from the federal government and most of the money had been distributed to county programs. As a result, the CSS State Office returned $2.5 million to the federal government and recouped $1.5 million from county child support programs. Since the 2010 recoupment, county programs receive smaller incentive payments in advance and a larger settlement payment after the State’s performance is validated by the federal data reliability audit. The CSS State Office implemented this change to ensure that funding is disbursed based on audited performance, with the goal of moving toward a pay-after-performance methodology. 14 N. C. Gen. Stat. § 110-129.1(9). 15 North Carolina’s fiscal year runs from July 1 through June 30. The federal fiscal year runs from October 1 through September 30.
Child Support Services Report No. 2014-08
Page 16 of 43
Exhibit 7
County Performance on Each Federal Performance Measure Reveals Wide Variance During State Fiscal Year 2012-13
Source: Program Evaluation Division based on incentive payment data from the North Carolina Child Support Services State Office of the Department of Health and Human Services.
Federal Performance Measures
Highest-Performing County
Statewide Average
Lowest-Performing County
Current Collections 75.9% Haywood
65.9% 53.4% Wilkes
Past-Due Payments 73.6% Macon 64.9%
51.6% Wilkes
Paternity Establishment 120.3% Madison 97.5%
85.2% Mecklenburg
Cases Under Order 96.0% Greene 84.4%
63.7% Mecklenburg
Cost Effectiveness (Collections per expenditures)
$12.50 Onslow
$4.63 $1.87 Hyde
To compare the performance of the 100 county child support programs, the Program Evaluation Division added together each county’s rank in the five federal performance measures to calculate the overall ranking of each county child support program. The county child support program with the lowest combined score was ranked 1st, and the county program with the highest combined score was ranked 100th.16 Exhibit 8 displays the 10 highest and lowest-performing county child support programs for State Fiscal Year 2012–13 and compares their performances to the statewide average for each performance measure. (See Appendices A (alphabetical order) and B (rank order) for rankings of all 100 county child support programs).
16 Whereas the federal Office of Child Support Enforcement (OCSE) weights the five performance measures differently to determine federal incentive payments, the Program Evaluation Division applied an equal weighting to all five federal performance measures in its ranking of county child support services programs.
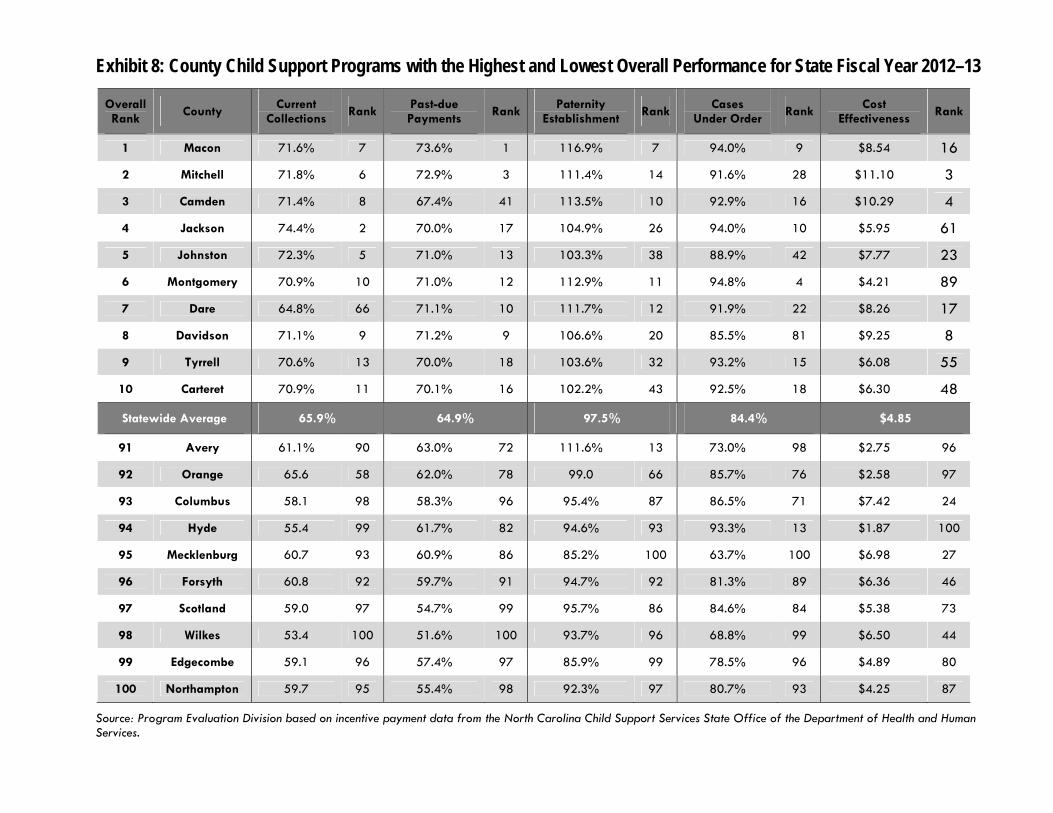
Exhibit 8: County Child Support Programs with the Highest and Lowest Overall Performance for State Fiscal Year 2012–13
Overall Rank
County Current
Collections Rank
Past-due Payments
Rank Paternity
Establishment Rank
Cases Under Order
Rank Cost
Effectiveness Rank
1 Macon 71.6% 7 73.6% 1 116.9% 7 94.0% 9 $8.54 16
2 Mitchell 71.8% 6 72.9% 3 111.4% 14 91.6% 28 $11.10 3
3 Camden 71.4% 8 67.4% 41 113.5% 10 92.9% 16 $10.29 4
4 Jackson 74.4% 2 70.0% 17 104.9% 26 94.0% 10 $5.95 61
5 Johnston 72.3% 5 71.0% 13 103.3% 38 88.9% 42 $7.77 23
6 Montgomery 70.9% 10 71.0% 12 112.9% 11 94.8% 4 $4.21 89
7 Dare 64.8% 66 71.1% 10 111.7% 12 91.9% 22 $8.26 17
8 Davidson 71.1% 9 71.2% 9 106.6% 20 85.5% 81 $9.25 8
9 Tyrrell 70.6% 13 70.0% 18 103.6% 32 93.2% 15 $6.08 55
10 Carteret 70.9% 11 70.1% 16 102.2% 43 92.5% 18 $6.30 48
Statewide Average 65.9% 64.9% 97.5% 84.4% $4.85
91 Avery 61.1% 90 63.0% 72 111.6% 13 73.0% 98 $2.75 96
92 Orange 65.6 58 62.0% 78 99.0 66 85.7% 76 $2.58 97
93 Columbus 58.1 98 58.3% 96 95.4% 87 86.5% 71 $7.42 24
94 Hyde 55.4 99 61.7% 82 94.6% 93 93.3% 13 $1.87 100
95 Mecklenburg 60.7 93 60.9% 86 85.2% 100 63.7% 100 $6.98 27
96 Forsyth 60.8 92 59.7% 91 94.7% 92 81.3% 89 $6.36 46
97 Scotland 59.0 97 54.7% 99 95.7% 86 84.6% 84 $5.38 73
98 Wilkes 53.4 100 51.6% 100 93.7% 96 68.8% 99 $6.50 44
99 Edgecombe 59.1 96 57.4% 97 85.9% 99 78.5% 96 $4.89 80
100 Northampton 59.7 95 55.4% 98 92.3% 97 80.7% 93 $4.25 87
Source: Program Evaluation Division based on incentive payment data from the North Carolina Child Support Services State Office of the Department of Health and Human Services.
Child Support Services Report No. 2014-08
Page 18 of 43
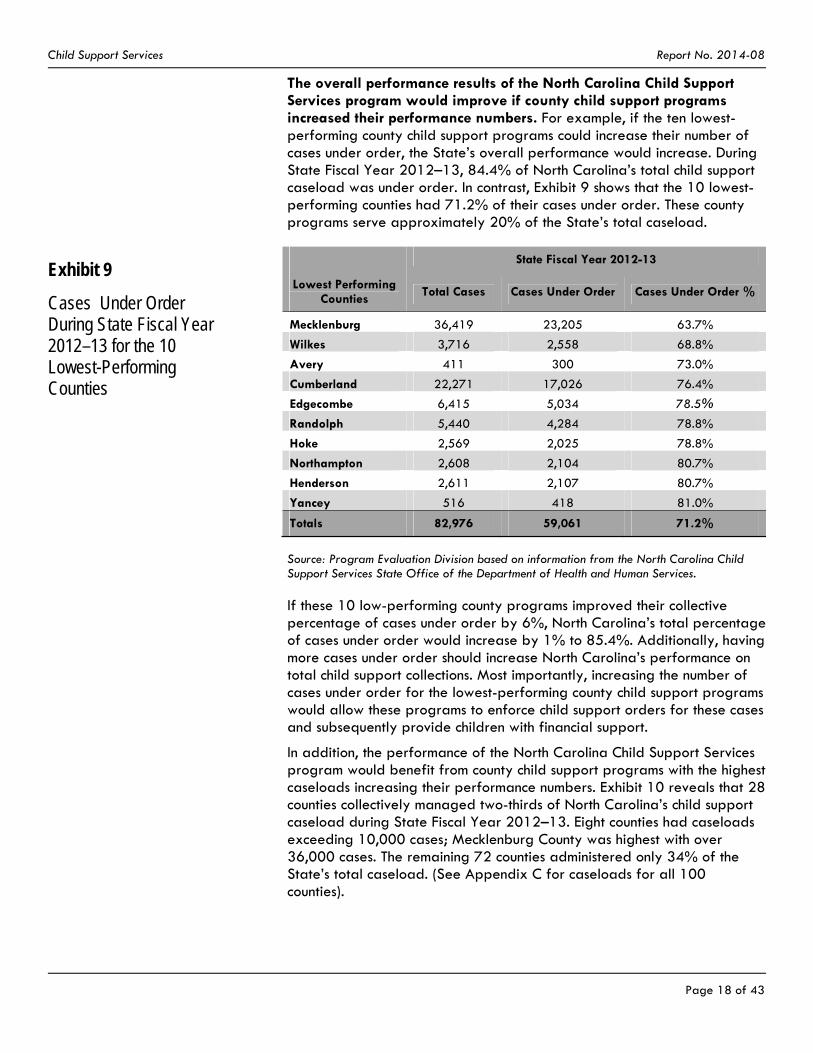
The overall performance results of the North Carolina Child Support Services program would improve if county child support programs increased their performance numbers. For example, if the ten lowest-performing county child support programs could increase their number of cases under order, the State’s overall performance would increase. During State Fiscal Year 2012–13, 84.4% of North Carolina’s total child support caseload was under order. In contrast, Exhibit 9 shows that the 10 lowest-performing counties had 71.2% of their cases under order. These county programs serve approximately 20% of the State’s total caseload.
Exhibit 9
Cases Under Order During State Fiscal Year 2012–13 for the 10 Lowest-Performing Counties
State Fiscal Year 2012-13
Lowest Performing Counties
Total Cases Cases Under Order Cases Under Order %
Mecklenburg 36,419 23,205 63.7%
Wilkes 3,716 2,558 68.8%
Avery 411 300 73.0%
Cumberland 22,271 17,026 76.4%
Edgecombe 6,415 5,034 78.5%
Randolph 5,440 4,284 78.8%
Hoke 2,569 2,025 78.8%
Northampton 2,608 2,104 80.7%
Henderson 2,611 2,107 80.7%
Yancey 516 418 81.0%
Totals 82,976 59,061 71.2%
Source: Program Evaluation Division based on information from the North Carolina Child Support Services State Office of the Department of Health and Human Services.
If these 10 low-performing county programs improved their collective percentage of cases under order by 6%, North Carolina’s total percentage of cases under order would increase by 1% to 85.4%. Additionally, having more cases under order should increase North Carolina’s performance on total child support collections. Most importantly, increasing the number of cases under order for the lowest-performing county child support programs would allow these programs to enforce child support orders for these cases and subsequently provide children with financial support.
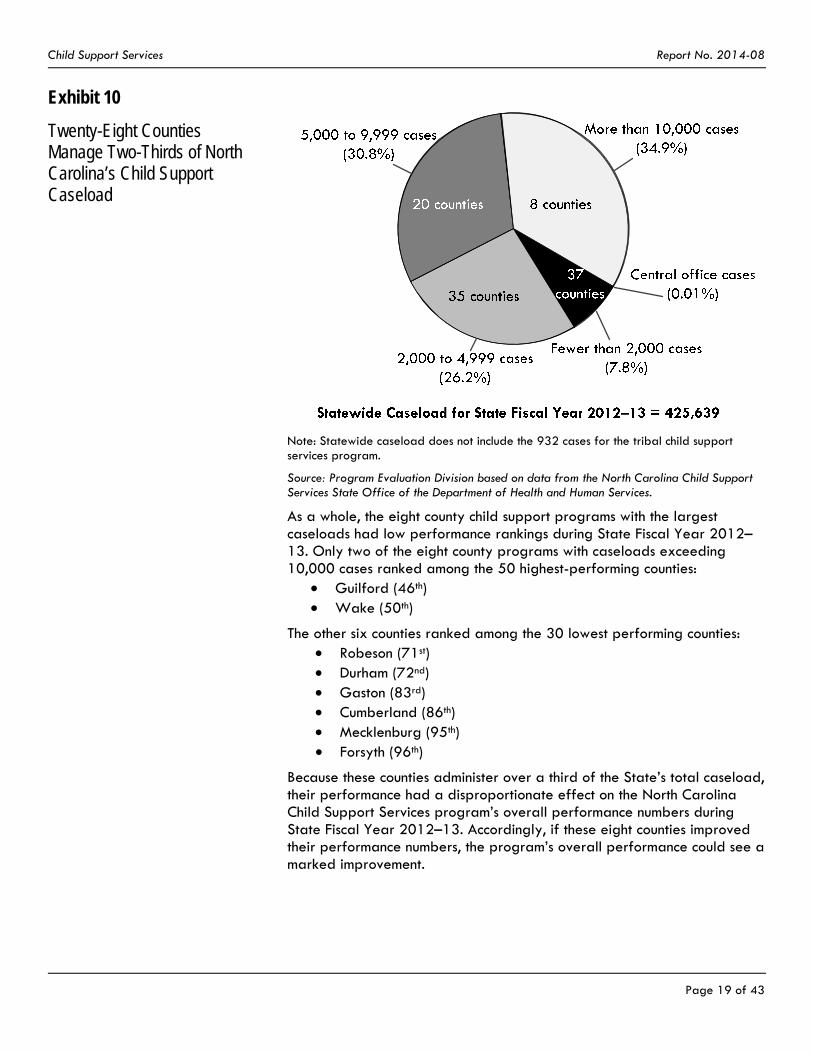
In addition, the performance of the North Carolina Child Support Services program would benefit from county child support programs with the highest caseloads increasing their performance numbers. Exhibit 10 reveals that 28 counties collectively managed two-thirds of North Carolina’s child support caseload during State Fiscal Year 2012–13. Eight counties had caseloads exceeding 10,000 cases; Mecklenburg County was highest with over 36,000 cases. The remaining 72 counties administered only 34% of the State’s total caseload. (See Appendix C for caseloads for all 100 counties).
Child Support Services Report No. 2014-08
Page 19 of 43
Exhibit 10
Twenty-Eight Counties Manage Two-Thirds of North Carolina’s Child Support Caseload
Note: Statewide caseload does not include the 932 cases for the tribal child support services program.
Source: Program Evaluation Division based on data from the North Carolina Child Support Services State Office of the Department of Health and Human Services.
As a whole, the eight county child support programs with the largest caseloads had low performance rankings during State Fiscal Year 2012–13. Only two of the eight county programs with caseloads exceeding 10,000 cases ranked among the 50 highest-performing counties:
Guilford (46th) Wake (50th)
The other six counties ranked among the 30 lowest performing counties: Robeson (71st) Durham (72nd) Gaston (83rd) Cumberland (86th) Mecklenburg (95th) Forsyth (96th)
Because these counties administer over a third of the State’s total caseload, their performance had a disproportionate effect on the North Carolina Child Support Services program’s overall performance numbers during State Fiscal Year 2012–13. Accordingly, if these eight counties improved their performance numbers, the program’s overall performance could see a marked improvement.
Child Support Services Report No. 2014-08
Page 20 of 43
In State Fiscal Year 2012–13, the North Carolina Child Support Services program did not meet statewide incentive goals because county programs did not meet their incentive goals. In collaboration with the county child support programs, the CSS State Office establishes annual incentive goals for each county program and for the State as a whole, based on the performance measures established by the federal government. The CSS State Office uses the incentive goals to encourage county child support programs to improve their performance, but county programs are not penalized if they do not meet their incentive goals.
During State Fiscal Year 2012–13, the CSS State Office set goals to encourage lower-performing counties to improve their performance. Higher-achieving counties were encouraged to maintain their performance if they had already met a higher threshold. For example, the North Carolina Child Support Services program set these goals for cases under order:
if a county’s achievement is 88% or above, the goal is to maintain the performance level;
if a county’s achievement is equal to or between 79% and 87.99%, the goal is a 1% increase; and
if a county’s achievement is below 79%, the goal is a 2% increase.
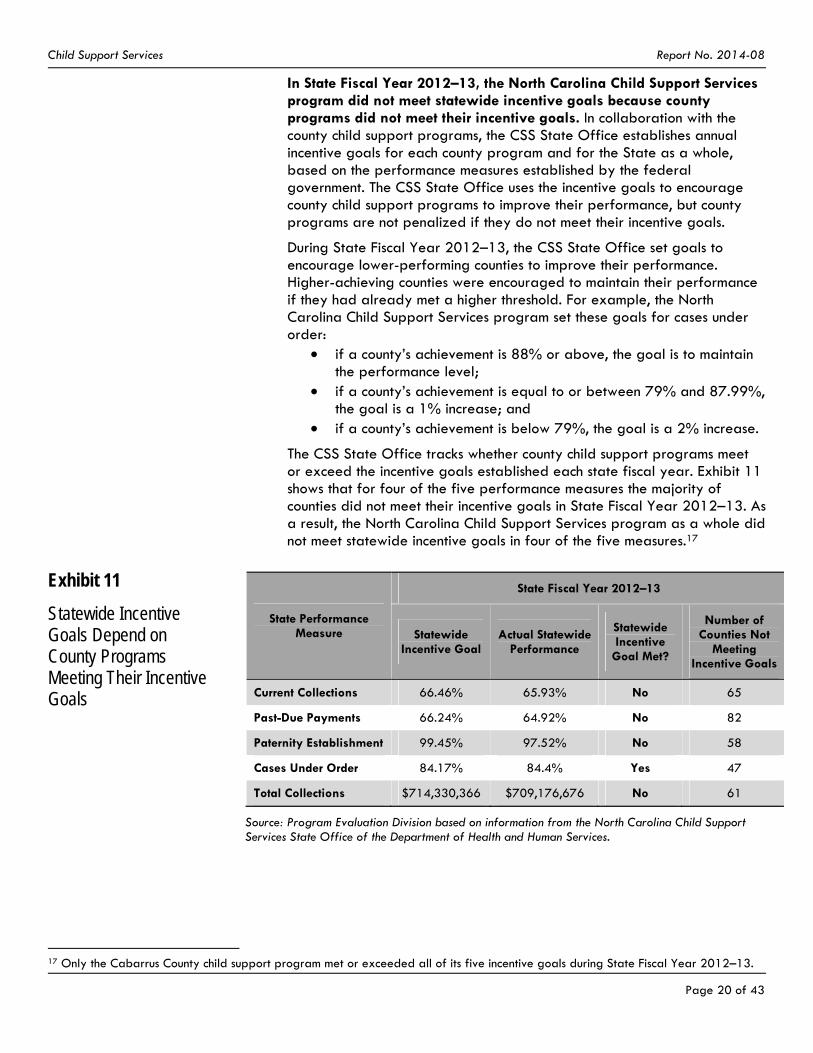
The CSS State Office tracks whether county child support programs meet or exceed the incentive goals established each state fiscal year. Exhibit 11 shows that for four of the five performance measures the majority of counties did not meet their incentive goals in State Fiscal Year 2012–13. As a result, the North Carolina Child Support Services program as a whole did not meet statewide incentive goals in four of the five measures.17
Exhibit 11
Statewide Incentive Goals Depend on County Programs Meeting Their Incentive Goals
State Performance Measure
State Fiscal Year 2012–13
Statewide Incentive Goal
Actual Statewide Performance
Statewide Incentive
Goal Met?
Number of Counties Not
Meeting Incentive Goals
Current Collections 66.46% 65.93% No 65
Past-Due Payments 66.24% 64.92% No 82
Paternity Establishment 99.45% 97.52% No 58
Cases Under Order 84.17% 84.4% Yes 47
Total Collections $714,330,366 $709,176,676 No 61
Source: Program Evaluation Division based on information from the North Carolina Child Support Services State Office of the Department of Health and Human Services.
17 Only the Cabarrus County child support program met or exceeded all of its five incentive goals during State Fiscal Year 2012–13.
Child Support Services Report No. 2014-08
Page 21 of 43
The CSS State Office modified county incentive goals for State Fiscal Year 2013–14 in response to poor performance during the previous state fiscal year. For example, the North Carolina Child Support Services program modified the incentive goals for cases under order by adding a threshold level and reducing the improvement goals:
if a county’s achievement is 88% or above, the goal is to maintain the performance level;
if a county’s achievement is equal to or between 79% and 87.99%, the goal is a 0.5% point increase;
if a county’s achievement is equal to or between 70% and 78.99%, the goal is a 1% point increase; and
if a county’s achievement is below 70%, the goal is a 1.5% increase.
The CSS State Office considered several factors that may have affected county performance in developing the goals for State Fiscal Year 2013–14, including a review of State Fiscal Year 2012–13 goals, unemployment rates, and static or declining child support collections. The reduced goals were intended to be challenging but also achievable.
The methodology the CSS State Office uses to determine and distribute incentive award payments to county child support programs is not connected to the incentive goals it sets for each county program. The CSS State Office distributes 100% of the federal incentive payments awarded to the North Carolina Child Support Services program to county programs using a methodology similar to the federal incentive award distribution methodology.18 According to the federal methodology, a state child support services program’s incentive award depends on its computed performance rate and how its performance rate compares to the performance rate earned by other states. Each federal performance measure is translated into the following mathematical formula:
1. Each state program’s performance is calculated on each of the five federal performance measures: current collection, past-due payments (arrearages), paternity establishment, cases under order, and cost effectiveness.19
2. For each state, the percentage for each performance measure is multiplied by its “collections” to determine the maximum incentive for each performance measure.20 Then, the maximum incentives are added together to determine a state’s maximum incentive base amount.
3. The maximum incentive base amounts for all states are added together for a total maximum incentive base amount.
18 The federal government makes incentive payments to the North Carolina Child Support Services program based on its scores on the five performance measures on an ongoing, quarterly prospective basis using the State’s estimates of what its incentive payments will total. The CSS State Office then makes incentive payments prospectively to county child support programs based on previous years’ awards. County programs receive smaller incentive payments in advance and a larger settlement payment after their performance is validated by the federal data reliability audit. 19 The five measures have different weights. Paternity establishment, child support order establishment, and current collections are multiplied by 100%. Past-due payments and cost effectiveness are multiplied by 75%. 20 The collections base is calculated by using the following formula: [2 x (current assistance collections + former assistance collections + Medicaid never assistance collections) + never on TANF collections + fees retained by other states].
Child Support Services Report No. 2014-08
Page 22 of 43
4. Each state’s individual maximum base amount is compared to the total maximum incentive base amount, and an individual state’s share of the total is the percentage used to determine the state’s actual incentive payment.
Under the federal incentive payment system, a state’s total incentive payment depends on
the total amount of federal funds available for incentive payments, a state’s success in obtaining collections on behalf of its caseload, a state’s performance on the five performance measures, and the relative success or failure of other states in making collections
and meeting performance criteria. Because incentive payments are capped, states can receive reduced incentive payments even if they improve their performance.
Ultimately, the amount of a state’s incentive payment depends on how much child support it collects. If a state has a small amount of collections and high performance, its incentive payments would be smaller than a state with a large amount of collections and mediocre performance. For example, California usually receives the highest or second highest incentive payment even though its overall performance ranking of 26th was lower than North Carolina’s ranking of 24th.21
The CSS State Office calculates incentive payments for county child support programs using a methodology similar to the federal process, but with two important differences:
1. The North Carolina CSS State Office does not include performance thresholds in its methodology. The methodology used by the federal Office of Child Support Enforcement (OCSE), by contrast, sets upper and lower thresholds. States achieving performance levels at or above the upper threshold are entitled to 100% of the incentive for each performance measure, and states with performance levels below the lower threshold do not receive an incentive payment for that performance measure unless the state makes significant improvement over its previous year’s performance.22
2. The North Carolina CSS State Office does not adjust incentive payments to county programs if quality reviews of county programs result in negative findings. In contrast, the federal OCSE penalizes states if they fail data reliability audits.
Federal, state, and local stakeholders have analyzed whether the methodology used by the federal OCSE should be revised because it can result in incentive awards that are not commensurate with a child support program’s relative performance on individual measures. Because incentive payments are disproportionately dependent on child support collections, population or size can disproportionately affect the incentive payment amount a child support program receives. The same analysis can be
21 The full list of state rankings can be seen in Exhibit 4. 22 If a state’s performance falls between the upper and lower thresholds, the applicable percentage is obtained by referring to tables specified in federal law.
Child Support Services Report No. 2014-08
Page 23 of 43
applied to the methodology used by the North Carolina CSS State Office. For example, Wake and Mecklenburg counties, the two largest counties in North Carolina, received the highest incentive payments in State Fiscal Year 2012–13 even though their performance rankings were 50th and 95th, respectively.
In addition, like the federal incentive formula, the formula used by the CSS State Office does not consider complex factors such as the county unemployment rate, economy, and geography that may disproportionately affect county performance. Finally, the federal performance measures that are the basis for the state incentive formula may not fully capture program performance because they do not measure other significant indicators of performance like interstate collections, welfare cost avoidance, payment processing performance, and customer service. If the CSS State Office revised its methodology to reflect some of these factors and/or include additional indicators, it might be able to calculate incentive award amounts that are more commensurate with the relative performance of county programs.
The current incentive payment system used by the CSS State Office does not provide a strong motivation for county programs to improve performance. Every county child support program receives a share of federal incentive payments even if their performance declines or remains stagnant. As mentioned previously, the incentive goals the CSS State Office develops for county child support programs are not connected to the incentive payments awarded to county programs. Accordingly, the CSS State Office does not use incentive goals to financially motivate county programs to improve their performance. By creating a direct relationship between incentive goals and incentive payments, the CSS State Office could reward the county programs that meet or exceed their incentive goals and penalize the programs that do not meet their incentive goals. If county child support programs understood that meeting incentive goals affected federal incentive payments, county programs would be financially motivated to meet the goals set by the CSS State Office. More county programs meeting incentive goals could result in improved state performance and potentially increased federal incentive payments.
The CSS State Office could adjust its methodology for distributing incentive payments to more effectively promote improved county performance. The CSS State Office is not required to utilize the federal incentive payment process to allocate incentive payments to county child support programs. By using a different methodology for distributing federal incentive payments that rewards county offices for meeting state incentive goals, the CSS State Office could promote improved performance by financially motivating county programs to not only meet incentive goals but also to more effectively serve children. Potential adjustments to the state incentive payment distribution formula include
incorporating minimum performance thresholds into the formula; requiring county programs to meet incentive goals to receive an
incentive payment, or a portion thereof; and/or setting aside a portion of the federal incentive payment to reward
county programs that improve their performance, which could be
Child Support Services Report No. 2014-08
Page 24 of 43
measured by a county program’s ability to meet and/or exceed its incentive goals.
For example, the North Carolina Child Support Services program could set aside a portion of the federal incentive payment pool to pay bonuses to employees of county child support programs that meet their incentive goals, which could incentivize employees and improve overall performance. According to the federal OCSE, employee performance bonuses are a permissible use of federal incentive payments because bonuses may improve program effectiveness and efficiency.
If the CSS State Office made some of these adjustments, incentive payment determinations would not be as greatly influenced by the total dollar amount of child support a county program collects. Currently, a county program’s child support collections score has a disproportionate effect on the incentive payment amount a county program receives, which provides an advantage to county programs with larger populations.
The CSS State Office also could improve its communication with county child support programs regarding how incentive payments are calculated and distributed. Survey results and interviews with county child support programs revealed confusion about how incentive payments were determined and how they could be used by counties. The CSS State Office disseminates information about the incentive payment process and other important child support policy matters by sending out letters to county child support programs. These letters also are available on the State Child Support Services website. County programs know that incentive payments are based on the five federal performance measures, but the letters do not describe how the State applies the federal formula to county performance data.
For six of the seven other states with state-supervised and county-administered child support programs, state laws or administrative rules describe the incentive payment process for county programs. North Carolina state law and administrative rules for child support enforcement do not mention the incentive payment process, so county programs must rely on the CSS State Office to provide information describing how incentive payments are calculated and distributed. If county programs were provided with clearer and more transparent information about how the incentive payment system works in North Carolina, they would have a better understanding of how improving program performance could result in higher incentive payments.
In summary, the success of the North Carolina Child Support Services program is dependent on the cumulative performance of the 100 county child support programs. Although the CSS State Office sets statewide and county-specific incentive goals, the majority of the programs do not meet their goals, which means North Carolina cannot meet its statewide goals. The methodology the CSS State Office uses to distribute its annual incentive payments to the county child support programs is not connected to the incentive goals it sets for the county programs. In order to promote improved county performance and, subsequently, state performance, the CSS State Office could consider adjusting the methodology it uses to determine incentive payments to county programs. Additionally, the CSS
Child Support Services Report No. 2014-08
Page 25 of 43
State Office could improve its communication with the county programs regarding how incentive payments are calculated and distributed.
Finding 3. The North Carolina Child Support Services State Office cannot ensure that federal incentive payments are being used to improve county child support programs because it has not established specific spending guidelines and does not track incentive payment expenditures.
As a state-supervised, county-administered program, the North Carolina Child Support Services State Office receives state appropriations from the General Fund to support centralized services, while local boards of county commissioners are responsible for funding their county’s child support services programs. As stated previously, the federal government reimburses 66% of all county and state child support expenditures.
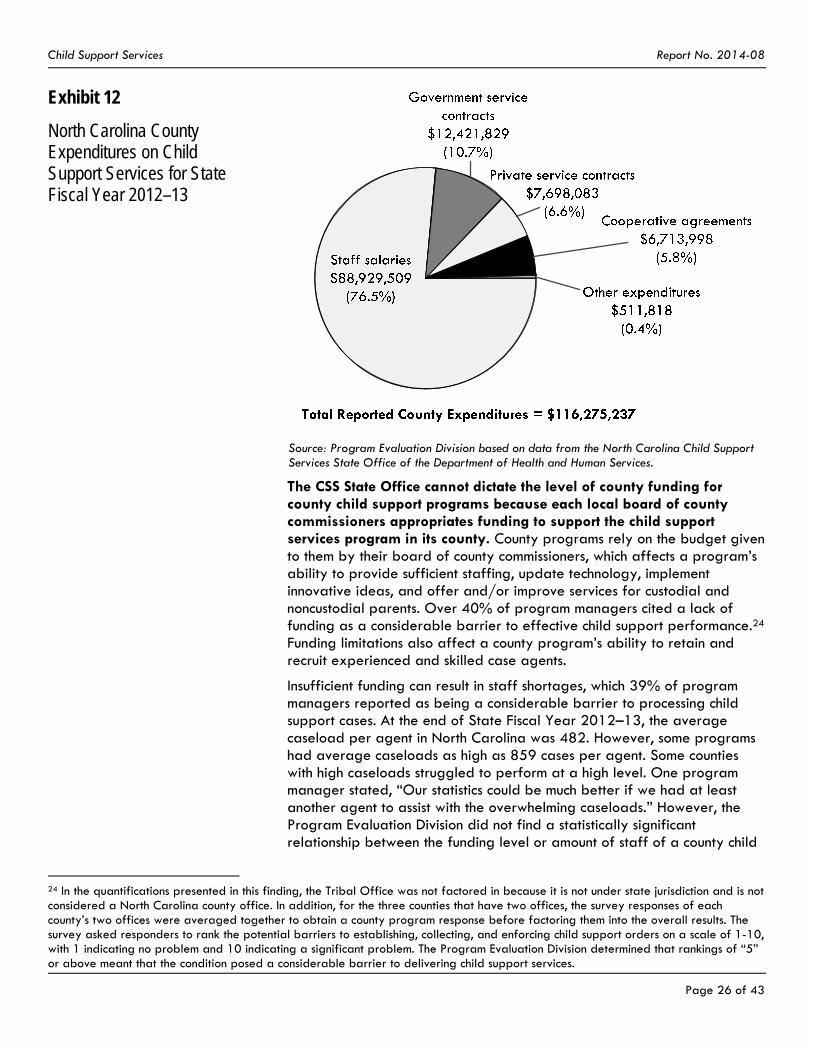
In State Fiscal Year 2012–13, counties expended $116.3 million in federal and county funds to provide child support services. The vast majority of county child support program expenditures pay for case workers’ wages, legal services, and fees. Exhibit 12 shows the breakdown of expenditures for North Carolina’s county child support programs during State Fiscal Year 2012–13. During State Fiscal Year 2012–13, counties also received $6.3 million in federal incentive payments to provide child support services, but the Program Evaluation Division was not able to obtain information on how counties spent this money because the CSS State Office does not track this information.23
23 The North Carolina Child Support Services program received $14.4 million in incentive payments for Federal Fiscal Year 2012, and has prospectively paid county child support programs $6.3 million. The remaining funds will be paid after the federal government completes the data reliability audit for 2012. Non-public assistance custodial parents also paid approximately $3.1 million in client fees for child support services in State Fiscal Year 2012–13, which offset total expenditures.
Child Support Services Report No. 2014-08
Page 26 of 43
Exhibit 12
North Carolina County Expenditures on Child Support Services for State Fiscal Year 2012–13
Source: Program Evaluation Division based on data from the North Carolina Child Support Services State Office of the Department of Health and Human Services.
The CSS State Office cannot dictate the level of county funding for county child support programs because each local board of county commissioners appropriates funding to support the child support services program in its county. County programs rely on the budget given to them by their board of county commissioners, which affects a program’s ability to provide sufficient staffing, update technology, implement innovative ideas, and offer and/or improve services for custodial and noncustodial parents. Over 40% of program managers cited a lack of funding as a considerable barrier to effective child support performance.24 Funding limitations also affect a county program’s ability to retain and recruit experienced and skilled case agents.
Insufficient funding can result in staff shortages, which 39% of program managers reported as being a considerable barrier to processing child support cases. At the end of State Fiscal Year 2012–13, the average caseload per agent in North Carolina was 482. However, some programs had average caseloads as high as 859 cases per agent. Some counties with high caseloads struggled to perform at a high level. One program manager stated, “Our statistics could be much better if we had at least another agent to assist with the overwhelming caseloads.” However, the Program Evaluation Division did not find a statistically significant relationship between the funding level or amount of staff of a county child
24 In the quantifications presented in this finding, the Tribal Office was not factored in because it is not under state jurisdiction and is not considered a North Carolina county office. In addition, for the three counties that have two offices, the survey responses of each county’s two offices were averaged together to obtain a county program response before factoring them into the overall results. The survey asked responders to rank the potential barriers to establishing, collecting, and enforcing child support orders on a scale of 1-10, with 1 indicating no problem and 10 indicating a significant problem. The Program Evaluation Division determined that rankings of “5” or above meant that the condition posed a considerable barrier to delivering child support services.
Child Support Services Report No. 2014-08
Page 27 of 43
support program and its performance level. For example, even though the Dare County Child Support Program has the 12th highest average number of cases per agent at 637, it ranks 7th in overall performance.
Local governments can choose to allocate more money to their county child support program to improve services, including designating more funding for more child support staff positions. During State Fiscal Year 2013–14, the Mecklenburg board of county commissioners increased the funding of its county child support program to provide for 10 more staff positions in order to reduce the amount of cases per agent and subsequently improve customer service. Other county child support programs have kept vacant positions unfilled due to county budget restrictions.
The CSS State Office’s decision to rely on federal regulations to direct how county child support programs use federal incentive payments limits the effectiveness of North Carolina’s incentive payment system. As explained in Finding 2, federal incentive payments are awarded to the North Carolina Child Support Services program, and the CSS State Office chooses to distribute 100% of the payments to county programs. The CSS State Office is responsible for ensuring that county child support programs comply with federal regulations in reinvesting federal incentive payments. Federal regulations provide general guidance for reinvesting federal incentive payments by requiring state child support services programs to use incentive payments to improve program efficiency and effectiveness. Child support services programs also have the option to spend incentive payments on other activities approved by the Secretary of the U.S. Department of Health and Human Services that have a clear connection to the program and will improve it. Examples of other activities include fatherhood programs and employment programs for noncustodial parents.
The CSS State Office does not provide counties with specific direction on the reinvestment of federal incentive payments. Aside from instructing counties to follow federal regulations, the CSS State Office does not provide counties with additional guidance regarding how to spend federal incentive payments. However, federal and state law do not prohibit the North Carolina Child Support Services program from establishing more specific guidelines for county reinvestment of federal incentive payments. For example, administrative rules for the Maryland child support program identify reinvestment activities for federal incentive payments that contribute to the effectiveness and efficiency of the Maryland child support program, including
creating public awareness projects; assisting in staff development and training; and establishing community outreach programs and activities.
The CSS State Office could develop guidelines directing county child support programs to reinvest some of their federal incentive payments into specific activities that improve program performance. Potential activities could include paying for child support employees to attend training, purchasing parent locator tools and services, and developing fatherhood and employment programs for noncustodial parents. These guidelines for using federal incentive payments could assist counties in planning how
Child Support Services Report No. 2014-08
Page 28 of 43
federal incentive payments could improve the effectiveness and efficiency of their county child support programs.
The CSS State Office does not verify federal incentive payments are supplementing and not supplanting county funding for child support services as required by federal law. The CSS State Office directs county child support programs to use the federal maintenance of effort (MOE) standard to determine whether incentive payments are supplementing and not supplanting county funding. The federal MOE for county child support programs is calculated using the average of county expenditures for Federal Fiscal Years 1996, 1997, and 1998, less the average of child support incentives earned during the same time periods. Because the MOE standard is based on child support expenditures that occurred 16 years ago, counties can use incentive payments to limit county expenditures for child support services and still meet their MOE requirement. Some county child support programs noted in their survey responses and interviews that their counties used incentive payments to reduce county funding for child support services or indicated that they did not know how incentive payments benefited their programs. To date, the CSS State Office has not verified whether county child support programs are complying with federal non-supplant regulations.
If incentive payments are not required to be used to improve the effectiveness of county child support programs, county programs do not have a financial motivation to improve program performance. A modern MOE requirement based on current county expenditures for child support services could ensure counties use incentive payments to improve the effectiveness of their child support services programs.
Currently, the CSS State Office does not require county child support programs to report how federal incentive payments are spent to improve program effectiveness and efficiency. The CSS State Office requires county child support programs to enter federal incentive payment expenditures into the child support financial reporting system, but county programs do not document how federal incentive payments are reinvested to improve program performance. The Colorado, Maryland, and Minnesota child support programs require counties or other local child support agencies to document the activities for which federal incentive payments were expended. By requiring counties to report on how they used incentive payments to improve program performance, the CSS State Office could ensure counties use incentive payments to supplement rather than supplant funding for county child support programs. This reporting also would allow county child support programs to develop plans for reinvesting federal incentive payments in activities that improve program effectiveness and efficiency.
In summary, the CSS State Office’s decision to rely on federal regulations to direct how county child support programs use federal incentive payments limits the effectiveness of North Carolina’s incentive payment system. Federal regulations require that incentive payments supplement and not supplant state expenditures for child support services, but the CSS State Office does not verify federal incentive payments are supplementing and not supplanting county funding for child support services. The CSS
Child Support Services Report No. 2014-08
Page 29 of 43
State Office could develop guidelines directing county child support programs to reinvest federal incentive payments into activities that improve program performance and require county programs to document that their reinvestment of federal incentive payments improves program performance.
Finding 4. The Child Support Services State Office’s provision of centralized child support services is hindered by limited resources, but federal incentive payments could be used to improve these services.
As explained previously, the North Carolina Child Support Services State Office supervises county child support programs and provides centralized services for the county programs and custodial and noncustodial parents. Interviews and survey results revealed most county child support program managers are satisfied with the services the CSS State Office provides and have a strong working relationship with the CSS State Office. When asked whether they have a strong working relationship with the CSS State Office, 90% of program managers stated that they “agree” or “strongly agree” with the statement. Only one program manager selected “disagree.”25 However, county child support program managers and case agents also reported that the CSS State Office could make improvements to the Automated Collection and Tracking System (ACTS) and improve the services provided by the Central Registry.
Automated Collection and Tracking System (ACTS). Federal Regulation 42 U.S.C. 654a requires every state to create an automated data processing and information retrieval system for the administration of child support services in compliance with federal requirements. ACTS tracks the distribution and disbursement of child support payments. Case workers depend on ACTS to process child support cases from start to finish, including the distribution of payments. Although ACTS is a necessary case management tool that helps case agents process cases in an effective and timely manner, a system update is needed to make the system more efficient and user-friendly. One county child support program manager stated, “Most of the challenges of this job are not the job itself but making ACTS reflect the work that has been completed. Current technology has surpassed ACTS. More time is spent on data entry in ACTS than the time spent working a case.”
Because the system was created in 1997, ACTS is a mainframe, green screen, disc-operating system rather than a web-based system. Accordingly, system upgrades could
increase storage, improve interface with other systems, clean up old material and information, unnecessary forms, and
repetitive work lists, and streamline and increase automation of case tasks, interfaces, and
updates.
25 Nine of the county child support program managers answered that they were “neutral” on the question.
Child Support Services Report No. 2014-08
Page 30 of 43
The financial accounting system in ACTS poses an obstacle to efficient case processing. When ACTS was implemented, federal regulations required states to keep two sets of financial “books”: one set for the payment of child support orders and another set for the distribution of payments. Although the federal requirement no longer exists, the two books still exist in ACTS. Case agents have to spend time reconciling the two financial systems, which takes time away from the processing of cases and creates the potential for incorrect distribution of payments. Case agents also often have a difficult time learning how the two different sets of books interact, which increases the amount of training they need.
Some judges refuse to accept the court documents produced by ACTS because they are out-of-date and not comprehensive. Accordingly, some county child support programs are using handwritten forms or creating legal document in Microsoft Word and using a workaround in ACTS to fulfill the federally mandated tracking requirement. ACTS still automatically prints these documents, which case agents then discard, wasting both time and resources.
The CSS State Office attempted to obtain funding for ACTS updates beginning in State Fiscal Year 2008–09. It requested funding for the 2009–11 biennium to eliminate the two sets of financial “books.” The CSS State Office also submitted a request to develop a document generation solution for legal documents, which would allow for the customization of documents without affecting the ability to pull general data from the mainframe application of ACTS. The CSS State Office did not receive state appropriations for these upgrades and has not requested funding recently because the Department of Health and Human Services had other more pressing information technology needs. The estimated cost of providing these upgrades in State Fiscal Year 2014–15 is $1.9 million. Because these upgrades would qualify for a 66% match by the federal Office of Child Support Enforcement (OCSE), the CSS State Office would need $643,500 in nonrecurring state appropriations to pay for the upgrades.
An ACTS upgrade would make the system more compatible with data analytic software and allow the CSS State Office to conduct more sophisticated data analytics on county and state performance data. Child support programs in other states have used data analytics to improve performance and increase collections for children. Kentucky’s Business Intelligence initiative includes dashboards, federal reports, operational reports, and predictive analytics. It has four purposes:
1. enhance visibility into the program data; 2. improve caseworker performance; 3. improve compliance with federal performance requirements; and 4. maximize federal incentive dollars received.
In addition, Los Angeles’ Data Analytics, Data Mining, and Case Stratification project utilizes data mining and case stratification to target certain clients and child support cases in order to improve outcomes.
In 2011, five state child support agencies contracted with Deloitte LLP to deliver analytic services. Deloitte has helped programs use data analytics and case stratification to increase their paternity rates and collections. The
Child Support Services Report No. 2014-08
Page 31 of 43
CSS State Office has explored Deloitte’s data analytics services, but it does not have the resources to contract for data analytics.
Even without an ACTS upgrade, the CSS State Office could make more extensive use of macros and share them with county programs.26 One private vendor providing management for county child support programs uses macros to make data analysis and reporting more efficient for child support staff. Macros interact with ACTS to enhance the efficiency of reporting and operations and reduce the amount of unnecessary key strokes. Case agents can use macros to more efficiently process cases by running certain queries like pay histories for multiple cases at a time rather than one case at a time.
Central Registry and Interstate Cases. A majority of county child support program managers report that interstate cases, or cases where the custodial parent and the child live in a different state than the noncustodial parent, pose a considerable obstacle to establishing and enforcing child support orders. The North Carolina Child Support Services program must partner with other states to process both initiating and responding interstate cases, which represent approximately 15% of cases. For some child support services programs, interstate cases comprise as much as 41% of their total caseload. Interstate cases can be difficult to navigate because other states have different regulatory and administrative systems that are not always compatible with one another. Moreover, some states, like South Carolina, do not have an automated system that can interact with ACTS through electronic communication.
The North Carolina CSS Office operates the Central Registry, which receives petitions for child support services from other states and processes responding cases. Upon receiving a petition for an interstate case from another state, the North Carolina Central Registry has 10 days to review the petition for completeness and forward the case to the child support program in the county where the noncustodial parent resides. State central registries can return petitions to the initiating states if the petitions fail to meet federal regulations or violate the responding state’s general statutes. For example, the North Carolina Central Registry has the authority to send a petition back to the initiating state if it does not include a potential address for the noncustodial parent and the North Carolina State Locator Service cannot locate the individual in the state.
However, county child support managers and case agents report that interstate cases are difficult to process because the North Carolina Central Registry does not have a comprehensive review process and often refers cases to the county child support program without complete information from the initiating state. In State Fiscal Year 2012–13, approximately 9% of interstate requests the North Carolina Central Registry forwarded to county programs contained incomplete information. Once the Central Registry opens a case and refers it to a county child support program, federally-mandated timeframes for case processing are initiated, which affect the North Carolina Child Support Services program’s performance
26 A macro is an automated input sequence that imitates keystrokes or mouse actions. A macro is typically used to replace a repetitive series of keyboard and mouse actions and is common in spreadsheet and word processing applications like MS Excel and MS Word. By running a macro, users are able to reduce time consumed by repetitive tasks.
Child Support Services Report No. 2014-08
Page 32 of 43
numbers. Program managers point to the need for more Central Registry staff and more training for Central Registry staff. In addition, several case agents and one North Carolina Child Support Services attorney stated that the North Carolina Central Registry does not screen interstate petitions as carefully as other states.
The CSS State Office confirmed staff cutbacks have affected Central Registry operations. The unit has lost three positions since 2007, and the remaining staff also have absorbed other CSS State Office responsibilities due to other budget reductions. Currently, the Central Registry has 2.5 Child Support Data Processing Assistants who receive and build interstate petitions from other states. The CSS State Office states that its Central Registry staff does not have the capability to thoroughly review each petition due to limited time and a high volume of work. Staff cannot consistently screen petitions for missing information within the 10-day timeframe, so they forward the petitions on to the county programs in order to meet the time requirement. As a result, Central Registry staff is limited to compiling basic information about the case, conducting a standard review of the case, and entering the case into ACTS.
The CSS State Office stated it would need more staff to improve its Central Registry services. According to the CSS State Office, services could be improved if it could upgrade its current Data Processing Assistant positions to Child Support Agent I positions and add 2.5 more Agent I positions, for a total of five Agent I positions. This employee upgrade would cost approximately $160,000 annually.27 With more staff, the North Carolina Central Registry could work with initiating states to get the information necessary to move forward with case actions before referring the cases to the appropriate North Carolina county child support programs. In addition, more staff would allow the Central Registry to conduct additional research and process additional information, such as location and employer verification, prior to forwarding a case to the county. If the Central Registry had more staff with more experience, county program staff could spend less time collecting information for interstate cases and process them more efficiently, which would increase the amount of time case agents would have to process other cases.
Budget reductions have affected centralized services provided by the CSS State Office to support county child support programs. The CSS State Office, located in Raleigh, consists of 67 state employees28 and is responsible for providing oversight of and guidance to the State’s county programs. Since 2006, 62 positions have been eliminated from the CSS State Office. The most severe budget reductions occurred in State Fiscal Year 2010–11, when the General Assembly accepted the Governor’s proposed budget recommendation that state appropriations for the CSS State Office be reduced by $1.3 million. The total budget reduction was $3.8 million when the federal match was included. This budget reduction assumed that the CSS State Office needed fewer staff because the State
27 The current average salary of the two full-time employees building interstate petitions is $27,696. The Program Evaluation Division took this salary and multiplied it by 2.5 positions, which is the current amount of Central Registry positions receiving and building interstate petitions. This current salary total was subtracted from the estimated total cost of five Agent I positions at pay grade 63 with an average salary of $37,867.50 (the middle of the salary range). PED added $40,042 to cover the cost of employee benefits. 28 This position count does not include call center employees located in Martin County.
Child Support Services Report No. 2014-08
Page 33 of 43
was no longer administering child support services for 29 counties and the Eastern Band of Cherokee.
With this budget reduction, 33 positions were eliminated across the CSS State Office, affecting the Central Registry, training services, and the Office’s ability to make necessary system upgrades to ACTS. The CSS State Office also reduced the number of regional representatives and the size of its Customer Service Unit that supports the county programs.
Survey and interview results from county child support programs mentioned that budget and personnel reductions at the CSS State Office have inhibited the services the State can provide to counties. One county program noted that before the budget reductions, the CSS State Office actively assisted agents with actual casework.
The CSS State Office could use a portion of the State’s federal incentive payments to improve its centralized services. Currently, the CSS State Office does not retain any federal incentive money to fund the child support services it provides. Although federal law does not prohibit the CSS State Office from retaining a portion of the incentive money, it has chosen to distribute 100% of the federal incentive payments to county programs. The Program Evaluation Division found two state-supervised and county-administered child support services programs that retain a portion of their federal incentive payments to support statewide operations.
Ohio. State law mandates that county child support programs receive 90% of federal incentive payments and the Ohio state agency overseeing child support services receives the remaining 10% for statewide child support services.
Wisconsin. State law stipulates that county programs receive 100% of federal incentive payments, up to $12.3 million. If the Wisconsin child support services program receives federal incentive payments exceeding $12.3 million, the Wisconsin state agency overseeing the child support programs retains 70% of the excess payment for statewide child support services.
Based on the experience of Ohio and Wisconsin (both of which rank higher than North Carolina in overall performance according to federal measurements), the CSS State Office could choose to or be directed to retain a portion of federal incentive payments to enhance the centralized services it provides to county child support programs.
In summary, county child support managers and case agents reported that improvements are needed to ACTS and the Central Registry. The ability of the CSS State Office to provide centralized child support services has been affected by budget reductions, but it could use a portion of federal incentive payments to make improvements to these centralized services.
Child Support Services Report No. 2014-08
Page 34 of 43
Recommendations Recommendation 1. The General Assembly should promote improved performance of the North Carolina Child Support Services program by directing that 25% of federal incentive payments be retained for centralized child support services and county employee incentive bonuses, revising the methodology for distributing incentive payments to county child support programs, and requiring county programs to report how they are using their incentive funds to improve program performance.
As reported in Findings 2 and 3, the Program Evaluation Division found that the methodology used by the North Carolina Child Support Services State Office to distribute federal incentive payments does not promote improved county program performance. The incentive payments awarded to county programs are not connected to the incentive goals the CSS State Office develops for county child support programs, so county child support programs receive a share of the federal incentive payments even if their performance declines or remains stagnant. The CSS State Office also cannot ensure federal incentive payments are being used to improve county child support programs because it has not established specific spending guidelines and does not track incentive payment expenditures. As reported in Finding 4, the Program Evaluation Division found that the CSS State Office could help improve the performance of county child support programs by enhancing the centralized child support services it provides to all county programs.
To ensure that federal incentive payments promote improved performance by county child support programs, the General Assembly should revise the methodology for distributing federal incentive payments to county child support programs. Instead of distributing 100% of the payments to county child support programs based on the five federal performance measures, the General Assembly should direct the CSS State Office to divide the federal incentive payment pool into three parts and distribute it as follows:
Centralized Services. The CSS State Office should retain 15% of annual federal incentive payments to enhance centralized child support services that would benefit county child support programs. The CSS State Office, in consultation with representatives from county child support programs, should identify how funding from federal incentive payments could improve the centralized services provided by the CSS State Office. For example, the CSS State Office could use federal incentive payments to increase Central Registry staffing, upgrade the Automated Collections and Tracking System (ACTS), or purchase tools for data analytics. If the CSS State Office had retained 15% of the $14.4 million federal incentive payment awarded to North Carolina for Federal Fiscal Year 2012, $2.2 million would have been available to enhance centralized services. These incentive funds should be used to improve the effectiveness of the State’s centralized child support services by supplementing and not supplanting State expenditures for these services.
Employee Incentive Bonuses. The CSS State Office should reserve 10% of federal incentive payments for annual incentive bonuses, up
Child Support Services Report No. 2014-08
Page 35 of 43
to $1,000 per child support employee, based on meeting the five incentive goals set by the CSS State Office. Establishing a direct relationship between incentive goals and incentive payments allows the CSS State Office to reward the employees of county child support programs that meet or exceed their incentive goals. If the CSS State Office had reserved 10% of the $14.4 million federal incentive payment awarded to North Carolina for Federal Fiscal Year 2012, $1.4 million would have been available for child support employee incentive bonuses.
County child support programs should receive incentive bonus funding after the CSS State Office verifies that the county programs met annual incentive goals set by the State and data reliability standards set by the federal government. The annual incentive bonuses should not become part of annual employee compensation and should be paid to county child support employees regardless of the management model used by the county to provide child support services, including the employees of private child support vendors. The General Assembly should direct the CSS State Office, in consultation with representatives of the county child support programs, to promulgate administrative rules describing the policies and procedures for calculating and issuing the annual incentive bonus funding to county child support programs. Any incentive bonus funding that is not awarded because counties fail to meet incentive goals should be authorized for use by the CSS State Office for enhancing centralized child support services.
After the employee incentive bonus program has been in place for three years, the CSS State Office should be directed to evaluate and report on the effectiveness of the bonuses in encouraging county child support programs to meet incentive goals and improve program performance.
County Child Support Programs. The CSS State Office should allocate 75% of federal incentive payments to county child support programs for improving effectiveness and efficiency using the five federal performance measures. If the CSS State Office had allocated 75% of the $14.4 million federal incentive payment awarded to North Carolina for Federal Fiscal Year 2012, $10.8 million would have been available to improve the effectiveness and efficiency of county child support programs. As reported in Finding 2, the CSS State Office calculates incentive payments for county programs using the federal methodology, which disproportionately relies on child support collections and does not consider other factors that may affect county performance. The General Assembly should direct the CSS State Office, in consultation with representatives from county child support programs, to examine the current methodology for distributing this portion of the federal incentive payment and determine whether an alternative formula would be appropriate. The CSS State should continue to utilize the current formula for distributing federal incentive payments until an alternative formula is finalized.
Child Support Services Report No. 2014-08
Page 36 of 43
The General Assembly should direct the CSS State Office to require county child support programs to provide documentation that incentive payments are being reinvested into their programs and being used to improve program effectiveness and efficiency. The CSS State Office should establish guidelines identifying appropriate uses for federal incentive payments. In order to receive federal incentive payments, county child support programs should be required to submit an annual plan describing how the program would use federal incentive funding to improve program effectiveness and efficiency. Before receiving future allocations of federal incentive payments, county child support programs also should be annually required to report how the payments improved their program, document that the funds were spent according to their plan, and explain any deviations from the plan.
To eliminate confusion and increase transparency for county child support programs, the General Assembly should direct the CSS State Office to promulgate administrative rules explaining the State process for calculating and distributing incentive bonuses and federal incentive payments to county programs. The General Assembly also should require the CSS State Office to submit an annual report to the Joint Legislative Oversight Committee on Health and Human Services and the Fiscal Research Division describing how federal incentive funds
enhanced centralized child support services to benefit county child support programs;
provided incentive bonuses rewarding county child support programs meeting incentive goals; and
improved the effectiveness and efficiency of county child support programs.
The annual report also should describe any changes to the State process for calculating and distributing federal incentive payments to county child support programs and include any recommendations for further changes.
Recommendation 2. Effective with State Fiscal Year 2015–16, the General Assembly should require counties to maintain county expenditures for child support services that are not less than the average level of such expenditures for the two previous state fiscal years.
The federal maintenance of effort (MOE) for county child support programs was implemented so child support programs would not use incentive payments to supplant child support expenditures. However, as reported in Finding 3, the Program Evaluation Division found that the federal MOE is based on child support expenditures that occurred 16 years ago. Counties can use incentive payments to limit county expenditures for child support services and still meet their MOE requirement. If incentive payments are not required to be used to improve the effectiveness of county child support programs, county programs do not have a financial motivation to improve program performance.
To ensure that counties reinvest federal incentive payments into improving the effectiveness and efficiency of their child support services programs,
Child Support Services Report No. 2014-08
Page 37 of 43
the General Assembly should establish a state MOE that requires counties to maintain county expenditures for child support services that are not less than the average level of such expenditures for the two previous state fiscal years. The Division of Social Services should estimate the state MOE for child support services when making the determination of state and county financial participation as required annually by N.C. Gen. Stat. § 108A-88. If a county fails to comply with the state MOE, that county would be ineligible to receive federal incentive payments during the following state fiscal year. To avoid penalizing counties with extreme economic hardship, the General Assembly should authorize the Child Support Services Program to waive the MOE requirement if the local board of county commissioners can demonstrate that reductions in county expenditures for child support services were caused by economic factors beyond its control. The effective date for the revised child support services MOE should begin in State Fiscal Year 2015–16 to give local boards of county commissioners appropriate notice of the change.
Appendices Appendix A: State Fiscal Year 2012–13 Performance Data for County
Child Support Programs (Alphabetical Order)
Appendix B: State Fiscal Year 2012–13 Performance Data for County Child Support Programs (Rank Order)
Appendix C: State Fiscal Year 2012–13 Program Data for County Child Support Programs
Agency Response A draft of this report was submitted to the Department of Health and
Human Services to review and respond. Its response is provided following the appendices.
Program Evaluation Division Contact and Acknowledgments
For more information on this report, please contact the lead evaluator, Jim Horne, at [email protected].
Staff members who made key contributions to this report include Meg Kunde, Sara Nienow, and Carol Shaw. John W. Turcotte is the director of the Program Evaluation Division.
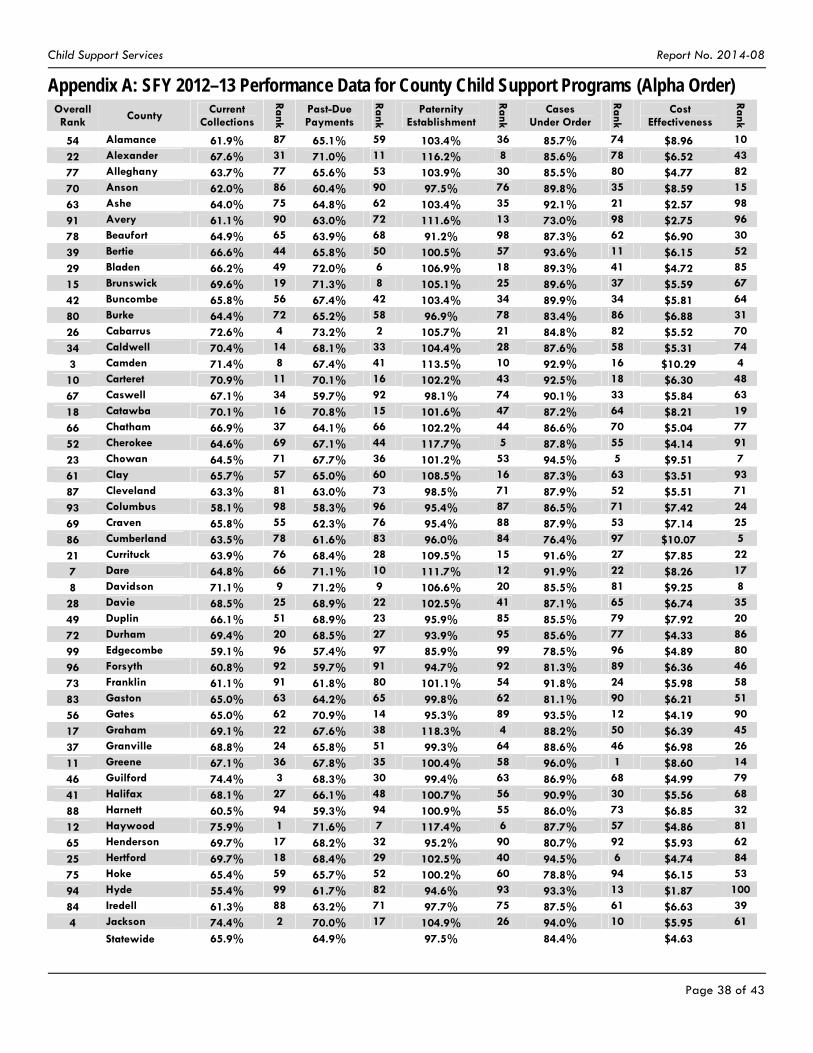
Child Support Services Report No. 2014-08
Page 38 of 43
Appendix A: SFY 2012–13 Performance Data for County Child Support Programs (Alpha Order) Overall Rank County
Current Collections
Rank
Past-Due Payments
Rank
Paternity Establishment
Rank
Cases Under Order
Rank
Cost Effectiveness
Rank
54 Alamance 61.9% 87 65.1% 59 103.4% 36 85.7% 74 $8.96 10
22 Alexander 67.6% 31 71.0% 11 116.2% 8 85.6% 78 $6.52 43
77 Alleghany 63.7% 77 65.6% 53 103.9% 30 85.5% 80 $4.77 82
70 Anson 62.0% 86 60.4% 90 97.5% 76 89.8% 35 $8.59 15
63 Ashe 64.0% 75 64.8% 62 103.4% 35 92.1% 21 $2.57 98
91 Avery 61.1% 90 63.0% 72 111.6% 13 73.0% 98 $2.75 96
78 Beaufort 64.9% 65 63.9% 68 91.2% 98 87.3% 62 $6.90 30
39 Bertie 66.6% 44 65.8% 50 100.5% 57 93.6% 11 $6.15 52
29 Bladen 66.2% 49 72.0% 6 106.9% 18 89.3% 41 $4.72 85
15 Brunswick 69.6% 19 71.3% 8 105.1% 25 89.6% 37 $5.59 67
42 Buncombe 65.8% 56 67.4% 42 103.4% 34 89.9% 34 $5.81 64
80 Burke 64.4% 72 65.2% 58 96.9% 78 83.4% 86 $6.88 31
26 Cabarrus 72.6% 4 73.2% 2 105.7% 21 84.8% 82 $5.52 70
34 Caldwell 70.4% 14 68.1% 33 104.4% 28 87.6% 58 $5.31 74
3 Camden 71.4% 8 67.4% 41 113.5% 10 92.9% 16 $10.29 4
10 Carteret 70.9% 11 70.1% 16 102.2% 43 92.5% 18 $6.30 48
67 Caswell 67.1% 34 59.7% 92 98.1% 74 90.1% 33 $5.84 63
18 Catawba 70.1% 16 70.8% 15 101.6% 47 87.2% 64 $8.21 19
66 Chatham 66.9% 37 64.1% 66 102.2% 44 86.6% 70 $5.04 77
52 Cherokee 64.6% 69 67.1% 44 117.7% 5 87.8% 55 $4.14 91
23 Chowan 64.5% 71 67.7% 36 101.2% 53 94.5% 5 $9.51 7
61 Clay 65.7% 57 65.0% 60 108.5% 16 87.3% 63 $3.51 93
87 Cleveland 63.3% 81 63.0% 73 98.5% 71 87.9% 52 $5.51 71
93 Columbus 58.1% 98 58.3% 96 95.4% 87 86.5% 71 $7.42 24
69 Craven 65.8% 55 62.3% 76 95.4% 88 87.9% 53 $7.14 25
86 Cumberland 63.5% 78 61.6% 83 96.0% 84 76.4% 97 $10.07 5
21 Currituck 63.9% 76 68.4% 28 109.5% 15 91.6% 27 $7.85 22
7 Dare 64.8% 66 71.1% 10 111.7% 12 91.9% 22 $8.26 17
8 Davidson 71.1% 9 71.2% 9 106.6% 20 85.5% 81 $9.25 8
28 Davie 68.5% 25 68.9% 22 102.5% 41 87.1% 65 $6.74 35
49 Duplin 66.1% 51 68.9% 23 95.9% 85 85.5% 79 $7.92 20
72 Durham 69.4% 20 68.5% 27 93.9% 95 85.6% 77 $4.33 86
99 Edgecombe 59.1% 96 57.4% 97 85.9% 99 78.5% 96 $4.89 80
96 Forsyth 60.8% 92 59.7% 91 94.7% 92 81.3% 89 $6.36 46
73 Franklin 61.1% 91 61.8% 80 101.1% 54 91.8% 24 $5.98 58
83 Gaston 65.0% 63 64.2% 65 99.8% 62 81.1% 90 $6.21 51
56 Gates 65.0% 62 70.9% 14 95.3% 89 93.5% 12 $4.19 90
17 Graham 69.1% 22 67.6% 38 118.3% 4 88.2% 50 $6.39 45
37 Granville 68.8% 24 65.8% 51 99.3% 64 88.6% 46 $6.98 26
11 Greene 67.1% 36 67.8% 35 100.4% 58 96.0% 1 $8.60 14
46 Guilford 74.4% 3 68.3% 30 99.4% 63 86.9% 68 $4.99 79
41 Halifax 68.1% 27 66.1% 48 100.7% 56 90.9% 30 $5.56 68
88 Harnett 60.5% 94 59.3% 94 100.9% 55 86.0% 73 $6.85 32
12 Haywood 75.9% 1 71.6% 7 117.4% 6 87.7% 57 $4.86 81
65 Henderson 69.7% 17 68.2% 32 95.2% 90 80.7% 92 $5.93 62
25 Hertford 69.7% 18 68.4% 29 102.5% 40 94.5% 6 $4.74 84
75 Hoke 65.4% 59 65.7% 52 100.2% 60 78.8% 94 $6.15 53
94 Hyde 55.4% 99 61.7% 82 94.6% 93 93.3% 13 $1.87 100
84 Iredell 61.3% 88 63.2% 71 97.7% 75 87.5% 61 $6.63 39
4 Jackson 74.4% 2 70.0% 17 104.9% 26 94.0% 10 $5.95 61
Statewide 65.9% 64.9% 97.5% 84.4% $4.63
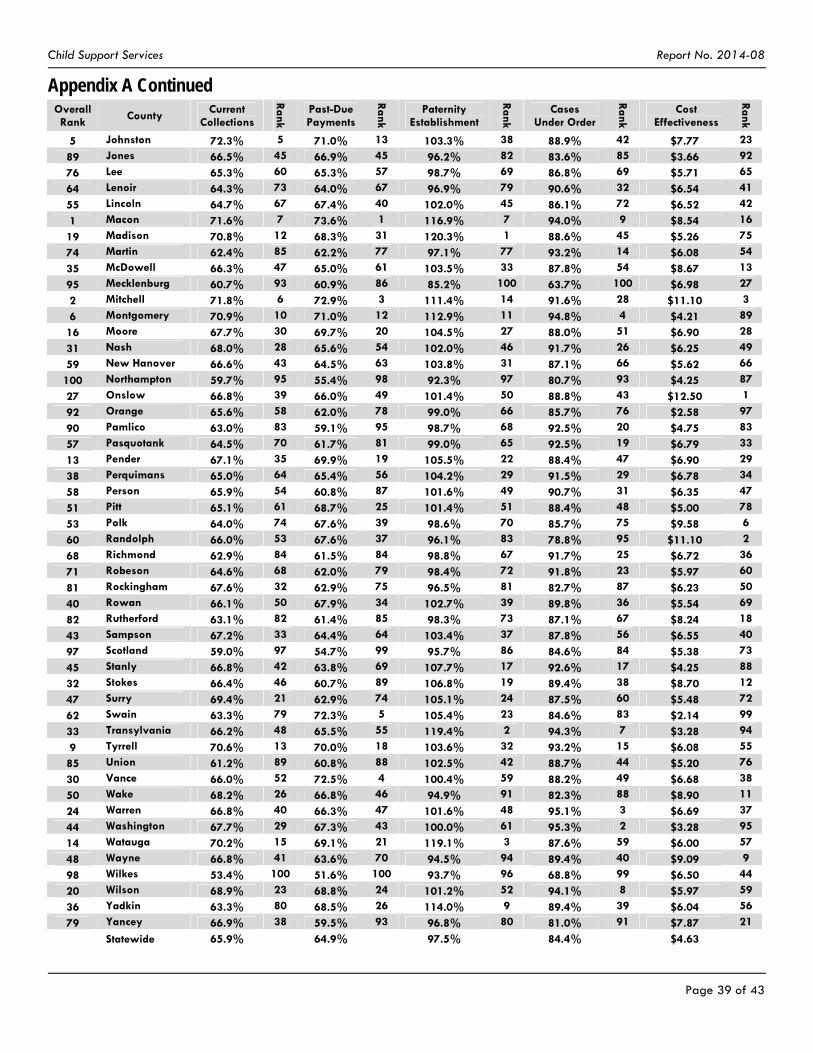
Child Support Services Report No. 2014-08
Page 39 of 43
Appendix A Continued Overall Rank
County Current
Collections
Rank
Past-Due Payments
Rank
Paternity Establishment
Rank
Cases Under Order
Rank
Cost Effectiveness
Rank
5 Johnston 72.3% 5 71.0% 13 103.3% 38 88.9% 42 $7.77 23
89 Jones 66.5% 45 66.9% 45 96.2% 82 83.6% 85 $3.66 92
76 Lee 65.3% 60 65.3% 57 98.7% 69 86.8% 69 $5.71 65
64 Lenoir 64.3% 73 64.0% 67 96.9% 79 90.6% 32 $6.54 41
55 Lincoln 64.7% 67 67.4% 40 102.0% 45 86.1% 72 $6.52 42
1 Macon 71.6% 7 73.6% 1 116.9% 7 94.0% 9 $8.54 16
19 Madison 70.8% 12 68.3% 31 120.3% 1 88.6% 45 $5.26 75
74 Martin 62.4% 85 62.2% 77 97.1% 77 93.2% 14 $6.08 54
35 McDowell 66.3% 47 65.0% 61 103.5% 33 87.8% 54 $8.67 13
95 Mecklenburg 60.7% 93 60.9% 86 85.2% 100 63.7% 100 $6.98 27
2 Mitchell 71.8% 6 72.9% 3 111.4% 14 91.6% 28 $11.10 3
6 Montgomery 70.9% 10 71.0% 12 112.9% 11 94.8% 4 $4.21 89
16 Moore 67.7% 30 69.7% 20 104.5% 27 88.0% 51 $6.90 28
31 Nash 68.0% 28 65.6% 54 102.0% 46 91.7% 26 $6.25 49
59 New Hanover 66.6% 43 64.5% 63 103.8% 31 87.1% 66 $5.62 66
100 Northampton 59.7% 95 55.4% 98 92.3% 97 80.7% 93 $4.25 87
27 Onslow 66.8% 39 66.0% 49 101.4% 50 88.8% 43 $12.50 1
92 Orange 65.6% 58 62.0% 78 99.0% 66 85.7% 76 $2.58 97
90 Pamlico 63.0% 83 59.1% 95 98.7% 68 92.5% 20 $4.75 83
57 Pasquotank 64.5% 70 61.7% 81 99.0% 65 92.5% 19 $6.79 33
13 Pender 67.1% 35 69.9% 19 105.5% 22 88.4% 47 $6.90 29
38 Perquimans 65.0% 64 65.4% 56 104.2% 29 91.5% 29 $6.78 34
58 Person 65.9% 54 60.8% 87 101.6% 49 90.7% 31 $6.35 47
51 Pitt 65.1% 61 68.7% 25 101.4% 51 88.4% 48 $5.00 78
53 Polk 64.0% 74 67.6% 39 98.6% 70 85.7% 75 $9.58 6
60 Randolph 66.0% 53 67.6% 37 96.1% 83 78.8% 95 $11.10 2
68 Richmond 62.9% 84 61.5% 84 98.8% 67 91.7% 25 $6.72 36
71 Robeson 64.6% 68 62.0% 79 98.4% 72 91.8% 23 $5.97 60
81 Rockingham 67.6% 32 62.9% 75 96.5% 81 82.7% 87 $6.23 50
40 Rowan 66.1% 50 67.9% 34 102.7% 39 89.8% 36 $5.54 69
82 Rutherford 63.1% 82 61.4% 85 98.3% 73 87.1% 67 $8.24 18
43 Sampson 67.2% 33 64.4% 64 103.4% 37 87.8% 56 $6.55 40
97 Scotland 59.0% 97 54.7% 99 95.7% 86 84.6% 84 $5.38 73
45 Stanly 66.8% 42 63.8% 69 107.7% 17 92.6% 17 $4.25 88
32 Stokes 66.4% 46 60.7% 89 106.8% 19 89.4% 38 $8.70 12
47 Surry 69.4% 21 62.9% 74 105.1% 24 87.5% 60 $5.48 72
62 Swain 63.3% 79 72.3% 5 105.4% 23 84.6% 83 $2.14 99
33 Transylvania 66.2% 48 65.5% 55 119.4% 2 94.3% 7 $3.28 94
9 Tyrrell 70.6% 13 70.0% 18 103.6% 32 93.2% 15 $6.08 55
85 Union 61.2% 89 60.8% 88 102.5% 42 88.7% 44 $5.20 76
30 Vance 66.0% 52 72.5% 4 100.4% 59 88.2% 49 $6.68 38
50 Wake 68.2% 26 66.8% 46 94.9% 91 82.3% 88 $8.90 11
24 Warren 66.8% 40 66.3% 47 101.6% 48 95.1% 3 $6.69 37
44 Washington 67.7% 29 67.3% 43 100.0% 61 95.3% 2 $3.28 95
14 Watauga 70.2% 15 69.1% 21 119.1% 3 87.6% 59 $6.00 57
48 Wayne 66.8% 41 63.6% 70 94.5% 94 89.4% 40 $9.09 9
98 Wilkes 53.4% 100 51.6% 100 93.7% 96 68.8% 99 $6.50 44
20 Wilson 68.9% 23 68.8% 24 101.2% 52 94.1% 8 $5.97 59
36 Yadkin 63.3% 80 68.5% 26 114.0% 9 89.4% 39 $6.04 56
79 Yancey 66.9% 38 59.5% 93 96.8% 80 81.0% 91 $7.87 21
Statewide 65.9% 64.9% 97.5% 84.4% $4.63
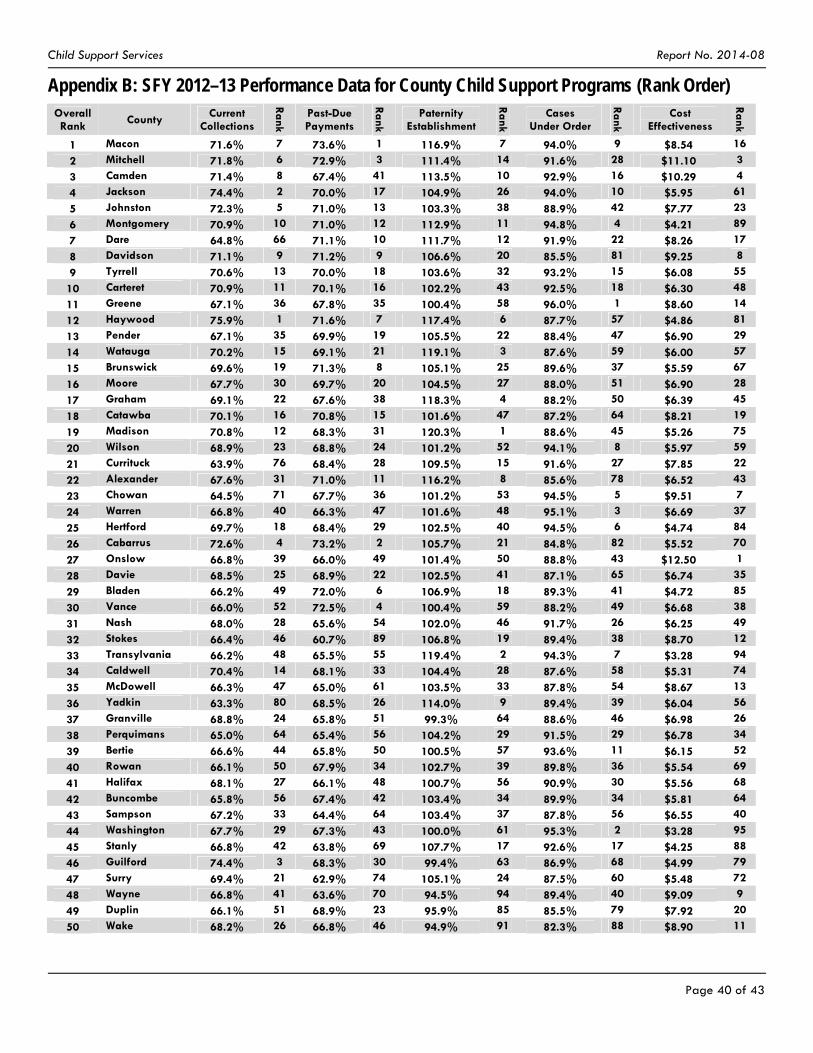
Child Support Services Report No. 2014-08
Page 40 of 43
Appendix B: SFY 2012–13 Performance Data for County Child Support Programs (Rank Order) Overall Rank
County Current
Collections
Rank
Past-Due Payments
Rank
Paternity Establishment
Rank
Cases Under Order
Rank
Cost Effectiveness
Rank
1 Macon 71.6% 7 73.6% 1 116.9% 7 94.0% 9 $8.54 16
2 Mitchell 71.8% 6 72.9% 3 111.4% 14 91.6% 28 $11.10 3
3 Camden 71.4% 8 67.4% 41 113.5% 10 92.9% 16 $10.29 4
4 Jackson 74.4% 2 70.0% 17 104.9% 26 94.0% 10 $5.95 61
5 Johnston 72.3% 5 71.0% 13 103.3% 38 88.9% 42 $7.77 23
6 Montgomery 70.9% 10 71.0% 12 112.9% 11 94.8% 4 $4.21 89
7 Dare 64.8% 66 71.1% 10 111.7% 12 91.9% 22 $8.26 17
8 Davidson 71.1% 9 71.2% 9 106.6% 20 85.5% 81 $9.25 8
9 Tyrrell 70.6% 13 70.0% 18 103.6% 32 93.2% 15 $6.08 55
10 Carteret 70.9% 11 70.1% 16 102.2% 43 92.5% 18 $6.30 48
11 Greene 67.1% 36 67.8% 35 100.4% 58 96.0% 1 $8.60 14
12 Haywood 75.9% 1 71.6% 7 117.4% 6 87.7% 57 $4.86 81
13 Pender 67.1% 35 69.9% 19 105.5% 22 88.4% 47 $6.90 29
14 Watauga 70.2% 15 69.1% 21 119.1% 3 87.6% 59 $6.00 57
15 Brunswick 69.6% 19 71.3% 8 105.1% 25 89.6% 37 $5.59 67
16 Moore 67.7% 30 69.7% 20 104.5% 27 88.0% 51 $6.90 28
17 Graham 69.1% 22 67.6% 38 118.3% 4 88.2% 50 $6.39 45
18 Catawba 70.1% 16 70.8% 15 101.6% 47 87.2% 64 $8.21 19
19 Madison 70.8% 12 68.3% 31 120.3% 1 88.6% 45 $5.26 75
20 Wilson 68.9% 23 68.8% 24 101.2% 52 94.1% 8 $5.97 59
21 Currituck 63.9% 76 68.4% 28 109.5% 15 91.6% 27 $7.85 22
22 Alexander 67.6% 31 71.0% 11 116.2% 8 85.6% 78 $6.52 43
23 Chowan 64.5% 71 67.7% 36 101.2% 53 94.5% 5 $9.51 7
24 Warren 66.8% 40 66.3% 47 101.6% 48 95.1% 3 $6.69 37
25 Hertford 69.7% 18 68.4% 29 102.5% 40 94.5% 6 $4.74 84
26 Cabarrus 72.6% 4 73.2% 2 105.7% 21 84.8% 82 $5.52 70
27 Onslow 66.8% 39 66.0% 49 101.4% 50 88.8% 43 $12.50 1
28 Davie 68.5% 25 68.9% 22 102.5% 41 87.1% 65 $6.74 35
29 Bladen 66.2% 49 72.0% 6 106.9% 18 89.3% 41 $4.72 85
30 Vance 66.0% 52 72.5% 4 100.4% 59 88.2% 49 $6.68 38
31 Nash 68.0% 28 65.6% 54 102.0% 46 91.7% 26 $6.25 49
32 Stokes 66.4% 46 60.7% 89 106.8% 19 89.4% 38 $8.70 12
33 Transylvania 66.2% 48 65.5% 55 119.4% 2 94.3% 7 $3.28 94
34 Caldwell 70.4% 14 68.1% 33 104.4% 28 87.6% 58 $5.31 74
35 McDowell 66.3% 47 65.0% 61 103.5% 33 87.8% 54 $8.67 13
36 Yadkin 63.3% 80 68.5% 26 114.0% 9 89.4% 39 $6.04 56
37 Granville 68.8% 24 65.8% 51 99.3% 64 88.6% 46 $6.98 26
38 Perquimans 65.0% 64 65.4% 56 104.2% 29 91.5% 29 $6.78 34
39 Bertie 66.6% 44 65.8% 50 100.5% 57 93.6% 11 $6.15 52
40 Rowan 66.1% 50 67.9% 34 102.7% 39 89.8% 36 $5.54 69
41 Halifax 68.1% 27 66.1% 48 100.7% 56 90.9% 30 $5.56 68
42 Buncombe 65.8% 56 67.4% 42 103.4% 34 89.9% 34 $5.81 64
43 Sampson 67.2% 33 64.4% 64 103.4% 37 87.8% 56 $6.55 40
44 Washington 67.7% 29 67.3% 43 100.0% 61 95.3% 2 $3.28 95
45 Stanly 66.8% 42 63.8% 69 107.7% 17 92.6% 17 $4.25 88
46 Guilford 74.4% 3 68.3% 30 99.4% 63 86.9% 68 $4.99 79
47 Surry 69.4% 21 62.9% 74 105.1% 24 87.5% 60 $5.48 72
48 Wayne 66.8% 41 63.6% 70 94.5% 94 89.4% 40 $9.09 9
49 Duplin 66.1% 51 68.9% 23 95.9% 85 85.5% 79 $7.92 20
50 Wake 68.2% 26 66.8% 46 94.9% 91 82.3% 88 $8.90 11
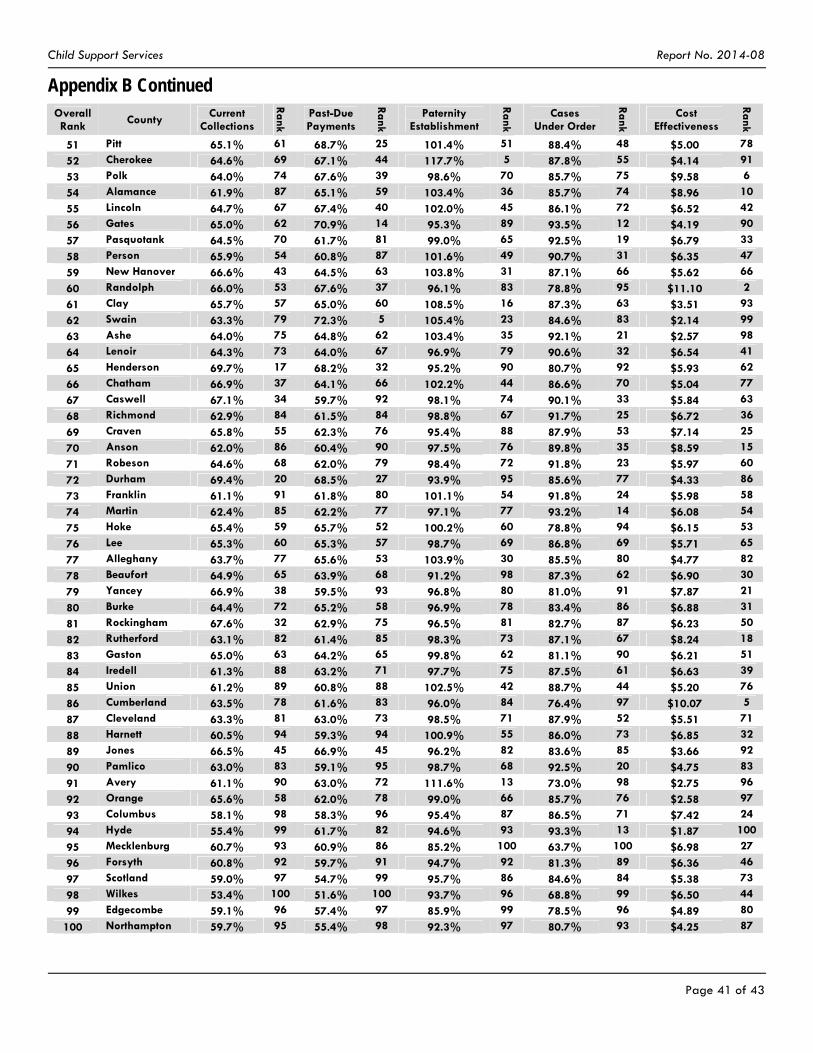
Child Support Services Report No. 2014-08
Page 41 of 43
Appendix B Continued Overall Rank
County Current
Collections
Rank
Past-Due Payments
Rank
Paternity Establishment
Rank
Cases Under Order
Rank
Cost Effectiveness
Rank
51 Pitt 65.1% 61 68.7% 25 101.4% 51 88.4% 48 $5.00 78
52 Cherokee 64.6% 69 67.1% 44 117.7% 5 87.8% 55 $4.14 91
53 Polk 64.0% 74 67.6% 39 98.6% 70 85.7% 75 $9.58 6
54 Alamance 61.9% 87 65.1% 59 103.4% 36 85.7% 74 $8.96 10
55 Lincoln 64.7% 67 67.4% 40 102.0% 45 86.1% 72 $6.52 42
56 Gates 65.0% 62 70.9% 14 95.3% 89 93.5% 12 $4.19 90
57 Pasquotank 64.5% 70 61.7% 81 99.0% 65 92.5% 19 $6.79 33
58 Person 65.9% 54 60.8% 87 101.6% 49 90.7% 31 $6.35 47
59 New Hanover 66.6% 43 64.5% 63 103.8% 31 87.1% 66 $5.62 66
60 Randolph 66.0% 53 67.6% 37 96.1% 83 78.8% 95 $11.10 2
61 Clay 65.7% 57 65.0% 60 108.5% 16 87.3% 63 $3.51 93
62 Swain 63.3% 79 72.3% 5 105.4% 23 84.6% 83 $2.14 99
63 Ashe 64.0% 75 64.8% 62 103.4% 35 92.1% 21 $2.57 98
64 Lenoir 64.3% 73 64.0% 67 96.9% 79 90.6% 32 $6.54 41
65 Henderson 69.7% 17 68.2% 32 95.2% 90 80.7% 92 $5.93 62
66 Chatham 66.9% 37 64.1% 66 102.2% 44 86.6% 70 $5.04 77
67 Caswell 67.1% 34 59.7% 92 98.1% 74 90.1% 33 $5.84 63
68 Richmond 62.9% 84 61.5% 84 98.8% 67 91.7% 25 $6.72 36
69 Craven 65.8% 55 62.3% 76 95.4% 88 87.9% 53 $7.14 25
70 Anson 62.0% 86 60.4% 90 97.5% 76 89.8% 35 $8.59 15
71 Robeson 64.6% 68 62.0% 79 98.4% 72 91.8% 23 $5.97 60
72 Durham 69.4% 20 68.5% 27 93.9% 95 85.6% 77 $4.33 86
73 Franklin 61.1% 91 61.8% 80 101.1% 54 91.8% 24 $5.98 58
74 Martin 62.4% 85 62.2% 77 97.1% 77 93.2% 14 $6.08 54
75 Hoke 65.4% 59 65.7% 52 100.2% 60 78.8% 94 $6.15 53
76 Lee 65.3% 60 65.3% 57 98.7% 69 86.8% 69 $5.71 65
77 Alleghany 63.7% 77 65.6% 53 103.9% 30 85.5% 80 $4.77 82
78 Beaufort 64.9% 65 63.9% 68 91.2% 98 87.3% 62 $6.90 30
79 Yancey 66.9% 38 59.5% 93 96.8% 80 81.0% 91 $7.87 21
80 Burke 64.4% 72 65.2% 58 96.9% 78 83.4% 86 $6.88 31
81 Rockingham 67.6% 32 62.9% 75 96.5% 81 82.7% 87 $6.23 50
82 Rutherford 63.1% 82 61.4% 85 98.3% 73 87.1% 67 $8.24 18
83 Gaston 65.0% 63 64.2% 65 99.8% 62 81.1% 90 $6.21 51
84 Iredell 61.3% 88 63.2% 71 97.7% 75 87.5% 61 $6.63 39
85 Union 61.2% 89 60.8% 88 102.5% 42 88.7% 44 $5.20 76
86 Cumberland 63.5% 78 61.6% 83 96.0% 84 76.4% 97 $10.07 5
87 Cleveland 63.3% 81 63.0% 73 98.5% 71 87.9% 52 $5.51 71
88 Harnett 60.5% 94 59.3% 94 100.9% 55 86.0% 73 $6.85 32
89 Jones 66.5% 45 66.9% 45 96.2% 82 83.6% 85 $3.66 92
90 Pamlico 63.0% 83 59.1% 95 98.7% 68 92.5% 20 $4.75 83
91 Avery 61.1% 90 63.0% 72 111.6% 13 73.0% 98 $2.75 96
92 Orange 65.6% 58 62.0% 78 99.0% 66 85.7% 76 $2.58 97
93 Columbus 58.1% 98 58.3% 96 95.4% 87 86.5% 71 $7.42 24
94 Hyde 55.4% 99 61.7% 82 94.6% 93 93.3% 13 $1.87 100
95 Mecklenburg 60.7% 93 60.9% 86 85.2% 100 63.7% 100 $6.98 27
96 Forsyth 60.8% 92 59.7% 91 94.7% 92 81.3% 89 $6.36 46
97 Scotland 59.0% 97 54.7% 99 95.7% 86 84.6% 84 $5.38 73
98 Wilkes 53.4% 100 51.6% 100 93.7% 96 68.8% 99 $6.50 44
99 Edgecombe 59.1% 96 57.4% 97 85.9% 99 78.5% 96 $4.89 80
100 Northampton 59.7% 95 55.4% 98 92.3% 97 80.7% 93 $4.25 87
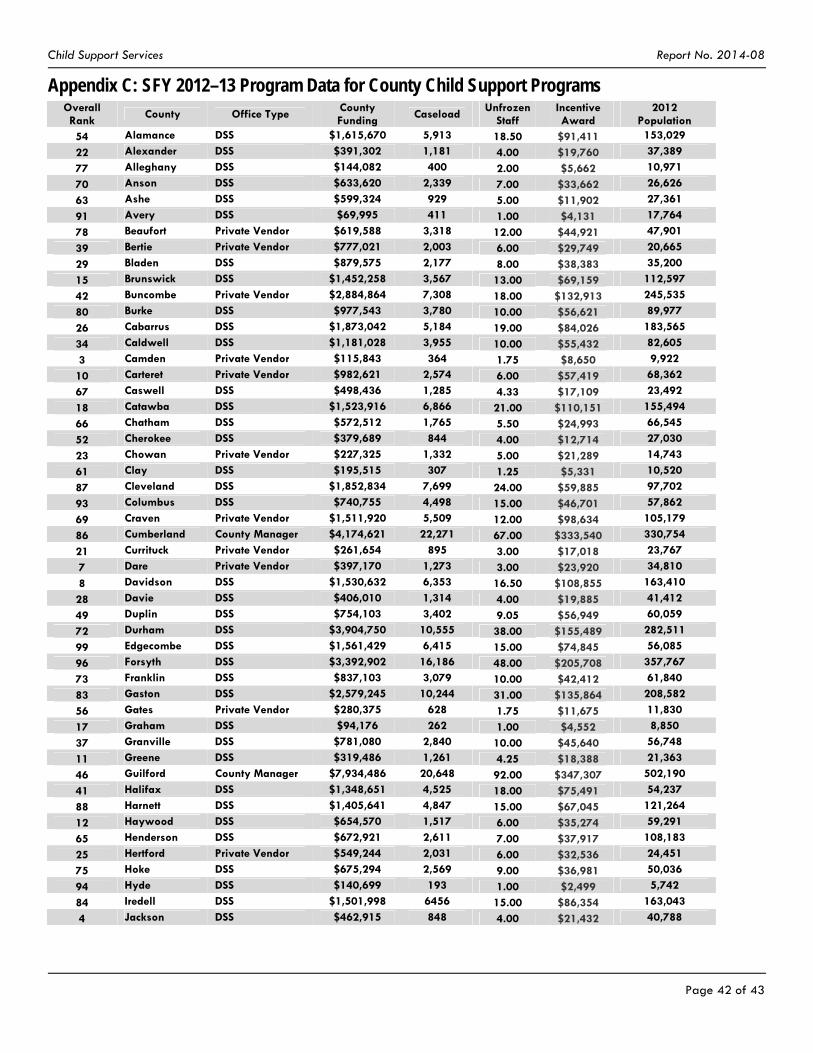
Child Support Services Report No. 2014-08
Page 42 of 43
Appendix C: SFY 2012–13 Program Data for County Child Support Programs Overall Rank
County Office Type County Funding
Caseload Unfrozen
Staff Incentive Award
2012 Population
54 Alamance DSS $1,615,670 5,913 18.50 $91,411 153,029
22 Alexander DSS $391,302 1,181 4.00 $19,760 37,389
77 Alleghany DSS $144,082 400 2.00 $5,662 10,971
70 Anson DSS $633,620 2,339 7.00 $33,662 26,626
63 Ashe DSS $599,324 929 5.00 $11,902 27,361
91 Avery DSS $69,995 411 1.00 $4,131 17,764
78 Beaufort Private Vendor $619,588 3,318 12.00 $44,921 47,901
39 Bertie Private Vendor $777,021 2,003 6.00 $29,749 20,665
29 Bladen DSS $879,575 2,177 8.00 $38,383 35,200
15 Brunswick DSS $1,452,258 3,567 13.00 $69,159 112,597
42 Buncombe Private Vendor $2,884,864 7,308 18.00 $132,913 245,535
80 Burke DSS $977,543 3,780 10.00 $56,621 89,977
26 Cabarrus DSS $1,873,042 5,184 19.00 $84,026 183,565
34 Caldwell DSS $1,181,028 3,955 10.00 $55,432 82,605
3 Camden Private Vendor $115,843 364 1.75 $8,650 9,922
10 Carteret Private Vendor $982,621 2,574 6.00 $57,419 68,362
67 Caswell DSS $498,436 1,285 4.33 $17,109 23,492
18 Catawba DSS $1,523,916 6,866 21.00 $110,151 155,494
66 Chatham DSS $572,512 1,765 5.50 $24,993 66,545
52 Cherokee DSS $379,689 844 4.00 $12,714 27,030
23 Chowan Private Vendor $227,325 1,332 5.00 $21,289 14,743
61 Clay DSS $195,515 307 1.25 $5,331 10,520
87 Cleveland DSS $1,852,834 7,699 24.00 $59,885 97,702
93 Columbus DSS $740,755 4,498 15.00 $46,701 57,862
69 Craven Private Vendor $1,511,920 5,509 12.00 $98,634 105,179
86 Cumberland County Manager $4,174,621 22,271 67.00 $333,540 330,754
21 Currituck Private Vendor $261,654 895 3.00 $17,018 23,767
7 Dare Private Vendor $397,170 1,273 3.00 $23,920 34,810
8 Davidson DSS $1,530,632 6,353 16.50 $108,855 163,410
28 Davie DSS $406,010 1,314 4.00 $19,885 41,412
49 Duplin DSS $754,103 3,402 9.05 $56,949 60,059
72 Durham DSS $3,904,750 10,555 38.00 $155,489 282,511
99 Edgecombe DSS $1,561,429 6,415 15.00 $74,845 56,085
96 Forsyth DSS $3,392,902 16,186 48.00 $205,708 357,767
73 Franklin DSS $837,103 3,079 10.00 $42,412 61,840
83 Gaston DSS $2,579,245 10,244 31.00 $135,864 208,582
56 Gates Private Vendor $280,375 628 1.75 $11,675 11,830
17 Graham DSS $94,176 262 1.00 $4,552 8,850
37 Granville DSS $781,080 2,840 10.00 $45,640 56,748
11 Greene DSS $319,486 1,261 4.25 $18,388 21,363
46 Guilford County Manager $7,934,486 20,648 92.00 $347,307 502,190
41 Halifax DSS $1,348,651 4,525 18.00 $75,491 54,237
88 Harnett DSS $1,405,641 4,847 15.00 $67,045 121,264
12 Haywood DSS $654,570 1,517 6.00 $35,274 59,291
65 Henderson DSS $672,921 2,611 7.00 $37,917 108,183
25 Hertford Private Vendor $549,244 2,031 6.00 $32,536 24,451
75 Hoke DSS $675,294 2,569 9.00 $36,981 50,036
94 Hyde DSS $140,699 193 1.00 $2,499 5,742
84 Iredell DSS $1,501,998 6456 15.00 $86,354 163,043
4 Jackson DSS $462,915 848 4.00 $21,432 40,788
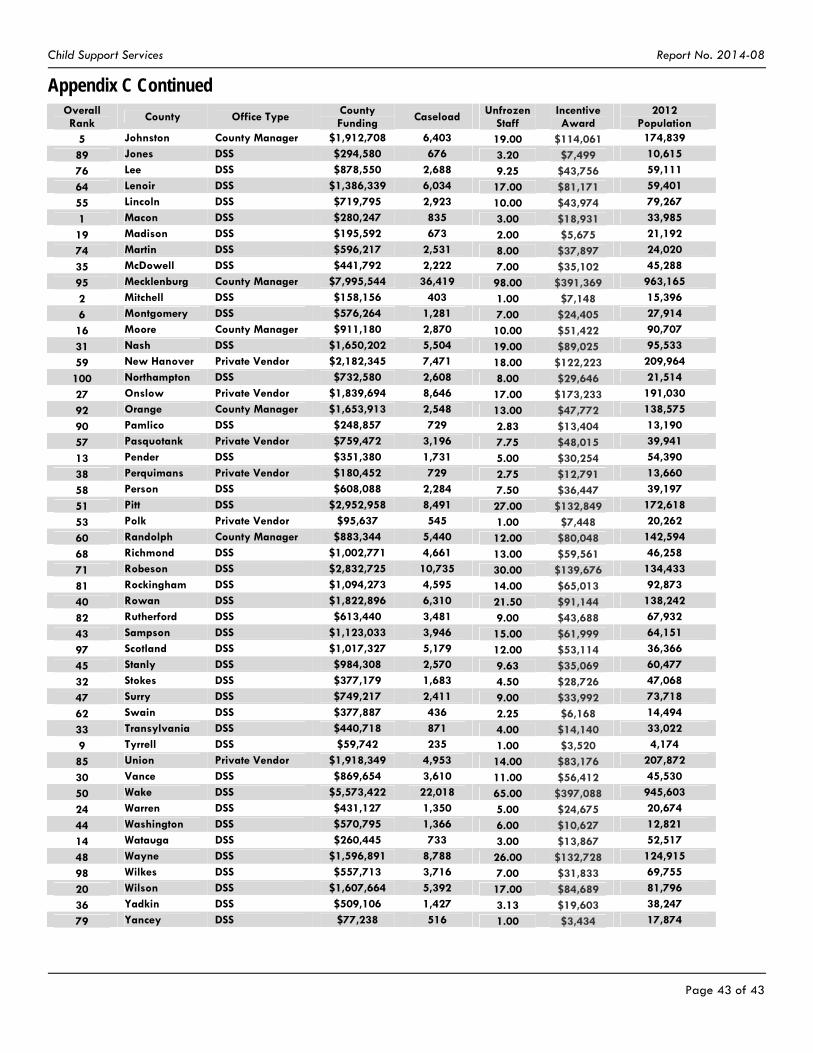
Child Support Services Report No. 2014-08
Page 43 of 43
Appendix C Continued Overall Rank
County Office Type County Funding
Caseload Unfrozen Staff
Incentive Award
2012 Population
5 Johnston County Manager $1,912,708 6,403 19.00 $114,061 174,839
89 Jones DSS $294,580 676 3.20 $7,499 10,615
76 Lee DSS $878,550 2,688 9.25 $43,756 59,111
64 Lenoir DSS $1,386,339 6,034 17.00 $81,171 59,401
55 Lincoln DSS $719,795 2,923 10.00 $43,974 79,267
1 Macon DSS $280,247 835 3.00 $18,931 33,985
19 Madison DSS $195,592 673 2.00 $5,675 21,192
74 Martin DSS $596,217 2,531 8.00 $37,897 24,020
35 McDowell DSS $441,792 2,222 7.00 $35,102 45,288
95 Mecklenburg County Manager $7,995,544 36,419 98.00 $391,369 963,165
2 Mitchell DSS $158,156 403 1.00 $7,148 15,396
6 Montgomery DSS $576,264 1,281 7.00 $24,405 27,914
16 Moore County Manager $911,180 2,870 10.00 $51,422 90,707
31 Nash DSS $1,650,202 5,504 19.00 $89,025 95,533
59 New Hanover Private Vendor $2,182,345 7,471 18.00 $122,223 209,964
100 Northampton DSS $732,580 2,608 8.00 $29,646 21,514
27 Onslow Private Vendor $1,839,694 8,646 17.00 $173,233 191,030
92 Orange County Manager $1,653,913 2,548 13.00 $47,772 138,575
90 Pamlico DSS $248,857 729 2.83 $13,404 13,190
57 Pasquotank Private Vendor $759,472 3,196 7.75 $48,015 39,941
13 Pender DSS $351,380 1,731 5.00 $30,254 54,390
38 Perquimans Private Vendor $180,452 729 2.75 $12,791 13,660
58 Person DSS $608,088 2,284 7.50 $36,447 39,197
51 Pitt DSS $2,952,958 8,491 27.00 $132,849 172,618
53 Polk Private Vendor $95,637 545 1.00 $7,448 20,262
60 Randolph County Manager $883,344 5,440 12.00 $80,048 142,594
68 Richmond DSS $1,002,771 4,661 13.00 $59,561 46,258
71 Robeson DSS $2,832,725 10,735 30.00 $139,676 134,433
81 Rockingham DSS $1,094,273 4,595 14.00 $65,013 92,873
40 Rowan DSS $1,822,896 6,310 21.50 $91,144 138,242
82 Rutherford DSS $613,440 3,481 9.00 $43,688 67,932
43 Sampson DSS $1,123,033 3,946 15.00 $61,999 64,151
97 Scotland DSS $1,017,327 5,179 12.00 $53,114 36,366
45 Stanly DSS $984,308 2,570 9.63 $35,069 60,477
32 Stokes DSS $377,179 1,683 4.50 $28,726 47,068
47 Surry DSS $749,217 2,411 9.00 $33,992 73,718
62 Swain DSS $377,887 436 2.25 $6,168 14,494
33 Transylvania DSS $440,718 871 4.00 $14,140 33,022
9 Tyrrell DSS $59,742 235 1.00 $3,520 4,174
85 Union Private Vendor $1,918,349 4,953 14.00 $83,176 207,872
30 Vance DSS $869,654 3,610 11.00 $56,412 45,530
50 Wake DSS $5,573,422 22,018 65.00 $397,088 945,603
24 Warren DSS $431,127 1,350 5.00 $24,675 20,674
44 Washington DSS $570,795 1,366 6.00 $10,627 12,821
14 Watauga DSS $260,445 733 3.00 $13,867 52,517
48 Wayne DSS $1,596,891 8,788 26.00 $132,728 124,915
98 Wilkes DSS $557,713 3,716 7.00 $31,833 69,755
20 Wilson DSS $1,607,664 5,392 17.00 $84,689 81,796
36 Yadkin DSS $509,106 1,427 3.13 $19,603 38,247
79 Yancey DSS $77,238 516 1.00 $3,434 17,874