Embed Size (px)
Citation preview
Government of the People’s Republic of Bangladesh Ministry of Communications
Roads and Highways Department
Third Road Rehabilitation and Maintenance Project Institutional Development Component
RHD ROAD USER COST ANNUAL REPORT
For 1999-2000
Economics Circle December 1999
Economics Circle RHD RHD Road User Cost Institutional Development Component Annual Report for FY 1999/2000
December 1999 Page 1 of 37
LIST OF CONTENTS
1 INTRODUCTION
1.1 Background 1.2 Financial and Economic Costs 1.3 Structure of this Report
2 THE BANGLADESH VEHICLE FLEET
2.1 Vehicles Registered 2.2 Representative Vehicles 2.3 Characteristics of Representative Vehicles
3 VEHICLE OPERATING COSTS
3.1 Introduction 3.2 Utilisation 3.3 Vehicle Purchase Costs 3.4 Consumable Costs 3.5 Vehicle Maintenance Policies and Costs 3.6 Crew and Overhead Costs 3.7 Unit Vehicle Operating Costs
4 TRAVEL TIME COSTS
4.1 Introduction 4.2 Previous Work 4.3 Methodology 4.4 Summary of Survey Results 4.5 Unit Travel Time Costs
5 ACCIDENT COSTS
5.1 Introduction 5.2 Estimating the Number of Road Traffic Accidents 5.3 Valuing Road Traffic Accident Cost Components 5.4 Total Road Accident Cost Estimates 5.5 Conclusions and Recommendations
APPENDIX A UNIT VEHICLE OPERATING COSTS

Economics Circle RHD RHD Road User Cost Institutional Development Component Annual Report for FY 1999/2000
December 1999 Page 2 of 37
1 INTRODUCTION 1.1 Background Road user costs (RUC) consist of three components: • Vehicle operating costs (VOC), that is, the physical costs of operating a vehicle such as
fuel, spare parts, crew costs, maintenance costs, depreciation, etc; • Travel time costs (TTC), that is, the value of time spent in travelling that could be used in
other activities; • Accident costs (AC), that is, the physical costs of an accident and the value of injuries and
fatalities. The importance of controlling road user costs is evident just when it is considered that the Bangladesh transport sector consumes some 1.4 million tonnes of petroleum products annually. And this is only one component of vehicle operating costs, which include among others vehicle capital and maintenance costs, all of which are a severe drain on scarce foreign exchange. Bangladesh is developing a process of allocating to its highway network maintenance and development budgets according to an economic appraisal system HDM as well as RBEMS (Road and Bridge Economic Modelling System) aimed at minimising costs to road users. This system is now under a functional stage of development in Roads and Highways Department (RHD). The Institutional Development Component (IDC) Project funded by the Dpartment for International Development (DFID, UK) has been helping build this system since 1994 and is continuing to provide support over the next 3-4 years. A vital part of this system is to provide an accurate and up-to-date estimate of Road User Costs. The Economics Circle of the Network Management Wing under RHD undertakes this task. This is the second annual road user cost report published by the Economics Circle. It contains new vehicle operating and travel time costs updated on the basis of data collected through conducting field surveys of road users, transport owners/operators, garages and transport businesses. The accident costs have not been changed from last years report pending a major research project by the Transport Research Laboratory of the United Kingdom in Bangladesh, though surveys were undertaken in 1999 to collect necessary data for this purpose. Every vehicle on the road, whether it is motorised or non-motorised, incurs road user costs. The analysis systems used to date have concentrated on quantifying motorised RUC, and this report only considers motorised vehicles. However, a considerable effort has been made to develop RUC for non-motorised vehicles in Bangladesh under an IDC sponsored research project. These values may be available in 2000 and will hopefully be included in the next annual RUC report. This will tie in with the release of the World Bank’s up-dated economic appraisal model, HDM-4, which includes provision for the modelling of non-motorised vehicle costs. The new RHD road maintenance planning management system is being constructed around HDM-4. 1.2 Financial and Economic Costs All costs in the report are given in financial and economic prices. The financial price is the retail market price to the consumer of the product. The economic price reflects the true value (that is, the real worth) as well as the scarcity value of the resource to the economy. In the

Economics Circle RHD RHD Road User Cost Institutional Development Component Annual Report for FY 1999/2000
December 1999 Page 3 of 37
economic jargon, this is temed as a “shadow” or "accounting" price of the resources in the economy. The shadow price of an unskilled labour, for instance, may well be lower than the wage to reflect its abundant supply, while that of a skilled professional may be higher than the salary given to him, if his opportunity cost is considered.The economic price of a factor or a product also excludes all taxation elements as they reflect mostly a transfer of resources from one sector of the economy to another. On the other hand, subsidy element if any is included with the economic price . In case of imported inputs, economic costs were based on the border prices plus port handling, transport, assembly and retail costs (profit margin) duly shadow-priced. Local inputs of labour and materials were shadow-priced using the RHD Standard Conversion Factor of 0.8 (see Economics Working Paper E9 for details on shadow pricing.) 1.3 Structure of This Report The report starts by examining the current composition of the Bangladesh vehicle fleet in Section 2 as this data is common to all the components of road user costs. These three components such as vehicle operating costs, travel time costs and accident costs are then described in turn in Sections 3, 4 and 5. A more detailed account of the work on each component is contained in the following IDC Economics Working Papers: • E6 Vehicle Operating Costs • E7 Travel Time Costs • E8 Accident Costs
Appendix A contains detailed tables of unit VOC.
Economics Circle RHD RHD Road User Cost Institutional Development Component Annual Report for FY 1999/2000
December 1999 Page 4 of 37
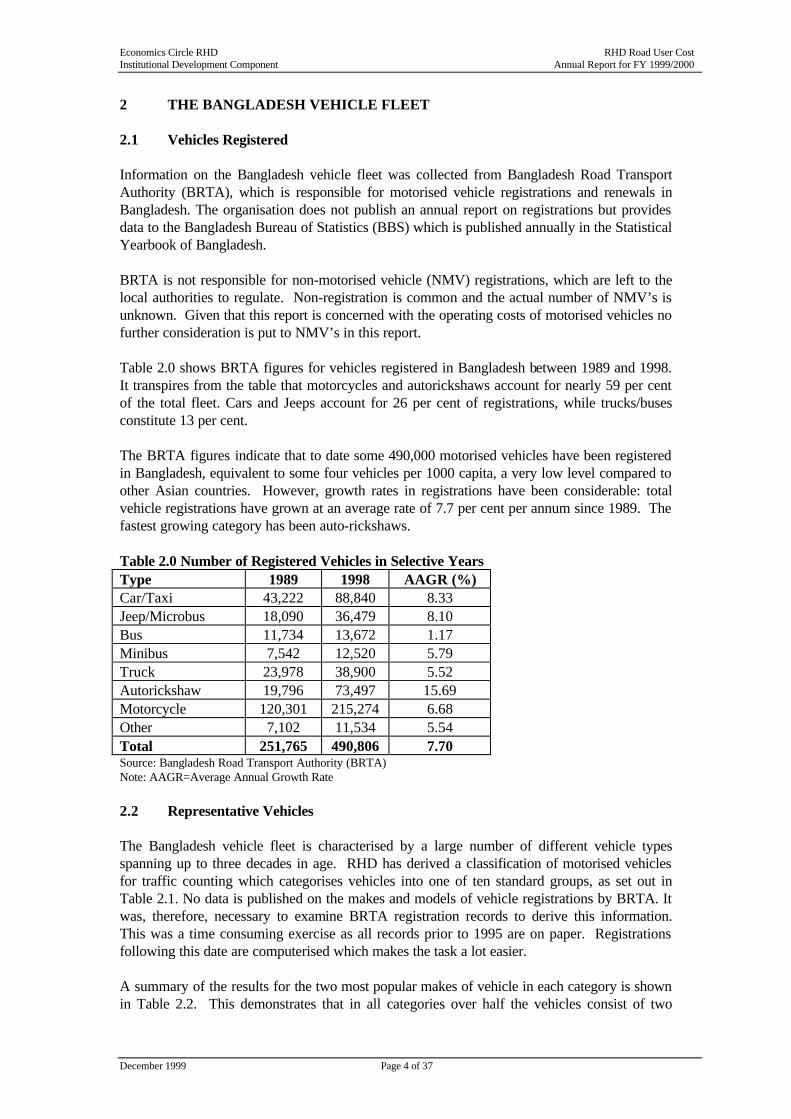
2 THE BANGLADESH VEHICLE FLEET 2.1 Vehicles Registered Information on the Bangladesh vehicle fleet was collected from Bangladesh Road Transport Authority (BRTA), which is responsible for motorised vehicle registrations and renewals in Bangladesh. The organisation does not publish an annual report on registrations but provides data to the Bangladesh Bureau of Statistics (BBS) which is published annually in the Statistical Yearbook of Bangladesh. BRTA is not responsible for non-motorised vehicle (NMV) registrations, which are left to the local authorities to regulate. Non-registration is common and the actual number of NMV’s is unknown. Given that this report is concerned with the operating costs of motorised vehicles no further consideration is put to NMV’s in this report. Table 2.0 shows BRTA figures for vehicles registered in Bangladesh between 1989 and 1998. It transpires from the table that motorcycles and autorickshaws account for nearly 59 per cent of the total fleet. Cars and Jeeps account for 26 per cent of registrations, while trucks/buses constitute 13 per cent. The BRTA figures indicate that to date some 490,000 motorised vehicles have been registered in Bangladesh, equivalent to some four vehicles per 1000 capita, a very low level compared to other Asian countries. However, growth rates in registrations have been considerable: total vehicle registrations have grown at an average rate of 7.7 per cent per annum since 1989. The fastest growing category has been auto-rickshaws. Table 2.0 Number of Registered Vehicles in Selective Years Type 1989 1998 AAGR (%) Car/Taxi 43,222 88,840 8.33 Jeep/Microbus 18,090 36,479 8.10 Bus 11,734 13,672 1.17 Minibus 7,542 12,520 5.79 Truck 23,978 38,900 5.52 Autorickshaw 19,796 73,497 15.69 Motorcycle 120,301 215,274 6.68 Other 7,102 11,534 5.54 Total 251,765 490,806 7.70 Source: Bangladesh Road Transport Authority (BRTA) Note: AAGR=Average Annual Growth Rate 2.2 Representative Vehicles The Bangladesh vehicle fleet is characterised by a large number of different vehicle types spanning up to three decades in age. RHD has derived a classification of motorised vehicles for traffic counting which categorises vehicles into one of ten standard groups, as set out in Table 2.1. No data is published on the makes and models of vehicle registrations by BRTA. It was, therefore, necessary to examine BRTA registration records to derive this information. This was a time consuming exercise as all records prior to 1995 are on paper. Registrations following this date are computerised which makes the task a lot easier. A summary of the results for the two most popular makes of vehicle in each category is shown in Table 2.2. This demonstrates that in all categories over half the vehicles consist of two
Economics Circle RHD RHD Road User Cost Institutional Development Component Annual Report for FY 1999/2000
December 1999 Page 5 of 37
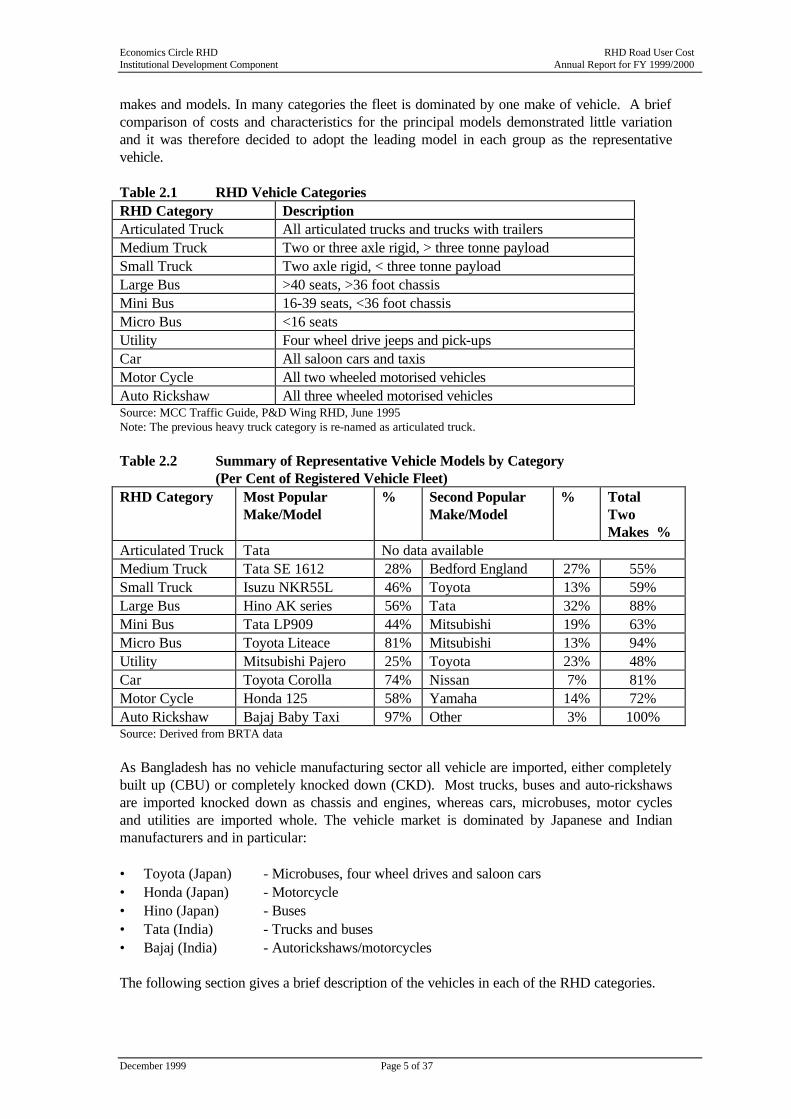
makes and models. In many categories the fleet is dominated by one make of vehicle. A brief comparison of costs and characteristics for the principal models demonstrated little variation and it was therefore decided to adopt the leading model in each group as the representative vehicle. Table 2.1 RHD Vehicle Categories RHD Category Description Articulated Truck All articulated trucks and trucks with trailers Medium Truck Two or three axle rigid, > three tonne payload Small Truck Two axle rigid, < three tonne payload Large Bus >40 seats, >36 foot chassis Mini Bus 16-39 seats, <36 foot chassis Micro Bus <16 seats Utility Four wheel drive jeeps and pick-ups Car All saloon cars and taxis Motor Cycle All two wheeled motorised vehicles Auto Rickshaw All three wheeled motorised vehicles Source: MCC Traffic Guide, P&D Wing RHD, June 1995 Note: The previous heavy truck category is re-named as articulated truck. Table 2.2 Summary of Representative Vehicle Models by Category
(Per Cent of Registered Vehicle Fleet) RHD Category Most Popular
Make/Model % Second Popular
Make/Model % Total
Two Makes %
Articulated Truck Tata No data available Medium Truck Tata SE 1612 28% Bedford England 27% 55% Small Truck Isuzu NKR55L 46% Toyota 13% 59% Large Bus Hino AK series 56% Tata 32% 88% Mini Bus Tata LP909 44% Mitsubishi 19% 63% Micro Bus Toyota Liteace 81% Mitsubishi 13% 94% Utility Mitsubishi Pajero 25% Toyota 23% 48% Car Toyota Corolla 74% Nissan 7% 81% Motor Cycle Honda 125 58% Yamaha 14% 72% Auto Rickshaw Bajaj Baby Taxi 97% Other 3% 100% Source: Derived from BRTA data As Bangladesh has no vehicle manufacturing sector all vehicle are imported, either completely built up (CBU) or completely knocked down (CKD). Most trucks, buses and auto-rickshaws are imported knocked down as chassis and engines, whereas cars, microbuses, motor cycles and utilities are imported whole. The vehicle market is dominated by Japanese and Indian manufacturers and in particular: • Toyota (Japan) - Microbuses, four wheel drives and saloon cars • Honda (Japan) - Motorcycle • Hino (Japan) - Buses • Tata (India) - Trucks and buses • Bajaj (India) - Autorickshaws/motorcycles The following section gives a brief description of the vehicles in each of the RHD categories.
Economics Circle RHD RHD Road User Cost Institutional Development Component Annual Report for FY 1999/2000
December 1999 Page 6 of 37
Articulated Truck (previously called heavy truck) It was not possible to identify the number of articulated trucks from BRTA records, which define Articulated Trucks as those carrying more than 7 tonnes of cargo, which includes the RHD articulated and medium categories. Of those multi-axle trucks that could be identified the majority were Tata tractor units and trailers. As there are still very few multi-axle vehicles in Bangladesh, articulated trucks are not considered further in this report. However, it is intended to include them in next years report as the number is expected to increase in the future. Medium Truck The medium truck market is dominated by three makes: Bedford England, Bedford Hindustan and Tata, which account for some 75 per cent of the market. However, the number of Bedford’s has been declining in recent years and the Tata is becoming increasingly popular. During 1994-95 truck imports were dominated by Tata who’s most popular model is the 15.6 tonne GVW SE1612. Small Truck It is evident that the small truck market is increasing in importance. Previous studies have not identified this as an important category but the 1995/1996 traffic census identified significant volumes on the RHD road network. This increase is symptomatic of the development of the economy and commercial liberalisation. At present the small truck market is dominated by second hand vehicles, and most especially converted ex-military Willy’s Jeeps and old model Toyota Land Cruisers which have had a locally made flat bed added. It is not possible to identify the proportions of these vehicles from the BRTA registration statistics, which only show the number of new registrations. However, new vehicles are been imported, mostly from Japan, and Isuzu, Toyota and Mitsubishi dominate this small but growing market. The Isuzu NKR55L was selected as the representative model. Large Bus Large buses can be divided into luxury (Air Conditioned and Chair Class) and ordinary categories. Hino of Japan and Tata of India dominate the large bus market, with some 90 per cent of the total market share. Of these the Hino AK series is by far the most popular and is expected to increase its market share with the introduction of more luxury air conditioned inter-urban services as the road network improves. The chair class bus was selected as the representative vehicle for modelling. Minibus The major brands of minibus are Isuzu, Mitsubishi, Hindustan, Tata, Nissan, Toyota and Eicher. The Japanese makes were popular till the last half of the 1980’s but the Indian makes have been steadily increasing their share and now the Tata LP909 is dominating new purchases. For the last three years its share of the total market was over 70%. Micro Bus
Economics Circle RHD RHD Road User Cost Institutional Development Component Annual Report for FY 1999/2000
December 1999 Page 7 of 37
Microbuses are usually privately owned and do not operate as public transport. Toyota dominates this category with its Hiace and Liteace models and has an 81% share of the market. The Mitsubishi L300 accounts for most of the remainder. Car Toyota also dominates the car fleet with 74% of the market. Most imports now consist of the highly popular Corolla Sedan 5 door saloon which comes in several variants. A mid range variant (1300 GL) was chosen for the representative model. Some cars are imported as re-conditioned second hand vehicles. Utility (4WD) The utility vehicle market is dominated by Japanese luxury four wheel drive models, usually referred to as Jeeps. The Mitsubishi Pajero and the Toyota Land Cruiser account for over half this market. The utility category also includes pick ups, but as these only account for a small proportion of the utility market and are not considered for separate modelling. A mid-range Pajero (2400 CC) was chosen for modelling. In 1999 a joint venture between Mitsubishi and Progati Industries Ltd, Bangladesh started to import Pajero’s knocked down and manufacture bodywork locally. The cost of these vehicles is significantly less than the completely built up versions. The proportion of these vehicles in the market will be monitored and future costs adjusted if they achieve a significant market share. Auto-Rickshaw The auto-rickshaw market is divided into three categories which are defined by their respective manufacturers: Mishuk (Atlas), Babytaxi (Bajaj), Tempo (Vespa). In addition auto-vans are built on various chassis. The Mishuk is a locally developed three wheeled vehicle based on a motor cycle engine, manufactured in Bangladesh by Atlas Ltd., part of the Bangladesh Steel and Engineering Corporation. However, only a small number were constructed and the market is now dominated by the Bajaj Babytaxi. The usually Vespa based Tempo is a larger passenger carrying vehicle (up to 15) which has a small but growing share of the auto rickshaw market. Motor Cycle Honda dominates the motor cycle market with 58 per cent of the fleet, most of which are 125cc variants. Yamaha, Bajaj and Suzuki account for 14 per cent, 6 per cent and 4 per cent of the remaining market respectively.

Economics Circle RHD RHD Road User Cost Institutional Development Component Annual Report for FY 1999/2000
December 1999 Page 8 of 37
2.3 Characteristics of Representative Vehicles Table 2.3 sets out the physical characteristics of the representative vehicle types identified in the previous section. Table 2.3A Vehicle Characteristics -Engine and Tyres Category Make Imported
as Fuel CC Cylinders Metric HP No.
Tyres Type of Tyres
Medium Truck Tata SE 1612/42 CKD Diesel 5675 6 120 6 10.00x20-16PR Small Truck Isuzu NKR55L CKD Diesel 2771 4 72 4 7.50x20-12PR Large Bus Hino AK3HMKA CKD Diesel 6443 6 195 6 9.00x20-14PR Mini Bus Tata LP909/36 CKD Diesel 4788 6 112 6 7.50x20-12PR Micro Bus Toyota Liteace CBU Petrol 1800 4 79 4 5.50x13-8PRLT Utility (Jeep) Mitsubishi Pajero CBU/CKD Petrol 2400 4 132 4 205 - R16 Car Toyota Corolla
Sedan 1300GL CBU Petrol 1300 4 110 4 155 - SR13
Auto Rick Bajaj Baby Taxi CKD Petrol/ 5%Oil
145 1 5.52 3 4.0x8-6PR
Motor Cycle Honda CG125 CBU/CKD Petrol 125 1 11 2 Front 2.5 - 4PR Rear 3.0 -4PR
Table 2.3B Vehicle Characteristics -Weights and Dimensions Category Make Axles
No. TARE Kg
GVW kg
Length mm
Width mm
Height mm
Medium Truck Tata SE 1612/42 2 4,015 15,660 6,970 2,434 3,625 Small Truck Isuzu NKR55L 2 2,750 5,200 6,025 1,880 2,220 Large Bus Hino AK3HMKA 2 4,145 12,500 10,005 2,430 1,995 Mini Bus Tata LP909/36 2 3,300 9,000 5,970 2,159 1,900 Micro Bus Toyota Liteace 2 1,180 2,150 4,453 1,695 1,870 Utility (Jeep) Mitsubishi Pajero 2 1,930 2,800 4,645 1,695 1,865 Car Toyota Corolla
Sedan 1300GL 2 998 1,510 4,270 1,685 1,380
Auto Rick Bajaj Baby Taxi 1 200 580 1,900 745 1,020 Motor Cycle Honda CG125 - 96 a 1900 745 1020 Source: Vehicle dealers' in Dhaka Notes: a - no manufacturers data TARE = unloaded weight GVW = gross vehicle weight CKD = completely knocked down CBU = completely built unit
Economics Circle RHD RHD Road User Cost Institutional Development Component Annual Report for FY 1999/2000
December 1999 Page 9 of 37
3 VEHICLE OPERATING COSTS (VOC) 3.1 Introduction The prediction of VOC’s is a complex procedure as costs are needed for the entire Bangladesh vehicle fleet, which consists of a plethora of vehicle types, and the variation of these costs under different operating conditions must also be understood. These operating conditions are normally categorised as: • Horizontal curvature; • Vertical curvature; • Road Surface Condition; • Traffic Congestion. Given that the economic prioritisation of maintenance management is based on the World Bank’s HDM programme, it follows that all other analyses should be conducted using the HDM parameters. This task is facilitated by the fact that the World Bank has produced a stand-alone version of the VOC sub model, the VOCM model, which is currently in its fourth version (VOCM4). This model will predict VOC’s per km for a number of vehicle groups as a function of the physical characteristics of a road (structural number, geometry, surface type and current pavement condition) as specified by the model. Traffic congestion effects are not currently included in VOCM4 and are not modelled in this report. It was intended to use the HDM-4 model, with its increased number of VOC relationships, in this second road user cost report but it was not fully released at the time of publication. Following its release the new relationships will be tested and calibrated for Bangladesh and the results published either in an interim report or next year's annual report. This model, and the procedure set out in the World Bank Technical Paper 234 on Vehicle Operating Costs, were adopted for the derivation of the Bangladesh VOC’s as follows: 1. Divide the vehicle fleet into groups of similar vehicles (Section 2.2); 2. Identify representative vehicle types for each group (Section 2.3); 3. Establish unit costs and characteristics of representative vehicles (Sections 3.2-3.6); 4. Compute average operating speed for each vehicle group (Section 3.7); 5. Compute amounts of resources used per vehicle kilometre by each group for each of
the following components (Section 3.7): a. Fuel b. Tyres c. Maintenance parts d. Maintenance labour e. Lubricants f. Crew g. Depreciation h. Interest I. Overhead 6. Apply unit costs to the resource consumption amounts to obtain cost per vehicle kilometre for each vehicle group (Section 3.8).
Economics Circle RHD RHD Road User Cost Institutional Development Component Annual Report for FY 1999/2000
December 1999 Page 10 of 37
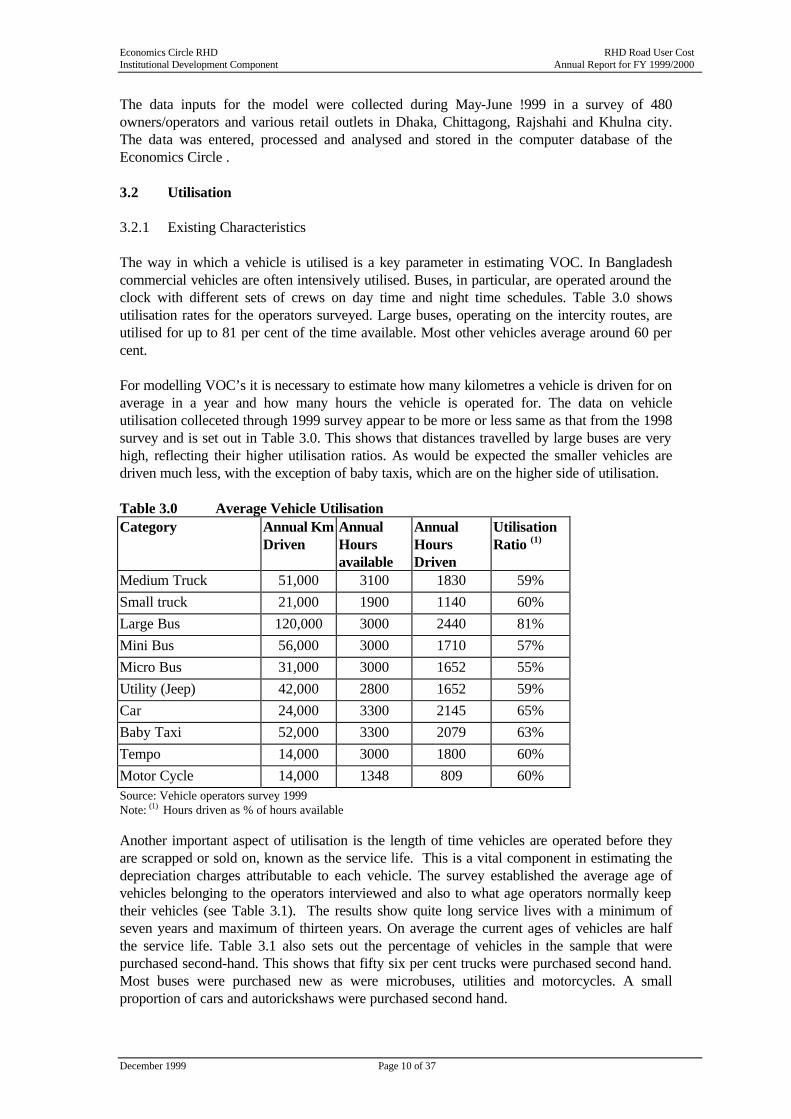
The data inputs for the model were collected during May-June !999 in a survey of 480 owners/operators and various retail outlets in Dhaka, Chittagong, Rajshahi and Khulna city. The data was entered, processed and analysed and stored in the computer database of the Economics Circle . 3.2 Utilisation 3.2.1 Existing Characteristics The way in which a vehicle is utilised is a key parameter in estimating VOC. In Bangladesh commercial vehicles are often intensively utilised. Buses, in particular, are operated around the clock with different sets of crews on day time and night time schedules. Table 3.0 shows utilisation rates for the operators surveyed. Large buses, operating on the intercity routes, are utilised for up to 81 per cent of the time available. Most other vehicles average around 60 per cent. For modelling VOC’s it is necessary to estimate how many kilometres a vehicle is driven for on average in a year and how many hours the vehicle is operated for. The data on vehicle utilisation colleceted through 1999 survey appear to be more or less same as that from the 1998 survey and is set out in Table 3.0. This shows that distances travelled by large buses are very high, reflecting their higher utilisation ratios. As would be expected the smaller vehicles are driven much less, with the exception of baby taxis, which are on the higher side of utilisation. Table 3.0 Average Vehicle Utilisation Category Annual Km
Driven Annual Hours available
Annual Hours Driven
Utilisation Ratio (1)
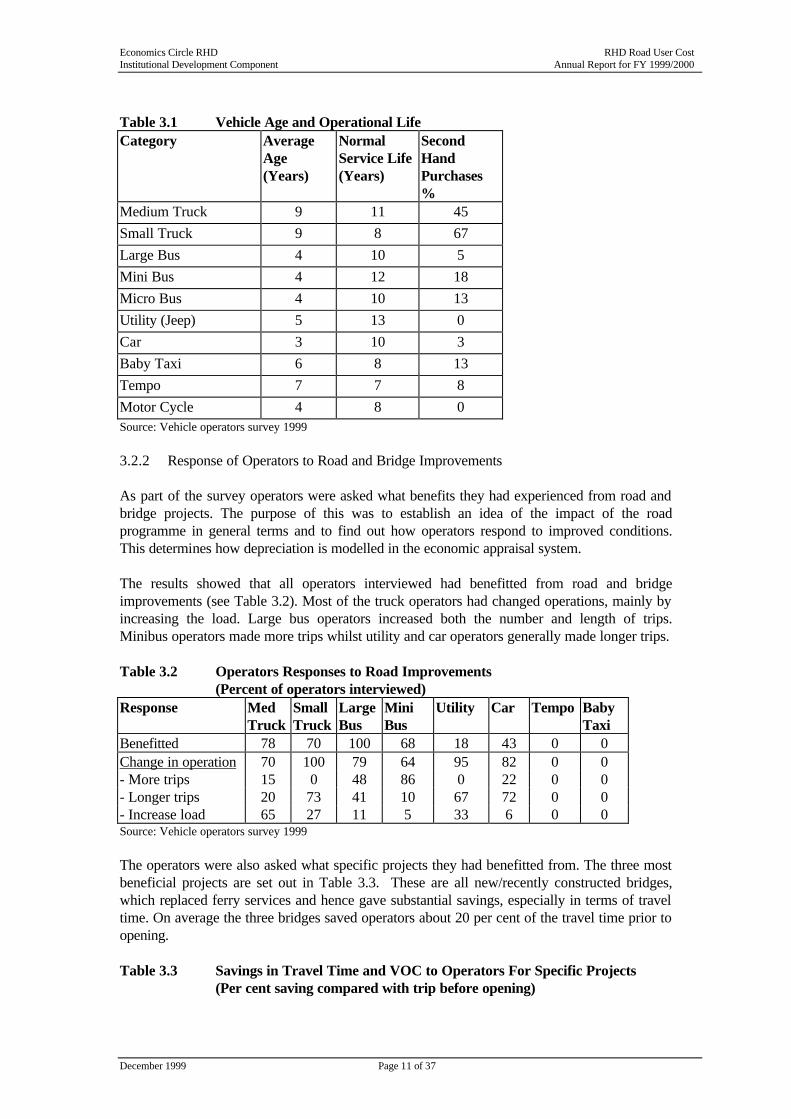
Medium Truck 51,000 3100 1830 59% Small truck 21,000 1900 1140 60% Large Bus 120,000 3000 2440 81% Mini Bus 56,000 3000 1710 57% Micro Bus 31,000 3000 1652 55% Utility (Jeep) 42,000 2800 1652 59% Car 24,000 3300 2145 65% Baby Taxi 52,000 3300 2079 63% Tempo 14,000 3000 1800 60% Motor Cycle 14,000 1348 809 60% Source: Vehicle operators survey 1999 Note: (1) Hours driven as % of hours available Another important aspect of utilisation is the length of time vehicles are operated before they are scrapped or sold on, known as the service life. This is a vital component in estimating the depreciation charges attributable to each vehicle. The survey established the average age of vehicles belonging to the operators interviewed and also to what age operators normally keep their vehicles (see Table 3.1). The results show quite long service lives with a minimum of seven years and maximum of thirteen years. On average the current ages of vehicles are half the service life. Table 3.1 also sets out the percentage of vehicles in the sample that were purchased second-hand. This shows that fifty six per cent trucks were purchased second hand. Most buses were purchased new as were microbuses, utilities and motorcycles. A small proportion of cars and autorickshaws were purchased second hand.
Economics Circle RHD RHD Road User Cost Institutional Development Component Annual Report for FY 1999/2000
December 1999 Page 11 of 37
Table 3.1 Vehicle Age and Operational Life Category Average
Age (Years)
Normal Service Life (Years)
Second Hand Purchases %
Medium Truck 9 11 45 Small Truck 9 8 67 Large Bus 4 10 5 Mini Bus 4 12 18 Micro Bus 4 10 13 Utility (Jeep) 5 13 0 Car 3 10 3 Baby Taxi 6 8 13 Tempo 7 7 8 Motor Cycle 4 8 0 Source: Vehicle operators survey 1999 3.2.2 Response of Operators to Road and Bridge Improvements As part of the survey operators were asked what benefits they had experienced from road and bridge projects. The purpose of this was to establish an idea of the impact of the road programme in general terms and to find out how operators respond to improved conditions. This determines how depreciation is modelled in the economic appraisal system. The results showed that all operators interviewed had benefitted from road and bridge improvements (see Table 3.2). Most of the truck operators had changed operations, mainly by increasing the load. Large bus operators increased both the number and length of trips. Minibus operators made more trips whilst utility and car operators generally made longer trips. Table 3.2 Operators Responses to Road Improvements (Percent of operators interviewed) Response Med
Truck Small Truck
Large Bus
Mini Bus
Utility Car Tempo Baby Taxi
Benefitted 78 70 100 68 18 43 0 0 Change in operation 70 100 79 64 95 82 0 0 - More trips 15 0 48 86 0 22 0 0 - Longer trips 20 73 41 10 67 72 0 0 - Increase load 65 27 11 5 33 6 0 0 Source: Vehicle operators survey 1999 The operators were also asked what specific projects they had benefitted from. The three most beneficial projects are set out in Table 3.3. These are all new/recently constructed bridges, which replaced ferry services and hence gave substantial savings, especially in terms of travel time. On average the three bridges saved operators about 20 per cent of the travel time prior to opening. Table 3.3 Savings in Travel Time and VOC to Operators For Specific Projects (Per cent saving compared with trip before opening)

Economics Circle RHD RHD Road User Cost Institutional Development Component Annual Report for FY 1999/2000
December 1999 Page 12 of 37
Project Saving Med Truck
Large Bus
Mini Bus
Utility
Meghna-Gumpti Bridge Time 20 20 8 17 VOC 7 9 5 5 Kamarkhali Bridge Time 15 18 20 VOC 10 Jamuna Bridge Time 23 VOC 10 Source: Vehicle operators survey 1999 3.3 Vehicle Purchase Costs Vehicle purchase costs were derived from a survey of established motor vehicle outlets in Dhaka. In order to derive economic costs the final retail price (actual cost to the purchaser) had to be broken down into its constituent parts to identify taxation and foreign currency elements. Duties and taxes are charged on the "Assessable Value (AV)" of the import which is the Cost Insurance and Freight (CIF) value in foreign currency converted to Taka at the prevailing exchange rate set by the Bangladesh Bank. If the Cost & Freight (C&F) value only is given, then an insurance and a landing fee of one per cent each is applied to the C&F cost to give the assessable value. A number of duties and taxes are charged on this value, which are set out in Bangladesh Operative Tariff Schedule issued by the National Board of Revenue. The following five duties and taxes are payable on the AV: • Customs Duty (CD): Customs duty charged at a percentage rate on the AV. These vary
between 7.5 and 42.5 per cent for vehicle imports. Duty on trucks and buses has been reduced from 15 to 7.5 per cent since 1997 and increased from 15 to 42.5 per cent for baby taxis.
• Development Surcharge (DS): Charged at a uniform rate of 2.5 per cent of AV to directly fund development works;
• Value Added Tax (VAT): Charged at a uniform rate of 15 per cent on the AV inclusive of customs duty;
• Supplementary Duty (SD): Additional charge under the VAT Act, charged as a percentage rate on AV;
• Advance Income Tax (AIT): Charged at a flat rate of 3.0 per cent on AV, except for Government imports;
• Landing Permit Fee (LPF): Charged at a flat rate of 2.5 per cent of AV on imports in excess of Taka 100,000 except for Government imports.
Tariffs charged on the representative vehicle categories are set out in Table 3.4. The CIF prices of the vehicle to Chittagong port are paid either in US dollar or Japanese Yen. Other costs include port dues, transport, assembly (for knocked down units) and dealers' overheads and margins. The economic cost is taken as the CIF cost plus all port, transport and assembly costs incurred in getting to the retail price of the vehicle which are shadow priced according to the SCF. Table 3.5 sets out the cost breakdown. Table 3.4 Tariffs Applicable to Representative Vehicles and Tyres November 1999 Category DS AIT LPF CD SD VAT

Economics Circle RHD RHD Road User Cost Institutional Development Component Annual Report for FY 1999/2000
December 1999 Page 13 of 37
Medium Truck 2.5% 3% 2.5% 15% - 15% Small Truck 2.5% 3% 2.5% 30% - 15% Large Bus 2.5% 3% 2.5% 5% - 15% Mini Bus 2.5% 3% 2.5% 15% - 15% Micro Bus 2.5% 3% 2.5% 37.5% - 15% Utility (Jeep) 2.5% 3% 2.5% 37.5% 127.5% 15% Car 2.5% 3% 2.5% 37.5% 52.5% 15% Baby Taxi 2.5% 3% 2.5% 42.5% 25% 15% Motor Cycle 2.5% 3% 2.5% 15% - 15% All tyres 2.5% 3% 2.5% 30% - 15% Source: National Board of Revenue Key : DS = Development Surcharge charged on AV
AIT = Advanced Income Tax charged on AV LPF = Landing Permit Fee charged on AV CD = Customs Duty charged on AV SD = Supplementary Duty charged on AV VAT = Value Added Tax charged on AV+CD Table 3.5 New Vehicle Purchase Costs – Taka 1999 Prices Category CIF
Tariffs Assembly &
Other Costs Total Financial
Total Economic
Medium Truck 576,400 213,000 570,600 1,360,000 1,032,880 Small Truck 399,350 209,659 205,991 815,000 564,143 Large Bus 1,351,200 439,250 192,000 2,990,000 2,314,350 Mini Bus 469,700 174,200 651,100 1,295,000 990,580 Micro Bus 657,633 397,868 44,500 1,100,000 693,232 Utility (Jeep) 1,966,961 3,467,998 332041 5,700,000 2,232,594 Car 753,760 851,749 44,500 1,650,000 789,351 Baby Taxi 42,750 48,094 40,656 131,500 75,275 Motor Cycle 65,187 28,693 20,120 114,000 81,283 Source:Vehicle dealers' survey November 1999 Note: Small Truck and Baby Taxi presented as 1998 value 3.4 Consumable Costs 3.4.1 Tyre Costs Tyres are imported from India, Japan, Malaysia and Taiwan with Indian tyres dominating the market (mainly because they are the cheapest.). The use of re-treaded tyres is not common, as is shown in Table 3.6. Table 3.7 sets out a breakdown of new tyre prices for each of the representative vehicle types. Tyres are subject to 53 per cent duties and taxes (see Table 3.4.) Table 3.6 Use Of Re-treaded Tyres Item Med
Truck Large Bus
Mini Bus
Utility Car Tempo Baby Taxi
Operators Using - 13% 53% 3% - 10 28% Cost Tk per Tyre - 3,500 2,800 460 - 400 380 Source: Vehicle operators survey 1999 Table 3.7 New Tyre Costs in Taka November 1999 Category Tyre Size Make CIF Tariffs Other
Costs Financial Cost
Economic Cost
Economics Circle RHD RHD Road User Cost Institutional Development Component Annual Report for FY 1999/2000
December 1999 Page 14 of 37
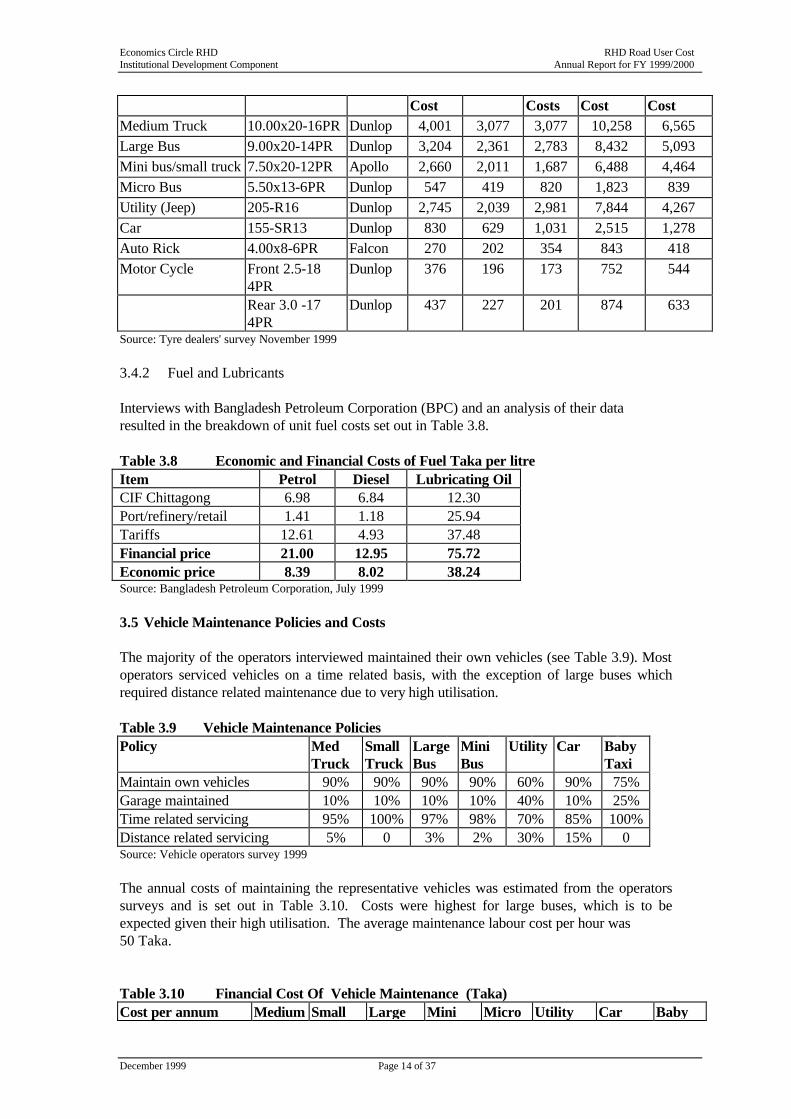
Cost Costs Cost Cost Medium Truck 10.00x20-16PR Dunlop 4,001 3,077 3,077 10,258 6,565 Large Bus 9.00x20-14PR Dunlop 3,204 2,361 2,783 8,432 5,093 Mini bus/small truck 7.50x20-12PR Apollo 2,660 2,011 1,687 6,488 4,464 Micro Bus 5.50x13-6PR Dunlop 547 419 820 1,823 839 Utility (Jeep) 205-R16 Dunlop 2,745 2,039 2,981 7,844 4,267 Car 155-SR13 Dunlop 830 629 1,031 2,515 1,278 Auto Rick 4.00x8-6PR Falcon 270 202 354 843 418 Motor Cycle Front 2.5-18
4PR Dunlop 376 196 173 752 544
Rear 3.0 -17 4PR
Dunlop 437 227 201 874 633
Source: Tyre dealers' survey November 1999 3.4.2 Fuel and Lubricants Interviews with Bangladesh Petroleum Corporation (BPC) and an analysis of their data resulted in the breakdown of unit fuel costs set out in Table 3.8. Table 3.8 Economic and Financial Costs of Fuel Taka per litre Item Petrol Diesel Lubricating Oil CIF Chittagong 6.98 6.84 12.30 Port/refinery/retail 1.41 1.18 25.94 Tariffs 12.61 4.93 37.48 Financial price 21.00 12.95 75.72 Economic price 8.39 8.02 38.24 Source: Bangladesh Petroleum Corporation, July 1999 3.5 Vehicle Maintenance Policies and Costs The majority of the operators interviewed maintained their own vehicles (see Table 3.9). Most operators serviced vehicles on a time related basis, with the exception of large buses which required distance related maintenance due to very high utilisation.
Table 3.9 Vehicle Maintenance Policies Policy Med
Truck Small Truck
Large Bus
Mini Bus
Utility Car Baby Taxi
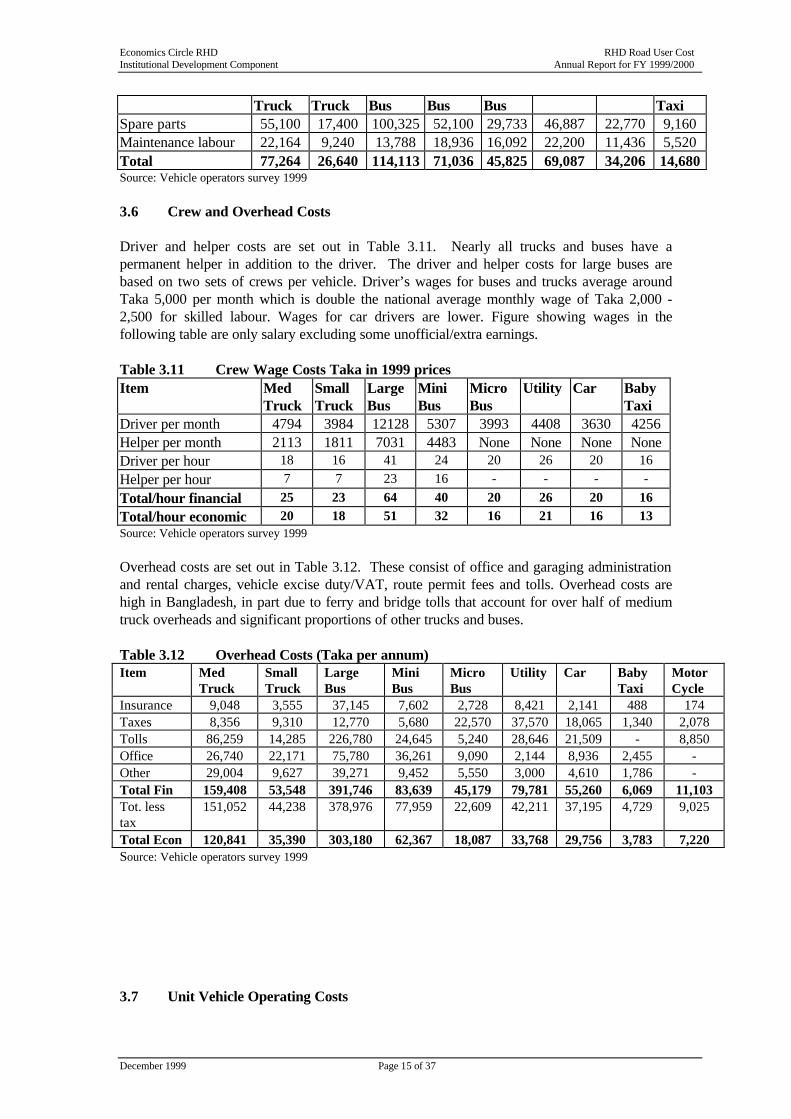
Maintain own vehicles 90% 90% 90% 90% 60% 90% 75% Garage maintained 10% 10% 10% 10% 40% 10% 25% Time related servicing 95% 100% 97% 98% 70% 85% 100% Distance related servicing 5% 0 3% 2% 30% 15% 0 Source: Vehicle operators survey 1999 The annual costs of maintaining the representative vehicles was estimated from the operators surveys and is set out in Table 3.10. Costs were highest for large buses, which is to be expected given their high utilisation. The average maintenance labour cost per hour was 50 Taka. Table 3.10 Financial Cost Of Vehicle Maintenance (Taka)
Cost per annum Medium Small Large Mini Micro Utility Car Baby
Economics Circle RHD RHD Road User Cost Institutional Development Component Annual Report for FY 1999/2000
December 1999 Page 15 of 37
Truck Truck Bus Bus Bus Taxi Spare parts 55,100 17,400 100,325 52,100 29,733 46,887 22,770 9,160 Maintenance labour 22,164 9,240 13,788 18,936 16,092 22,200 11,436 5,520 Total 77,264 26,640 114,113 71,036 45,825 69,087 34,206 14,680 Source: Vehicle operators survey 1999 3.6 Crew and Overhead Costs Driver and helper costs are set out in Table 3.11. Nearly all trucks and buses have a permanent helper in addition to the driver. The driver and helper costs for large buses are based on two sets of crews per vehicle. Driver’s wages for buses and trucks average around Taka 5,000 per month which is double the national average monthly wage of Taka 2,000 -2,500 for skilled labour. Wages for car drivers are lower. Figure showing wages in the following table are only salary excluding some unofficial/extra earnings. Table 3.11 Crew Wage Costs Taka in 1999 prices Item
Med Truck
Small Truck
Large Bus
Mini Bus
Micro Bus
Utility Car Baby Taxi
Driver per month 4794 3984 12128 5307 3993 4408 3630 4256 Helper per month 2113 1811 7031 4483 None None None None Driver per hour 18 16 41 24 20 26 20 16 Helper per hour 7 7 23 16 - - - - Total/hour financial 25 23 64 40 20 26 20 16 Total/hour economic 20 18 51 32 16 21 16 13 Source: Vehicle operators survey 1999 Overhead costs are set out in Table 3.12. These consist of office and garaging administration and rental charges, vehicle excise duty/VAT, route permit fees and tolls. Overhead costs are high in Bangladesh, in part due to ferry and bridge tolls that account for over half of medium truck overheads and significant proportions of other trucks and buses. Table 3.12 Overhead Costs (Taka per annum) Item Med
Truck Small Truck
Large Bus
Mini Bus
Micro Bus
Utility Car Baby Taxi
Motor Cycle
Insurance 9,048 3,555 37,145 7,602 2,728 8,421 2,141 488 174 Taxes 8,356 9,310 12,770 5,680 22,570 37,570 18,065 1,340 2,078 Tolls 86,259 14,285 226,780 24,645 5,240 28,646 21,509 - 8,850 Office 26,740 22,171 75,780 36,261 9,090 2,144 8,936 2,455 - Other 29,004 9,627 39,271 9,452 5,550 3,000 4,610 1,786 - Total Fin 159,408 53,548 391,746 83,639 45,179 79,781 55,260 6,069 11,103 Tot. less tax
151,052 44,238 378,976 77,959 22,609 42,211 37,195 4,729 9,025
Total Econ 120,841 35,390 303,180 62,367 18,087 33,768 29,756 3,783 7,220 Source: Vehicle operators survey 1999 3.7 Unit Vehicle Operating Costs
Economics Circle RHD RHD Road User Cost Institutional Development Component Annual Report for FY 1999/2000
December 1999 Page 16 of 37
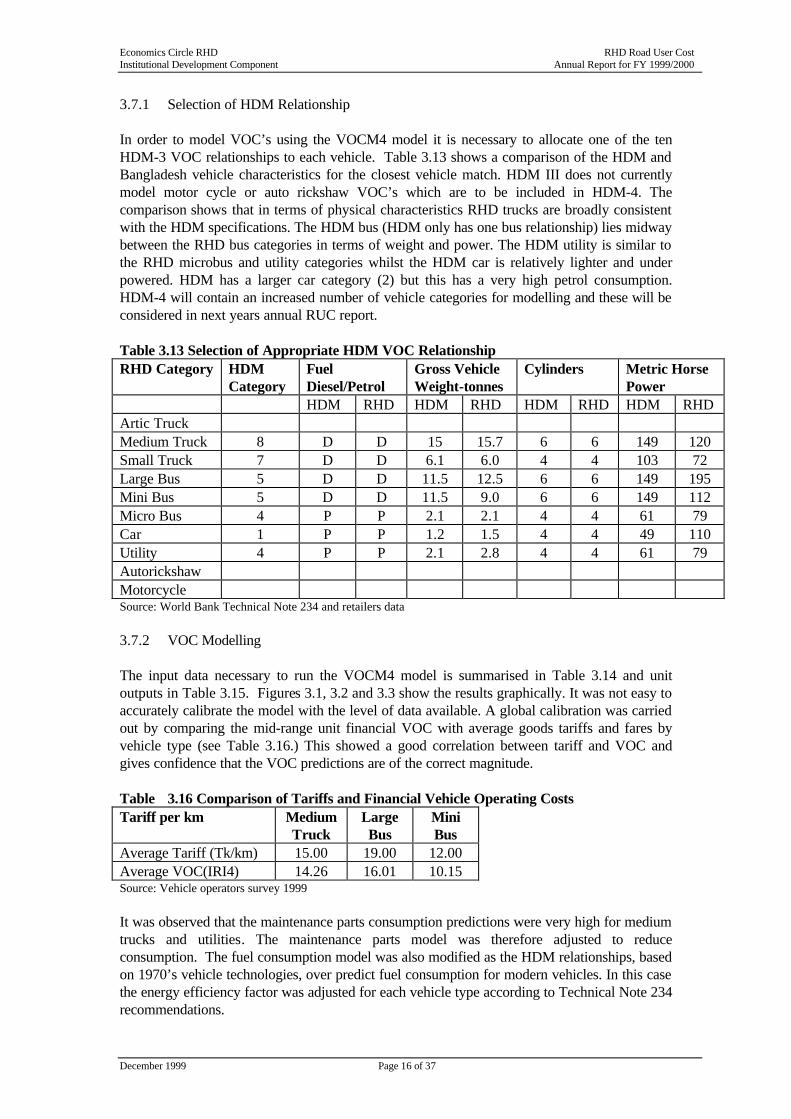
3.7.1 Selection of HDM Relationship In order to model VOC’s using the VOCM4 model it is necessary to allocate one of the ten HDM-3 VOC relationships to each vehicle. Table 3.13 shows a comparison of the HDM and Bangladesh vehicle characteristics for the closest vehicle match. HDM III does not currently model motor cycle or auto rickshaw VOC’s which are to be included in HDM-4. The comparison shows that in terms of physical characteristics RHD trucks are broadly consistent with the HDM specifications. The HDM bus (HDM only has one bus relationship) lies midway between the RHD bus categories in terms of weight and power. The HDM utility is similar to the RHD microbus and utility categories whilst the HDM car is relatively lighter and under powered. HDM has a larger car category (2) but this has a very high petrol consumption. HDM-4 will contain an increased number of vehicle categories for modelling and these will be considered in next years annual RUC report. Table 3.13 Selection of Appropriate HDM VOC Relationship RHD Category HDM
Category Fuel Diesel/Petrol
Gross Vehicle Weight-tonnes
Cylinders Metric Horse Power
HDM RHD HDM RHD HDM RHD HDM RHD Artic Truck Medium Truck 8 D D 15 15.7 6 6 149 120 Small Truck 7 D D 6.1 6.0 4 4 103 72 Large Bus 5 D D 11.5 12.5 6 6 149 195 Mini Bus 5 D D 11.5 9.0 6 6 149 112 Micro Bus 4 P P 2.1 2.1 4 4 61 79 Car 1 P P 1.2 1.5 4 4 49 110 Utility 4 P P 2.1 2.8 4 4 61 79 Autorickshaw Motorcycle Source: World Bank Technical Note 234 and retailers data 3.7.2 VOC Modelling The input data necessary to run the VOCM4 model is summarised in Table 3.14 and unit outputs in Table 3.15. Figures 3.1, 3.2 and 3.3 show the results graphically. It was not easy to accurately calibrate the model with the level of data available. A global calibration was carried out by comparing the mid-range unit financial VOC with average goods tariffs and fares by vehicle type (see Table 3.16.) This showed a good correlation between tariff and VOC and gives confidence that the VOC predictions are of the correct magnitude. Table 3.16 Comparison of Tariffs and Financial Vehicle Operating Costs Tariff per km Medium
Truck Large Bus
Mini Bus
Average Tariff (Tk/km) 15.00 19.00 12.00 Average VOC(IRI4) 14.26 16.01 10.15 Source: Vehicle operators survey 1999 It was observed that the maintenance parts consumption predictions were very high for medium trucks and utilities. The maintenance parts model was therefore adjusted to reduce consumption. The fuel consumption model was also modified as the HDM relationships, based on 1970’s vehicle technologies, over predict fuel consumption for modern vehicles. In this case the energy efficiency factor was adjusted for each vehicle type according to Technical Note 234 recommendations.
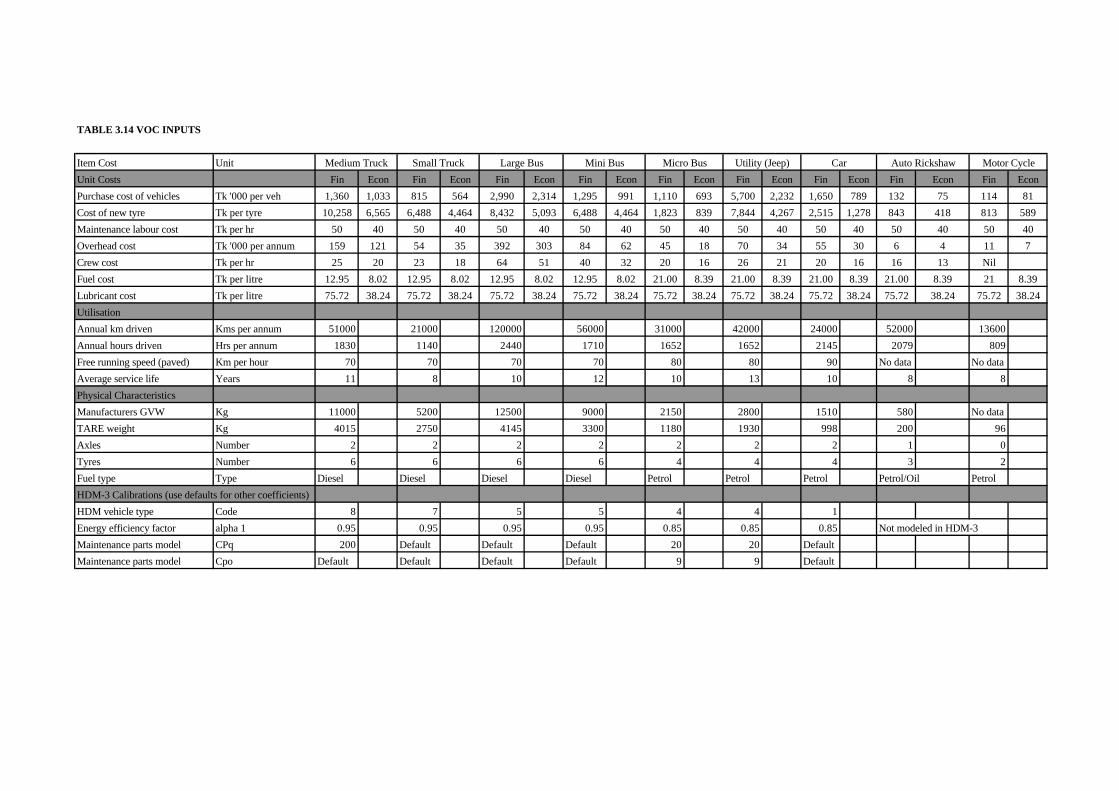
TABLE 3.14 VOC INPUTS
Item Cost Unit
Unit Costs Fin Econ Fin Econ Fin Econ Fin Econ Fin Econ Fin Econ Fin Econ Fin Econ Fin Econ
Purchase cost of vehicles Tk '000 per veh 1,360 1,033 815 564 2,990 2,314 1,295 991 1,110 693 5,700 2,232 1,650 789 132 75 114 81
Cost of new tyre Tk per tyre 10,258 6,565 6,488 4,464 8,432 5,093 6,488 4,464 1,823 839 7,844 4,267 2,515 1,278 843 418 813 589
Maintenance labour cost Tk per hr 50 40 50 40 50 40 50 40 50 40 50 40 50 40 50 40 50 40
Overhead cost Tk '000 per annum 159 121 54 35 392 303 84 62 45 18 70 34 55 30 6 4 11 7
Crew cost Tk per hr 25 20 23 18 64 51 40 32 20 16 26 21 20 16 16 13 Nil
Fuel cost Tk per litre 12.95 8.02 12.95 8.02 12.95 8.02 12.95 8.02 21.00 8.39 21.00 8.39 21.00 8.39 21.00 8.39 21 8.39
Lubricant cost Tk per litre 75.72 38.24 75.72 38.24 75.72 38.24 75.72 38.24 75.72 38.24 75.72 38.24 75.72 38.24 75.72 38.24 75.72 38.24
Utilisation
Annual km driven Kms per annum 51000 21000 120000 56000 31000 42000 24000 52000 13600
Annual hours driven Hrs per annum 1830 1140 2440 1710 1652 1652 2145 2079 809
Free running speed (paved) Km per hour 70 70 70 70 80 80 90 No data No data
Average service life Years 11 8 10 12 10 13 10 8 8
Physical Characteristics
Manufacturers GVW Kg 11000 5200 12500 9000 2150 2800 1510 580 No data
TARE weight Kg 4015 2750 4145 3300 1180 1930 998 200 96
Axles Number 2 2 2 2 2 2 2 1 0
Tyres Number 6 6 6 6 4 4 4 3 2
Fuel type Type Diesel Diesel Diesel Diesel Petrol Petrol Petrol Petrol/Oil Petrol
HDM-3 Calibrations (use defaults for other coefficients)
HDM vehicle type Code 8 7 5 5 4 4 1
Energy efficiency factor alpha 1 0.95 0.95 0.95 0.95 0.85 0.85 0.85 Not modeled in HDM-3
Maintenance parts model CPq 200 Default Default Default 20 20 Default
Maintenance parts model Cpo Default Default Default Default 9 9 Default
Motor CycleCar Auto RickshawMicro Bus Utility (Jeep)Medium Truck Small Truck Large Bus Mini Bus

Economics Circle RHD RHD Road User Cost Institutional Development Component Annual Report for FY 1999/2000
December 1999 Page 19 of 37
Table 3.15: Sensitivity of Vehicle Operating Costs to Road Roughness With Zero Horizontal and Vertical Curvature
Medium Truck Small Truck Large Bus Mini Bus Micro Bus Utility/Jeep Car IRI m/km VOC
Taka/km Speed km/h
VOC Taka/km
Speed km/h
VOC Taka/km
Speed km/h
VOC Taka/km
Speed km/h
VOC Taka/km
Speed km/h
VOC Taka/km
Speed km/h
VOC Taka/km
Speed km/h
2 10.04 60 7.61 68 13.55 62 8.55 74 4.53 74 9.82 67 5.22 82 3 10.73 59 7.93 67 13.78 62 8.69 74 4.67 73 10.29 66 5.48 81 4 11.43 59 8.25 66 14.03 61 8.83 73 4.82 72 10.83 65 5.79 81 5 12.13 57 8.57 65 14.30 60 8.99 71 4.99 71 11.42 64 6.15 80 6 12.84 56 8.91 63 14.59 60 9.16 70 5.19 69 12.10 63 6.59 78 7 13.57 54 9.26 60 14.92 58 9.35 67 5.40 67 12.85 61 7.10 76 8 14.32 51 9.62 57 15.28 57 9.56 64 5.65 64 13.69 59 7.70 73 9 15.08 49 10.00 54 15.68 55 9.81 61 5.92 62 14.64 57 8.42 70 10 15.88 46 10.39 51 16.12 53 10.08 58 6.22 59 15.67 55 9.24 67 11 16.69 44 10.80 49 16.60 50 10.38 54 6.53 56 16.71 52 10.06 64 12 17.52 42 11.22 46 17.13 48 10.72 51 6.85 53 17.78 50 10.88 61 13 18.37 39 11.66 43 17.70 46 11.09 48 7.18 51 18.85 48 11.71 57 14 19.24 37 12.10 41 18.32 44 11.48 46 7.51 48 19.94 46 12.53 54 15 20.11 35 12.55 39 18.97 41 11.91 43 7.85 46 21.04 44 13.36 51
Source: VOCM4 model
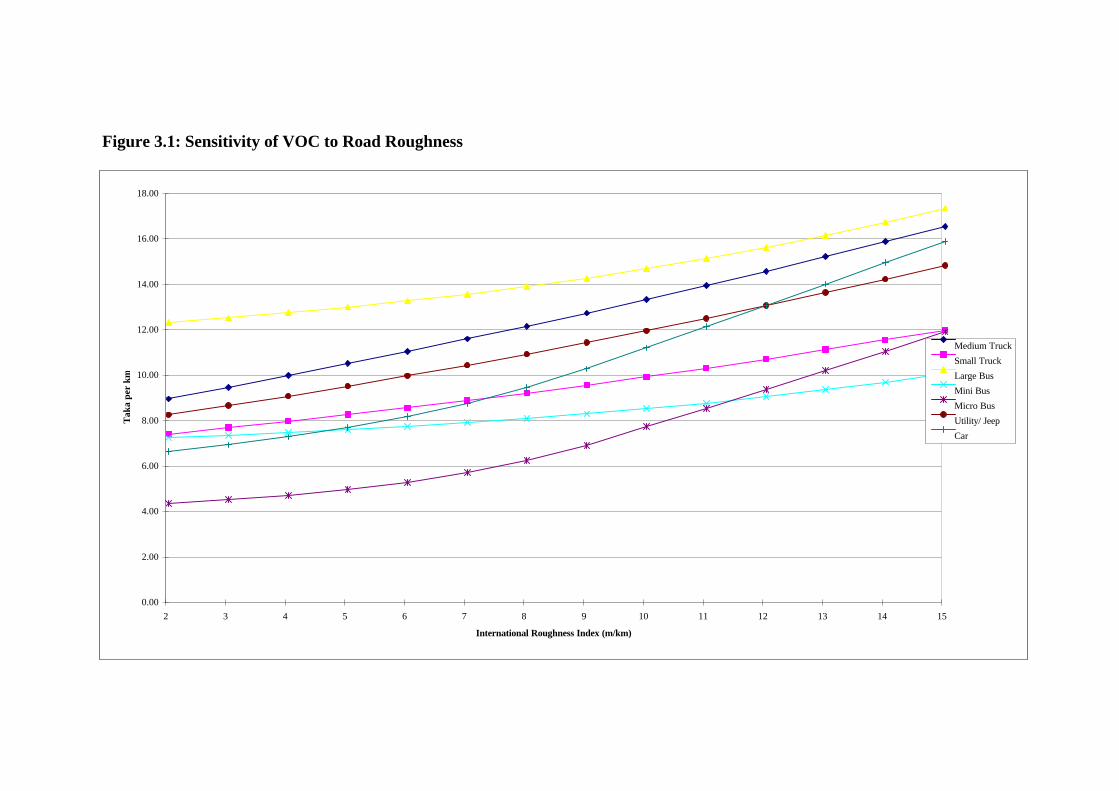
Figure 3.1: Sensitivity of VOC to Road Roughness
0.00
2.00
4.00
6.00
8.00
10.00
12.00
14.00
16.00
18.00
2 3 4 5 6 7 8 9 10 11 12 13 14 15
International Roughness Index (m/km)
Tak
a pe
r km
Medium Truck
Small Truck
Large Bus
Mini Bus
Micro Bus
Utility/ Jeep
Car
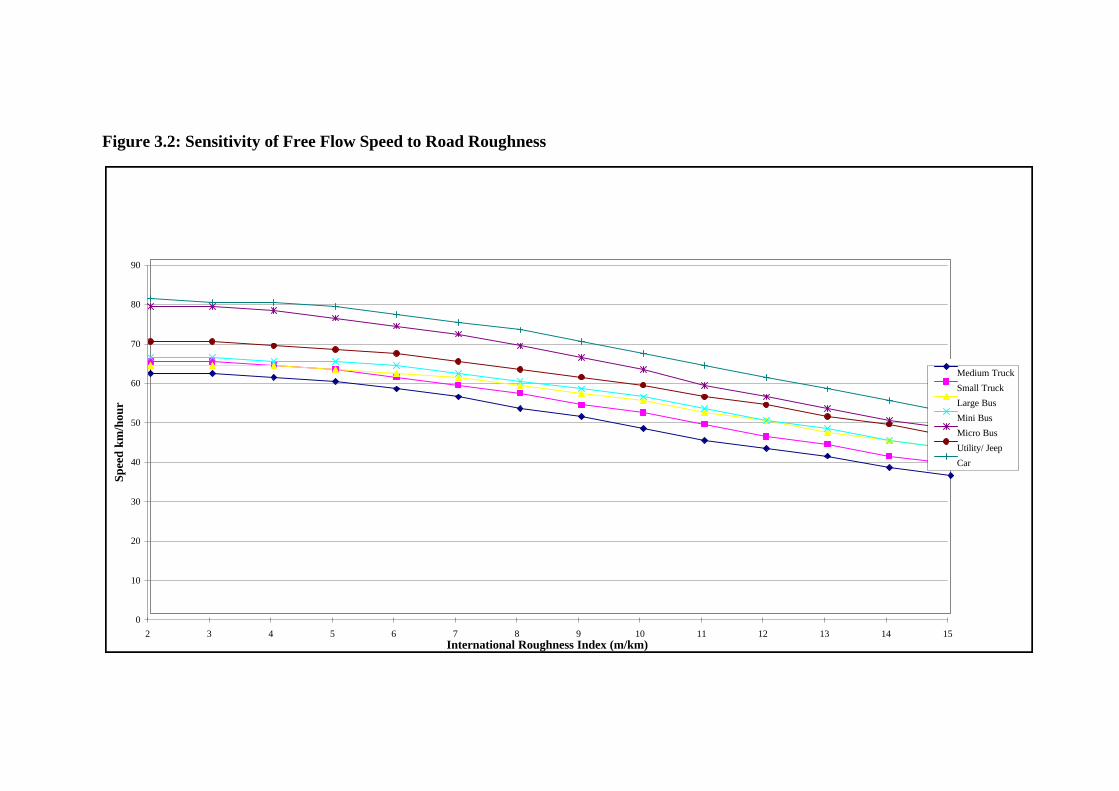
Figure 3.2: Sensitivity of Free Flow Speed to Road Roughness
0
10
20
30
40
50
60
70
80
90
2 3 4 5 6 7 8 9 10 11 12 13 14 15International Roughness Index (m/km)
Spee
d km
/hou
r
Medium Truck
Small Truck
Large Bus
Mini Bus
Micro Bus
Utility/ Jeep
Car
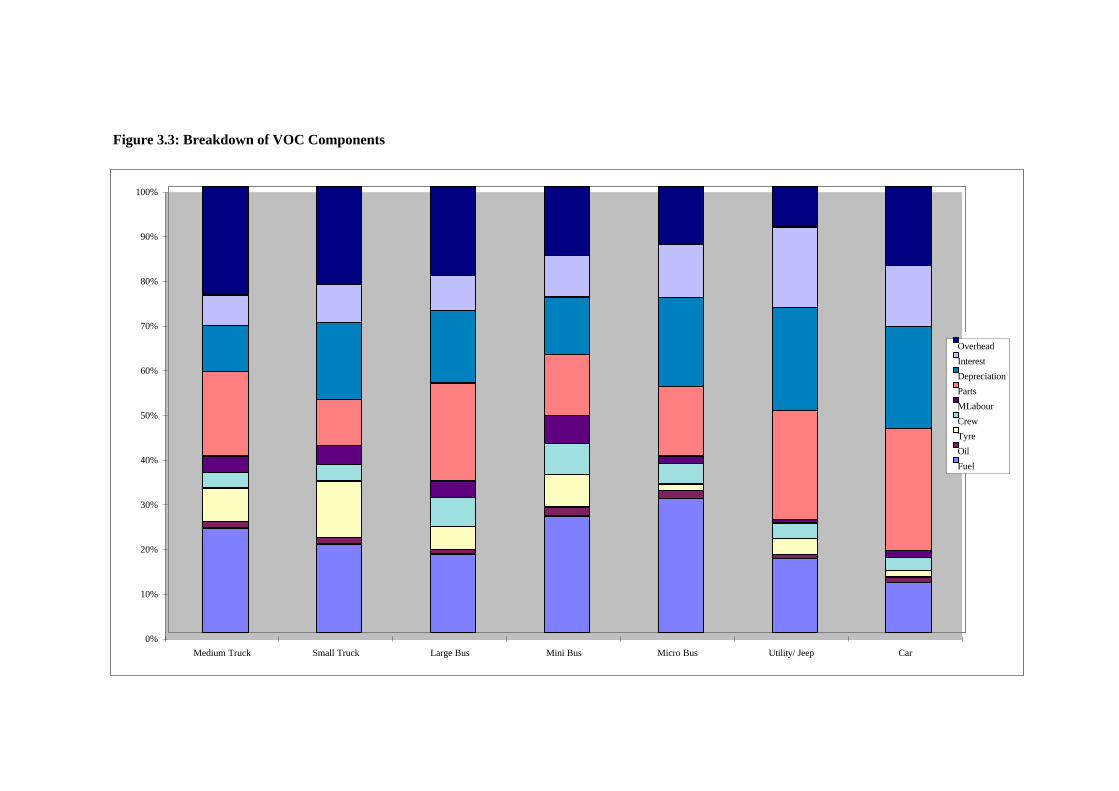
Figure 3.3: Breakdown of VOC Components
0%
10%
20%
30%
40%
50%
60%
70%
80%
90%
100%
Medium Truck Small Truck Large Bus Mini Bus Micro Bus Utility/ Jeep Car
Overhead
Interest
Depreciation
Parts
MLabour
Crew
Tyre
Oil
Fuel
Economics Circle RHD RHD Road User Cost Institutional Development Component Annual Report for FY 1999/2000
December 1999 Page 23 of 37
4 TRAVEL TIME COSTS 4.1 Introduction Travel time costs (TTC), also referred to as Value of Time (VOT) are an important component of road user costs. This can vary from country to country and from project to project in the same country.TTC can vary in size from 20 per cent of total RUC to over 80 per cent in the appraisal of schemes that reduce time delays significantly (such as the construction of a new bridge to replace a ferry). The theory of travel time costs is based around the premise that time spent in travelling has an “opportunity cost” and could be used in an alternative activity which also produce or may produce some significant utility (benefit). If the alternative activity can have a monetary value assigned to it this can be used as a RUC in an economic appraisal. Time costs can be estimated for road users and for freight consignments. Costs may be broken down into “in vehicle time” and “out of vehicle time”. The latter may be important to bus passengers waiting for a vehicle, but is specialised in its application and is not considered in the RHD approach which focuses on “in vehicle” time value. Time costs will vary between different vehicle types according to the socio-economic characteristics of the occupants, trip purpose and the type of freight carried. For analysis purposes TTC are expressed as hourly values per vehicle by assuming average occupancies and loading factors for each vehicle type. Although every vehicle or category of vehicle will have its own total TTC it is sometimes considered appropriate to apply a uniform TTC across all vehicle types to avoid biasing investment towards roads with a dominance of one type of user (i.e. a road with many high income car users will generate much greater time savings than a road with many low value rickshaw users). In this case the TTC is referred to as an “equity” value. This approach has not been adopted in Bangladesh to date. It should also be noted that TTC will vary geographically according to the socio-economic characteristics of the region. It would be expected, for instance, that road users in Dhaka will value their time more than those in a remote Thana in Barisal. It is usual practice, in this case, to adopt a set of national average TTC applicable to all analyses to avoid the sort of biases referred to in the preceding paragraph. This approach will continue to be used in Bangladesh in line with current methodology. 4.2 Previous Work Until the IDC initiative TTC were estimated in feasibility studies according to the projects requirements. Costs were often based on small surveys or updated from previous studies. Table 4.0 sets out the principal transport studies to date that have conducted some original work on TTC. An average wage base approach was used by the first four studies. This was changed in the Dhaka Eastern Bypass Study which used a Stated Preference interview technique which gave very high TTC. Table 4.0 Previous Work on TTC in Bangladesh
Economics Circle RHD RHD Road User Cost Institutional Development Component Annual Report for FY 1999/2000
December 1999 Page 24 of 37
Study Author Year Jamuna Bridge Feasibility Study Rendel Palmer & Tritton et al 1989 Road Master Plan Project Transroute et al 1992 Road Materials & Standards Study Howard Humphreys et al 1994 Dhaka Urban Transport Study Phase 2 Mott MacDonald et al 1996 Dhaka Eastern Bypass Halcrow Fox et al 1997 Table 4.1 Results of Previous Work on TTC in Bangladesh (Values per vehicle occupant in Taka, not adjusted for inflation) Study Year Bus Car Jamuna Bridge Feasibility Study 1989 7.84 - Road Master Plan Project 1992 8 20 Road Materials & Standards Study 1994 9 23 Dhaka Urban Transport Study Phase 2 1996 5.52 19.17 Dhaka Eastern Bypass 1997 28.8-35.6 74.4 4.3 Methodology The Dhaka Eastern Bypass Study (DEBS) work derived TTC higher than previously estimated and as the reasons for this were not completely clear they were not used in the economic appraisal for the study. It was considered that the results might have been biased by the high incomes in the Dhaka area and/or the previously unused “Stated Preference” interview technique. The Economics Circle, therefore, organised to undertake surveys in four divisional cities in 1997 and also in early 1999 both on main and feeder roads in order to develop a greater understanding of the issues involved, and to estimate a common national set of TTC according to vehicle types. The survey was based on the Average Wage approach whereby the wage rates of vehicle occupants are assessed and average rates estimated to reflect the value of time of occupants in different vehicles. An assessment of the number of travellers in work time (WT) and non-work time (NWT) is made for each vehicle type. The TTC for WT is then taken as the estimated wage rate (net of tax but including employers costs directly associated with the employment) and the value for NWT as a proportion of the wage rate (35 per cent according to advice from the United Kingdom’s Transport Research Laboratory (TRL). The summary results of the 1999 TTC survey are published in this RUC report. 4.4 Summary of Survey Results This section sets out a summary of the main and feeder road travel time surveys conducted in 1999. More details of methodology can be found in Economics Working Paper E7. Tables 4.2 and 4.3 set out the distribution of trip purpose for main road and feeder roads respectively. Table 4.2 Main Road - Percentage Sample Distribution by Trip Purpose

Economics Circle RHD RHD Road User Cost Institutional Development Component Annual Report for FY 1999/2000
December 1999 Page 25 of 37
Trip Purpose A/C Bus
C/C Bus
O/C Bus
Mini Bus
Micro Bus
Car Auto Rick
Tempo Motor Cycle
Journey to Work 10 15 16 8 20 18 20 15 22 Employers Business 12 10 5 10 3 5 0 5 10 Own Business 20 15 16 15 10 27 17 20 20 Family and Social 40 39 37 35 35 36 28 43 20 Other 18 21 26 32 32 14 35 17 28 Total 100 100 100 100 100 100 100 100 100 Source: Travel Time Surveys 1999. Note: A/C =Air Conditioned, C/C= Chair Class, O/C= Ordinary Class. Table 4.3 Feeder Road - Percentage Sample Distribution by Trip Purpose Trip Purpose O/C
Bus Mini Bus
Micro Bus
Car Auto Rick
Tempo Motor Cycle
Journey to Work 18 20 15 5 8 20 27 Employers Business 5 0 5 5 15 5 10 Own Business 27 17 20 18 30 25 23 Family and Social 36 28 43 42 22 25 22 Other 14 35 17 30 25 25 18 Total 100 100 100 100 100 100 100 Source: Travel Time Surveys 1999. Tables 4.4 and 4.5 show the distribution of occupations according to main road and feeder road users respectively. Table 4.4 Main Road - Percentage Sample Distribution by Occupation Occupations A/C
Bus C/C Bus
O/C Bus
Mini Bus
Micro Bus
Car Auto Rick
Tempo Motor Cycle
Businessman 33 23 29 33 40 47 20 30 25 Officer 30 25 13 9 30 28 3 8 13 Salesman 0 5 6 15 5 3 17 10 8 Clerical 5 10 16 13 10 10 43 38 22 Farmer 0 2 3 7 0 2 2 7 0 Student 18 13 18 8 2 0 7 7 15 Domestic Staff 0 0 0 0 0 0 0 0 0 Housewife 14 10 5 8 8 0 0 0 0 Unemployed 0 2 0 0 0 0 5 0 10 Other 0 10 10 7 5 10 3 0 7 Total 100 100 100 100 100 100 100 100 100 Source: Travel Time Surveys 1999. Note: A/C =Air Conditioned, C/C= Chair Class, O/C= Ordinary Class. Table 4.5 Feeder Road - Percentage Sample Distribution by Occupation
Economics Circle RHD RHD Road User Cost Institutional Development Component Annual Report for FY 1999/2000
December 1999 Page 26 of 37
Occupations O/C Bus
Mini Bus
Micro Bus
Car Auto Rick
Tempo Motor Cycle
Businessman 23 25 25 50 40 20 28 Officer 0 7 8 18 10 7 21 Salesman 19 10 10 2 5 15 10 Clerical 0 15 5 10 12 23 10 Farmer 18 13 2 0 12 17 2 Student 9 20 23 8 3 13 17 Domestic Staff 0 0 0 0 3 0 0 Housewife 9 3 17 5 3 0 0 Unemployed 0 5 5 0 2 2 7 Other 22 2 5 7 10 3 5 Total 100 100 100 100 100 100 100 Source: Travel Time Surveys 1999. Tables 4.6 and 4.7 show the reported monthly household income of the respondents (gross of tax), disaggregated by bus type. The results more or less accord with last years surveys and show the significant differences between main road and feeder road incomes and between different bus and vehicle types. Table 4.6 Main Road -Percentage Sample Distribution by Monthly Income Income Group (Taka)
A/C Bus
C/C Bus
O/C Bus
Mini Bus
Micro Bus
Car Tempo Auto Rick
Motor Cycle
<1000 0 0 2 0 0 0 0 0 0 1001-2000 0 0 0 5 0 0 0 0 0 2001-5000 12 25 13 33 2 10 58 35 7 5001-10000 43 43 42 32 45 15 10 45 45 10001-20000 23 22 27 20 38 32 27 17 38 20001-30000 22 10 16 10 15 25 5 3 10 30000+ 0 0 0 0 0 18 0 0 0 Total 100 100 100 100 100 100 100 100 100 Source: Travel Time Surveys 1999. Note: A/C =Air Conditioned, C/C= Chair Class, O/C= Ordinary Class. Table 4.7 Feeder Road -Percentage Sample Distribution by Monthly Income Income Group (Taka)
O/C Bus
Mini Bus
Micro Bus
Car Tempo Auto Rick
Motor Cycle
<1000 4 0 0 0 0 0 0 1001-2000 18 0 5 0 7 10 0 2001-5000 50 45 17 0 43 20 7 5001-10000 19 43 55 45 43 30 43 10001-20000 5 12 23 40 7 25 35 20001-30000 4 0 0 15 0 15 15 30000+ 0 0 0 0 0 0 0 Total 100 100 100 100 100 100 100
Source: Travel Time Surveys 1999. 4.5 Unit Travel Time Costs
Economics Circle RHD RHD Road User Cost Institutional Development Component Annual Report for FY 1999/2000
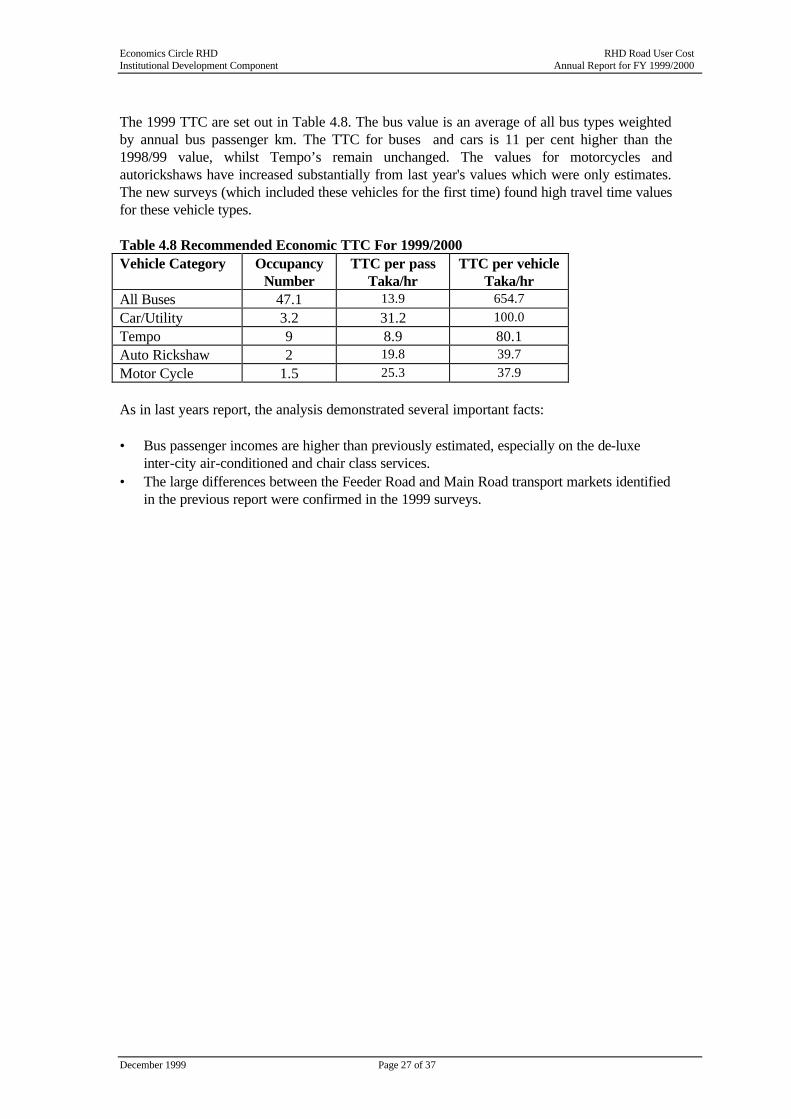
December 1999 Page 27 of 37
The 1999 TTC are set out in Table 4.8. The bus value is an average of all bus types weighted by annual bus passenger km. The TTC for buses and cars is 11 per cent higher than the 1998/99 value, whilst Tempo’s remain unchanged. The values for motorcycles and autorickshaws have increased substantially from last year's values which were only estimates. The new surveys (which included these vehicles for the first time) found high travel time values for these vehicle types. Table 4.8 Recommended Economic TTC For 1999/2000 Vehicle Category Occupancy
Number TTC per pass
Taka/hr TTC per vehicle
Taka/hr All Buses 47.1 13.9 654.7 Car/Utility 3.2 31.2 100.0 Tempo 9 8.9 80.1 Auto Rickshaw 2 19.8 39.7 Motor Cycle 1.5 25.3 37.9 As in last years report, the analysis demonstrated several important facts: • Bus passenger incomes are higher than previously estimated, especially on the de-luxe
inter-city air-conditioned and chair class services. • The large differences between the Feeder Road and Main Road transport markets identified
in the previous report were confirmed in the 1999 surveys.
Economics Circle RHD RHD Road User Cost Institutional Development Component Annual Report for FY 1999/2000
December 1999 Page 28 of 37
5 ACCIDENT COSTS 5.1 Introduction 5.1.1 General Accident costs have not generally been included in economic appraisal in Bangladesh. This analysis is intended to be the starting point in the process to incorporate accident costing in the Bangladesh road appraisal system. Given that many of the data sets needed to derive accident costs are of very poor quality the costs presented are indicative only. This analysis is intended to document the data sources, analysis procedures and present the current working estimates. As many assumptions were required, a conservative but realistic approach was used. However, the paper presents a solid framework for the development of costs under subsequent projects. For the last two decades, road accident costs have been generally assumed to cost a country around one per cent of Gross National Product (GNP.) This figure initially applied to both motorised and motorising countries. But with the shift towards the higher priced Willingness to Pay approach, road accident costs in motorised countries are now estimated at a higher rate. In the Institution of Civil Engineer’s publication “A Vision for Road Safety beyond 2000”, road accidents were quoted as costing the European Union 2.5 per cent of its GNP, the equivalent of approximately $US 200 billion. (ICE, 1996) In addition to their overall impact on the national economy, estimates of accident costs are also needed to measure the safety impacts of road schemes. The main objective of most road improvements is to reduce vehicle operating costs and journey times, which is most often achieved by increasing vehicle speeds. Increased speeds may increase the number and severity of accidents. It is, therefore, vital to include the accident of accidents in road appraisals as the failure to do so may result in increased loss of life and economic output. 5.1.2 Accident Costing Methodologies The two basic accident costing methodologies are the Lost Output (or “human capital”) and the Willingness to Pay (WTP) approach. Lost Output focuses on the economical consequences of road accidents but also includes a component for the pain, grief and suffering caused by road accidents. The WTP method, on the other hand, considers the value of prevention, i.e. how much people would pay to avoid an accident altogether, and accordingly produces much higher cost estimates than the Lost Output Method. WTP has only been used in motorised countries and the Lost Output method has traditionally been recommended for motorising countries whose primary objective is maximising national economic growth. Lost Output methods can be further classified into Gross and Net Lost Output. As can be surmised, the Net Lost Output subtracts an estimate of personal consumption from the expected lost earnings of a road traffic accident (RTA) fatality. While Net Lost Output was used for the first few years of accident costing in the UK (1968-71), most countries rely on the Gross Output Method. It should be noted that the current UK WTP approach calculates foregone production using the net lost output method and assumes all foregone pleasure to be represented in the Human Costs Component. For further background reference on the different accident costing methods, please refer to the TRL publication Overseas Road Note 10. 5.1.3 Other Work in Bangladesh

Economics Circle RHD RHD Road User Cost Institutional Development Component Annual Report for FY 1999/2000
December 1999 Page 29 of 37
There had been little rigorous research into estimating accident costs in Bangladesh. The most recent estimates we are aware of are in the Road Materials and Standards Study (RMSS-Howard Humphreys et al, 1994). This analysis estimated the average cost of an injury RTA to be approximately Taka 228,000 in 1992 prices (US$6444). This costing analysis was basically a “desk exercise” but hospital surveys were conducted to identify the total number of RTA and related casualties, rather than just those police reported. The two main cost components were identified as lost output (45%) and vehicle related damage (40%), which included both vehicle damage and loss of business. Dr Jobair Bin Alam of the Bangladesh University of Engineering and Technology (BUET) is also currently researching accident costs. However, despite initial approaches regarding co-operation in July 1998 no liaison was achieved. 5.2 Estimating the Number of Road Traffic Accidents As most injury RTA include more than one casualty, RTA costing is traditionally divided into casualty related costs (lost output, medical costs, pain, grief and suffering) and event related costs (property damage and administration costs.) RTA casualties are classified in three basic categories:
• Fatalities are limited to deaths occurring from and within 30 days of the RTA • Serious injuries include injuries which require hospitalisation, i.e. an overnight
stay in a hospital, to those RTA related deaths occurring after the first 30 days. • Slight injuries are those which require medical treatment but not hospitalisation.
The total cost of road accidents should include both reported and unreported road accidents and not be limited to those officially reported, as all accidents incur costs. While widescale under-reporting of simple RTA is accepted by all, many, including the Bangladesh Police, believe that fatal and grievous RTA are well reported. This has not been found to be the case as: • Hospital records show many more RTA inpatients being treated than reported by police.
Assume over 4000 being hospitalised for RTA in DMP alone and while this is equivalent to national figures for grievous injuries, DMP is reported at only accounting for only 24% RTA and 13% of injuries.
• Comparison with those DMP fatal RTA reported in one newspaper during 1996 and 1997 found that approximately 30% of fatal RTA newspaper reported RTA were not in the DMP MAAP database (including one where 9 killed in truck accident in Demra).
• Manual reporting system is prone to inaccuracy as seen by Police Headquarters reporting different RTA and casualty figures than in MAAP. Police Headquarters reported over 30% more injury road accidents but approximately 30% less RTA casualties in Dhaka than did the computerised MAAP system.
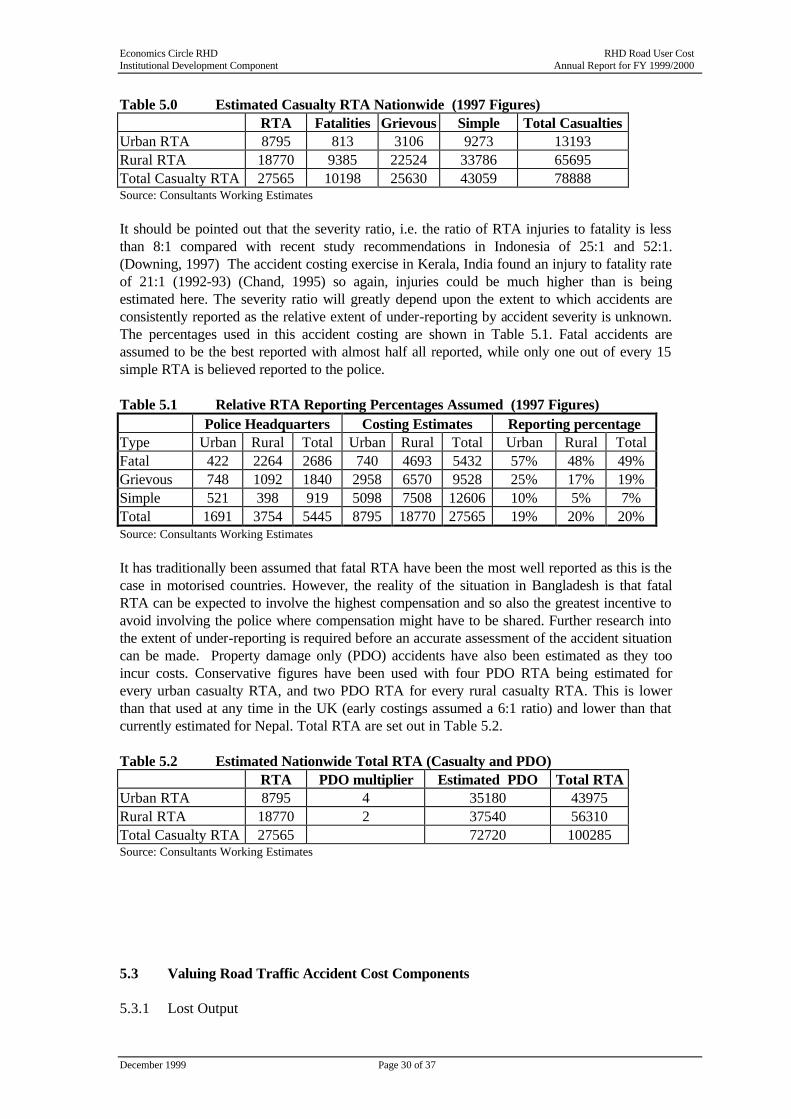
Accordingly, it was assumed that only 20% of casualty RTA are included in the official police accident statistics for DMP. Conservative assumptions were made and it is possible that the actual figure is twice as large and only 10% casualty RTA are being officially recorded. It was decided to use the top end of the range as a starting point. It was also assumed that the level of under-reporting was consistent throughout Bangladesh. While under-reporting tends to be worse in rural areas, the accident data from the Ranges was more consistent than the metropolitan areas and so the same under-reporting ratio has been a applied. The resultant estimate of casualty RTA is set out in Table 5.0.
Economics Circle RHD RHD Road User Cost Institutional Development Component Annual Report for FY 1999/2000
December 1999 Page 30 of 37
Table 5.0 Estimated Casualty RTA Nationwide (1997 Figures) RTA Fatalities Grievous Simple Total Casualties Urban RTA 8795 813 3106 9273 13193 Rural RTA 18770 9385 22524 33786 65695 Total Casualty RTA 27565 10198 25630 43059 78888 Source: Consultants Working Estimates It should be pointed out that the severity ratio, i.e. the ratio of RTA injuries to fatality is less than 8:1 compared with recent study recommendations in Indonesia of 25:1 and 52:1. (Downing, 1997) The accident costing exercise in Kerala, India found an injury to fatality rate of 21:1 (1992-93) (Chand, 1995) so again, injuries could be much higher than is being estimated here. The severity ratio will greatly depend upon the extent to which accidents are consistently reported as the relative extent of under-reporting by accident severity is unknown. The percentages used in this accident costing are shown in Table 5.1. Fatal accidents are assumed to be the best reported with almost half all reported, while only one out of every 15 simple RTA is believed reported to the police. Table 5.1 Relative RTA Reporting Percentages Assumed (1997 Figures) Police Headquarters Costing Estimates Reporting percentage Type Urban Rural Total Urban Rural Total Urban Rural Total Fatal 422 2264 2686 740 4693 5432 57% 48% 49% Grievous 748 1092 1840 2958 6570 9528 25% 17% 19% Simple 521 398 919 5098 7508 12606 10% 5% 7% Total 1691 3754 5445 8795 18770 27565 19% 20% 20% Source: Consultants Working Estimates It has traditionally been assumed that fatal RTA have been the most well reported as this is the case in motorised countries. However, the reality of the situation in Bangladesh is that fatal RTA can be expected to involve the highest compensation and so also the greatest incentive to avoid involving the police where compensation might have to be shared. Further research into the extent of under-reporting is required before an accurate assessment of the accident situation can be made. Property damage only (PDO) accidents have also been estimated as they too incur costs. Conservative figures have been used with four PDO RTA being estimated for every urban casualty RTA, and two PDO RTA for every rural casualty RTA. This is lower than that used at any time in the UK (early costings assumed a 6:1 ratio) and lower than that currently estimated for Nepal. Total RTA are set out in Table 5.2. Table 5.2 Estimated Nationwide Total RTA (Casualty and PDO) RTA PDO multiplier Estimated PDO Total RTA Urban RTA 8795 4 35180 43975 Rural RTA 18770 2 37540 56310 Total Casualty RTA 27565 72720 100285 Source: Consultants Working Estimates 5.3 Valuing Road Traffic Accident Cost Components 5.3.1 Lost Output
Economics Circle RHD RHD Road User Cost Institutional Development Component Annual Report for FY 1999/2000
December 1999 Page 31 of 37
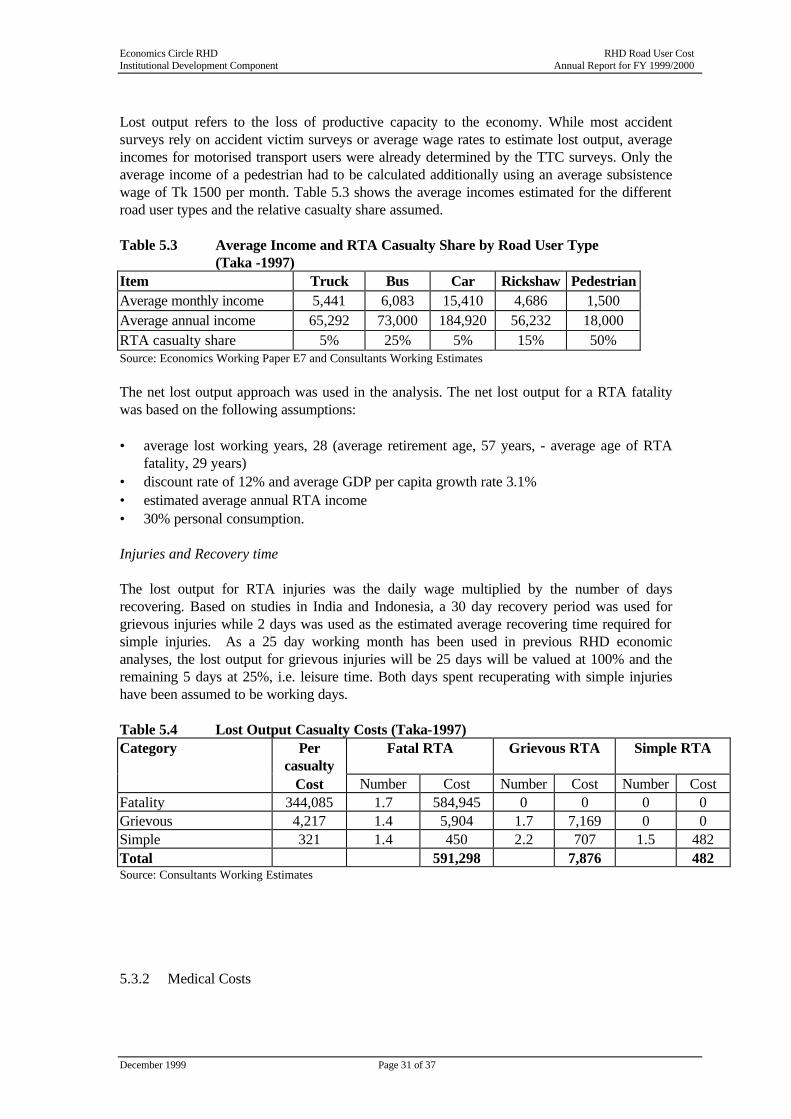
Lost output refers to the loss of productive capacity to the economy. While most accident surveys rely on accident victim surveys or average wage rates to estimate lost output, average incomes for motorised transport users were already determined by the TTC surveys. Only the average income of a pedestrian had to be calculated additionally using an average subsistence wage of Tk 1500 per month. Table 5.3 shows the average incomes estimated for the different road user types and the relative casualty share assumed. Table 5.3 Average Income and RTA Casualty Share by Road User Type (Taka -1997) Item Truck Bus Car Rickshaw Pedestrian Average monthly income 5,441 6,083 15,410 4,686 1,500 Average annual income 65,292 73,000 184,920 56,232 18,000 RTA casualty share 5% 25% 5% 15% 50% Source: Economics Working Paper E7 and Consultants Working Estimates The net lost output approach was used in the analysis. The net lost output for a RTA fatality was based on the following assumptions: • average lost working years, 28 (average retirement age, 57 years, - average age of RTA
fatality, 29 years) • discount rate of 12% and average GDP per capita growth rate 3.1% • estimated average annual RTA income • 30% personal consumption. Injuries and Recovery time The lost output for RTA injuries was the daily wage multiplied by the number of days recovering. Based on studies in India and Indonesia, a 30 day recovery period was used for grievous injuries while 2 days was used as the estimated average recovering time required for simple injuries. As a 25 day working month has been used in previous RHD economic analyses, the lost output for grievous injuries will be 25 days will be valued at 100% and the remaining 5 days at 25%, i.e. leisure time. Both days spent recuperating with simple injuries have been assumed to be working days. Table 5.4 Lost Output Casualty Costs (Taka-1997) Category Per
casualty Fatal RTA Grievous RTA Simple RTA
Cost Number Cost Number Cost Number Cost Fatality 344,085 1.7 584,945 0 0 0 0 Grievous 4,217 1.4 5,904 1.7 7,169 0 0 Simple 321 1.4 450 2.2 707 1.5 482 Total 591,298 7,876 482 Source: Consultants Working Estimates 5.3.2 Medical Costs

Economics Circle RHD RHD Road User Cost Institutional Development Component Annual Report for FY 1999/2000
December 1999 Page 32 of 37
The standard cost components of medical services received by RTA casualties include: first aid and rescue services (ambulance), hospital costs (food and bed, operations, x rays, medicine, doctors services), and subsequent rehabilitation costs (treatment, prosthetics). Rescue services In Bangladesh, very few of RTA casualties are transported by ambulance services or receive first aid treatment as roadside first aid posts do not exist. Yet RTA casualties are still transported to medical centres or homes (the police usually transport the bodies of those who died at the scene) and these trips involve a cost. Given the lack of data on hospital transport costs, a token amount of Taka 100 is assigned to each RTA casualty to reflect transport cost. Hospital care Hospital costs are difficult to calculate and an average in-patient per day cost and average out-patient visit cost are the best working estimates believed possible. The Centre for the Rehabilitation of the Paralysed (CRP) estimates its monthly in-patient cost at Taka 12,000/month (up from 8000/month when costs first began being monitored in 1990). Using the CRP’s figure, an average in-patient per day cost of Taka 400 will be used. Average in-patient length of stay is not known for RTA casualties only and an average in-patient stay of 10 days is assumed. Outpatient visit costs are estimated at 25% of the in-patient per day and outpatient visits will refer to all casualty treatment services, whether hospital or private clinic administered. Table 5.5 Medical Costs per RTA Casualty (Taka-1997) Category Per
casualty Fatal RTA Grievous RTA Simple RTA
Cost Number Cost Number Cost Number Cost Fatality 100 1.7 170 0 0 0 0 Grievous 4,200 1.4 5,880 1.7 7,140 0 0 Simple 100 1.4 140 2.2 220 1.5 150 Total 6,190 7,360 150 Source: Consultants Working Estimates 5.3.3 Human Costs (Pain, Grief and Suffering) The Road User Cost Study conducted in India in the early 1980’s estimated PGS at 20 per cent of total lost output. This percentage has been maintained in subsequent Indian costings and was also adopted for the 1995 Nepal accident costing. It has been used in this analysis as a default value pending further research. As explained under Lost Output, the amount estimated for personal consumption (30% gross lost output) has been transferred to the traditional PGS Component. This is added to the 30 per cent proportion of lost output taken as the PGS component to give the cost set out in Table 5.6. The term “human costs” is used to refer to this expanded component. Table 5.6 Human Costs (Taka-1997) Category Per Fatal RTA Grievous RTA Simple RTA

Economics Circle RHD RHD Road User Cost Institutional Development Component Annual Report for FY 1999/2000
December 1999 Page 33 of 37
casualty Cost Number Cost Number Cost Number Cost Fatality 206,451 1.7 350,967 0 0 0 0 Grievous 2,530 1.4 3,542 1.7 4,301 0 0 Simple 193 1.4 270 2.2 424 1.5 289 Total 354,779 4,726 289 Source: Consultants Working Estimates 5.3.4 Vehicle Damage Costs In addition to vehicle damage, this component should also include other property damage costs and any lost business due to the vehicle being out of commission. Vehicle damage was known to be a major cost component and data was collected during the November 1998 survey of some one hundred vehicle operators in Dhaka by the Economics Circle. This data is summarised in Table 5.7. Table 5.7 Average Vehicle Damage Costs From 1998 Operators Survey
(Taka per vehicle-1998) Item Med
Truck Small Truck
Large Bus
Mini Bus
Utility Car Tempo Baby Taxi
Mean
Damage 20,750 7,167 75,833 69,833 12,000 11,500 4,914 2,917 29,370 Lost earnings 9,000 1,167 33,667 58,889 0 8,200 3,021 1,081 18,224 Total Costs 29,750 8,333 109,500 128,722 12,000 19,700 7,936 3,998 47,594 Source: Economics Circle. 1998 Vehicle Operators Survey In addition, vehicle claim data was provided by one large private insurance company which found the 1997 average vehicle damage claim cost was Taka 43,500 (265 claims). Given the uncertainty regarding the proportions of vehicles involved in an average accident it was decided to adopt an interim average vehicle damage and loss of earnings cost at this stage. A value of Taka 50,000 per simple accident was therefore adopted which accords with the average values from the operators survey and the insurance company. The average vehicle related cost was weighted so that grievous and fatal accidents cost 1.5 and 2 times more than simple accidents. Table 5.8 sets out the resultant costs. Table 5.8 Average Vehicle Related Costs per Accident (Taka-1998) Severity Unit costs Fatal 100,000 Grievous 75,000 Simple 50,000 PDO 2,500 Source: Consultants Working Estimates 5.3.5 Administrative Costs Administrative costs include the “handling costs” incurred by police, insurance companies and courts in investigation road accidents as well as prosecution and the settlement of insurance claims. Related police activity includes at the scene efforts as well as the initial reporting and any subsequent investigation and prosecution. This could include the officer in charge, the accident investigator, the vehicle examiner, and the Coroner’s office. Given the level of under-reporting, the relatively few vehicle insurance claims, and the small number believed to go through the legal system, administrative costs are not assumed to be worth surveying in Bangladesh. However, as it is believed that many, if not most of accidents
Economics Circle RHD RHD Road User Cost Institutional Development Component Annual Report for FY 1999/2000
December 1999 Page 34 of 37
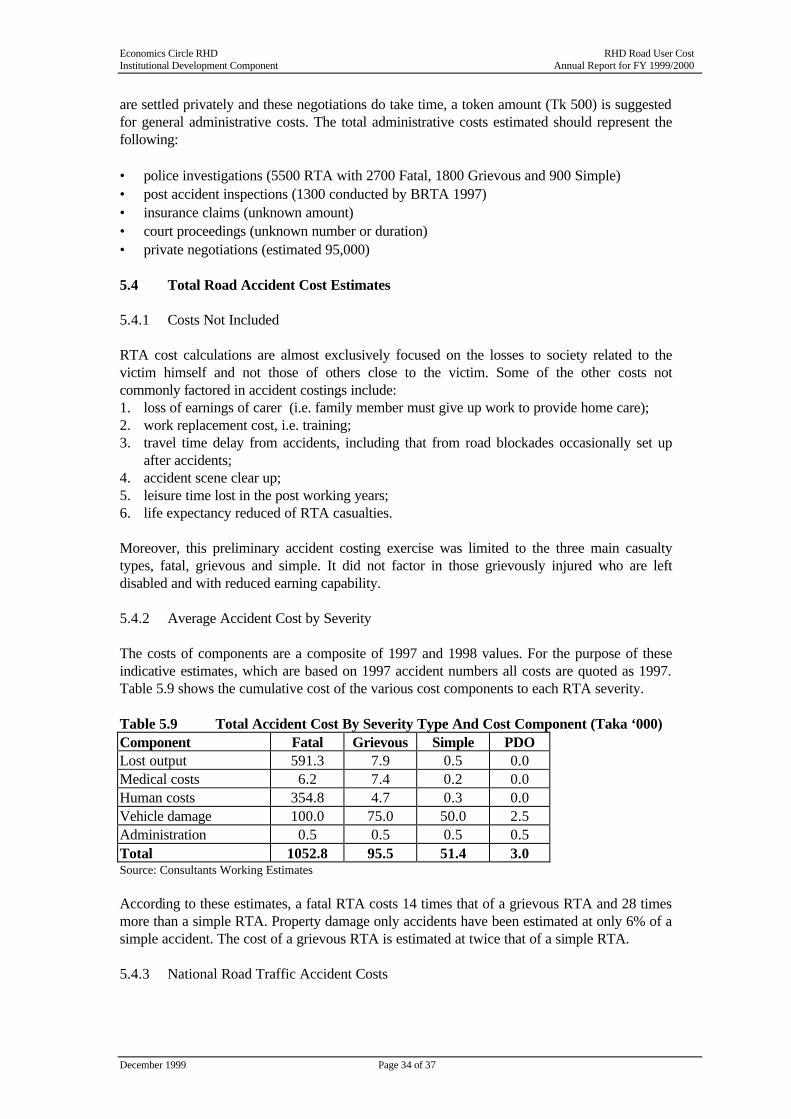
are settled privately and these negotiations do take time, a token amount (Tk 500) is suggested for general administrative costs. The total administrative costs estimated should represent the following: • police investigations (5500 RTA with 2700 Fatal, 1800 Grievous and 900 Simple) • post accident inspections (1300 conducted by BRTA 1997) • insurance claims (unknown amount) • court proceedings (unknown number or duration) • private negotiations (estimated 95,000) 5.4 Total Road Accident Cost Estimates 5.4.1 Costs Not Included RTA cost calculations are almost exclusively focused on the losses to society related to the victim himself and not those of others close to the victim. Some of the other costs not commonly factored in accident costings include: 1. loss of earnings of carer (i.e. family member must give up work to provide home care); 2. work replacement cost, i.e. training; 3. travel time delay from accidents, including that from road blockades occasionally set up
after accidents; 4. accident scene clear up; 5. leisure time lost in the post working years; 6. life expectancy reduced of RTA casualties. Moreover, this preliminary accident costing exercise was limited to the three main casualty types, fatal, grievous and simple. It did not factor in those grievously injured who are left disabled and with reduced earning capability. 5.4.2 Average Accident Cost by Severity The costs of components are a composite of 1997 and 1998 values. For the purpose of these indicative estimates, which are based on 1997 accident numbers all costs are quoted as 1997. Table 5.9 shows the cumulative cost of the various cost components to each RTA severity. Table 5.9 Total Accident Cost By Severity Type And Cost Component (Taka ‘000) Component Fatal Grievous Simple PDO Lost output 591.3 7.9 0.5 0.0 Medical costs 6.2 7.4 0.2 0.0 Human costs 354.8 4.7 0.3 0.0 Vehicle damage 100.0 75.0 50.0 2.5 Administration 0.5 0.5 0.5 0.5 Total 1052.8 95.5 51.4 3.0 Source: Consultants Working Estimates According to these estimates, a fatal RTA costs 14 times that of a grievous RTA and 28 times more than a simple RTA. Property damage only accidents have been estimated at only 6% of a simple accident. The cost of a grievous RTA is estimated at twice that of a simple RTA. 5.4.3 National Road Traffic Accident Costs

Economics Circle RHD RHD Road User Cost Institutional Development Component Annual Report for FY 1999/2000
December 1999 Page 35 of 37
Table 5.10 sets out the sum of all accident cost components for the total number of estimated accidents in 1997. The total cost of all road accidents, including PDO, has been conservatively estimated at Tk 7,495 million (Tk 750 Crore or US$153 million). The vast majority of the costs are due to casualty accidents with property damage only accidents accounting for less than 2.5 per cent of total costs. Table 5.10 Annual National RTA Costs For 1997 (Taka) Item No. of
Accidents Ave. Cost per accident (‘000)
Total Cost (million)
Fatal RTA 5,432 1,053 5,719 Grievous RTA 9,528 95 910 Simple RTA 12,606 51 648 Total casualty RTA 27,565 7,276 PDO RTA 72,720 3 218 Total RTA 100,285 7,495 Average RTA 0.27 Source: Consultants Working Estimates The average RTA is estimated to cost Tk 270,000 (US$ 5,510). The total national accident cost is equal to 0.5 per cent of Gross National Product in 1997 (see Table 5.11.) This is less than the previously assumed global amount of 1 per cent. However, when it is considered that the whole analysis was based on conservative assumptions this amount is almost certainly the minimum cost to society. The true cost is probably much closer to the one per cent estimate and represents a totally unacceptable waste of life and Bangladesh’s scarce resources. Table 5.11 Annual Accident Costs and Gross National Product Item Taka Million US$ Million Annual Accident Costs 7,495 153 Gross National Product 1,616,309 32,986 Accident Costs%GNP 0.5% 0.5% Source: Consultants Working Estimates Note: US$1=49 Taka 5.5 Conclusions And Recommendations 5.5.1 Significance of This Findings Many assumptions were required with this accident costing and this analysis is intended to promote discussion, which will confirm or correct these assumptions. However, the analysis had proved that accident costs are very significant in Bangladesh and represent a very real drain on its resources. As traffic volumes and the population increases these costs will undoubtedly increase. Immediate action is required to address the accident problem in Bangladesh if the scale of the losses is not to hold back development and result in an unacceptable loss of human life. 5.5.2 Areas for Further Research A main area of work in this accident costing was the estimation of the actual number of road accidents. Further research is required on this fundamental problem as an accurate assessment of the overall accident situation is not yet possible. More research is also required on all the cost components and in particular vehicle damage costs and loss of earnings.

Economics Circle RHD RHD Road User Cost Institutional Development Component Annual Report for FY 1999/2000
December 1999 Page 36 of 37
5.5.3 Application of Accident Costs A great deal of work is needed on researching the relationships between accident rates, driver behaviour and road design. Without this knowledge it will not be possible to apply accident costs in the economic appraisal of road maintenance and development projects. It is hoped that the accident reporting system introduced under IDC using the MAAP5 accident analysis software will provide the data to derive these relationships. This will be a longer-term exercise, as a reliable time series of data will have to be recorded before realistic relationships can be established. 5.5.4 The Way Forward At the time of publication a major research project by the Transport Research Laboratory of the United Kingdom is under consideration. This would review accident costing methodologies used in less developed countries and conduct case-studies in a few selected countries. At the present time Bangladesh is a candidate for a case study and it is intended that this work will form the basis for the updating of the preliminary work in this report.
Economics Circle RHD RHD Road User Cost Institutional Development Component Annual Report for FY 1999/2000
December 1999 Page 37 of 37
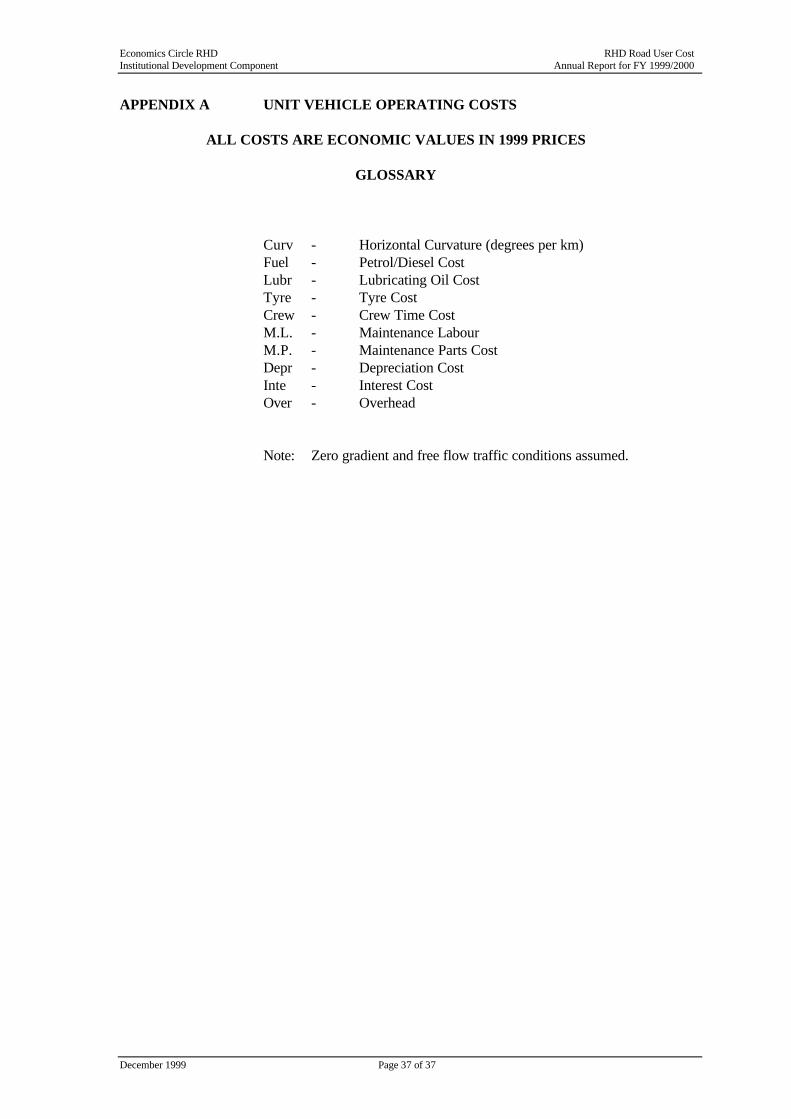
APPENDIX A UNIT VEHICLE OPERATING COSTS
ALL COSTS ARE ECONOMIC VALUES IN 1999 PRICES
GLOSSARY Curv - Horizontal Curvature (degrees per km) Fuel - Petrol/Diesel Cost Lubr - Lubricating Oil Cost Tyre - Tyre Cost Crew - Crew Time Cost M.L. - Maintenance Labour M.P. - Maintenance Parts Cost Depr - Depreciation Cost Inte - Interest Cost Over - Overhead Note: Zero gradient and free flow traffic conditions assumed.
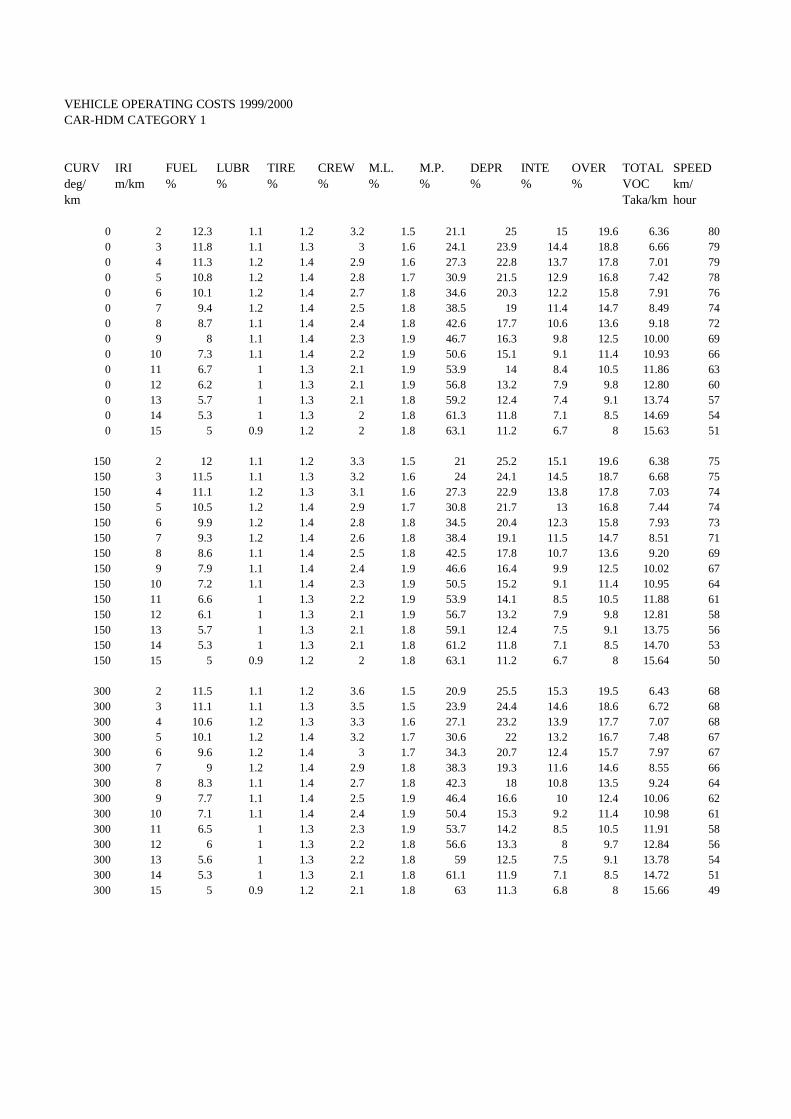
VEHICLE OPERATING COSTS 1999/2000CAR-HDM CATEGORY 1
CURV IRI FUEL LUBR TIRE CREW M.L. M.P. DEPR INTE OVER TOTAL SPEEDdeg/ m/km % % % % % % % % % VOC km/km Taka/km hour
0 2 12.3 1.1 1.2 3.2 1.5 21.1 25 15 19.6 6.36 800 3 11.8 1.1 1.3 3 1.6 24.1 23.9 14.4 18.8 6.66 790 4 11.3 1.2 1.4 2.9 1.6 27.3 22.8 13.7 17.8 7.01 790 5 10.8 1.2 1.4 2.8 1.7 30.9 21.5 12.9 16.8 7.42 780 6 10.1 1.2 1.4 2.7 1.8 34.6 20.3 12.2 15.8 7.91 760 7 9.4 1.2 1.4 2.5 1.8 38.5 19 11.4 14.7 8.49 740 8 8.7 1.1 1.4 2.4 1.8 42.6 17.7 10.6 13.6 9.18 720 9 8 1.1 1.4 2.3 1.9 46.7 16.3 9.8 12.5 10.00 690 10 7.3 1.1 1.4 2.2 1.9 50.6 15.1 9.1 11.4 10.93 660 11 6.7 1 1.3 2.1 1.9 53.9 14 8.4 10.5 11.86 630 12 6.2 1 1.3 2.1 1.9 56.8 13.2 7.9 9.8 12.80 600 13 5.7 1 1.3 2.1 1.8 59.2 12.4 7.4 9.1 13.74 570 14 5.3 1 1.3 2 1.8 61.3 11.8 7.1 8.5 14.69 540 15 5 0.9 1.2 2 1.8 63.1 11.2 6.7 8 15.63 51
150 2 12 1.1 1.2 3.3 1.5 21 25.2 15.1 19.6 6.38 75150 3 11.5 1.1 1.3 3.2 1.6 24 24.1 14.5 18.7 6.68 75150 4 11.1 1.2 1.3 3.1 1.6 27.3 22.9 13.8 17.8 7.03 74150 5 10.5 1.2 1.4 2.9 1.7 30.8 21.7 13 16.8 7.44 74150 6 9.9 1.2 1.4 2.8 1.8 34.5 20.4 12.3 15.8 7.93 73150 7 9.3 1.2 1.4 2.6 1.8 38.4 19.1 11.5 14.7 8.51 71150 8 8.6 1.1 1.4 2.5 1.8 42.5 17.8 10.7 13.6 9.20 69150 9 7.9 1.1 1.4 2.4 1.9 46.6 16.4 9.9 12.5 10.02 67150 10 7.2 1.1 1.4 2.3 1.9 50.5 15.2 9.1 11.4 10.95 64150 11 6.6 1 1.3 2.2 1.9 53.9 14.1 8.5 10.5 11.88 61150 12 6.1 1 1.3 2.1 1.9 56.7 13.2 7.9 9.8 12.81 58150 13 5.7 1 1.3 2.1 1.8 59.1 12.4 7.5 9.1 13.75 56150 14 5.3 1 1.3 2.1 1.8 61.2 11.8 7.1 8.5 14.70 53150 15 5 0.9 1.2 2 1.8 63.1 11.2 6.7 8 15.64 50
300 2 11.5 1.1 1.2 3.6 1.5 20.9 25.5 15.3 19.5 6.43 68300 3 11.1 1.1 1.3 3.5 1.5 23.9 24.4 14.6 18.6 6.72 68300 4 10.6 1.2 1.3 3.3 1.6 27.1 23.2 13.9 17.7 7.07 68300 5 10.1 1.2 1.4 3.2 1.7 30.6 22 13.2 16.7 7.48 67300 6 9.6 1.2 1.4 3 1.7 34.3 20.7 12.4 15.7 7.97 67300 7 9 1.2 1.4 2.9 1.8 38.3 19.3 11.6 14.6 8.55 66300 8 8.3 1.1 1.4 2.7 1.8 42.3 18 10.8 13.5 9.24 64300 9 7.7 1.1 1.4 2.5 1.9 46.4 16.6 10 12.4 10.06 62300 10 7.1 1.1 1.4 2.4 1.9 50.4 15.3 9.2 11.4 10.98 61300 11 6.5 1 1.3 2.3 1.9 53.7 14.2 8.5 10.5 11.91 58300 12 6 1 1.3 2.2 1.8 56.6 13.3 8 9.7 12.84 56300 13 5.6 1 1.3 2.2 1.8 59 12.5 7.5 9.1 13.78 54300 14 5.3 1 1.3 2.1 1.8 61.1 11.9 7.1 8.5 14.72 51300 15 5 0.9 1.2 2.1 1.8 63 11.3 6.8 8 15.66 49
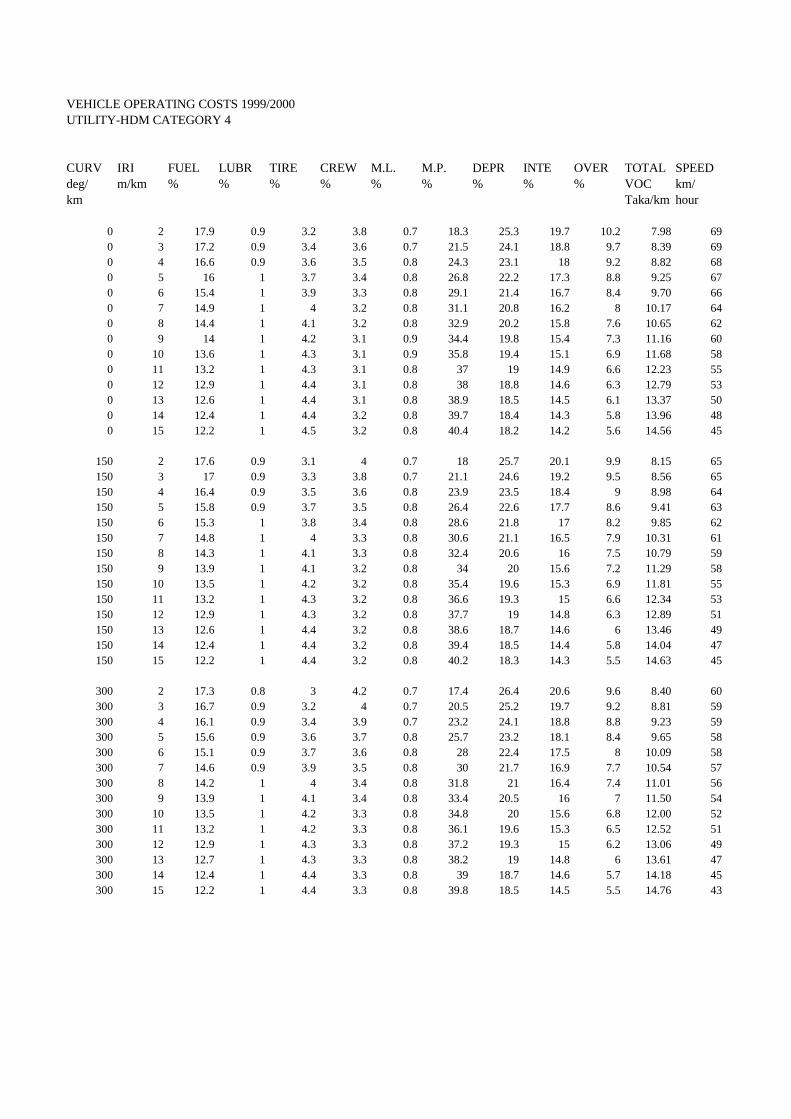
VEHICLE OPERATING COSTS 1999/2000UTILITY-HDM CATEGORY 4
CURV IRI FUEL LUBR TIRE CREW M.L. M.P. DEPR INTE OVER TOTAL SPEEDdeg/ m/km % % % % % % % % % VOC km/km Taka/km hour
0 2 17.9 0.9 3.2 3.8 0.7 18.3 25.3 19.7 10.2 7.98 690 3 17.2 0.9 3.4 3.6 0.7 21.5 24.1 18.8 9.7 8.39 690 4 16.6 0.9 3.6 3.5 0.8 24.3 23.1 18 9.2 8.82 680 5 16 1 3.7 3.4 0.8 26.8 22.2 17.3 8.8 9.25 670 6 15.4 1 3.9 3.3 0.8 29.1 21.4 16.7 8.4 9.70 660 7 14.9 1 4 3.2 0.8 31.1 20.8 16.2 8 10.17 640 8 14.4 1 4.1 3.2 0.8 32.9 20.2 15.8 7.6 10.65 620 9 14 1 4.2 3.1 0.9 34.4 19.8 15.4 7.3 11.16 600 10 13.6 1 4.3 3.1 0.9 35.8 19.4 15.1 6.9 11.68 580 11 13.2 1 4.3 3.1 0.8 37 19 14.9 6.6 12.23 550 12 12.9 1 4.4 3.1 0.8 38 18.8 14.6 6.3 12.79 530 13 12.6 1 4.4 3.1 0.8 38.9 18.5 14.5 6.1 13.37 500 14 12.4 1 4.4 3.2 0.8 39.7 18.4 14.3 5.8 13.96 480 15 12.2 1 4.5 3.2 0.8 40.4 18.2 14.2 5.6 14.56 45
150 2 17.6 0.9 3.1 4 0.7 18 25.7 20.1 9.9 8.15 65150 3 17 0.9 3.3 3.8 0.7 21.1 24.6 19.2 9.5 8.56 65150 4 16.4 0.9 3.5 3.6 0.8 23.9 23.5 18.4 9 8.98 64150 5 15.8 0.9 3.7 3.5 0.8 26.4 22.6 17.7 8.6 9.41 63150 6 15.3 1 3.8 3.4 0.8 28.6 21.8 17 8.2 9.85 62150 7 14.8 1 4 3.3 0.8 30.6 21.1 16.5 7.9 10.31 61150 8 14.3 1 4.1 3.3 0.8 32.4 20.6 16 7.5 10.79 59150 9 13.9 1 4.1 3.2 0.8 34 20 15.6 7.2 11.29 58150 10 13.5 1 4.2 3.2 0.8 35.4 19.6 15.3 6.9 11.81 55150 11 13.2 1 4.3 3.2 0.8 36.6 19.3 15 6.6 12.34 53150 12 12.9 1 4.3 3.2 0.8 37.7 19 14.8 6.3 12.89 51150 13 12.6 1 4.4 3.2 0.8 38.6 18.7 14.6 6 13.46 49150 14 12.4 1 4.4 3.2 0.8 39.4 18.5 14.4 5.8 14.04 47150 15 12.2 1 4.4 3.2 0.8 40.2 18.3 14.3 5.5 14.63 45
300 2 17.3 0.8 3 4.2 0.7 17.4 26.4 20.6 9.6 8.40 60300 3 16.7 0.9 3.2 4 0.7 20.5 25.2 19.7 9.2 8.81 59300 4 16.1 0.9 3.4 3.9 0.7 23.2 24.1 18.8 8.8 9.23 59300 5 15.6 0.9 3.6 3.7 0.8 25.7 23.2 18.1 8.4 9.65 58300 6 15.1 0.9 3.7 3.6 0.8 28 22.4 17.5 8 10.09 58300 7 14.6 0.9 3.9 3.5 0.8 30 21.7 16.9 7.7 10.54 57300 8 14.2 1 4 3.4 0.8 31.8 21 16.4 7.4 11.01 56300 9 13.9 1 4.1 3.4 0.8 33.4 20.5 16 7 11.50 54300 10 13.5 1 4.2 3.3 0.8 34.8 20 15.6 6.8 12.00 52300 11 13.2 1 4.2 3.3 0.8 36.1 19.6 15.3 6.5 12.52 51300 12 12.9 1 4.3 3.3 0.8 37.2 19.3 15 6.2 13.06 49300 13 12.7 1 4.3 3.3 0.8 38.2 19 14.8 6 13.61 47300 14 12.4 1 4.4 3.3 0.8 39 18.7 14.6 5.7 14.18 45300 15 12.2 1 4.4 3.3 0.8 39.8 18.5 14.5 5.5 14.76 43

VEHICLE OPERATING COSTS 1999/2000MICRO BUS-HDM CATEGORY 4
CURV IRI FUEL LUBR TIRE CREW M.L. M.P. DEPR INTE OVER TOTAL SPEEDdeg/ m/km % % % % % % % % % VOC km/km Taka/km hour
0 2 32.1 1.7 1.2 5 1.3 10.1 21.4 12.9 14.2 4.08 780 3 31.1 1.8 1.3 4.8 1.4 12.6 20.7 12.4 13.7 4.24 780 4 30 1.9 1.4 4.7 1.6 15.6 19.9 11.9 13.1 4.44 770 5 28.5 1.9 1.5 4.5 1.7 19.1 19 11.4 12.4 4.70 750 6 26.9 1.9 1.5 4.3 1.9 23.2 18 10.8 11.6 5.02 730 7 25 1.8 1.5 4.1 2 27.8 16.9 10.2 10.7 5.44 710 8 23 1.8 1.4 3.9 2.1 32.9 15.8 9.5 9.7 5.97 680 9 20.9 1.7 1.4 3.7 2.2 38.3 14.5 8.7 8.7 6.65 650 10 18.9 1.6 1.3 3.5 2.2 43.5 13.3 8 7.8 7.46 620 11 17.3 1.5 1.3 3.3 2.2 47.6 12.3 7.4 7 8.28 580 12 16.1 1.4 1.2 3.2 2.2 51 11.6 6.9 6.4 9.11 550 13 15.1 1.4 1.2 3.1 2.2 53.8 11 6.6 5.8 9.94 520 14 14.3 1.3 1.1 3 2.1 56.1 10.4 6.3 5.4 10.78 490 15 13.6 1.3 1.1 2.9 2.1 58 10 6 5 11.63 47
150 2 31.3 1.7 1.2 5.4 1.3 9.9 22.1 13.2 14 4.15 72150 3 30.4 1.8 1.3 5.2 1.4 12.4 21.3 12.8 13.4 4.31 71150 4 29.3 1.8 1.4 5 1.6 15.4 20.4 12.3 12.8 4.51 71150 5 28 1.8 1.4 4.8 1.7 18.8 19.5 11.7 12.2 4.77 69150 6 26.5 1.8 1.5 4.6 1.8 22.9 18.5 11.1 11.4 5.10 68150 7 24.7 1.8 1.5 4.4 2 27.4 17.3 10.4 10.5 5.51 66150 8 22.8 1.7 1.4 4.1 2.1 32.5 16.1 9.6 9.6 6.04 64150 9 20.8 1.7 1.4 3.9 2.1 37.9 14.8 8.9 8.6 6.72 62150 10 18.9 1.6 1.3 3.6 2.2 43.1 13.5 8.1 7.7 7.52 59150 11 17.4 1.5 1.2 3.4 2.2 47.3 12.5 7.5 7 8.34 56150 12 16.1 1.4 1.2 3.3 2.2 50.7 11.7 7 6.3 9.16 54150 13 15.1 1.3 1.2 3.1 2.2 53.5 11.1 6.6 5.8 9.99 51150 14 14.3 1.3 1.1 3.1 2.1 55.9 10.5 6.3 5.4 10.83 48150 15 13.6 1.2 1.1 3 2.1 57.8 10.1 6 5 11.67 46
300 2 30.5 1.7 1.2 5.9 1.2 9.6 22.7 13.6 13.6 4.28 64300 3 29.7 1.7 1.3 5.7 1.4 12 22 13.2 13.1 4.44 64300 4 28.7 1.8 1.3 5.5 1.5 14.9 21.1 12.7 12.5 4.64 63300 5 27.5 1.8 1.4 5.2 1.7 18.4 20.1 12.1 11.9 4.89 63300 6 26.1 1.8 1.4 5 1.8 22.4 19 11.4 11.1 5.22 62300 7 24.5 1.8 1.4 4.7 1.9 26.9 17.8 10.7 10.3 5.63 60300 8 22.7 1.7 1.4 4.4 2 31.9 16.5 9.9 9.4 6.15 59300 9 20.8 1.6 1.3 4.1 2.1 37.3 15.2 9.1 8.5 6.82 57300 10 18.9 1.5 1.3 3.8 2.2 42.5 13.9 8.3 7.6 7.62 55300 11 17.4 1.5 1.2 3.6 2.2 46.8 12.8 7.7 6.9 8.43 53300 12 16.2 1.4 1.2 3.4 2.2 50.2 12 7.2 6.3 9.25 51300 13 15.2 1.3 1.2 3.3 2.1 53.1 11.3 6.8 5.8 10.07 49300 14 14.4 1.3 1.1 3.1 2.1 55.5 10.7 6.4 5.3 10.90 47300 15 13.7 1.2 1.1 3.1 2.1 57.5 10.2 6.1 4.9 11.74 45
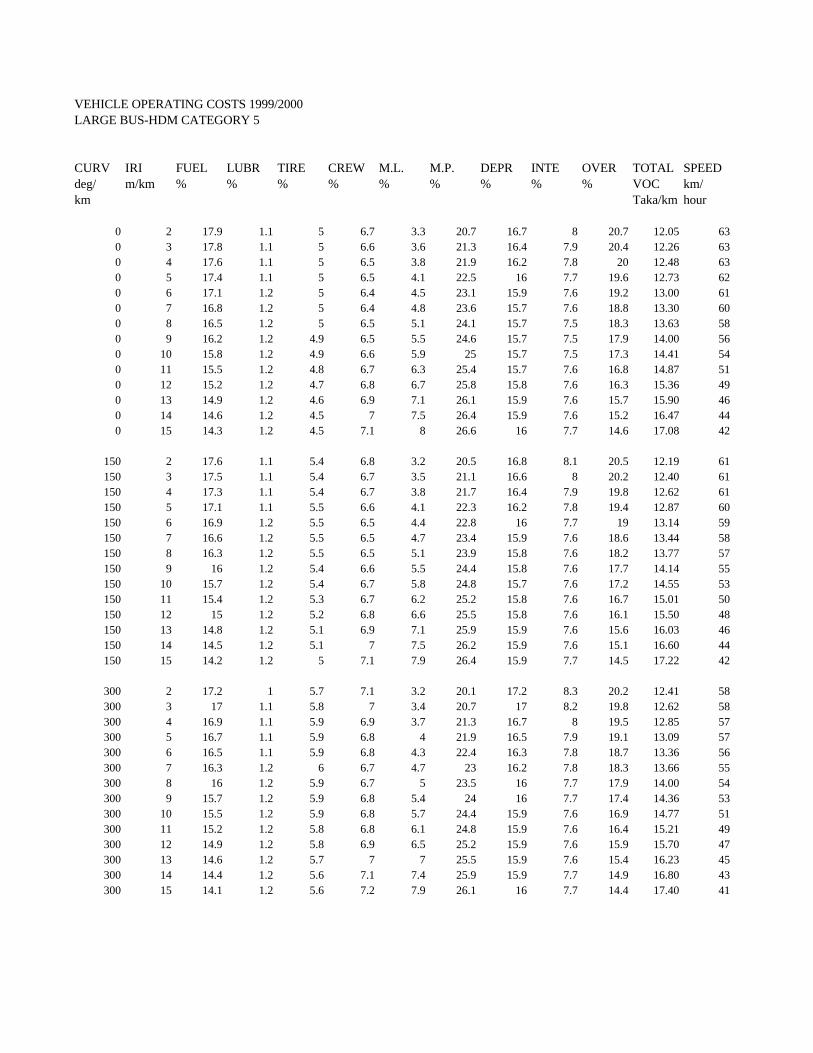
VEHICLE OPERATING COSTS 1999/2000LARGE BUS-HDM CATEGORY 5
CURV IRI FUEL LUBR TIRE CREW M.L. M.P. DEPR INTE OVER TOTAL SPEEDdeg/ m/km % % % % % % % % % VOC km/km Taka/km hour
0 2 17.9 1.1 5 6.7 3.3 20.7 16.7 8 20.7 12.05 630 3 17.8 1.1 5 6.6 3.6 21.3 16.4 7.9 20.4 12.26 630 4 17.6 1.1 5 6.5 3.8 21.9 16.2 7.8 20 12.48 630 5 17.4 1.1 5 6.5 4.1 22.5 16 7.7 19.6 12.73 620 6 17.1 1.2 5 6.4 4.5 23.1 15.9 7.6 19.2 13.00 610 7 16.8 1.2 5 6.4 4.8 23.6 15.7 7.6 18.8 13.30 600 8 16.5 1.2 5 6.5 5.1 24.1 15.7 7.5 18.3 13.63 580 9 16.2 1.2 4.9 6.5 5.5 24.6 15.7 7.5 17.9 14.00 560 10 15.8 1.2 4.9 6.6 5.9 25 15.7 7.5 17.3 14.41 540 11 15.5 1.2 4.8 6.7 6.3 25.4 15.7 7.6 16.8 14.87 510 12 15.2 1.2 4.7 6.8 6.7 25.8 15.8 7.6 16.3 15.36 490 13 14.9 1.2 4.6 6.9 7.1 26.1 15.9 7.6 15.7 15.90 460 14 14.6 1.2 4.5 7 7.5 26.4 15.9 7.6 15.2 16.47 440 15 14.3 1.2 4.5 7.1 8 26.6 16 7.7 14.6 17.08 42
150 2 17.6 1.1 5.4 6.8 3.2 20.5 16.8 8.1 20.5 12.19 61150 3 17.5 1.1 5.4 6.7 3.5 21.1 16.6 8 20.2 12.40 61150 4 17.3 1.1 5.4 6.7 3.8 21.7 16.4 7.9 19.8 12.62 61150 5 17.1 1.1 5.5 6.6 4.1 22.3 16.2 7.8 19.4 12.87 60150 6 16.9 1.2 5.5 6.5 4.4 22.8 16 7.7 19 13.14 59150 7 16.6 1.2 5.5 6.5 4.7 23.4 15.9 7.6 18.6 13.44 58150 8 16.3 1.2 5.5 6.5 5.1 23.9 15.8 7.6 18.2 13.77 57150 9 16 1.2 5.4 6.6 5.5 24.4 15.8 7.6 17.7 14.14 55150 10 15.7 1.2 5.4 6.7 5.8 24.8 15.7 7.6 17.2 14.55 53150 11 15.4 1.2 5.3 6.7 6.2 25.2 15.8 7.6 16.7 15.01 50150 12 15 1.2 5.2 6.8 6.6 25.5 15.8 7.6 16.1 15.50 48150 13 14.8 1.2 5.1 6.9 7.1 25.9 15.9 7.6 15.6 16.03 46150 14 14.5 1.2 5.1 7 7.5 26.2 15.9 7.6 15.1 16.60 44150 15 14.2 1.2 5 7.1 7.9 26.4 15.9 7.7 14.5 17.22 42
300 2 17.2 1 5.7 7.1 3.2 20.1 17.2 8.3 20.2 12.41 58300 3 17 1.1 5.8 7 3.4 20.7 17 8.2 19.8 12.62 58300 4 16.9 1.1 5.9 6.9 3.7 21.3 16.7 8 19.5 12.85 57300 5 16.7 1.1 5.9 6.8 4 21.9 16.5 7.9 19.1 13.09 57300 6 16.5 1.1 5.9 6.8 4.3 22.4 16.3 7.8 18.7 13.36 56300 7 16.3 1.2 6 6.7 4.7 23 16.2 7.8 18.3 13.66 55300 8 16 1.2 5.9 6.7 5 23.5 16 7.7 17.9 14.00 54300 9 15.7 1.2 5.9 6.8 5.4 24 16 7.7 17.4 14.36 53300 10 15.5 1.2 5.9 6.8 5.7 24.4 15.9 7.6 16.9 14.77 51300 11 15.2 1.2 5.8 6.8 6.1 24.8 15.9 7.6 16.4 15.21 49300 12 14.9 1.2 5.8 6.9 6.5 25.2 15.9 7.6 15.9 15.70 47300 13 14.6 1.2 5.7 7 7 25.5 15.9 7.6 15.4 16.23 45300 14 14.4 1.2 5.6 7.1 7.4 25.9 15.9 7.7 14.9 16.80 43300 15 14.1 1.2 5.6 7.2 7.9 26.1 16 7.7 14.4 17.40 41
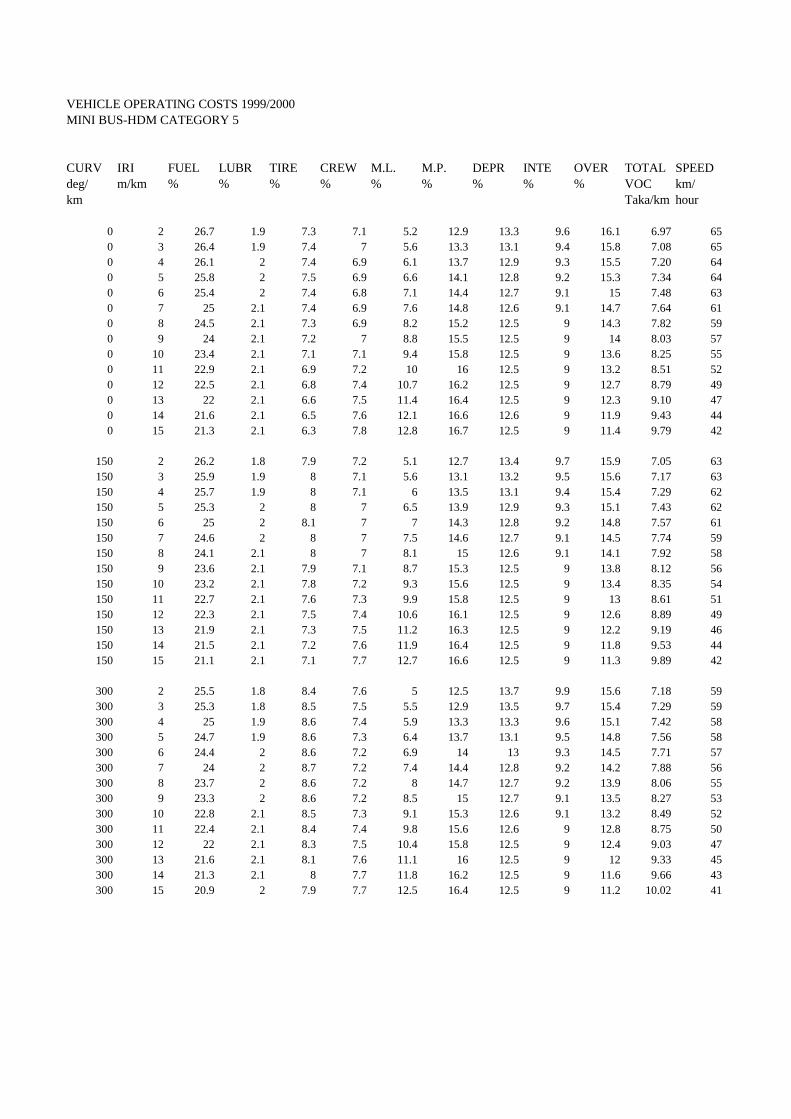
VEHICLE OPERATING COSTS 1999/2000MINI BUS-HDM CATEGORY 5
CURV IRI FUEL LUBR TIRE CREW M.L. M.P. DEPR INTE OVER TOTAL SPEEDdeg/ m/km % % % % % % % % % VOC km/km Taka/km hour
0 2 26.7 1.9 7.3 7.1 5.2 12.9 13.3 9.6 16.1 6.97 650 3 26.4 1.9 7.4 7 5.6 13.3 13.1 9.4 15.8 7.08 650 4 26.1 2 7.4 6.9 6.1 13.7 12.9 9.3 15.5 7.20 640 5 25.8 2 7.5 6.9 6.6 14.1 12.8 9.2 15.3 7.34 640 6 25.4 2 7.4 6.8 7.1 14.4 12.7 9.1 15 7.48 630 7 25 2.1 7.4 6.9 7.6 14.8 12.6 9.1 14.7 7.64 610 8 24.5 2.1 7.3 6.9 8.2 15.2 12.5 9 14.3 7.82 590 9 24 2.1 7.2 7 8.8 15.5 12.5 9 14 8.03 570 10 23.4 2.1 7.1 7.1 9.4 15.8 12.5 9 13.6 8.25 550 11 22.9 2.1 6.9 7.2 10 16 12.5 9 13.2 8.51 520 12 22.5 2.1 6.8 7.4 10.7 16.2 12.5 9 12.7 8.79 490 13 22 2.1 6.6 7.5 11.4 16.4 12.5 9 12.3 9.10 470 14 21.6 2.1 6.5 7.6 12.1 16.6 12.6 9 11.9 9.43 440 15 21.3 2.1 6.3 7.8 12.8 16.7 12.5 9 11.4 9.79 42
150 2 26.2 1.8 7.9 7.2 5.1 12.7 13.4 9.7 15.9 7.05 63150 3 25.9 1.9 8 7.1 5.6 13.1 13.2 9.5 15.6 7.17 63150 4 25.7 1.9 8 7.1 6 13.5 13.1 9.4 15.4 7.29 62150 5 25.3 2 8 7 6.5 13.9 12.9 9.3 15.1 7.43 62150 6 25 2 8.1 7 7 14.3 12.8 9.2 14.8 7.57 61150 7 24.6 2 8 7 7.5 14.6 12.7 9.1 14.5 7.74 59150 8 24.1 2.1 8 7 8.1 15 12.6 9.1 14.1 7.92 58150 9 23.6 2.1 7.9 7.1 8.7 15.3 12.5 9 13.8 8.12 56150 10 23.2 2.1 7.8 7.2 9.3 15.6 12.5 9 13.4 8.35 54150 11 22.7 2.1 7.6 7.3 9.9 15.8 12.5 9 13 8.61 51150 12 22.3 2.1 7.5 7.4 10.6 16.1 12.5 9 12.6 8.89 49150 13 21.9 2.1 7.3 7.5 11.2 16.3 12.5 9 12.2 9.19 46150 14 21.5 2.1 7.2 7.6 11.9 16.4 12.5 9 11.8 9.53 44150 15 21.1 2.1 7.1 7.7 12.7 16.6 12.5 9 11.3 9.89 42
300 2 25.5 1.8 8.4 7.6 5 12.5 13.7 9.9 15.6 7.18 59300 3 25.3 1.8 8.5 7.5 5.5 12.9 13.5 9.7 15.4 7.29 59300 4 25 1.9 8.6 7.4 5.9 13.3 13.3 9.6 15.1 7.42 58300 5 24.7 1.9 8.6 7.3 6.4 13.7 13.1 9.5 14.8 7.56 58300 6 24.4 2 8.6 7.2 6.9 14 13 9.3 14.5 7.71 57300 7 24 2 8.7 7.2 7.4 14.4 12.8 9.2 14.2 7.88 56300 8 23.7 2 8.6 7.2 8 14.7 12.7 9.2 13.9 8.06 55300 9 23.3 2 8.6 7.2 8.5 15 12.7 9.1 13.5 8.27 53300 10 22.8 2.1 8.5 7.3 9.1 15.3 12.6 9.1 13.2 8.49 52300 11 22.4 2.1 8.4 7.4 9.8 15.6 12.6 9 12.8 8.75 50300 12 22 2.1 8.3 7.5 10.4 15.8 12.5 9 12.4 9.03 47300 13 21.6 2.1 8.1 7.6 11.1 16 12.5 9 12 9.33 45300 14 21.3 2.1 8 7.7 11.8 16.2 12.5 9 11.6 9.66 43300 15 20.9 2 7.9 7.7 12.5 16.4 12.5 9 11.2 10.02 41

VEHICLE OPERATING COSTS 1999/2000SMALL TRUCK-HDM CATEGORY 7
CURV IRI FUEL LUBR TIRE CREW M.L. M.P. DEPR INTE OVER TOTAL SPEEDdeg/ m/km % % % % % % % % % VOC km/km Taka/km hour
0 2 21.2 1.3 13 3.9 3.3 6 18.6 8.9 23.8 7.14 640 3 20.5 1.4 12.8 3.8 3.8 8.2 17.9 8.6 22.9 7.42 640 4 19.9 1.4 12.7 3.7 4.2 10.3 17.4 8.4 22.1 7.70 630 5 19.3 1.4 12.5 3.7 4.5 12.3 17 8.1 21.3 7.99 620 6 18.8 1.4 12.3 3.6 4.7 14 16.6 8 20.5 8.29 600 7 18.3 1.4 12.1 3.6 4.9 15.7 16.4 7.9 19.8 8.60 580 8 17.9 1.5 11.8 3.6 5 17.2 16.2 7.8 19 8.94 560 9 17.6 1.5 11.6 3.6 5.2 18.5 16.1 7.7 18.3 9.29 530 10 17.3 1.5 11.3 3.7 5.2 19.7 16 7.7 17.6 9.65 510 11 17.1 1.5 11.1 3.7 5.3 20.8 16 7.7 16.9 10.04 480 12 16.9 1.5 10.9 3.8 5.3 21.8 15.9 7.7 16.3 10.44 450 13 16.7 1.5 10.7 3.9 5.3 22.6 16 7.7 15.7 10.85 430 14 16.6 1.5 10.5 3.9 5.3 23.4 16 7.7 15.1 11.28 400 15 16.6 1.5 10.3 4 5.3 24.1 16 7.7 14.5 11.71 38
150 2 20.7 1.3 14.1 4 3.2 5.8 18.7 9 23.2 7.33 61150 3 20.1 1.3 14 3.9 3.7 8 18 8.6 22.3 7.62 61150 4 19.5 1.4 13.8 3.8 4.1 10.1 17.5 8.4 21.5 7.90 60150 5 19 1.4 13.7 3.7 4.4 12 17 8.2 20.7 8.19 59150 6 18.5 1.4 13.5 3.7 4.6 13.7 16.6 8 20 8.50 58150 7 18.1 1.4 13.3 3.6 4.8 15.3 16.4 7.9 19.3 8.81 56150 8 17.7 1.4 13.1 3.6 4.9 16.8 16.1 7.7 18.6 9.15 54150 9 17.4 1.4 12.8 3.7 5 18.1 16 7.7 17.9 9.50 52150 10 17.1 1.4 12.6 3.7 5.1 19.3 15.9 7.6 17.2 9.87 49150 11 16.9 1.4 12.4 3.7 5.2 20.4 15.8 7.6 16.6 10.25 47150 12 16.7 1.4 12.2 3.8 5.2 21.3 15.8 7.6 16 10.65 45150 13 16.5 1.4 12 3.9 5.2 22.2 15.8 7.6 15.4 11.06 42150 14 16.4 1.4 11.8 3.9 5.2 23 15.8 7.6 14.8 11.49 40150 15 16.3 1.4 11.7 4 5.2 23.7 15.8 7.6 14.3 11.93 38
300 2 20.3 1.3 15.3 4.2 3.1 5.6 18.9 9 22.4 7.59 57300 3 19.7 1.3 15.1 4 3.5 7.7 18.2 8.7 21.6 7.88 56300 4 19.2 1.3 15 3.9 3.9 9.7 17.6 8.5 20.8 8.17 56300 5 18.7 1.3 14.9 3.8 4.2 11.6 17.2 8.2 20.1 8.47 55300 6 18.2 1.4 14.7 3.8 4.5 13.3 16.8 8 19.4 8.77 54300 7 17.8 1.4 14.6 3.7 4.6 14.8 16.4 7.9 18.7 9.09 53300 8 17.4 1.4 14.4 3.7 4.8 16.3 16.2 7.8 18 9.43 51300 9 17.1 1.4 14.2 3.7 4.9 17.6 16 7.7 17.4 9.78 50300 10 16.9 1.4 14 3.7 5 18.8 15.9 7.6 16.8 10.14 48300 11 16.6 1.4 13.8 3.8 5 19.8 15.8 7.6 16.2 10.53 45300 12 16.5 1.4 13.6 3.8 5.1 20.8 15.7 7.5 15.6 10.92 43300 13 16.3 1.4 13.5 3.8 5.1 21.7 15.7 7.5 15 11.34 41300 14 16.2 1.4 13.3 3.9 5.1 22.5 15.7 7.5 14.5 11.76 39300 15 16.1 1.4 13.2 4 5.1 23.2 15.7 7.5 13.9 12.20 37
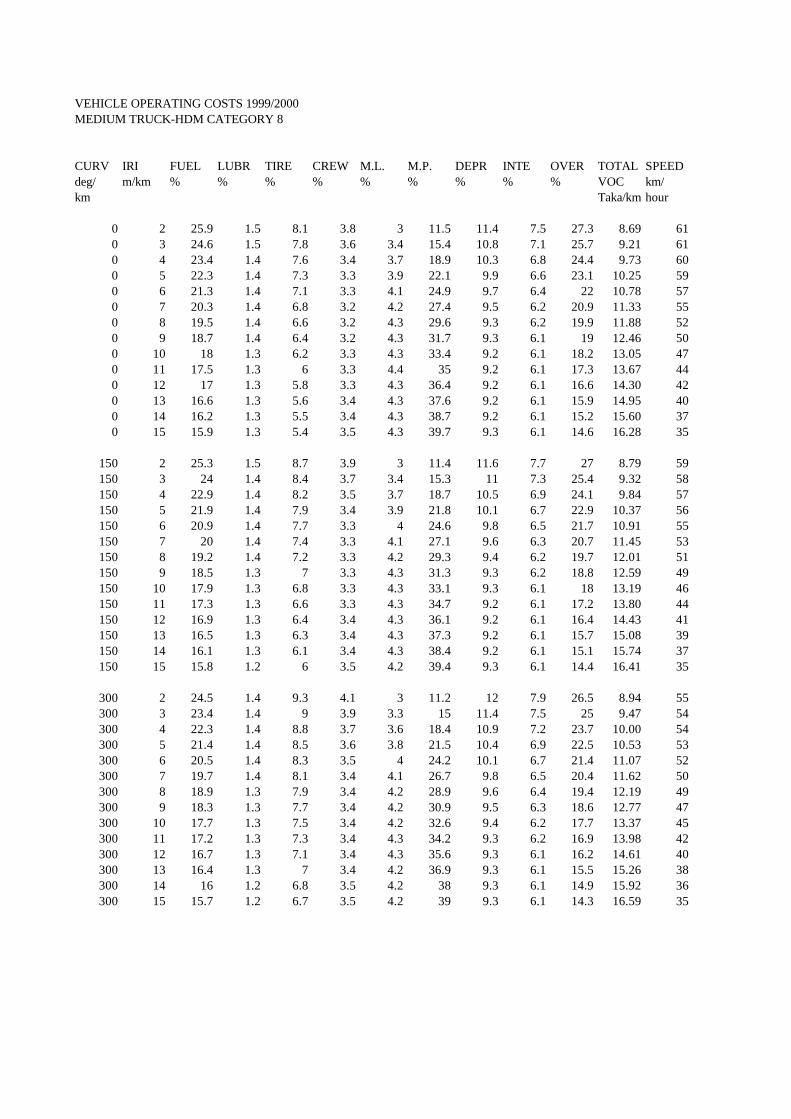
VEHICLE OPERATING COSTS 1999/2000MEDIUM TRUCK-HDM CATEGORY 8
CURV IRI FUEL LUBR TIRE CREW M.L. M.P. DEPR INTE OVER TOTAL SPEEDdeg/ m/km % % % % % % % % % VOC km/km Taka/km hour
0 2 25.9 1.5 8.1 3.8 3 11.5 11.4 7.5 27.3 8.69 610 3 24.6 1.5 7.8 3.6 3.4 15.4 10.8 7.1 25.7 9.21 610 4 23.4 1.4 7.6 3.4 3.7 18.9 10.3 6.8 24.4 9.73 600 5 22.3 1.4 7.3 3.3 3.9 22.1 9.9 6.6 23.1 10.25 590 6 21.3 1.4 7.1 3.3 4.1 24.9 9.7 6.4 22 10.78 570 7 20.3 1.4 6.8 3.2 4.2 27.4 9.5 6.2 20.9 11.33 550 8 19.5 1.4 6.6 3.2 4.3 29.6 9.3 6.2 19.9 11.88 520 9 18.7 1.4 6.4 3.2 4.3 31.7 9.3 6.1 19 12.46 500 10 18 1.3 6.2 3.3 4.3 33.4 9.2 6.1 18.2 13.05 470 11 17.5 1.3 6 3.3 4.4 35 9.2 6.1 17.3 13.67 440 12 17 1.3 5.8 3.3 4.3 36.4 9.2 6.1 16.6 14.30 420 13 16.6 1.3 5.6 3.4 4.3 37.6 9.2 6.1 15.9 14.95 400 14 16.2 1.3 5.5 3.4 4.3 38.7 9.2 6.1 15.2 15.60 370 15 15.9 1.3 5.4 3.5 4.3 39.7 9.3 6.1 14.6 16.28 35
150 2 25.3 1.5 8.7 3.9 3 11.4 11.6 7.7 27 8.79 59150 3 24 1.4 8.4 3.7 3.4 15.3 11 7.3 25.4 9.32 58150 4 22.9 1.4 8.2 3.5 3.7 18.7 10.5 6.9 24.1 9.84 57150 5 21.9 1.4 7.9 3.4 3.9 21.8 10.1 6.7 22.9 10.37 56150 6 20.9 1.4 7.7 3.3 4 24.6 9.8 6.5 21.7 10.91 55150 7 20 1.4 7.4 3.3 4.1 27.1 9.6 6.3 20.7 11.45 53150 8 19.2 1.4 7.2 3.3 4.2 29.3 9.4 6.2 19.7 12.01 51150 9 18.5 1.3 7 3.3 4.3 31.3 9.3 6.2 18.8 12.59 49150 10 17.9 1.3 6.8 3.3 4.3 33.1 9.3 6.1 18 13.19 46150 11 17.3 1.3 6.6 3.3 4.3 34.7 9.2 6.1 17.2 13.80 44150 12 16.9 1.3 6.4 3.4 4.3 36.1 9.2 6.1 16.4 14.43 41150 13 16.5 1.3 6.3 3.4 4.3 37.3 9.2 6.1 15.7 15.08 39150 14 16.1 1.3 6.1 3.4 4.3 38.4 9.2 6.1 15.1 15.74 37150 15 15.8 1.2 6 3.5 4.2 39.4 9.3 6.1 14.4 16.41 35
300 2 24.5 1.4 9.3 4.1 3 11.2 12 7.9 26.5 8.94 55300 3 23.4 1.4 9 3.9 3.3 15 11.4 7.5 25 9.47 54300 4 22.3 1.4 8.8 3.7 3.6 18.4 10.9 7.2 23.7 10.00 54300 5 21.4 1.4 8.5 3.6 3.8 21.5 10.4 6.9 22.5 10.53 53300 6 20.5 1.4 8.3 3.5 4 24.2 10.1 6.7 21.4 11.07 52300 7 19.7 1.4 8.1 3.4 4.1 26.7 9.8 6.5 20.4 11.62 50300 8 18.9 1.3 7.9 3.4 4.2 28.9 9.6 6.4 19.4 12.19 49300 9 18.3 1.3 7.7 3.4 4.2 30.9 9.5 6.3 18.6 12.77 47300 10 17.7 1.3 7.5 3.4 4.2 32.6 9.4 6.2 17.7 13.37 45300 11 17.2 1.3 7.3 3.4 4.3 34.2 9.3 6.2 16.9 13.98 42300 12 16.7 1.3 7.1 3.4 4.3 35.6 9.3 6.1 16.2 14.61 40300 13 16.4 1.3 7 3.4 4.2 36.9 9.3 6.1 15.5 15.26 38300 14 16 1.2 6.8 3.5 4.2 38 9.3 6.1 14.9 15.92 36300 15 15.7 1.2 6.7 3.5 4.2 39 9.3 6.1 14.3 16.59 35