Embed Size (px)
Citation preview

Risk Analysis and Technical Analysis
Tanveer Singh Chandok (Director of Mentorship)

GTSF Investments Committee2
What we have done so far Efficient Market Hypothesis Investing Styles (IC) Time Value of Money Financial Statement Analysis Valuation and important terms Important Ratios Fundamental Analysis (Macro/Micro) Intro to Fixed Income

GTSF Investments Committee3
A quick review The 3 main styles of investing
Value Growth Momentum
What is the difference between going long and short? How do we “short” a stock?
Different levels of market cap Large Mid Small
What does “liquidity” mean and why is it so important?
GTSF Investments Committee4
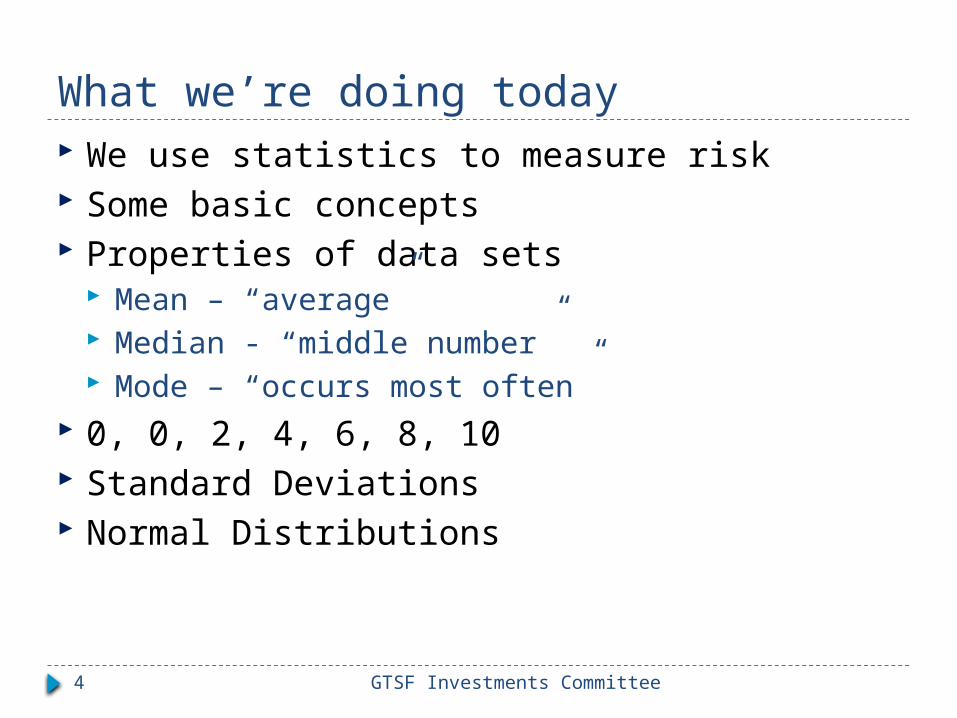
What we’re doing today We use statistics to measure risk Some basic concepts Properties of data sets
Mean – “average” Median - “middle number” Mode – “occurs most often”
0, 0, 2, 4, 6, 8, 10 Standard Deviations Normal Distributions

GTSF Investments Committee5
What is “Risk”? Uncertainty Risk What are we uncertain about? Generally:
The more uncertain the cashflows of a particular investment are the higher the risk
The higher the risk, the higher the required interest rate
Thus: Higher Risk = Higher Rate of Return Risk – return trade-off

GTSF Investments Committee6
Terms “Rate of Return” “Sample” = our dataset Sample mean returns
Sample variance of returns

GTSF Investments Committee7
More terms Sample covariance
Standard Deviation Square root of variance = σ
Sample correlation

GTSF Investments Committee8
Correlation Patterns

GTSF Investments Committee9
Correlation Patterns
GTSF Investments Committee10
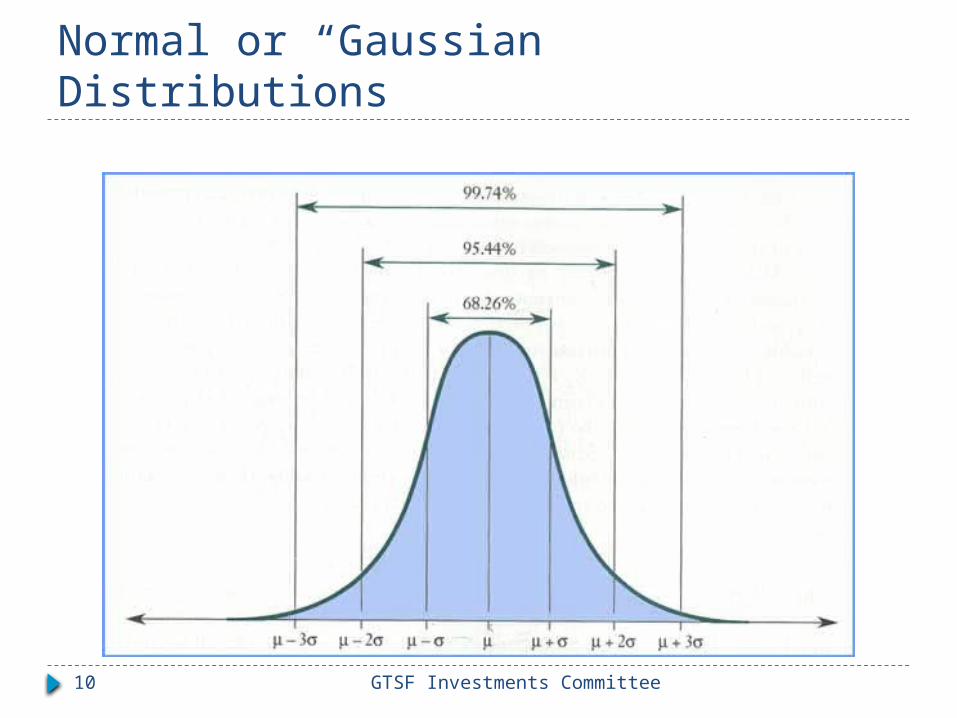
Normal or “Gaussian” Distributions

GTSF Investments Committee11
Compare to uniform distribution

GTSF Investments Committee12
Characteristics of Probability Distributions Mean
Most likely value – “Expected value” Variance or Standard Deviation
Volatility – “Degree of deviation from the mean value”
Skewness Degree of asymmetry in distribution
Kurtosis Degree of fatness in tail area

GTSF Investments Committee13
Standard Deviation Defined by the following equation:
Step 1: Find the mean of the dataset Step 2: Subtract the mean from each value Step 3: Square the values from Step 2 Step 4: Add up all the values from Step 3 Step 5: Divide the value from Step 4 by (n-1) Step 6: Take the square root of the value from
Step 5

GTSF Investments Committee14
Standard Deviation as a measure of risk Std. Dev. tells us what the normal distribution
probability function looks like Pros
Easy to calculate and implement If return distribution is symmetric, the upside risk
is the same as downside risk, and therefore standard deviation is a good measure of downside risk
If returns are normally distributed, standard deviation would be adequate in characterizing the risk
Upside risk vs. Downside risk

GTSF Investments Committee15
Standard Deviation as a measure of risk Cons
Investors are concerned about downside risk Standard deviation includes both the above-average
returns (upside risk) and the below-average returns (downside risk)
If returns are skewed, standard deviation is not the only relevant measure of risk
Holding expected return and standard deviation constant, investor would prefer positive skewed distribution

GTSF Investments Committee16
Risk Practice Problems You are thinking about investing in 2
companies. One of them (let’s call it ABC) has the following monthly returns 4% 2% 3% 1% -8%
What is this stocks average return and standard deviation?

GTSF Investments Committee17
Risk Practice Problems The next company (DEF) has the following
returns; 1% 2% 1% 3% 2%
What is this stocks average return and standard deviation?
Which stock would you most likely invest in? What other factors should influence your
decision?
GTSF Investments Committee18
More Risk! What about a stock’s sensitivity to the
market? When the broader market is down, individual
company stocks are often down, why is that? Traders use stocks as a way to express their
views on the market, often movements in stocks are not due to company news but market news

GTSF Investments Committee19
Beta The most common way to see how a stock
moves in relation to the broader market (represented by the S&P 500)
Beta (or market risk) is a measure of a securities relative volatility as compared to the broader market
Beta > 1 means the stock is more volatile than the market
Beta < 1 means the stock is less volatile than the market

GTSF Investments Committee20
Beta

GTSF Investments Committee21
Beta Practice Consider the following security beta’s;
a. 1.3b. 1.4c. .6d. 1.0e. .35f. 1.9
Which stock will move the most in relation to the market? Which one will move the least?

GTSF Investments Committee22
Using Beta to determine return We previously calculated expected return by
taking the average of past returns With Beta we know how a security compares
to the market return Using this information we can calculate the
E(r) of a security without knowing its previous returns
E(r) = Risk Free Rate + Beta (Market Risk Premium) Market risk premium = Market return – Risk Free Rate
GTSF Investments Committee23
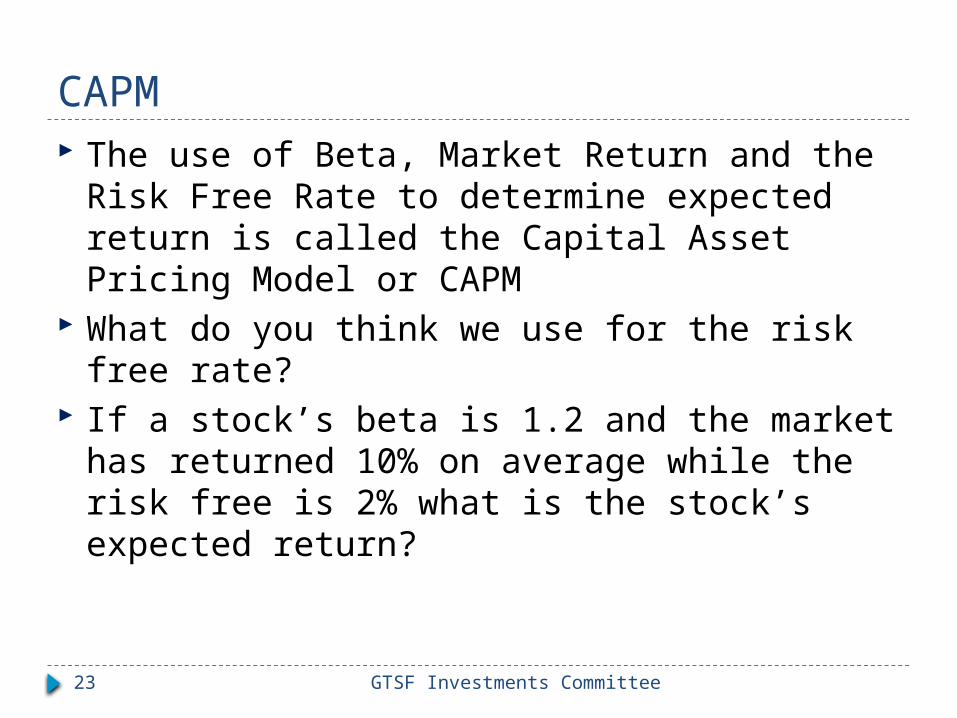
CAPM The use of Beta, Market Return and the Risk
Free Rate to determine expected return is called the Capital Asset Pricing Model or CAPM
What do you think we use for the risk free rate?
If a stock’s beta is 1.2 and the market has returned 10% on average while the risk free is 2% what is the stock’s expected return?

GTSF Investments Committee24

GTSF Investments Committee25
Alpha If everything perfectly followed CAPM then
we would be able to very accurately predict what a given stock would return
If this was true then we would not need actively managed funds to gain outsized returns
“The abnormal rate of return on a security or portfolio in excess of what would be predicted by an equilibrium model like the capital asset pricing model (CAPM)”
Alpha represents a greater return for lower risk
GTSF Investments Committee26
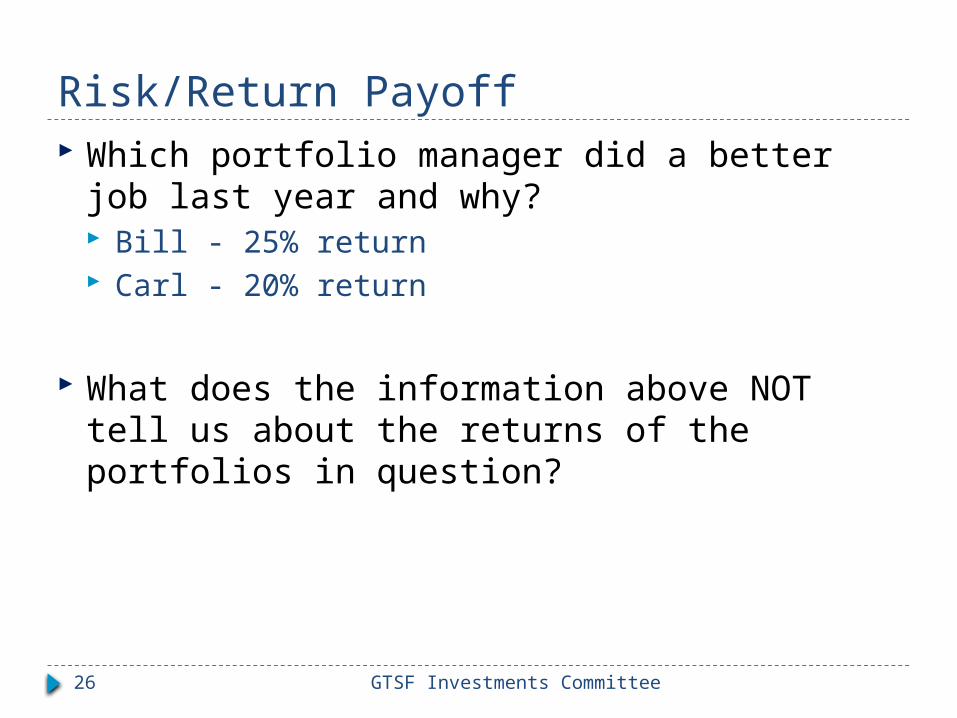
Risk/Return Payoff Which portfolio manager did a better job last
year and why? Bill - 25% return Carl - 20% return
What does the information above NOT tell us about the returns of the portfolios in question?
GTSF Investments Committee27
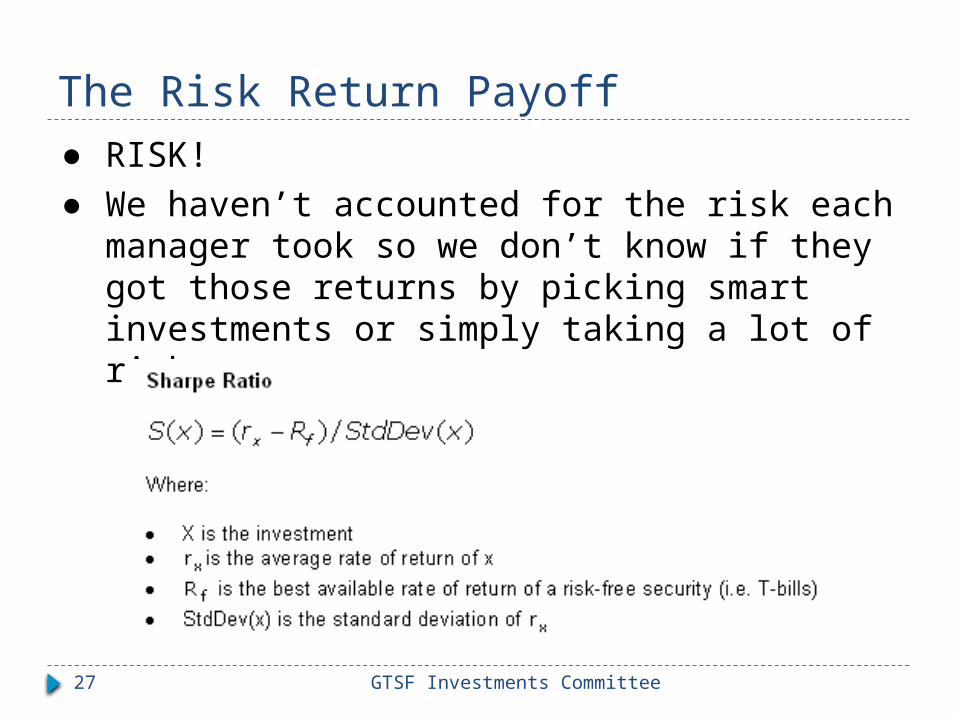
The Risk Return Payoff● RISK! ● We haven’t accounted for the risk each
manager took so we don’t know if they got those returns by picking smart investments or simply taking a lot of risk

GTSF Investments Committee28
Risk Adjusted Returns
● Let’s take another look at those returns● Bill – (25% return, stdev of 20%)● Carl – (20% return, stdev of 25%)

GTSF Investments Committee29
What does the Sharpe Ratio Tell Us?● A sharpe ratio tells us how much return the
portfolio gets for every “unit” of risk it takes ● A sharpe ratio of > 1 means for every unit of
risk we get more than 1 unit of return ● A sharpe ratio of > 2 means that we are
getting double the return for every unit of risk we take

GTSF Investments Committee30
Where does “risk” come from?● Beta measures risk compared to markets● Alpha measures risk of individual assets in
terms of excess return● If we hold multiple securities at the same
time can we increase/decrease our risk?● Correlation - the degree to which two things
move together ● If we have a portfolio of highly correlated
stocks then our entire portfolio will rise and fall at the same time

GTSF Investments Committee31
Correlation A measure of how closely two things move
together

GTSF Investments Committee32
Why We Care About Correlation

GTSF Investments Committee33
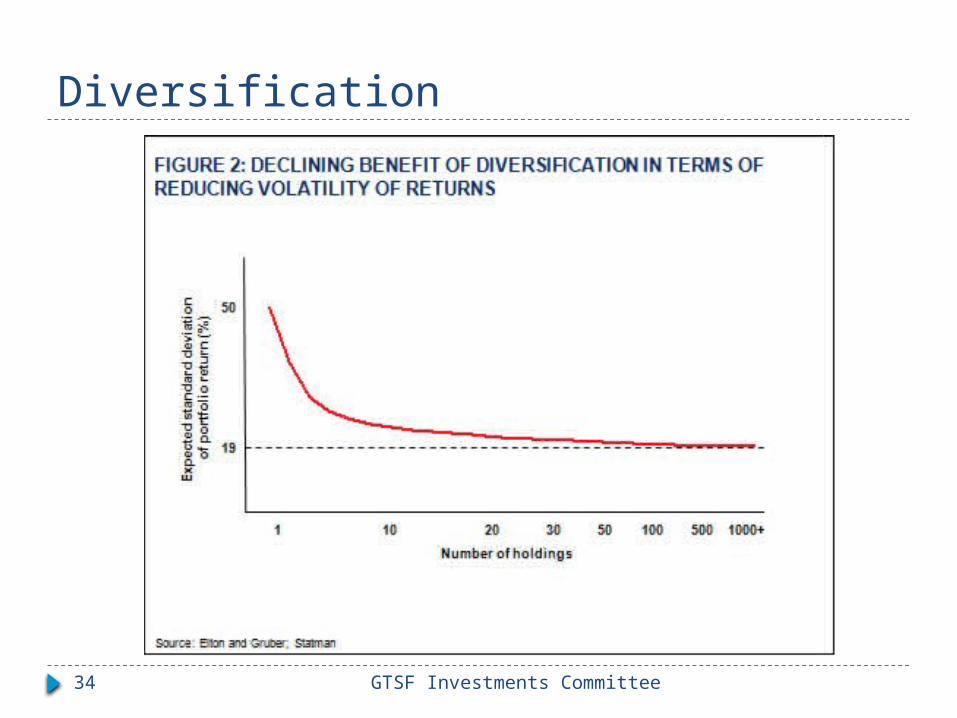
Diversification● We can increase our portfolio’s risk/return
relationship by diversifying● If we hold non-correlated assets then they
will move separately eliminating moves cause by correlations
● Say you have a portfolio of only Tech stocks (GOOG, APPL, MSFT) how would you diversify your holdings so a drop in the tech sector wouldn’t bankrupt you?
GTSF Investments Committee34
Diversification

GTSF Investments Committee35
Technical Analysis Live demo

Quiz Time!
What is Beta?1. Security Risk2. Market Risk3. Treasury Risk4. Interest Rate Risk

Quiz Time!
What is Beta?1. Security Risk2. Market Risk3. Treasury Risk4. Interest Rate Risk
Quiz Time!
How many low correlation stocks do we need to achieve the diversification benefit
1. 52. 203. 304. 33
Quiz Time!
How many low correlation stocks do we need to achieve the diversification benefit
1. 52. 203. 304. 33

Quiz Time!
What is NOT a component of CAPM1. Market Risk2. Risk Free Rate3. Beta4. Market Return

Quiz Time!
What is NOT a component of CAPM1. Market Risk2. Risk Free Rate3. Beta4. Market Return