Embed Size (px)
Citation preview
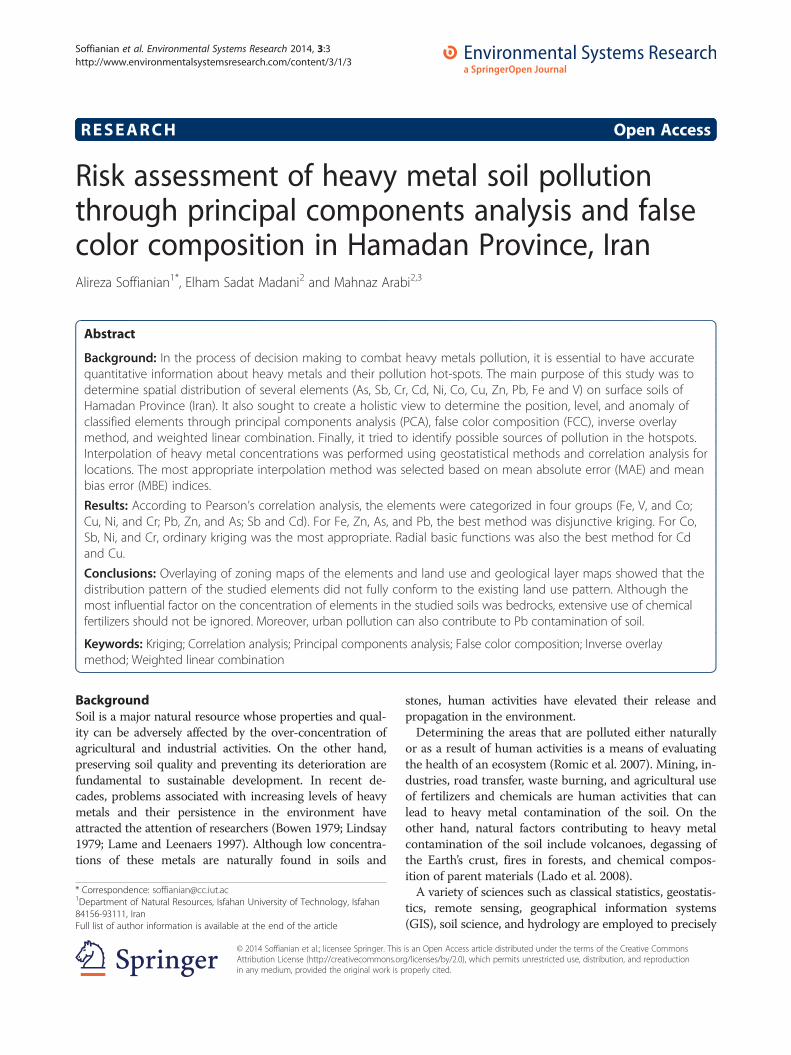
Soffianian et al. Environmental Systems Research 2014, 3:3http://www.environmentalsystemsresearch.com/content/3/1/3
RESEARCH Open Access
Risk assessment of heavy metal soil pollutionthrough principal components analysis and falsecolor composition in Hamadan Province, IranAlireza Soffianian1*, Elham Sadat Madani2 and Mahnaz Arabi2,3
Abstract
Background: In the process of decision making to combat heavy metals pollution, it is essential to have accuratequantitative information about heavy metals and their pollution hot-spots. The main purpose of this study was todetermine spatial distribution of several elements (As, Sb, Cr, Cd, Ni, Co, Cu, Zn, Pb, Fe and V) on surface soils ofHamadan Province (Iran). It also sought to create a holistic view to determine the position, level, and anomaly ofclassified elements through principal components analysis (PCA), false color composition (FCC), inverse overlaymethod, and weighted linear combination. Finally, it tried to identify possible sources of pollution in the hotspots.Interpolation of heavy metal concentrations was performed using geostatistical methods and correlation analysis forlocations. The most appropriate interpolation method was selected based on mean absolute error (MAE) and meanbias error (MBE) indices.
Results: According to Pearson’s correlation analysis, the elements were categorized in four groups (Fe, V, and Co;Cu, Ni, and Cr; Pb, Zn, and As; Sb and Cd). For Fe, Zn, As, and Pb, the best method was disjunctive kriging. For Co,Sb, Ni, and Cr, ordinary kriging was the most appropriate. Radial basic functions was also the best method for Cdand Cu.
Conclusions: Overlaying of zoning maps of the elements and land use and geological layer maps showed that thedistribution pattern of the studied elements did not fully conform to the existing land use pattern. Although themost influential factor on the concentration of elements in the studied soils was bedrocks, extensive use of chemicalfertilizers should not be ignored. Moreover, urban pollution can also contribute to Pb contamination of soil.
Keywords: Kriging; Correlation analysis; Principal components analysis; False color composition; Inverse overlaymethod; Weighted linear combination
BackgroundSoil is a major natural resource whose properties and qual-ity can be adversely affected by the over-concentration ofagricultural and industrial activities. On the other hand,preserving soil quality and preventing its deterioration arefundamental to sustainable development. In recent de-cades, problems associated with increasing levels of heavymetals and their persistence in the environment haveattracted the attention of researchers (Bowen 1979; Lindsay1979; Lame and Leenaers 1997). Although low concentra-tions of these metals are naturally found in soils and
* Correspondence: [email protected] of Natural Resources, Isfahan University of Technology, Isfahan84156-93111, IranFull list of author information is available at the end of the article
© 2014 Soffianian et al.; licensee Springer. ThisAttribution License (http://creativecommons.orin any medium, provided the original work is p
stones, human activities have elevated their release andpropagation in the environment.Determining the areas that are polluted either naturally
or as a result of human activities is a means of evaluatingthe health of an ecosystem (Romic et al. 2007). Mining, in-dustries, road transfer, waste burning, and agricultural useof fertilizers and chemicals are human activities that canlead to heavy metal contamination of the soil. On theother hand, natural factors contributing to heavy metalcontamination of the soil include volcanoes, degassing ofthe Earth’s crust, fires in forests, and chemical compos-ition of parent materials (Lado et al. 2008).A variety of sciences such as classical statistics, geostatis-
tics, remote sensing, geographical information systems(GIS), soil science, and hydrology are employed to precisely
is an Open Access article distributed under the terms of the Creative Commonsg/licenses/by/2.0), which permits unrestricted use, distribution, and reproductionroperly cited.

Soffianian et al. Environmental Systems Research 2014, 3:3 Page 2 of 14http://www.environmentalsystemsresearch.com/content/3/1/3
assess the heavy metal content of soils. In fact, soil pollu-tion can currently be well determined using GIS and geos-tatistical methods. While classical statistical methods havebeen widely applied in previous studies on soil contamin-ation, such methods are expensive and time-consumingand do not calculate estimation errors. Besides, preparingsufficient samples from the areas under-study is impos-sible. Hence, geostatistical methods have replaced classicalstatistics as they can accurately identify time and spatialchanges of pollutants and calculate estimation error (Blom1985; Bonham-carter et al. 1987).The present research aimed to determine areas with
heavy metal (Cu, Co, Ni, Cd, Cr, Sb, V, Fe, Pb, As, andZn) contamination, to locate pollution hot-spots, and torecognize possible sources of contamination in surfacesoils of Hamadan Province (Iran) through principal com-ponent analysis (PCA) and false color composites (FCC).
MethodsStudy areaHamadan Province occupies an area of 19493 km2 (from33 degrees, 59 minutes to 35 degrees, 48 minutes northlatitude and from 47 degrees, 34 minutes to 49 degrees,36 minutes east longitude) (Figure 1). The agriculturaland livestock development of this province (49.3% of its
Figure 1 Location map of Hamadan Province (Iran) and the sampling
lands are used for agricultural purposes) has turnedHamadan into an economic hub (Figure 2). The domin-ant geological structures of the area include alluvial ter-races from the Quaternary period, orbitoline limestone,shale and marl from the late Cretaceous period, meta-morphic sandstone from the Jurassic period, and andesiticlava and reef limestone from late Paleogene and earlyNeogene periods (geological map 1:1000000; GeologicalSurvey of Iran). The area contains shallow to moderately-deep soils with small to medium-sized gravels and someamounts of calcareous material (2007).
SamplingIn order to perform systematic random sampling, thearea was first divided to 5*5 km2 networks. Afterward,based on the characteristics of the area and various typesof land use and activities, networks of 2.5 × 2.5 and 10 ×10 km2 were developed in areas with intensive and low-intensity land use, respectively. The points where thenetworks met were selected as sampling points. Finally,286 soil samples were collected from the area, i.e. afterdetermining sampling points, a 20 × 20 cm2 macro-platewas drawn at each point. Then, three 3 × 3 cm2 micro-plates were drawn inside it in the shape of a downwardV. Five soil samples were taken from the four corners
points.

Figure 2 Regional geological map of the study area.
Soffianian et al. Environmental Systems Research 2014, 3:3 Page 3 of 14http://www.environmentalsystemsresearch.com/content/3/1/3
and the center of each micro-plate. The samples were allobtained at depths of 0–20 cm. The collected soils wereeventually mixed and a final 2–3 kg sample was prepared.Information about land use at the sampling point, type
of agriculture (irrigated/rainfed), appearance of the land,kind of product, geographical characteristics, and thenearest village was recorded in a sampling form. Sam-ples were taken from pristine areas as well as mountain-ous areas, deserts, salt marshes, lands under irrigated orrainfed agriculture, vineyards, gardens, and areas nearvillages (Figure 3).
Chemical analysis of soilThe prepared samples were sent to the laboratory andtheir Pb, Zn, As, Cr, Co, Ni, V, Fe, and Cu concentrationswere measured via inductively coupled plasma-atomicemission spectrometry (ICP-AES). Cd content of the
samples was assessed using a graphite furnace and atomicabsorption spectroscopy in the chemical laboratory of theIranian Center for Advanced Mineral Processing Research.
Descriptive statisticsKolmogorov-Smirnov test was applied to investigate thenormal distribution of data at a confidence level of 95%.Moreover, the data was normalized with logarithmictransformation. In order to evaluate the effects of land useon the concentrations of heavy metals in soil, the map wasfirst divided into three main categories of agricultural,urban-industrial, and non-agricultural use. Pearson’s cor-relation coefficients were then calculate to identify thecorrelations between heavy metal concentrations and dif-ferent land uses. A box plot and PCA were used to deter-mine the outliers and classify the relations between themeasured variables, respectively.

• Soil sampling method in depth of 20 cm• locations for sampling points record with GPS
device.
Figure 3 Sampling method.
Soffianian et al. Environmental Systems Research 2014, 3:3 Page 4 of 14http://www.environmentalsystemsresearch.com/content/3/1/3
Land use mappingConsidering the importance of land use map in analyz-ing heavy metal pollution, the map was prepared usingIndian Remote Sensing (IRS-P6) Advanced Wide FieldSensor (AWiFS) images.
Data mappingThe current research employed kriging for data mapping.
False color composition (FCC)Geographical information studies may utilize FCC to de-termine hot-spots of heavy metal pollution. This methodcan simultaneously compress data and interpret layers ofinformation. Creating color composite images involvedspatial correlation analysis of the heavy metals. After stand-ardizing the zoning map of all elements’ concentrations(0–255), the three elements in each group were colored asred, green, and blue. The FCC map was then developedaccordingly.
Principal component analysis (PCA)PCA is a statistical method to classify the relations be-tween the measured variables, i.e. it linearly compressesa set of main data to an essentially smaller set of new,uncorrelated variables which represent nearly all informa-tion in the main data set. Meanwhile, understanding andworking with a small set of uncorrelated variables is mucheasier than working with a large set of correlated variables(Eastman 2006). In the present study, PCA was carriedout in SPSS for Windows 15.0 (SPSS Inc., Chicago, IL,USA). In addition, spatial correlation analysis was appliedfor each variable to select the most appropriate methodof interpolation. Finally, the zoning map of the factors
obtained from PCA was produced in ArcGIS 9.3 (Esri,CA, USA).
Inverse overlaying of elementsSince the images from the previous stage could not pro-vide information about more than three elements inrecognition of pollution hot-spots, the anomalies of ele-ments (distribution of a combination of elements in eacharea) were determined using the zoning map of elementsobtained from FCC, map overlay, and identification ofheavy metal hot-spots. Overlaying of inverse layers facili-tates analysis by creating an overall view on multiple ele-ments (Suyash Kumar et al. 2007). It is, in fact, a differentrepresentation of elements for clearer observation of pol-lution hot-spots. In order to apply this method, the mapsfrom FCC were first stretched between zero and 255.Afterward, pairs of layers (one as the top and one as thebottom map) were selected according to the correlationsbetween their elements. In top and bottom layers, red toblue and blue to red (reverse) represented maximum tominimum amounts, respectively. Top layers were thendemonstrated at a contrast of 100 and transparency of 60.Finally, similar to FCC, the anomaly of elements was inter-preted based on the composition of the obtained colors.
ResultsFiltration and normalization of primary dataTable 1 summarizes the density of heavy metals (mean As:15.7993, Cd: 0.1535, Fe: 3.9472, Co: 18.9598, Cr: 96.8182,Cu: 36.4545, Ni: 69.0350, Pb: 31.8916: Sb: 2.9084, V:109.4161, Zn: 80.0035). The box plot in Figure 4 was usedto correct the outlier data about the concentration ofheavy metals. The numbers of outlier and corrected dataare given in Table 2. The results of Kolmogorov-Smirnovtest showed the data for As, Sb, Cr, Co, and Pb not to benormal (Table 3). However, normal distribution of vari-ables is essential in geostatistical studies. Moreover, toomuch stretching and crumpling can damage the structureof variogram and the results of kriging. Therefore, afterensuring the absence of negative data, logarithmic trans-formation was applied to normalize the concentrations ofthe mentioned elements (Figure 5). Pearson’s correlationanalysis was then performed again on the normalized data(Table 4).Analysis of variance on the mean concentrations of
heavy metals in soil did not prove any significant differ-ence between the three different kinds of land use (agri-cultural, urban-industrial, and non-agricultural uses).
PCAThe appropriateness of data for PCA is assessed based onKaiser-Mayer-Olkin (KMO) index, i.e. the test is recom-mended only if KMO> 0.70. Since KMO index was calcu-lated as 0.84 in the current research, PCA was applied on
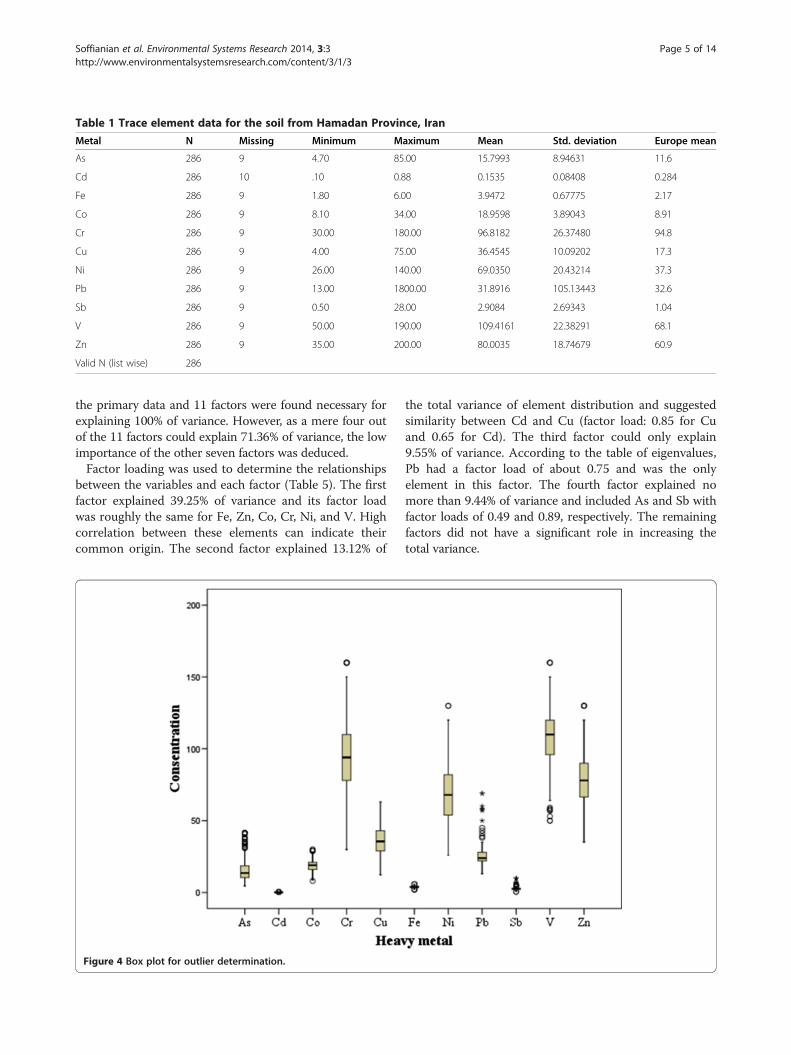
Table 1 Trace element data for the soil from Hamadan Province, Iran
Metal N Missing Minimum Maximum Mean Std. deviation Europe mean
As 286 9 4.70 85.00 15.7993 8.94631 11.6
Cd 286 10 .10 0.88 0.1535 0.08408 0.284
Fe 286 9 1.80 6.00 3.9472 0.67775 2.17
Co 286 9 8.10 34.00 18.9598 3.89043 8.91
Cr 286 9 30.00 180.00 96.8182 26.37480 94.8
Cu 286 9 4.00 75.00 36.4545 10.09202 17.3
Ni 286 9 26.00 140.00 69.0350 20.43214 37.3
Pb 286 9 13.00 1800.00 31.8916 105.13443 32.6
Sb 286 9 0.50 28.00 2.9084 2.69343 1.04
V 286 9 50.00 190.00 109.4161 22.38291 68.1
Zn 286 9 35.00 200.00 80.0035 18.74679 60.9
Valid N (list wise) 286
Soffianian et al. Environmental Systems Research 2014, 3:3 Page 5 of 14http://www.environmentalsystemsresearch.com/content/3/1/3
the primary data and 11 factors were found necessary forexplaining 100% of variance. However, as a mere four outof the 11 factors could explain 71.36% of variance, the lowimportance of the other seven factors was deduced.Factor loading was used to determine the relationships
between the variables and each factor (Table 5). The firstfactor explained 39.25% of variance and its factor loadwas roughly the same for Fe, Zn, Co, Cr, Ni, and V. Highcorrelation between these elements can indicate theircommon origin. The second factor explained 13.12% of
Figure 4 Box plot for outlier determination.
the total variance of element distribution and suggestedsimilarity between Cd and Cu (factor load: 0.85 for Cuand 0.65 for Cd). The third factor could only explain9.55% of variance. According to the table of eigenvalues,Pb had a factor load of about 0.75 and was the onlyelement in this factor. The fourth factor explained nomore than 9.44% of variance and included As and Sb withfactor loads of 0.49 and 0.89, respectively. The remainingfactors did not have a significant role in increasing thetotal variance.

Table 2 The number of modified and element outlier data for studied heavy metals
Element Cr Ni V Zn Cd As Co Cu Sb F Fe Pb
The number of outliers 5 3 10 5 6 12 6 3 16 9 5 11
The number of modified data 2 1 2 3 3 4 2 3 5 1 2 6
Soffianian et al. Environmental Systems Research 2014, 3:3 Page 6 of 14http://www.environmentalsystemsresearch.com/content/3/1/3
Spatial distribution of components in PCAIn order to prepare the zoning maps of factors obtainedfrom the PCA, spatial correlation analysis was conductedfor each factor in SPSS (SPSS Inc., Chicago, IL, USA) andthe most suitable method of interpolation was selected.Table 6 shows fitted models and the most appropriatemethods of interpolation. Geostatistical analyses (Table 7)revealed the exponential model to be the best fitted modelfor the factors (Figure 6).
Geostatistical analysisKriging and radial basis function (RBF) were employedto investigate the spatial variations of heavy metals. Allsuch analyses were performed in ArcGIS 9.3 (Esri, CA,USA). The precision of the methods was compared usingthe jack-knife technique and root mean square error(RMSE), mean bias error (MBE), and mean absolute error(MAE) which are all valid indices (Table 7). Based on theresults, the most appropriate methods were disjunctivekriging for Fe, Zn, As, and Pb, ordinary kriging for Cr, Ni,Sb, and Co, and RBF for Cd and Cu (Figure 7).
FCCAccording to Pearson’s correlation analysis (Table 4), theelements were divided into four groups: Fe, V, and Co;Cu, Ni, and Cr; Pb and Zn; and Sb and Cd. Single-component images were standardized (0–255) to preparethe FCC map. Two-three elements were then combinedbased on the above-mentioned classifications and usingthe FCC method (Figure 8a and b). As the prepared im-ages did not yield information about more than three ele-ments in recognizing the hot-spots, after standardizationof single-component images, the elements were catego-rized into two groups based on their correlation level.
Table 3 One-sample Kolmogorov-Smirnov test results about tin Hamadan Province, Iran
As Cd Fe Co
N 286 286 286 286
Normal parameters (a,b) Mean 15.49 .1457 3.9479 18.9458
Std. Deviation 7.34 .0720 .67360 3.84308
Most extreme differences Absolute .15 .242 .070 .098
Positive .15 .242 .049 .098
Negative -.10 -.220 -.070 -.064
Kolmogorov- Smirnov Z 2.561 4.088 1.176 1.661
Asymp. Sig. (2-tailed) .000 .054 .126 .008
Consequently, Fe, V, Co, Cu, Ni, and Cr were allocated tothe first category and Pb, Zn, As, Sb, and Cd were placedin the second. The two groups were then combined usingweighted linear combination (Figure 8c). This processsimplified the analysis of hot-spot positions. In otherwords, to identify the anomalies of the elements (com-bined distribution of elements in each area), weightedlinear combination and overlaying were applied on single-component images and the heavy metal hot-spots wererecognized. Red and blue areas in Figure 8c have high andlow anomalies, respectively.
DiscussionCorrelation analysisThe results of spatial correlation analysis (Table 4)showed that the mean estimation error and RMSE for allvariables were close to the ideal values (zero and one, re-spectively). This suggests high precision of our estima-tions. There was also a great spatial correlation betweenthe concentrations of elements (especially As, Fe, Co,Ni, and Cr) in the samples. In other words, the concen-trations of elements in closer samples were more similarto each other probably due to the effects of natural fac-tors such as parent material, topography, and soil type.However, human factors (e.g. fertilizing) might havebeen responsible for weak spatial structure of Zn, V, andPb.MAE and MBE indices were calculated to assess the
precision and deviation of interpolation models, respect-ively (Table 7). As these indices measure the differencebetween the measured and the estimated values, valuescloser to zero indicate higher spatial precision of themodel and lower deviation, respectively (Hassani-pak1998; Mohammadi 2006).
he concentration (in mg/kg) of the studied heavy metals
Cr Cu Ni Pb Sb V Zn
286 286 286 286 286 286 286
96.6783 36.1612 69.0000 25.8392 2.702 109.241 79.5839
25.9820 9.75556 20.3185 7.22292 1.30851 21.8781 16.9531
.096 .037 .078 .176 .180 .116 .052
.096 .037 .078 .176 .180 .116 .052
-.050 -.029 -.038 -.116 -.106 -.087 -.039
1.623 .624 1.324 2.978 3.052 1.954 .875
.010 .831 .060 .000 .000 .064 .428

Ln Cr5.505.004.504.003.503.00
Fre
quen
cy
60
40
20
0
Mean =4.53 Std. Dev. =0.289
N =286
Normal
Ln As4.504.003.503.002.502.001.50
Fre
quen
cy
60
50
40
30
20
10
0
Mean =2.65 Std. Dev. =0.437
N =286
Normal
Ln Co4.003.503.002.502.00
Fre
quen
cy
60
50
40
30
20
10
0
Mean =2.93 Std. Dev. =0.215
N =286
Normal
Ln Pb4.003.803.603.403.203.002.802.60
Fre
quen
cy
60
40
20
0
Mean =3.21 Std. Dev. =0.206
N =286
Normal
Figure 5 Normalized data histogram using logarithm method (As, Pb, Cr, Sb and Co).
Soffianian et al. Environmental Systems Research 2014, 3:3 Page 7 of 14http://www.environmentalsystemsresearch.com/content/3/1/3
Zoning mapsAccording to the distribution map of As (Figure 7), theelement had the highest concentrations (20–50 mg/kg)in the northwest, two spots in the southwest and somespots in the center of the province. The geological struc-ture of these areas comprised metamorphic rocks, shale,marl, and limestone.The distribution maps showed the highest concentra-
tions of Fe, Ni, Cr, and Co to be 4.0-5.9, 90–130, 140–160, and 20–30 mg/kg, respectively. These hot-spotswere detected in the form of some red spots in the west,southwest, and northwest of the province. Furthermore,the bedrock was shale, igneous and alluvial rocks, andsandstone for Fe and Ni, limestone and igneous rocks
for Cr, and shale-marl, sandstone, limestone, and meta-morphic rocks for Co.The highest concentration of Cd in the studied soils
varied between 0.30 and 0.35 mg/kg (Figure 7) and wasdemonstrated as some spots throughout the province. Itwas found on geological structure of shale-marl, lime-stone, and alluvial rocks.The distribution map of Zn suggested the maximum
level of the element (100–130 mg/kg) to exist in the west,southeast, northeast, and partly in the center of the prov-ince on limestone, metamorphic rocks, and shale bedrocks.The greatest concentration of Sb ranged from 5.0 to
9.8 mg/kg (Figure 7) and was seen in the form of twospots on igneous stones and shale bedrocks.

Table 4 Pearson’s correlation coefficients between the heavy metals
LnCo LnSb LnPb LnCr LnAs Zn V Ni Cu Cd Fe
LnCo 1
LnSb .616(**) 1
LnPb .108 .093 1
LnCr .159(**) .085 .396(**) 1
LnAs .018 -.069 .098 .043 1
Zn .704(**) .491(**) .093 .168(**) .031 1
V .860(**) .553(**) .160(**) .224(**) .023 .709(**) 1
Ni .020 -.014 .146(*) .472(**) .058 -.003 .072 1
Cu .082 -.042 .171(**) .294(**) .196(**) .100 .109 .521(**) 1
Cd .005 .008 .072 .196(**) -.098 .055 .064 .263(**) .218(**) 1
Fe .899(**) .608(**) .116(*) .129(*) .006 .729(**) .851(**) .007 .062 .014 1
*Correlation is significant at the 0.05 level (two-tailed).**Correlation is significant at the 0.01 level (two-tailed).
Soffianian et al. Environmental Systems Research 2014, 3:3 Page 8 of 14http://www.environmentalsystemsresearch.com/content/3/1/3
Overlaying of the distribution maps of As, Fe, Cd, Zn,Cr, Ni, and Sb, land use maps, and geological strata ofthe studied area revealed that the distribution pattern ofthe elements did not conform to the land use patternof the area. On the other hand, since the concentrationof each element is naturally high in its bedrock (Table 8)(De vos et al. 2005), the most important factor affectingthe concentration of the mentioned elements in soil musthave been the geological structure (bedrock).As Figure 7 illustrates, areas with Pb concentration
higher than 30 mg/kg were located in the southeast, cen-ter, and west of the province on igneous, metamorphicsandstone, shale, and limestone. Irrigated agriculture,pasture, and mining land use in these areas results inoveruse of fertilizers and chemical herbicides in them.Moreover, sandstone and shale naturally have high con-centrations of Pb (Table 8) (De vos et al. 2005).
Table 5 Load factors of the studied variables in HamadanProvince, Iran
Heavy metal Component
1 2 3 4
As 0.897
Cd 0.848
Fe 0.901
Co 0.943
Cr 0.898
Cu 0.647
Ni 0.833
Pb 0.749
Sb 0.496 0.491
V 0.882
Zn 0.705
Maximum Cu and V content of soil was 50–63 and120–160 mg/kg, respectively (Figure 7). These valueswere detected in the west, southwest, and southeast ofthe province as well as some spots in the center. Thebedrocks were shale and limestone for Cu and shale,igneous rocks, sandstone, and limestone for V. The con-centration of these two elements is generally high inshale (Table 8). Meanwhile, overlaying of their distribu-tion maps and the area’s land use map showed excessiveuse of fertilizers and chemical herbicides in the agricul-tural activities performed in these lands. Hence, althoughthe high concentration of Cu and V can be mainly justifiedby natural factors such as shale, lime, and alluvium bed-rock, the accumulation of these elements in agriculturallands with unwarranted use of chemical fertilizers (themean annual use of urea, potash, and phosphate fertilizersis about 500–700, 200–230, and 300–558 kg per hectare,respectively) can be expected.Comparisons between our findings and the mean
values in Europe and the world (Table 9) led to the con-clusion that excluding Cd (which had a concentrationlower than that in Europe and the world) and Pb (whoselevel was lower than the mean level in Europe), all ele-ments had higher values in the studied area comparedto Europe and the world.Facchinelli et al. (2001) concluded that while Cu, Ni,
Cr, and Co concentrations are controlled by bedrock,and Pb and Zn content of soil is influenced by humanfactors. Similarly, Leo et al. (2007) found Cu, Ni, Zn andCr levels and Zn and Cd levels to depend on bedrockand human factors, respectively. Mico et al. (2006) re-ported that the amounts Cu, Fe, Ni, Zn, Cr, and Co areaffected by bedrocks, but Cd content changes based onhuman factors such as the use of phosphate fertilizers.Lado et al. (2008) assessed heavy metals in the soils ofEurope and concluded that Cu, Pb, Cd, and Zn have

Table 6 Models fitted for factors obtained from principal component analysis and selecting the best interpolationmethod
Factors Interpolation method Model Nugget Partial sill Sill Mean range Mean Root mean square
Factor 1 Ordinary kriging Exponential 0 1.009 1.009 21035.1 0.027 0.853
Factor 2 Radial basis functions - - - - - 0.015 1.003
Factor 3 Radial basis functions - - - - - 0.001 0.874
Factor 4 Radial basis functions - - - - - 0.002 0.785
Soffianian et al. Environmental Systems Research 2014, 3:3 Page 9 of 14http://www.environmentalsystemsresearch.com/content/3/1/3
high correlations with agriculture and limestone, whereasCr and Ni levels are related to bedrocks. Inácio et al.(2008) evaluated the soils of Portugal to prepare a geo-chemical atlas. They suggested revealed that while theconcentrations of As and Cr are controlled by parent ma-terial, the amount of V depends on mining activities (pre-cipitation of ores). Likewise, Jiachun et al. (2004) indicatedAs content to be controlled by bedrock but to also be rela-tively dependent on human resources. They found theconcentration of Cd to be affected by not only natural fac-tors but also human activities.
Factor analysisAs it can be seen in the zoning map of factor 1, corre-lation coefficients of variables in each sample rangedfrom −0.93 to +2.76. High positive correlations existedbetween the seven elements in the southeast, southwest,and west where igneous and shale bedrocks were present.In contrast, high negative correlations were seen betweenthe seven elements in the east and northwest on shalebedrocks.Zoning map of factor 2 shows the correlations between
the variables of each sample to vary between −1.24and +4.40. High positive correlations between Cu and Cdwere detected as four blue spots in the north and centerof the province on alluvium bedrock. High negative cor-relations were demonstrated as orange spots throughoutthe province on shale, igneous, metamorphic, and lime-stone bedrock.According to the zoning map of factor 3, correlations
of variables in each sample took values between −1.31and +4.20. High positive correlations were observedbetween Pb and F on shale and lime bedrocks in thesoutheast of the province. On the other hand, high nega-tive correlations between the two elements were clear inthe west and south (on alluvium bedrock) where agricul-ture is the most common land use. Other areas hadvalues between these figures.For factor 4, correlations between variables ranged
from −0.84 to +4.14. High positive correlations betweenSb and As were observed on shale, lime, igneous, andmetamorphic bedrocks in the southeast, northwest, andpartly center of the province. High negative correlationsoccurred on alluvium bedrock in the east of the prov-ince where the land is dominantly used for agricultural
purposes. Values in other areas lay between these twofigures.Correlations between these metals can indicate their
common source, i.e. bedrock. Factor analysis maps cangenerally yield useful results about the source of heavymetals. In fact, negative and positive correlations mainlysuggest the effects of human activities and geologicalsources, respectively.In a study on heavy metal (Zn, Cd, As, Pb, Ni, Cu, and
Hg) pollution and landscape patterns, Pin Lin et al.(2002) categorized the metals using factor analysis andthen prepared the zoning maps of four factors. They con-cluded that the first (Ni, Cd, and Cr) and second factors(Pb, Zn, and Cu) were transferred to soil as a direct resultof human activities. Similarly, studies in Italy (Facchinelliet al. 2001), northern Spain (Gallego et al. 2002), and otherparts of Spain (Rodriguez Martin et al. 2006) classified Cr,Co, and Ni in the same factor and found them to be con-trolled by parent material of soil.Moller (2005) reported that Cu in urban areas is pro-
duced following human activities. Mico et al. (2006) andFranco-Uria et al. (2009) suggested Cd, Cu, Pb, and Znconcentrations to change mainly through human activ-ities. Rodriguez Martin et al. (2006) mentioned transporta-tion and traffic as the main factors contributing to highlevels of Zn and Pb in the soils of Spain. Mico et al. (2006)claimed that Pb is transferred to agricultural soils of Spainvia atmospheric deposition and use of chemical fertilizers.On the contrary, Fe, Cr, and Co levels are basically con-trolled by parent material (Franco-Uria et al. 2009).
FCC analysisFCC colors the three elements in each group as red, green,and blue. For instance, in a composition of As, Zn, andPb, blue, red, and green will represent high concentrationsof As, Zn and Pb, respectively. High levels of all elementswill result in white areas. Black, on the other hand, showsminimum concentrations of all three elements. Therefore,as Figure 8 suggests, these three element had maximumlevels in the southeast, northwest, west, and southwestof the province. Cd, Fe, and Vas well as Cr, Ni, and Cu(Figure 8a) had the highest concentrations in the west,southwest, and southeast of the province. In Figure 8b,the green and red areas correspond high levels of Sband Cd, respectively.

Table 7 Results of spatial correlation analysis and the fitted models
Element No. sample Interpolationmethod
Model Nugget (C0)(mg/kg)
Partial sill (C)(mg/kg)
Sill (C0+C)(mg/kg)
Majorrange(km)
Mean RMS Root- meanstandardized
Trend MAE(mg/kg)
MBE(mg/kg)
Anisotropy
Isotropy
As 286 Disjunctive kriging Exponential 0.4 0.8 1.2 106 0.076 7.085 1.16 no 5.13 0.076 344.5
Zn 286 Disjunctive kriging Exponential 0.36 0.54 0.9 29.39 −0.059 14.6 1.046 no 11.48 0.059 *
Cu 286 Radial basis function - - - - - .068 9.3 - - 7.42 0.045 - -
V 286 Disjunctive kriging Exponential 0.31 0.6 0.91 16.919 −0.92 19.22 1.003 no 14.85 .094 *
Ni 286 Ordinary kriging Spherical 177.29 437.7 614.99 178 .034 15.98 1.068 no 12.54 .34 *
Co 286 Ordinary kriging Exponential 7.89 10.67 18.56 178.01 0.0005 3.21 1.025 no 2.53 0.005 *
Pb 286 Disjunctive kriging Exponential 0.39 0.49 0.88 13.49 0.018 6.68 1.09 no 4.06 0.018 *
Cd 286 Radial basis function - - - - - 0.002 0.097 - - 0.67 0.002 - -
Fe 286 Disjunctive kriging Exponential 0.52 0.7 1.22 123.97 0.0005 0.58 1.05 no 0.46 0.00005 *
Cr 286 Ordinary kriging Exponential 241 669 910 178 0.006 20 1.11 no 16.25 0.006 *
Sb 286 Ordinary kriging Exponential 0.086 0.111 0.197 178 0.042 0.35 1.14 - 0.74 0.0048 325.5
Soffianianet
al.EnvironmentalSystem
sResearch
2014,3:3Page
10of
14http://w
ww.environm
entalsystemsresearch.com
/content/3/1/3

Figure 6 The first factor zoning maps (Zn, V, Ni, Cr, Co, Sb and Fe); The second factor (Cu and Cd) zoning maps; The third factor (Pb)zoning map; and the fourth factor (As and Sb).
Soffianian et al. Environmental Systems Research 2014, 3:3 Page 11 of 14http://www.environmentalsystemsresearch.com/content/3/1/3
In the maps produced by combining single-componentimages through weighted linear combination (Figure 8c),red areas (e.g. area number 1) illustrate high amounts ofall five elements (As, Zn, Pb, Cd, and Sb). These areaswere located on shale, alluvium, and igneous bedrocksand indicate the hot-spots of the mentioned elements.Areas 2 and 3 (in purple) have a layer with maximumcontent and a layer with minimum content. In other
words, area 2 contained high concentrations of As, Pb,and Zn but low levels of Cd and Sb which is consistentwith its shale, igneous, and alluvium bedrocks. However,the opposite was true in area 3. Blue areas suggested lowvalues in both layers. In Figure 8c, the elements are at theirmaximum values in the west, southwest, and southeast.Based on our findings, FCC could clearly depict areas withhigh and relatively low concentrations of heavy metals.

Figure 7 Single-component image of the study area (index values in PPw).
Soffianian et al. Environmental Systems Research 2014, 3:3 Page 12 of 14http://www.environmentalsystemsresearch.com/content/3/1/3
ConclusionsThe current research aimed at locating the hot-spots ofpollution with heavy metals. Its most significant findingsare summarized below:Comparison of the mean levels of heavy metals in
Hamadan Province and other parts of Iran, suggestedhigher concentrations of As, Zn and V in the studied areathan in Isfahan. The mean level of Zn was higher than thatin Mashhad but lower than the value in Sepahanshahr.
The mean concentrations of Cd and Pb were lower thanthe levels in Isfahan and Sepahanshahr, respectively.Comparisons between the obtained levels and the
mean values in Europe and the world (Table 8) revealedthat except for Cd and Pb, the concentrations of all otherelements were higher in Hamadan Province than inEurope and the world. Overlaying of land use maps andthose obtained from sampling revealed that higher con-centrations of some elements in their bedrocks compared

Figure 8 Three-component (a), Two-component (b) and Multi-component (c) color composition of the study area.
Soffianian et al. Environmental Systems Research 2014, 3:3 Page 13 of 14http://www.environmentalsystemsresearch.com/content/3/1/3
to standard levels existed in the agricultural lands wherehigh amounts of chemical fertilizers are used.Overlaying of zoning maps of the elements and land
use and geological layer maps showed that the distributionpattern of the studied elements did not fully conform tothe existing land use pattern. On the other hand, as the
Table 8 The mean concentrations of elements in differentbedrocks
Cu Fe Zn Cr Pb Ni V Sb Cd Co
Ultramafic 40 9.6 50 1600 1 - 0.09
Sandstone - 0.5 35 10 20 <1
Shale 50 4.7 50-90 90 23 90 90-260 1.5 0.8
Limestone - 0.98 50 11 - <5 0.15
level of each element is naturally high in its bedrock, itseems that the main factor affecting the concentrations ofheavy metals in the studied soils must have been thegeological structure (bedrock). However, excessive use ofchemical fertilizers and industrial pollution (in case of Pb)should not be ignored.According to factor analysis, the studied heavy metals
lay in four factors. This strong correlation can be causedby a common source of transfer to soil through agricul-tural activities, atmosphere, or parent material of soil.Moreover, while the measured elements had maximumlevels in shale, igneous stone, limestone, and sandstonebedrocks, their concentration was minimum in alluvium.The zoning maps of pollution probability showed
99.65% of the area to have Cd values under the threshold.
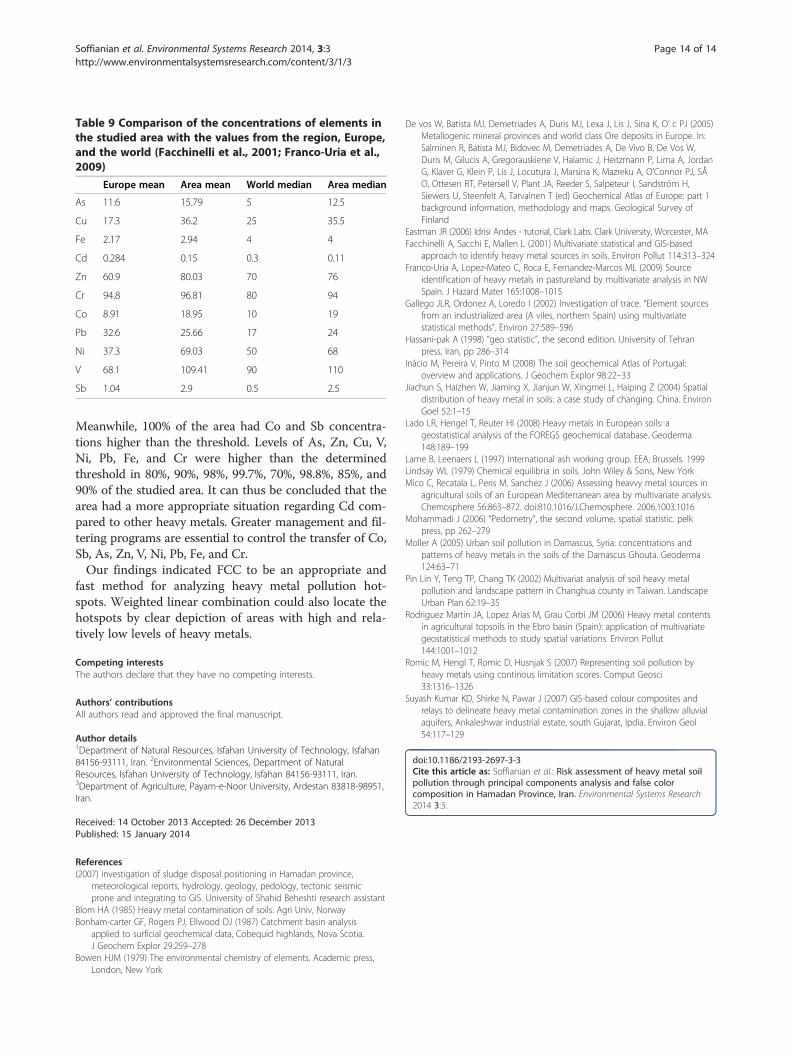
Table 9 Comparison of the concentrations of elements inthe studied area with the values from the region, Europe,and the world (Facchinelli et al., 2001; Franco-Uria et al.,2009)
Europe mean Area mean World median Area median
As 11.6 15.79 5 12.5
Cu 17.3 36.2 25 35.5
Fe 2.17 2.94 4 4
Cd 0.284 0.15 0.3 0.11
Zn 60.9 80.03 70 76
Cr 94.8 96.81 80 94
Co 8.91 18.95 10 19
Pb 32.6 25.66 17 24
Ni 37.3 69.03 50 68
V 68.1 109.41 90 110
Sb 1.04 2.9 0.5 2.5
Soffianian et al. Environmental Systems Research 2014, 3:3 Page 14 of 14http://www.environmentalsystemsresearch.com/content/3/1/3
Meanwhile, 100% of the area had Co and Sb concentra-tions higher than the threshold. Levels of As, Zn, Cu, V,Ni, Pb, Fe, and Cr were higher than the determinedthreshold in 80%, 90%, 98%, 99.7%, 70%, 98.8%, 85%, and90% of the studied area. It can thus be concluded that thearea had a more appropriate situation regarding Cd com-pared to other heavy metals. Greater management and fil-tering programs are essential to control the transfer of Co,Sb, As, Zn, V, Ni, Pb, Fe, and Cr.Our findings indicated FCC to be an appropriate and
fast method for analyzing heavy metal pollution hot-spots. Weighted linear combination could also locate thehotspots by clear depiction of areas with high and rela-tively low levels of heavy metals.
Competing interestsThe authors declare that they have no competing interests.
Authors’ contributionsAll authors read and approved the final manuscript.
Author details1Department of Natural Resources, Isfahan University of Technology, Isfahan84156-93111, Iran. 2Environmental Sciences, Department of NaturalResources, Isfahan University of Technology, Isfahan 84156-93111, Iran.3Department of Agriculture, Payam-e-Noor University, Ardestan 83818-98951,Iran.
Received: 14 October 2013 Accepted: 26 December 2013Published: 15 January 2014
References(2007) investigation of sludge disposal positioning in Hamadan province,
meteorological reports, hydrology, geology, pedology, tectonic seismicprone and integrating to GIS. University of Shahid Beheshti research assistant
Blom HA (1985) Heavy metal contamination of soils. Agri Univ, NorwayBonham-carter GF, Rogers PJ, Ellwood DJ (1987) Catchment basin analysis
applied to surficial geochemical data, Cobequid highlands, Nova Scotia.J Geochem Explor 29:259–278
Bowen HJM (1979) The environmental chemistry of elements. Academic press,London, New York
De vos W, Batista MJ, Demetriades A, Duris MJ, Lexa J, Lis J, Sina K, O’ c PJ (2005)Metallogenic mineral provinces and world class Ore deposits in Europe. In:Salminen R, Batista MJ, Bidovec M, Demetriades A, De Vivo B, De Vos W,Duris M, Gilucis A, Gregorauskiene V, Halamic J, Heitzmann P, Lima A, JordanG, Klaver G, Klein P, Lis J, Locutura J, Marsina K, Mazreku A, O’Connor PJ, SÅO, Ottesen RT, Petersell V, Plant JA, Reeder S, Salpeteur I, Sandström H,Siewers U, Steenfelt A, Tarvainen T (ed) Geochemical Atlas of Europe: part 1background information, methodology and maps. Geological Survey ofFinland
Eastman JR (2006) Idrisi Andes - tutorial, Clark Labs. Clark University, Worcester, MAFacchinelli A, Sacchi E, Mallen L (2001) Multivariate statistical and GIS-based
approach to identify heavy metal sources in soils. Environ Pollut 114:313–324Franco-Uria A, Lopez-Mateo C, Roca E, Fernandez-Marcos ML (2009) Source
identification of heavy metals in pastureland by multivariate analysis in NWSpain. J Hazard Mater 165:1008–1015
Gallego JLR, Ordonez A, Loredo I (2002) Investigation of trace. “Element sourcesfrom an industrialized area (A viles, northern Spain) using multivariatestatistical methods”. Environ 27:589–596
Hassani-pak A (1998) “geo statistic”, the second edition. University of Tehranpress, Iran, pp 286–314
Inácio M, Pereira V, Pinto M (2008) The soil geochemical Atlas of Portugal:overview and applications. J Geochem Explor 98:22–33
Jiachun S, Haizhen W, Jiaming X, Jianjun W, Xingmei L, Haiping Z (2004) Spatialdistribution of heavy metal in soils: a case study of changing. China. EnvironGoel 52:1–15
Lado LR, Hengel T, Reuter HI (2008) Heavy metals in European soils: ageostatistical analysis of the FOREGS geochemical database. Geoderma148:189–199
Lame B, Leenaers L (1997) International ash working group. EEA, Brussels. 1999Lindsay WL (1979) Chemical equilibria in soils. John Wiley & Sons, New YorkMico C, Recatala L, Peris M, Sanchez J (2006) Assessing heavvy metal sources in
agricultural soils of an European Mediterranean area by multivariate analysis.Chemosphere 56:863–872. doi:810.1016/J.Chemosphere. 2006.1003.1016
Mohammadi J (2006) “Pedometry”, the second volume, spatial statistic. pelkpress, pp 262–279
Moller A (2005) Urban soil pollution in Damascus, Syria: concentrations andpatterns of heavy metals in the soils of the Damascus Ghouta. Geoderma124:63–71
Pin Lin Y, Teng TP, Chang TK (2002) Multivariat analysis of soil heavy metalpollution and landscape pattern in Changhua county in Taiwan. LandscapeUrban Plan 62:19–35
Rodriguez Martin JA, Lopez Arias M, Grau Corbi JM (2006) Heavy metal contentsin agricultural topsoils in the Ebro basin (Spain): application of multivariategeostatistical methods to study spatial variations. Environ Pollut144:1001–1012
Romic M, Hengl T, Romic D, Husnjak S (2007) Representing soil pollution byheavy metals using continous limitation scores. Comput Geosci33:1316–1326
Suyash Kumar KD, Shirke N, Pawar J (2007) GIS-based colour composites andrelays to delineate heavy metal contamination zones in the shallow alluvialaquifers, Ankaleshwar industrial estate, south Gujarat, Ipdia. Environ Geol54:117–129
doi:10.1186/2193-2697-3-3Cite this article as: Soffianian et al.: Risk assessment of heavy metal soilpollution through principal components analysis and false colorcomposition in Hamadan Province, Iran. Environmental Systems Research2014 3:3.