Embed Size (px)
Citation preview

the bmj | BMJ 2021;374:n2244 | doi: 10.1136/bmj.n2244 1
RESEARCH
Risk prediction of covid-19 related death and hospital admission in adults after covid-19 vaccination: national prospective cohort studyJulia Hippisley-Cox,1 Carol AC Coupland,1,2 Nisha Mehta,3 Ruth H Keogh,4 Karla Diaz-Ordaz,4 Kamlesh Khunti,5 Ronan A Lyons,6 Frank Kee,7 Aziz Sheikh,8 Shamim Rahman,9 Jonathan Valabhji,10 Ewen M Harrison,8 Peter Sellen,9 Nazmus Haq,9 Malcolm G Semple,11 Peter W M Johnson,10 Andrew Hayward,12 Jonathan S Nguyen-Van-Tam2,9
ABSTRACTOBJECTIVESTo derive and validate risk prediction algorithms to estimate the risk of covid-19 related mortality and hospital admission in UK adults after one or two doses of covid-19 vaccination.DESIGNProspective, population based cohort study using the QResearch database linked to data on covid-19 vaccination, SARS-CoV-2 results, hospital admissions, systemic anticancer treatment, radiotherapy, and the national death and cancer registries.SETTINGSAdults aged 19-100 years with one or two doses of covid-19 vaccination between 8 December 2020 and 15 June 2021.MAIN OUTCOME MEASURESPrimary outcome was covid-19 related death. Secondary outcome was covid-19 related hospital admission. Outcomes were assessed from 14 days after each vaccination dose. Models were fitted in the derivation cohort to derive risk equations using a range of predictor variables. Performance was
evaluated in a separate validation cohort of general practices.RESULTSOf 6 952 440 vaccinated patients in the derivation cohort, 5 150 310 (74.1%) had two vaccine doses. Of 2031 covid-19 deaths and 1929 covid-19 hospital admissions, 81 deaths (4.0%) and 71 admissions (3.7%) occurred 14 days or more after the second vaccine dose. The risk algorithms included age, sex, ethnic origin, deprivation, body mass index, a range of comorbidities, and SARS-CoV-2 infection rate. Incidence of covid-19 mortality increased with age and deprivation, male sex, and Indian and Pakistani ethnic origin. Cause specific hazard ratios were highest for patients with Down’s syndrome (12.7-fold increase), kidney transplantation (8.1-fold), sickle cell disease (7.7-fold), care home residency (4.1-fold), chemotherapy (4.3-fold), HIV/AIDS (3.3-fold), liver cirrhosis (3.0-fold), neurological conditions (2.6-fold), recent bone marrow transplantation or a solid organ transplantation ever (2.5-fold), dementia (2.2-fold), and Parkinson’s disease (2.2-fold). Other conditions with increased risk (ranging from 1.2-fold to 2.0-fold increases) included chronic kidney disease, blood cancer, epilepsy, chronic obstructive pulmonary disease, coronary heart disease, stroke, atrial fibrillation, heart failure, thromboembolism, peripheral vascular disease, and type 2 diabetes. A similar pattern of associations was seen for covid-19 related hospital admissions. No evidence indicated that associations differed after the second dose, although absolute risks were reduced. The risk algorithm explained 74.1% (95% confidence interval 71.1% to 77.0%) of the variation in time to covid-19 death in the validation cohort. Discrimination was high, with a D statistic of 3.46 (95% confidence interval 3.19 to 3.73) and C statistic of 92.5. Performance was similar after each vaccine dose. In the top 5% of patients with the highest predicted covid-19 mortality risk, sensitivity for identifying covid-19 deaths within 70 days was 78.7%.CONCLUSIONThis population based risk algorithm performed well showing high levels of discrimination for identifying those patients at highest risk of covid-19 related death and hospital admission after vaccination.
IntroductionDuring the first waves of the covid-19 pandemic (March 2020 to August 2020), before the introduction
For numbered affiliations see end of the articleCorrespondence to: J Hippisley-Cox [email protected] (or @JuliaHCox on Twitter; ORCID 0000-0002-2479-7283)Additional material is published online only. To view please visit the journal online.Cite this as: BMJ 2021;374:n2244 http://dx.doi.org/10.1136/bmj.n2244
Accepted: 13 September 2021
WHAT IS ALREADY KNOWN ON THIS TOPICThe original QCovid tool for predicting risk of covid-19 related death or hospital admission based on individual characteristics was used in England to identify patients at high risk of severe covid-19 outcomesIdentification of these high risk patients added an additional 1.5 million people to the national shielded patient list in February 2021On a UK basis, these patients would be prioritised for vaccination, if they had not already been offered the vaccine on account of their age or occupation
WHAT THIS STUDY ADDSCommissioned by the Chief Medical Officer for England on behalf of the UK government, two new risk prediction algorithms have been derived and validated to estimate the risk of covid-19 related mortality and hospital admission in UK adults, 14 days or more after vaccination when some immunity is expected to have developedSeveral clinical risk factors for severe covid-19 outcomes despite vaccination have been identified: Down’s syndrome, kidney transplantation, sickle cell disease, care home residency, chemotherapy, recent bone marrow transplantation or a solid organ transplantation ever, HIV/AIDS, dementia, Parkinson’s disease, neurological conditions, and liver cirrhosisThe QCovid3 risk algorithms (https://bmjSept2021.qcovid.org) showed high levels of discrimination for identifying adults at highest risk of covid-19 related death and hospital admission after vaccination; these risk stratification tools can help support public health policy and prioritise patients for targeted, early interventions
on 23 Novem
ber 2021 by guest. Protected by copyright.
http://ww
w.bm
j.com/
BM
J: first published as 10.1136/bmj.n2244 on 17 S
eptember 2021. D
ownloaded from

RESEARCH
2 doi: 10.1136/bmj.n2244 | BMJ 2021;374:n2244 | the bmj
of vaccines, it was essential to be able to identify people at highest risk of adverse outcomes if they were infected with SARS-CoV-2. The QCovid risk assessment tool for predicting risk of covid-19 related death or hospital admission based on individual characteristics was developed,1 independently externally validated,2 and found to have performed well at identifying those individuals at high risk of severe outcomes from covid-19. The tool was used in England to identify patients at high risk of severe covid-19 outcomes, adding an additional 1.5 million people to the national shielded patient list in February 2021 and, on a UK basis, prioritising them for vaccination (if they had not already been offered the vaccine on account of their age or occupation).3
Since then, clinical trials of covid-19 vaccinations have demonstrated safety and efficacy in healthy volunteers4-6 and have been rolled out to the adult UK population, beginning with the most elderly groups (aged ≥90 years) and those people most at risk. Although vaccines have been found to be highly effective in trials and observational studies, a residual risk of serious covid-19 outcomes (in particular, hospital admission or death) remains after vaccination, despite allowing adequate time for immunity to develop. The risk of a severe outcome in vaccinated groups includes the risk of exposure, the risk of a breakthrough infection if exposed, and the risk of a breakthrough infection becoming severe. However, the relevant risk factors are currently unknown because clinical trials have not included many people in whom vaccine response might be suboptimal (eg, elderly people, people with complex comorbidities (eg, in receipt of solid organ transplants or immunosuppressive treatment for autoimmune disorders), or patients with cancer receiving chemotherapy or radiotherapy7).
Therefore, vaccinated individuals at highest risk of consequent severe outcomes such as covid-19 related hospital admission or death need to be identified urgently. A risk stratification tool for the vaccinated population would enable identification of patients to prioritise for targeted, early interventions once these become available—including booster vaccination and preventive treatments such as passive antibody delivery (for either prophylactic or therapeutic use). Risk stratification tools also provide a robust pragmatic mechanism for avoiding unnecessary lifestyle precautions, investigations, and therapeutic interventions for those individuals whose risk is relatively low, but who might perceive it to be much higher.
We developed and validated two new QCovid risk algorithms, based on data from the second pandemic wave in England, to identify those groups at highest risk of severe covid-19 outcomes: QCovid2 (based on unvaccinated patients) and QCovid3 (based on vaccinated patients). Given the nature of the pandemic, the speed of the vaccination programme, the relaxation of lockdown measures, and the urgent need to develop national policy, this work had to be undertaken during the pandemic period and national vaccination
programme, and therefore included people who had only one vaccination dose as well as those who were fully vaccinated.
MethodsData sourcesWe used the QResearch database (version 46) of 12 million patients with personal, clinical, and drug data that have been used for clinical1 8 and drug safety research.9 10 QResearch is linked to multiple datasets at individual patient level. For this analysis, we used the National Immunisation Database of covid-19 vaccinations to identify data on vaccine date and doses for all people vaccinated in England. For hospital admissions, we used the linked Hospital Episode Statistics dataset supplemented by the more regularly updated Secondary Users Service data. We also obtained and linked the following datasets: national data for mortality; SARS-CoV-2 infection; systemic anticancer treatment; radiotherapy treatment datasets; and national cancer registry data.
Study design and period for vaccinated cohortWe undertook a prospective cohort study of vaccinated individuals from 8 December 2020 (the earliest vaccination date in England) to 15 June 2021 (the latest date for which data were available at the time of the analysis). We considered outcomes after the first and second vaccination doses. The cohort included people who received one or two doses of a covid-19 vaccine during the study period. Individuals were followed from 14 days after receiving each vaccine dose until they had the outcome of interest, died, or reached the end of the study period. Use of follow-up time after the first dose and after the second dose is described below.
Inclusion criteria for vaccinated cohortWe included all adults aged 19-100 years who had one or two doses of the ChAdOx1 nCoV-19 (Oxford-AstraZeneca) or BNT162b2 (Pfizer-BioNTech) vaccine during the study period. Both these vaccinations require two doses for full vaccination. People were excluded from the analysis of hospital outcomes if they had a covid-19 associated hospital admission before their start of follow-up (14 days after the first or second dose of vaccination).
Outcomes for vaccinated cohortThe primary outcome was time to covid-19 related death (either in or out of hospital) as recorded on the death certification, or death within 28 days of a SARS-CoV-2 infection confirmed by reverse transcription polymerase chain reaction (RT-PCR). The secondary outcome was time to hospital admission with covid-19, defined as either confirmed or suspected covid-19 on ICD-10 (international classification of diseases, 10th revision) codes U071 and U072, or new hospital admission associated with a confirmed SARS-CoV-2 infection in the preceding 14 days. These outcome definitions are also used for covid-19 death and hospital admission in the UK.11 Both outcomes
on 23 Novem
ber 2021 by guest. Protected by copyright.
http://ww
w.bm
j.com/
BM
J: first published as 10.1136/bmj.n2244 on 17 S
eptember 2021. D
ownloaded from

RESEARCH
the bmj | BMJ 2021;374:n2244 | doi: 10.1136/bmj.n2244 3
were assessed from 14 days or more after the first and second doses of vaccination, from which time we considered it was reasonable to expect some immunity.
Predictor variables for vaccinated cohortCandidate predictor variables likely to be associated with increased risk of covid-19 death or hospital admission were identified from the original QCovid protocol12 and from previous studies.1 8 13 The variables were vaccine dose (first or second), age, sex, ethnic origin, Townsend deprivation score (an area level score based on postcode where higher scores indicate higher levels of deprivation14), body mass index,13 domicile (care home, homeless, neither), chronic kidney disease, chemotherapy in previous 12 months, type 1 or type 2 diabetes (with glycated haemoglobin (HbA1c) levels <59 or ≥59 mmol/mol), blood cancer, bone marrow transplantation in past six months, respiratory cancer, radiotherapy in past six months, solid organ transplantation, chronic obstructive pulmonary disease, asthma, rare lung diseases (cystic fibrosis, bronchiectasis, or alveolitis), pulmonary hypertension or pulmonary fibrosis, coronary heart disease, stroke, atrial fibrillation, heart failure, venous thromboembolism, peripheral vascular disease, congenital heart disease, dementia, Parkinson’s disease, epilepsy, rare neurological conditions (motor neurone disease, multiple sclerosis, myasthenia gravis, or Huntington’s chorea), cerebral palsy, osteoporotic fracture, rheumatoid arthritis or systemic lupus erythematosus, liver cirrhosis, bipolar disorder or schizophrenia, inflammatory bowel disease, sickle cell disease, HIV/AIDS, severe combined immunodeficiency, and record of a SARS-CoV-2 positive test result before cohort entry.
To account for changing infection rates during the study period (since the vaccination programme was started during the second pandemic wave in England), we calculated a seven-day moving average of the background rates of positive SARS-CoV-2 tests per 100 000 people, using published English national data.15 We linked the rate to the date of cohort entry for each individual (that is, 14 days after each vaccine dose).
We defined predictors using information recorded in primary care electronic health records at the start of follow-up at 14 days after the first dose, except for chemotherapy, radiotherapy, and transplantations, which were based on linked data related to systemic anticancer and radiotherapy treatment, Hospital Episode Statistics data, and Secondary Users Service data. For all predictor variables, we used the most recently available value at the cohort entry date.
Model developmentTo maximise the number of events after second dose of vaccine, we used all 1336 practices with linked data available up to 15 June 2021 at the time of model development. We subsequently validated it in the remaining 182 practices once the updated linked data to 15 June 2021 became available a few weeks later.
People entered the cohort at 14 days after their first vaccination dose. We used a landmarking approach16 to handle the time dependent dose variable, because some people contributed follow-up time after their second dose as well as after their first dose. For people with only one dose, we followed them up until they had the event of interest, died, or reached the study end. For those with two vaccination doses, we split follow-up time into two periods. Period 1 included the time from 14 days after their first vaccination dose until 14 days after their second dose (therefore, outcomes during the first 14 days after the second dose were attributed to the first dose). Period 2 included time from 14 days after their second dose until they had the event of interest, died, or reached the study end. We fitted all models using combined data from follow-up after the first and second doses, with dose number entered into the model as a predictor.
We developed the risk models using cause specific Cox proportional hazard models to calculate hazard ratios and develop risk scores accounting for the competing risk of death due to other causes. A hazard ratio is a measure of the rate at which a particular outcome happens in one group relative to the rate at which it happens in another group over time. We fitted two cause specific Cox models to derive a risk algorithm for our primary outcome—one for covid-19 deaths and one for deaths due to other causes, censoring patients with the respective competing event. For our secondary outcome, we fitted one model for covid-19 admission and another model for all cause mortality (excluding deaths occurring after a covid-19 admission).
We used second degree fractional polynomials to model non-linear associations for continuous variables including SARS-Cov-2 infection rates, age, body mass index, and Townsend deprivation score.14 We fitted the models to the complete cases (that is, with no missing values for predictor variables) to derive the fractional polynomial terms. We used multiple imputation with chained equations to impute missing values for ethnic origin, Townsend score, body mass index, and HbA1c. We carried out five imputations and fitted the prediction models in each imputed dataset, and used Rubin’s rules to combine the model parameter estimates across the imputed datasets.17
We retained variables in the final models that were significant at the 5% level (taking account of the clustered nature of the data) or when adjusted cause specific hazard ratios for categorical variables were more than 1.1. Clinically similar variables with low numbers of events, such as bone marrow and solid organ transplantation, were combined. We examined interactions between predictor variables and age, as well as interactions between vaccine dose and age, body mass index, ethnic origin, deprivation, and each comorbidity. Furthermore, we derived estimates of the cumulative incidence function for covid-19 mortality accounting for the competing risk of death from other causes by combining estimates obtained from the two cause specific Cox models using an appropriate formula.18 The same method was used to derive the
on 23 Novem
ber 2021 by guest. Protected by copyright.
http://ww
w.bm
j.com/
BM
J: first published as 10.1136/bmj.n2244 on 17 S
eptember 2021. D
ownloaded from
RESEARCH
4 doi: 10.1136/bmj.n2244 | BMJ 2021;374:n2244 | the bmj
cumulative incidence function for covid-19 hospital admission, accounting for competing risk of death. These final algorithms for predicting absolute risk in vaccinated individuals are referred to as QCOVID3.18
We developed an additional model restricted to vaccinated patients with a positive SARS-CoV-2 test result after vaccination. This model separately quantified the risk of severe outcomes (mortality and admission) in individuals with a record of infection.
Model evaluationWe evaluated model performance in the separate validation cohort. We used multiple imputation to replace missing values for ethnic origin, body mass index, and Townsend score; the imputation model used was the same as that used in the derivation cohort. We applied the final risk equations to calculate the risk scores for each outcome accounting for competing risks, and calculated a C index accounting for competing risks using R.19 We also calculated R2 values and D statistics20 although these statistics were only available for the cause specific outcomes.
We assessed model calibration in the validation cohort accounting for competing risks by comparing mean predicted risks with the observed cumulative incidence function by twentieths of predicted risk.21 A model is well calibrated if predicted risks closely approximate the observed risks. We calculated each metric in the whole validation cohort, separately for individuals who had received one and two vaccination doses, and in subgroups for age and sex (ethnic groups had too few patients to undertake analyses).
Risk stratificationWe applied the algorithms to the validation cohort to define the centile thresholds based on absolute risk using the prevailing SARS-CoV-2 rate 14 days after the date of each vaccination dose. Sensitivity was calculated as the total cumulative number of patients with a risk score above the risk threshold with a covid-19 death by 70 days divided by the total cumulative number of patients with a covid-19 death by 70 days.
QCovid2 model in the unvaccinated cohortWe also developed and evaluated two additional models (QCovid2) based on a cohort of unvaccinated people aged 19-100 years and observed between 1 September 2020 and 31 May 2021 but censoring people who were subsequently vaccinated on the date of their first vaccination. Additional variables not included in the original QCovid model were used, such as inflammatory bowel disease and levels of diabetes control according to HbA1c measurements. We also examined separate variables for sickle cell disease, HIV/AIDs, immunodeficiency conditions, and a refined definition of severe mental illness (to determine the contribution of moderate and severe depression). The first model included all unvaccinated patients (restricting to the time before vaccination for those who were subsequently vaccinated). The second
model was restricted to unvaccinated patients with a positive SARS-CoV-2 test result, to separately quantify the risk of SARS-CoV-2 infection from the risk of severe outcomes (covid-19 mortality and admission) in those people with a positive test result. These final algorithms for predicting absolute risk in unvaccinated individuals are referred to as QCovid2.
ReportingStata (version 17) and R were used for analyses. The study adhered to the TRIPOD (transparent reporting of a multivariable prediction model for individual prognosis or diagnosis) statement for reporting.22
Patient and public involvementPatients were involved in framing the research question, identifying predictors, and in developing plans for design and implementation of the study.
ResultsCharacteristics of the vaccinated cohortTable 1 shows the characteristics of the 6 952 440 vaccinated patients in the derivation cohort, of whom 4 026 592 (57.9%) had the Oxford-AstraZeneca vaccine and 2 925 848 (42.1%) had the Pfizer-BioNTech vaccine. Overall, the mean age was 52 years (standard deviation 17.7), 3 321 247 (47.8%) were men, and 5 150 310 (74.1%) had two vaccine doses. The median follow-up time was 72 days (interquartile range 59-77) after the first dose and 35 (18-53) days after the second dose. Of 2031 covid-19 related deaths and 1929 covid-19 related hospital admissions, 81 deaths and 71 admissions occurred 14 days or more after the second vaccine dose. Of the 1929 patients in hospital, 446 (23.1%) subsequently died. Supplementary table 1 shows corresponding results for the 626 656 vaccinated patients in the validation cohort, of whom 174 had a covid-19 death and 179 had a covid-19 hospital admission. Of these, 10 deaths and seven admissions occurred 14 days or more after the second vaccine dose.
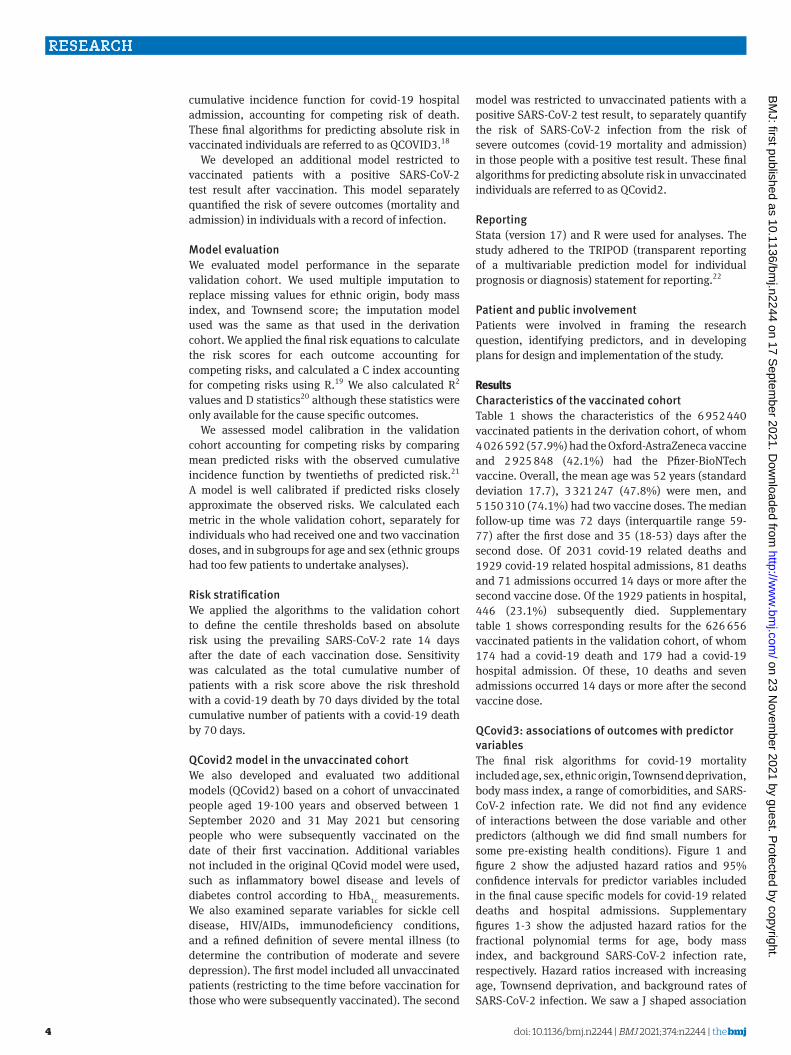
QCovid3: associations of outcomes with predictor variablesThe final risk algorithms for covid-19 mortality included age, sex, ethnic origin, Townsend deprivation, body mass index, a range of comorbidities, and SARS-CoV-2 infection rate. We did not find any evidence of interactions between the dose variable and other predictors (although we did find small numbers for some pre-existing health conditions). Figure 1 and figure 2 show the adjusted hazard ratios and 95% confidence intervals for predictor variables included in the final cause specific models for covid-19 related deaths and hospital admissions. Supplementary figures 1-3 show the adjusted hazard ratios for the fractional polynomial terms for age, body mass index, and background SARS-CoV-2 infection rate, respectively. Hazard ratios increased with increasing age, Townsend deprivation, and background rates of SARS-CoV-2 infection. We saw a J shaped association
on 23 Novem
ber 2021 by guest. Protected by copyright.
http://ww
w.bm
j.com/
BM
J: first published as 10.1136/bmj.n2244 on 17 S
eptember 2021. D
ownloaded from

RESEARCH
the bmj | BMJ 2021;374:n2244 | doi: 10.1136/bmj.n2244 5
Characteristics Total (n=6 952 440)Covid-19 deaths (n=2031)
Covid-19 admissions (n=1929)
Sex: Women 3 631 193 (52.23) 981 (48.30) 983 (50.96) Men 3 321 247 (47.77) 1050 (51.70) 946 (49.04)Mean age (SD) 52.46 (17.73) 84.48 (9.15) 77.36 (14.84)Mean Townsend deprivation score (SD) −0.17 (2.98) −0.25 (2.76) −0.05 (2.92)Mean body mass index (SD) 27.30 (5.64) 26.04 (5.89) 27.90 (6.18)Mean background SARS-CoV-2 daily infection rate per 100 000 population (SD) 21.34 (22.80) 60.05 (21.06) 52.93 (22.38)No of patients with SARS-Co-2 positive test result before vaccination
414 163 (5.96) 147 (7.24) 78 (4.04)
Age (years): <30 771 125 (11.09) — 19 (0.98) 30-39 1 105 120 (15.90) — 43 (2.23) 40-49 1 218 902 (17.53) 9 (0.44) 71 (3.68) 50-59 1 402 707 (20.18) 38 (1.87) 121 (6.27) 60-69 1 090 778 (15.69) 81 (3.99) 160 (8.29) 70-79 860 179 (12.37) 327 (16.10) 377 (19.54) 80-89 414 752 (5.97) 960 (47.27) 830 (43.03) ≥90 88 877 (1.28) 614 (30.23) 308 (15.97)Covid-19 vaccination: 1 dose 1 802 130 (25.92) 1947 (95.86) 1858 (96.32) 2 doses 5 150 310 (74.08) 81 (4.14) 71 (3.68)Ethnic origin: White 4 781 050 (68.77) 1512 (74.45) 1466 (76.00) Indian 202 528 (2.91) 44 (2.17) 51 (2.64) Pakistani 111 873 (1.61) 27 (1.33) 46 (2.38) Bangladeshi 81 197 (1.17) 8 (0.39) 14 (0.73) Other Asian 117 061 (1.68) 13 (0.64) 22 (1.14) Caribbean 48 486 (0.70) 15 (0.74) 13 (0.67) Black African 113 663 (1.63) 4 (0.20) 11 (0.57) Chinese 41 595 (0.60) — — Other 187 576 (2.70) 15 (0.74) 20 (1.04)Chronic kidney disease: None 6 597 783 (94.90) 1231 (60.61) 1290 (66.87) Stage 3 319 898 (4.60) 662 (32.59) 531 (27.53) Stage 4 17 914 (0.26) 85 (4.19) 56 (2.90) Stage 5 only 10 098 (0.15) 45 (2.22) 27 (1.40) Stage 5 with dialysis 2182 (0.03) — 10 (0.52) Stage 5 with transplant 4565 (0.07) 5 (0.25) 15 (0.78)Chemotherapy: None in past 12 months 6 911 085 (99.41) 1978 (97.39) 1891 (98.03) Group A 14 518 (0.21) 9 (0.44) 12 (0.62) Group B 25 087 (0.36) 42 (2.07) 25 (1.30) Group C 1750 (0.03) — —Type 1 diabetes: No type 1 diabetes 6 911 191 (99.41) 2023 (99.61) 1919 (99.48) HbA1c ≤59 mmol/mmol (≤7.5%) 13 536 (0.19) — — HbA1c >59 mmol/mol (>7.5%) 27 276 (0.39) 5 (0.25) 9 (0.47) HbA1c not recorded 437 (0.01) — —Type 2 diabetes: No type 2 diabetes 6 375 340 (91.70) 1486 (73.17) 1385 (71.80) HbA1c ≤59 mmol/mol (≤7.5%) 370 653 (5.33) 382 (18.81) 347 (17.99) HbA1c >59 mmol/mol (>7.5%) 203 998 (2.93) 159 (7.83) 196 (10.16) HbA1c not recorded 2449 (0.04) — —Other pre-existing health conditions: Blood cancer 46 748 (0.67) 72 (3.55) 67 (3.47) Bone marrow transplantation in past 6 months or solid organ transplantation ever 1979 (0.03) — 7 (0.36) Respiratory cancer 17 401 (0.25) 29 (1.43) 19 (0.98) Radiotherapy in past 6 months 12 011 (0.17) 19 (0.94) 16 (0.83) Down’s syndrome 3963 (0.06) — — Chronic obstructive pulmonary disease 199 780 (2.87) 278 (13.69) 216 (11.20) Coronary heart disease 318 851 (4.59) 530 (26.10) 456 (23.64) Stroke 193 710 (2.79) 407 (20.04) 282 (14.62) Atrial fibrillation 222 783 (3.20) 479 (23.58) 399 (20.68)
Table 1 | Personal and medical characteristics for the derivation cohort and covid-19 related death or hospital admission 14 days or more after vaccination. Data are number (%) unless stated otherwise
(Continued)
on 23 Novem
ber 2021 by guest. Protected by copyright.
http://ww
w.bm
j.com/
BM
J: first published as 10.1136/bmj.n2244 on 17 S
eptember 2021. D
ownloaded from

RESEARCH
6 doi: 10.1136/bmj.n2244 | BMJ 2021;374:n2244 | the bmj
between body mass index and rates of both hospital admission and mortality outcomes. Supplementary figures 4 and 5 show the adjusted hazard ratios for the competing events of non-covid-19 death and all cause deaths.
Covid-19 mortality incidence increased with age and deprivation, male sex, and Indian and Pakistani ethnic origin. Hazard ratios were highest for those with Down’s syndrome (12.7-fold increase), kidney transplantation (8.1-fold), sickle cell disease (7.7-fold), care home residency (4.1-fold), group B (3.6-fold) and group C chemotherapy (4.3-fold), recent bone marrow transplantation or a solid organ transplantation ever (2.5-fold), HIV/AIDS (3.3-fold), dementia (2.2-fold), Parkinson’s disease (2.2-fold), neurological conditions (2.6-fold), and liver cirrhosis (3.0-fold). Other conditions associated with increased covid-19 mortality included chronic kidney disease, blood cancer, epilepsy, chronic obstructive pulmonary disease, coronary heart disease, stroke, atrial fibrillation, heart failure, thromboembolism, peripheral vascular disease, and type 2 diabetes (with highest risks among those with HbA1c ≥59 mmol/mol (>7.5%)). The adjusted hazard ratio for covid-19 related death was 0.17 (95% confidence interval 0.13 to 0.22) after the second vaccine dose (plus 14 days) compared with after the first vaccine dose (plus 14 days).
We found similar patterns of associations between predictors and the cause specific hazard for covid-19 admission (fig 2) except for conditions with too few events for analysis (that is, sickle cell disease, severe combined immunodeficiency, and HIV/AIDS). Similarly, the adjusted hazard ratio of covid-19 related hospital admission was 0.21 (95% confidence interval 0.16 to 0.27) after the second dose compared with after the first dose.
Supplementary figure 6 shows the corresponding results for risk of covid-19 death among the subgroup of patients with a SARS-CoV-2 positive test result. The associations for each factor in the restricted model were similar to those of the main QCovid3 model apart from ethnic origin (for which no significant associations were seen) and conditions with too few events for analysis (sickle cell disease, severe combined immunodeficiency, HIV/AIDS). All associations with
pre-existing health conditions reported are conditional on the other predictors in the model and do not necessarily have a causal interpretation.
QCovid3 model evaluation of performanceTable 2 shows the performance of the risk equations in the validation cohort. The QCovid3 algorithm for covid-19 related death explained 74.1% (95% confidence interval 71.1% to 77.0%) of the variation in time to covid-19 death, the Royston’s D statistic was 3.46 (3.19 to 3.73) and the Harrell’s C statistic was 92.5. Results were similar in men and women. Corresponding results restricted to the first vaccine dose were 71.3% (67.9% to 74.7%), 3.23 (2.96 to 3.50), and 93.6. The results restricting to the validation cohort after the second vaccine dose were similar but with wider confidence intervals owing to smaller numbers. The values for the R2, D, and C statistics were similar for the hospital admission equation. Supplementary table 2 shows the corresponding results for covid-19 death and hospital admission by age band where performance tended to be lower in the higher age bands.
Figure 3 shows the calibration plot for covid-19 related deaths and figure 4 shows the corresponding results for covid-19 related hospital admission, both accounting for competing risks. Model calibration was assessed by comparing mean predicted risks with the observed cumulative incidence function by twentieths of predicted risk21; a model is well calibrated if predicted risks closely approximate the observed risks. These plots showed reasonable correspondence between observed and predicted cumulative incidences at 70 days of follow-up. However, numbers of events were small in several groups, and in the higher twentieths we saw slight under-prediction for covid-19 death (fig 3) and in twentieths 17-19 for the admissions outcome (fig 4). For example, in the top twentieth of predicted risks for covid-19 death, the observed cumulative incidence was 0.28% over 70 days (95% confidence interval 0.24% to 0.33%) and the mean predicted risk was 0.25%.
QCovid3 risk stratificationTable 3 shows the percentage of covid-19 related deaths identified by the QCovid3 mortality equation
Characteristics Total (n=6 952 440)Covid-19 deaths (n=2031)
Covid-19 admissions (n=1929)
Heart failure 105 427 (1.52) 308 (15.16) 241 (12.49) Venous thromboembolism 158 464 (2.28) 216 (10.64) 140 (7.26) Peripheral vascular disease 63 553 (0.91) 131 (6.45) 97 (5.03) Dementia 81 320 (1.17) 631 (31.07) 305 (15.81) Parkinson’s disease 22 489 (0.32) 84 (4.14) 38 (1.97) Epilepsy 109 204 (1.57) 49 (2.41) 61 (3.16) Rare neurological conditions 27 312 (0.39) 20 (0.98) 18 (0.93) Liver cirrhosis 17 457 (0.25) 27 (1.33) 19 (0.98) Sickle cell disease 2073 (0.03) — — HIV/AIDS 15 218 (0.22) — — Severe combined immunodeficiency 3853 (0.06) — —SD=standard deviation; HbA1c=glycated haemogoblin. Chemotherapy groups are defined in supplementary box A of reference 1.
Table 1 | Continued
on 23 Novem
ber 2021 by guest. Protected by copyright.
http://ww
w.bm
j.com/
BM
J: first published as 10.1136/bmj.n2244 on 17 S
eptember 2021. D
ownloaded from

RESEARCH
the bmj | BMJ 2021;374:n2244 | doi: 10.1136/bmj.n2244 7
Two vaccine doses v one doseMale patients v female patientsTownsend deprivation (5 unit increase) score
WhiteIndianPakistaniBangladeshiOther AsianCaribbeanBlack africanChineseOther ethnic group
Not in care home or homelessLives in care homeHomeless
No kidney failureCKD stage 3CKD stage 4CKD stage 5CKD stage 5 (dialysis)CKD stage 5 (transplantation)
No chemotherapy in past yearChemotherapy grade AChemotherapy grade BChemotherapy grade C
No type 2 diabetesType 2 HbA
1c <59 mmol/mol
Type 2 HbA1c
≥59 mmol/mol
Blood cancerBone marrow or solid organ transplantationRespiratory tract cancerRadiotherapy in past 6 monthsDown’s syndromeChronic obstructive pulmonary diseaseCoronary heart diseaseStrokeAtrial fibrillationCongestive cardiac failureThromboembolismPeripheral vascular diseaseDementiaParkinson’s diseaseEpilepsyRare neurological conditionsLiver cirrhosisSchizophrenia or bipolar disorderSickle cell diseaseHIV/AIDSSevere combined immunodeficiency
0.17 (0.13 to 0.22)1.89 (1.72 to 2.08)1.27 (1.17 to 1.37)
11.59 (1.16 to 2.18)2.28 (1.59 to 3.27)0.95 (0.47 to 1.93)1.15 (0.65 to 2.04)0.70 (0.42 to 1.17)0.45 (0.17 to 1.21)0.43 (0.08 to 2.39)0.83 (0.51 to 1.34)
14.14 (3.66 to 4.68)
2.05 (0.29 to 14.58)
11.23 (1.12 to 1.36)1.96 (1.56 to 2.46)2.81 (2.08 to 3.80)2.33 (0.75 to 7.25)
8.07 (3.34 to 19.54)
10.96 (0.49 to 1.85)3.63 (2.57 to 5.12)
4.30 (1.06 to 17.51)
11.26 (1.12 to 1.42)1.43 (1.21 to 1.70)
1.42 (1.09 to 1.85)2.49 (0.62 to 10.08)1.65 (1.13 to 2.39)2.62 (1.65 to 4.15)
12.68 (4.68 to 34.38)1.52 (1.33 to 1.73)1.18 (1.07 to 1.32)1.21 (1.08 to 1.36)1.15 (1.03 to 1.28)1.43 (1.25 to 1.63)1.45 (1.26 to 1.67)1.31 (1.09 to 1.57)2.23 (1.98 to 2.50)2.23 (1.79 to 2.78)1.13 (0.85 to 1.50)2.63 (1.69 to 4.08)2.96 (2.02 to 4.34)1.12 (0.77 to 1.63)
7.73 (1.07 to 55.83)3.29 (1.05 to 10.29)1.31 (0.33 to 5.27)
0.0625 0.25 4 161 64
Adjusted hazardratio (95% CI)
Adjusted hazardratio (95% CI)
Fig 1 | Use of QCovid3 model showing adjusted cause specific hazard ratios for covid-19 death after vaccination, mutually adjusted and adjusted for fractional polynomial terms for age, body mass index, vaccination dose, and background infection rate at time of vaccination. CKD=chronic kidney disease; HbA1c=glycated haemogoblin
on 23 Novem
ber 2021 by guest. Protected by copyright.
http://ww
w.bm
j.com/
BM
J: first published as 10.1136/bmj.n2244 on 17 S
eptember 2021. D
ownloaded from
RESEARCH
8 doi: 10.1136/bmj.n2244 | BMJ 2021;374:n2244 | the bmj
at different thresholds based on centiles of predicted absolute risk in the validation cohort, using the background SARS-CoV-2 infection rate associated with 14 days after vaccination. For example, it shows that
78.7% of deaths occurred in individuals in the top 5% for predicted absolute risk of covid-19 death (predicted absolute risks at 70 days above 0.06%). Individuals in the top 20% for predicted absolute risk of death
Two vaccine doses v one doseMale patients v female patientsTownsend deprivation (5 unit increase) score
WhiteIndianPakistaniBangladeshiOther AsianCaribbeanBlack africanChineseOther ethnic group
No kidney failureCKD stage 3CKD stage 4CKD stage 5CKD stage 5 (dialysis)CKD stage 5 (transplantation)
No chemotherapy in past yearChemotherapy grade AChemotherapy grade BChemotherapy grade C
No type 2 diabetesType 2 HbA
1c <59 mmol/mol
Type 2 HbA1c
≥59 mmol/mol
Care homeBlood cancerBone marrow or solid organ transplantation Respiratory tract cancerDown’s syndromeChronic obstructive pulmonary diseaseCoronary heart diseaseStrokeAtrial fibrillationCongestive cardiac failureThromboembolismPeripheral vascular diseaseDementiaParkinson’s diseaseEpilepsyRare neurological conditionsLiver cirrhosisSchizophrenia or bipolar disorder
0.21 (0.16 to 0.27)1.31 (1.20 to 1.44)1.41 (1.30 to 1.53)
11.32 (1.00 to 1.75)2.49 (1.86 to 3.33)1.24 (0.73 to 2.10)1.28 (0.83 to 1.98)0.67 (0.38 to 1.18)0.72 (0.41 to 1.26)0.45 (0.11 to 1.79)0.84 (0.55 to 1.28)
11.30 (1.17 to 1.45)1.73 (1.32 to 2.28)2.23 (1.52 to 3.28)
7.37 (3.95 to 13.77)12.82 (7.65 to 21.47)
11.27 (0.71 to 2.24)1.67 (1.09 to 2.55)1.16 (0.16 to 8.35)
11.28 (1.13 to 1.44)1.76 (1.50 to 2.05)
1.69 (1.43 to 2.01)1.86 (1.43 to 2.43)
6.81 (3.18 to 14.56)1.35 (0.86 to 2.13)
2.55 (0.63 to 10.28)1.28 (1.11 to 1.48)1.30 (1.16 to 1.46)1.15 (1.01 to 1.32)1.35 (1.20 to 1.53)1.37 (1.18 to 1.60)1.13 (0.95 to 1.34)1.20 (0.97 to 1.48)2.07 (1.79 to 2.39)1.47 (1.06 to 2.03)1.70 (1.32 to 2.20)2.30 (1.44 to 3.65)1.79 (1.13 to 2.83)2.12 (1.55 to 2.89)
0.0625 0.25 4 161 64
Adjusted hazardratio (95% CI)
Adjusted hazardratio (95% CI)
Fig 2 | Use of QCovid3 model showing adjusted cause specific hazard ratios for covid-19 hospital admission after vaccination, mutually adjusted and adjusted for fractional polynomial terms for age, body mass index, vaccination dose, and background infection rate at time of vaccination. CKD=chronic kidney disease; HbA1c=glycated haemogoblin
on 23 Novem
ber 2021 by guest. Protected by copyright.
http://ww
w.bm
j.com/
BM
J: first published as 10.1136/bmj.n2244 on 17 S
eptember 2021. D
ownloaded from

RESEARCH
the bmj | BMJ 2021;374:n2244 | doi: 10.1136/bmj.n2244 9
accounted for 98.9% of deaths. Table 4 summarises the characteristics of individuals at the highest predicted absolute risk of covid-19 death (top 5%). Box 1 lists clinical examples of patients and their predicted covid-19 risks (https://bmjSept2021.qcovid.org).
QCovid2 model in unvaccinated patientsSupplementary figure 7 shows the adjusted hazard ratios for risk of covid-19 death for men and women in the comparison cohort of unvaccinated individuals using the QCovid2 model. Supplementary figure 8 shows the corresponding results for covid-19 hospital admission. These models are updated versions of the original QCovid model from our earlier publication.1 The new models include additional variables for inflammatory bowel disease, levels of diabetes control (according to measured HbA1c values), separate variables for sickle cell disease, HIV/AIDS, and severe combined immunodeficiency, and a refined definition of severe mental illness (which now includes only schizophrenia or bipolar disease but does not include moderate and severe depression).
The hazard ratios for QCovid2 were generally similar in magnitude and direction for the subset of variables included in our main model (QCovid3). However, some additional variables included in the QCovid2 model did not reach statistical significance or resulted in hazard ratios lower than 1.1, and hence were not included in the main QCovid3 model. These variables were type 1 diabetes, asthma, rare lung conditions, pulmonary fibrosis or pulmonary hypertension, congenital heart disease, cerebral palsy, inflammatory bowel disease, and severe mental illness (schizophrenia or bipolar disorder).
Supplementary table 3 shows similar performance statistics for discrimination and explained variation for the main QCovid2 model when compared with the original QCovid model evaluated in the validation cohort. Supplementary figures 9 and 10 show adjusted hazard ratios from a similar analysis for risk of covid-19 death and hospital admission in unvaccinated patients but restricted to individuals with a positive SARS-CoV-2 test result.
DiscussionPrincipal findingsWe have identified a range of important clinical risk factors for severe covid-19 outcomes in people in the UK, 14 days or more after covid-19 vaccination (first or second dose) when some immunity is expected to have developed. We have used national linked datasets from general practice, national immunisation and SARS-CoV-2 testing, death registry, and hospital episode data for a population representative sample of more than 6.9 million adults. Risk ratios were highest for people with Down’s syndrome, kidney transplantation, sickle cell disease, care home residency, chemotherapy, recent bone marrow transplantation or solid organ transplantation ever, HIV/AIDS, dementia, Parkinson’s disease, neurological conditions, and liver cirrhosis. We also developed and evaluated novel clinical risk prediction models to estimate the absolute risks of covid-19 related hospital admission and mortality in the general population of vaccinated people as well as in the subset of people with positive SARS-CoV-2 test results. The risk models showed high levels of discrimination (C statistics ≥0.88 for the primary outcome, covid-19 death) and good calibration.
Table 2 | Performance of QCovid3 risk model in the validation cohort for covid-19 related death and hospital admission
Covid-19 death Covid-19 admissionOverallHarrell’s C statistic 92.5 85.3R2 74.1 (71.1 to 77) 65.7 (61.8 to 69.6)Royston’s D statistic 3.46 (3.19 to 3.73) 2.83 (2.59 to 3.08)WomenHarrell’s C statistic 94.4 86.8R2 75.4 (71.6 to 79.3) 66.4 (60.9 to 71.9)Royston’s D statistic 3.59 (3.22 to 3.96) 2.88 (2.52 to 3.23)MenHarrell’s C statistic 90.4 83.6R2 72.7 (68.5 to 76.9) 64.9 (59.5 to 70.4)Royston’s D statistic 3.34 (2.99 to 3.7) 2.79 (2.45 to 3.12)One dose of vaccine onlyHarrell’s C statistic 93.6 85.5R2 71.3 (67.9 to 74.7) 60 (55.2 to 64.7)Royston’s D statistic 3.23 (2.96 to 3.5) 2.5 (2.26 to 2.75)Two doses of vaccineHarrell’s C statistic 81.7 79.3R2 70 (54.5 to 85.6) 72.1 (57.3 to 87)Royston’s D statistic 3.13 (1.97 to 4.29) 3.29 (2.08 to 4.51)Harrell’s C statistic=time dependent area under the curve accounting for competing risks; confidence intervals could not be obtained.
Twentieth of predicted risk at 70 days’ follow-up
Ris
k of
cov
id-1
9 de
ath
(%)
0
0.10
0.15
0.25
0.20
0.30
0.05
0 2 4 6 8 10 12 14 16 18 20
Observed risk Predicted risk
Fig 3 | Calibration of the QCovid3 risk model to predict covid-19 related death after vaccination. Data source: QResearch England, 8 December 2020 to 15 June 2021, https://www.qresearch.org/
Twentieth of predicted risk at 70 days’ follow-up
Ris
k of
cov
id-1
9 de
ath
(%)
0
0.10
0.15
0.25
0.20
0.30
0.05
0 2 4 6 8 10 12 14 16 18 20
Observed risk Predicted risk
Fig 4 | Calibration of the QCovid3 risk model to predict covid-19 related hospital admission after vaccination. Data source: QResearch England, 8 December 2020 to 15 June 2021, https://www.qresearch.org/
on 23 Novem
ber 2021 by guest. Protected by copyright.
http://ww
w.bm
j.com/
BM
J: first published as 10.1136/bmj.n2244 on 17 S
eptember 2021. D
ownloaded from

RESEARCH
10 doi: 10.1136/bmj.n2244 | BMJ 2021;374:n2244 | the bmj
For many of the predictors included in the original QCovid model (contributing to risk prediction in an unvaccinated population during wave 1), the magnitude of the relative risks is broadly comparable in both QCovid2 (risk prediction in an unvaccinated population, wave 2) and QCovid3 (risk prediction in a vaccinated population, wave 2). Although these associations cannot be given a causal interpretation, individual characteristics such as age,23 obesity, pre-existing medical conditions, and socioeconomic disadvantage24 are known to affect immune competence25 and, at least for certain diseases, affect the response to some vaccines26-30 or to immunosuppressive drugs.7 31 The associations with Down’s syndrome in all the models are likely to reflect increased susceptibility to infection and genetic predisposition.8 Compared with the white ethnic group, the Pakistani and Indian groups had up to twofold increased hazards of covid-19 death and hospital admission after vaccination in the full QCovid3 model. These ethnic disparities in covid-19 outcomes could represent residual differential exposure (eg, linked to behaviour, lifestyle, household size, and occupation) more than differential susceptibility mechanisms,32 although we also acknowledge that being vaccinated could change behaviour (and exposure) in some groups more than in others.
These risk models can be deployed in several health and care settings, either during the current phase of the pandemic or in subsequent waves of infection (with recalibration as required); however, absolute risk for individuals will always depend on disease prevalence and personal exposures. Uses of QCovid3 could include supporting targeted recruitment for clinical trials, prioritisation of vaccine boosters, future preventive treatments such as prophylactic passive monoclonal antibody protection, shielding, and discussions between individuals and clinicians on workplace or health risk mitigation (eg, through improved glycaemic control, weight reduction,33or general risk avoidance behaviours). Our QCovid3 model provides absolute risks conditional on patient characteristics, including whether they have received one or two doses of a covid-19 vaccine, and on the underlying prevailing infection levels. It also enables individuals to be ranked in terms of their risk. The deployment of drug and non-drug interventions to protect individuals with residual vulnerability after vaccination needs to be considered in the context of absolute risks of severe outcomes at the
time of making predictions. Absolute risks are related to both the prevalence of SARS-CoV-2 infection in the population and the likelihood of SARS-CoV-2 exposure in a vaccinated adult population. Although these algorithms have been designed to inform UK health policy and interventions to manage covid-19 related risks, they also have international potential, subject to local validation. Previous similar risk prediction models have been validated internationally and shown to have good performance outside of the UK.34 35
Strengths and limitations of this studyOur study has some major strengths but also some important limitations, which include specific issues related to covid-19 along with factors similar to those for several other widely used clinical risk prediction algorithms developed using the QResearch database.36-38 Key strengths included the use of large, validated, representative, population based contemporaneous data sources that have been used to develop other widely used risk prediction tools36 37; the wealth of candidate risk predictors; the prospective recording of outcomes and their ascertainment using linkage of multiple national databases; lack of selection, recall, and respondent biases; and robust statistical analysis. We have used non-linear terms to model body mass index, age, and background SARS-CoV-2 infection rates. The inclusion of infection rates is a substantial improvement compared with the original QCovid model, because it enables risks to be updated according to the background infection, which is important given the nature of pandemic waves. Our analysis has been able to separately quantify the risk of severe outcomes among those people with a positive SARS-CoV-2 test result, which was not possible in the original QCovid model1 owing to a lack of testing data. Therefore, the analysis could be used at the point of testing to identify those who might benefit from additional interventions such as monoclonal antibodies once these treatments become available.
Limitations included a relatively short duration of follow-up, a partially vaccinated population, and small numbers of events in some subgroups—which are inevitable consequences of undertaking an analysis during rapid deployment of a national vaccination programme. Our analysis incorporated information on whether an individual had received one or two vaccination doses in our prediction models. We saw relatively few deaths in individuals who had received
Table 3 | Sensitivity for covid-19 related death at 70 days’ follow-up in the validation cohort (consisting of 626 656 vaccinated patients with 174 covid-19 related deaths at different QCovid3 thresholds of absolute risk)Centile threshold of predicted absolute risk
Threshold predicted absolute risk (%) at 70 days
Total No of cumulative deaths
Cumulative proportion (%) of deaths based on absolute risk (sensitivity)*
Top 5% 0.061 137 78.74Top 10% 0.020 157 90.23Top 15% 0.009 167 95.98Top 20% 0.005 172 98.85Top 25% 0.003 172 98.85Top 30% 0.003 172 98.85*Sensitivity calculated as the total cumulative number of patients with a risk score above the risk threshold with a covid-19 death at 70 days divided by the total cumulative number of patients with a covid-19 death at 70 days.
on 23 Novem
ber 2021 by guest. Protected by copyright.
http://ww
w.bm
j.com/
BM
J: first published as 10.1136/bmj.n2244 on 17 S
eptember 2021. D
ownloaded from

RESEARCH
the bmj | BMJ 2021;374:n2244 | doi: 10.1136/bmj.n2244 11
the second dose of the vaccine (4% of all covid-19 related deaths); therefore, most information about associations between predictors and mortality came from individuals who had received only one dose. Results from individuals who have received the second vaccination dose are likely to be most relevant for UK adults as full vaccine coverage increases. Although we
examined for interactions, our study might have lacked power to detect whether certain associations differed according to whether one or two doses had been received. Our models also incorporated information on prevailing positive SARS-CoV-2 infection rates, as a proxy for a person’s risk of covid-19 infection at the start of the follow-up period.
Table 4 | Characteristics of patients at highest risk of covid-19 related death (top 5%) from 14 days after covid-19 vaccination in the validation cohort using QCovid3 model. Data are numbers (percentages) unless stated otherwise
CharacteristicsPatients in top 5% highest risk of covid-19 death (n=28 751)
Patients not in top 5% highest risk of covid-19 death (n=546 281)
14 days after vaccination: Covid-19 related death 115 (0.40) 49 (0.01) Covid-19 related hospital admission 86 (0.30) 86 (0.02)Sex: Women 12 627 (43.92) 290 694 (53.21) Men 16 124 (56.08) 255 587 (46.79)Mean age (SD) 85.48 (5.65) 53.39 (15.52)Mean Townsend deprivation score (SD) −0.21 (2.94) 0.01 (3.05)Mean body mass index (SD) 27.23 (5.50) 27.76 (5.68)Ethnic origin: White 26 508 (92.20) 463 902 (84.92) Indian 848 (2.95) 18 339 (3.36) Pakistani 402 (1.40) 8441 (1.55) Bangladeshi 53 (0.18) 4063 (0.74) Other Asian 158 (0.55) 9178 (1.68) Caribbean 434 (1.51) 6275 (1.15) Black African 52 (0.18) 14 708 (2.69) Chinese 26 (0.09) 3590 (0.66) Other 270 (0.94) 17 785 (3.26)Chronic kidney disease: None 18 259 (63.51) 528 091 (96.67) Stage 3 9237 (32.13) 16 640 (3.05) Stage 4 827 (2.88) 609 (0.11) Stage 5 only 309 (1.07) 387 (0.07) Stage 5 with dialysis 52 (0.18) 161 (0.03) Stage 5 with transplantation 67 (0.23) 393 (0.07)Chemotherapy: None in past 12 months 28 035 (97.51) 543 184 (99.43) Group A 144 (0.50) 1242 (0.23) Group B 536 (1.86) 1712 (0.31) Group C 36 (0.13) 143 (0.03)Type 2 diabetes: No type 2 diabetes 20 607 (71.67) 501 199 (91.75) HbA1c ≤59 mmol/mol (≤7.5%) 5794 (20.15) 29 176 (5.34) HbA1c >59 mmol/mol (>7.5%) 2350 (8.17) 15 906 (2.91)Other pre-existing health conditions: Blood cancer 838 (2.91) 2824 (0.52) Bone marrow or solid organ transplant 21 (0.07) 133 (0.02) Respiratory cancer 377 (1.31) 1034 (0.19) Recent radiotherapy 219 (0.76) 646 (0.12) Down’s syndrome 39 (0.14) 319 (0.06) Chronic obstructive pulmonary disease 4018 (13.98) 15 265 (2.79) Coronary heart disease 7489 (26.05) 20 457 (3.74) Stroke 4627 (16.09) 11 039 (2.02) Atrial fibrillation 5986 (20.82) 11 266 (2.06) Heart failure 3316 (11.53) 4694 (0.86) Venous thromboembolism 2545 (8.85) 10 322 (1.89) Dementia 3698 (12.86) 1407 (0.26) Parkinson’s disease 635 (2.21) 987 (0.18) Epilepsy 549 (1.91) 9286 (1.70) Rare neurological conditions 220 (0.77) 2131 (0.39) Liver cirrhosis 253 (0.88) 1188 (0.22) Sickle cell disease 12 (0.04) 196 (0.04) HIV/AIDS 36 (0.13) 1667 (0.31) Severe combined immunodeficiency 22 (0.08) 280 (0.05)SD=standard deviation; HbA1c=glycated haemogoblin. Chemotherapy groups are defined in supplementary box A of reference 1.
on 23 Novem
ber 2021 by guest. Protected by copyright.
http://ww
w.bm
j.com/
BM
J: first published as 10.1136/bmj.n2244 on 17 S
eptember 2021. D
ownloaded from

RESEARCH
12 doi: 10.1136/bmj.n2244 | BMJ 2021;374:n2244 | the bmj
We did not include information on different variants that emerged during the study period owing to incomplete data, particularly in those patients admitted to hospital.39 While we accounted for many risk factors for covid-19 mortality, some risks could remain, such as those conferred by rare medical conditions or other factors associated with exposure (eg, occupation) that are poorly recorded in general practice or hospital records and that might be being proxied to some extent by the covariates included. We did not distinguish vaccination type because this study was not designed to compare vaccine effectiveness. Younger patients without underlying health conditions had limited data, because the vaccination programme in England prioritised elderly patients and those people at highest risk. Furthermore, those patients who had two vaccines early in the pandemic were judged to be at highest risk of infection or severe outcomes.
Although we have reported a validation using practices from QResearch, these practices were separate to those used to develop the model. Previously we have used this approach to develop and validate other widely used prediction models. When these models have been validated on different clinical computer systems, the results have been similar.40-42 Work is already underway to evaluate the new models in external datasets (such as the English national dataset hosted by the Office for National
Statistics) including data from other general practice computer systems that have not been used to derive the algorithm. These data offer a fully independent dataset including data from general practice computer systems not included in the derivation of the dataset. They also offer a larger sample size for validation because clinical and demographic subgroups will have more events. Work is also underway to consider integration of this new algorithm within NHS clinical software systems.
Policy implications and conclusionsThis study presents a robust risk prediction model (QCovid3) that can be used to stratify risk populations to identify those who are at highest risk of severe covid-19 outcomes despite covid-19 vaccination, and who might therefore benefit from further interventions to reduce risk or boost immunity once these become available. The model can be used in conjunction with QCovid2, which updates and replaces the original algorithm (QCovid1) and is designed for use in unvaccinated patients. We anticipate that these algorithms will be updated as the vaccination programme progresses and is extended to younger age groups, as understanding of covid-19 increases, as more post-vaccination follow-up data become available, as new variants of concern emerge, and in response to new policy interventions.
AUTHOR AFFILIATIONS1Nuffield Department of Primary Health Care Sciences, University of Oxford, Oxford, UK2Division of Primary Care, School of Medicine, University of Nottingham, Nottingham, UK3NHS-X, London, UK4Department of Medical Statistics and Centre for Statistical Methodology, London School of Hygiene and Tropical Medicine, London, UK5Diabetes Research Centre, University of Leicester, Leicester, UK6Population Data Science, Swansea University, Swansea, UK7Queen’s University, Belfast, UK8Usher Institute, University of Edinburgh, Edinburgh, UK9Department of Health and Social Care, England, UK10NHS England and Improvement, London, UK11NIHR Health Protection Research Unit, Institute of Infection, Veterinary and Ecological Sciences, Faculty of Health and Life Sciences, University of Liverpool, Liverpool, UK12UCL Institute of Epidemiology and Health Care, London, UK
We acknowledge the contribution of Egton Medical Information Systems practices who contribute to QResearch and EMIS Health and the Universities of Nottingham and Oxford for expertise in establishing, developing, or supporting the QResearch database. This project involves data derived from patient level information collected by the NHS, as part of the care and support of patients with cancer. The data are collated, maintained, and quality assured by the National Cancer Registration and Analysis Service, which is part of Public Health England. The Hospital Episode Statistics data, SARS-Cov-2 results, and civil registration mortality data are used by permission from NHS Digital who retain the copyright in those data. NHS Digital and Public Health England bear no responsibility for the analysis or interpretation of the data.Contributors: Study conceptualisation was led by JH-C, CACC, and JSN-V-T. JH-C specified the data, organised data approvals, and data linkage. JH-C, CACC, RHK, and KD-O designed the statistical analysis plan. JH-C and CACC undertook the analyses. JH-C wrote the first draft of the paper and developed the software for the web calculator. The Office of the Chief Medical Officer contributed to the development of the study question and facilitated access to relevant national datasets, contributed to interpretation of data, and contributed to the drafting of the report. All authors contributed to the interpretation of the results
Box 1: Clinical examples of patients and their predicted covid-19 risks over a 70 day period, based on QCovid3 risk algorithms (https://bmjSept2021.qcovid.org)Example 172 year old white man with a first vaccine dose, atrial fibrillation, and body mass index of 30 (background daily infection rate of 22 positive reverse transcription polymerase chain reaction (RT-PCR) test results per 100 000 people) would have: • 0.04% risk of covid-19 related hospital admission over a 70 day period• 0.02% risk of covid-19 death over a 70 day period• 5.15% risk of covid-19 related death after a SARS-CoV-2 positive test result.
Example 262 year old Pakistani woman with two vaccine doses, chronic kidney disease stage 5 with transplantation, and body mass index of 24 (background daily infection rate of 20 positive RT-PCR test results per 100 000 people) would have:• 0.04% risk of covid-19 related hospital admission over a 70 day period• 0.003% risk of covid-19 death over a 70 day period• 0.10% risk of covid-19 related death after a SARS-CoV-2 positive test result.
Example 360 year old white man with a first vaccine dose, stroke, epilepsy, well controlled type 2 diabetes, Down’s syndrome, and body mass index of 41 (background daily infection rate of 60 positive RT-PCR test results per 100 000 people) would have:• 0.56% risk of covid-19 related hospital admission over a 70 day period• 0.46% risk of covid-19 death over a 70 day period• 24.3% risk of covid-19 related death after a SARS-CoV-2 positive test result.
Example 467 year-old Caribbean woman with a first vaccine dose, liver cirrhosis, and body mass index of 41 (background daily infection rate of 40 positive RT-PCR test results per 100 000 people) would have:• 0.08% risk of covid-19 related hospital admission over a 70 day period• 0.04% risk of covid-19 death over a 70 day period• 7.29% risk of covid-19 related death after a SARS-CoV-2 positive test result.
on 23 Novem
ber 2021 by guest. Protected by copyright.
http://ww
w.bm
j.com/
BM
J: first published as 10.1136/bmj.n2244 on 17 S
eptember 2021. D
ownloaded from

RESEARCH
the bmj | BMJ 2021;374:n2244 | doi: 10.1136/bmj.n2244 13
and revision of the manuscript and approved the final version of the manuscript. JH-C had full access to all data in the study and takes responsibility for the integrity of the data and the accuracy of the data analysis. JH-C is the guarantor for the study. The corresponding author attests that all listed authors meet authorship criteria and that no others meeting the criteria have been omitted.Funding: This study was funded by the National Institute for Health Research (NIHR) following a commission by the Chief Medical Officer for England. The researchers are independent from the NIHR. QResearch was supported by funds from the John Fell Oxford University Press Research Fund, grants from Cancer Research UK (grant C5255/A18085), through the Cancer Research UK Oxford Centre, grants from the Oxford Wellcome Institutional Strategic Support Fund (204826/Z/16/Z), during the conduct of the study. The funders had no role in considering the study design or in the collection, analysis, interpretation of data, writing of the report, or decision to submit the article for publication.Competing interests: All authors have completed the ICMJE uniform disclosure form at www.icmje.org/disclosure-of-interest/ and declare: support from the NIHR for the submitted work; JH-C reports grants from NIHR Biomedical Research Centre, Oxford, grants from John Fell Oxford University Press Research Fund, grants from Cancer Research UK, through the Cancer Research UK Oxford Centre, grants from the Oxford Wellcome Institutional Strategic Support Fund and other research councils, during the conduct of the study; JH-C is an unpaid director of QResearch, a not-for-profit organisation that is a partnership between the University of Oxford and EMIS Health, which supplied the QResearch database used for this work; JH-C is a founder and shareholder of ClinRisk and was its medical director until 31 May 2019 (ClinRisk produces open and closed source software to implement clinical risk algorithms (outside this work) into clinical computer systems); JH-C is chair of the NERVTAG risk stratification subgroup and a member of SAGE covid-19 groups and the NHS group advising on prioritisation of use of monoclonal antibodies in covid-19 infection; CACC reports receiving personal fees from ClinRisk outside this work, and is a member of the NERVTAG risk stratification subgroup; KK is supported by the NIHR Applied Research Collaboration-East Midlands and the Leicester BRC and is a member of SAGE; RHK was supported by a UKRI Future Leaders Fellowship (MR/S017968/1); KD-O was supported by a grant from the Alan Turing Institute Health Programme (EP/T001569/1); AS is a member of the Scottish Government Chief Medical Officer’s covid-19 advisory group and a member of AstraZeneca’s thrombotic thrombocytopenic advisory group (both roles are unremunerated); RAL is a member of the Welsh government covid-19 technical advisory group (unrenumerated); MGS reports grants from Department of Health and Social Care NIHR UK, grants from the UK Medical Research Council, grants from Health Protection Research Unit in Emerging and Zoonotic Infections, University of Liverpool, during the conduct of the study, and other funds from Integrum Scientific, Greensboro, NC, USA, outside the submitted work; MGS is a member of NERVTAG and attends SAGE covid-19; AH is a member of NERVTAG and the NHS group advising on prioritisation of use of monoclonal antibodies in covid-19 infection; JV is national clinical director for diabetes and obesity at NHS England and Improvement; FK is a member of the Northern Ireland Chief Medical Officer’s pandemic modelling group and strategic intelligence group; JSN-V-T is seconded to the Department of Health and Social Care, England. The views expressed in this manuscript are those of the authors and not necessarily those of Department of Health and Social Care or the UK government.Ethical approval: The QResearch ethics approval was provided on 8 June 2020 by the East Midlands-Derby research ethics committee (reference 18/EM/0400).Data sharing: To guarantee the confidentiality of personal and health information, only the authors have had access to the data during the study in accordance with the relevant licence agreements. Access to the QResearch data is according to the information on the QResearch website (https://www.qresearch.org/). The full model, model coefficients, functional form and cumulative incidence function are published on the qcovid.org website.The lead author affirms that the manuscript is an honest, accurate, and transparent account of the study being reported; that no important aspects of the study have been omitted; and that any discrepancies from the study as planned (and, if relevant, registered) have been explained.Dissemination to participants and related patient and public communities: Patients will be invited to advise on disseminating the results.
Provenance and peer review: Not commissioned; externally peer reviewed.This is an Open Access article distributed in accordance with the terms of the Creative Commons Attribution (CC BY 4.0) license, which permits others to distribute, remix, adapt and build upon this work, for commercial use, provided the original work is properly cited. See: http://creativecommons.org/licenses/by/4.0/.
1 Clift AK, Coupland CAC, Keogh RH, et al. Living risk prediction algorithm (QCOVID) for risk of hospital admission and mortality from coronavirus 19 in adults: national derivation and validation cohort study. BMJ 2020;371:m3731. doi:10.1136/bmj.m3731
2 Nafilyan V, Humberstone B, Mehta N, et al. An external validation of the QCovid risk prediction algorithm for risk of mortality from COVID-19 in adults: a national validation cohort study in England. Lancet Digit Health 2021;3:e425-33. doi:10.1016/S2589-7500(21)00080-7
3 NHS Digital. Coronavirus Shielded Patient List open data set, England 2021. https://digital.nhs.uk/dashboards/shielded-patient-list-open-data-set.
4 Voysey M, Clemens SAC, Madhi SA, et al, Oxford COVID Vaccine Trial Group. Safety and efficacy of the ChAdOx1 nCoV-19 vaccine (AZD1222) against SARS-CoV-2: an interim analysis of four randomised controlled trials in Brazil, South Africa, and the UK. Lancet 2021;397:99-111.
5 Polack FP, Thomas SJ, Kitchin N, et al, C4591001 Clinical Trial Group. Safety and Efficacy of the BNT162b2 mRNA Covid-19 Vaccine. N Engl J Med 2020;383:2603-15. doi:10.1056/NEJMoa2034577
6 Baden LR, El Sahly HM, Essink B, et al, COVE Study Group. Efficacy and Safety of the mRNA-1273 SARS-CoV-2 Vaccine. N Engl J Med 2021;384:403-16. doi:10.1056/NEJMoa2035389
7 Lim SH, Campbell N, Johnson M, et al. Antibody responses after SARS-CoV-2 vaccination in patients with lymphoma. Lancet Haematol 2021;8:e542-4. doi:10.1016/S2352-3026(21)00199-X
8 Clift AK, Coupland CAC, Keogh RH, Hemingway H, Hippisley-Cox J. COVID-19 Mortality Risk in Down Syndrome: Results From a Cohort Study of 8 Million Adults. Ann Intern Med 2021;174:572-6.
9 Hippisley-Cox J, Young D, Coupland C, et al. Risk of severe COVID-19 disease with ACE inhibitors and angiotensin receptor blockers: cohort study including 8.3 million people. Heart 2020;106:1503-11. doi:10.1136/heartjnl-2020-317393
10 Hippisley-Cox J, Coupland C. Risk of myocardial infarction in patients taking cyclo-oxygenase-2 inhibitors or conventional non-steroidal anti-inflammatory drugs: population based nested case-control analysis. BMJ 2005;330:1366-9. doi:10.1136/bmj.330.7504.1366
11 UK Government. COVID-19 deaths in the UK. 2921 2021.12 Hippisley-Cox J, Clift AK, Coupland CAC, et al. Protocol for the
development and evaluation of a tool for predicting risk of short-term adverse outcomes due to COVID-19 in the general UK population. medRxiv 2020:2020.06.28.20141986-2020.06.28.86. doi:10.1101/2020.06.28.20141986
13 Gao M, Piernas C, Astbury NM, et al. Associations between body-mass index and COVID-19 severity in 6·9 million people in England: a prospective, community-based, cohort study. Lancet Diabetes Endocrinol 2021;9:350-9. doi:10.1016/S2213-8587(21)00089-9
14 Townsend P, Davidson N. The Black report. Penguin, 1982.15 UK Government. Coronar (COVID-19) in the UK downloaded data
2021. https://coronavirus.data.gov.uk/details/download.16 Dafni U. Landmark analysis at the 25-year landmark point. Circ
Cardiovasc Qual Outcomes 2011;4:363-71. doi:10.1161/CIRCOUTCOMES.110.957951
17 Little RJA, Rubin DB. Statistical analysis with missing data/Roderick J.A. Little, Donald B. Rubin. 2nd ed 2002. Wiley, c, 2002. doi:10.1002/9781119013563.
18 Kalbfleisch J, Prentice R. The Statistical Analysis of Failure Time Data. 2002:114-8. doi:10.1002/9781118032985
19 Wolbers M, Blanche P, Koller MT, Witteman JC, Gerds TA. Concordance for prognostic models with competing risks. Biostatistics 2014;15:526-39. doi:10.1093/biostatistics/kxt059
20 Royston P. Explained variation for survival models. Stata J 2006;6:1-14. doi:10.1177/1536867X0600600105
21 Coviello V, Boggess M. Cumulative incidence estimation in the presence of competing risks. Stata J 2004;4:103-12. doi:10.1177/1536867X0400400201
22 Collins GS, Reitsma JB, Altman DG, Moons KG. Transparent Reporting of a multivariable prediction model for Individual Prognosis or Diagnosis (TRIPOD): the TRIPOD statement. Ann Intern Med 2015;162:55-63. doi:10.7326/M14-0697
23 Wall EC, Wu M, Harvey R, et al. Neutralising antibody activity against SARS-CoV-2 VOCs B.1.617.2 and B.1.351 by BNT162b2 vaccination. Lancet 2021;397:2331-3. doi:10.1016/S0140-6736(21)01290-3
24 Hoes J, Boef AGC, Knol MJ, et al. Socioeconomic Status Is Associated With Antibody Levels Against Vaccine Preventable Diseases in the Netherlands. Front Public Health 2018;6:209. doi:10.3389/fpubh.2018.00209
on 23 Novem
ber 2021 by guest. Protected by copyright.
http://ww
w.bm
j.com/
BM
J: first published as 10.1136/bmj.n2244 on 17 S
eptember 2021. D
ownloaded from
RESEARCH
No commercial reuse: See rights and reprints http://www.bmj.com/permissions Subscribe: http://www.bmj.com/subscribe
25 Zimmermann P, Curtis N. Factors That Influence the Immune Response to Vaccination. Clin Microbiol Rev 2019;32:e00084-18. doi:10.1128/CMR.00084-18
26 Baker RJ, Mark PB, Patel RK, Stevens KK, Palmer N. Renal association clinical practice guideline in post-operative care in the kidney transplant recipient. BMC Nephrol 2017;18:174. doi:10.1186/s12882-017-0553-2
27 Garthwaite E, Reddy V, Douthwaite S, Lines S, Tyerman K, Eccles J. Clinical practice guideline management of blood borne viruses within the haemodialysis unit. BMC Nephrol 2019;20:388. doi:10.1186/s12882-019-1529-1
28 Stevens CE, Alter HJ, Taylor PE, Zang EA, Harley EJ, Szmuness W. Hepatitis B vaccine in patients receiving hemodialysis. Immunogenicity and efficacy. N Engl J Med 1984;311:496-501. doi:10.1056/NEJM198408233110803
29 Cavdar C, Sayan M, Sifil A, et al. The comparison of antibody response to influenza vaccination in continuous ambulatory peritoneal dialysis, hemodialysis and renal transplantation patients. Scand J Urol Nephrol 2003;37:71-6. doi:10.1080/00365590310008749
30 Remschmidt C, Wichmann O, Harder T. Influenza vaccination in patients with end-stage renal disease: systematic review and assessment of quality of evidence related to vaccine efficacy, effectiveness, and safety. BMC Med 2014;12:244-44. doi:10.1186/s12916-014-0244-9
31 Kennedy NA, Lin S, Goodhand JR, et al. Infliximab is associated with attenuated immunogenicity to BNT162b2 and ChAdOx1 nCoV-19 SARS-CoV-2 vaccines.medRxiv 2021:2021.03.25.21254335. doi:10.1101/2021.03.25.21254335
32 Katikireddi SV, Lal S, Carrol ED, et al. Unequal impact of the COVID-19 crisis on minority ethnic groups: a framework for understanding and addressing inequalities. J Epidemiol Community Health 2021;75:970-4. doi:10.1136/jech-2020-216061
33 Sattar N, McInnes IB, McMurray JJV. Obesity Is a Risk Factor for Severe COVID-19 Infection: Multiple Potential Mechanisms. Circulation 2020;142:4-6. doi:10.1161/CIRCULATIONAHA.120.047659
34 Pike MM, Decker PA, Larson NB, et al. Improvement in Cardiovascular Risk Prediction with Electronic Health Records. J Cardiovasc Transl Res 2016;9:214-22. doi:10.1007/s12265-016-9687-z
35 Kengne AP, Beulens JW, Peelen LM, et al. Non-invasive risk scores for prediction of type 2 diabetes (EPIC-InterAct): a validation of existing models. Lancet Diabetes Endocrinol 2014;2:19-29. doi:10.1016/S2213-8587(13)70103-7
36 Hippisley-Cox J, Coupland C, Brindle P. Development and validation of QRISK3 risk prediction algorithms to estimate future risk of cardiovascular disease: prospective cohort study. BMJ 2017;357:j2099. doi:10.1136/bmj.j2099
37 Hippisley-Cox J, Coupland C. Development and validation of QDiabetes-2018 risk prediction algorithm to estimate future risk of type 2 diabetes: cohort study. BMJ 2017;359:j5019. doi:10.1136/bmj.j5019
38 Hippisley-Cox J, Coupland C. Development and validation of QMortality risk prediction algorithm to estimate short term risk of death and assess frailty: cohort study. BMJ 2017;358:j4208. doi:10.1136/bmj.j4208
39 Patone M, Thomas KRH, et al. Mortality and Critical Care Unit admission associated with the SARS-CoV-2 Variant of Concern 202012/01 in England: an observational cohort study. Lancet Infect Dis 2021; [forthcoming] doi:10.1016/S1473-3099(21)00318-2.
40 Collins GS, Altman DG. An independent external validation and evaluation of QRISK cardiovascular risk prediction: a prospective open cohort study. BMJ 2009;339:b2584. doi:10.1136/bmj.b2584
41 Collins GS, Altman DG. An independent and external validation of QRISK2 cardiovascular disease risk score: a prospective open cohort study. BMJ 2010;340:c2442. doi:10.1136/bmj.c2442
42 Collins GS, Altman DG. Predicting the 10 year risk of cardiovascular disease in the United Kingdom: independent and external validation of an updated version of QRISK2. BMJ 2012;344:e4181. doi:10.1136/bmj.e4181
Web appendix: Supplementary material
on 23 Novem
ber 2021 by guest. Protected by copyright.
http://ww
w.bm
j.com/
BM
J: first published as 10.1136/bmj.n2244 on 17 S
eptember 2021. D
ownloaded from