Embed Size (px)
Citation preview
Diss.ETH No. 15496
River Restoration: Potential and limitations to re-establish riparian landscapes.
Assessment & Planning.
A dissertation submitted to the
SWISS FEDERAL INSTITUTE OF TECHNOLOGY ZURICH
for the degree of
DOCTOR OF SCIENCES
Presented by
Sigrun ROHDE
Dipl. Ing. Landschafts- u. Freiraumplanung, University of Hanover (Germany)
born 21st April, 1972
from Germany
accepted on the recommendation of
Prof. Dr. Klaus C. Ewald, examiner PD Dr. Felix Kienast, co-examiner
Ass. Prof. Dr. Peter Englmaier, co-examiner
2004

The researcher investigates the river, the engineer tames the river by meansof concrete and exponential equations.
But the rambler loves the river.
(Silvio Blatter, Wassermann, 1986)
Nicht in der Erkenntnis liegt das Glück,sondern im Erwerben der Erkenntnis
(Edgar Allan Poe)
This study is part of the Rhone-Thur-Project funded by the Swiss Federal Institute forEnvironmental Science and Technology (EAWAG), the Swiss Federal Research Institute
WSL, the Swiss Federal Office for Water and Geology (FOWG) and the Swiss Agency for theEnvironment, Forests and Landscape (SAEFL).


Contents i
Contents Summary..........................................................................................................................1 Zusammenfassung ...........................................................................................................4 Résumé ............................................................................................................................8 General introduction ..................................................................................................... 12 Paper I A habitat-based method for rapid
assessment of river restoration.............................................................. 25 Paper II River widening: a promising restoration approach
to re-establish riparian habitats and plant species? ............................... 53 Paper III Room for rivers: an integrative search
strategy for floodplain restoration......................................................... 77 Synthesis and final remarks..........................................................................................113 Appendix ......................................................................................................................119 Acknowledgements ......................................................................................................125 Curriculum vitae ...........................................................................................................127

ii Contents
Summary 1
Summary This study presents methods and indicators for the evaluation of restoration measures
(river widening) along rivers (papers 1 and 2) and shows the results obtained from
several case studies on Swiss rivers. This study also introduces an integrated search
strategy for identifying promising areas (judged according to both ecological and socio-
economic criteria) as a guide for future restoration planning (paper 3). The evaluation is
based on a comparison between (i) river widenings, (ii) canalized rivers (regulated
reference) and (iii) near-natural stretches (near-natural reference).
The findings about methods and indicators to evaluate restoration success can be
summarized as follows:
Indicators
Landscape metrics allow the restored landscape configuration and composition
to be quantified. They are surrogates for landscape function and thus valuable
indicators for assessing the potential of re-establishing riparian biocoenosis. The
proposed core set of landscape metrics includes: Mean Shape Index, Median
Patch Size, Mean Nearest Neighbour, Mean Proximity Index, Interspersion and
Juxtaposition Indx, Edge Density, % Area, Patch Richness (paper 1).
The degree of dependency of the plants found at a restored site on riparian
habitats indicates the naturalness achieved by the restoration measures. A list of
riparian (semi-) terrestrial plants is presented to guide future assessment
procedures (Appendix).

Summary 2
Stencil technique
The application of landscape metrics is limited when comparing landscapes that differ
in size (river widening, near-natural reference). Therefore the GIS-based “stencil
technique”, which can handle this problem was developed. It is described in detail in
paper 1.
Computing of similarity indices
Computing similarity indices allows quantifying the degree of naturalness
achieved through restoration measures and thus a quick and clear rating of the
performance of restoration projects.
The degree of naturalness at the landscape level can be obtained computing the
City Block Distance (= Manhattan Metric) between the landscape metric values
of the river widening and its corresponding references (paper 1).
Fuzzy ordination (multivariate statistics) revealed to be a useful method for
computing and visualization of similarities between plant assemblages of the
river widening and its corresponding references (paper 2).
The case studies (papers 1 and 2) revealed that:
River widenings promote the re-establishment of pioneer habitats, mainly gravel
bars and softwoods.
River widenings increase habitat diversity. However, habitat diversity is lower
than in corresponding near-natural reference sites due to the limited spatial
extent of the widenings.
River widenings show a more complex habitat mosaic than near-natural sites.
Summary 3
River widenings provide habitats for riparian plant species, for example,
Phalaris arundinacea and Epilobium fleischeri.
Restoration success depends mainly on the spatial extent of the widening,
distance to near-natural species pools and bed-load transport.
The identification of promising river reaches for restoration was based on a hierarchical
filter process of spatially explicit information (multi criteria decision making (MCDM)-
GIS analysis) (paper 3). The selection integrates ecological as well as socio-economic
criteria and indicators to capture both ecological key processes (e.g. hydrology, bed-
load transport, connectivity, etc.) and socio-economic aspects (e.g. flood protection,
recreation functions, public attitude, etc.). The Ecological Restoration Suitability Index
(ERSI) combines the ecological suitability factors in a single index. Weights and
suitability functions for the MCDM-GIS analysis were obtained through expert
interviews (modified Delphi process).
The results show, that (paper 3):
Most of the catchments in Switzerland are ecologically very suitable for
restoration. They are mainly located in the Swiss plateau because restoration
suitability of Alpine rivers is limited due to hydropower production.
The acceptance of future restoration projects by the public can be estimated on
the basis of public votes, which serve as surrogate for the public attitude towards
environmental policies.
In a nutshell, widening rivers is an appropriate measure for promoting riparian
biocoenosis and there are many river reaches in Switzerland where such restoration
measures would be worthwhile.
4 Zusammenfassung
Zusammenfassung Inhalt dieser Arbeit ist eine Wirkungskontrolle bisher durchgeführter
Revitalisierungsmassnahmen (Gerinneaufweitungen) an ausgewählten Schweizer
Fliessgewässern (paper 1 und 2) und die Lokalisierung von Vorranggebieten für
zukünftige Revitalisierungsmassnahmen (paper 3).
Die Wirkungskontrolle basiert auf einer vergleichenden Untersuchung zwischen (i)
Gerinneaufweitungen, (ii) kanalisierten Strecken (regulierte Referenz =Nullzustand) und
(iii) naturnahen Abschnitten (naturnahe Referenz = Zielzustand), welche die Beurteilung
der durch die Revitalisierung erreichten Naturnähe ermöglichen soll.
Im Rahmen dieser Arbeit wurden folgende methodische Erkenntnisse zur Durchführung
einer Wirkungskontrolle gewonnen:
Indikatoren
Landschaftsstrukturmasse (landscape metrics) eignen sich zur Quantifizierung
der wiederhergestellten Landschaftskomposition und -konfiguration und damit
als Indikatoren für das Potential zur Wiederherstellung auetypischer Biozönosen.
Das vorgeschlagene Indikatorenset setzt sich zusammen aus: Mean Shape Index,
Median Patch Size, Mean Nearest Neighbour, Mean Proximity Index,
Interspersion and Juxtaposition Indx, Edge Density, % Area, Patch Richness (s.
paper 1).
Die Anzahl und Habitatbindung (Stenökie) der einzelnen, in einem revitalisierten
Abschnitt angetroffenen Arten sind Zeiger für den Revitalisierungserfolg. Für die
Durchführung zukünftiger Erfolgskontrollen wurde deshalb eine Liste
auetypischer, (semi-)terrestrischer Pflanzenarten unterschiedlicher
Habitatbindung erstellt (s. Anhang).
Zusammenfassung 5
Stencil technique
Der Vergleich der Landschaftsstruktur unterschiedlich grosser Untersuchungsgebiete
(Aufweitung, naturnahe Referenz) mittels landscape metrics ist nur bedingt zulässig. Um
einen solchen Vergleich dennoch zu ermöglichen, wurde die GIS-basierte „Stencil
technique“ entwickelt, welche im paper 1 detailliert beschrieben wird.
Ähnlichkeitsrechnungen
Die durch die Revitalisierung erreichte Naturnähe lässt sich mittels Ähnlichkeits-
rechnungen quantifizieren.
Auf der Ebene der landscape metrics eignet sich hierfür die Berechnung der City
Block Distance (= Manhattan metric) zwischen den Werten der
Gerinneaufweitung und den Werten der regulierten bzw. naturnahen Referenz
(paper 1).
Für die Berechnung und visuelle Darstellung der Ähnlichkeit zwischen den
Vegetationsaufnahmen der Gerinneaufweitungen und jenen der entsprechenden
Referenzgebiete, erwies sich die Fuzzy Ordination, eine Methode aus dem
Bereich der multivariaten Statistik, als besonders geeignet (paper 2).
Die Anwendung der oben vorgestellten Methoden zur Wirkungskontrolle von
Revitalisierungsmassnahmen führte zu folgenden Ergebnissen (paper 1 und 2):
Gerinneaufweitungen ermöglichen vor allem die Wiederherstellung von
Pionierlebensräumen wie z.B. Kiesbänke u. Weichholzgebüsch.

6 Zusammenfassung
Gerinneaufweitungen erhöhen die Habitatdiversität. Diese liegt jedoch aufgrund
der geringen Flächenausdehnung der Aufweitungen unter jener der naturnahen
Strecken.
Gerinneaufweitungen weisen ein komplexeres und kleinteiligeres Habitatmosaik
auf als entsprechende naturnahe Bereiche.
Gerinneaufweitungen leisten einen wichtigen Beitrag zu Schutz und Förderung
auetypischer Pflanzenarten, z.B. von Rohrglanzgras (Phalaris arundinacea) oder
Fleischers Weidenröschen (Epilobium fleischeri).
Der Erfolg von Massnahmen zur Gerinneaufweitung ist im Wesentlichen
abhängig von der Grösse der Aufweitung, der Nähe zu naturnahen Bereichen und
dem Geschiebehaushalt.
Für die Ermittlung der Vorranggebiete für zukünftige Gerinneaufweitungen (paper 3)
wurden räumlich explizite Daten in ein GIS eingespiesen und mittels eines
hierarchischen Filterprozesses ausgewertet (multi criteria decision making (MCDM)-
GIS- Analyse). Der Auswahlprozess integriert:
ökologische Kriterien und Indikatoren zur Erfassung ökosystemarer
Schlüsselprozesse (z.B. Hydrologie, Geschiebe, Vernetzung) und
sozio-ökonomische Kriterien (z.B. Hochwasserschutz, Naherholung, Einstellung
der Bevölkerung gegenüber Umweltbelangen), womit der gesellschaftlichen
Relevanz von Revitalisierungsprojekten Rechnung getragen wird.
Die Eignung aus ökologischer Sicht wird in einem „ecological restoration suitability
index“ zusammengefasst. Die Gewichtung der Kriterien und Wertfunktionen für die
MCDM-GIS-Analyse wurden im Rahmen einer Expertenumfrage (Delphi-Prozess)
ermittelt.

Zusammenfassung 7
Die Ergebnisse zeigen, unter anderem, für die Schweiz (paper 3),:
dass die überwiegende Mehrheit der Einzugsgebiete sehr gute, ökologische
Rahmenbedingungen für Revitalisierungsmassnahmen aufweist. Diese liegen
mehrheitlich im Mittelland, da das Revitalisierungspotenzial der Berggewässer
durch die Wasserkraftnutzung stark eingeschränkt ist und,
dass eine Auswertung des bisherigen Abstimmungsverhaltens der Bevölkerung
eine Abschätzung der Akzeptanz zukünftiger Revitalisierungsprojekte
ermöglicht.
Grundsätzlich zeigt sich, dass Gerinneaufweitungen geeignete Massnahmen zur
Förderung u. Wiederherstellung auetypischer Arten- u. Lebensgemeinschaften
darstellen, deren Potenzial in der Schweiz bei Weitem noch nicht ausgeschöpft ist.
8 Résumé
Résumé Cette thèse traite de la surveillance de l’efficacité des mesures de revitalisation des cours
d’eau (l’élargissement local de rivières); ceci à travers une méthode de localisation des
lieux prioritaires pour des mesures de revitalisation. La surveillance s’est effectuée sur
une comparaison des (i) élargissements avec (ii) des rivières canalisées (référence
corrigée) et (iii) des rivières naturelles (référence naturelle = état-but). Cette
comparaison rend possible la quantification du caractère naturel réalisé par la mesure de
revitalisation.
Les résultats concernant les méthodes de l’exécution de la surveillance de l’efficacité des
mesures de revitalisation sont les suivants:
Indicateurs
Les « landscape metrics » sont adéquats pour quantifier la composition et la
configuration du paysage rétabli. Ce sont des indicateurs permettant d'évaluer le
potentiel de reconstitution des habitats et espèces alluviales. Les indicateurs
proposés sont : "Mean Shape Index", "Median Patch Size", "Mean Nearest
Neighbour", "Mean Proximity Index", "Interspersion and Juxtaposition Index",
"Edge Densitiy", "% Area", "Patch richness" (article 1).
Le nombre d'espèces trouvées dans l’élargissement et la liaison des espèces avec
la diversité des habitats démontrent le succès de la revitalisation. Une liste des
plantes alluviales (semi-) terrestres est présentée (Appendice).
Résumé 9
"Stencil technique"
La comparaison de la structure du paysage avec des « landscape metrics » est limitée
dans le cas de zones de recherches offrant des surfaces différentes. Pour faciliter cette
comparaison la « stencil technique » (effectué dans un Système d'Information Géoréféré,
SIG) est presentée et developée en détail dans l'article 1.
Calcul des similarités
Il est possible de quantifier le caractère naturel obtenu à l'aide de calculs de
similarités.
Quant à l’état des « landscape metrics » le calcul de la « City Block distance »
(="Manhattan metric") est idéal pour indiquer la similarité entre les valeurs
obtenues pour les élargissements et les références correspondantes (canalisées et
naturelles) (article 1).
La "Fuzzy Ordination" (une méthode d'analyse statistique multivariée) est
judicieuse pour le calcul et la visualisation des similarités entre les relevés de
végétation obtenus dans les élargissements et les références correspondantes
(article 2).
L’exécution de la surveillance de l’efficacité des mesures de revitalisation des cours
d’eau montre les résultats suivants (articles 1 et 2) :
Les habitats pionniers, par exemple les bancs de gravier brut et les saulaies
buissonnantes, sont les habitats qui se reconstituent les premiers.
Les élargissements locaux de rivières augmentent la diversité des habitats. Mais
la diversité des élargissements est moindre que la diversité trouvée dans les zones
alluviales naturelles du fait que les élargissements réalisés sont trop petits.

10 Résumé
La mosaïque des habitats des élargissements est plus complexe que celle des
zones alluviales naturelles.
Les élargissements représentent une contribution importante pour la protection et
le développement des plantes alluviales, par exemple Phalaris arundinacea ou
Epilobium fleischeri.
Le succès des mesures dépend de la surface de l’élargissement, de la proximité
des zones alluviales naturelles et de la régime du dépôt sédimentaire.
Le choix des lieux prioritaires pour de futurs élargissements (article 3) a été effectué à
l'aide d'un SIG. Les données spatiales sont analysées avec une procédure-filtre
hiérarchique ("multi criteria decision making (MCDM)-GIS Analysis"). Cette procédure
de sélection intègre :
des critères et indicateurs écologiques pour comprendre les processus clés de
l’écosystème alluvial (hydrologie, régime des sédiments, connectivité etc...) et
des critères socio-économiques (par exemple: la protection contre les crues, offre
d'activités récréatives, opinion publique face aux mesures de gestion de
l'environnement).
Les critères écologiques sont réunis au sein de l'« Ecological Restoration Suitability
Index (ERSI) ». L’importance des critères et des fonctions de valeurs des critères pour
l'Analyse MCDM-SIG " sont mis en place par un groupe d’experts dans le domaine
(processus-delphi).
Résumé 11
Pour la Suisse les résultats sont les suivants (article 3):
La majorité des bassins hydrologiques ayant des conditions-cadre favorisant des
mesures de revitalisation de cours d’eau (l’élargissement local des rivières) sont
situés sur le plateau Suisse et non pas en région de montagne. En effet, dans ces
régions, les revitalisations potentielles sont limitées par la présence des usines
hydrauliques.
Une analyse des résultats de votations montre l'intérêt du public pour les mesures
environnementales et rend possible l’estimation de l'acceptation de l'opinion
publique envers de futurs projets de revitalisation des cours d'eau.
Pour résumer les résultats, on peut dire que les élargissements locaux de rivières sont des
mesures appropriées pour l'encouragement et la reconstitution des habitats et espèces
alluviales. De plus, en Suisse le potentiel de revitalisation des cours d’eau n’est pas
encore épuisé.
12 General introduction
General introduction
Rivers and their multiple roles in the human environment – an overview
Rivers are more than just flowing water. They are prominent features in the
environment that have a major impact on human society and culture as people have
always been attracted to water courses. Thus religion and mythology, as well as art and
economics, have been affected by rivers. The following chapter aims to give a glimpse
of the many different ways rivers have touched and still touch people’s lives and
environment.
Water is a major resource for humans. Thus settlements were often made near rivers. On
the Swiss plateau, for example, settlements have since Neolithic times occured mainly
along rivers and lakes. Rivers have often defined the borders between estates,
communities, shires and states. For instance, the Rhine is still a major border between
several European countries. Districts were often named after rivers. In Switzerland, for
example, the names of the cantons Thurgau and Aargau came from the rivers Thur and
Aare.
The water courses themselves have been used for multiple purposes: fishing, drinking
water, irrigation, waste disposal, transport and industry. Early watershed industries
included logging, mining, milling, tanneries and agriculture. In Switzerland, for
example water power was used as early as the 3rd century (Schnitter 1992). Water
courses have also allowed the transport of mainly timber and firewood, but also of salt,
wine and ore, and thus promoted commerce. Some settlements along rivers became
major trading centres. In the 16th century Zurzach, for example, near the junction of the
navigable Rhine and Aare became a widely known market town. Traders from Italy,
France, The Netherlands and Poland came to trade leather, textiles and horses. Other
settlements obtained considerable income from tolls on bridges, for example, Brugg on
General introduction 13
the Aare river. Today, rivers have become popular for recreational purposes (canoeing,
walking, etc.) but they are still important commercially, especially for transport (e. g.
the Danube, Rhine, Elbe and Weser), cooling water and hydropower. In Switzerland, for
example, hydropower produces 56% of Switzerland’s electricity and covers about 65%
of its electricity consumption (BWG 2003, http://www.bwg.admin.ch).
Rivers have contributed to economic development through the exchange of goods, but
also enable travel and thus the exchange of knowledge. Thus rivers have markedly
influenced cultural development and have often been a source for artistic inspiration.
One of the most famous examples is the music by Bedrich Smetana (1824 – 1884)
which describes the course of the river Moldavia from its springs to where it flows into
the Elbe river. Rivers are also the subject of works of Franz Schubert (1797-1828) in his
Lieder “ Am Flusse” (1822, text by J. W. Goethe) and “Der Strom” (1817, text by A.
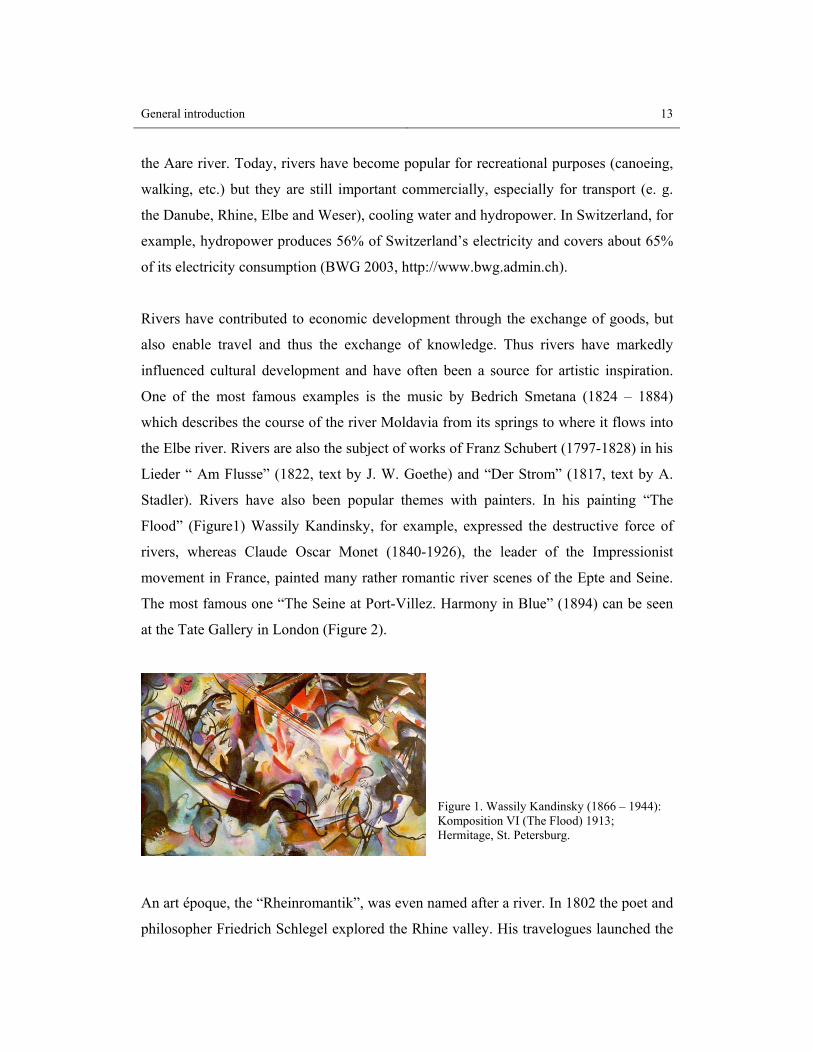
Stadler). Rivers have also been popular themes with painters. In his painting “The
Flood” (Figure1) Wassily Kandinsky, for example, expressed the destructive force of
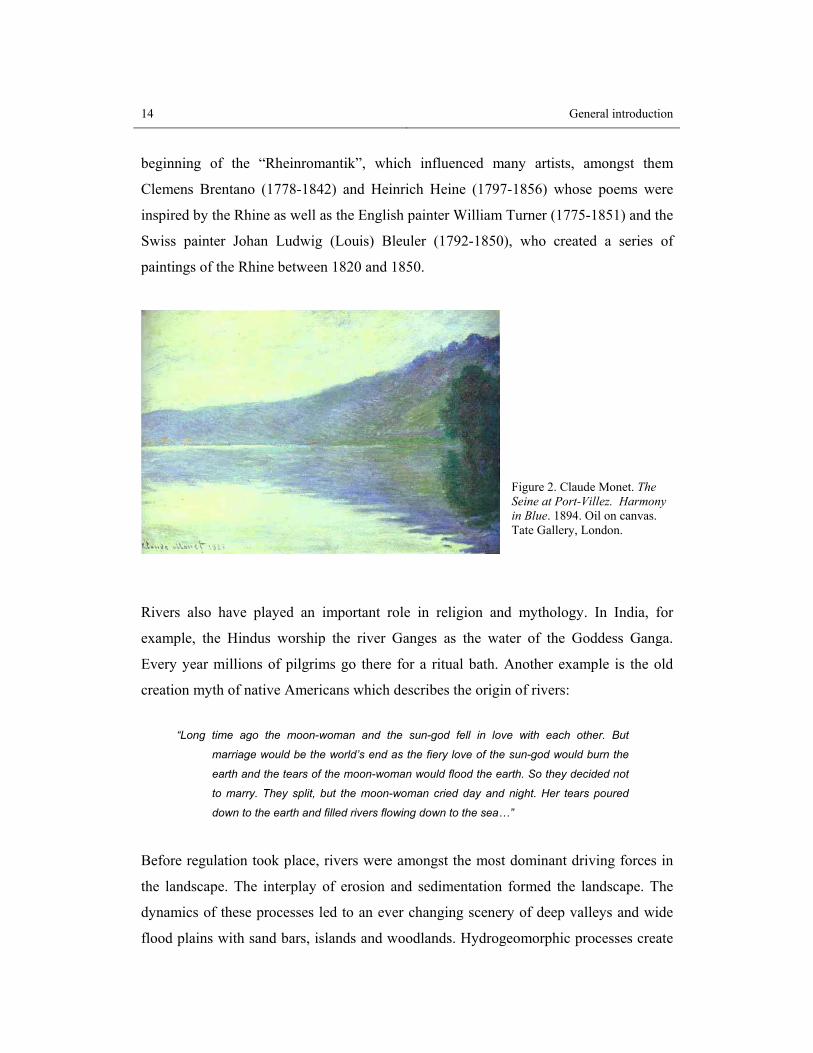
rivers, whereas Claude Oscar Monet (1840-1926), the leader of the Impressionist
movement in France, painted many rather romantic river scenes of the Epte and Seine.
The most famous one “The Seine at Port-Villez. Harmony in Blue” (1894) can be seen
at the Tate Gallery in London (Figure 2).
Figure 1. Wassily Kandinsky (1866 – 1944): Komposition VI (The Flood) 1913; Hermitage, St. Petersburg.
An art époque, the “Rheinromantik”, was even named after a river. In 1802 the poet and
philosopher Friedrich Schlegel explored the Rhine valley. His travelogues launched the
14 General introduction
beginning of the “Rheinromantik”, which influenced many artists, amongst them
Clemens Brentano (1778-1842) and Heinrich Heine (1797-1856) whose poems were
inspired by the Rhine as well as the English painter William Turner (1775-1851) and the
Swiss painter Johan Ludwig (Louis) Bleuler (1792-1850), who created a series of
paintings of the Rhine between 1820 and 1850.
Figure 2. Claude Monet. The Seine at Port-Villez. Harmony in Blue. 1894. Oil on canvas. Tate Gallery, London.
Rivers also have played an important role in religion and mythology. In India, for
example, the Hindus worship the river Ganges as the water of the Goddess Ganga.
Every year millions of pilgrims go there for a ritual bath. Another example is the old
creation myth of native Americans which describes the origin of rivers:
“Long time ago the moon-woman and the sun-god fell in love with each other. But
marriage would be the world’s end as the fiery love of the sun-god would burn the
earth and the tears of the moon-woman would flood the earth. So they decided not
to marry. They split, but the moon-woman cried day and night. Her tears poured
down to the earth and filled rivers flowing down to the sea…”
Before regulation took place, rivers were amongst the most dominant driving forces in
the landscape. The interplay of erosion and sedimentation formed the landscape. The
dynamics of these processes led to an ever changing scenery of deep valleys and wide
flood plains with sand bars, islands and woodlands. Hydrogeomorphic processes create

General introduction 15
a shifting mosaic of different successional stages and the mosaic of water, bare ground,
pioneer vegetation up to mature woodland provides habitat for many different species.
Therefore rivers and their flood plains are widely acknowledged as biodiversity
hotspots. For example, nearly 40% of all vascular plants to be found in Switzerland
occur along rivers (Huber et al. 2002, Roulier 2002). Thus today the remnants of natural
rivers play a major role in the conservation of biodiversity and rivers provide important
corridors for species dispersal (e.g. Bonn and Poschlod 1998).
This brief overview shows that rivers have influenced human life in many different
ways. However, the influence has also been vice versa as humans have altered the
appearance of many river corridors drastically with engineering works and regulation.
River regulation in Switzerland and its consequences
In many areas rivers have undergone progressive changes away from their natural state.
Changes began with human settlement along rivers. As the population grew, many areas
that previously had been flooded during high water became more and more densely
populated. As a result measures were taken for flood protection. However, until the 18th
century these measures had only local effects (Vischer 1986). Local measures were, for
example, the meander cutoffs at the Reuss between Ottenbach and Birri-Merenschwand
in 1415 and between Buchrain and Inwil in 1594 (Vischer 2003).
Things changed when there was a marked increase in severe flooding in the 18th and
19th century due to climate changes and deforestation (Pfister 1999). Growing
populations and industries led to extensive clearing, for example, in the Emme valley,
which provided wood and timber for the growing industries of the city of Solothurn. As
a result water retention decreased and erosion and sediment transport increased. Larger
quantities of sediment caused the river beds to progressively rise, with consequent
flooding. As a result many people and livestock died, settlements and agricultural land
were destroyed and the land became marshy with malaria becoming an additional threat.
At this time many people suffered as a result from hunger and disease and there were
16 General introduction
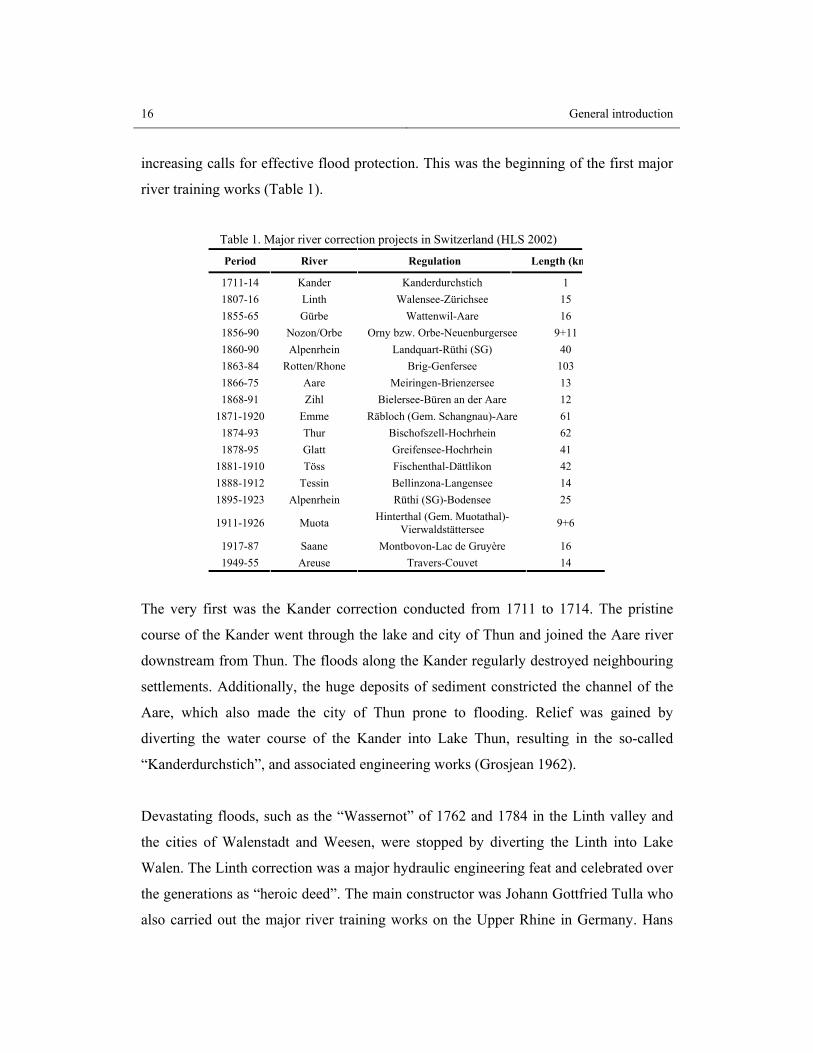
increasing calls for effective flood protection. This was the beginning of the first major
river training works (Table 1).
Table 1. Major river correction projects in Switzerland (HLS 2002)
Period River Regulation Length (km
1711-14 Kander Kanderdurchstich 1 1807-16 Linth Walensee-Zürichsee 15 1855-65 Gürbe Wattenwil-Aare 16 1856-90 Nozon/Orbe Orny bzw. Orbe-Neuenburgersee 9+11 1860-90 Alpenrhein Landquart-Rüthi (SG) 40 1863-84 Rotten/Rhone Brig-Genfersee 103 1866-75 Aare Meiringen-Brienzersee 13 1868-91 Zihl Bielersee-Büren an der Aare 12
1871-1920 Emme Räbloch (Gem. Schangnau)-Aare 61 1874-93 Thur Bischofszell-Hochrhein 62 1878-95 Glatt Greifensee-Hochrhein 41
1881-1910 Töss Fischenthal-Dättlikon 42 1888-1912 Tessin Bellinzona-Langensee 14 1895-1923 Alpenrhein Rüthi (SG)-Bodensee 25
1911-1926 Muota Hinterthal (Gem. Muotathal)-Vierwaldstättersee 9+6
1917-87 Saane Montbovon-Lac de Gruyère 16 1949-55 Areuse Travers-Couvet 14
The very first was the Kander correction conducted from 1711 to 1714. The pristine
course of the Kander went through the lake and city of Thun and joined the Aare river
downstream from Thun. The floods along the Kander regularly destroyed neighbouring
settlements. Additionally, the huge deposits of sediment constricted the channel of the
Aare, which also made the city of Thun prone to flooding. Relief was gained by
diverting the water course of the Kander into Lake Thun, resulting in the so-called
“Kanderdurchstich”, and associated engineering works (Grosjean 1962).
Devastating floods, such as the “Wassernot” of 1762 and 1784 in the Linth valley and
the cities of Walenstadt and Weesen, were stopped by diverting the Linth into Lake
Walen. The Linth correction was a major hydraulic engineering feat and celebrated over
the generations as “heroic deed”. The main constructor was Johann Gottfried Tulla who
also carried out the major river training works on the Upper Rhine in Germany. Hans
General introduction 17
Conrad Escher promoted the Linth correction, which took nearly 10 years to complete
(1807-1816). He also led the engineering works together with Conrad Schindler (Speich
2002).
The third major river correction in Switzerland was the “1st correction of the Jurassic
water courses” which took place from 1868 to 1891. It was the largest of all the river
correction projects and a key figure behind it was the doctor Johan Rudolf Schneider
(Vischer 2003). This project included the construction of the Hageneck Canal which
redirected the Aare from Aarburg directly into Lake Biel. The effluent of Lake Biel was
increased with the construction of the Nidau-Büren Canal. These measures stopped the
regular flooding and the marshland became dry. As a consequence large-scale
subsidence of the terrain took place which made further measures necessary. Around
seventy years later, the “2nd correction of the Jurassic water courses” (1962-73) took
place.
Most of the following river training works did not aim to direct flow but rather to
increase drainage capacity. The natural water courses were canalized and contained in a
double trapeze profile. The correction of the Rhone from Brig to Lake Geneva is a
typical example. Here the water course was straightened and the river profile was
defined by flood levees at a distance of 70m to 120m, accompanied by groins 20m to
30m long. By the beginning of the 20th century nearly all the rivers in Switzerland had
been corrected.
These river corrections also led to land reclamation due to improved drainage and
melioration. During the “1st correction of the Jurassic water courses”, for example, 400
km2 of wetlands were converted into agricultural land. This land reclamation, also
called “inner colonisation”, was necessary as the population was growing rapidly with
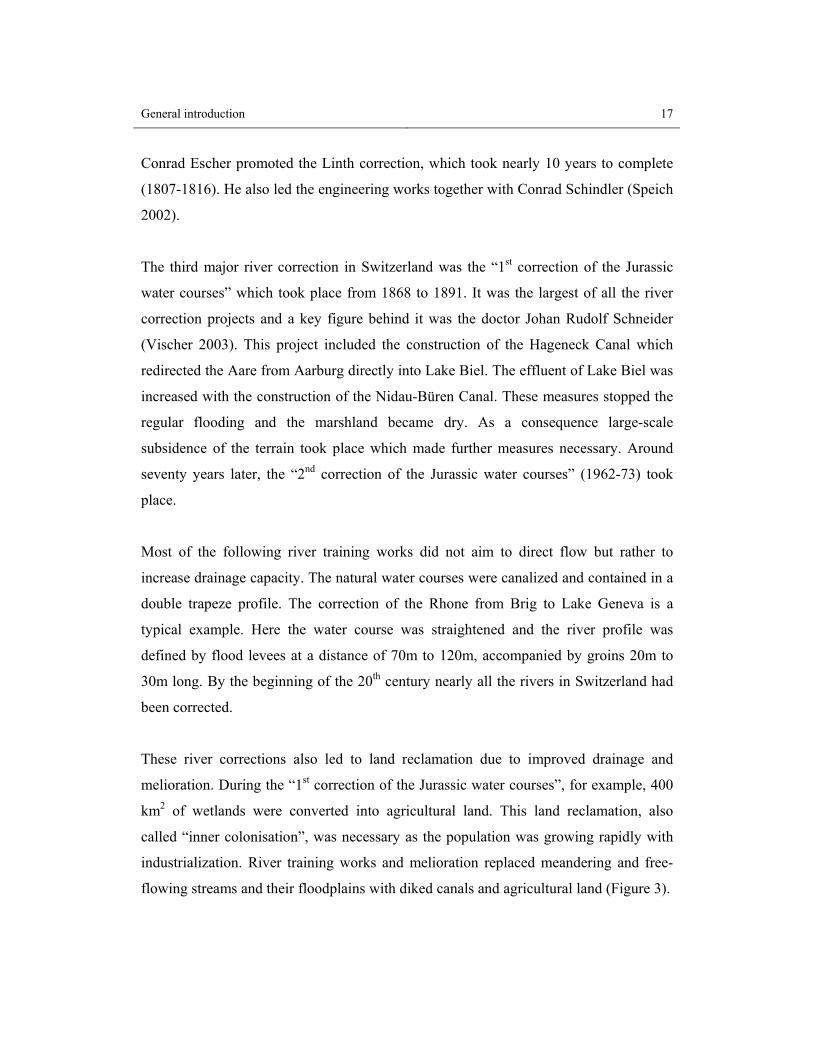
industrialization. River training works and melioration replaced meandering and free-
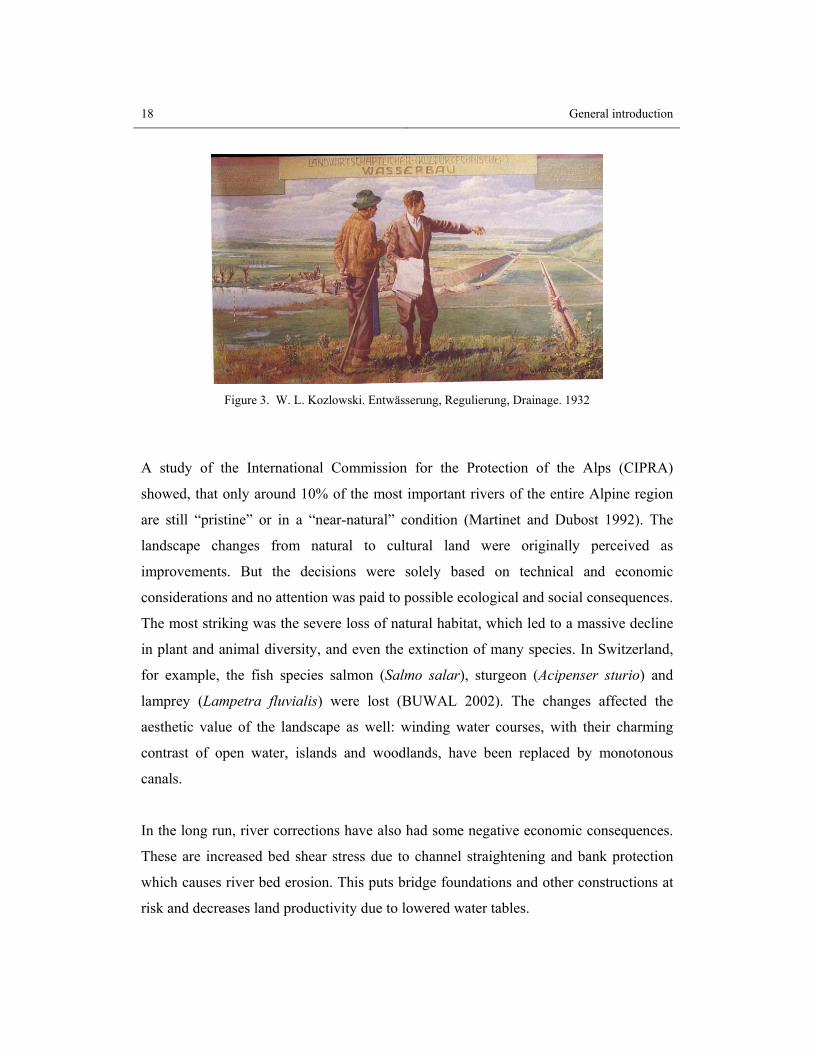
flowing streams and their floodplains with diked canals and agricultural land (Figure 3).
18 General introduction
Figure 3. W. L. Kozlowski. Entwässerung, Regulierung, Drainage. 1932
A study of the International Commission for the Protection of the Alps (CIPRA)
showed, that only around 10% of the most important rivers of the entire Alpine region
are still “pristine” or in a “near-natural” condition (Martinet and Dubost 1992). The
landscape changes from natural to cultural land were originally perceived as
improvements. But the decisions were solely based on technical and economic
considerations and no attention was paid to possible ecological and social consequences.
The most striking was the severe loss of natural habitat, which led to a massive decline
in plant and animal diversity, and even the extinction of many species. In Switzerland,
for example, the fish species salmon (Salmo salar), sturgeon (Acipenser sturio) and
lamprey (Lampetra fluvialis) were lost (BUWAL 2002). The changes affected the
aesthetic value of the landscape as well: winding water courses, with their charming
contrast of open water, islands and woodlands, have been replaced by monotonous
canals.
In the long run, river corrections have also had some negative economic consequences.
These are increased bed shear stress due to channel straightening and bank protection
which causes river bed erosion. This puts bridge foundations and other constructions at
risk and decreases land productivity due to lowered water tables.
General introduction 19
As the negative consequences of the traditional engineering practice became more and
more serious, a paradigm shift took place towards a more sustainable river management.
River widening: A new approach to river management
Public awareness of the limitations of traditional engineering practices and the
imperative to conserve nature in the 20th century have led to changes in river
management policies and to the development of numerous restoration projects. Changes
in management policies have taken place at different political levels. At the
international level the European Habitats Directive and the European Water Framework
Directive represent the most important policy shift. At the Swiss federal level a network
of floodplain reserves was established through legislation (Auenverordnung, 1992).
Reserves now cover 289 floodplains of national importance and the Water Protection
Law (GSchG 1991) regulates, among other things, the minimum flow discharge which
has to be maintained in the river when it is used for hydropower production.
In recent years various river restoration projects have been planned or implemented. In
Europe the various projects include creation of secondary channels along the Rhine
(Simons et al. 2001), returning the straight, regulated river Skjern back to its former
meandering state (Neilsen 2002), reconnecting the Danube side-arm system to the main
channel (Tockner et al. 1998), re-allocating flood levees at the Elbe river
(http://www.burg-lenzen.de/deichrueckverlegung/) and widening rivers in Switzerland
and Austria (e.g. Drau river: http://panda.wwf.at/spittal.html). In North America many
projects have focused on dam removal (Bednarek 2001, Hart and Poff 2002) to re-
establish the river continuum.
In Switzerland many rivers face progressive river bed erosion due to river training
(Schilling et al. 1996). Traditionally, sills, chutes or block ramps were installed to
stabilize the river bed. But these measures disrupt the river continuum and impair
species movement. An alternative management option is the construction of river
widenings. The first river to be widend in Switzerland was along the Emme river in
20 General introduction
1992. Several other widenings followed along the Thur, Alpenrhein, Rhône, Moesa,
Reuss, Inn and Calancasca.
Local widening of a river bed seeks to meet hydraulic and ecological demands. River
widening decreases the transport capacity of a river and causes retention of sediment
within the widening so that the mean bed level rises. At the same time river widening
allows river braiding which increases the variability of flow parameters and the
diversity of in-stream habitats.
The morphological changes along the longitudinal profile of a river widening are,
according to, Hunzinger (1998):
The mean bed level in the widening is stepped vertically relative to the bed level in
the upstream and downstream channel to ensure continuity and energy conservation.
A new equilibrium slope becomes established. This is steeper than the slope of the
original narrow streamway. In the case of long river widenings, this effect increases
the upstream bed level.
Bars are formed, creating a more diverse flow pattern. At the same time cross flows
and scouring lead to an increased hydraulic load on the river banks.
The flow is concentrated, causing intense scouring at the constriction.
Sediment is retained within the widening, causing temporary downstream erosion.
The morphological processes occurring in river widenings are pretty well known and
documented and can be quantified in hydraulic experiments and numerical simulations.
So far research has concentrated mainly on aspects of river engineering and neglected
the postulated aim of ecological river restoration. There have only been a few ecological
studies on river widenings, all from Austria (Habersack and Nachtnebel 1995,
Habersack et al. 2000, Petutschnig 1997). However, if river management is to be
sustainable the contribution of river widenings to the restoration of river systems and
riparian landscapes needs to be investigated and assessed.
General introduction 21
Restoration, Rehabilitation or Revitalization?
There is a growing literature on the philosophical and scientific dimensions of
“restoration”. Numerous terms have been used to describe river restoration, such as
“rehabilitation”, “revitalization”, “renaturalization” and “enhancement”. Adams and
Perrow (1999) and Perrow and Wightman (1993) proposed the following definitions,
which are similar to the definitions given by the CIPRA (Martinet and Dubost 1992):
Restoration: “The complete structural and functional return to a pre-disturbance state.”
Rehabilitation: “The partial structural and functional return to a pre-disturbance state.”
Enhancement: “Any improvement of structural or functional attribute”.
Following these definitions I suggest the terms “renaturalization” should be considered
an alternative term for “restoration” and “revitalization” should be considered an
alternative term for “rehabilitation”.
In recent years there has been a shift in meaning of the term “improvement”.
Traditionally, rivers have been “improved” for flood protection and land reclamation
through canalization and regulation. A quote from Victor Hugo (1802-1885) underlines
this traditional meaning: “When nature created the Rhine, there was chaos and void,
however mankind turned it into a street”. This “street” was celebrated as
“improvement”. More recently these traditional “improvements” have come to be
recognized at least in part as losses and river “improvement” is now associated with re-
establishing formerly lost, more natural riparian habitats and processes.
There is a gap in restoration ecology between theory and practice. Although definable in
restoration theory, full restoration to some pristine state is rarely a feasible practical
option (if at all) due to irreversible alterations of geological, climatic and other
processes. Indeed, the question arises which time slot in natural history should serve as
the reference for a pristine state: the time after the last ice age, the beginning of the 19th
century, present floodplain remnants or what? It is very difficult to define a particular

22 General introduction
time slot which would be commonly accepted as “pristine”. In addition, Petts (1996)
maintaining that, philosophically, the very notion of a return to a “natural” or “virgin”
state through human action is bizarre. However, most authors use the term “restoration”,
and I have also followed this practice, although I am well aware that this is leaving the
path of pure definition.
Objectives, content and outline of this work
Swiss society is aware of the major ecological degradation caused by river regulation.
Thus river conservation and restoration are now being addressed through legislative
changes (Auenverordnung, GSchG) and action on the ground, such as river widenings.
However, an extensive literature search and informal interviews with several river
managers in Switzerland revealed little information on the positive or negative impacts
of river widenings on the ecological performance of the “restored” river stretches. Many
of these managers mentioned the lack of an easy-to-apply assessment method as a major
reason for the lack of information on the ecological performance of river widenings.
The interviews also showed that river widening projects do not follow a strategic
restoration or river management plan for the whole catchment, but are mainly based on
local, ad-hoc decisions.
Thus the objectives of this work are: (i) to provide a method for obtaining a rapid and
robust assessment of river widenings from a nature conservation point of view, (ii) to
increase scientific knowledge on the ecological performance of river widenings, which
can then be fed into designing of future restoration projects, and (iii) to provide a
framework for establishing a strategic planning tool for whole catchments to assist
management authorities in setting priorities for planning river widenings.
This study reports on the results of research conducted along several Swiss rivers. It is
divided into three main parts: the first paper is devoted to the description of the “stencil
technique”, a new method to assess restoration performance at the habitat level, the
second paper focuses on the potential and limitations of river widenings to re-establish
riparian vegetation and habitats, and the third paper addresses the need for a strategic

General introduction 23
planning tool for river restoration that integrates ecological as well as socio-economic
needs. The last chapter presents a synthesis and some final remarks.
Literature cited Adams, W. M. and Perrow, M. R. 1999: Scientific and institutional constraints on the restoration of
European floodplains. Pages 89-97 in Marriott, S. B. and Alexander, J. (eds.) Floodplains: Interdisciplinary Approaches, The Geological Society of London, London.
Bednarek, A. T. 2001. Undamming rivers: A review of the ecological impacts of dam removal.
Environmental Management 27: 803-814. Bonn, S. and Poschlod, P. 1998. Ausbreitungsbiologie der Pflanzen Mitteleuropas Grundlagen und
kulturhistorische Aspekte. Quelle & Meyer, Wiesbaden, X, 404 S. pp. BUWAL. 2002. Umwelt-Bericht Bd 1. Politik und Perspektiven des BUWAL. Bundesamt für Umwelt,
Wald und Landschaft. Grosjean, G. 1962. Die Ableitung der Kander in den Thunersee vor 250 Jahren. Jahrbuch vom Thuner-
und Brienzersee: 18-40. Habersack, H.-M. and Nachtnebel, H.-P. 1995. Short-term effects of local river restoration on
morphology, flow field, substrate and biota. Regulated Rivers: Research & Management 10: 291-301.
Habersack, H.-M., Koch, K. and Nachtnebel, H.-P. 2000. Flussaufweitungen in Österreich - Entwicklung,
Stand und Ausblick. Österreichische Wasser- und Abfallwirtschaft 52: 143-153. Hart, D. D. and Poff, N. L. 2002. A special section on dam removal and river restoration. BioScience 52:
653-655. HLS. 2002. Historisches Lexikon der Schweiz. Stiftung Historisches Lexikon der Schweiz (HLS), Basel. Huber, F., Kuhn, N., Müller-Wenk, R. and Peter, A. 2002. Gewässerraumnutzung und Umweltschaden.
seecon gmbh, 81. Hunzinger, L. M. 1998. Flussaufweitungen - Morphologie, Geschiebehaushalt und Grundsätze zur
Bemessung. Vol. 159, VAW Mitteilungen, Versuchsanstalt für Wasserbau, Hydrologie und Glaziologie der ETH Zürich, Zürich.
Martinet, F. and Dubost, M. 1992. Die letzten naturnahen Alpenflüsse. Vol. 11, Kleine Schriften,
Internationale Alpenschutzkommission CIPRA, Vaduz. Neilsen, M. 2002. Lowland stream restoration in Denmark: Background and examples. Journal of the
chartered institution of water and environmental management 16: 189-193. Perrow, M. R. and Wightman, A. S. 1993. River Restoration Project Phase 1. Feasability Study. Oxford
Brookes University.

24 General introduction
Petts, G. E. 1996: Sustaining the ecological integrity of large floodplain rivers. Pages 535-551 in Walling,
D. E. and Bates, P. D. (eds.) Floodplain Processes, Wiley, Chichester. Petutschnig, W. 1997. Vegetationsentwicklung auf Pionierstandorten einer Flussaufweitung an der
Oberen Drau (Kärnten). Carinthia II 187: 409-421. Pfister, C. 1999. Wetternachhersage. 500 Jahre Klimavariationen und Naturkatastrophen (1496-1995).
Paul Haupt, Bern, Stuttgart, Wien, 304 pp. Roulier, C. 2002: Schriftliche Mitteilung mit vollständiger Artenliste vom 6.6.2002. (eds.) zit. in Huber et
al. Schilling, M., Hunziker, R. and Hunzinger, L. 1996. Die Auswirkungen von Korrektionsmassnahmen auf
den Geschiebehaushalt. Intrapraevent, 209-220. Schnitter, N. 1992: Römischer Wasserbau in der Schweiz. Pages 152-159 in Scheidegger, F. (eds.) Aus
der Geschichte der Bautechnik Bd.2, Birkhäuser, Basel. Simons, J. H. E. J., Bakker, J. P., Schropp, M. H. I., Jans, L. H., Kok, F. R. and Grift, R. E. 2001. Man-
made secondary channels along the River Rhine (the Netherlands); results of post-project monitoring. Regulated Rivers-Research & Management 17: 473-491.
Speich, D. 2002. Linth Kanal: die korrigierte Landschaft - 200 Jahre Geschichte. Baeschlin, Glarus, 87
pp. Tockner, K., Schiemer, F. and Ward, J. V. 1998. Conservation by restoration: The management concept
for a river-floodplain system on the Danube River in Austria. Aquatic conservation - marine and freshwater ecosystems 8: 71-86.
Vischer, D. 1986. Schweizerische Flusskorrektionen im 18. und 19. Jahrhundert. Vol. 84, VAW
Mitteilungen, Zürich. Vischer, D. 2003. Die Geschichte des Hochwasserschutzes in der Schwiz. Von den Anfängen bis ins 19.
Jahrhundert. Berichte des BWG, Serie Wasser, Bundesamt für Wasser und Geologie (BWG), 208.
Auenverordnung. Verordnung vom 28. Oktober 1992 über den Schutz der Auengebiete von nationaler
Bedeutung Gewässerschutzgesetz (GSchG 1991). Bundesgesetz über den Schutz der Gewässer.
Paper I 25
Paper I
A habitat-based method for rapid assessment of river restoration
Submitted as:
Sigrun Rohde, Felix Kienast and Matthias Bürgi: A habitat-based method for rapid assessment of river restoration. Environmental Management. Swiss Federal Research Institute for Forest, Snow and Landscape Research (WSL), Zuercherstrasse 111, 8903 Birmensdorf, Switzerland
Abstract Many rivers in industrialized countries have been modified by canalization. Restoration
of the ecological integrity is now an important management goal in many places. One
restoration approach is to create „river-widenings“ that permit braiding within a limited
area. This study presents a new and efficient framework for rapid assessment of river
widening projects and offers a novel method to compare restored sites with near-natural
stretches (stencil technique). The new framework compliments existing assessment
methods by evaluating spatial patterns of habitat and using landscape metrics as
indicators. Three case studies from river restoration in Switzerland are presented for
demonstration purposes.
The restoration projects are compared to pre-restoration conditions and near-natural
conditions, which are assumed to bound the worst- and best-case condition of a river
system. To account for the limited spatial extent of the restored sites the stencil
technique was developed. Landscape metrics were calculated for each entire study area
as well as smaller sections (clips) of the near natural reference. Clips were created by
using a stencil of the same shape and size as the restored area to clip data for the near-
26 Paper I
natural reference (random window sampling technique). Subsequently the calculated
metrics for the restored sites were compared to the range of values calculated for the
near-natural data subset.
We conclude that the proposed method of using the stencil technique and landscape
metrics for restoration assessment is valid and easy to apply. We found that river
widenings do offer potential for re-establishment of riparian habitats. However, mainly
pioneer successional stages were promoted, and the habitat mosaic of the restored
section was more complex than near- natural reference sites.
Keywords: stencil technique, indicators, landscape metrics, GIS, random window
sampling, riparian habitat, river restoration, Switzerland
Introduction River floodplains are widely acknowledged as being biodiversity hotspots (Malanson
1995, Naiman et al. 1993). However, in Europe only small areas are left in a relatively
undisturbed condition. Most rivers have been subjected to a variety of human impacts,
primarily regulation. These engineering works led to uniform landscapes characterized
by canalized rivers lined with flood levees. As a result the floodplains lost their natural
dynamics and patterns with a consequent decline in habitat and species diversity
(Nilsson and Svedmark 2002, Pedroli et al. 2002, Petts and Calow 1996). Due to a new
approach in river management an increasing number of restoration projects have been
initiated in the last years. One measure is to create river widenings that permit braiding
within a limited area. These measures seek to mimic natural patterns and processes and
thus return the fluvial ecosystem to a close approximation of its condition prior to
canalization. Despite the increasing number of river restoration projects, post- project
evaluation has generally been neglected (Kondolf and Micheli 1995). The supposed
reasons are limited financial resources and the lack of evaluation schemes which are
efficient and easy to apply. Where post- project evaluation has been undertaken, it has
concentrated on in-stream characteristics like channel geomorphology and channel
Paper I 27
wildlife (Brunke 2002, Downs 2001, Gilvear et al. 2002, Henry et al. 2002, Thomson et
al. 2001), and largely diregarded the adjacent riparian landscape. Thus the purpose of
our study was to establish a framework for rapid assessment of restoration projects
which considers the whole floodplain, including the semi-terrestrial habitats (riparian
zone).
The specific aims of the study are as follows: To develop a powerful and efficient
method to assess the improvements achieved by the restoration measures against
regulated and near- natural conditions; to identify easily-surveyed indicators which
appropriately reflect landscape function and processes and to determine whether river
widenings are suitable means to re-establish fluvial ecosystems.
Three case studies of river restoration projects are presented for demonstration
purposes.
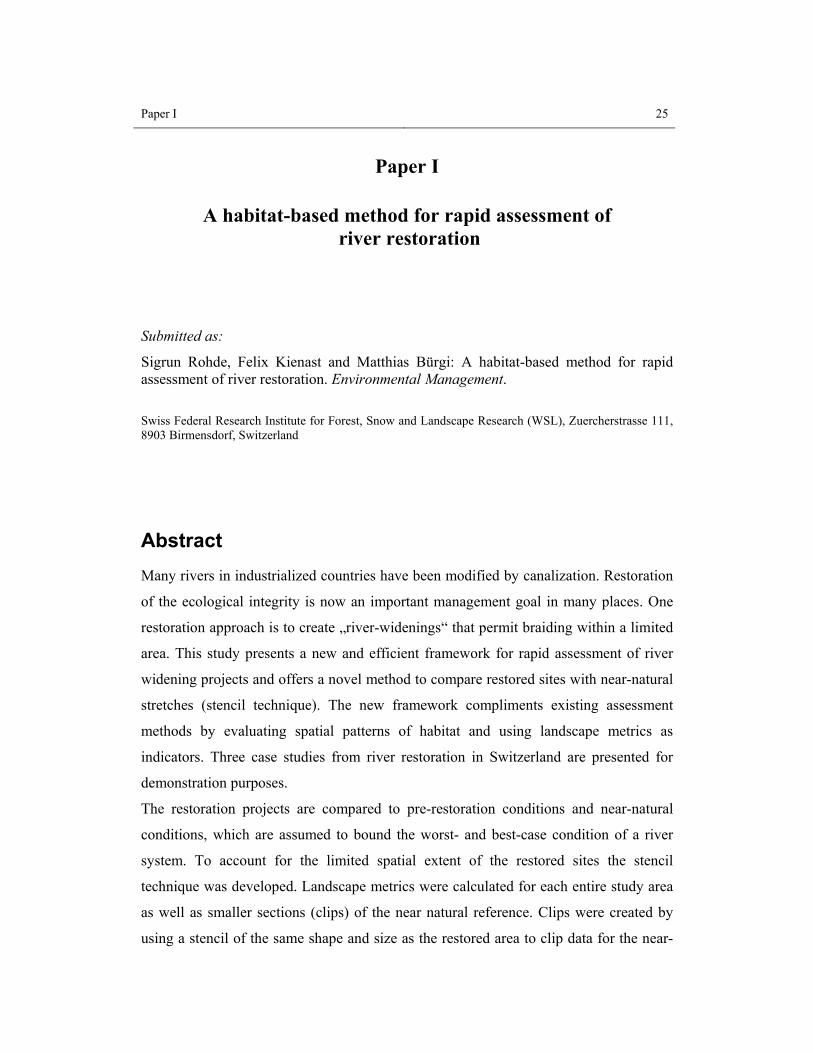
Case study sites In the case studies we analyzed three river restoration projects (river widenings) in
Switzerland (see Figure 1). All river widenings are of about 5 ha in size. The first site is
located at the Emme River in the community of Aefligen in the north western part of
Switzerland, the second and third site are both located in the southern part of
Switzerland at the Moesa River near the villages of Grono and Lostallo. Both rivers are
heavily impaired by human activity, mainly through canalization. Restoration at the
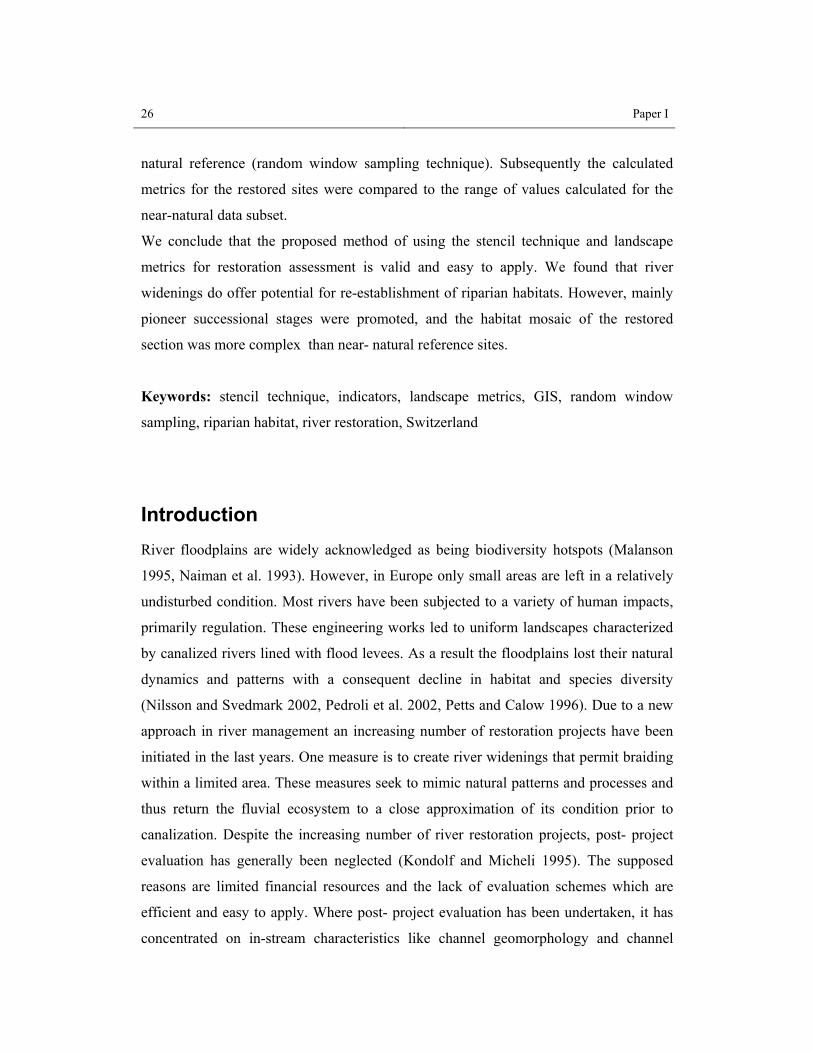
Emme River started around 1991. Embankments were removed on both sides and the
channel was widened from 30m to 85m over a length of about 500m (see Figure 2).
After the widening process groins were installed every 35-50m for bank protection. At
Grono (Moesa site I) the works for restoration started in winter/spring 1999. On both
sides, forests were cleared over a length of up to 600m and the river bed was widened
by up to 50m. To allow for undisturbed, hydrogeomorphic processes no bank
protections were installed, except at the downstream end of the widening. The river
widening at Lostallo (Moesa site II) was undertaken in 1997.
28 Paper I
Figure 1. Study sites.
Figure 2. The Emme river at Aefligen before (left) and after restoration took place (right). (Documenta Natura)
As part of the restoration project the right-hand embankment was relocated to allow
channel widening from 20m up to 85m. The relocated dam was protected by groins.
Excavation material was used to build banks (1 m high) in the channel.
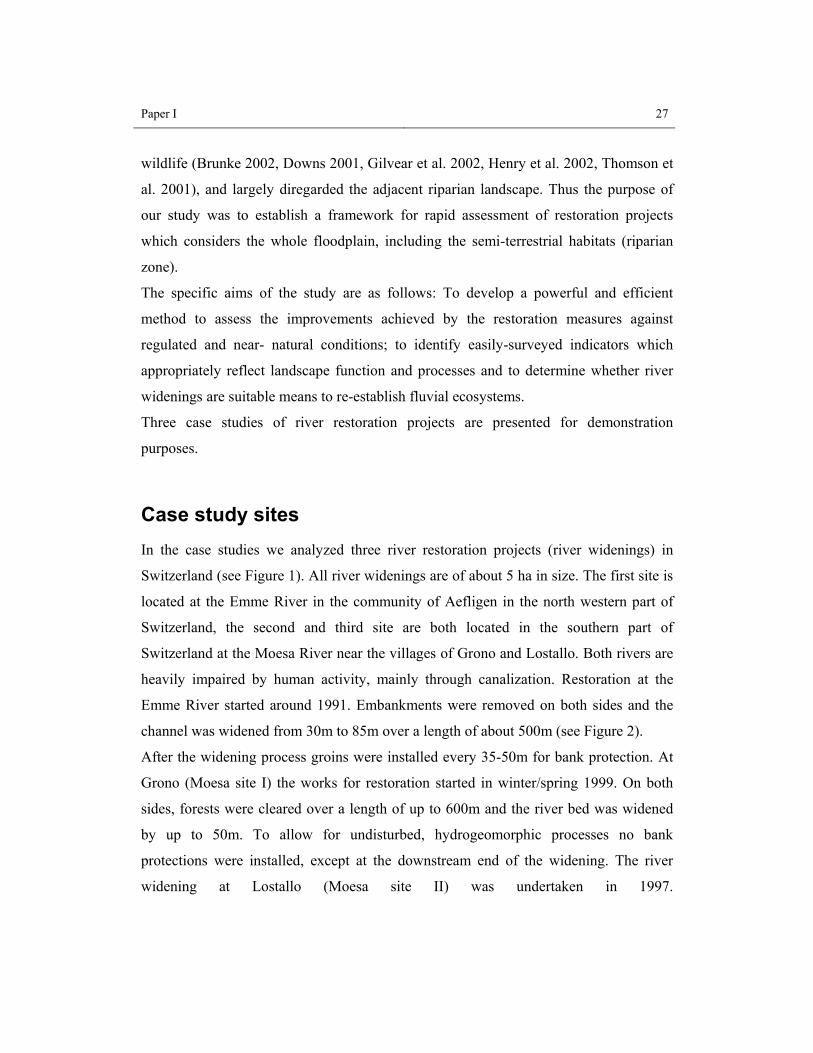
The Sense river near Plaffeien and the Maggia near Someo (see Figure 1) were selected
for natural reference as there is little or no human impact on their hydrogeomorphic
processes. Both sites belong to the most natural floodplains to be found in Switzerland
(Gallandat et al. 1993). The restored sites and corresponding near-natural references can
be seen at a glance in Figure 3. Information on the ecological conditions at each site is
given in Table 1.
Figure 3. Restoration site and corresponding regulated/ near-natural reference.
Paper I 29
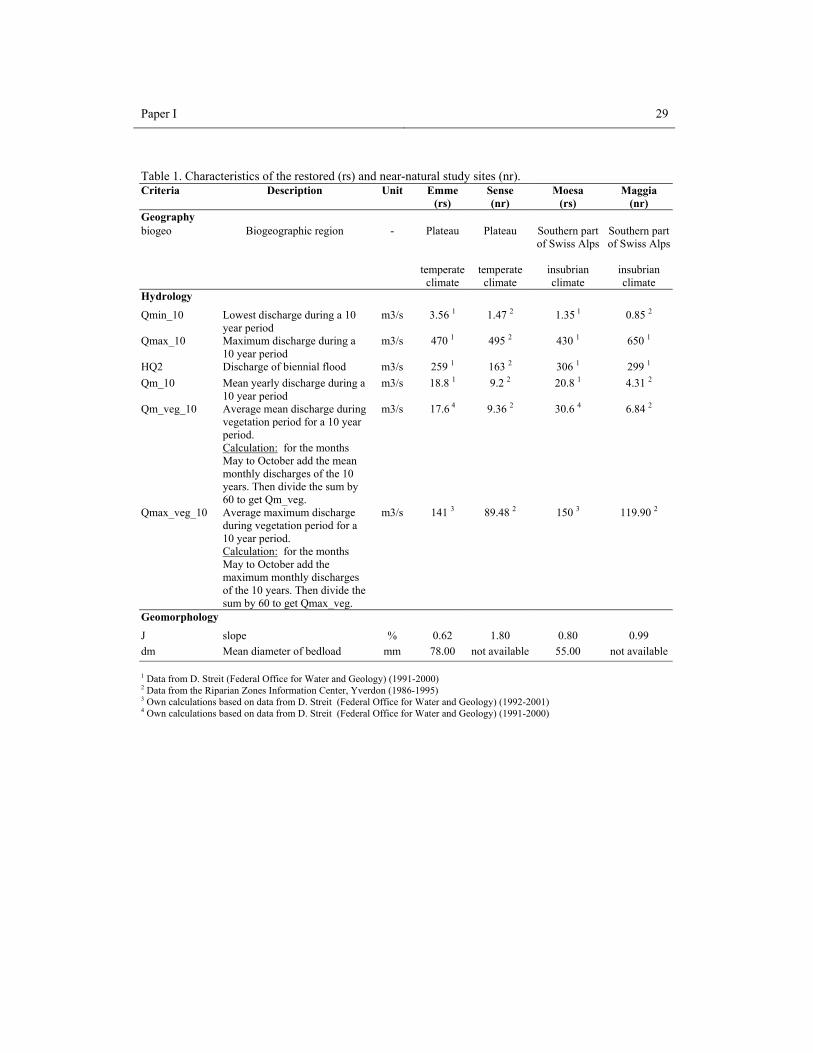
Table 1. Characteristics of the restored (rs) and near-natural study sites (nr). Criteria Description Unit Emme
(rs) Sense (nr)
Moesa (rs)
Maggia (nr)
Geography biogeo Biogeographic region - Plateau
temperate climate
Plateau
temperate climate
Southern part of Swiss Alps
insubrian climate
Southern part of Swiss Alps
insubrian climate
Hydrology
Qmin_10 Lowest discharge during a 10 year period
m3/s 3.56 1 1.47 2 1.35 1 0.85 2
Qmax_10 Maximum discharge during a 10 year period
m3/s 470 1 495 2 430 1 650 1
HQ2 Discharge of biennial flood m3/s 259 1 163 2 306 1 299 1 Qm_10 Mean yearly discharge during a
10 year period m3/s 18.8 1 9.2 2 20.8 1 4.31 2
Qm_veg_10 Average mean discharge during vegetation period for a 10 year period. Calculation: for the months May to October add the mean monthly discharges of the 10 years. Then divide the sum by 60 to get Qm_veg.
m3/s 17.6 4 9.36 2 30.6 4 6.84 2
Qmax_veg_10 Average maximum discharge during vegetation period for a 10 year period. Calculation: for the months May to October add the maximum monthly discharges of the 10 years. Then divide the sum by 60 to get Qmax_veg.
m3/s 141 3 89.48 2 150 3 119.90 2
Geomorphology
J slope % 0.62 1.80 0.80 0.99 dm Mean diameter of bedload mm 78.00 not available 55.00 not available
1 Data from D. Streit (Federal Office for Water and Geology) (1991-2000) 2 Data from the Riparian Zones Information Center, Yverdon (1986-1995) 3 Own calculations based on data from D. Streit (Federal Office for Water and Geology) (1992-2001) 4 Own calculations based on data from D. Streit (Federal Office for Water and Geology) (1991-2000)
30 Paper I
Methods and data base
Selection of case study sites
As restoration seeks the return of an ecosystem to a close approximation of its condition
prior to disturbance information about the pristine status is needed for comparison as
part of the evaluation process. How can we obtain this information? Historical data is
often rather poor and if historic sources are available, they need to be crosschecked,
which is too time consuming to be implemented into a rapid assessment scheme. Instead
we can use data from present natural or near- natural sites as references for the
evaluation of restoration measures (Milner 1996). To be suitable as a reference the
abiotic conditions of the near- natural reach must be similar to those to be found at the
restoration site. Table 1 presents a set of criteria which are useful for the selection of
reference sites. They include biogeographical as well as geomorphological and
hydrological properties. We also investigated the regulated status before restoration
took place. This allows us to evaluate the improvements achieved by the restoration
process. Hence, two reference situations were chosen as we presumed that the near-
natural and the regulated reaches would define the boundaries for „best“ and „worst“
condition, respectively, and that the restored sites would plot between these extremes
(Downs 2001).
Habitat maps
Habitat information was obtained by analyzing stereo pairs of photographs (1:5000
CIR) for the restored sites and for the near-natural reaches. To correct for distortion
found in a normal aerial photograph we converted all images to orthophotos, using
Erdas Imagine 5.1 (Leica Geosystems). The pre-restoration, regulated situation was
reconstructed using information provided by the local authorities. Ground information
about vegetation height and vegetation cover was added to represent the variety of
structural features and different successional stages present within the floodplains.
Paper I 31
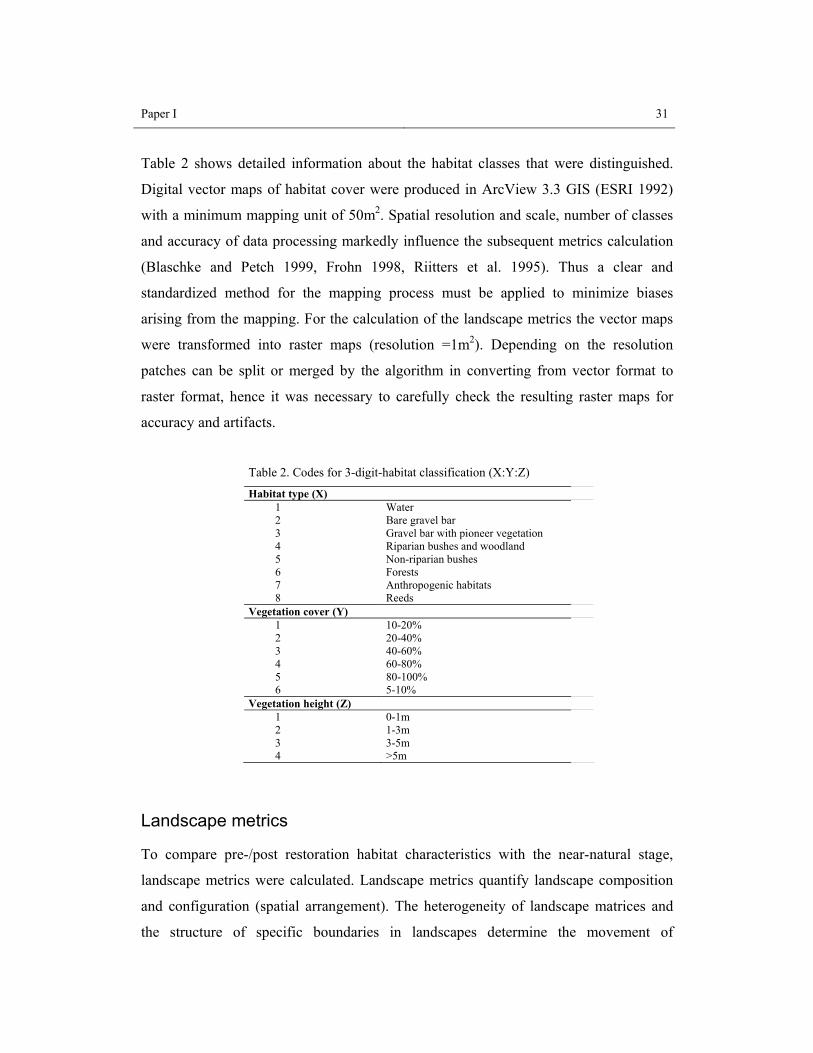
Table 2 shows detailed information about the habitat classes that were distinguished.
Digital vector maps of habitat cover were produced in ArcView 3.3 GIS (ESRI 1992)
with a minimum mapping unit of 50m2. Spatial resolution and scale, number of classes
and accuracy of data processing markedly influence the subsequent metrics calculation
(Blaschke and Petch 1999, Frohn 1998, Riitters et al. 1995). Thus a clear and
standardized method for the mapping process must be applied to minimize biases
arising from the mapping. For the calculation of the landscape metrics the vector maps
were transformed into raster maps (resolution =1m2). Depending on the resolution
patches can be split or merged by the algorithm in converting from vector format to
raster format, hence it was necessary to carefully check the resulting raster maps for
accuracy and artifacts.
Table 2. Codes for 3-digit-habitat classification (X:Y:Z)
Habitat type (X) 1 Water 2 Bare gravel bar 3 Gravel bar with pioneer vegetation 4 Riparian bushes and woodland 5 Non-riparian bushes 6 Forests 7 Anthropogenic habitats 8 Reeds
Vegetation cover (Y) 1 10-20% 2 20-40% 3 40-60% 4 60-80% 5 80-100% 6 5-10%
Vegetation height (Z) 1 0-1m 2 1-3m 3 3-5m 4 >5m
Landscape metrics
To compare pre-/post restoration habitat characteristics with the near-natural stage,
landscape metrics were calculated. Landscape metrics quantify landscape composition
and configuration (spatial arrangement). The heterogeneity of landscape matrices and
the structure of specific boundaries in landscapes determine the movement of
32 Paper I
organisms, materials and energy (Pickett and Cadenasso 1995). Hence, landscape
metrics can be interpreted as surrogates for the (inner) organization of a system which
reflect landscape function and processes (Forman and Godron 1986, Miller et al. 1997).
During the last 20 years numerous metrics have been proposed, many of them strongly
correlated (Gustafson 1998, McGarigal and Marks 1995, Turner et al. 2001). Thus one
needs to select a manageable set of independent metrics. According to several studies
only a few major aspects were identified to describe landscape composition and
landscape configuration (Herzog et al. 2001, Li and Reynolds 1994, Riitters et al. 1995).
Landscape composition is quantified by (i) the number and (ii) proportion of land-cover
types, whilst landscape configuration can be summarized as (i) the spatial arrangement
of patches, (ii) number and size of patches, (iii) occurrence of edges and (iv) patch
compaction (Herzog et al. 2001, Lausch and Herzog 2002, Li and Reynolds 1994,
Riitters et al. 1995). Reviewing the aforementioned studies shows that a small set of
metrics suffice to capture the principal properties of the landscape under consideration.
Regarding the selection of metrics one has to bear in mind that each study has a unique
setting and therefore the core metrics may differ. Thus our selection is based on the
studies referred to before and theoretical considerations focusing on key features of
riparian landscape pattern and their restoration. To cover the range of qualitatively
different landscape properties we selected at least one metric for each above-named
aspect (see Table 3). A test of the relationship among the selected indices showed that
they are relatively independent, having a Pearson correlation coefficient ≤0.46.
The raster version of PatchAnalyst (Rempel et al. 1999) was used for landscape metric
calculation. For each site the selected landscape metrics were computed at the landscape
level and – for selected key habitat types - at the habitat type (class) level.
We were also interested to know how far the present river widening deviates from the
pre-restoration status before and from a near-natural status. For comparison we used the
City Block Distance, also called „Manhattan“ metric.
Paper I 33
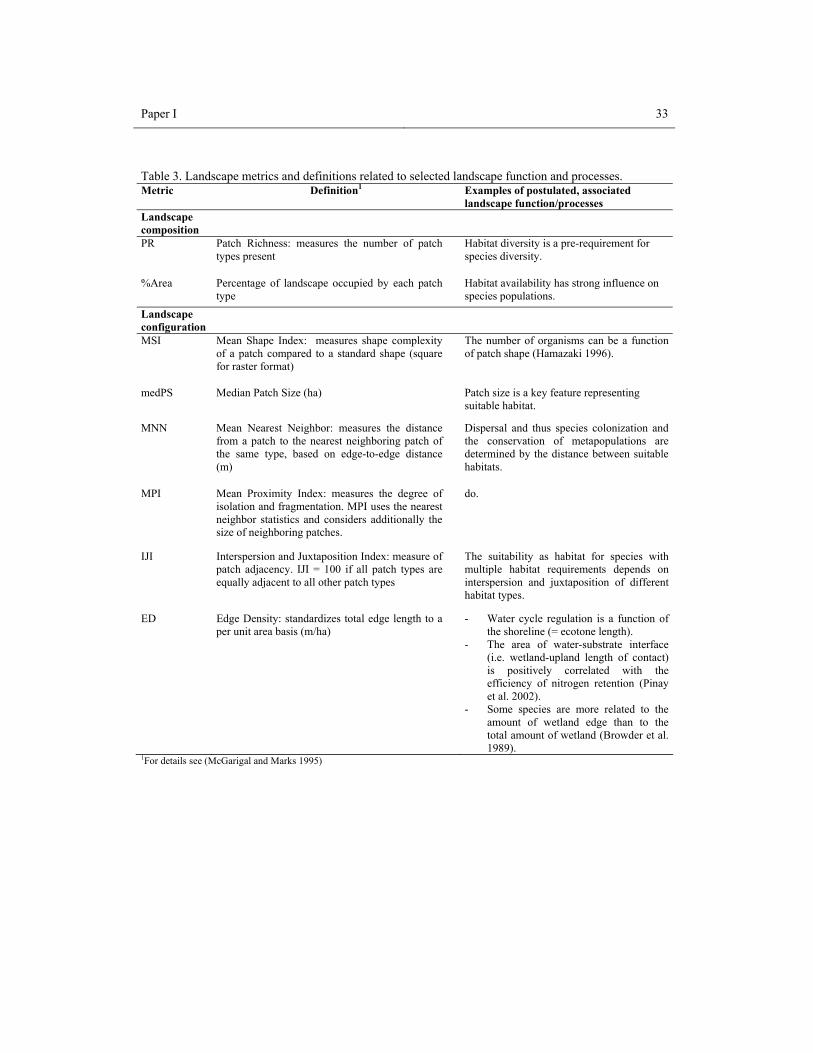
Table 3. Landscape metrics and definitions related to selected landscape function and processes. Metric Definition1 Examples of postulated, associated
landscape function/processes Landscape composition
PR Patch Richness: measures the number of patch types present
Habitat diversity is a pre-requirement for species diversity.
%Area Percentage of landscape occupied by each patch type
Habitat availability has strong influence on species populations.
Landscape configuration
MSI Mean Shape Index: measures shape complexity of a patch compared to a standard shape (square for raster format)
The number of organisms can be a function of patch shape (Hamazaki 1996).
medPS Median Patch Size (ha) Patch size is a key feature representing suitable habitat.
MNN Mean Nearest Neighbor: measures the distance from a patch to the nearest neighboring patch of the same type, based on edge-to-edge distance (m)
Dispersal and thus species colonization and the conservation of metapopulations are determined by the distance between suitable habitats.
MPI Mean Proximity Index: measures the degree of isolation and fragmentation. MPI uses the nearest neighbor statistics and considers additionally the size of neighboring patches.
do.
IJI Interspersion and Juxtaposition Index: measure of patch adjacency. IJI = 100 if all patch types are equally adjacent to all other patch types
The suitability as habitat for species with multiple habitat requirements depends on interspersion and juxtaposition of different habitat types.
ED Edge Density: standardizes total edge length to a per unit area basis (m/ha)
- Water cycle regulation is a function of the shoreline (= ecotone length).
- The area of water-substrate interface (i.e. wetland-upland length of contact) is positively correlated with the efficiency of nitrogen retention (Pinay et al. 2002).
- Some species are more related to the amount of wetland edge than to the total amount of wetland (Browder et al. 1989).
1For details see (McGarigal and Marks 1995)
34 Paper I
This metric compares two cases i and j and is the sum of the distances on each variable,
defined as follows (see also http://www.clustan.com/general_distances.html):
∑∑ −
=k ijk
k jkikijkij w
xxwd
where: xik is the value of variable k in case i, and wijk is a weight of 1 or 0 depending
upon whether or not the comparison is valid for the kth variable (if differential variable
weights are specified it is the weight of the kth variable). The Manhattan metric
aggregates the individual metrics into a single figure which allows the restoration
measure to be rated on a scale of naturalness running from heavily altered (canalized) to
near-natural.
Data subset clips
General considerations
An evaluation of restoration projects should be conducted in two steps. Firstly, the
restored area should be compared with the regulated reference to detect any changes in
landscape pattern due to the restoration process. Secondly, and of major importance, the
restored area and a near-natural reference should be compared to see if the restored area
matches the patterns inherent to a natural system. If significant differences can be found
one should consider the different spatial extent of the areas under investigation, because
the spatial extent of the map (window size) being analyzed has been shown to influence
the values of landscape metrics considerably (Hunsaker et al. 1994, Qi and Wu 1996,
Turner et al. 1989), especially those relating to patch complexity (Saura and Martinez-
Millan 2001). Therefore caution is necessary when comparing areas of different extent.
The influence of spatial extent can be reduced either by calculating the metric on the
basis of a standard unit area (Freeman et al. 2003) (which can not be done for every
metric) or by comparing the restored sites with a subset of near-natural areas of same
Paper I 35
size and shape as the restored sites. The latter approach is the one we used in this study.
This approach is similar to the random window sampling technique used in studies of
habitat selection in wildlife ecology (Mladenoff et al. 1995, Potvin et al. 2001, Ripple et
al. 1991) but instead of using a square window, a mask of the same shape and size as the
restored area was created to produce a data subset of comparable area from the near-
natural reference sites. For the near-natural data subsets mean/median and range were
calculated for each selected metric and compared with the values obtained from the
restored/regulated sites. Statistical analysis was conducted with SPSS 11.0 for
Windows.
Subset generation
By means of the GIS a size and shape matched stencil („window“) of the restored area
was produced. This stencil was used to cut out the subset of the habitat map of the
natural reference using the clip function in ArcMap 8.1 (ESRI 1999) (see Figure 4). The
stencil was positioned on the habitat maps with stencil centroids at randomly selected
grid points of a 50m2 grid. Only grid points which allowed for a complete overlap
between the stencil and the natural reference habitat map were used. The orientation of
the stencil followed the mean stream direction. If a landscape patch was truncated by
the edge of the stencil the portion of the patch within the stencil was included to provide
for a constant sample unit. Sampling with overlapping was allowed (Potvin et al. 2001).
The number of clips needed within a subset depends on the variability of the metric
values within the subset. The clipping process proceeded until the obtained additional
variability approached zero (∆ V = Vn+1 –V ≈ 0). As the data were not normally
distributed standard deviation and variance could not be used to describe the variability.
Instead we calculated the variability as half the interquartile range (IQR) as percentage
of the median (M): M
IQRV *5.0= (Lamprecht 1992). Based on ∆ V the variability
analysis showed that a sample size of 12 random windows provided a stabilization of
the variability (except for MPI at the site of Lostallo (Moesa)). Consequently we used a
set of 15 clips for the following investigations.
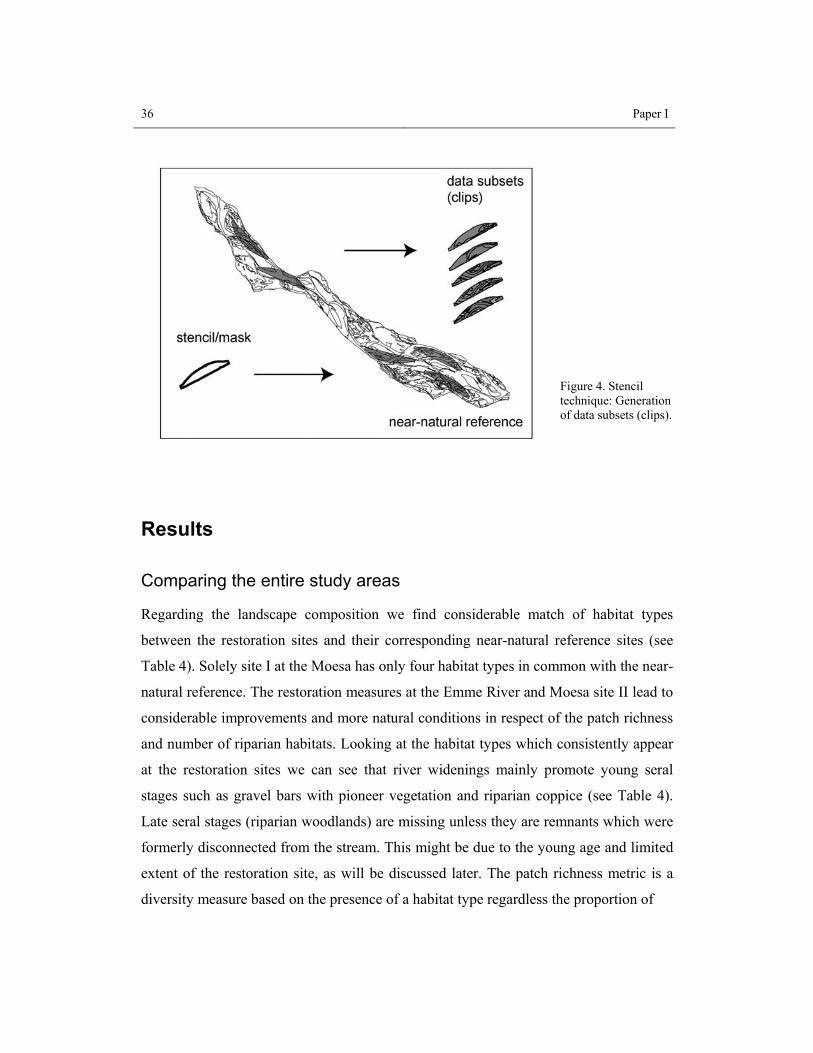
36 Paper I
Figure 4. Stencil technique: Generation of data subsets (clips).
Results
Comparing the entire study areas
Regarding the landscape composition we find considerable match of habitat types
between the restoration sites and their corresponding near-natural reference sites (see
Table 4). Solely site I at the Moesa has only four habitat types in common with the near-
natural reference. The restoration measures at the Emme River and Moesa site II lead to
considerable improvements and more natural conditions in respect of the patch richness
and number of riparian habitats. Looking at the habitat types which consistently appear
at the restoration sites we can see that river widenings mainly promote young seral
stages such as gravel bars with pioneer vegetation and riparian coppice (see Table 4).
Late seral stages (riparian woodlands) are missing unless they are remnants which were
formerly disconnected from the stream. This might be due to the young age and limited
extent of the restoration site, as will be discussed later. The patch richness metric is a
diversity measure based on the presence of a habitat type regardless the proportion of

Paper I 37
Table 4. Landscape composition of the restoration sites (rs), corresponding regulated (rr) and near-natural (nr) references. For habitat codes refer to Table 2. Habitat type code Emme
(rs)
Emme
(rr)
Sense
(nr)
Moesa
site I
(rs)
Moesa
site I
(rr)
Moesa
site II
(rs)
Moesa
site II
(rr)
Maggia
(nr)
%Area %Area %Area %Area %Area %Area %Area %Area
water 100 37.09 27.39 19.24 84.91 35.40 46.66 32.64 10.43
bare gravel bars 200 13.51 - 23.13 14.15 -
19.01 - 31.89
gravel bars with
pioneer vegetation
311 0.35 -
1.69 0.74 - - - 1.31
321 2.72 - 4.05 0.2 - 0.24 - 4.69
331 0.22 - 0.87 - - - - 0.51
341 2.15 - 0.31 - - 0.35 - 0.73
351 1.98 - 0.06 - - 1.12 - 0.32
361 1.58 - 4.19 - - 3.93 - 1.56
riparian coppice 422 0.68 - 5.74 - - 5.51 - 12.62
432 0.11 - 3.55 - - 3.65 - 3.91
442 0.19 - 3.7 - - 1.17 - 2.15
452 7.67 22.83 2.22 - - 4.95 - 1.98
riparian woodlands 423 - - - - - - - 2.47
433 - - 0.18 - - - - 1.79
443 - - 0.44 - - - - 0.87
453 10.68 - 8.22 - - 1.6 - 8.23
424 - - - - - - - 0.02
434 - - 0.08 - - - - -
454 18.51 - 20.16 - - - - 14.27
non-riparian coppice 500 1.34 - - - - 6.89 9.63 -
non-riparian
woodlands
600 0.64 42.38 - - 64.40 2.47 57.73 -
anthropogenic 700 0.58 7.4 2.15 - - 2.46 - 0.25
patch richness 17 4 18 4 2 14 3 19
number of riparian
habitats
14 2 17 4 1 11 1 18
Total area (ha) 4.86 4.86 55.48 5.18 5.18 4.7 4.7 150.59
landscape occupied by the individual habitat type. As there are many species which
have considerable minimum habitat area requirements it is also important to consider
38 Paper I
the area occupied by the individual habitat types. To avoid artifacts in differences of the
occupied area due to varying water levels we regard water and bare gravel bars as a
single, combined habitat type named „amphibious“. Table 4 shows that approx. 40% of
the area in near-natural stretches belongs to this amphibious habitat. In contrast the
restoration sites have a much higher percentage of either water or bare gravel bars
(Emme 50%, Moesa site I 99%, Moesa site II 65%). Thus the river widenings provide a
significant lower percentage of habitats for species which avoid amphibious ground
than do the near-natural sites. At the restoration site of Aefligen (Emme) no differences
in habitat occupation can be found for gravel bars with pioneer vegetation and riparian
woodlands. In contrast both restoration sites at the Moesa differ (in some respects
significantly) from their near-natural reference site at the Maggia River (see Table 4).
Thus habitat composition at the restoration site of the Emme is more natural than at the
sites at the Moesa.
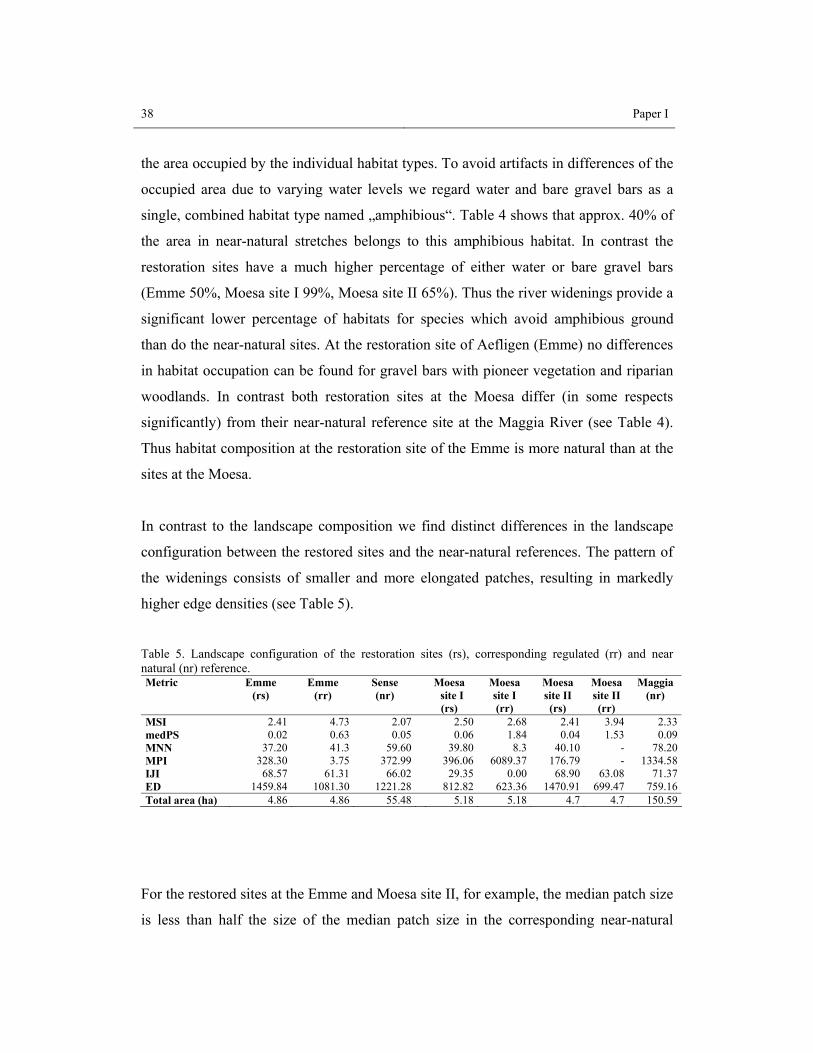
In contrast to the landscape composition we find distinct differences in the landscape
configuration between the restored sites and the near-natural references. The pattern of
the widenings consists of smaller and more elongated patches, resulting in markedly
higher edge densities (see Table 5).
Table 5. Landscape configuration of the restoration sites (rs), corresponding regulated (rr) and near natural (nr) reference. Metric
Emme (rs)
Emme (rr)
Sense (nr)
Moesa site I (rs)
Moesa site I (rr)
Moesa site II (rs)
Moesa site II (rr)
Maggia (nr)
MSI 2.41 4.73 2.07 2.50 2.68 2.41 3.94 2.33medPS 0.02 0.63 0.05 0.06 1.84 0.04 1.53 0.09MNN 37.20 41.3 59.60 39.80 8.3 40.10 - 78.20MPI 328.30 3.75 372.99 396.06 6089.37 176.79 - 1334.58IJI 68.57 61.31 66.02 29.35 0.00 68.90 63.08 71.37ED 1459.84 1081.30 1221.28 812.82 623.36 1470.91 699.47 759.16Total area (ha) 4.86 4.86 55.48 5.18 5.18 4.7 4.7 150.59
For the restored sites at the Emme and Moesa site II, for example, the median patch size
is less than half the size of the median patch size in the corresponding near-natural
Paper I 39
reference site. Our data shows that MSI generally increases with decreasing naturalness,
which means that the more natural a site is the more compact and less elongate the
patches are (see Table 5). Hence, a decrease in MSI indicates gain of interior habitat and
less edge effects. Generally speaking, the restoration measures lead to a more natural
habitat configuration, but the resulting pattern is more patchy than the pattern of the
near-natural reaches.
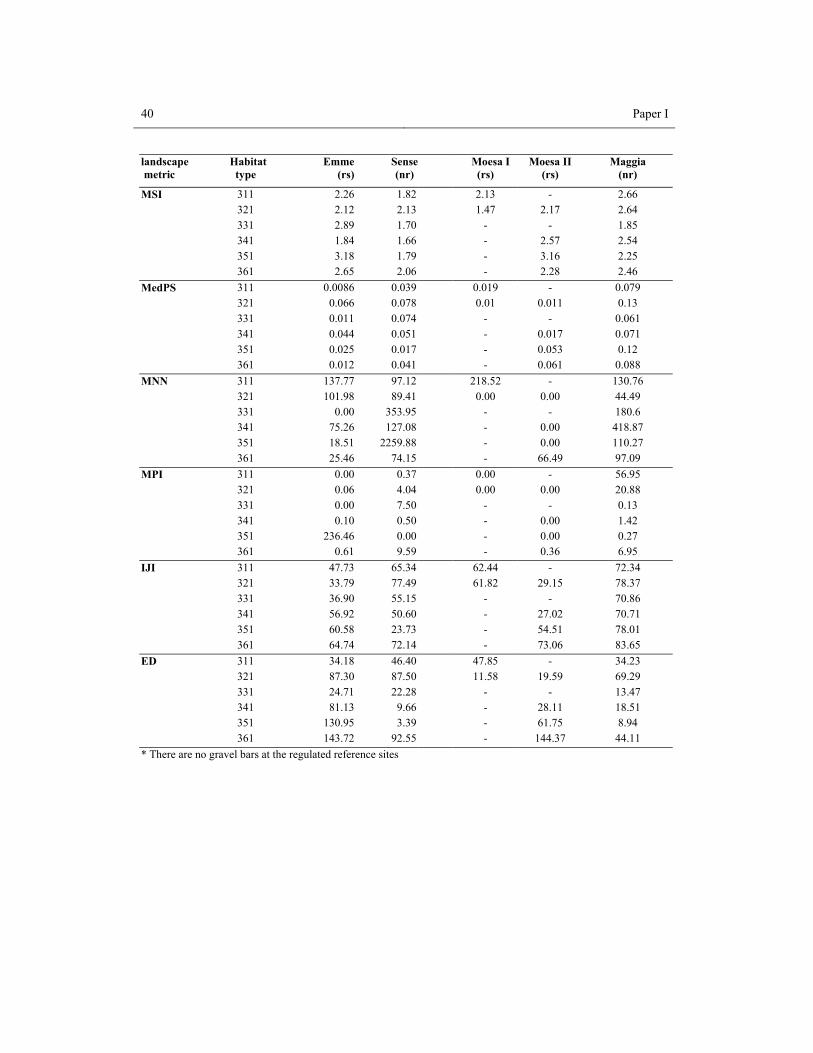
As we suspected that there might be differences between the calculation at the
landscape level and at the level of habitat types we calculated the metrics for selected
habitat types, for example, gravel bars with pioneer vegetation, which are of special
interest from a conservation point of view. As can be seen from Table 6 this calculation
revealed the same results as obtained for calculation at the landscape level, namely
smaller median patch size, higher edge density and mean shape index and less
interspersed seral stages.
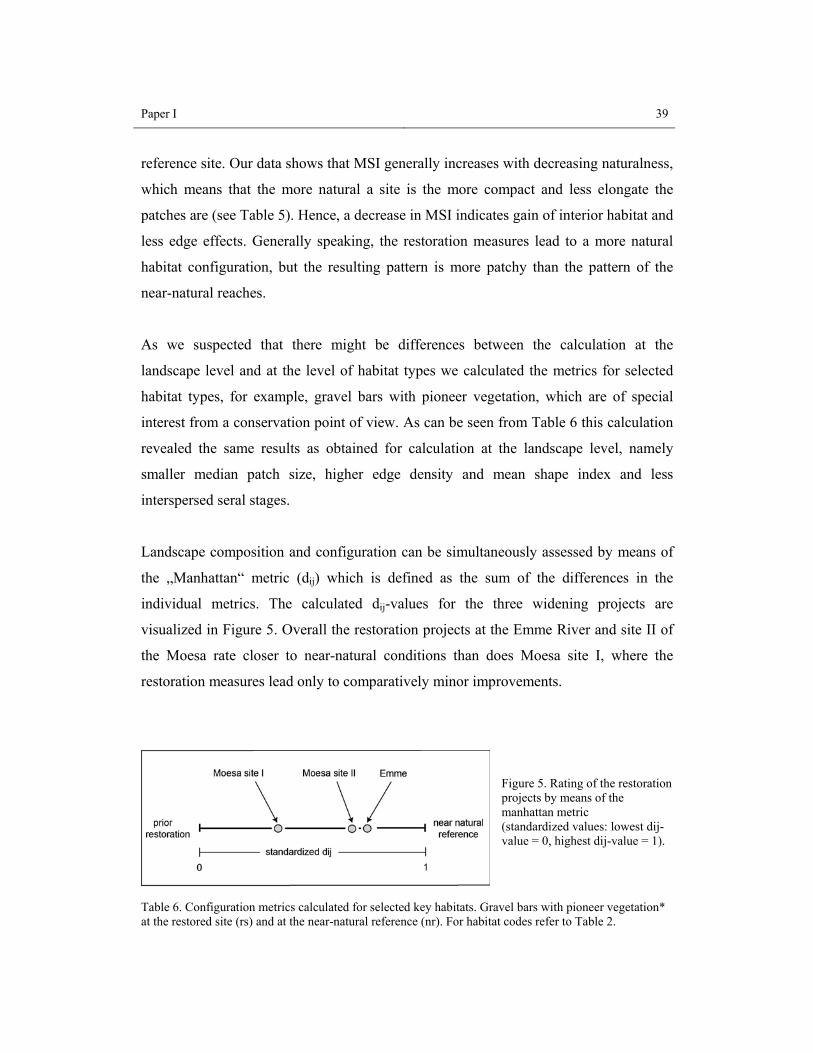
Landscape composition and configuration can be simultaneously assessed by means of
the „Manhattan“ metric (dij) which is defined as the sum of the differences in the
individual metrics. The calculated dij-values for the three widening projects are
visualized in Figure 5. Overall the restoration projects at the Emme River and site II of
the Moesa rate closer to near-natural conditions than does Moesa site I, where the
restoration measures lead only to comparatively minor improvements.
Figure 5. Rating of the restoration projects by means of the manhattan metric (standardized values: lowest dij-value = 0, highest dij-value = 1).
Table 6. Configuration metrics calculated for selected key habitats. Gravel bars with pioneer vegetation* at the restored site (rs) and at the near-natural reference (nr). For habitat codes refer to Table 2.
40 Paper I
landscape metric
Habitat type
Emme(rs)
Sense (nr)
Moesa I (rs)
Moesa II (rs)
Maggia (nr)
MSI 311 2.26 1.82 2.13 - 2.66 321 2.12 2.13 1.47 2.17 2.64 331 2.89 1.70 - - 1.85 341 1.84 1.66 - 2.57 2.54 351 3.18 1.79 - 3.16 2.25 361 2.65 2.06 - 2.28 2.46
MedPS 311 0.0086 0.039 0.019 - 0.079 321 0.066 0.078 0.01 0.011 0.13 331 0.011 0.074 - - 0.061 341 0.044 0.051 - 0.017 0.071 351 0.025 0.017 - 0.053 0.12 361 0.012 0.041 - 0.061 0.088
MNN 311 137.77 97.12 218.52 - 130.76 321 101.98 89.41 0.00 0.00 44.49 331 0.00 353.95 - - 180.6 341 75.26 127.08 - 0.00 418.87 351 18.51 2259.88 - 0.00 110.27 361 25.46 74.15 - 66.49 97.09
MPI 311 0.00 0.37 0.00 - 56.95 321 0.06 4.04 0.00 0.00 20.88 331 0.00 7.50 - - 0.13 341 0.10 0.50 - 0.00 1.42 351 236.46 0.00 - 0.00 0.27 361 0.61 9.59 - 0.36 6.95
IJI 311 47.73 65.34 62.44 - 72.34 321 33.79 77.49 61.82 29.15 78.37 331 36.90 55.15 - - 70.86 341 56.92 50.60 - 27.02 70.71 351 60.58 23.73 - 54.51 78.01 361 64.74 72.14 - 73.06 83.65
ED 311 34.18 46.40 47.85 - 34.23 321 87.30 87.50 11.58 19.59 69.29 331 24.71 22.28 - - 13.47 341 81.13 9.66 - 28.11 18.51 351 130.95 3.39 - 61.75 8.94 361 143.72 92.55 - 144.37 44.11
* There are no gravel bars at the regulated reference sites
Paper I 41
Comparing data subsets (clips)
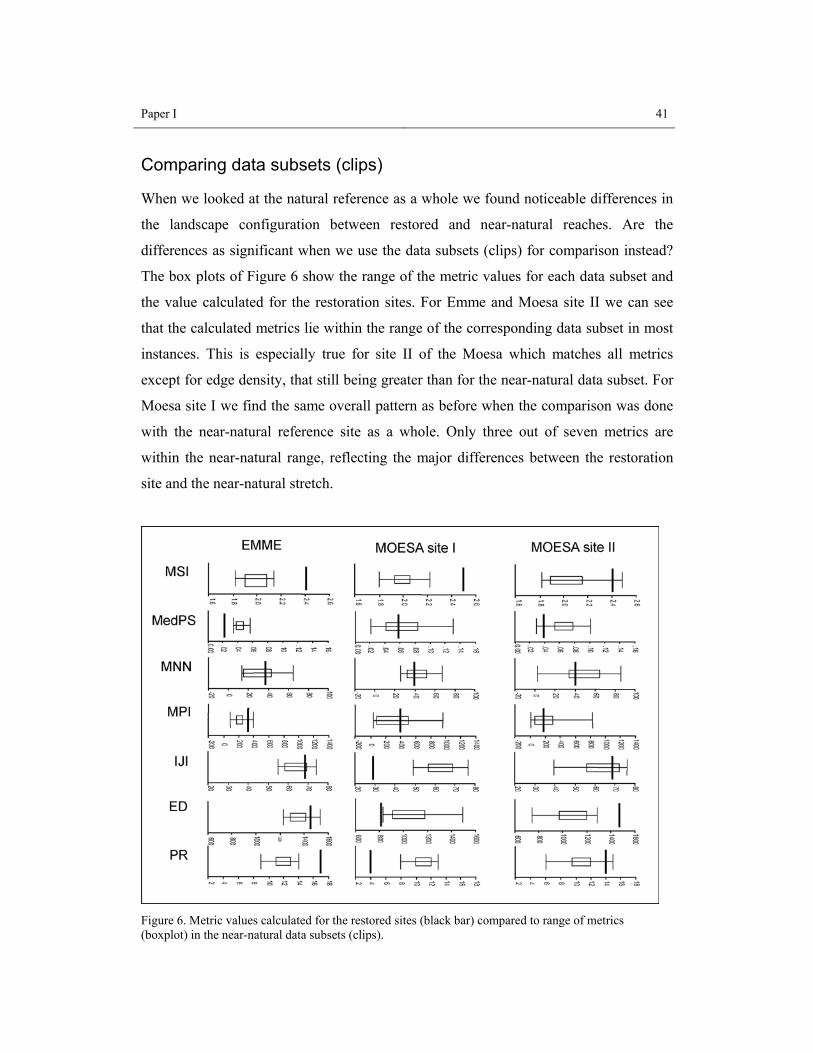
When we looked at the natural reference as a whole we found noticeable differences in
the landscape configuration between restored and near-natural reaches. Are the
differences as significant when we use the data subsets (clips) for comparison instead?
The box plots of Figure 6 show the range of the metric values for each data subset and
the value calculated for the restoration sites. For Emme and Moesa site II we can see
that the calculated metrics lie within the range of the corresponding data subset in most
instances. This is especially true for site II of the Moesa which matches all metrics
except for edge density, that still being greater than for the near-natural data subset. For
Moesa site I we find the same overall pattern as before when the comparison was done
with the near-natural reference site as a whole. Only three out of seven metrics are
within the near-natural range, reflecting the major differences between the restoration
site and the near-natural stretch.
Figure 6. Metric values calculated for the restored sites (black bar) compared to range of metrics (boxplot) in the near-natural data subsets (clips).
42 Paper I
Looking at the individual metrics in more detail we find that MNN and MPI, which
reflect neighboring aspects, are within the near-natural range for all three restoration
sites. For MNN the values even lie within the interquartile range. In contrast, the
restored sites differ markedly from the near-natural sites if we compare the values of
these metrics with the reference as a whole. This applies particularly to site I at the
Moesa. In general one can say that the differences to be found between restored sites
and near-natural stretches are less profound when comparison is done with the data
subsets instead of the natural reference as a whole.
Discussion The presented methodological framework is an attempt to provide a rapid assessment of
restoration measures based on readily available habitat data. The results of the method
based on landscape metrics calculation, stencil subset sampling and comparison of the
restored site versus a regulated/ near-natural reference are promising. However, the
method has several limitations that have to be considered before drawing final
conclusions.
(1) A method based on habitat mapping
Many indicators used for river (restoration) assessment focus on in-stream components
(Gergel et al. 2002, Innis et al. 2000). Benthos, temperature, water chemistry, velocity
etc. are important characteristics to be considered. However, in-stream environment
covers only 10-20% of the studied near-natural references. Thus in-stream indicators
neglect most of the floodplain. The (semi-) terrestrial zone of a floodplain is generally
characterized by a high habitat diversity and consequently high species richness, which
should be considered when assessing restoration efforts. Additionally, processes in the
riparian zone influence in-stream processes (Jones et al. 1999, Weller et al. 1998) (and
Paper I 43
vice versa). Therefore information on (semi-)terrestrial habitat should be included to
complement existing assessment schemes.
Floodplains are characterized by the presence of a wide range of successional stages due
to fluvial dynamics in natural river ecosystems. Therefore different horizontal and
vertical structures of plant cover occur, which provide different animal habitat. This
structural and functional diversity determines the richness of species diversity within
riparian communities. Mapping merely based upon broad classes (forest, nonforest f.ex)
and solely floristic characteristics does not account for this diversity. Therefore it is
important to map also structural and successional features such as vegetation height and
vegetation cover. The latter can easily be mapped using air photographs (orthophotos).
Vegetation height might need field verification, depending on the area’s topography.
In our rapid assessment we used habitat mapping that employs the widely
acknowledged relationship between site characteristics and species abundance (Amoros
2001). One could argue that measuring species abundance would yield more accurate
results. We acknowledge this but one has also to consider the following points:
- Firstly, a habitat reflects the potential for a typical biocoenosis to establish at a
specific site. With our method we are able to judge this potential, i.e. whether or
not the observed habitat pattern is similar to the near-natural conditions. This is
of primary interest in the evaluation of restoration projects as restoration
measures can mainly influence habitat conditions rather than species migration
and colonization. The latter depends on time for colonization and on distance to
seedling pools as well as on habitat availability. Colonization by a given species
can therefore be decelerated in time despite favorable habitat conditions.
- Secondly, there is often a large year-to-year variability in the abundance of
individual species due to factors that lie beyond the usual scale of a river
restoration project. Therefore it is unlikely that assessment of individual species
can inform the managers about the likely sustainability of the scheme, which is a
vital consideration for restoration designers (Downs 2001). The alternative is to
exploit the proven link between species and their physical habitats and to assess
44 Paper I
the restoration project against its provision of a suitable habitat template (Downs
2001). Additionally, habitat maps are readily generated and cost-efficient, an
important aspect considering the budget of many restoration projects.
(2) A very formalized assessment based on landscape metrics
Our primary purpose was to generate a rapid assessment method that compares habitat
properties after restoration with both the state prior to restoration and the near-natural
state. To do so we employed landscape metrics calculation which is readily done once
habitat maps are acquired.
Landscape metrics calculation is driven by the generally accepted paradigm that
landscape pattern can be linked to landscape function and processes (Forman and
Godron 1986, Honnay et al. 2003, Lausch and Thulke 2001). For an evaluation process
the individual metrics should be independent from each other to avoid the weighting of
single aspects. Thus the Pearsson correlation coefficient should be ideally less than 0.5.
But finally, selection of the metrics should depend not only on correlation coefficients
but on the questions to be answered as it is clear that each index adds additional
information about the pattern of a specific site.
Potentials and limitations of the use of landscape metrics have been discussed by
several authors (see Gustafson 1998, McGarigal and Marks 1995, Turner et al. 2001).
Thus only a few remarks will be made here. Mean shape index (MSI) and mean patch
fractal dimension (MPFD) are both measures of shape complexity. A simple test on
sensitivity showed that MSI is more sensitive to changes in patch shape than is MPFD.
Similar observations have been made by (Herzog et al. 2001, Moser et al. 2002). Thus
MSI was selected for the evaluation of patch shape. MNN and MPI measure patch
isolation and fragmentation. Both indices are based on the distance between patches, but
in some cases spatial resistance in between suitable habitat patches may be as crucial an
influence as distance on species dispersal. Thus interpretation of MNN and MPI is
limited. One has also to bear in mind that at the landscape level MNN and MPI consider
only patches having neighbors. Isolated habitat types are ignored. Therefore MNN and
MPI are best interpreted in conjunction with the number of patches being present.
Paper I 45
Landscape composition is a non-spatially-explicit characteristic. Following the ideas of
the patch-shifting-concept and the statements of Gepp (1985) concerning the fluvial
habitat mosaic the location of a single habitat patch may change with time but the total
area occupied by a certain habitat type remains the same (within a limited range). Thus
%land is a suitable indicator to be used in monitoring programs and evaluation
processes.
(3) Comparing entire study areas or subset clips
A methodological problem that occurs in many landscape studies is the comparison of
study objects of different size (Frohn 1998, Saura and Martinez-Millan 2001). As we
are well aware that the size of a study region influences certain landscape metrics we
propose a new method (the stencil technique) that yields samples with constant size and
shape. This is an important prerequisite for the comparison of different areas to reduce
bias due to window size. As the clips are artificial subsets of natural patterns some
remarks are needed for data interpretation. The patch size of the subset is likely to be
underestimated as the stencil truncates the larger patches. These fragments of patches
that are cut by the stencil border are likely to be smaller than the defined minimum
mapping unit used in the habitat maps of the restored area. Therefore we used median
values instead of mean values for the interpretation as the median is less sensitive to
those artificial outliers than is the mean. The data subsets allow the characterization of
the natural range of variability of habitat properties (composition & configuration)
found at near-natural sites. This insight into the natural range of variability helps to
assess whether the structural pattern found at a restoration site is within the natural
range of variability of natural systems or if they differ from natural conditions (Poiani et
al. 2000).
46 Paper I
(4) A method based on comparison of restored and near-natural sites
Near-natural stretches define the endpoint to aim for in a restoration process. Thus
reference sites are needed to assess the degree of naturalness which has been achieved
by a selected restoration project (Downs 2001, Innis et al. 2000, Milner 1996).
However, a major limitation of this study is that the assessment of the post restoration
stage is not based on near-natural sites in situ but on the comparison of sites that are
most similar to the site under investigation (analogy conclusion). If the reference sites
do not belong to the same system as the restoration sites the most important differences
between the areas need to be known and to be taken into account during the evaluation
process. Thus natural references are best interpreted as „generalized models“.
In the process of restoration time plays a major role in the establishment of near-natural
features. Succession needs some time to develop late seral stages like shrub and
woodlands. Therefore evaluation should allow for this „time lag“ and should not take
place until a few years after the restoration measures have been finished. Restoration at
the Emme River was finished around 10 years ago but still lacks late seral stages
initialized by the restoration process. The riparian woodlands which can be found at the
Emme restoration site are remnants of the situation before the restoration measures took
place. But even provided enough time for establishment it is still doubtful that all seral
stages naturally present in a floodplain will occur in the river widenings due to their
limited spatial extent. This is confirmed by the metric analysis at the habitat level which
revealed a median patch size in the near-natural sites up to six times larger than that to
be found at the present restoration sites. The sum of the mean patch sizes of each habitat
class (excluding water) for the near-natural site at the Sense river is 7.5 ha. This area is
one and a half times larger than the total extent of the river widening at the
corresponding river widening at the Emme (5 ha). Thus the extent of the widenings does
not allow the establishment of the whole range of floodplain habitats. One has also to
consider that the river widenings solely open the channel but not allowing the former
floodplain to be flooded. Therefore new habitats establish in the channel were stream
velocity and scour is high. This hampers the development of woodlands which develop
at sites with low disturbance level.
Paper I 47
We were able to consider spatial variation in the near-natural clips, but acknowledge
that we could not take temporal variation into account. It remains to be answered, if the
temporal variation of the near-natural metric values produces considerably different
ranges than the ranges for spatial variability obtained in this study.
Conclusions Given the limitations of the approach discussed above we conclude that:
a) Reference sites, both regulated and near-natural are pre-requisites for successful
assessment. The proposed stencil technique is applicable to any restoration
project and allows an efficient and rapid assessment of the degree of naturalness
being achieved as it readily offers insights into similarities and differences
between regulated, restored and near-natural sites. The clip of data subsets
proofed to be a suitable method to assess to what extent a natural habitat pattern
has been achieved by the restoration measures considering the limited spatial
extent of those measures. Thus a manager can check if the restoration project has
obtained a near-natural state, taken into account that the spatial dimension of the
project is limited by socioeconomic constraints.
b) Considering the riparian zone complements in-stream indicators and thus
maximizes the quality of the assessment on the performance of the restored site.
This approach allows to assess the ecological integrity of a certain site, which is
defined as the full range of elements and processes expected in a regions natural
habitat (Karr and Dudley 1981).
c) Landscape metrics are valuable indicators for the evaluation of restoration
projects as they are surrogates for landscape function and offer valuable insights
into similarities and differences between landscape pattern in different
landscapes. The proposed core set of landscape metrics (MSI, medPS, MNN,
MPI, IJI, ED, %Area, PR) suffice to capture the principal properties of a natural
48 Paper I
pattern and they are intuitive and easily interpretable which makes them easy to
communicate to a wide range of stakeholders. The Manhattan metric (dij) allows
a quick and clear rating of restoration measures, thus supporting the evaluation
process and communication.
d) River widenings provide the potential for the re-establishment of riparian
habitat, mainly young seral stages, showing a more complex habitat mosaic than
near-natural sites. Thus it is possible to re-establish some aspects of fluvial
ecosystems, but river widenings can not replace (near) natural ecosystems.
Acknowledgements We thank P. Englmaier and F. Herzog for helpful feedback on an earlier draft and M. G.
Turner for her comments and suggestions which greatly improved the manuscript. C.
Ginzler deserves thanks for advice in the process of converting aerial photographs to
orthophotos. This study is part of the Rhone-Thur-Project funded by the Swiss Federal
Research Institute WSL, the Swiss Federal Institute for Environmental Science and
Technology (EAWAG), the Swiss Federal Office for Water and Geology (FOWG) and
the Swiss Agency for the Environment, Forests and Landscape (SAEFL).
Literature cited Amoros, C. 2001. The concept of Habitat Diversity Between and Within Ecosystems Applied to River
Side-Arm Restoration. Environmental Management 28: 805-817. Blaschke, T. and Petch, J. 1999: Landscape structure and scale: comparative studies on some landscape
indices in Germany and the UK. Pages 75-84 in Maudsley, M. and Marshall, J. (eds.) Heterogeneity in Landscape Ecology: Pattern and Scale, IALE UK, Bristol.
Browder, J. A., May, L. N., Rosenthal, A., Gosselink, J. G. and Baumann, R. H. 1989. Modeling future-
trends in wetland loss and brown shrimp production in Louisiana using thematic mapper imagery. Remote sensing of environment 28: 45-52.
Paper I 49
Brunke, M. 2002. Floodplains of a regulated southern alpine river (Brenno, Switzerland): ecological assessment and conservation options. Aquatic conservation - marine and freshwater ecosystems 12: 583-599.
Downs, P. 2001: Geomorphological evaluation of river restoration schemes: principles, method,
monitoring, assessment, evaluation. Progress? Pages 243-249. in Nijland, H. J. and Cals, M. J. R. (eds.) River Restoration in Europe: practical approaches, Institute for Inland Water Management and Waste Water Treatment / RIZA, Lelystad.
Forman, R. T. T. and Godron, M. 1986. Landscape ecology. Wiley, New York a.o., XIX, 619 pp. Freeman, R. E., Stanley, E. H. and Turner, M. G. 2003. Analysis and conservation implications of
landscape change in the Wisconsin river Floodplain, USA. Ecological Applications 13: 416-431. Frohn, R. 1998. Remote Sensing for Landscape Ecology. New metric indicators for monitoring, modeling
and assessment of ecosystems. Lewis Publishers, Boca Raton, 99 pp. Gallandat, J.-D., Gobat, J.-M. and Roulier, C. 1993. Kartierung der Auen von nationaler Bedeutung. Vol.
199, Schriftenreihe Umwelt, Bundesamt für Umwelt, Wald und Landschaft (BUWAL). Gepp, J. 1985. Auengewässer als Oekozellen. Fluss-Altarme, Altwässer und sonstige Auen-Stillgewässer
Oesterreichs; Bestand, Oekologie und Schutz. Grüne Reihe, Bundesministerium für Gesundheit und Umweltschutz, Wien, 322 pp.
Gergel, S. E., Turner, M. G., Miller, J. R., Melack, J. M. and Stanley, E. H. 2002. Landscape indicators of
human impacts to riverine systems. Aquatic science 64: 118-128. Gilvear, D., Heal, K. and Stephen, A. 2002. Hydrology and the ecological quality of Scottish river
ecosystems. Science of the total environment 294: 131-159. Gustafson, E. J. 1998. Quantifying landscape spatial pattern: what is the state of the art? Ecosystems 1:
143-156. Hamazaki, T. 1996. Effects of patch shape on the number of organisms. Landscape Ecology 11: 299-306. Henry, C., Amoros, C. and N, R. 2002. Restoration ecology of riverine wetlands: A 5-year post-operation
survey on the Rhone River, France. Ecolgical engeneering 18: 543-554. Herzog, F., Lausch, A., Müller, E., Thulke, H.-H., Steinhard, U. and Lehmann, S. 2001. Landscape
Metrics for Assessment of Landscape Destruction and Rehabilitation. Environmental Management 27: 91-107.
Honnay, O., Piessens, K., Van Landuyt, W., Hermy, M. and Gulinck, H. 2003. Satellite based land use
and landscape complexity indices as predictors for regional plant species diversity. Landscape and urban planning 63: 241-250.
Hunsaker, C. T., O'Neill, R. V., Jackson, B. L., Timmins, S. P., Levine, D. A. and Norton, D. A. 1994.
Sampling to characterize landscape pattern. Landscape Ecology 9: 207-226. Innis, S. A., Naiman, R. J. and Elliott, S. R. 2000. Indicators and assessment methods for measuring the
ecological integrity of semi-aquatic terrestrial environments. Hydrobiologia 422/423: 111-131. Jones, E. B. D., Helfman, G. S., Harper, O. J. and Bolstad, P. V. 1999. Effects of riparian forest removal
on fish assemblages in southern Appalachian streams. Conservation Biology 16: 1454-1465.

50 Paper I
Karr, J. R. and Dudley, D. R. 1981. Ecological perspectives on water quality goals. Environmental
Management 5: 55-68. Kondolf, M. G. and Micheli, E. R. 1995. Evaluating Stream Restoration Projects. Environmental
Management 19: 1-15. Lamprecht, J. 1992. Biologische Forschung: Von der Planung bis zur Publikation. Vol. 73, Pareys
Studientexte, Verlag Paul Parey, Berlin and Hamburg, 157 pp. Lausch, A. and Thulke, H.-H. 2001: The analysis of spatio-temporal dynamics of landscape structures.
Pages 113-136 in Krönert, R., Steinhard, U. and Volk, M. (eds.) Landscape balance and landscape assessment, Springer-Verlag, Berlin, Heidelberg, New York.
Lausch, A. and Herzog, F. 2002. Applicability of landscape metrics for the monitoring of landscape
change: issues of scale, resolution and interpretability. Ecological Indicators 2: 3-15. Li, H. and Reynolds, J. F. 1994. A simulation experiment to quantify spatial heterogeneity in categorical
maps. Ecology 75: 2446-2455. Malanson, G. P. 1995. Riparian Landscapes. Cambridge University Press, Cambridge, 296 pp. McGarigal, K. and Marks, B. 1995. FRAGSTATS: spatial pattern analysis program for quantifying
landscape structure., U.S. Department of Agriculture, Forest Service, Pacific Northwest Research Station, 122.
Miller JN, Brooks RP and MJ, C. 1997. Effects of landscape patterns on biotic communities. Landscape
Ecology 3: 137-153. Milner, A. M. 1996: System Recovery. Pages 67-76 in Petts, G. and Calow, P. (eds.) River Restoration,
Blackwell Science Ltd., Oxford. Mladenoff, D. J., Sickley, T. A., Haight, R. G. and Wydeven, A. P. 1995. A regional landscape analysis
and prediction of favorable gray wolf habitat in the Northern Great Lakes Region. Conservation Biology 9: 279-294.
Moser, D., Zechmeister, H. G., Plutzar, C., Sauberer, N., Wrbka, T. and Grabherr, G. 2002. Landscape
patch shape complexity as an effective measure for plant species richness in rural landscapes. Landscape Ecology 17: 657-669.
Naiman, R. J., Décamps, H. and Pollock, M. 1993. The role of riparian corridors in maintaining regional
biodiversity. Ecological Applications 3: 209-212. Nilsson, C. and Svedmark, M. 2002. Basic Principles and Ecological Consequences of Changing Water
Regimes: Riparian Plant Communities. Environmental Management 30: 468-480. Pedroli, B., de Blust, G., van Looy, K. and van Rooij, S. 2002. Setting targets in strategies for river
restoration. Landscape Ecology 17 (Suppl.1): 5-18. Petts, G. and Calow, P. 1996. River Restoration. Blackwell Science Ltd, Oxford, 231 pp. Pickett, S. T. A. and Cadenasso, M. L. 1995. Landscape Ecology - spatial heterogeneity in ecological
systems. Science 269: 331-334.

Paper I 51
Pinay, G., Clément, J. C. and Naiman, R. J. 2002. Basic Principles and Ecological Consequences of Changing Water Regimes on Nitrogen Cycling in Fluvial Systems. Environmental Management 30: 481-491.
Poiani, K. A., Richter, B. D., Anderson, M. G. and Richter, H. E. 2000. Biodiversity Conservation at
Multiple Scales: Functional Sites, Landscapes, and Networks. BioSciense 50: 133-146. Potvin, F., Lowell, K., Fortin, M.-J. and Bélanger, L. 2001. How to test habitat selection at the home
range scale: A resampling random windows technique. Ecoscience 8: 399-406. Qi, Y. and Wu, J. 1996. Effects of changing spatial resolution on the results of landscape patterns analysis
using spatial autocorrelation indices. Landscape Ecology 11: 39-49. Rempel, R. S., Carr, A. and Elkie, P. 1999. Patch analyst and patch analyst (grid) function reference.
Centre for Northern Forest Ecosystem Research, Ontario Ministry of Natural Resources, Lakehead University.
Riitters, K. H., O'Neill, R. V., Hunsaker, C. T., Wickham, D. H., Yankee, D. H., Timmins, S. P., Jones,
K. B. and Jackson, B. L. 1995. A factor analysis of landscape pattern and structure metrics. Landscape Ecology 10: 23-29.
Ripple, W. J., Johnson, D. H. and Meslow, C. E. 1991. Old-growth and mature forests near spotted owl
nests in western Oregon. The Journal of Wildlife Management 55: 316-318. Saura, S. and Martinez-Millan, J. 2001. Sensitivity of Landscape Pattern Metrics to Map Spatial Extent.
Photogrammetric engineering & remote sensing 67: 1027-1036. Thomson, J., Taylor, M., Fryirs, K. and Brierley, G. 2001. A geomorphological framework for river
characterization and habitat assessment. Aquatic conservation - marine and freshwater ecosystems 11: 373-389.
Turner, M. G., Gardner, R. H. and O'Neill, R. V. 2001. Landscape ecology in theory and practice. Pattern
and process. Springer, New York, 401 pp. Turner, M. G., O'Neill, R. V., Gardner, R. H. and Milne, B. T. 1989. Effects of changing spatial scale on
the analysis of landscape pattern. Landscape Ecology 3: 153-162. Weller, D. E., Jordan, T. E. and Correll, D. L. 1998. Heuristic models for material discharge from
landscapes with riparian buffers. Ecological Applications 8: 1156-1169.

52 Paper I
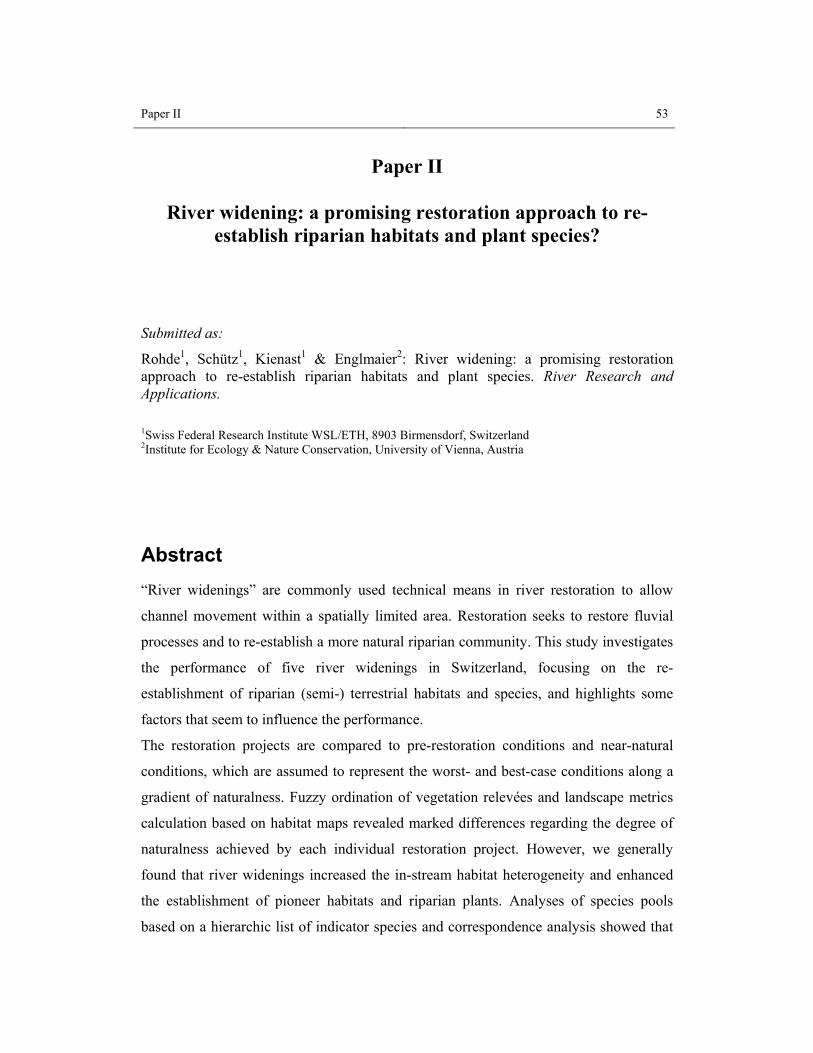
Paper II 53
Paper II
River widening: a promising restoration approach to re-establish riparian habitats and plant species?
Submitted as:
Rohde1, Schütz1, Kienast1 & Englmaier2: River widening: a promising restoration approach to re-establish riparian habitats and plant species. River Research and Applications. 1Swiss Federal Research Institute WSL/ETH, 8903 Birmensdorf, Switzerland 2Institute for Ecology & Nature Conservation, University of Vienna, Austria
Abstract “River widenings” are commonly used technical means in river restoration to allow
channel movement within a spatially limited area. Restoration seeks to restore fluvial
processes and to re-establish a more natural riparian community. This study investigates
the performance of five river widenings in Switzerland, focusing on the re-
establishment of riparian (semi-) terrestrial habitats and species, and highlights some
factors that seem to influence the performance.
The restoration projects are compared to pre-restoration conditions and near-natural
conditions, which are assumed to represent the worst- and best-case conditions along a
gradient of naturalness. Fuzzy ordination of vegetation relevées and landscape metrics
calculation based on habitat maps revealed marked differences regarding the degree of
naturalness achieved by each individual restoration project. However, we generally
found that river widenings increased the in-stream habitat heterogeneity and enhanced
the establishment of pioneer habitats and riparian plants. Analyses of species pools
based on a hierarchic list of indicator species and correspondence analysis showed that
54 Paper II
the ability of river widenings to host typical riparian species and to increase local plant
diversity strongly depends on the distance to near-natural stretches. Species dispersal
and establishment might be hampered by decisions taken outside the scope of the
restoration project. Therefore we conclude that further action on the catchment scale is
needed to maximise the effort of local management.
Keywords: river widening, restoration, riparian habitat, riparian plant species,
landscape metrics, Manhattan metric, reference system, assessment, Switzerland
Introduction Several studies have emphasized the importance of riparian ecosystems as centres of
biodiversity since they link terrestrial and aquatic systems (Malanson, 1995; Naiman et
al., 1993; Ward, 1998; Ward et al., 2002). However, intensive anthropogenic use and
alteration of riverine landscapes have led to severe degradation of river-floodplain
systems, especially in highly industrialised countries. River-bed erosion and loss of
riparian habitat and species are among the most prominent consequences of these
engineering works (Erskine, 1992; Pedroli et al., 2002; Petts and Calow, 1996). In
recent years the restoration of these wetlands has become an important issue, enhanced
by the European Union’s Habitat and Water Framework Directives. In the Netherlands,
for example, the number of stream restoration projects increased from 70 to 206
between 1991-1998 (Verdonschot and Nijboer, 2002).
One major conceptual framework in restoration ecology is the restoration threshold
concept formulated by Hobbs and Norton (1996). A number of different states may exist
for a system, but once a threshold is crossed the system needs some active management
to remove the stressors and to allow the system to recover. Whisenant (1999) proposed
two types of restoration thresholds: one caused by biotic stressors and the other caused
by abiotic limitations. However, the re-establishment of the abiotic habitat conditions is
a pre-requisite for the return of riparian species (Bakker et al., 2002, de Jonge and de
Jong, 2002).
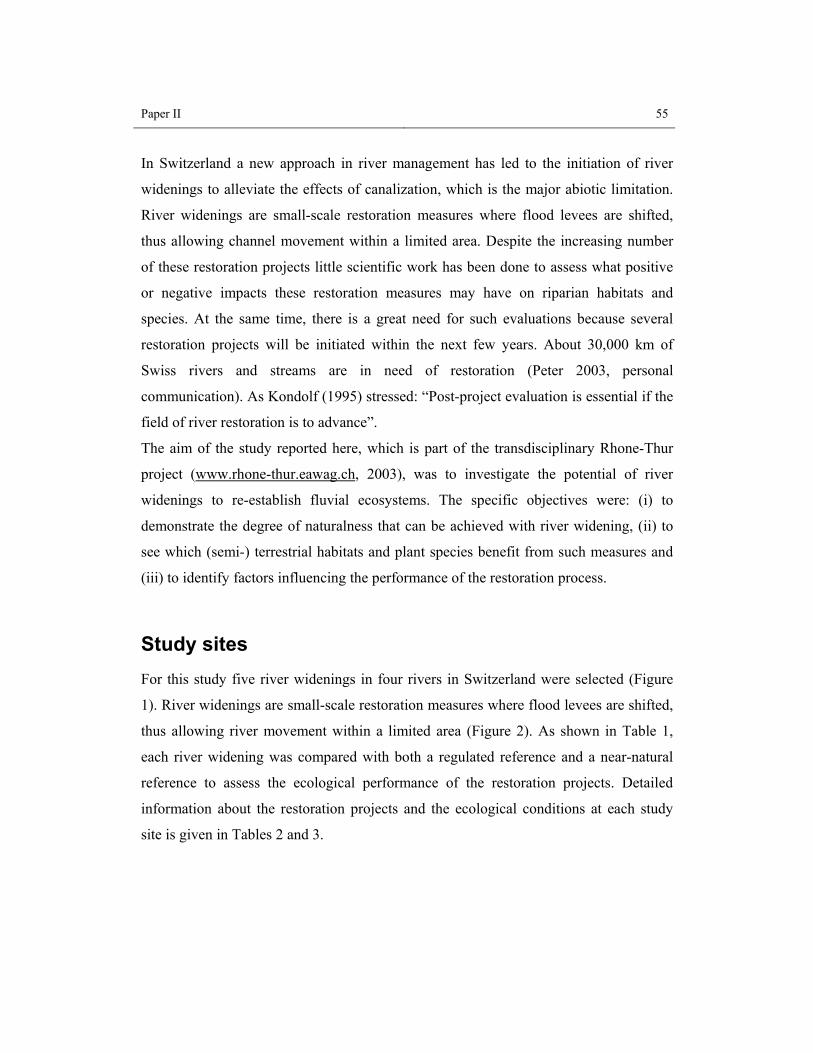
Paper II 55
In Switzerland a new approach in river management has led to the initiation of river
widenings to alleviate the effects of canalization, which is the major abiotic limitation.
River widenings are small-scale restoration measures where flood levees are shifted,
thus allowing channel movement within a limited area. Despite the increasing number
of these restoration projects little scientific work has been done to assess what positive
or negative impacts these restoration measures may have on riparian habitats and
species. At the same time, there is a great need for such evaluations because several
restoration projects will be initiated within the next few years. About 30,000 km of
Swiss rivers and streams are in need of restoration (Peter 2003, personal
communication). As Kondolf (1995) stressed: “Post-project evaluation is essential if the
field of river restoration is to advance”.
The aim of the study reported here, which is part of the transdisciplinary Rhone-Thur
project (www.rhone-thur.eawag.ch, 2003), was to investigate the potential of river
widenings to re-establish fluvial ecosystems. The specific objectives were: (i) to
demonstrate the degree of naturalness that can be achieved with river widening, (ii) to
see which (semi-) terrestrial habitats and plant species benefit from such measures and
(iii) to identify factors influencing the performance of the restoration process.
Study sites For this study five river widenings in four rivers in Switzerland were selected (Figure
1). River widenings are small-scale restoration measures where flood levees are shifted,
thus allowing river movement within a limited area (Figure 2). As shown in Table 1,
each river widening was compared with both a regulated reference and a near-natural
reference to assess the ecological performance of the restoration projects. Detailed
information about the restoration projects and the ecological conditions at each study
site is given in Tables 2 and 3.
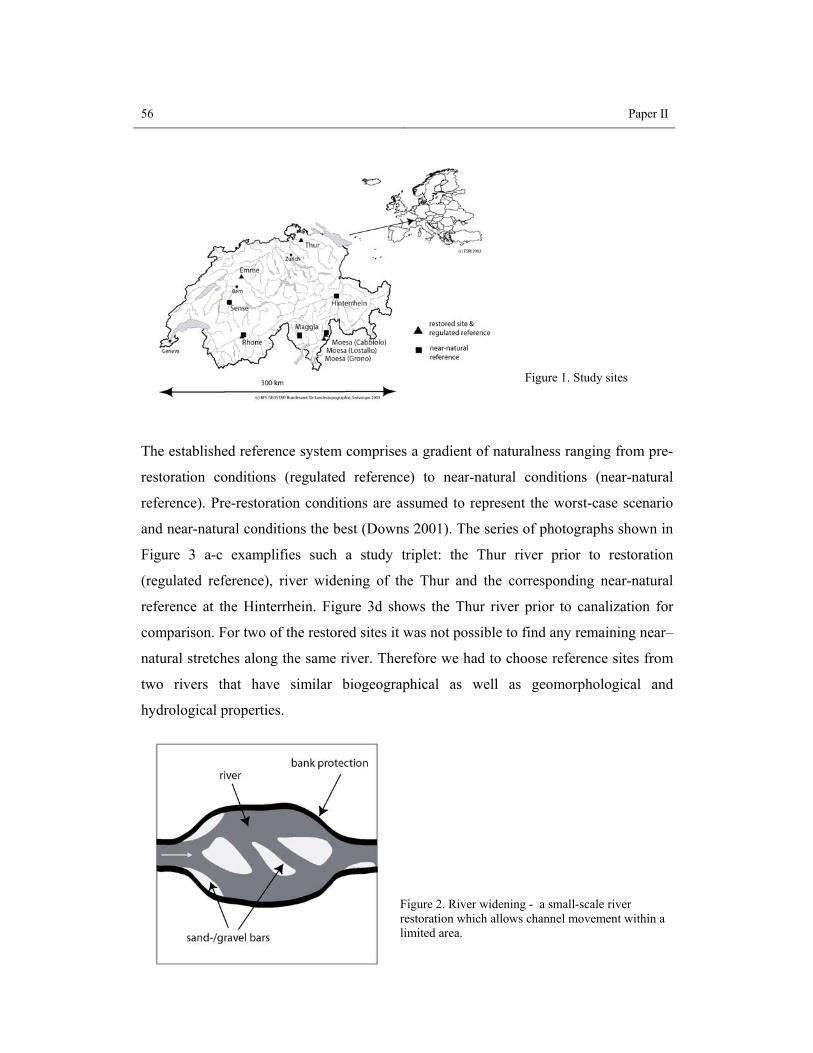
56 Paper II
Figure 1. Study sites
The established reference system comprises a gradient of naturalness ranging from pre-
restoration conditions (regulated reference) to near-natural conditions (near-natural
reference). Pre-restoration conditions are assumed to represent the worst-case scenario
and near-natural conditions the best (Downs 2001). The series of photographs shown in
Figure 3 a-c examplifies such a study triplet: the Thur river prior to restoration
(regulated reference), river widening of the Thur and the corresponding near-natural
reference at the Hinterrhein. Figure 3d shows the Thur river prior to canalization for
comparison. For two of the restored sites it was not possible to find any remaining near–
natural stretches along the same river. Therefore we had to choose reference sites from
two rivers that have similar biogeographical as well as geomorphological and
hydrological properties.
Figure 2. River widening - a small-scale river restoration which allows channel movement within a limited area.
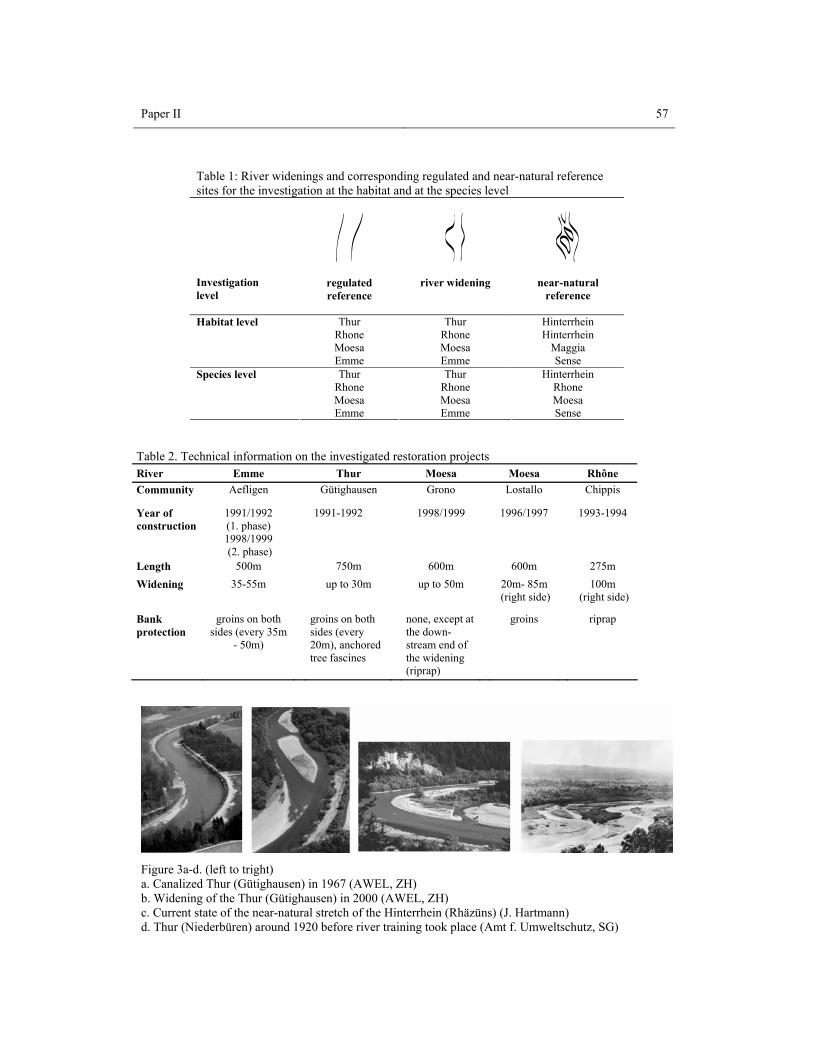
Paper II 57
Table 1: River widenings and corresponding regulated and near-natural reference sites for the investigation at the habitat and at the species level Investigation level
regulated reference
river widening
near-natural reference
Thur Thur Hinterrhein Rhone Rhone Hinterrhein Moesa Moesa Maggia
Habitat level
Emme Emme Sense Thur Thur Hinterrhein
Rhone Rhone Rhone Moesa Moesa Moesa
Species level
Emme Emme Sense
Table 2. Technical information on the investigated restoration projects River Emme Thur Moesa Moesa Rhône Community Aefligen Gütighausen Grono Lostallo Chippis
Year of construction
1991/1992 (1. phase) 1998/1999 (2. phase)
1991-1992 1998/1999 1996/1997 1993-1994
Length 500m 750m 600m 600m 275m Widening 35-55m up to 30m up to 50m 20m- 85m
(right side) 100m
(right side)
Bank protection
groins on both sides (every 35m
- 50m)
groins on both sides (every 20m), anchored tree fascines
none, except at the down-stream end of the widening (riprap)
groins riprap
Figure 3a-d. (left to tright) a. Canalized Thur (Gütighausen) in 1967 (AWEL, ZH) b. Widening of the Thur (Gütighausen) in 2000 (AWEL, ZH) c. Current state of the near-natural stretch of the Hinterrhein (Rhäzüns) (J. Hartmann) d. Thur (Niederbüren) around 1920 before river training took place (Amt f. Umweltschutz, SG)
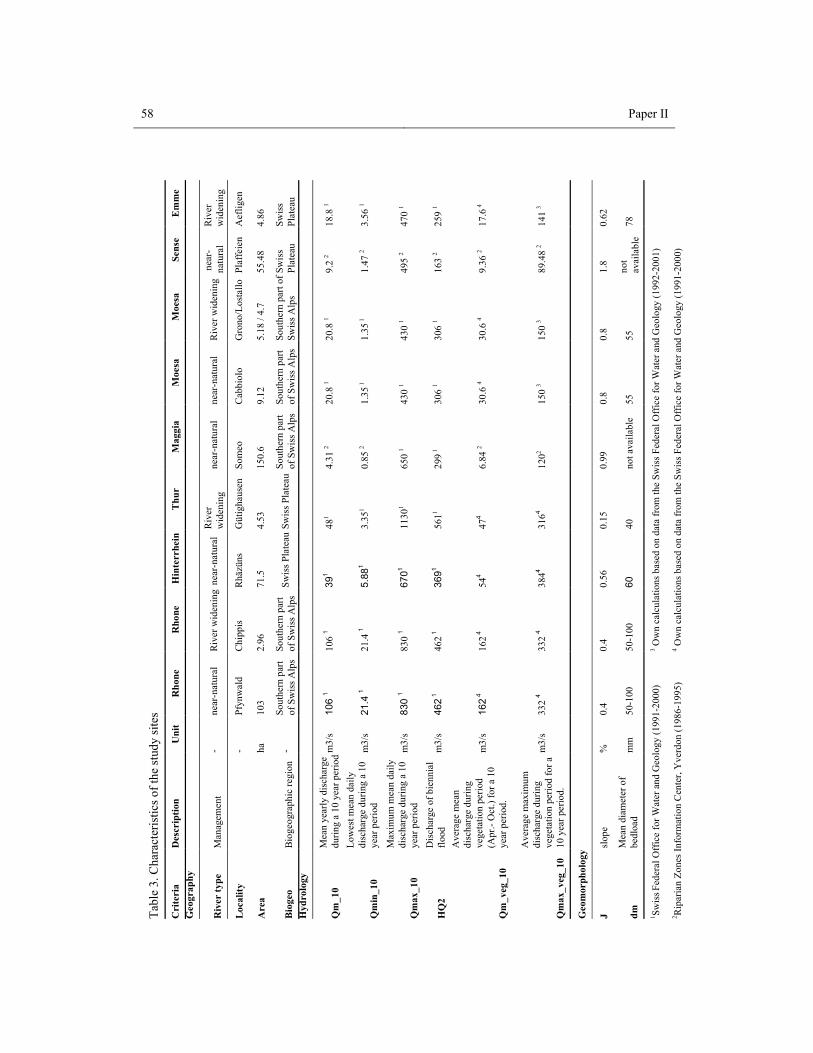
58 Paper II
Em
me
Riv
er
wid
enin
g
Aef
ligen
4.86
Swis
s Pl
atea
u 18
.8 1
3.56
1
470
1
259
1
17.6
4
141
3
0.62
78
Sens
e
nea
r-na
tura
l
Plaf
feie
n
55.4
8
Swis
s Pl
atea
u 9.
2 2
1.47
2
495
2
163
2
9.36
2
89.4
8 2
1.8
not
avai
labl
e
Moe
sa
Riv
er w
iden
ing
Gro
no/L
osta
llo
5.18
/ 4.
7
Sout
hern
par
t of
Swis
s Alp
s 20
.8 1
1.35
1
430
1
306
1
30.6
4
150
3
0.8
55
Moe
sa
near
-nat
ural
Cab
biol
o
9.12
Sout
hern
par
t of
Sw
iss A
lps
20.8
1
1.35
1
430
1
306
1
30.6
4
150
3
0.8
55
Mag
gia
near
-nat
ural
Som
eo
150.
6
Sout
hern
par
t of
Sw
iss A
lps
4.31
2
0.85
2
650
1
299 1
6.84
2
1202
0.99
not a
vaila
ble
Thu
r
Riv
er
wid
enin
g
Güt
igha
usen
4.53
Swis
s Pla
teau
481
3.35
1
1130
1
5611
474
3164
0.15
40
Hin
terr
hein
n
ear-
natu
ral
Rhä
züns
71.5
Swis
s Pla
teau
391
5.88
1
6701
3691
544
3844
0.56
60
Rho
ne
Rive
r wid
enin
g
Chip
pis
2.96
Sout
hern
par
t of
Sw
iss A
lps
106
1
21.4
1
830
1
462 1
162 4
332
4
0.4
50-1
00
3 Ow
n ca
lcul
atio
ns b
ased
on
data
from
the
Swis
s Fed
eral
Off
ice
for W
ater
and
Geo
logy
(199
2-20
01)
4 Ow
n ca
lcul
atio
ns b
ased
on
data
from
the
Swis
s Fed
eral
Off
ice
for W
ater
and
Geo
logy
(199
1-20
00)
Rho
ne
near
-nat
ural
Pfyn
wal
d
103
Sout
hern
par
t of
Sw
iss A
lps
106
1
21.4
1
830
1
462 1
162 4
332
4
0.4
50-1
00
Uni
t
- - ha
- m3/
s
m3/
s
m3/
s
m3/
s
m3/
s
m3/
s
%
mm
Des
crip
tion
Man
agem
ent
Biog
eogr
aphi
c re
gion
M
ean
year
ly d
isch
arge
du
ring
a 10
yea
r per
iod
Low
est m
ean
daily
di
scha
rge
durin
g a
10
year
per
iod
Max
imum
mea
n da
ily
disc
harg
e du
ring
a 10
ye
ar p
erio
d D
isch
arge
of b
ienn
ial
flood
A
vera
ge m
ean
disc
harg
e du
ring
vege
tatio
n pe
riod
(Apr
.- O
ct.)
for a
10
year
per
iod.
Ave
rage
max
imum
di
scha
rge
durin
g ve
geta
tion
perio
d fo
r a
10 y
ear p
erio
d.
slop
e
Mea
n di
amet
er o
f be
dloa
d
Tabl
e 3.
Cha
ract
eris
tics o
f the
stud
y si
tes
Cri
teri
a G
eogr
aphy
Riv
er ty
pe
Loc
ality
Are
a
Bio
geo
Hyd
rolo
gy
Qm
_10
Qm
in_1
0
Qm
ax_1
0
HQ
2
Qm
_veg
_10
Qm
ax_v
eg_1
0
Geo
mor
phol
ogy
J dm
1 Swis
s Fede
ral O
ffic
e fo
r Wat
er a
nd G
eolo
gy (1
991-
2000
)
2 Rip
aria
n Zo
nes I
nfor
mat
ion
Cen
ter,
Yve
rdon
(198
6-19
95)
Paper II 59
Methods
Data sampling
Digital habitat maps were obtained by analyzing orthophotos and ground-based surveys
with a differential GPS (Leica GS50, DRS reference signal). These maps were used for
landscape metrics calculations and as a basis for the stratified random placement of
sample points for vegetation mapping.
The vegetation survey was carried out in 2002 from May to September. At each sample
point a 5m x 5m quadrate was set up to survey alluvial pioneer vegetation at the river-
widenings and at the near-natural stretches. All vascular plants present were recorded
and their abundance estimated, following Braun-Blanquet (1964) and the nomenclature
of Lauber and Wagner (1996). Additionally, for the restored sites all plants growing
outside the plots were recorded to compile a complete species list for each restoration
project.
We also investigated the plant composition of the dominant habitat types at the
regulated reference sites and the surroundings of the river widening. The investigated
habitat types were river-banks and embankments upstream of the river widening, nearby
forest, forest edges and arable grassland.
Data analysis
Analysis of habitat maps
River restoration can be defined as returning the river system to its condition prior to
degradation (Lewis 1990). We hypothesized that the degree of naturalness achieved by
an individual restoration project varies according to the different biological organization
levels, namely habitat and species level.
To assess the degree of naturalness achieved at the habitat level we analysed digital
habitat maps. We applied landscape metrics calculation to quantify landscape
configuration and composition since the presence of a diverse array of riparian
landscape elements (= habitat types) is a pre-requisite for species colonization. Table 4
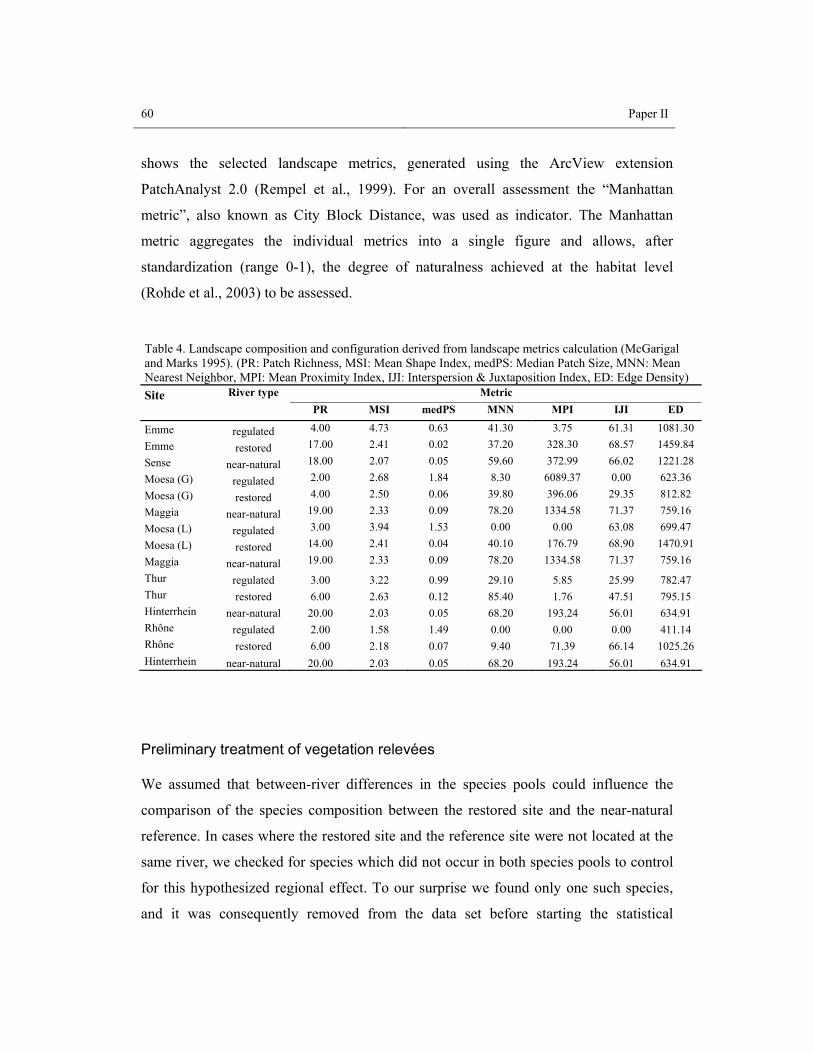
60 Paper II
shows the selected landscape metrics, generated using the ArcView extension
PatchAnalyst 2.0 (Rempel et al., 1999). For an overall assessment the “Manhattan
metric”, also known as City Block Distance, was used as indicator. The Manhattan
metric aggregates the individual metrics into a single figure and allows, after
standardization (range 0-1), the degree of naturalness achieved at the habitat level
(Rohde et al., 2003) to be assessed.
Table 4. Landscape composition and configuration derived from landscape metrics calculation (McGarigal and Marks 1995). (PR: Patch Richness, MSI: Mean Shape Index, medPS: Median Patch Size, MNN: Mean Nearest Neighbor, MPI: Mean Proximity Index, IJI: Interspersion & Juxtaposition Index, ED: Edge Density) Site River type Metric
PR MSI medPS MNN MPI IJI ED
Emme regulated 4.00 4.73 0.63 41.30 3.75 61.31 1081.30 Emme restored 17.00 2.41 0.02 37.20 328.30 68.57 1459.84 Sense near-natural 18.00 2.07 0.05 59.60 372.99 66.02 1221.28 Moesa (G) regulated 2.00 2.68 1.84 8.30 6089.37 0.00 623.36 Moesa (G) restored 4.00 2.50 0.06 39.80 396.06 29.35 812.82 Maggia near-natural 19.00 2.33 0.09 78.20 1334.58 71.37 759.16 Moesa (L) regulated 3.00 3.94 1.53 0.00 0.00 63.08 699.47 Moesa (L) restored 14.00 2.41 0.04 40.10 176.79 68.90 1470.91 Maggia near-natural 19.00 2.33 0.09 78.20 1334.58 71.37 759.16 Thur regulated 3.00 3.22 0.99 29.10 5.85 25.99 782.47 Thur restored 6.00 2.63 0.12 85.40 1.76 47.51 795.15 Hinterrhein near-natural 20.00 2.03 0.05 68.20 193.24 56.01 634.91 Rhône regulated 2.00 1.58 1.49 0.00 0.00 0.00 411.14 Rhône restored 6.00 2.18 0.07 9.40 71.39 66.14 1025.26 Hinterrhein near-natural 20.00 2.03 0.05 68.20 193.24 56.01 634.91
Preliminary treatment of vegetation relevées
We assumed that between-river differences in the species pools could influence the
comparison of the species composition between the restored site and the near-natural
reference. In cases where the restored site and the reference site were not located at the
same river, we checked for species which did not occur in both species pools to control
for this hypothesized regional effect. To our surprise we found only one such species,
and it was consequently removed from the data set before starting the statistical
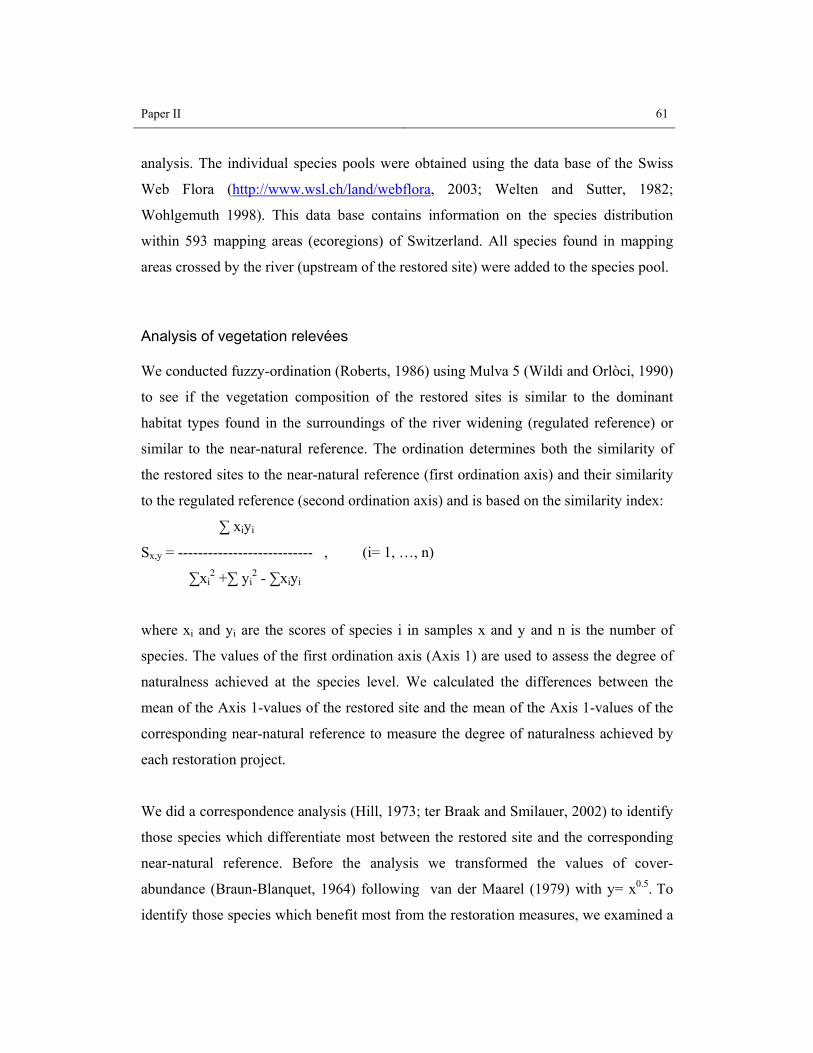
Paper II 61
analysis. The individual species pools were obtained using the data base of the Swiss
Web Flora (http://www.wsl.ch/land/webflora, 2003; Welten and Sutter, 1982;
Wohlgemuth 1998). This data base contains information on the species distribution
within 593 mapping areas (ecoregions) of Switzerland. All species found in mapping
areas crossed by the river (upstream of the restored site) were added to the species pool.
Analysis of vegetation relevées
We conducted fuzzy-ordination (Roberts, 1986) using Mulva 5 (Wildi and Orlòci, 1990)
to see if the vegetation composition of the restored sites is similar to the dominant
habitat types found in the surroundings of the river widening (regulated reference) or
similar to the near-natural reference. The ordination determines both the similarity of
the restored sites to the near-natural reference (first ordination axis) and their similarity
to the regulated reference (second ordination axis) and is based on the similarity index:
∑ xiyi
Sx,y = --------------------------- , (i= 1, …, n)
∑xi2 +∑ yi
2 - ∑xiyi
where xi and yi are the scores of species i in samples x and y and n is the number of
species. The values of the first ordination axis (Axis 1) are used to assess the degree of
naturalness achieved at the species level. We calculated the differences between the
mean of the Axis 1-values of the restored site and the mean of the Axis 1-values of the
corresponding near-natural reference to measure the degree of naturalness achieved by
each restoration project.
We did a correspondence analysis (Hill, 1973; ter Braak and Smilauer, 2002) to identify
those species which differentiate most between the restored site and the corresponding
near-natural reference. Before the analysis we transformed the values of cover-
abundance (Braun-Blanquet, 1964) following van der Maarel (1979) with y= x0.5. To
identify those species which benefit most from the restoration measures, we examined a
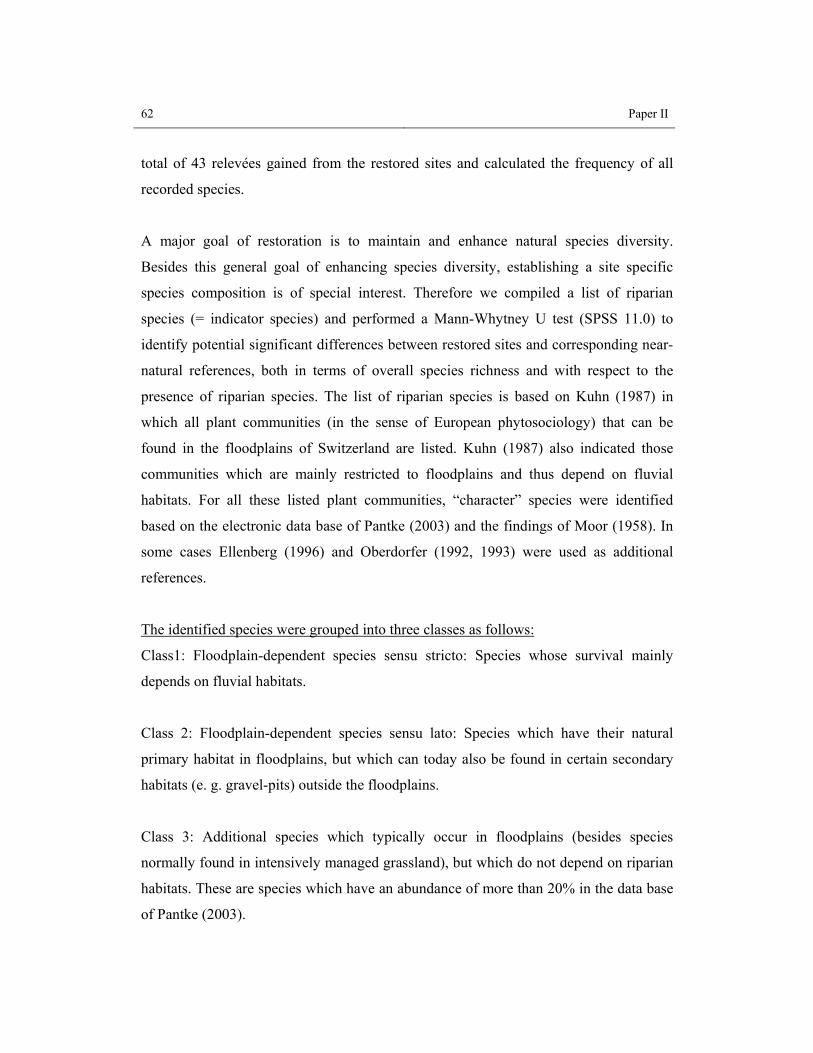
62 Paper II
total of 43 relevées gained from the restored sites and calculated the frequency of all
recorded species.
A major goal of restoration is to maintain and enhance natural species diversity.
Besides this general goal of enhancing species diversity, establishing a site specific
species composition is of special interest. Therefore we compiled a list of riparian
species (= indicator species) and performed a Mann-Whytney U test (SPSS 11.0) to
identify potential significant differences between restored sites and corresponding near-
natural references, both in terms of overall species richness and with respect to the
presence of riparian species. The list of riparian species is based on Kuhn (1987) in
which all plant communities (in the sense of European phytosociology) that can be
found in the floodplains of Switzerland are listed. Kuhn (1987) also indicated those
communities which are mainly restricted to floodplains and thus depend on fluvial
habitats. For all these listed plant communities, “character” species were identified
based on the electronic data base of Pantke (2003) and the findings of Moor (1958). In
some cases Ellenberg (1996) and Oberdorfer (1992, 1993) were used as additional
references.
The identified species were grouped into three classes as follows:
Class1: Floodplain-dependent species sensu stricto: Species whose survival mainly
depends on fluvial habitats.
Class 2: Floodplain-dependent species sensu lato: Species which have their natural
primary habitat in floodplains, but which can today also be found in certain secondary
habitats (e. g. gravel-pits) outside the floodplains.
Class 3: Additional species which typically occur in floodplains (besides species
normally found in intensively managed grassland), but which do not depend on riparian
habitats. These are species which have an abundance of more than 20% in the data base
of Pantke (2003).
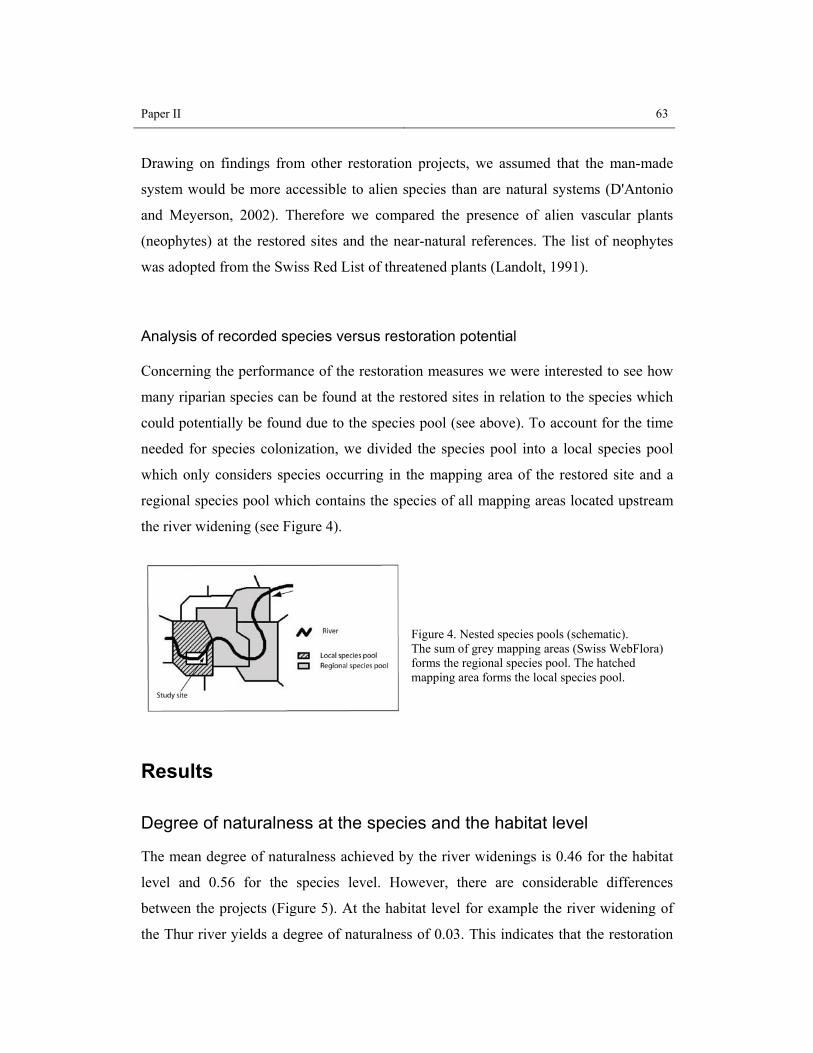
Paper II 63
Drawing on findings from other restoration projects, we assumed that the man-made
system would be more accessible to alien species than are natural systems (D'Antonio
and Meyerson, 2002). Therefore we compared the presence of alien vascular plants
(neophytes) at the restored sites and the near-natural references. The list of neophytes
was adopted from the Swiss Red List of threatened plants (Landolt, 1991).
Analysis of recorded species versus restoration potential
Concerning the performance of the restoration measures we were interested to see how
many riparian species can be found at the restored sites in relation to the species which
could potentially be found due to the species pool (see above). To account for the time
needed for species colonization, we divided the species pool into a local species pool
which only considers species occurring in the mapping area of the restored site and a
regional species pool which contains the species of all mapping areas located upstream
the river widening (see Figure 4).
Figure 4. Nested species pools (schematic). The sum of grey mapping areas (Swiss WebFlora) forms the regional species pool. The hatched mapping area forms the local species pool.
Results
Degree of naturalness at the species and the habitat level
The mean degree of naturalness achieved by the river widenings is 0.46 for the habitat
level and 0.56 for the species level. However, there are considerable differences
between the projects (Figure 5). At the habitat level for example the river widening of
the Thur river yields a degree of naturalness of 0.03. This indicates that the restoration
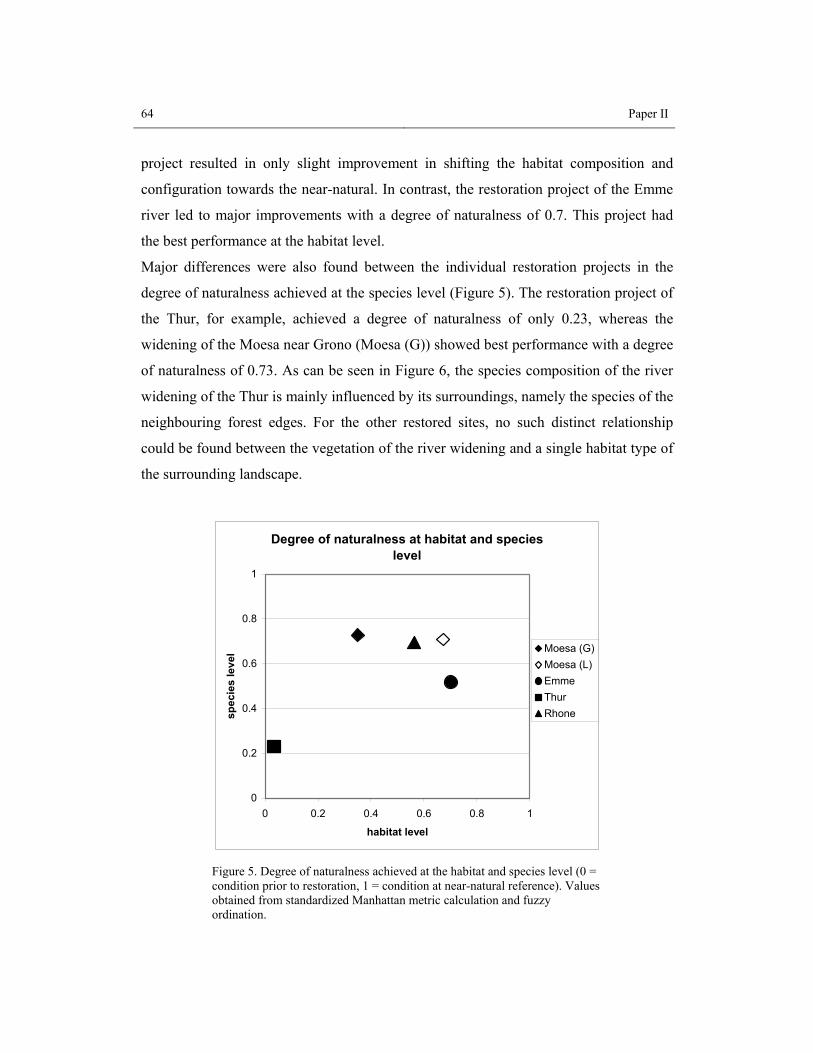
64 Paper II
project resulted in only slight improvement in shifting the habitat composition and
configuration towards the near-natural. In contrast, the restoration project of the Emme
river led to major improvements with a degree of naturalness of 0.7. This project had
the best performance at the habitat level.
Major differences were also found between the individual restoration projects in the
degree of naturalness achieved at the species level (Figure 5). The restoration project of
the Thur, for example, achieved a degree of naturalness of only 0.23, whereas the
widening of the Moesa near Grono (Moesa (G)) showed best performance with a degree
of naturalness of 0.73. As can be seen in Figure 6, the species composition of the river
widening of the Thur is mainly influenced by its surroundings, namely the species of the
neighbouring forest edges. For the other restored sites, no such distinct relationship
could be found between the vegetation of the river widening and a single habitat type of
the surrounding landscape.
Degree of naturalness at habitat and species level
0
0.2
0.4
0.6
0.8
1
0 0.2 0.4 0.6 0.8 1
habitat level
spec
ies
leve
l Moesa (G)Moesa (L)EmmeThurRhone
Figure 5. Degree of naturalness achieved at the habitat and species level (0 = condition prior to restoration, 1 = condition at near-natural reference). Values obtained from standardized Manhattan metric calculation and fuzzy ordination.
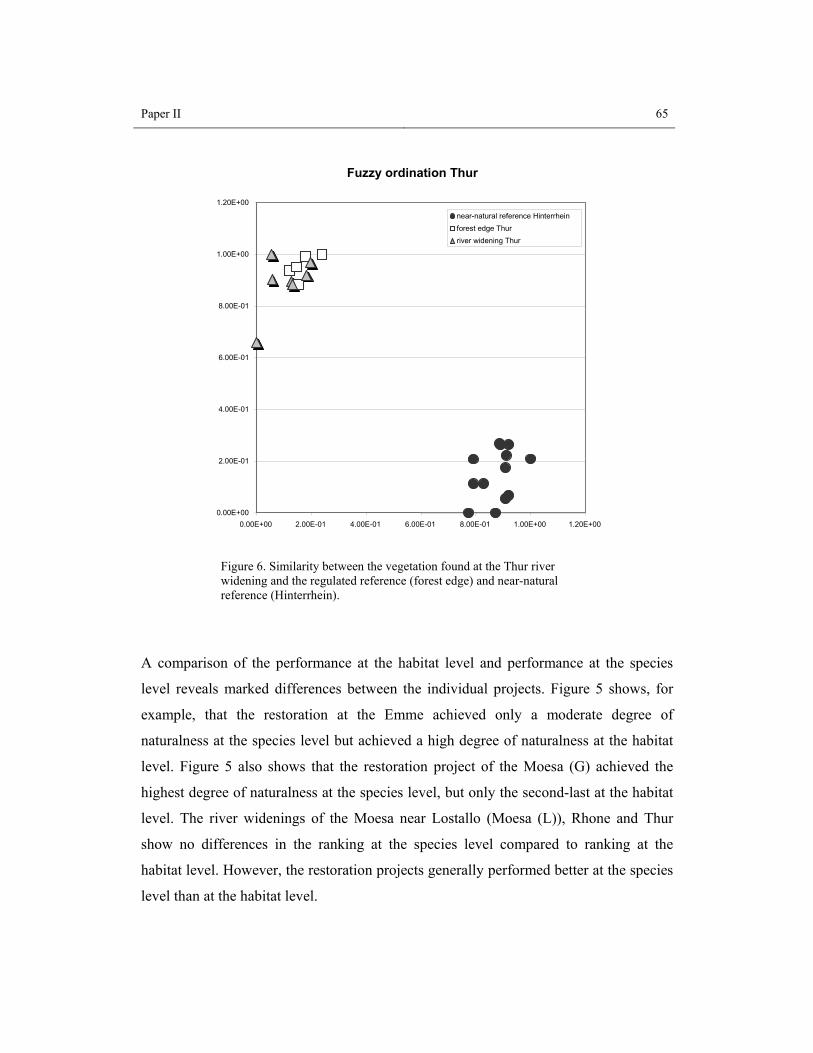
Paper II 65
Figure 6. Similarity between the vegetation found at the Thur river widening and the regulated reference (forest edge) and near-natural reference (Hinterrhein).
A comparison of the performance at the habitat level and performance at the species
level reveals marked differences between the individual projects. Figure 5 shows, for
example, that the restoration at the Emme achieved only a moderate degree of
naturalness at the species level but achieved a high degree of naturalness at the habitat
level. Figure 5 also shows that the restoration project of the Moesa (G) achieved the
highest degree of naturalness at the species level, but only the second-last at the habitat
level. The river widenings of the Moesa near Lostallo (Moesa (L)), Rhone and Thur
show no differences in the ranking at the species level compared to ranking at the
habitat level. However, the restoration projects generally performed better at the species
level than at the habitat level.
Fuzzy ordination Thur
0.00E+00
2.00E-01
4.00E-01
6.00E-01
8.00E-01
1.00E+00
1.20E+00
0.00E+00 2.00E-01 4.00E-01 6.00E-01 8.00E-01 1.00E+00 1.20E+00
near-natural reference Hinterrhein forest edge Thurriver widening Thur
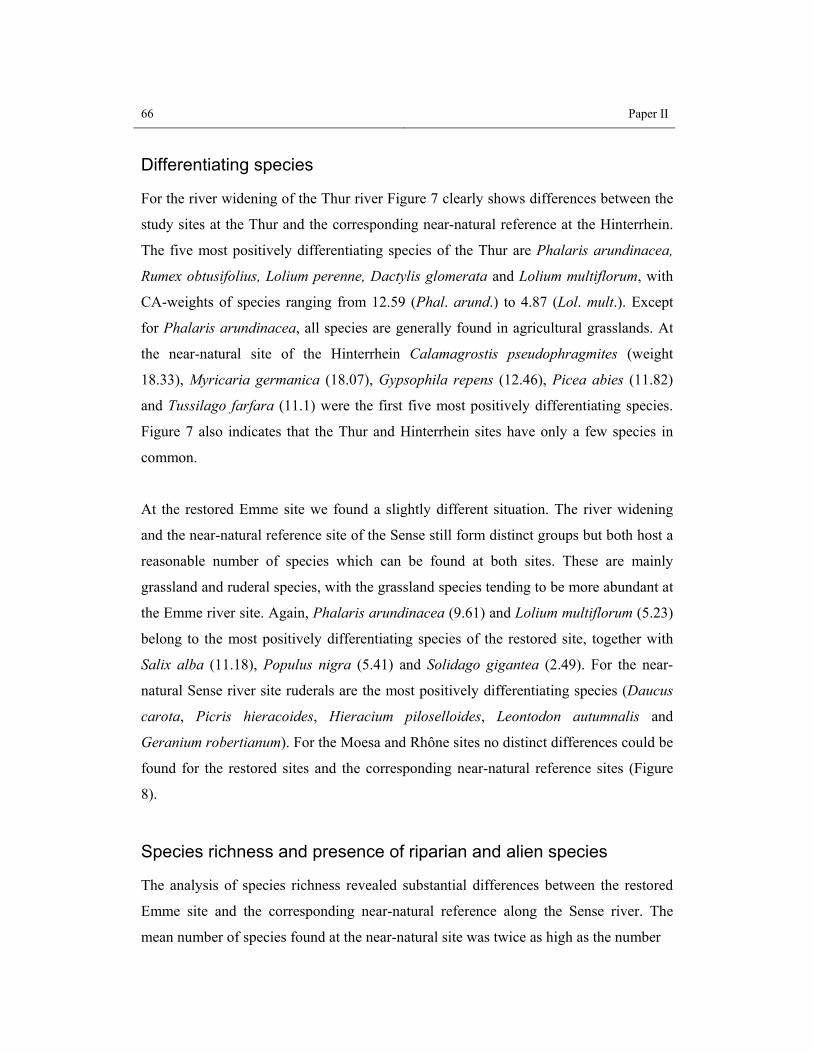
66 Paper II
Differentiating species
For the river widening of the Thur river Figure 7 clearly shows differences between the
study sites at the Thur and the corresponding near-natural reference at the Hinterrhein.
The five most positively differentiating species of the Thur are Phalaris arundinacea,
Rumex obtusifolius, Lolium perenne, Dactylis glomerata and Lolium multiflorum, with
CA-weights of species ranging from 12.59 (Phal. arund.) to 4.87 (Lol. mult.). Except
for Phalaris arundinacea, all species are generally found in agricultural grasslands. At
the near-natural site of the Hinterrhein Calamagrostis pseudophragmites (weight
18.33), Myricaria germanica (18.07), Gypsophila repens (12.46), Picea abies (11.82)
and Tussilago farfara (11.1) were the first five most positively differentiating species.
Figure 7 also indicates that the Thur and Hinterrhein sites have only a few species in
common.
At the restored Emme site we found a slightly different situation. The river widening
and the near-natural reference site of the Sense still form distinct groups but both host a
reasonable number of species which can be found at both sites. These are mainly
grassland and ruderal species, with the grassland species tending to be more abundant at
the Emme river site. Again, Phalaris arundinacea (9.61) and Lolium multiflorum (5.23)
belong to the most positively differentiating species of the restored site, together with
Salix alba (11.18), Populus nigra (5.41) and Solidago gigantea (2.49). For the near-
natural Sense river site ruderals are the most positively differentiating species (Daucus
carota, Picris hieracoides, Hieracium piloselloides, Leontodon autumnalis and
Geranium robertianum). For the Moesa and Rhône sites no distinct differences could be
found for the restored sites and the corresponding near-natural reference sites (Figure
8).
Species richness and presence of riparian and alien species
The analysis of species richness revealed substantial differences between the restored
Emme site and the corresponding near-natural reference along the Sense river. The
mean number of species found at the near-natural site was twice as high as the number
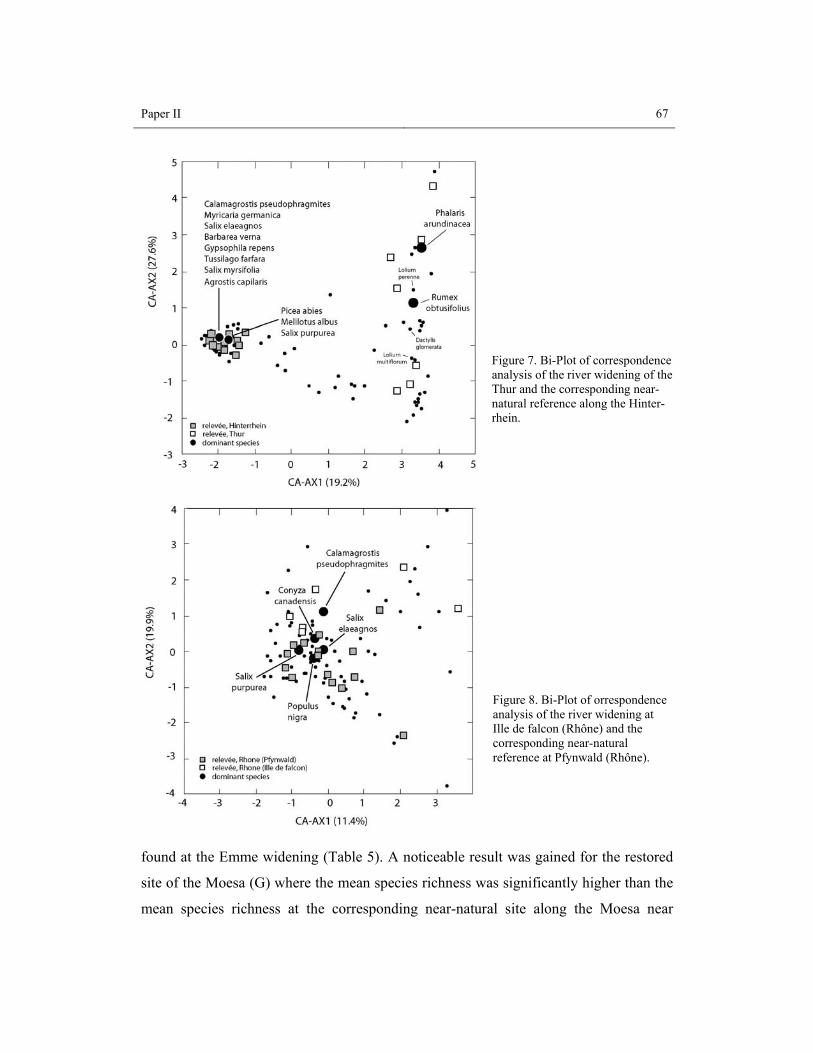
Paper II 67
Figure 7. Bi-Plot of correspondence analysis of the river widening of the Thur and the corresponding near-natural reference along the Hinter-rhein.
Figure 8. Bi-Plot of orrespondence analysis of the river widening at Ille de falcon (Rhône) and the corresponding near-natural reference at Pfynwald (Rhône).
found at the Emme widening (Table 5). A noticeable result was gained for the restored
site of the Moesa (G) where the mean species richness was significantly higher than the
mean species richness at the corresponding near-natural site along the Moesa near
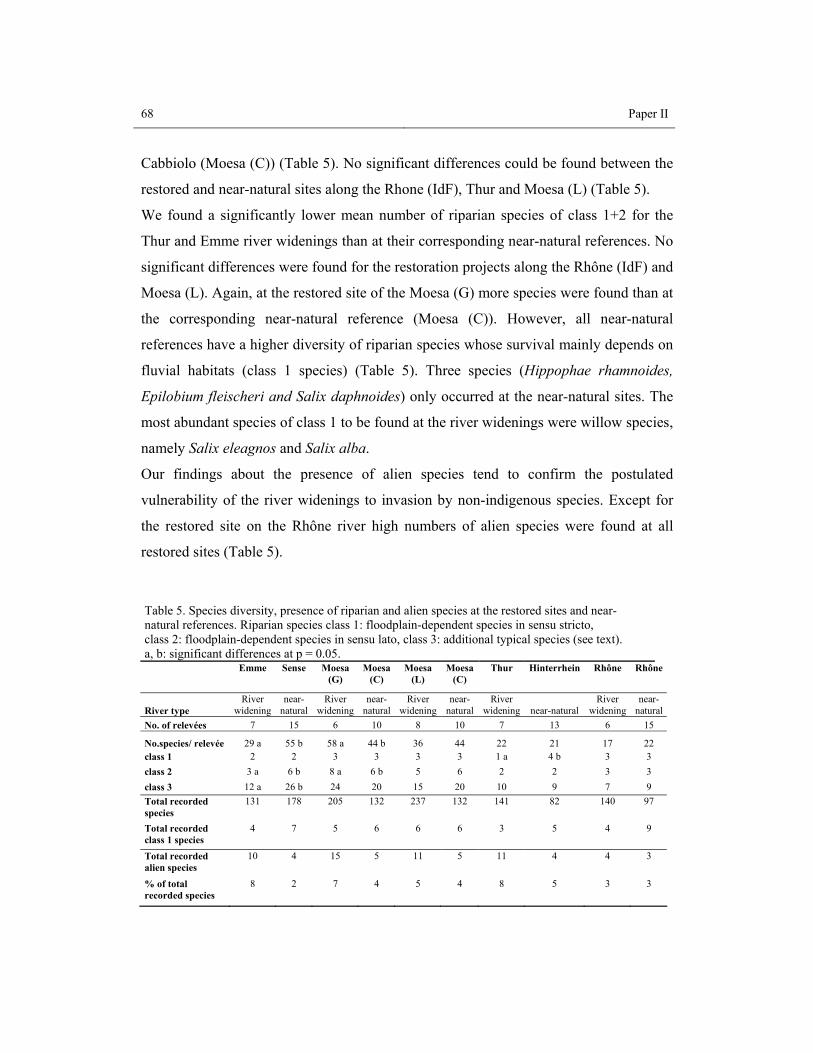
68 Paper II
Cabbiolo (Moesa (C)) (Table 5). No significant differences could be found between the
restored and near-natural sites along the Rhone (IdF), Thur and Moesa (L) (Table 5).
We found a significantly lower mean number of riparian species of class 1+2 for the
Thur and Emme river widenings than at their corresponding near-natural references. No
significant differences were found for the restoration projects along the Rhône (IdF) and
Moesa (L). Again, at the restored site of the Moesa (G) more species were found than at
the corresponding near-natural reference (Moesa (C)). However, all near-natural
references have a higher diversity of riparian species whose survival mainly depends on
fluvial habitats (class 1 species) (Table 5). Three species (Hippophae rhamnoides,
Epilobium fleischeri and Salix daphnoides) only occurred at the near-natural sites. The
most abundant species of class 1 to be found at the river widenings were willow species,
namely Salix eleagnos and Salix alba.
Our findings about the presence of alien species tend to confirm the postulated
vulnerability of the river widenings to invasion by non-indigenous species. Except for
the restored site on the Rhône river high numbers of alien species were found at all
restored sites (Table 5).
Table 5. Species diversity, presence of riparian and alien species at the restored sites and near-natural references. Riparian species class 1: floodplain-dependent species in sensu stricto, class 2: floodplain-dependent species in sensu lato, class 3: additional typical species (see text). a, b: significant differences at p = 0.05.
Emme Sense Moesa (G)
Moesa (C)
Moesa (L)
Moesa (C)
Thur Hinterrhein Rhône Rhône
River type River
widening near-
natural River
wideningnear-
naturalRiver
wideningnear-
naturalRiver
widening near-natural River
widening near-
naturalNo. of relevées 7 15 6 10 8 10 7 13 6 15
No.species/ relevée 29 a 55 b 58 a 44 b 36 44 22 21 17 22 class 1 2 2 3 3 3 3 1 a 4 b 3 3 class 2 3 a 6 b 8 a 6 b 5 6 2 2 3 3 class 3 12 a 26 b 24 20 15 20 10 9 7 9 Total recorded species
131 178 205 132 237 132 141 82 140 97
Total recorded class 1 species
4 7 5 6 6 6 3 5 4 9
Total recorded alien species
10 4 15 5 11 5 11 4 4 3
% of total recorded species
8 2 7 4 5 4 8 5 3 3
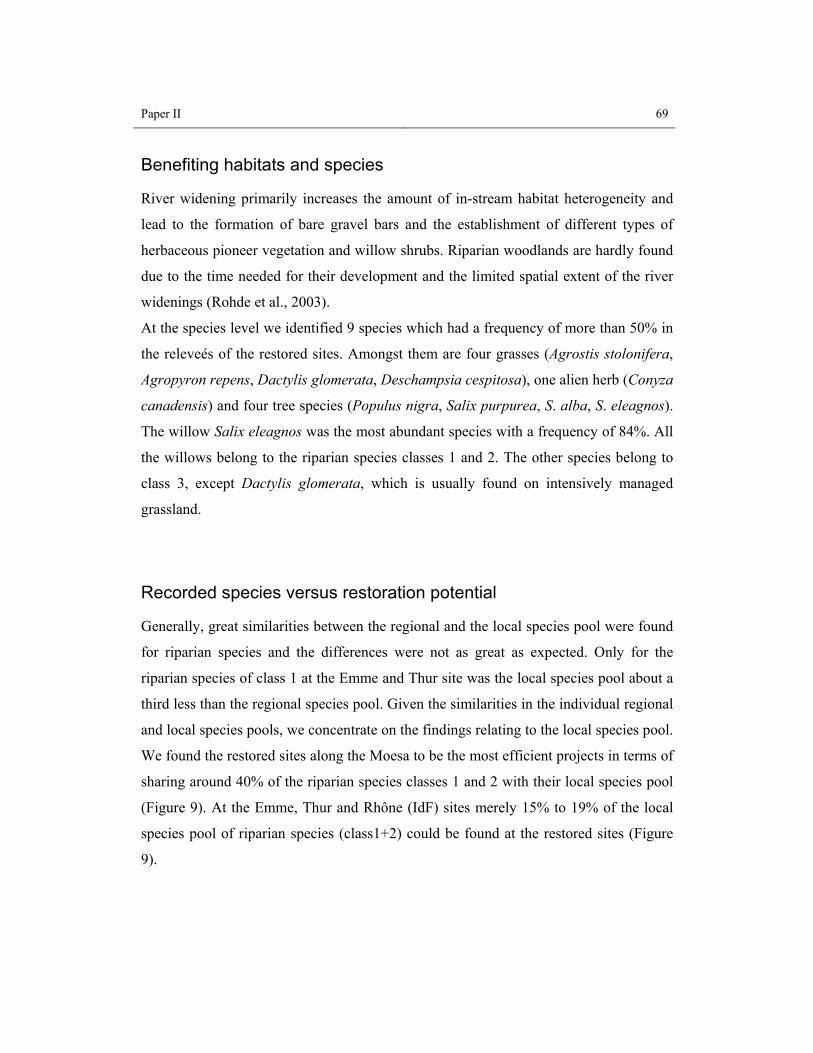
Paper II 69
Benefiting habitats and species
River widening primarily increases the amount of in-stream habitat heterogeneity and
lead to the formation of bare gravel bars and the establishment of different types of
herbaceous pioneer vegetation and willow shrubs. Riparian woodlands are hardly found
due to the time needed for their development and the limited spatial extent of the river
widenings (Rohde et al., 2003).
At the species level we identified 9 species which had a frequency of more than 50% in
the releveés of the restored sites. Amongst them are four grasses (Agrostis stolonifera,
Agropyron repens, Dactylis glomerata, Deschampsia cespitosa), one alien herb (Conyza
canadensis) and four tree species (Populus nigra, Salix purpurea, S. alba, S. eleagnos).
The willow Salix eleagnos was the most abundant species with a frequency of 84%. All
the willows belong to the riparian species classes 1 and 2. The other species belong to
class 3, except Dactylis glomerata, which is usually found on intensively managed
grassland.
Recorded species versus restoration potential
Generally, great similarities between the regional and the local species pool were found
for riparian species and the differences were not as great as expected. Only for the
riparian species of class 1 at the Emme and Thur site was the local species pool about a
third less than the regional species pool. Given the similarities in the individual regional
and local species pools, we concentrate on the findings relating to the local species pool.
We found the restored sites along the Moesa to be the most efficient projects in terms of
sharing around 40% of the riparian species classes 1 and 2 with their local species pool
(Figure 9). At the Emme, Thur and Rhône (IdF) sites merely 15% to 19% of the local
species pool of riparian species (class1+2) could be found at the restored sites (Figure
9).
70 Paper II
0
10
20
30
40
50
60
70
Emme Moesa (G) Moesa (L) Rhône (IdF) Thur
num
ber o
f rec
orde
d rip
aria
n sp
ecie
s cl
ass
1+2
River widening Local species pool
Figure 9. Recorded riparian species (class 1+2) at the river widenings in relation to the corresponding local species pool. Class 1: riparian species sensu stricto, class 2: riparian species sensu lato (see text).
Discussion Restoration seeks to return an ecosystem to its condition prior to degradation. Looking
at the degree of naturalness brought about by the river widenings investigated, our data
show: (1) different performances at the species and habitat level, and (2) differences
between the individual restoration projects. The assessment of the restoration
performance is based on an ecological value system. However, we are well aware that
other value systems (recreation, aesthetics, etc.) need to be consulted for a global
evaluation of restoration measures.
Depending on the organizational level (species or habitat), the results for the restoration
projects along the Moesa (G) and the Emme river clearly show different degrees of
naturalness. At the Emme river site, restoration performs well at the habitat level and
provides the potential for the establishment of a desired biocoenosis. However, actual
Paper II 71
species colonization is hampered by a low ecological permeability of the regulated river
system leading to a rather poor performance at the species level. On the other hand,
results from the river widening of the Moesa (G) show that some single components of
the restored ecosystem may perform better than others. At the habitat level Moesa (G)
shows poor performance with low habitat diversity. But the established gravel bars
provide suitable site attributes for the establishment of riparian plants and thus the
restoration project performs well at the species level.
Besides finding differences in performance at the habitat and species levels we also
found differences in the degree of naturalness achieved by the individual restoration
projects. One could argue that this is due to two major driving forces that influence
species colonization, namely (i) the age of the restored site and (ii) distance away from
species pools. Concerning the age of the restored site we have no indication that this is
the main restricting factor since the oldest restoration project (Thur, 10 years old)
showed the worst and the five-year old river widening of the Moesa (L) showed the best
overall performance. At the species level the age of a restored site does not a priori limit
the development of pioneer vegetation as these vegetation types naturally exhibit a high
turnover due to the fluvial disturbance regime. Thus the establishing alluvial vegetation
is always at the young seral stage. However, we believe that time needs to be considered
in association with the distance from the species pools and the ecological permeability
of the environment. The more distant the species pools and the greater the impediments
to species movement, the more time needed for species arrival and colonization.
Concerning the distance of the restored sites from potential species pools, we have
indications that the location of the river widenings is of major importance (see Tabacchi
et al., 1996). The restoration projects with the best performance at the species level were
the river widenings along the Rhone and the Moesa which have near-natural stretches
less than 10 km away upstream. These near-natural stretches provide a viable species
pool with their propagules floating down the river to colonize the newly created habitats
of the river widenings. In contrast, the species compositions of the isolated river
widenings along the Emme and Thur river with no near-natural stretches upstream are
72 Paper II
mainly influenced by the intensively managed surroundings with only few riparian
species of class 1+2 (see Tabacchi et al., 1996). Among the latter willows are the most
abundant and most frequent species. The establishment of these species can be linked to
the bank protection upstream, where willows are used to prevent bank erosion.
Regarding the species which finally became established at the river widenings, it seems
that river-widenings are generally able to provide habitats for some riparian species but
mainly promote grassland species. This is due to the competitiveness of these species
and the dominance and proximity of agricultural land at all restored sites. Looking at the
colonization by alien species we found the restored sites are more accessible to these
species than the near-natural reaches. This poses a potential threat as alien species may
outcompete native vegetation and thus interfere with the restoration goal (Chornesky
and Randall, 2003; Pysek and Prach, 1995). At the river widening of Moesa (L), for
example, Buddleija davidii reached a cover up to 25%. However, this site was the only
one where an alien species became dominant.
The fact that the near-natural references generally show a higher richness in riparian
species of class 1 than the river widenings is probably due to three factors: the time
needed for the species to arrive, the high degree of specialisation of these species and
the small extent of the sites under investigation. The near-natural references are larger in
area than the small-scale river widenings and thus have: i) more habitat diversity and
thus more habitat available for colonization by stenotopic species, ii) more habitat and
thus less competition for colonisation and iii) a higher probability of species surviving
(high) floods. The relationship between the vulnerability of riparian vegetation to
catastrophic flooding and the abundance of riparian vegetation was shown by Hawkins
et al. (1997).
This study has investigated the potential of river widenings to re-establish riparian
habitat and vegetation. Since data collection took place only once, the study cannot
provide more than a “snap shot” of the ongoing processes. Long time series on the
Paper II 73
vegetation development are necessary for a comprehensive assessment to allow time for
species dispersal and the naturally high variability and turnover in species composition
due to hydrodynamic and geomorphic processes. However, evaluation three years after
restoration might yield initial indications of the restoration success (Urbanska, 1997).
Replicating the vegetation sampling could also help to answer the question whether the
hydrodynamic and geomorphic processes at the river widenings are sufficient to allow
for a diverse vegetation pattern of several successional stages. We think that in the long
term the willow saplings will establish extensive shrubs which will grow over the gravel
bars and thus outcompete the pioneer herbs and grasses due to suppressed
hydrodynamics by dams and hydroelectric power plants.
Conclusion The following conclusions can be drawn from this investigation of five restoration
projects, bearing in mind that there are some uncertainties due to the short observation
time:
a) River widenings provide the potential to restore some elements of riparian
ecosystems: They promote in-stream habitat heterogeneity and the establishment of bare
gravel bars as well as herbaceous pioneer vegetation and shrubs (Salix sp., Myricaria
germanica, etc.). However, the river widenings show generally better performance at
the species level than at the habitat level. Besides willows, grasses are the most
abundant species to be found in river widenings, namely: Agrostis stolonifera,
Agropyron repens, Dactylis glomerata and Deschampsia cespitosa. However, riparian
herbs, for example, Epilobium fleischeri are also found.
b) Restoration projects perform differently depending on the level of biological
organization: We emphasize the need for a hierarchical approach when assessing
restoration efforts (see also Noss, 1990; Pedroli et al., 2002). We suggest habitat level
and species level as appropriate organizational levels when assessing restoration efforts
74 Paper II
from a conservation point of view. However, further aspects need to be considered in a
more global evaluation (including e.g. aesthetics and recreational value).
c) The establishment of riparian vegetation following a restoration project depends on
the distance to near-natural reaches as the presence of a viable seed bank is an important
pre-requisite for the rehabilitation of (semi-) natural vegetation (Nienhuis et al., 2002).
Thus the closer a river widening is to a near-natural river stretch, the better its
performance. Generally, one should consider the regional setting and the landscape
context when planning river widenings or any other restoration measure (Hughes et al.,
2001).
d) River widenings are small-scale restoration measures which locally remove the
stresses of canalization. However, the success of such river restorations does not depend
solely on local action but also on decisions taken at the catchment scale which are
outside the scope of the restoration measure. The re-establishment of riparian habitats
and communities is often impaired by constraints located outside the actual restoration
projects, for example, bedload excavation or hampered species dispersal due to dams
(Andersson et al., 2000). Therefore catchment scale processes need to be considered and
additional regional management solutions are required to maximise the effects of local
management.
Acknowledgements We would like to thank M. Buergi for fruitful discussions and C. Nilsson and K.C.
Ewald for their valuable comments and suggestions on the manuscript. We are also very
grateful to S. Herbst and N.Guthapfel for field assistance and to T. Wohlgemuth for
access to the SwissWebflora and help with data analysis.
Paper II 75
Literature cited Bakker, J. P., Esselink, P., Dijkema, K. S., van Diun, W. E. and de Jonge, V. N. 2002. Restoration of salt
marshes in the Netherlands. Hydrobiologia 478: 29-51. Braun-Blanquet, J. 1932. Plant sociology. The study of plant communities. McGraw-Hill, New York,
London. Chornesky, E. A. and Randall, J. M. 2003. The threat of invasive alien species to biological diversity:
Setting a future course. Annals of the Missouri Botanical Garden 90: 67-76. D'Antonio, C. and Meyerson, L. A. 2002. Exotic Plant species as Problems and Solutions in Ecological
Restoration: A Synthesis. Restoration Ecology 10: 703-713. de Jonge, V. N. and de Jong, D. J. 2002. Ecological restoration in coastal areas in the Netherlands:
concepts, dilemmas and some examples. Hydrobiologia 478: 7-28. Downs, P. 2001: Geomorphological evaluation of river restoration schemes: principles, method,
monitoring, assessment, evaluation. Progress? Pages 243-249. in Nijland, H. J. and Cals, M. J. R. (eds.) River Restoration in Europe: practical approaches, Institute for Inland Water Management and Waste Water Treatment / RIZA, Lelystad.
Erskine, W. D. 1992. Channel response to large-scale river training works- Hunter River, Australia.
Regulated Rivers 7: 261-278. Landolt, E. 1991. Gefährdung der Farn- und Blütenpflanzen in der Schweiz. Bundesamt für Umwelt,
Wald und Landschaft, Bern. Lewis, R. R. 1990: Wetland restoration/creation/enhancement terminology: Suggestions for
standardizing. Pages 417-422 in Kusler, A. and Kentula, M. E. (eds.) Wetland creation and restoration: the status of the science, Island Press, Washington, DC.
Malanson, G. P. 1995. Riparian Landscapes. Cambridge University Press, Cambridge, 296 pp. Naiman, R. J., Décamps, H. and Pollock, M. 1993. The role of riparian corridors in maintaining regional
biodiversity. Ecological Applications 3: 209-212. Nienhuis, P. H., Bakker, J. P., P., G. A., Gulati, R. D. and de Jonge, V. N. 2002. The state of the art of
aquatic and semi-aquatic ecological restoration projects in the Netherlands. Hydrobiologia 478: 219-233.
Pedroli, B., de Blust, G., van Looy, K. and van Rooij, S. 2002. Setting targets in strategies for river
restoration. Landscape Ecology 17 (Suppl.1): 5-18. Peter, A. 2003. Personal communication. Petts, G. and Calow, P. 1996. River Restoration. Blackwell Science Ltd, Oxford, 231 pp. Pysek, P. and Prach, K. 1995. Invasion dynamics of Impatients glandulifera - A century of spreading
reconstructed. Biological Conservation 74: 41-48.

76 Paper II
Rempel, R. S., Carr, A. and Elkie, P. 1999. Patch analyst and patch analyst (grid) function reference.
Centre for Northern Forest Ecosystem Research, Ontario Ministry of Natural Resources, Lakehead University.
Roberts, D. W. 1986. Ordination on the basis of fuzzy set theory. Vegetatio 66: 123-131. Rohde, S., Kienast, F. and Bürgi, M. 2003. A habitat-based method for rapid assessment of river
restoration. Environmental Management. In review. ter Braak, C. J. F. and Smilauer, P. 2002. CANOCO Reference manual and CanoDraw for Windows
user's guide. Software for Canonical Community Ordination (version 4.5). Biometris, Wageningen and Ceské Budejovice.
Urbanska, K. M. 1997: Plant population ecology and restoration ecology. in Urbanska, K. M., Webb, N.
R. and Edwards, P. J. (eds.) Restoration Ecology and Suistainable development, Cambridge University Press.
Verdonschot, P. F. M. and Nijboer, R. C. 2002. Towards a decision support system for stream restoration
in the Netherlands: an overview of restoration projects and future needs. Hydrobiologia 478: 131-148.
Ward, J. V. 1998. Riverine landscapes: biodiversity patterns, disturbance regimes, and aquatic
conservation. Biological Conservation 83: 269-278. Ward, J. V., Tockner, K., Arscott, D. B. and Claret, C. 2002. Riverine landscape diversity. Freshwater
Biology 47: 517-539. Wildi, O. and Orlòci, L. 1990. Numerical exploration of community patterns. SPB Acad. Publ., The
Hague, 124 pp.
Paper III 77
Paper III
Room for rivers: an integrative search strategy for floodplain restoration
Submitted as:
S. Rohdea, M. Hostmannb, A. Peterc, K. C. Ewaldd: Room for rivers: an integrative
search strategy for floodplain restoration. Landscape and Urban Planning.
aSwiss Federal Institute for Forest, Snow and Landscape Research WSL/ETH, 8903 Birmensdorf, Switzerland bSwiss Federal Institute for Environmental Science and Technology EAWAG/ETH, 8600 Dübendorf, Switzerland cSwiss Federal Institute for Environmental Science and Technology EAWAG/ETH, 6047 Kastanienbaum, Switzerland dChair of Nature and Landscape Protection, Swiss Federal Institute of Technology (ETH), 8092 Zurich, Switzerland
Abstract River restoration aims to re-establish the ecological integrity of a river ecosystem and is
one of the answers to river deterioration. However, restoration measures are nowadays
mainly a reactive, site-by-site activity rather than based on strategic planning. This
study presents an integrated search strategy to identify river reaches where the
restoration of floodplains and their biocoenosis is less likely to be undermined by poor
environmental conditions and where the greatest benefits (judged according to
ecological and socio-economic criteria) are to be expected.
The search strategy helps management authorities in setting priorities and allocating
resources. It also helps to identify management deficiencies and data gaps. The search
strategy presented focuses on catchment-wide issues and is based particularly on
spatially explicit information. A hierarchical filter process combines the possibilities of
GIS with multiple criteria decision analysis (MCDA) to generate restoration suitability
maps. The filter process is based on a list of criteria and indicators that capture the
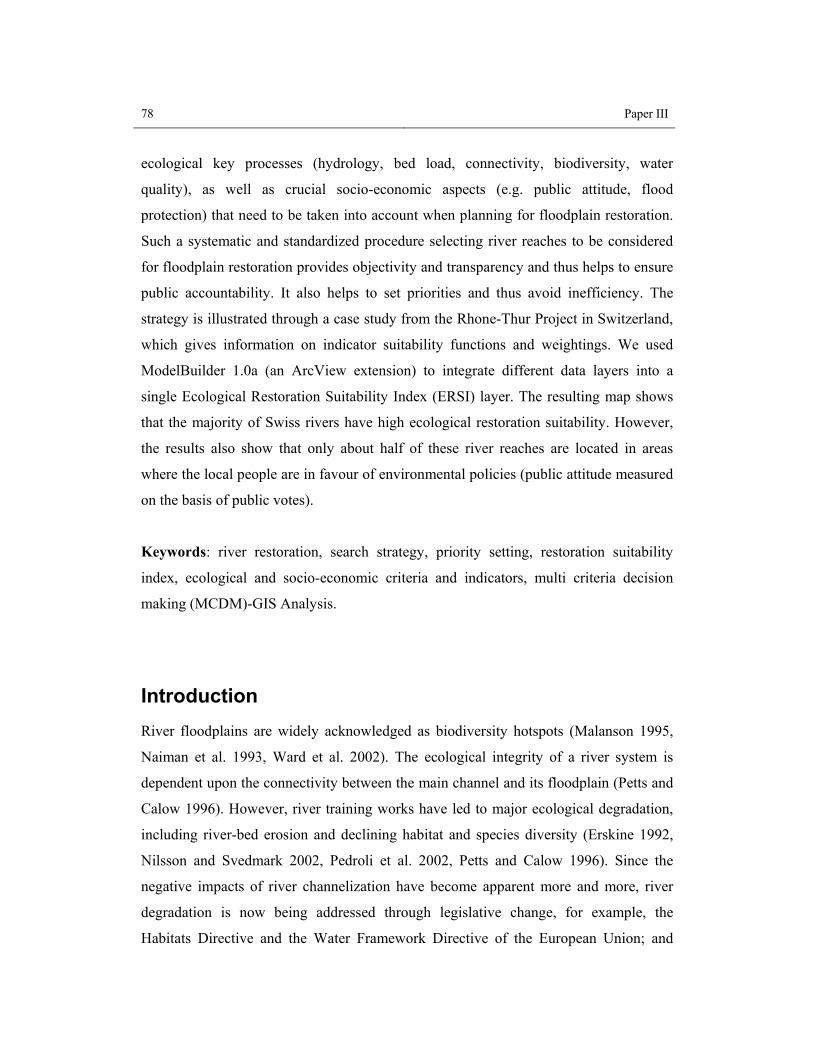
78 Paper III
ecological key processes (hydrology, bed load, connectivity, biodiversity, water
quality), as well as crucial socio-economic aspects (e.g. public attitude, flood
protection) that need to be taken into account when planning for floodplain restoration.
Such a systematic and standardized procedure selecting river reaches to be considered
for floodplain restoration provides objectivity and transparency and thus helps to ensure
public accountability. It also helps to set priorities and thus avoid inefficiency. The
strategy is illustrated through a case study from the Rhone-Thur Project in Switzerland,
which gives information on indicator suitability functions and weightings. We used
ModelBuilder 1.0a (an ArcView extension) to integrate different data layers into a
single Ecological Restoration Suitability Index (ERSI) layer. The resulting map shows
that the majority of Swiss rivers have high ecological restoration suitability. However,
the results also show that only about half of these river reaches are located in areas
where the local people are in favour of environmental policies (public attitude measured
on the basis of public votes).
Keywords: river restoration, search strategy, priority setting, restoration suitability
index, ecological and socio-economic criteria and indicators, multi criteria decision
making (MCDM)-GIS Analysis.
Introduction River floodplains are widely acknowledged as biodiversity hotspots (Malanson 1995,
Naiman et al. 1993, Ward et al. 2002). The ecological integrity of a river system is
dependent upon the connectivity between the main channel and its floodplain (Petts and
Calow 1996). However, river training works have led to major ecological degradation,
including river-bed erosion and declining habitat and species diversity (Erskine 1992,
Nilsson and Svedmark 2002, Pedroli et al. 2002, Petts and Calow 1996). Since the
negative impacts of river channelization have become apparent more and more, river
degradation is now being addressed through legislative change, for example, the
Habitats Directive and the Water Framework Directive of the European Union; and
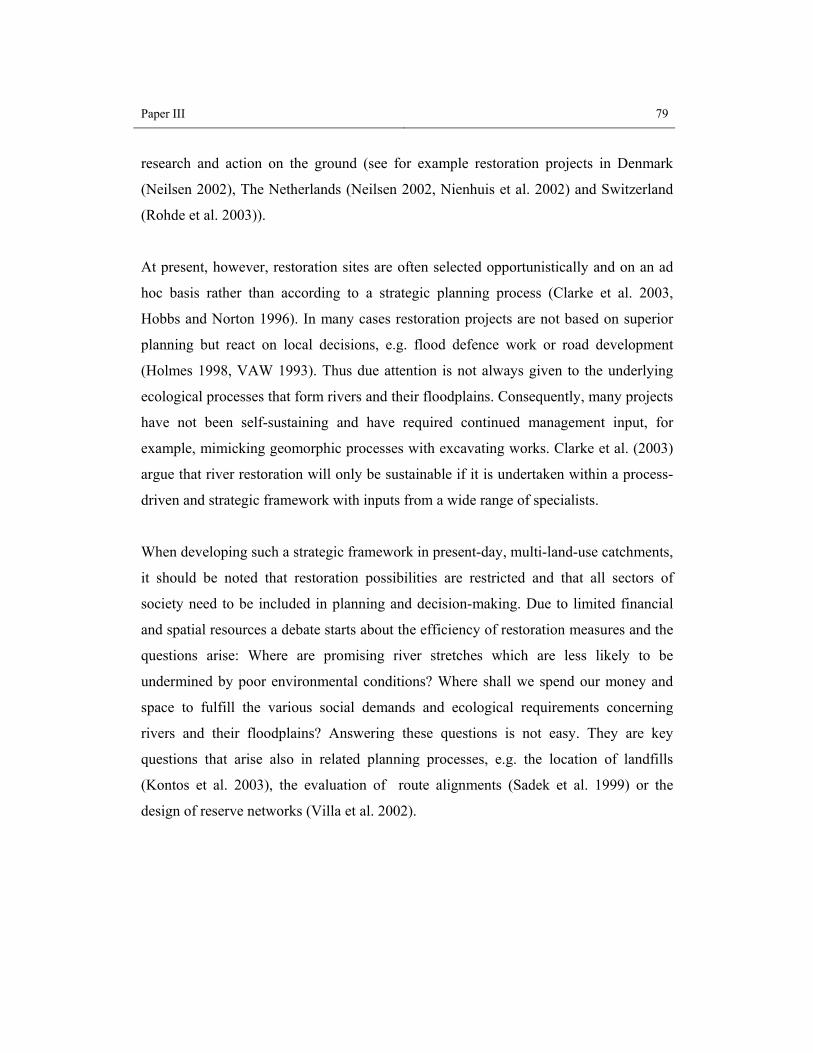
Paper III 79
research and action on the ground (see for example restoration projects in Denmark
(Neilsen 2002), The Netherlands (Neilsen 2002, Nienhuis et al. 2002) and Switzerland
(Rohde et al. 2003)).
At present, however, restoration sites are often selected opportunistically and on an ad
hoc basis rather than according to a strategic planning process (Clarke et al. 2003,
Hobbs and Norton 1996). In many cases restoration projects are not based on superior
planning but react on local decisions, e.g. flood defence work or road development
(Holmes 1998, VAW 1993). Thus due attention is not always given to the underlying
ecological processes that form rivers and their floodplains. Consequently, many projects
have not been self-sustaining and have required continued management input, for
example, mimicking geomorphic processes with excavating works. Clarke et al. (2003)
argue that river restoration will only be sustainable if it is undertaken within a process-
driven and strategic framework with inputs from a wide range of specialists.
When developing such a strategic framework in present-day, multi-land-use catchments,
it should be noted that restoration possibilities are restricted and that all sectors of
society need to be included in planning and decision-making. Due to limited financial
and spatial resources a debate starts about the efficiency of restoration measures and the
questions arise: Where are promising river stretches which are less likely to be
undermined by poor environmental conditions? Where shall we spend our money and
space to fulfill the various social demands and ecological requirements concerning
rivers and their floodplains? Answering these questions is not easy. They are key
questions that arise also in related planning processes, e.g. the location of landfills
(Kontos et al. 2003), the evaluation of route alignments (Sadek et al. 1999) or the
design of reserve networks (Villa et al. 2002).
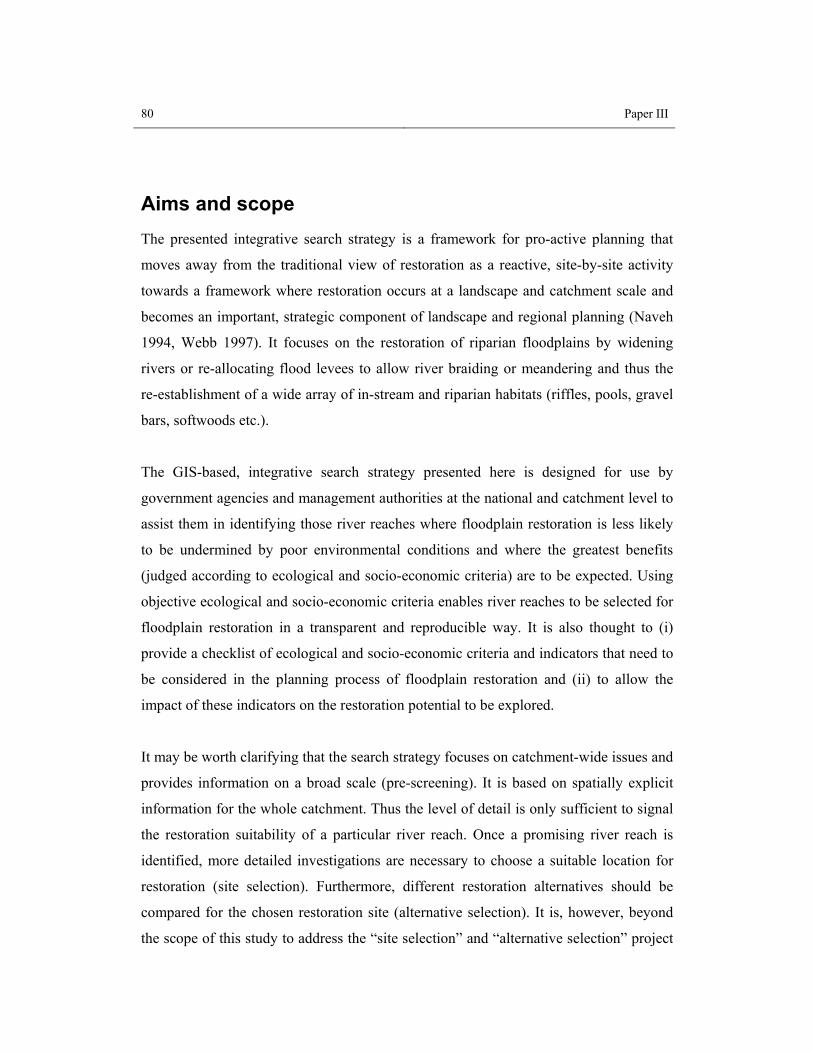
80 Paper III
Aims and scope The presented integrative search strategy is a framework for pro-active planning that
moves away from the traditional view of restoration as a reactive, site-by-site activity
towards a framework where restoration occurs at a landscape and catchment scale and
becomes an important, strategic component of landscape and regional planning (Naveh
1994, Webb 1997). It focuses on the restoration of riparian floodplains by widening
rivers or re-allocating flood levees to allow river braiding or meandering and thus the
re-establishment of a wide array of in-stream and riparian habitats (riffles, pools, gravel
bars, softwoods etc.).
The GIS-based, integrative search strategy presented here is designed for use by
government agencies and management authorities at the national and catchment level to
assist them in identifying those river reaches where floodplain restoration is less likely
to be undermined by poor environmental conditions and where the greatest benefits
(judged according to ecological and socio-economic criteria) are to be expected. Using
objective ecological and socio-economic criteria enables river reaches to be selected for
floodplain restoration in a transparent and reproducible way. It is also thought to (i)
provide a checklist of ecological and socio-economic criteria and indicators that need to
be considered in the planning process of floodplain restoration and (ii) to allow the
impact of these indicators on the restoration potential to be explored.
It may be worth clarifying that the search strategy focuses on catchment-wide issues and
provides information on a broad scale (pre-screening). It is based on spatially explicit
information for the whole catchment. Thus the level of detail is only sufficient to signal
the restoration suitability of a particular river reach. Once a promising river reach is
identified, more detailed investigations are necessary to choose a suitable location for
restoration (site selection). Furthermore, different restoration alternatives should be
compared for the chosen restoration site (alternative selection). It is, however, beyond
the scope of this study to address the “site selection” and “alternative selection” project
Paper III 81
phases, for a discussion of these phases and stakeholder involvement in the decision
process, refer to Hostmann et al. (2004).
The integrative search strategy
A hierarchical filter process
Figure 1 shows the general outline of the proposed search strategy and its
implementation in the planning process. Our search strategy focuses on floodplain
restoration and thus the improvement of the eco-morphological condition of a river by
means of river widening or flood levee re-allocation. Therefore, the starting point is an
analysis of the eco-morphological deficits (artificial bank and/or river-bed stabilization)
of the river system. River reaches in good eco-morphological condition are excluded in
this search strategy, and only those with a morphological deficit are included.
Restoration suitability is determined by constraints and factors which might restrict or
favour restoration efforts. The task of assessing restoration suitability is completed in a
hierarchical filter process (Filters 1-3) where the corresponding filters consist of several
criteria. Filter 1 determines river reaches which are not suitable for river restoration
based on limiting constraints. All river reaches not excluded by this filter are generally
suitable for river restoration. The second filter (Filter 2) evaluates the restoration
suitability according to specific ecological criteria (e.g. hydrology and biodiversity).
The overall restoration suitability of a stretch of river from an ecological point of view
is assessed using the Ecological Restoration Suitability Index (ERSI). The third filter
(Filter 3) takes into account socio-economic factors that can play an important role in
selecting a suitable river reach. Restoration experience has shown that socio-economic
aspects need to be considered in order to implement planning successfully. The result of
this search strategy is the identification of river reaches suitable for restoration
according to both ecological and socio-economic criteria. The three filters of the search
strategy are shown in Figure 1 and will be discussed in more detail in the following
sections.
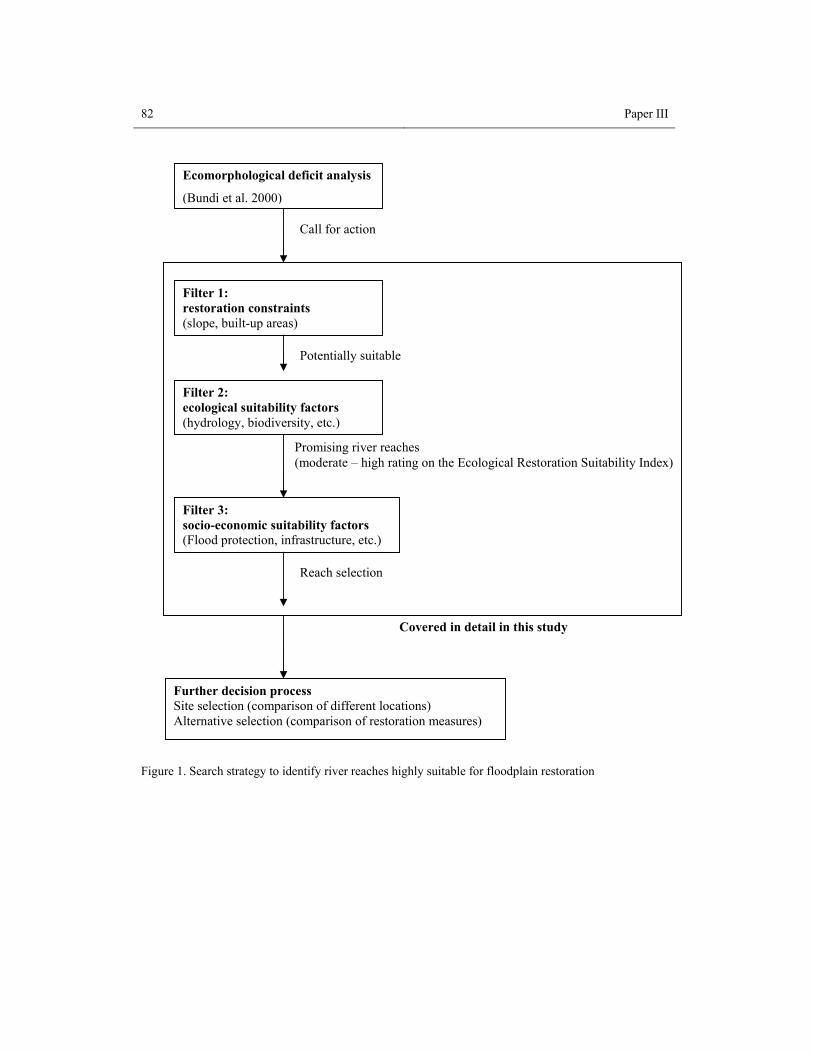
82 Paper III
Figure 1. Search strategy to identify river reaches highly suitable for floodplain restoration
Ecomorphological deficit analysis
(Bundi et al. 2000)
Filter 1: restoration constraints (slope, built-up areas)
Filter 2: ecological suitability factors (hydrology, biodiversity, etc.)
Filter 3: socio-economic suitability factors (Flood protection, infrastructure, etc.)
Further decision process Site selection (comparison of different locations) Alternative selection (comparison of restoration measures)
Call for action
Potentially suitable
Reach selection
Covered in detail in this study
Promising river reaches (moderate – high rating on the Ecological Restoration Suitability Index)
Paper III 83
Filter 1: pre-selection based on limiting constraints
The first filter defines the minimum pre-requisites to be met for floodplain restoration. It
determines river reaches to be excluded from further consideration based on the
attributes of selected constraints. These constraints constitute the general framework
which cannot be changed. We considered the following two factors as constraints:
(i) slope > 6%
(ii) location within built-up areas.
The threshold slope of 6% was obtained from a spatial analysis of the distribution of
floodplains in Switzerland. This analysis showed that extended floodplains can only be
found in areas with a slope < 6% because steeper slopes naturally result in straight river
courses. As opportunities for floodplain restoration within settlements are limited, urban
streams are not considered. However, the needs of urban inhabitants, e.g. recreation, are
taken into account in the assessment/selection procedure (Filter 3).
Filter 2: evaluation of ecological suitability
Introduction
The second filter involves determining the ecological restoration suitability of a river
stretch. It is based on the idea that the environmental catchment conditions drive the
success of floodplain restoration and thus the restoration potential (Malmquist 2002,
Poff 1997). In planning restoration the processes which form the landscape and the
wider context in which the project is placed needs to be considered. Hence, the second
filter evaluates ecological restoration suitability on the basis of non-deterministic, but
driving factors.
Based on a broad literature review (Brookes and Shields 1996, Calow and Petts 1994,
Marriott and Alexander 1999, Naiman and Bilby 1998, Nilsson and Svedmark 2002,

84 Paper III
Osborne et al. 1993, Pedroli et al. 2002, Petts and Calow 1996), we identified the
following five factors to be the key elements in affecting the restoration potential of a
river (suitability factors) : i) hydrology, ii) bed load, iii) water quality, iv) connectivity
and v) biodiversity. Table 1 summarizes the chosen ecological suitability factors and
corresponding indicators.
Table 1. Ecological suitability factors (criteria) and corresponding indicators (incl. range) (Filter 2) Criteria Indicator Indicator range Hydrology Water abstraction [%] < 20 <20 + increased winter flow 20-40 40-60 60-80 > 80 Hydropeaking peak flow : base flow < 3(4):1 peak flow : base flow > 3(4):1 Dam No Yes Bed load River bed erosion Transport capacity:bedload discharge < 4:3 Transport capacity:bedload discharge > 4:3 Water quality Chemistry Very good Good Moderate Bad Very bad Arable land [%] 0-2.33*** 2.33-6.69 6.69-12.3 12.3-21.59 21.59-35.88 Connectivity Distance from present floodplains [km] 0-10 10-25 25-50 50-100 > 100 Distance from gravel pits [km] < 10 > 10 Presence of artificial migration barriers [per km]** 0 1-3 > 3 Biodiversity Percentage [%] of regional riparian species pool 0-10*** (flora) 10-34 34-50 50-70 70-100 Percentage [%] of regional riparian species pool 0-7*** (fauna) 7-19 19-32 33-49 49-74 **) vertical height of the barriers: trout zones = 70 cm, all other fish zones = 25 cm ***) Classes according to present situation in Switzerland (relative, not absolute assessment)
Paper III 85
The five factors are incorporated in the Ecological Restoration Suitability Index (ERSI)
for assessing the ecological restoration suitability of a river reach. This index is a
unitless variable with values between 0 (moderate suitable) and 1 (highly suitable).
However, sub-indices values for each indicator are reported with the overall score and
all values are used to describe the restoration suitability of an individual reach. This
allows users to make their own assessment about the relative importance of each
indicator. Furthermore, ecological deficiencies in the river system whose removal will
have a great positive effect on the overall restoration suitability can be identified.
Hydrology
It is recognized that (near-) natural river flows are the key to restoring floodplains as the
establishment and persistence of riparian habitats rely on a complex, dynamic
hydrological regime with intra- and inter-annual flood variations in timing, duration,
magnitude and shape of the hydrograph (Hughes and Rood 2003). Thus flow
characteristics are important parameters for the assessment of floodplain restoration
suitability.
However, anthropogenic flood regulation and hydropower production have altered the
hydro-regime of many rivers by changing flow volume, cutting peak flows and
changing seasonalities. The influence of a changed flow regime on the state of a river is
well documented (Bowen et al. 2003, Bunn and Arthington 2002, Cereghino et al. 2002,
Lagarrigue et al. 2002). Direct measurements of the hydrological condition of each
river reach typically require the analysis of extended data sets and are thus not
appropriate for pre-selecting river reaches for restoration management on a broad scale.
86 Paper III
Therefore, the following indicators are used as surrogates to evaluate flow
characteristics for restoration purposes:
(i) Water abstraction
(ii) Hydropeaking
(iii) Dams.
The latter do not only prevent free water flow but also hinder the migration of some
aquatic species and change the seasonal flow regime. An extensive literature review by
Limnex (2003) on hydropeaking showed that a ratio of about 3(4):1 between the peak
flow and base flow phases was a critcal value. With smaller ratios no major impacts on
the river biocoenosis are to be expected. However, Limnex (2003) emphasizes that this
value should only be taken as a rough guide.
Bed load
The sediment regime plays a major role in determining the biotic composition, structure
and function of floodplains. Floodplains show a steady state shifting mosaic of habitats
varying in successional age (Bornette et al. 1994, van der Nat et al. 2003). Transient
islands and sand/gravel bars are characteristic features of floodplains. These typical
elements are formed by erosion, transport and deposition processes due to water and
sediment fluxes, which are the dominant channel-forming mechanisms (Clarke et al.
2003). However, in many rivers, artificial bank stabilization and sediment retention
basins have led to a lack of bed-load material. This is associated with a decline in
alluvial deposits and habitats. A balanced sediment regime is an important driving force
in the process of floodplain restoration, whilst a lack of sediment hampers river
rehabilitation and thus restoration suitability. To assess restoration suitability from a
geomorphologic point of view the following indicator is proposed:
(i) River-bed erosion.
Paper III 87
In general a lack of sediment is assumed if the ratio between the transport capacity of a
river and the bed-load discharge exceeds 4:3 for a period longer than 10 years (Bezzola
2003, personal communication). However, the sediment regime can hardly be analysed
on the catchment scale as it requires an extended data set and is very time consuming.
Therefore we propose using the extent of river-bed erosion as an indicator for the status
of the sediment regime. River bed incision is strongly correlated with deficient bed-load
transport and is thus a surrogate for the above mentioned ratio between transport
capacity and bed-load discharge. River-bed erosion can be assessed according to the
written or oral descriptions of local authorities, photogrammetric channel data or
comparisons of photographs taken of constructions within the river bed (e.g. bridges)
where changes in river-bed level can be roughly estimated from. The presence of river-
bottom sills also indicates a lack of sediment as they are commonly used by river
engineers to prevent/stop river-bed erosion. Having said that, it is possible that river-bed
may be paved so that there is no river bed erosion but still a lack of sediment.
Water quality
Investigations of benthic macro-invertebrates (Nedeau et al. 2003) and fish communities
(Pretty et al. 2003) have shown that poor chemical water quality can reduce the positive
effect of physical habitat restoration. Both chemical and physical parameters affect the
success of a restoration project. High loads of fine sediment, for example, hamper high
benthic diversity and abundance due to the absence of local flow refugia and spawning
grounds. Research shows that arable land use is a major source of pollution with fine
sediments (Allan et al. 1997, Basnyat et al. 1999, Walser and Bart 1999).
88 Paper III
Therefore we included
(i) Chemical water quality
(ii) Percentage of arable land in the watershed
(iii) Presence of riparian woodland
as indicators for assessing restoration suitability.
Characteristics of the chemical water quality of a river reach were selected according to
the Swiss Program for investigating and assessing of flowing waters (BUWAL 2003)
and include: ortho-phosphates, nitrates, nitrites, ammonium, DOC and pH. The scheme
contains temperature-dependent critical values to account for the natural differences
between headwaters and lowland rivers.
Water quality is not only described chemically but also physically, for example,
turbidity and temperature. Temperature is of major importance as it drives many
chemical processes and the metabolism of living organisms. The natural temperature
regime and turbidity can be heavily disturbed by anthropogenic effluents (e.g. power
stations or sewage plants) and the logging of riparian woodland. In cases where
temperature data is not available, the presence of hydropeaking, water abstraction and
riparian woodland are proposed as surrogates.
Connectivity
Rivers are longitudinally, laterally, vertically and temporally connected with their
environment (Amoros and Bornette 2002, Ward 1998). Connectivity is a pre-
requirement for the flux of energy, water, sediments and nutrients, as well as of species
dispersal and migration. Thus restoration suitability increases with connectivity.

Paper III 89
To assess the degree of spatial connectivity of a certain river reach, the following
indicators are proposed:
(i) Artificial migration barriers
(ii) Distance from current floodplains
(iii) Distance from gravel pits.
Dams, weirs, etc. are artificial barriers which have considerable influence on aquatic life
as they hamper or interrupt species movement along the river channel. Thus, such
barriers impair restoration suitability.
Distance from species pools is a major factor besides the ecological permeability of an
environment, behind species colonization at a new established site. Investigations
(Rohde et al. 2003) showed that the vegetation composition of river widenings within a
distance of 10km downstream of near-natural floodplains was similar to that found at
the near-natural sites, while the vegetation composition of isolated river widenings was
mainly influenced by the immediate surroundings. There have been many studies
investigating hydrochory, but there is no general information on dispersal distances as
these vary from species to species (Pedroli et al. 2002). However, the number of
dispersed species generally decreases with distance from the species pool, as, for
example, shown by Waals (1938) in Ellenberg (1996). Thus the greater the distance
from a species pool, the lower the probability of species arrival and therefore the less
suitable for restoration.
Gravel pits have been identified as providing secondary habitats for some riparian
species (Catling and Brownell 2001, Pinder 1997, Santoul 2002, Sidle and Kirsch
1993). Therefore they may function as species pools. Thus the presence of gravel pits
was also included as indicator for connectivity. A distance of 1km from gravel pits was
found to be reasonable to have a positive impact on the restoration suitability as
research on amphibians, for example, has shown that individuals are capable of
90 Paper III
covering distances up to 3-4 km (Miaud et al. 2000, Ray et al. 2002) and many riparian
plant species are not only hydrochor, but also anemochor (Bonn and Poschlod 1998).
Biodiversity
The number of riparian species present in a region surges the potential for colonization
by riparian species and thus the probability of re-establishing near-natural biocoenosis.
The more riparian species present in a river region, the more species could potentially
benefit from restoration efforts.
For Switzerland Schneider et al. (2003), Peter (personal communication) and Rohde et
al. (2003) provide lists of riparian species whose survival mainly depends on fluvial
habitats. These lists include fish, birds, mammals, mussels, insects (Carabidae,
Saltatoria, Apidae, Heteroptera) and (semi-) terrestrial flora. For roughly estimating
how suitable a river stretch is to enhance those species the following indicator is
suggested:
(i) The presence of riparian species (flora & fauna).
The presence of riparian species is measured as a percentage of the local species pool
derived from distribution maps. This procedure reflects the current colonization
potential and also takes into account biogeographical differences.
Species colonization clearly depends not only on the species pool, but also on the
species abundance and ecological permeability of the region. The extent of species
movement within the landscape is difficult to assess. Nevertheless, over the longer term
we might expect that restoration sites placed in species-rich regions are more likely to
be colonized by riparian species than sites with a low species pool.
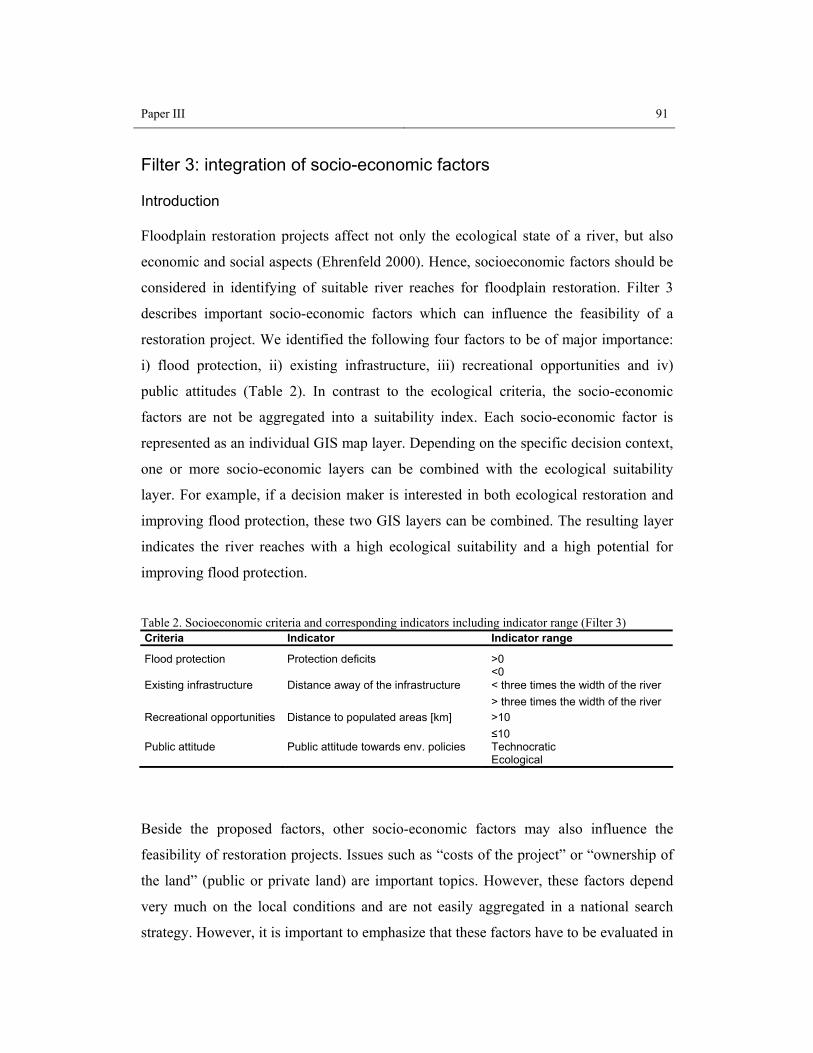
Paper III 91
Filter 3: integration of socio-economic factors
Introduction
Floodplain restoration projects affect not only the ecological state of a river, but also
economic and social aspects (Ehrenfeld 2000). Hence, socioeconomic factors should be
considered in identifying of suitable river reaches for floodplain restoration. Filter 3
describes important socio-economic factors which can influence the feasibility of a
restoration project. We identified the following four factors to be of major importance:
i) flood protection, ii) existing infrastructure, iii) recreational opportunities and iv)
public attitudes (Table 2). In contrast to the ecological criteria, the socio-economic
factors are not be aggregated into a suitability index. Each socio-economic factor is
represented as an individual GIS map layer. Depending on the specific decision context,
one or more socio-economic layers can be combined with the ecological suitability
layer. For example, if a decision maker is interested in both ecological restoration and
improving flood protection, these two GIS layers can be combined. The resulting layer
indicates the river reaches with a high ecological suitability and a high potential for
improving flood protection.
Table 2. Socioeconomic criteria and corresponding indicators including indicator range (Filter 3) Criteria Indicator Indicator range
Flood protection Protection deficits >0 <0 Existing infrastructure Distance away of the infrastructure < three times the width of the river > three times the width of the river Recreational opportunities Distance to populated areas [km] >10 ≤10 Public attitude Public attitude towards env. policies Technocratic Ecological
Beside the proposed factors, other socio-economic factors may also influence the
feasibility of restoration projects. Issues such as “costs of the project” or “ownership of
the land” (public or private land) are important topics. However, these factors depend
very much on the local conditions and are not easily aggregated in a national search
strategy. However, it is important to emphasize that these factors have to be evaluated in

92 Paper III
the later decision-making process, when different locations for restoration or different
restoration alternatives are considered (Hostmann et al. 2004).
Flood protection
Flood retention is one of the most important socio-economic aspects in floodplain
restoration. Providing more room for rivers increases the retention volume and thus
reduces the risk of damaging the surrounding area. Hence, combinating of ecological
restoration and improved flood protection can increase the public acceptance of a
project.
The following indicator provides information on the flood protection level within the
river basin:
(i) Protection deficits
The protection deficit is the difference between the protection objective defined by the
public authority and the existing protection level for a specific river reach. The need for
restoration measures increases the larger the protection deficit. We propose varying
protection objectives, which depend on the purpose of the area under consideration.
Settlements and infrastructure, for example, need a greater protection than farming
areas. The public authority in Switzerland, for example, requires the 100-year flood
(Q100) as a protection objective for settlements, whilst the protection objective for high-
intensity farming areas is proposed as ranging from a 20-year flood (Q20) up to a 50-
year flood (Q50) (BWG 2001).
Existing infrastructure
Existing infrastructure may complicate or constrain restoration projects. There are
different types of infrastructure, such as highways, railways, houses and groundwater
recharge stations, which are strong constraints on restoration projects since they are not

Paper III 93
likely to be removed. In contrast, other types of infrastructure such as power supply
lines and gas pipes are more likely to be relocated, but may still complicate restoration
projects.
To assess the suitability of a restoration project based on existing infrastructure, the
following indicator is proposed:
(i) Distance between the infrastructure and the river.
The necessary space for a river widening depends on the type of the river and the
restoration measures. In general, it can be assumed that if the infrastructure is located
closer than three (to four) times the width of the existing river bed, the rehabilitation
measures will be constrained.
Recreation opportunities
Natural or near-natural rivers make attractive recreation areas, providing opportunities
for activities such as eco-tourism, sport fishing and other outdoor activities (Costanza et
al. 1997). Hence, improving recreational opportunities can be an important objective in
restoration projects and can increase the public acceptance of the project.
The potential for recreational activities depends on the distance between the river and
the next closest densely populated area (village, town). Thus the restored sites should be
close to populated areas to allow for local recreation. To assess the suitability of
restoration projects for recreation, the following indicator is proposed:
(i) Distance between the river and the populated areas.
We suggest 10km as an adequate threshold, as a distance up to 10km between the
recreational site and the populated area seems to be a reasonable distance to travel for
recreation purposes (ARE and BFS 2001).
94 Paper III
Public attitudes
Most restoration projects are financed by the government (local, regional or federal
government), and hence mainly paid for with public money. In Switzerland, for
example, the public even has in some cases to vote in a referendum on the restoration
project. That shows that the general attitude of the public towards restoration projects is
a major factor affecting their implementation.
We assume that if a community has an ecological attitude this can increase the
feasibility of restoration projects. Therefore, the following indicator is proposed:
(i) Public attitude towards environmental projects (ecological or technocratic).
There is hardly any data on public attitude towards river restoration projects available
on a national scale. In the absence of such data, surrogate data featuring general public
attitudes towards environmental policies could be used instead. This could be obtained
from public polls (Herrmann and Leuthold 2001, 2003).
Restoration priorities
Limited resources will not allow floodplain restoration at every reach identified as
suitable by this search strategy. Therefore priorities need to be set. However, the
prioritizing process should not only consider the suitability values but also include
biogeographical aspects. The overall aim should be to restore a healthy network of
floodplains representative of their natural diversity. Such a network should ensure that
headwaters, middle reaches and lower courses from different biogeographic regions are
represented equally so as to sustain the natural array of processes and species which
characterise our floodplains.
Paper III 95
Spatial multiple criteria decision analysis
Data requirements
To apply the search strategy, the following information is needed:
(i) Quantitative, spatially explicit data about the selected indicators, which will be
implemented in a geographical information system (grid layers). These may be
readily available from inventories or can be generated from existing information
by using, for example, buffer, merge or cost-distance functions provided by the
GIS software. Data scarcity does not limit the application, as we allowed some
redundancy in the indicator selection.
(ii) Suitability functions and weightings of the selected indicators for GIS modelling
and sensitivity analysis (Filter 2). These can be obtained from expert interviews
(e. g. using the Delphi process).
MCDA-GIS modelling and sensitivity analysis
For the hierarchical filter process a geographic information system is used to manage
and analyse the spatial data. In filter 1 all those areas that are not considered suitable for
floodplain restoration are excluded by a Boolean-type selection.
In filter 2 the Ecological Restoration Suitability Index (ERSI) is calculated by a
numerical overlay of the selected indicators (Figure 2). The combination of these
indicators in a single restoration suitability index is a multiple criteria decision analysis
(MCDA) problem. Within a geographical information system (GIS), each indicator is
represented in a thematic grid layer while each cell in the database is taken as an
alternative to be evaluated in terms of its quality or appropriateness for a given end, e.g.
floodplain restoration (Pereira and Duckstein 1993).
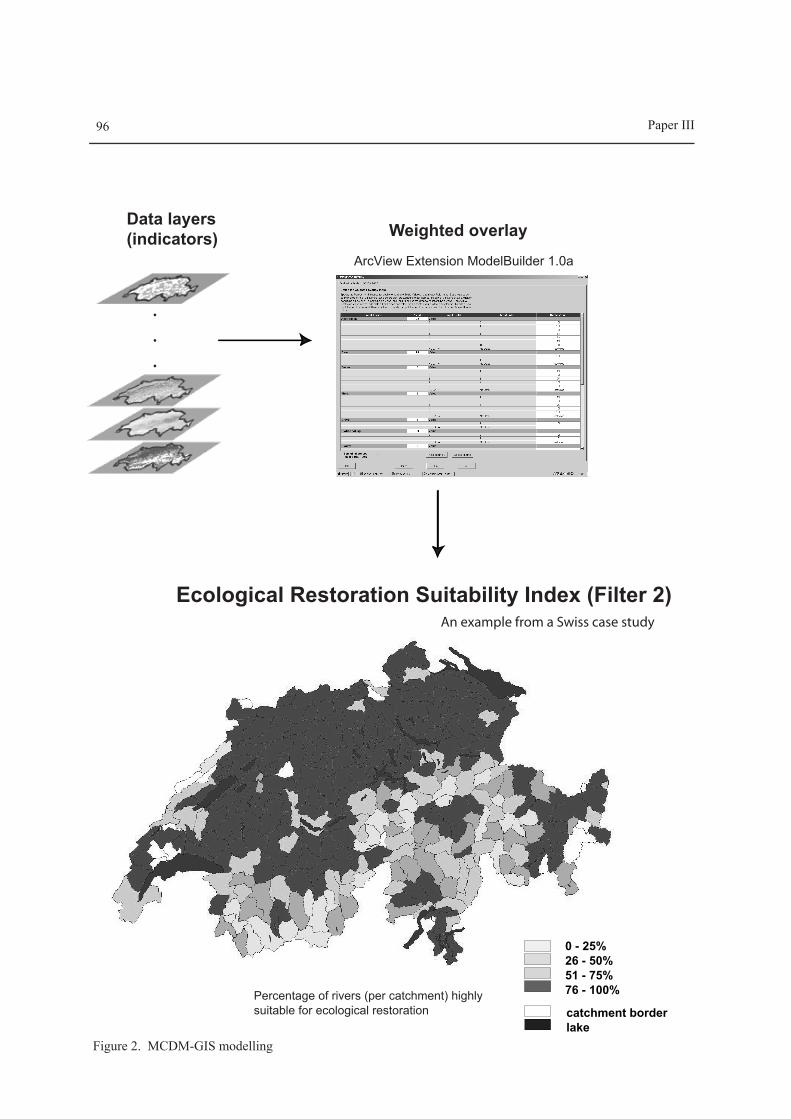
.
.
.
Data layers(indicators) Weighted overlay
Ecological Restoration Suitability Index (Filter 2)
Percentage of rivers (per catchment) highlysuitable for ecological restoration
0 - 25%26 - 50%51 - 75%76 - 100%
catchment borderlake
ArcView Extension ModelBuilder 1.0a
An example from a Swiss case study
Figure 2. MCDM-GIS modelling
Paper III96
Paper III 97
The combination of GIS and MCDA is a powerful approach to land suitability
assessment (Joerin et al. 2001) and different applications have been described in the
literature (e.g. Bojorquez-Tapia et al. 2001, Jankowski et al. 1997, Joerin et al. 2001,
Pereira and Duckstein 1993, Store and Kangas 2001).
There are numerous MCDA methods to combine different indicators within an
assessment/selection procedure (Malczewski 1999). This study adapts the multi-
attribute value theory (MAVT) approach based on the weighted additive model.
Additive decision rules are the best known and most widely used MCDM methods in
GIS-based decision-making (Malczewski 1999). For example, Store & Kangas (2001)
applied the multi-attribute utility theory (MAUT) for habitat suitability evaluation
within forest management planning and species conservation. Other MCDM methods
include outranking techniques such as PROMETHEE (Brans et al. 1986) and
ELECTRE (Roy et al. 1986). However, outranking techniques require pair-wise
comparisons among alternatives, which is impractical for applications where the
number of alternatives/cells in a database is in the range of tens or hundreds of
thousands (Pereira and Duckstein 1993).
The MAVT-approach (e.g. Belton and Stewart 2002, von Winterfeldt and Edwards
1986) involves three elements: (1) a single value (suitability) function for each indicator
which is used to transform the indicator levels into an interval-value scale, (2) the
weightings to determine the relative importance of each indicator and (3) the prediction
of outcomes for the indicators. The overall value for the suitability status of a cell A is
the weighted average of the single indicator values:
V(A) = ∑ wi vi(ai) (1),
where V(A) is the overall value of the cell A, ai represents the outcome for indicator i
resulting from cell A, vi(ai) is the single indicator suitability function and wi is a
normalized weight for indicator i. The overall value of a cell V(A) represents the
Ecological Restoration Suitability Index (ERSI) of this cell.

98 Paper III
In the GIS the map layer of each indicator was integrated in a suitability model (Figure
2). The attribute levels of the indicators were standardized to a continuous scale of
suitability from 0 (the least suitable) to 100 (the most suitable) (indicator suitability
function). Each standardized factor is then multiplied by its corresponding weight
(Table 3). Finally, the suitability model produces a suitability map showing the overall
ERSI with cell values ranging from 0 to 100. To make the resulting map more user-
friendly, the Ecological Restoration Suitability Index is reclassified into 3 equal classes:
Class 1: highly suitable
Class 2: fairly suitable
Class 3: moderate suitable.
Filter 3 is a visual overlay of the ecological suitability map with the single maps of the
socio-economic factors. The overlay is not done numerically as suitability values and
weights depend more on local management and planning goals and restrictions than on
general scientific knowledge.
A sensitivity analysis allows the relative influence of the weightings on the ERSI to be
investigated. This tests how the results will change if the weightings of the criteria are
changed. A sensitivity analysis is a useful tool in situations where the relationships
between variables and their relative importance are uncertain as it helps with data
interpretation.
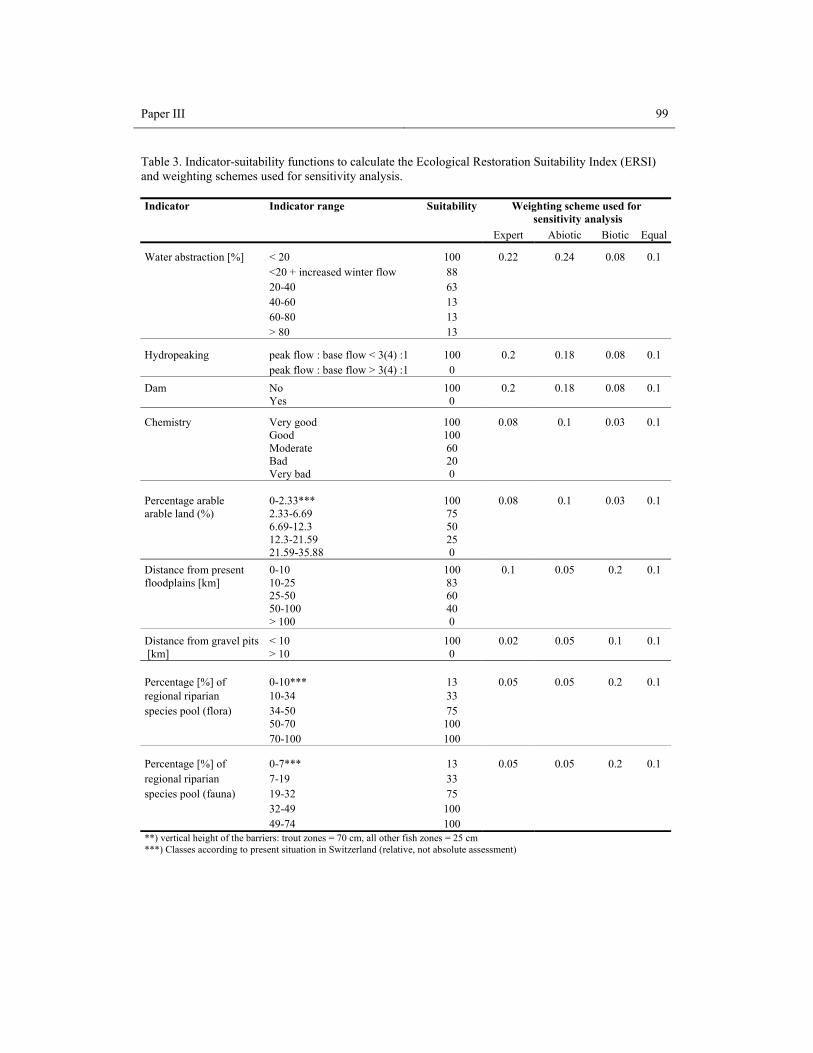
Paper III 99
Table 3. Indicator-suitability functions to calculate the Ecological Restoration Suitability Index (ERSI) and weighting schemes used for sensitivity analysis. Indicator Indicator range Suitability Weighting scheme used for
sensitivity analysis Expert Abiotic Biotic Equal
Water abstraction [%] < 20 100 0.22 0.24 0.08 0.1 <20 + increased winter flow 88 20-40 63 40-60 13 60-80 13 > 80 13
Hydropeaking peak flow : base flow < 3(4) :1 100 0.2 0.18 0.08 0.1 peak flow : base flow > 3(4) :1 0 Dam No 100 0.2 0.18 0.08 0.1 Yes 0
Chemistry Very good 100 0.08 0.1 0.03 0.1 Good 100 Moderate 60 Bad 20 Very bad 0
Percentage arable 0-2.33*** 100 0.08 0.1 0.03 0.1 arable land (%) 2.33-6.69 75 6.69-12.3 50 12.3-21.59 25 21.59-35.88 0 Distance from present 0-10 100 0.1 0.05 0.2 0.1 floodplains [km] 10-25 83 25-50 60 50-100 40 > 100 0
Distance from gravel pits < 10 100 0.02 0.05 0.1 0.1 [km] > 10 0
Percentage [%] of 0-10*** 13 0.05 0.05 0.2 0.1 regional riparian 10-34 33 species pool (flora) 34-50 75 50-70 100 70-100 100
Percentage [%] of 0-7*** 13 0.05 0.05 0.2 0.1 regional riparian 7-19 33 species pool (fauna) 19-32 75 32-49 100 49-74 100 **) vertical height of the barriers: trout zones = 70 cm, all other fish zones = 25 cm ***) Classes according to present situation in Switzerland (relative, not absolute assessment)
100 Paper III
Case Study The integrative search strategy presented here was applied as part of the Rhone-Thur
Project in Switzerland. The Swiss network of water courses covers about 61’000 km of
streams and rivers. Preliminary studies suggest that 43% of the stream and river network
is in need of restoration (Peter et al. 2003). As a result the Swiss Federal Ministries for
environment and water formulated “sufficient room for water courses” as a major
development objective (BUWAL/BWG 2003). The ministries ask to achieve these
objectives by considering ecological as well as socio-economic criteria.
The search strategy was developed as planning tool and a preliminary case study was
conducted using spatial data from various sources (BFS-GEOSTAT 1992/97, BFS-
GEOSTAT/BUWAL 2001, BFS-GEOSTAT/BUWAL/BUWAL/ARE/BAKOM 2002,
BWG/BUWAL 2003, CSCF 2003, Herrmann and Leuthold 2003, Wohlgemuth et al.
1999). Data was available to cover most of the ecological indicators (Filter 2). Only the
indicators “bed load” and “presence of artificial migration barriers” could not be
implemented due to incomplete data bases. A modified Delphi process survey of nine
river ecology experts was used to assess the appropriateness of each ecological criterion
and corresponding indicator; and to estimate the single indicator suitability functions on
the basis of their best professional judgements (Table 3).
ArcView GIS 3.3. and ModelBuilder 1.0a were used to perform the spatial multiple
criteria decision analysis. Each suitability indicator represented its own map layer and
the data was grided into 100m x 100m grid cells. Figure 2 shows the input maps of the
ecological suitability assessment (MCDM-GIS- analysis, see above) and the resulting
ecological restoration suitability map on the catchment scale.
For some of the data GIS layers were readily available. Others had to be produced from
existing information by using spatial function and analysis tools provided by the GIS
software. For example, the distance to the nearest floodplain reserve (Filter 2) was
calculated with the CostDistance function within the SpatialAnalyst extension of
Paper III 101
ArcView3.3. We decided not to use the buffer function, as this would not take into
account bends and meanders.
For some criteria (e.g. proportion of arable land (Filter 2)) the suitability of a river
stretch was not assessed on the basis of thresholds that have an ecologically based
rational. Instead, we ranked the existing data. The ranking (classification) of the data
was done using the “natural breaks” function in ArcView, which finds groupings and
patterns inherent in the data and minimizes the sum of the variance within each of the
classes (Jenk’s optimization). This procedure identifies the most suitable areas
according to present-day environmental conditions.
Figure 2 shows the percentage of the river reaches highly suitable for ecological
restoration within the catchment areas. This result is based on the expert weighting
scheme (Table 3). It is striking that for the majority of the catchment areas, the river
reaches are highly suitable for restoration (class 1). In total, 80% of all river reaches in
the study area are classified as highly suitable and 20% of the river reaches are fairly
suitable (class 2) for restoration (Figure 3). None of the rivers are classified as moderate
suitable (class 3). The majority of river reaches that are highly respectively fairly
suitable for restoration can be found in the lowland region of Switzerland. This
geographical differentiation has to do with the fact that alpine rivers are especially
affected by water abstraction and hydropeaking due to hydropower production. These
factors which limit restoration suitability are weighted relatively high by the experts
(Table 3).
To determine how the weightings of the indicators influence the results, three additional
weighting schemes were applied for the sensitivity analysis: (i) an abiotic scheme,
which emphasizes the abiotic criteria, (ii) a biotic scheme, which emphasizes the biotic
indicators and (iii) a third scheme where all indicators received equal weightings (Table
3). Major differences occur between the results of the expert weighting and of the biotic
weighting scheme and the scheme with equal weightings (Figure 3).
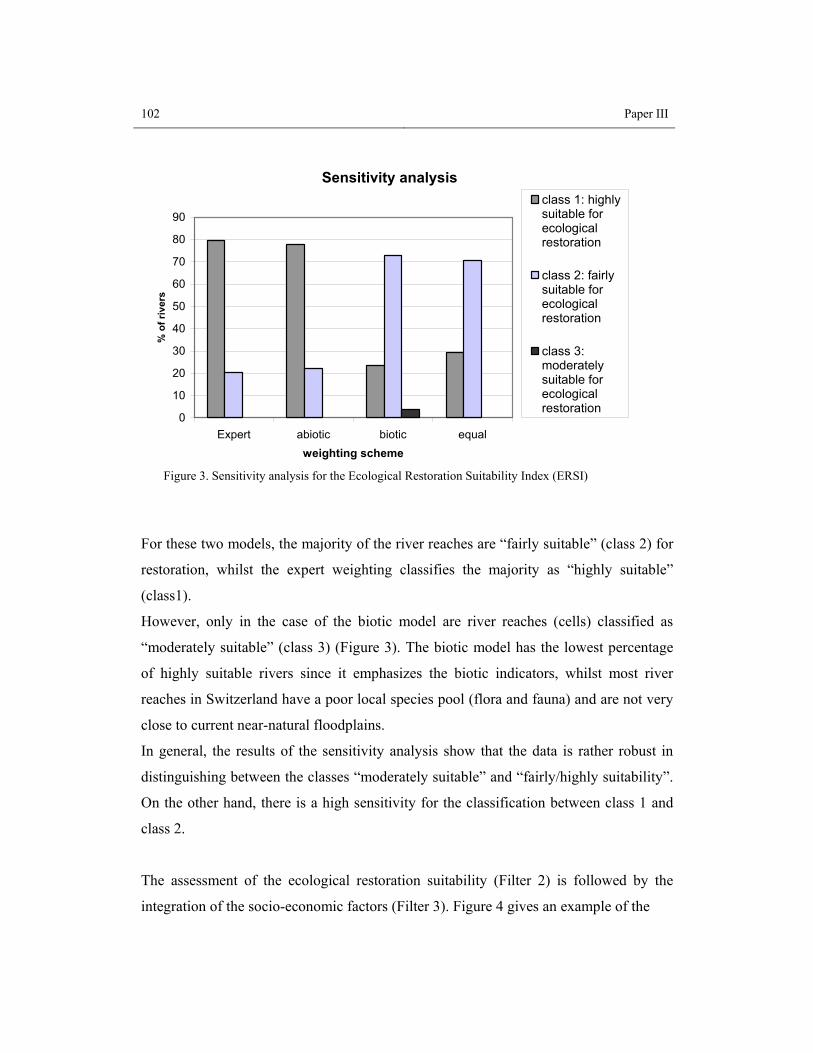
102 Paper III
Sensitivity analysis
0
10
20
30
40
50
60
70
80
90
Expert abiotic biotic equalweighting scheme
% o
f riv
ers
class 1: highlysuitable forecologicalrestoration
class 2: fairlysuitable forecologicalrestoration
class 3:moderatelysuitable forecologicalrestoration
Figure 3. Sensitivity analysis for the Ecological Restoration Suitability Index (ERSI)
For these two models, the majority of the river reaches are “fairly suitable” (class 2) for
restoration, whilst the expert weighting classifies the majority as “highly suitable”
(class1).
However, only in the case of the biotic model are river reaches (cells) classified as
“moderately suitable” (class 3) (Figure 3). The biotic model has the lowest percentage
of highly suitable rivers since it emphasizes the biotic indicators, whilst most river
reaches in Switzerland have a poor local species pool (flora and fauna) and are not very
close to current near-natural floodplains.
In general, the results of the sensitivity analysis show that the data is rather robust in
distinguishing between the classes “moderately suitable” and “fairly/highly suitability”.
On the other hand, there is a high sensitivity for the classification between class 1 and
class 2.
The assessment of the ecological restoration suitability (Filter 2) is followed by the
integration of the socio-economic factors (Filter 3). Figure 4 gives an example of the
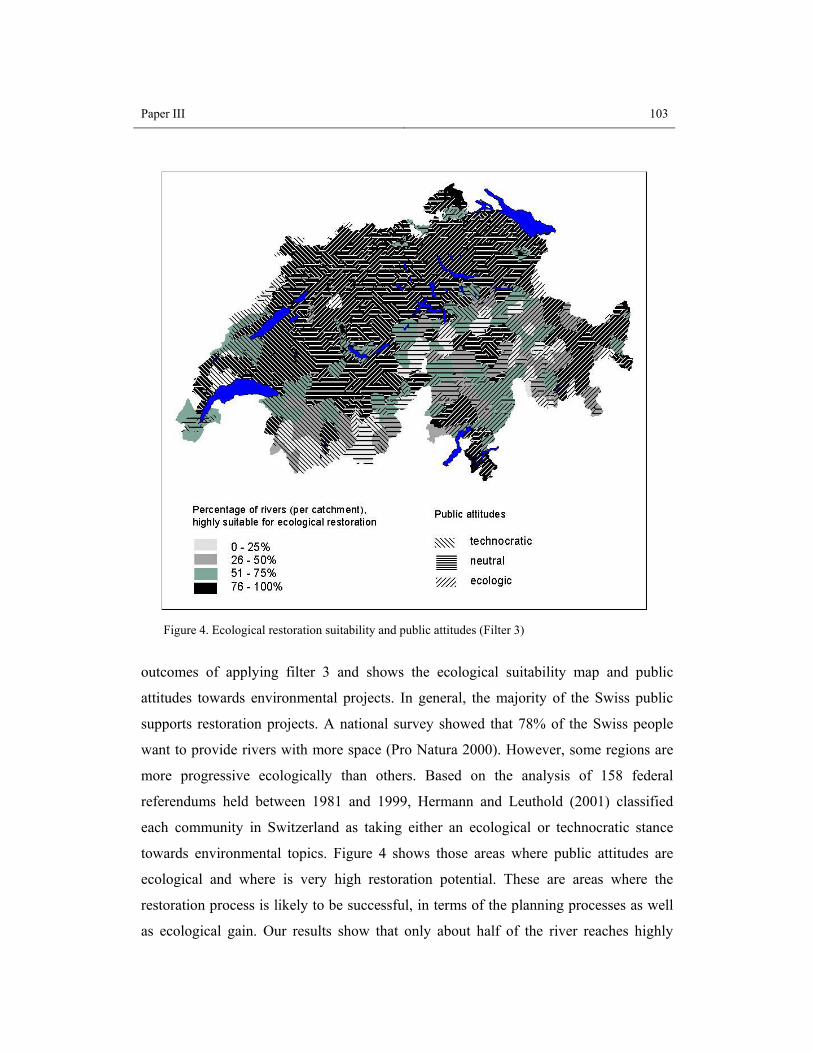
Paper III 103
Figure 4. Ecological restoration suitability and public attitudes (Filter 3)
outcomes of applying filter 3 and shows the ecological suitability map and public
attitudes towards environmental projects. In general, the majority of the Swiss public
supports restoration projects. A national survey showed that 78% of the Swiss people
want to provide rivers with more space (Pro Natura 2000). However, some regions are
more progressive ecologically than others. Based on the analysis of 158 federal
referendums held between 1981 and 1999, Hermann and Leuthold (2001) classified
each community in Switzerland as taking either an ecological or technocratic stance
towards environmental topics. Figure 4 shows those areas where public attitudes are
ecological and where is very high restoration potential. These are areas where the
restoration process is likely to be successful, in terms of the planning processes as well
as ecological gain. Our results show that only about half of the river reaches highly
104 Paper III
suitable for ecological restoration are located in areas where public attitudes are
ecological. However, experience shows that public attitudes can change with
information and stakeholder involvement. Thus our results do not imply that the areas
with technocratic attitudes should be excluded from consideration, but that there might
be more resources needed there to achieve public support.
The map in Figure 4 is a preliminary result, as the data of Herrmann and Leuthold
(2003) represents general public attitudes towards environmental projects. There will be
a nation-wide survey within the Rhone-Thur project focusing on public attitudes
towards river restoration which will provide more detailed information (Junker et al., in
prep.).
Discussion The main purpose of this study was to describe important ecological and socio-
economic criteria for assessing restoration suitability and to develop a search strategy to
identify river reaches where the greatest benefits from restoration can be expected. The
case study illustrating its application. Although the selected criteria and parameter
values represent mainly Swiss conditions, the proposed approach can easily be adapted
to other study areas, e.g. by integrating “navigation” as a socioeconomic criterion within
filter 3.
The strategy concentrates on assessing suitability and priority for restoration of
floodplains and their biocoenosis. Other restoration measures, like removing dams and
reducing water abstraction, are not specifically addressed. These are very important
issues which are tackled by, for example, the Green Hydropower Project (Truffer et al.
2003). However, the model presented here implies a deficiency analysis which gives
information on where improvements of abiotic conditions are needed and which
measures would have the most far-ranging effects favouring the restoration efforts.
Paper III 105
Restoration suitability is driven by numerous factors. However, practical applications
require a manageable set of indicators and data. In this regard the search strategy is a
compromise between accuracy and costs, which can guide and support decisions, but
never “make” decisions.
In order to estimate the Ecological Restoration Suitability Index (ERSI) based on the
weighted additive model, the decision maker’s preference should satisfy a condition
known as mutual preferential independence. This requires that every subset of attributes
should be preferentially independent of its complement (Belton 1999). There are
different ways to deal with a lack of mutual preferential independence. It may be
possible to redefine or restructure the attributes in a way which achieves preferential
independence (Belton 1999). Another way is to estimate the interactions of the
attributes and use the multiplicative model (Keeney and Raiffa 1976, von Winterfeldt
and Edwards 1986). In this study, we selected the ecological criteria so as to be as
independent as possible. However, some redundancy was allowed to enable the
application of the search strategy in situations where data is scarce and the sensitivity
analysis was done to assess the effects of different weightings of the indicators.
Lack of data limits the completeness of information to be integrated into the suitability
model of the search strategy. In cases of data scarcity one can use surrogate data instead
of direct measurements. Data on public attitudes, for example, can be estimated from
ballot results instead of personal interviews. Having said that, one has to be careful that
the chosen surrogate implies the information needed. In general, data scarcity does not
prevent the application of our search strategy, as we allowed some redundancy in the
indicator selection.
The quality of the search strategy does not solely depend on the implemented factors
and data availability. It also depends on accuracy, age and resolution of the input data.
When interpreting the data one should be aware of the spatial resolution of the input
data. We worked on a basis of a 100m x 100m grid (for technical reasons). Underlying
ecological and socio-economic criteria, however, are often based on much coarser
resolutions, for example, reach level for hydropeaking or municipal level for the
indicator “public attitude”. The model presented here produces a suitability map with
106 Paper III
crisp boundaries between the individual suitability classes. However, real-world
boundaries are mainly continuous ones. Water quality, for example, will rarely change
abruptly but rather will be fuzzy with increasing dilution. The crisp boundaries in the
suitability model are an artefact resulting from abstraction of real-world data into the
GIS-compatible map layers of the input data. Hence, the level of detail is only sufficient
to signal river reaches of different restoration suitability on the catchment scale.
It is important to emphasise that this search strategy does not replace more detailed
investigations, which provide the foundation for comparing different restoration sites
within one river reach and different alternatives for the chosen restoration site. The
strength of this search strategy lies in the pre-screening of spatial data on a national
scale and its ability to focus restoration activity on the most promising areas.
Conclusions The integrative search-strategy presented and its implied GIS-model are valuable tools
to assist policy makers and planners in making decisions about floodplain restoration.
As is every model there are some constraints. For example, the simplification of reality
due to limited data input and spatial resolution. Nevertheless, we think that the
application of the suggested search strategy will enable an efficient planning process, as
it:
a) eases priority setting and allocation of resources because it helps to identify river
reaches where the present conditions favour restoration efforts and thus justify
further specific and detailed investigations (pre-screening);
b) merges input from a wide range of specialists and provides a comprehensive set
of objective, ecological as well as socio-economic indicators or surrogates for
assessing restoration suitability. The Ecological Restoration Suitability Index
Paper III 107
(ERSI) signals ecological deficiencies where further action, for example,
residual flow management, is needed to foster restoration success;
c) can be flexibly adapted to local situations with, for example, restricted data
availability. Its flexibility also means that different scenarios can be produced
subject to (future) changes in the environment or planning targets and
d) provides a “check-list” of clearly defined criteria and indicators respectively
surrogates for sustainable river management and ensures as much objectivity
and standardization as possible. Such a replicable selection procedure could be
seen by politicians and stakeholders as being less prescriptive and individually
intrusive than a subjective assessment.
In a nutshell, the search strategy presented here enables a strategic, proactive and
efficient planning process, which is based on both ecological and socio-economic
criteria. Such a systematic planning procedure provides transparency and thus helps to
ensure public accountability, and it also helps to set priorities and thus avoid
inefficiency. It enables projects to be located where they are less likely to be
undermined by adverse influences, and where the greatest gains (both ecological and
socio-economic) are to be made. We acknowledge, however, that further development
of the presented search strategy is desirable, and we invite others to become involved in
the process of further refinement.
Acknowledgments We would like to thank our collegues of the Rhone-Thur project for their participation
in the Delphi-process and for fruitful discussions about criteria and indicator selection.
We especially benefited from stimulating discussions with G.-R. Bezzola, C. Marti and
K. Tockner. We are also very grateful to P. Englmaier and F. Kienast for their valuable
comments and suggestions on the manuscript. This study was part of the
108 Paper III
transdisciplinary Rhone-Thur project (http://www.rhone-thur.eawag.ch/index.html), financed
by EAWAG, WSL, BWG and BUWAL.
Literature cited Allan, J. D., Erickson, D. L. and Fay, J. 1997. The influence of catchment land use on stream integrity
across multiple spatial scales. Freshwater Biology 37: 149-161. Amoros, C. and Bornette, G. 2002. Connectivity and biocomplexity in waterbodies of riverine
floodplains. Freshwater Biology 47: 761-776. ARE and BFS. 2001. Mobilität in der Schweiz. Ergebnisse des Mikrozenzus 2000 zum
Verkehrsverhalten. Bundesamt für Raumentwicklung, Bundesamt für Statistik, Bern and Neuenburg.
Basnyat, P., Teeter, L. D., Flynn, K. M. and Lockaby, B. G. 1999. Relationships between landscape
characteristics and nonpoint source pollution inputs to coastal estuaries. Environmental Management 23: 539-549.
Belton, V. 1999: Multi-criteria problem structuring and analysis in a value theory framework. Pages 12-1
- 12-32 in Gal T., e. a. (eds.) Multicriteria Decision Making, Kluwer Academic Press, Dordrecht, Netherlands.
Belton, V. and Stewart, T. J. 2002. Multiple Criteria Decision Analysis - An integrated approach. Kluwer
Academic Publishers, Boston/Dordrecht/London. BFS-GEOSTAT. 1992/97. Arealstatisik der Schweiz. Bundesamt für Statistik, Servicestelle GEOSTAT,
Neuchâtel. BFS-GEOSTAT/BUWAL. 2001. Aueninventar. Bundesamt für Statistik, Servicestelle GEOSTAT,
Neuchâtel. BFS-GEOSTAT/BUWAL/BUWAL/ARE/BAKOM. 2002. Siedlungsgebiete der Schweiz. Bundesamt für
Statistik, Servicestelle GEOSTAT, Neuchâtel. Bojorquez-Tapia, L. A., Diaz-Mondragon, S. and Ezcurra, E. 2001. GIS-based approach for participatory
decision making and land suitability assessment. International Journal of Geographical Information Science 15: 129-151.
Bonn, S. and Poschlod, P. 1998. Ausbreitungsbiologie der Pflanzen Mitteleuropas Grundlagen und
kulturhistorische Aspekte. Quelle & Meyer, Wiesbaden, X, 404 S. pp. Bornette, G., Amoros, C., Castella, C. and Beffy, J. L. 1994. Succession and fluctuation in the aquatic
vegetation of 2 former Rhone river channels. Vegetatio 110: 171-184. Bowen, Z. H., Bovee, K. D. and Waddle, T. J. 2003. Effects of flow regulation on shallow-water habitat
dynamics and floodplain. Transactions of the American Fisheries Society 132: 809-923.
Paper III 109
Brans, J. P., Vincke, P. and Mareschal, B. 1986. How to select and how to rank projects: The
PROMETHEE method. European Journal of Operational Research 24: 228-238. Brookes, A. and Shields, F. D. 1996. River channel restoration: guiding principles for sustainable
projects. John Wiley & Sons Ltd, Chichester. Bundi, U., Peter, A., Frutiger, A., Hütte, M., Liechti, P. and Sieber, U. 2000. Scientific base and modular
concept for comprehensive assessment of streams in Switzerland. Hydrobiologia 422/423: 477-487.
Bunn, S. E. and Arthington, A. H. 2002. Basic principles and ecological consequences of altered flow
regimes for aquatic biodiversity. Environmental Management 30: 492-507. BUWAL. 2003. Methoden zur Untersuchung und Beurteilung der Fliessgewässer in der Schweiz. Modul
Chemie. Chemisch-ohysikalische Erhebungen. Vollzug Umwelt (Entwurf). BUWAL/BWG. 2003. Leitbild Fliessgewässer Schweiz. Für eine nachhaltige Gewässerpolitik., Bern, 12
pp. BWG. 2001. Hochwasserschutz an Fliessgewässern, Wegleitung. Biel, 72 pp. BWG/BUWAL. 2003. GEWISS - Gewässerinformationssystem Schweiz. Bern. Calow, P. and Petts, G. 1994. The Rivers Handbook: hydrological and ecological principles. Vol. 1,
Blackwell Science Ltd, Oxford, 523 pp. Catling, P. M. and Brownell, V. R. 2001. Biodiversity of adult damselflies (Zygoptera) at eastern Ontario
gravel pit ponds. Canadian Field-Naturalist 115: 402-405. Cereghino, R., Cugny, P. and Lavandier, P. 2002. Influence of intermittent hydropeaking on the
longitudinal zonation patterns of benthic invertebrates in a mountain stream. International review of hydrobiology 87: 47-60.
Clarke, S. J., Bruce-Burgess, L. and Wharton, G. 2003. Linking form and function: towards an eco-
hydromorphic approach to sustainable river restoration. Aquatic conservation - marine and freshwater ecosystems 13: 439-450.
Costanza, R., d'Arge, R., de Groot, R., Farber, S., Grasso, M., Hannon, B., Limburg, K., Naeem, S.,
O'Neill, R. V., Paruelo, J., Raskin, R. G., Sutton, P. and van den Belt, M. 1997. The value of the world's ecosystem services and natural capital. Nature 387: 253-260.
CSCF. 2003. Base cartographique. Centre Suisse de Cartographie de la Faune, Neuchâtel. Ehrenfeld, J. G. 2000. Defining the limits of restoration: the need for realistic goals. Restoration Ecology
8: 2-9. Erskine, W. D. 1992. Channel response to large-scale river training works- Hunter River, Australia.
Regulated Rivers 7: 261-278. Herrmann, M. and Leuthold, H. 2001. Weltanschauung und ihre soziale Basis im Spiegel eidgenössischer
Volksabstimmungen. Swiss Political Science Review 7: 39-63. Herrmann, M. and Leuthold, H. 2003. Atlas der politischen Landschaften. Ein weltanschauliches Portrait
der Schweiz. vdf-Verlag, Zürich, 136 pp.
110 Paper III
Hobbs, R. J. and Norton, D. A. 1996. Towards a conceptual framework for restoration ecology.
Restoration Ecology 4: 93-110. Holmes, N. 1998: The river restoration project and its demonstration sites. Pages 133-148 in DeWaal, L.
C., Large, A. R. G. and Wade, P. M. (eds.) Rehabilitaiton of Rivers: Principles and Implementation, John Wiley, Chichester.
Hostmann, M., Truffer, B., Reichert, P. and Borsuk, M. 2004. Stakeholder values in decision support for
river rehabilitation. Archiv für Hydrobiologie, Supplement Volume Large Rivers under review. Hughes, F. M. R. and Rood, S. B. 2003. Allocation of River Flows for Restoration of Floodplain Forest
Ecosystems: A Review of Approaches and Their Applicability in Europe. Environmental Management 32: 12-33.
Jankowski, P., Nyerges, T. L., Smith, A., Moore, T. J. and Horvath, E. 1997. Spatial group choice: a
SDSS tool for collaborative spatial decision-making. International Journal of Geographical Information Science 11: 577-602.
Joerin, F., Thériault, M. and Musy, A. 2001. Using GIS and outranking multicriteria analysis for land-use
suitability assessment. International Journal of Geographical Information Science 15: 153-174. Keeney, R. L. and Raiffa, H. 1976. Decisions with Multiple Objectives. Wiley, New York. Kontos, T. D., Komilis, D. R. and Halvadakis, C. P. 2003. Siting MSW landfills on Lesvos island with a
GIS-based methodology. Waste management & research 21: 262-277. Lagarrigue, T., Cereghino, R., Lim, P., Reyes-Marchant, P., Chappaz, R., Lavandier, P. and Belaud, A.
2002. Diel and seasonal variations in brown trout (Salmo trutta) feeding patterns and relationship with invertebrate drift under natural and hydropeaking conditions in a mountain stream. Aquatic living resources 15: 129-137.
Limnex. 2003. Gewässerökologische Auswirkungen des Schwallbetriebes: Ergebnisse einer
Literaturstudie. Vol. 75, Mitteilungen zur Fischerei, Bundesamt für Umwelt, Wald und Landschaft, Bern.
Malanson, G. P. 1995. Riparian Landscapes. Cambridge University Press, Cambridge, 296 pp. Malczewski, J. 1999. GIS and multicriteria decision analysis. John Wiley & Sons, INC., New York. Malmquist, B. 2002. Aquatic invertebrates in riverine landscapes. Freshwater Biology 47: 679-694. Marriott, S. B. and Alexander, J. 1999. Floodplains: Interdisciplinary Approaches. Vol. 163, Geological
Society special Publication, The Geological Society London, London, 330 pp. Miaud, C., Sanuy, D. and Avrillier, J.-N. 2000. Terrestrial movements of thenatterjack toad Bufo calamita
(Amphibia, anura) in a semid-arid, agricultural landscape. Amphibia-Reptilia 21: 357-369. Naiman, R. J. and Bilby, R. E. 1998. River Ecology and Management. Lessons from the Pacific Coastal
Ecoregion. Springer-Verlag, New York, 705 pp. Naiman, R. J., Décamps, H. and Pollock, M. 1993. The role of riparian corridors in maintaining regional
biodiversity. Ecological Applications 3: 209-212. Naveh, Z. 1994. From biodiversity to ecodiversity: a landscape-ecology approach to conservation and
restoration. Restoration Ecology 2: 180-189.

Paper III 111
Nedeau, E. J., W., M. R. and Kaufmann, M. G. 2003. The effect of an industrial efluent on an urban
stream benthic communigy: water quality vs. habitat quality. Environmental Pollution 123: 1-13. Neilsen, M. 2002. Lowland stream restoration in Denmark: Background and examples. Journal of the
chartered institution of water and environmental management 16: 189-193. Nienhuis, P. H., Buijse, A. D., Leuven, R. S. E. W., Smits, A. J. M., de Nooij, R. J. W. and Samborska, E.
M. 2002. Ecological rehabilitation of the lowland basin of the river Rhine (NW Europe). Hydrobiologia 478: 53-72.
Nilsson, C. and Svedmark, M. 2002. Basic Principles and Ecological Consequences of Changing Water
Regimes: Riparian Plant Communities. Environmental Management 30: 468-480. Osborne, L. L., Bayley, P. B., Higler, L. W. G., Statzner, B., Triska, F. and Iversen, T. 1993. Restoration
of Lowland Streams - an introduction. Freshwater Biology 29: 187-194. Pedroli, B., de Blust, G., van Looy, K. and van Rooij, S. 2002. Setting targets in strategies for river
restoration. Landscape Ecology 17 (Suppl.1): 5-18. Pereira, J. M. C. and Duckstein, L. 1993. A multiple criteria decision-making approach to GIS-based land
suitability evaluation. International Journal of Geographic Information Systems 7: 407-424. Peter, A., Kienast, F. and Nutter, S. 2003. The Rhone-Thur River project: a comprehensive river
rehabilitation project in Switzerland. (subm.). Petts, G. and Calow, P. 1996. River Restoration. Blackwell Science Ltd, Oxford, 231 pp. Pinder, L. C. V. 1997. Research on the Great Ouse: Overview and implications for management.
Regulated Rivers-research and management 13: 309-315. Poff, N. L. 1997. Landscape filters and species traits:towards mechanistic understanding and prediction in
stream ecology. Journal of the North American Benthological Society 16: 391-409. Pretty, J. L., Harrison, S. S. C., Shepherd, D. J., Smith, C., Hildrew, A. G. and Hey, R. D. 2003. River
rehabilitation and fish populaitons: assessing the benefit of instream structures. Journal of Applied Ecology 40: 251-265.
Pro Natura. 2000. Fliessgewässer. Studie von LINK Institut. Ray, N., Lehmann, A. and Joly, P. 2002. Modeling spatial distribution of amphibian populations: a GIS
approach based on habitat matrix permeability. Biodiversity and Conservation 11: 2143-2165. Rohde, S., Schütz, M., Kienast, F. and Englmaier, P. 2003. River widenings: a promising approach to re-
establish riparian habitats and species? Regulated Rivers Research and Applications under review.
Roy, B., Présent, M. and Silhol, D. 1986. A programming method for determining which Paris metro
stations should be renovated. European Journal of Operational Research 24: 318-334. Sadek, S., Bedran, M. and Kaysi, I. 1999. GIS platform for multicriteria evaluation of rout alignments.
Journa of transportation engineering-ASCE 125: 144-151.
112 Paper III
Santoul, F. 2002. The waterbirds of gravel pits in the Garonne river floodplain. Carrying capacity and
management plan of Saint-Caprais and Lavernose-Lacasse gravel pits. Bulletin de la Societe Zoologique de France 127: 371-374.
Schneider, K., Walter, T. and Umbricht, M. 2003. AUA - Datenbank zur Fauna in Auen. Eidgenössischen
Forschungsanstalt für Agrarökologie und Landbau (FAL). Sidle, J. G. and Kirsch, E. M. 1993. Least tern and piping plover nesting at sand pits in Nebraska.
Colonial Waterbirds 16: 139-148. Store, R. and Kangas, J. 2001. Integrating spatial multi-criteria evaluation and expert knowledge for GIS-
based habitat suitability modeling. Landscape and urban planning 55: 79-93. Truffer, B., Bratrich, C., Markard, J., Peter, A., Wuest, A. and Wehrli, B. 2003. Green Hydropower: The
contribution of aquatic science research to the promotion of sustainable electricity. Aquatic Sciences 65: 99-110.
van der Nat, D., Tockner, K., Edwards, P. J., Ward, J. V. and Gurnell, A. M. 2003. Habitat change in
braided flood plains (Tagliamento, NE-Italy). Freshwater Biology 48: 1799-1812. VAW, V. f. W., Hydrologie und Glaziologie der Eidgen. Techn. Hochschule Zürich. 1993. Strada.
Flussmorphologisches Gutachten zur geplanten Innrevitalisierung im Zusammenhang mit der Umfahrungsstrasse Strada.
Villa, F., Tunesi, L. and Agardy, T. 2002. Zoning Marine Protected Areas through Spatial Multiple-
Criteria Analysis: the Case of the Asinara Island National Marine Reserve of Italy. Conservation Biology 16: 515-526.
von Winterfeldt, D. and Edwards, W. 1986. Decision analysis and behavioral research. Cambridge
University Press, Cambridge. Walser, C. A. and Bart, H. L. 1999. Influence of agriculture on in-stream habitat and fish community
structure in Piedmont watersheds of the Chattahoochee River System. Ecology of freshwater fisch 8: 237-246.
Ward, J. V. 1998. Riverine landscapes: biodiversity patterns, disturbance regimes, and aquatic
conservation. Biological Conservation 83: 269-278. Ward, J. V., Tockner, K., Arscott, D. B. and Claret, C. 2002. Riverine landscape diversity. Freshwater
Biology 47: 517-539. Webb, N. R. 1997: The development of criteria for ecological restoration. in Urbanska, K. M., Webb, N.
R. and Edwards, P. J. (eds.) Restoration Ecology and Suistainable development, Cambridge University Press.
Wohlgemuth, T., Boschi, K. and Longatti, P. 1999. Swiss Web Flora. WSL.
Synthesis and final remarks 113
Synthesis and final remarks
Restoration: an iterative and integrative process
Progress in the restoration of riparian landscapes can only be achieved through an
iterative process that integrates input from a wide range of disciplines (ecology,
hydrology, geomorphology, sociology and economics) and that is based on the
interaction between theory and practice.
Each restoration project constitutes an experiment in the “landscape laboratory”.
Lessons learned from the success and failure of these experiments will advance the
science of river restoration. These experiments allow to understand the underlying
ecological and socio-economic principles and processes that drive restoration and to
refine theoretical concepts in restoration ecology and planning processes. The shared
knowledge gained from research and application in the field also helps to develop
methods to reverse or ameliorate river degradation and to improve existing restoration
measures. Thus, a dialogue between research community and practitioners is necessary
to ensure that the knowledge thus obtained is applicable and meets the requirements of
restoration practice in the field.
Assessment scheme and indicators
Monitoring and post-project evaluation are essential for adapting the knowledge gained
from success and failure to future projects. When assessing a restoration project, two
main questions arise: “Which attributes should we measure?” and “How do we measure
the temporal development of these attributes?”.
River ecosystems are very complex, including physical and chemical processes over a
wide range of spatial and temporal scales and numerous variables and interactions,
which may obscure many cause-and-effect relationships. Therefore, a combined set of
attributes, namely, structure, function and composition, to be applied at different
114 Synthesis and final remarks hierarchical levels (landscape, species and processes), should be monitored over a long
time period.
My analyses show that landscape metrics and selected species are valuable indicators
for monitoring and evaluating the performance of a restoration project (paper 2).
Investigations on the basis of functional groups (e.g. dispersal strategies, competition,
etc.) would yield additional information.
However, assessment needs to be embedded in a value system that serves as reference.
Such a reference system should consist of the status before restoration took place and a
desired system status, for example, a known near-natural area (papers 1 and 2). The
measurement itself can be done on the basis of similarity indices (paper 2). An
alternative is to assess restoration performance relative to the range of natural
variability. In this context the presented “stencil technique” has proofed to be a fruitful
approach for comparing landscapes of different sizes on the basis of landscape metrics
(paper 1). For highly dynamic ecosystems, such as riparian landscapes, “natural
variability” (in time and in space) is an aspect that deserves greater attention.
Potential and limitations of re-establishing riparian landscapes
The canalization of the rivers is a major cause of the loss of riparian habitats and their
associated biodiversity. Removing the confining “corset” of dikes and groins is very
important in restoring these habitats, as space (“room for rivers”) is a pre-requisite for
bringing back near-natural processes, habitats and species. This study shows that river
widenings allow the re-establishment of some aspects of riparian landscapes, such as the
early successional stages of a riparian habitat (e.g. gravel bars) or some riparian species
(papers 1 and 2). However, re-establishing riparian landscapes does not solely depend
on the space provided (local decisions), but also on catchment-related decisions, such as
residual flow or sediment management and land use.
The stochastic nature of flood events and sediment transportation, which are the two
major driving forces in the riparian ecosystem, means that the outcome of a particular
Synthesis and final remarks 115 restoration measure may differ when carried out at different locations or at different
times. Thus the transferability of the results from this study is limited. However, the
presented results may serve as a baseline indicating what potentially could take place
when rivers are widened within a limited area.
Additionally, a discussion of the potential and limitations of restoration measures
should not neglect the fact that there is no guarantee that restoration will not have
adverse side-effects and the possibility that restoration may have an impact well beyond
the restored reach of a river. Examples include an increased risk of flooding due to
increased sedimentation up-stream of the river widening, increased risk of clogging at
the contraction zone downstream of the widening or a risk of contamination due to
spilling of pollutants from former waste dumps.
Recommendations for future restoration projects
Sustainable restoration requires a reinstatement of unaffected fluvial processes, such as
natural water and sediment fluxes. This is more difficult than “creating” river widenings
with islands and bars or pool-riffle sequences. Restoring these key processes means less
management will be required to maintain the desired channel structures and habitats.
Otherwise regular measures (e.g. sediment excavation) will be needed to mimic natural
processes.
The success and performance of a restoration project depend on decisions taken at the
local level as well as on the catchment scale. Thus restoration should be undertaken
considering a wide spatial context to account for the degree of longitudinal, lateral and
vertical connectivity in a river system (catchment approach). By linking a range of
different initiatives and schemes within a particular catchment (e.g. residual flow
management, flood defense and agri-environment schemes) it may be possible to restore
not just the reach, but the whole catchment.
River and floodplain restoration (usually this should be described more properly as
rehabilitation – see General introduction) is the return of a degraded stream ecosystem
116 Synthesis and final remarks to a close approximation of its remaining natural potential. It is therefore necessary to
know which ecological deficiencies occur in a river system and to which degree these
are reversible, if at all. Reversibility of human influences (e.g. by water abstraction,
sediment excavation and land-use change) may prove impossible or may not be
desirable economically or socially. Quantifying and recognizing both the ecological
limitations on restoration and the socio-economic barriers to its implementation (=
remaining natural and “socio-economic” restoration potential) helps to prevent
disillusionment and to locate restoration measures where they are least likely to be
undermined by unfavourable environmental conditions. Hence, such a procedure allows
(i) a vision suitable for the river within its present and future environmental framework
to be formulated, and (ii) those environmental conditions to be identified that need to be
improved to meet ecological needs, e.g. residual flow management (paper 3).
(River) restoration should not take place detached from society, as any environmental
planning affects people and what those people value. A planning procedure which
includes all sectors of society in decision-making (stakeholder involvement) provides
transparency and helps to ensure public support and accountability. Therefore, a
strategic and pro-active planning concept is essential when “real-world” restoration is
going to advance (paper 3).
Further research
Restoration ecology and river restoration are fairly young disciplines. Thus many
aspects still remain to be investigated. The following suggestions give an idea of what
further research is needed to advance the science of restoration.
Although it is generally acknowledged (in terms of restoration) that “bigger is better”,
we do not know “how large a restored floodplain needs to be?”. Research in
geomorphology gained experience in calculating the minimum channel width to allow
for alternating bars or braiding (e.g. Hunzinger 1998, Yalin and da Silva 2001) and in
calculating the oscillation width of a river, which is approximately 5-6 times the channel
width (BWG 2001). However, the channel width for braiding is too tight for the whole
Synthesis and final remarks 117 range of riparian habitat types (including woodlands) to be re-established. Morever, the
natural oscillation width seems to be unrealistic in most cases. Therefore, research on
the ecological minimum width for river widenings is needed. However, research should
also include investigations of the ecological minimum length of river widenings. I
propose for a start as the ecological minimum requirements for river widenings that the
width should be three times the channel width based on the findings of Hunzinger
(1998) and the length of three riffle-pool sequences. However, this suggestion is based
on observations during fieldwork and needs to be verified in a detailed and broad study.
Future research on the required minimum size of river widenings should focus on the
formulation of minimum standards taking into consideration environmental parameters,
such as flow, slope and grain size, instead of definite, absolute numbers.
Further research needs to be done to assess the outcome of restoration measures and the
conditions under which they were conducted. This should be comprehensive and
include habitats, species and food webs as well as chemical and physical processes.
Additionally, more research is required on the postulated relationship between
landscape composition/configuration and processes and biocoenosis. This is especially
important when using landscape metrics as indicators for success and failure. A major
question which still needs to be answered is “what change in the numerical value of a
single metric is ecologically relevant?”.
Overall conclusion The restoration of riparian landscapes is possible to a limited degree, given enough space
and the reinstatement of natural processes (hydro-/morphodynamics). Restoration will
improve if it moves away from a species-focused to a process- and catchment-focused
approach, because “Managing a river to maintain minimum water flow or sustain a single
‘important species’ is like teaching pet tricks to a wolf: The animal may perform, but it is
not much of a wolf anymore” (www.crcwater.orgissues3/rivermanagment.html).
118 Synthesis and final remarks Otherwise restoration runs the risk of “being seen as a sort of gardening with wild species
in natural mosaics”, as Allen & Hoekstra (1992) commented.
Concluding that river widenings have the potential to re-establish riparian landscapes
and species does not imply that it is general feasible to re-create nature and does not
deny the important need to conserve near-natural areas. Indeed, my results reveal the
limitations of “human-made nature”. Furthermore, (near-) natural ecosystems provide a
skeleton on which restoration activities are built, as they are sources for (i) research on
natural fluvial processes and (ii) species re-colonization. However, “human-made
nature” (e.g. river widenings) is a valuable measure to reduce the pressure upon near-
natural areas caused by people seeking recreation. Increased opportunities for recreation
are one of the socio-economic values generated by river widenings. Surveying and
publication of the social benefits provided by river widenings and stakeholder
involvement will increase public accountability and support for future river widening
projects.
Going back to the origins of the term “landscape” we see that it is derived from the
landscape phrase of “shaping land”. The recent change in public attitudes towards river
management means that it should be possible to provide room for rivers and to shape
rivers in such way that they are no longer “straight river channels” but rather future
“riverscapes”.
Literature cited Allen, T. H. F. and Hoekstra, T. W. 1992. Toward a unified ecology. Columbia University Press, New
York, 384 pp. BWG. 2001. Hochwasserschutz an Fliessgewässern. Wegleitung. Bundesamt für Wasser und Geologie,
Biel. Hunzinger, L. M. 1998. Flussaufweitungen - Morphologie, Geschiebehaushalt und Grundsätze zur
Bemessung. Vol. 159, VAW Mitteilungen, Versuchsanstalt für Wasserbau, Hydrologie und Glaziologie der ETH Zürich, Zürich.
Yalin, M. S. and da Silva, A. M. F. 2001. Fluvial Processes. IAHR International Association of Hydraulic Engineering and Research, Kingston.
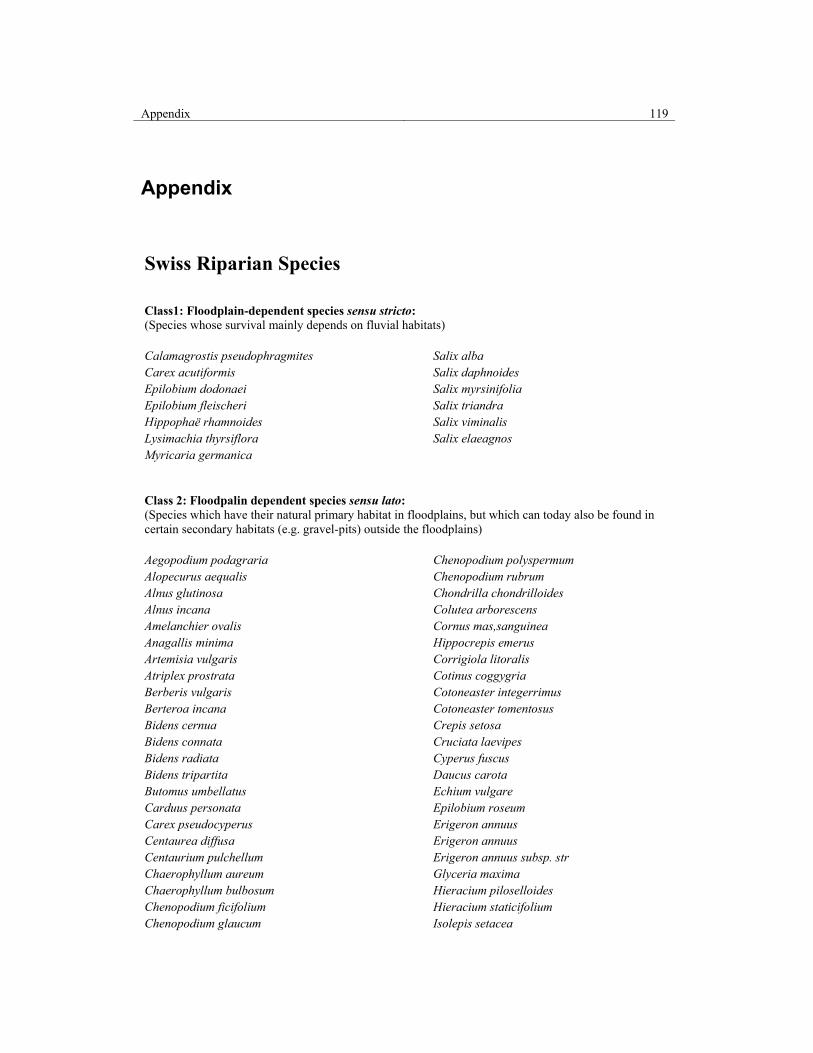
Appendix 119
Appendix
Swiss Riparian Species Class1: Floodplain-dependent species sensu stricto: (Species whose survival mainly depends on fluvial habitats) Calamagrostis pseudophragmites Carex acutiformis Epilobium dodonaei Epilobium fleischeri Hippophaë rhamnoides Lysimachia thyrsiflora Myricaria germanica
Salix alba Salix daphnoides Salix myrsinifolia Salix triandra Salix viminalis Salix elaeagnos
Class 2: Floodpalin dependent species sensu lato: (Species which have their natural primary habitat in floodplains, but which can today also be found in certain secondary habitats (e.g. gravel-pits) outside the floodplains) Aegopodium podagraria Alopecurus aequalis Alnus glutinosa Alnus incana Amelanchier ovalis Anagallis minima Artemisia vulgaris Atriplex prostrata Berberis vulgaris Berteroa incana Bidens cernua Bidens connata Bidens radiata Bidens tripartita Butomus umbellatus Carduus personata Carex pseudocyperus Centaurea diffusa Centaurium pulchellum Chaerophyllum aureum Chaerophyllum bulbosum Chenopodium ficifolium Chenopodium glaucum
Chenopodium polyspermum Chenopodium rubrum Chondrilla chondrilloides Colutea arborescens Cornus mas,sanguinea Hippocrepis emerus Corrigiola litoralis Cotinus coggygria Cotoneaster integerrimus Cotoneaster tomentosus Crepis setosa Cruciata laevipes Cyperus fuscus Daucus carota Echium vulgare Epilobium roseum Erigeron annuus Erigeron annuus Erigeron annuus subsp. str Glyceria maxima Hieracium piloselloides Hieracium staticifolium Isolepis setacea

120 Appendix Class 2: Floodpalin dependent species sensu lato (cont.) (Species which have their natural primary habitat in floodplains, but which can today also be found in certain secondary habitats (e.g. gravel-pits) outside the floodplains)
Juncus bufonius Juncus capitatus Juncus tenageia Lamium maculatum Linaria vulgaris Lythrum portula Melilotus albus Melilotus altissimus Melilotus officinalis Montia fontana subsp. chon Myosotis cespitosa Cotoneaster tomentosus Crepis setosa Cruciata laevipes Cyperus fuscus Daucus carota Echium vulgare Epilobium roseum Erigeron annuus Erigeron annuus Erigeron annuus subsp. str Glyceria maxima Hieracium piloselloides Hieracium staticifolium Isolepis setacea Juncus bufonius Juncus capitatus Juncus tenageia Lamium maculatum Linaria vulgaris Lythrum portula Melilotus albus Melilotus altissimus Melilotus officinalis Montia fontana subsp. chon Myosotis cespitosa Oenothera biennis
Oenothera glazioviana Oenothera parviflora Petasites hybridus Phalaris arundinacea Phragmites australis Picris hieracioides Polygonum hydropiper Polygonum lapathifolium s. Polygonum lapathifolium su Polygonum minus Prunus mahaleb Ranunculus sceleratus Reseda luteola Rhamnus alpina Riccia glauca Rorippa amphibia Rosa micrantha Rosa villosa Rumex aquaticus Salix fragilis Salix purpurea Salix x rubens Sambucus ebulus Schoenoplectus lacustris Scrophularia canina Sium latifolium Sparganium emersum Sparganium erectum Sparganium erectum Tanacetum vulgare Tragopogon dubius Typha angustifolia Typha latifolia Viburnum lantana Barbarea vulgaris Equisetum hyemale Humulus lupulus
Appendix 121 Class 3: Additional characteristic species
(Species which typically occur in floodplains (except those normally found in intensively managed grasslands), but which do not depend on riparian habitats)
Achillea millefolium Agropyron repens Agropyron repens Agrostis gigantea Agrostis rupestris Agrostis stolonifera Alchemilla vulgaris Alliaria petiolata Alopecurus geniculatus Amaranthus blitum Amaranthus caudatus Amaranthus retroflexus Angelica sylvestris Anthriscus sylvestris Anthyllis vulneraria Arabis alpina Arctium tomentosum Arenaria serpyllifolia aggr. Artemisia campestris Astragalus alpinus Atriplex patula Bidens frondosa Brachypodium pinnatum Brachypodium sylvaticum Brassica oleracea Calamagrostis epigejos Calamagrostis varia Caltha palustris Calystegia sepium Campanula cochleariifolia Capsella bursa-pastoris Cardamine amara Cardamine hirsuta Cardamine pratensis Cardamine resedifolia Carduus acanthoides Carduus defloratus Carex acuta Carex alba Carex ornithopoda Carex vesicaria Carex vulpina Cerastium arvense Chaenorrhinum minus
Chaerophyllum hirsutum Chelidonium majus Chenopodium album Chenopodium bonus-henricus Cirsium arvense Cirsium oleraceum Cirsium vulgare Clematis vitalba Conyza canadensis Cornus sanguinea Corylus avellana Crataegus laevigata Crataegus monogyna Crepis capillaris Deschampsia cespitosa Digitaria sanguinalis Echinochloa crus-galli Epilobium hirsutum Equisetum arvense Equisetum fluviatile Equisetum ramosissimum Erigeron acer Erucastrum gallicum Erucastrum nasturtiifolium Erysimum cheiranthoides Euonymus europaeus Euphorbia cyparissias Euphorbia peplus Euphrasia salisburgensis Eurhynchium striatum Fallopia convolvulus Festuca arundinacea Festuca gigantea Festuca rubra aggr. Festuca rupicola Filipendula ulmaria Fragaria vesca Frangula alnus Fraxinus excelsior Galeopsis tetrahit Galium aparine Galium palustre Geranium pyrenaicum Geranium robertianum

122 Appendix Class 3: Additional characteristic species (cont.)
(Species which typically occur in floodplains (except those normally found in intensively managed grasslands), but which do not depend on riparian habitats) Geum rivale Geum urbanum Glechoma hederacea Glyceria fluitans Gypsophila repens Helianthus annuus Heracleum sphondylium Hieracium intybaceum Hylocomium splendens Hypericum perforatum Hypnum cupressiforme Impatiens noli-tangere Impatiens parviflora Iris pseudacorus Isatis tinctoria Juniperus communis . Lactuca serriola Lamium album Lamium purpureum Leontodon hispidus . Leontodon hispidus Lepidium campestre Leucanthemopsis alpina Ligustrum vulgare Plantago major Linaria alpina Lonicera xylosteum Lotus corniculatus Lycopersicon esculentum Lysimachia nummularia Lysimachia vulgaris Lythrum salicaria Malva neglecta Matricaria recutita Medicago lupulina Melica nutans Mentha aquatica Mentha longifolia Myosotis arvensis Myosotis scorpioides Myosoton aquaticum Nasturtium officinale Origanum vulgare Oxalis fontana
Oxytropis campestris . Papaver rhoeas Pastinaca sativa . Petasites paradoxus Picea abies Pinus sylvestris Plagiomnium undulatum Plantago major subsp. intermedia Poa alpina Poa angustifolia Poa annua aggr. Poa compressa Poa glauca Poa palustris Polygonum amphibium Polygonum aviculare Polygonum mite Polygonum persicaria Populus nigra . Portulaca oleracea . Potentilla anserina Prunus avium Prunus padus . Prunus spinosa Quercus petraea Quercus pubescens Quercus robur Racomitrium canescens Ranunculus lingua Raphanus raphanistrum Reseda lutea Rhamnus cathartica Rhytidiadelphus triquetrus Rorippa x Rorippa islandica Rorippa sylvestris Rosa canina Rubus caesius Rumex acetosa Rumex crispus Rumex maritimus Rumex scutatus Sagina saginoides Salix appendiculata

Appendix 123 Class 3: Additional characteristic species (cont.)
(Species which typically occur in floodplains (except those normally found in intensively managed grasslands), but which do not depend on riparian habitats) Sambucus nigra Sanguisorba minor . Saponaria ocymoides Saponaria officinalis Saxifraga aizoides Saxifraga bryoides Saxifraga oppositifolia Scrophularia nodosa Scrophularia umbrosa Sempervivum arachnoideum Senecio vulgaris Setaria pumila Setaria viridis Silene dioica Silene pratensis Silene vulgaris . Sinapis arvensis Sisymbrium officinale Solanum dulcamara Solanum nigrum Solidago gigantea Sonchus asper Sonchus oleraceus Sorbus aria Stachys sylvatica Stellaria media
Stereocaulon alpinum Symphytum officinale Teucrium chamaedrys Thuidium tamariscinum Thymus praecox . Thymus serpyllum aggr. Tortella tortuosa Trifolium pallescens Trifolium saxatile Tripleurospermum perforatum Tussilago farfara Urtica dioica Valeriana montana Valeriana officinalis Verbascum densiflorum Verbascum nigrum Verbascum phlomoides Verbascum thapsus . Veronica anagallis-aquatica Veronica beccabunga Veronica bellidioides Veronica chamaedrys Veronica persica Vicia cracca . Viola tricolor

124 Appendix

Acknowledgements 125
Acknowledgements
First I would like to express my gratitude to Prof. Dr. Klaus C. Ewald (ETH, advisor)
for the opportunity to carry out this dissertation and for allowing me the freedom to
establish and carry out my own research project.
I am indebted to Ass. Prof. Dr. Peter Englmaier (Uni Wien, co-advisor) for providing
many insights and comments during various discussions in the field and for helping me
to broaden and increase my knowledge and understanding of river ecology and river
restoration.
I am grateful to PD Dr. Felix (WSL, co-advisor) for all his support and advice during
this study. He managed to find the right balance between allowing me freedom and
providing advice when needed. I have enjoyed the stimulating exchange of thoughts and
ideas with him very much and benefited greatly from his critical reading and
constructive comments on the manuscripts.
Many thanks go to Nadine Guthapfel and to Siegrid Herbst for their dedicated field
work and help with data collection.
My friends and collegues at ETH and WSL have created an enjoyable working
atmosphere of mutual support and fruitful discussion. They were always ready to help
me by sharing their ideas, identifying plants, providing equipment, software or
methodological knowledge. I am particularly grateful to Dr. Matthias Bürgi, Christian
Ginzler, Dr. F. Gugerli, Dr. R. Holderegger, Dr. Walter Keller, Dr. Martin Schütz, Dr.
P. Weisberg (now University of Nevada, USA) and Dr. Thomas Wohlgemuth.

126 Acknowledgements I have also benefited from helpful comments and stimulating discussions with the
members of the Rhone-Thur project, especially Dr. G.-R. Bezzola, C. Marti, Dr. A.
Peter and Dr. K. Tockner.
I am grateful to several federal and cantonal authorities for providing me with
information and data, particularly Dr. Marco Baumann (Canton Thurgau) and Dr.
Matthias Oplatka (Canton Zürich) who gave me insights into restoration practices and
requirements in the field.
I am indebted to Jonathan Swale and Silvia Dingwall for improving my English and to
Marc Laverrière for improving my French.
I would also like to thank Urs Brändle for all his support and patience during the last
three years.
Last but not least, I am indebted to my parents, who made my studies of landscape
planning and landscape ecology possible.
Curriculum vitae 127
C U R R I C U L U M V I T A E
Sigrun ROHDE born 21st April, 1972 in Calw, Germany 2001 - 2004 Ph.D. in Environmental Science at Swiss Federal Institute for Forest, Snow and
Landscape Research WSL and ETH Zurich
“River Restoration: potential and limitations to re-establish riparian landscapes (assessment & planning)”
Under the supervision of
Prof. Dr. K.C. Ewald (ETH) Ass. Prof. Dr. P. Englmaier (University of Vienna) PD Dr. F. Kienast (WSL)
2000-2001 Research Scientist and Teaching Assistant, Chair of Nature and Landscape Protection, ETH Zurich
1999-2000 Freelance in Environmental planning working for WWF Germany
1999 Consultant Agency AGROFUTURA, Brugg, Switzerland
1999 MSc Landscape and Open Space Planning
“Options for the cooperation between nature conservation agencies and agriculture to enhance natural heritage”
Under supervision of
Prof. Dr. Chr. V. Haaren, Institute for Landscape Planning and Nature Conservation, University of Hanover, Germany; Dipl. Ing. W. Roggendorf, Institute for Regional Planning and Regional Science, University of Hanover, Germany
1998-1999 Graduate research and teaching assistant, Institute for Landscape Planning and Nature Conservation, University of Hanover, Germany (Prof. Dr. Chr. v. Haaren)
1996-1997 Studies in Environmental Sciences, University of Stirling, Scotland
1994-1996 Graduate research and teaching assistant, Institute for Landscape Planning and Nature Conservation, University of Hanover, Germany (Prof. Dr. H. Kiemstedt)
1992-1999 Studies in Landscape Planning and Open Space Planning, University of Hanover, Germany
1991-1992 Volunteer Conservationist, Garten- u. Friedhofamt Villingen-Schwenningen, Germany