Embed Size (px)
Citation preview
Road Traffic Safety: Situation in Estonia
Margus LepikParliament of Estonia
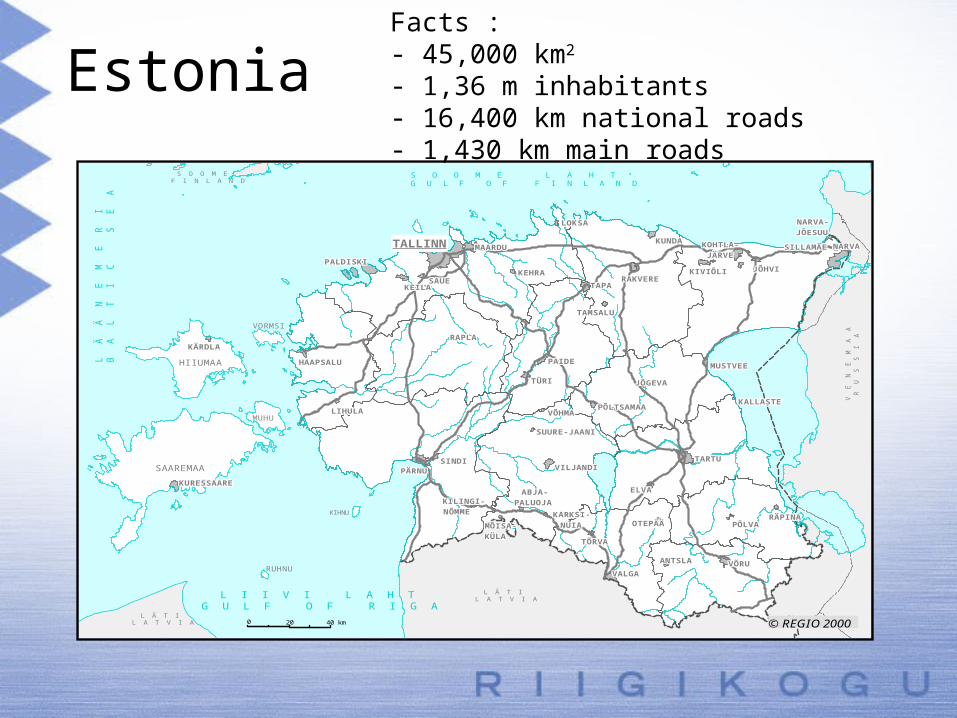
Estonia L
Ä
Ä
N
E
M
E
R
IB
A
L T
I
C
S
E
A
L I I V I L A H TG U L F O F R I G A
S O O M E L A H TG U L F O F F I N L A N D
SILLAMÄESILLAMÄESILLAMÄESILLAMÄESILLAMÄESILLAMÄESILLAMÄESILLAMÄESILLAMÄE NARVANARVANARVANARVANARVANARVANARVANARVANARVA
JÕHVIJÕHVIJÕHVIJÕHVIJÕHVIJÕHVIJÕHVIJÕHVIJÕHVI
NARVA-NARVA-NARVA-NARVA-NARVA-NARVA-NARVA-NARVA-NARVA-JÕESUUJÕESUUJÕESUUJÕESUUJÕESUUJÕESUUJÕESUUJÕESUUJÕESUU
VÕRUVÕRUVÕRUVÕRUVÕRUVÕRUVÕRUVÕRUVÕRU
PÕLVAPÕLVAPÕLVAPÕLVAPÕLVAPÕLVAPÕLVAPÕLVAPÕLVARÄPINARÄPINARÄPINARÄPINARÄPINARÄPINARÄPINARÄPINARÄPINA
KALLASTEKALLASTEKALLASTEKALLASTEKALLASTEKALLASTEKALLASTEKALLASTEKALLASTE
KIVIÕLIKIVIÕLIKIVIÕLIKIVIÕLIKIVIÕLIKIVIÕLIKIVIÕLIKIVIÕLIKIVIÕLI
KOHTLA-KOHTLA-KOHTLA-KOHTLA-KOHTLA-KOHTLA-KOHTLA-KOHTLA-KOHTLA-JÄRVEJÄRVEJÄRVEJÄRVEJÄRVEJÄRVEJÄRVEJÄRVEJÄRVE
TARTUTARTUTARTUTARTUTARTUTARTUTARTUTARTUTARTU
JÕGEVAJÕGEVAJÕGEVAJÕGEVAJÕGEVAJÕGEVAJÕGEVAJÕGEVAJÕGEVA
MUSTVEEMUSTVEEMUSTVEEMUSTVEEMUSTVEEMUSTVEEMUSTVEEMUSTVEEMUSTVEE
RAKVERERAKVERERAKVERERAKVERERAKVERERAKVERERAKVERERAKVERERAKVERE
KUNDAKUNDAKUNDAKUNDAKUNDAKUNDAKUNDAKUNDAKUNDA
ANTSLAANTSLAANTSLAANTSLAANTSLAANTSLAANTSLAANTSLAANTSLA
VALGAVALGAVALGAVALGAVALGAVALGAVALGAVALGAVALGA
ELVAELVAELVAELVAELVAELVAELVAELVAELVA
OTEPÄÄOTEPÄÄOTEPÄÄOTEPÄÄOTEPÄÄOTEPÄÄOTEPÄÄOTEPÄÄOTEPÄÄ
PÕLTSAMAAPÕLTSAMAAPÕLTSAMAAPÕLTSAMAAPÕLTSAMAAPÕLTSAMAAPÕLTSAMAAPÕLTSAMAAPÕLTSAMAA
VILJANDIVILJANDIVILJANDIVILJANDIVILJANDIVILJANDIVILJANDIVILJANDIVILJANDI
TÕRVATÕRVATÕRVATÕRVATÕRVATÕRVATÕRVATÕRVATÕRVA
KARKSI-KARKSI-KARKSI-KARKSI-KARKSI-KARKSI-KARKSI-KARKSI-KARKSI-NUIANUIANUIANUIANUIANUIANUIANUIANUIA
LOKSALOKSALOKSALOKSALOKSALOKSALOKSALOKSALOKSA
PAIDEPAIDEPAIDEPAIDEPAIDEPAIDEPAIDEPAIDEPAIDE
SUURE-JAANISUURE-JAANISUURE-JAANISUURE-JAANISUURE-JAANISUURE-JAANISUURE-JAANISUURE-JAANISUURE-JAANI
TÜRITÜRITÜRITÜRITÜRITÜRITÜRITÜRITÜRI
VÕHMAVÕHMAVÕHMAVÕHMAVÕHMAVÕHMAVÕHMAVÕHMAVÕHMA
TAMSALUTAMSALUTAMSALUTAMSALUTAMSALUTAMSALUTAMSALUTAMSALUTAMSALU
TAPATAPATAPATAPATAPATAPATAPATAPATAPA
KEHRAKEHRAKEHRAKEHRAKEHRAKEHRAKEHRAKEHRAKEHRA
MÕISA-MÕISA-MÕISA-MÕISA-MÕISA-MÕISA-MÕISA-MÕISA-MÕISA-KÜLAKÜLAKÜLAKÜLAKÜLAKÜLAKÜLAKÜLAKÜLA
ABJA-ABJA-ABJA-ABJA-ABJA-ABJA-ABJA-ABJA-ABJA-PALUOJAPALUOJAPALUOJAPALUOJAPALUOJAPALUOJAPALUOJAPALUOJAPALUOJA
MAARDUMAARDUMAARDUMAARDUMAARDUMAARDUMAARDUMAARDUMAARDU
RAPLARAPLARAPLARAPLARAPLARAPLARAPLARAPLARAPLA
PÄRNUPÄRNUPÄRNUPÄRNUPÄRNUPÄRNUPÄRNUPÄRNUPÄRNU
SINDISINDISINDISINDISINDISINDISINDISINDISINDI
KILINGI-KILINGI-KILINGI-KILINGI-KILINGI-KILINGI-KILINGI-KILINGI-KILINGI-NÕMMENÕMMENÕMMENÕMMENÕMMENÕMMENÕMMENÕMMENÕMME
TALLINNTALLINNTALLINNTALLINNTALLINNTALLINNTALLINNTALLINNTALLINN
KEILAKEILAKEILAKEILAKEILAKEILAKEILAKEILAKEILASAUESAUESAUESAUESAUESAUESAUESAUESAUE
HAAPSALUHAAPSALUHAAPSALUHAAPSALUHAAPSALUHAAPSALUHAAPSALUHAAPSALUHAAPSALU
KÄRDLAKÄRDLAKÄRDLAKÄRDLAKÄRDLAKÄRDLAKÄRDLAKÄRDLAKÄRDLA
PALDISKIPALDISKIPALDISKIPALDISKIPALDISKIPALDISKIPALDISKIPALDISKIPALDISKI
KURESSAAREKURESSAAREKURESSAAREKURESSAAREKURESSAAREKURESSAAREKURESSAAREKURESSAAREKURESSAARE
LIHULALIHULALIHULALIHULALIHULALIHULALIHULALIHULALIHULA
40 km0 20
SAAREMAA
L Ä T IL A T V I A
VORMSI
HIIUMAA
MUHU
RUHNU
S O O M EF I N L A N D
KIHNU
L Ä T IL A T V I A
V
E
N
E
M A
A
R
U
S
S
I A
© REGIO 2000
Facts :- 45,000 km2
- 1,36 m inhabitants- 16,400 km national roads- 1,430 km main roads
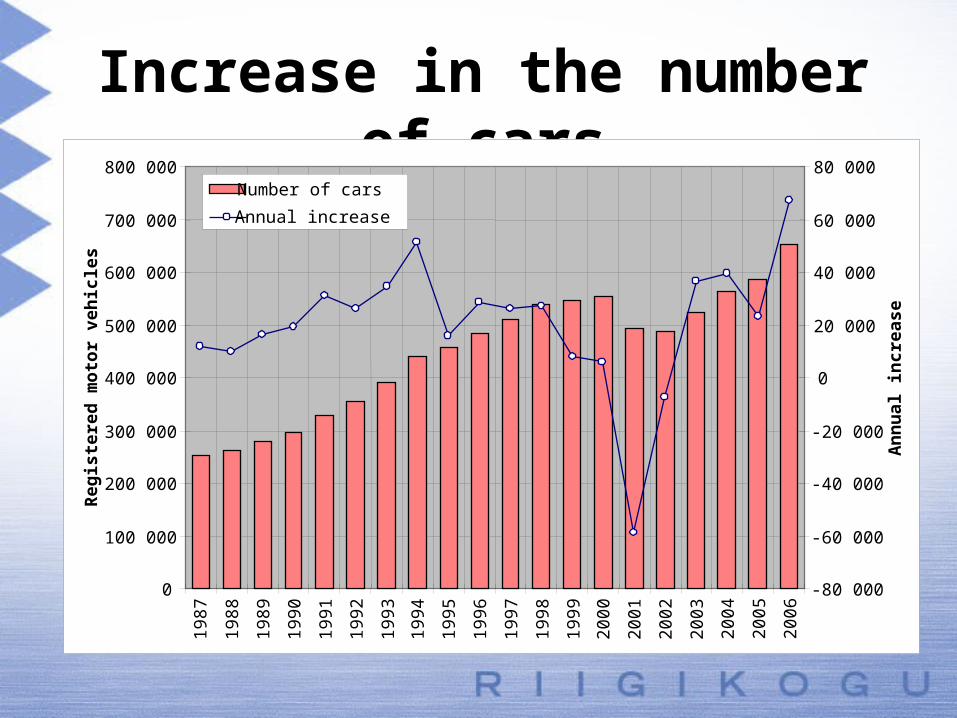
Increase in the number of cars
0
100 000
200 000
300 000
400 000
500 000
600 000
700 000
800 000
1987
1988
1989
1990
1991
1992
1993
1994
1995
1996
1997
1998
1999
2000
2001
2002
2003
2004
2005
2006
Reg
iste
red
mo
tor
veh
icle
s
-80 000
-60 000
-40 000
-20 000
0
20 000
40 000
60 000
80 000
An
nu
al in
crea
se
Number of cars
Annual increase
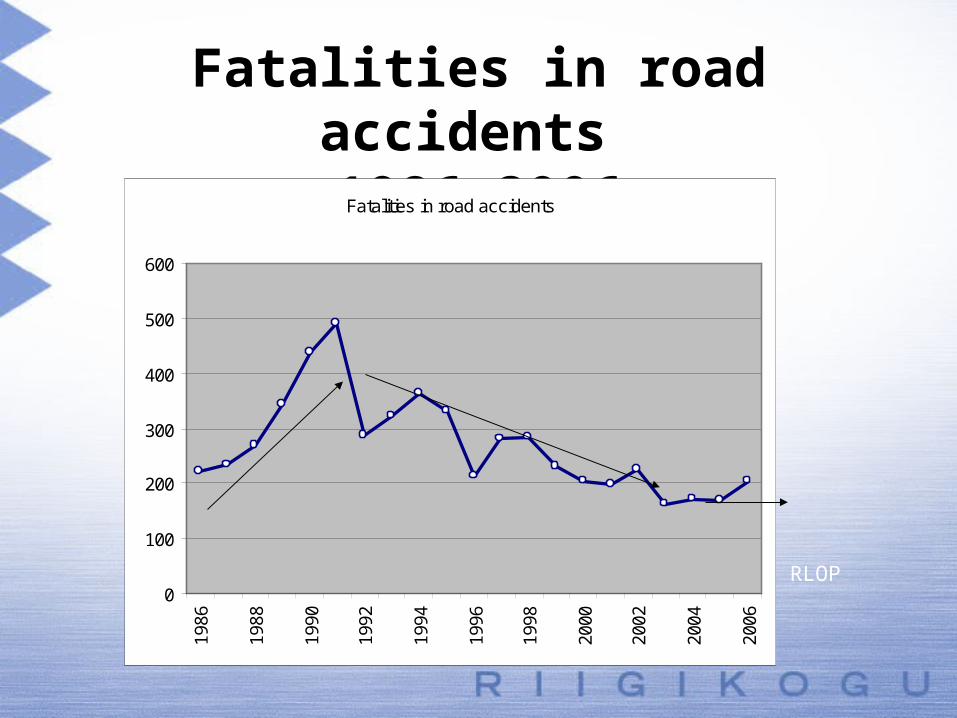
Fatalities in road accidents 1986-2006
H
RLOP
Fatalities in road accidents
0
100
200
300
400
500
600
1986
1988
1990
1992
1994
1996
1998
2000
2002
2004
2006
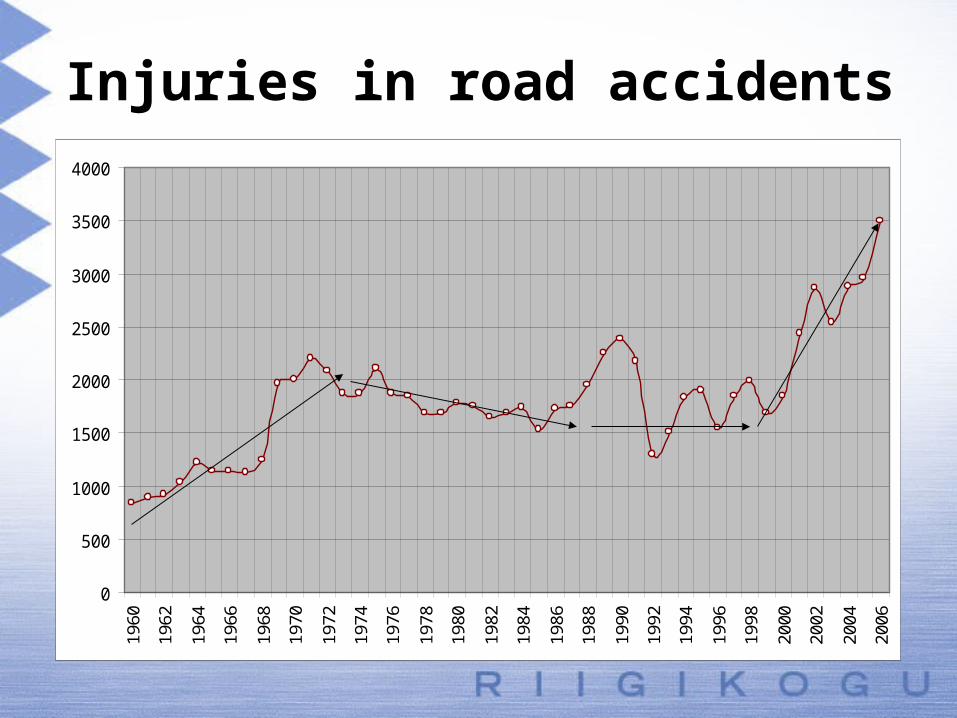
Injuries in road accidents
0
500
1000
1500
2000
2500
3000
3500
4000
1960
1962
1964
1966
1968
1970
1972
1974
1976
1978
1980
1982
1984
1986
1988
1990
1992
1994
1996
1998
2000
2002
2004
2006
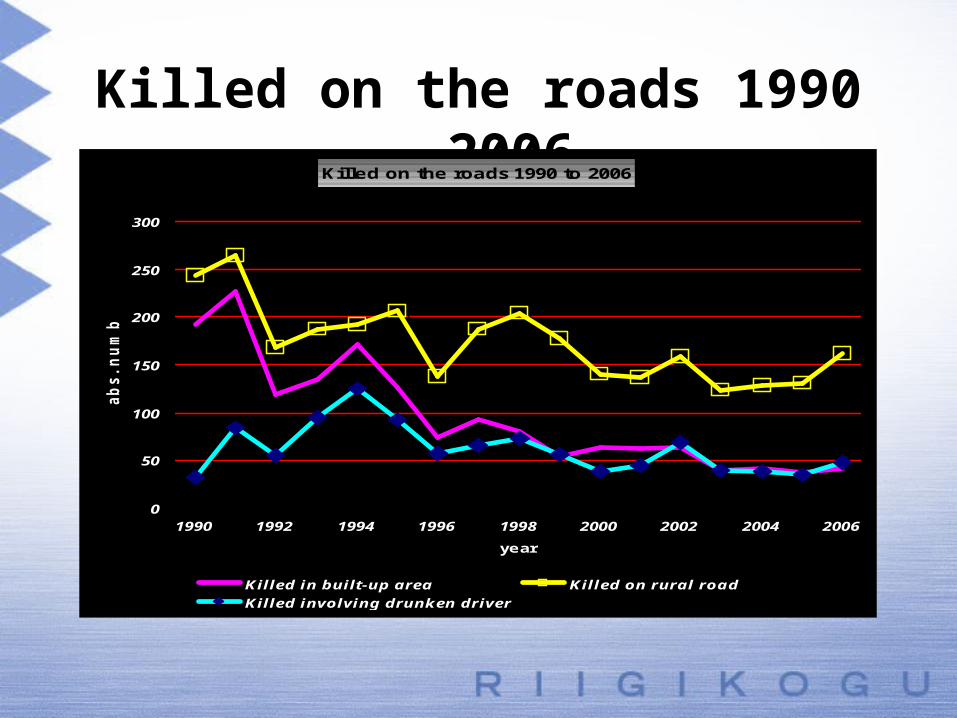
Killed on the roads 1990 - 2006Killed on the roads 1990 to 2006
0
50
100
150
200
250
300
1990 1992 1994 1996 1998 2000 2002 2004 2006
year
ab
s. n
um
ber
Killed in built-up area Killed on rural road
Killed involving drunken driver
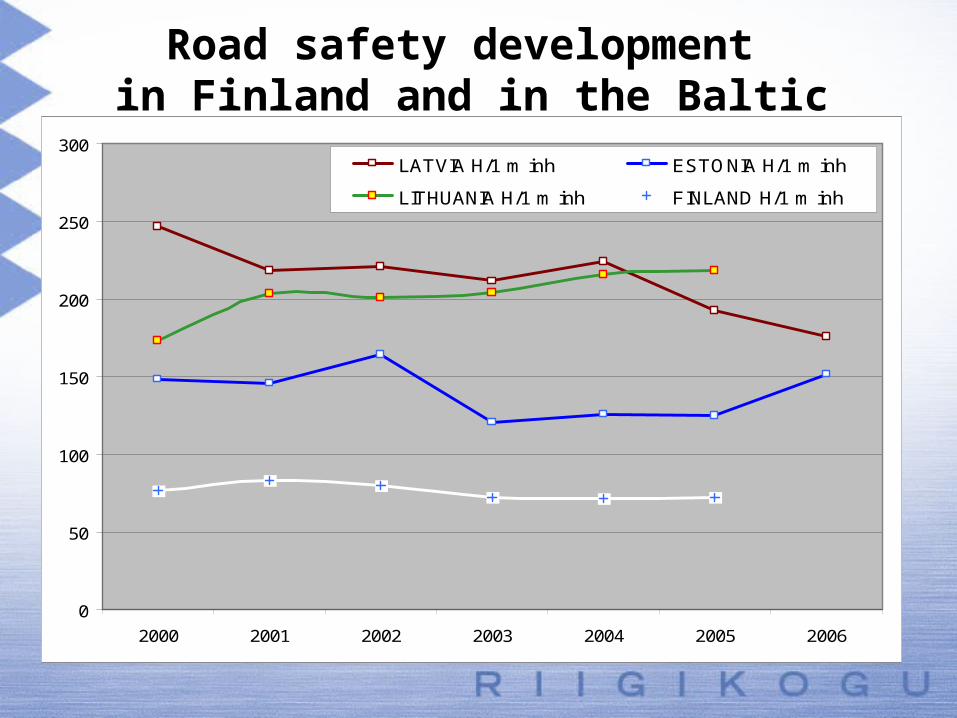
Road safety development in Finland and in the Baltic states
0
50
100
150
200
250
300
2000 2001 2002 2003 2004 2005 2006
LATVIA H/1 m inh ESTONIA H/1 m inh
LITHUANIA H/1 m inh FINLAND H/1 m inh
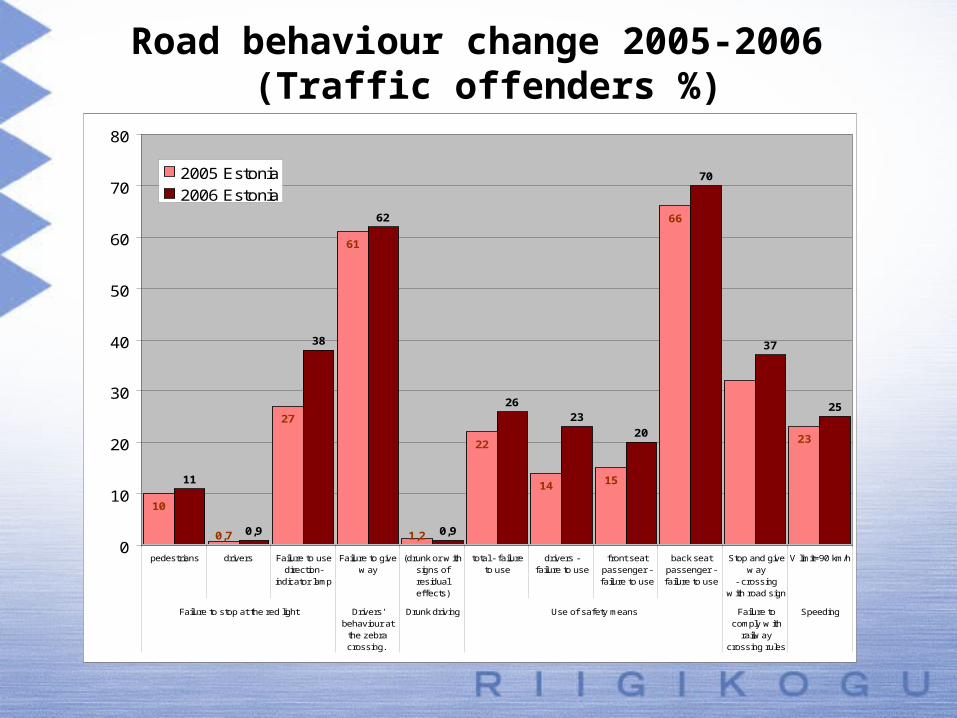
Road behaviour change 2005-2006 (Traffic offenders %)
10
0,7
27
61
1,2
22
14 15
66
23
11
0,9
38
62
0,9
2623
20
70
37
25
0
10
20
30
40
50
60
70
80
pedestrians drivers Failure to usedirection-
indicator lamp
Failure to givew ay
(drunk or w ithsigns ofresidualeffects)
total - failureto use
drivers -failure to use
front seatpassenger -failure to use
back seatpassenger -failure to use
Stop and givew ay
- crossingw ith road sign
V limit=90 km/h
Failure to stop at the red light Drivers'behaviour at
the zebracrossing.
Drunk driving Use of safety means Failure tocomply w ith
railw aycrossing rules
Speeding
2005 Estonia
2006 Estonia
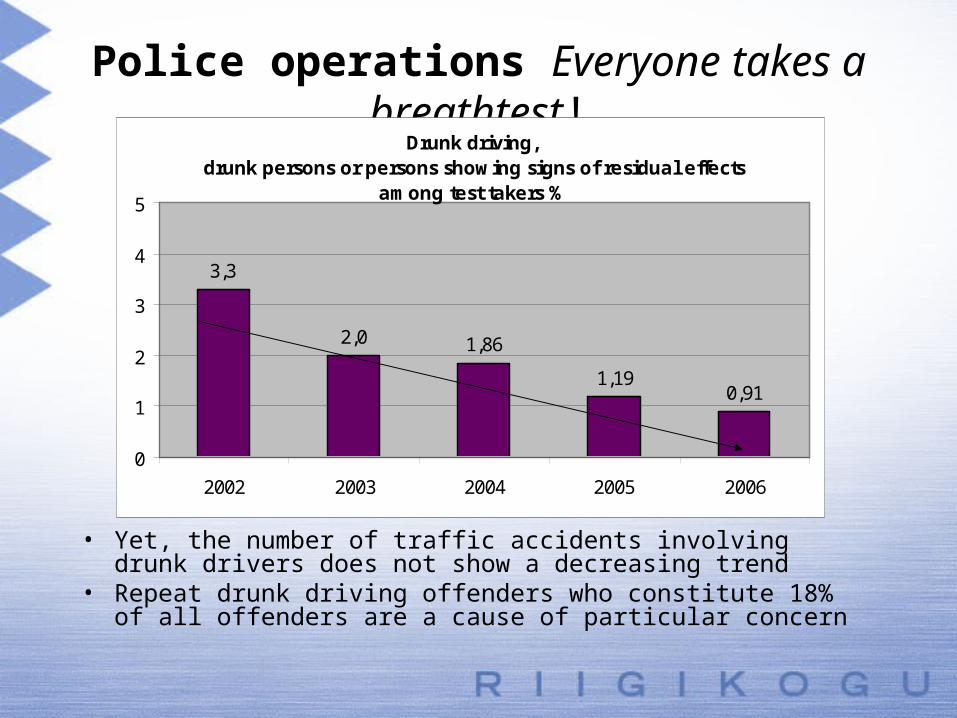
Police operations Everyone takes a breathtest!
• Yet, the number of traffic accidents involving drunk drivers does not show a decreasing trend
• Repeat drunk driving offenders who constitute 18% of all offenders are a cause of particular concern
Drunk driving, drunk persons or persons showing signs of residual effects
among test takers %
3,3
2,0 1,86
1,190,91
0
1
2
3
4
5
2002 2003 2004 2005 2006
Stages of Road Safety Program (RSP)
• First stage • Duration 2003-2006
• General amount of 212.9 mil. EEK (13.6 m€)
– Application of less expensive and quickly applicable measures
• Second stage• Duration 2007 – 2010
• General amount of 279 mil. EEK (17.9 m€)
– Application of measures from the 1st stage and some more expensive measures
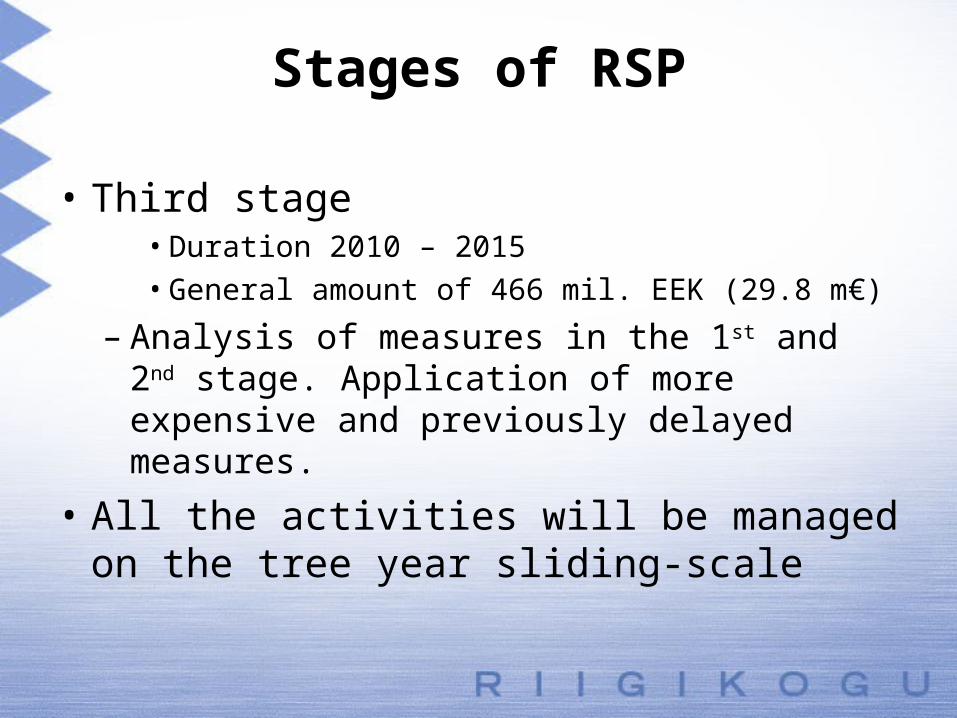
Stages of RSP
• Third stage• Duration 2010 – 2015
• General amount of 466 mil. EEK (29.8 m€)
– Analysis of measures in the 1st and 2nd stage. Application of more expensive and previously delayed measures.
• All the activities will be managed on the tree year sliding-scale
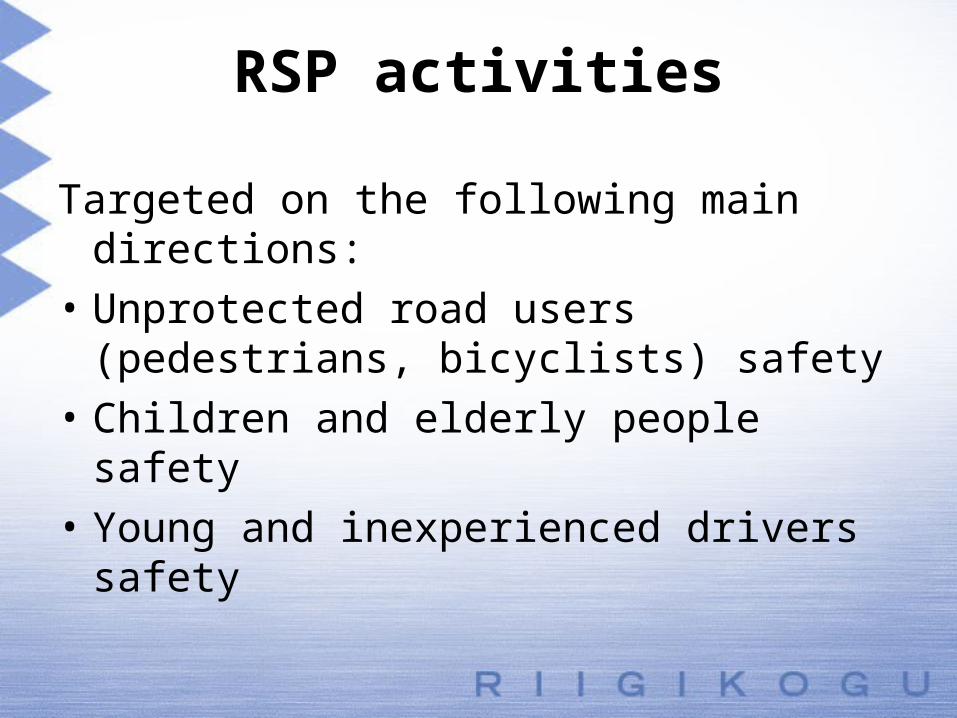
RSP activities
Targeted on the following main directions:
• Unprotected road users (pedestrians, bicyclists) safety
• Children and elderly people safety
• Young and inexperienced drivers safety
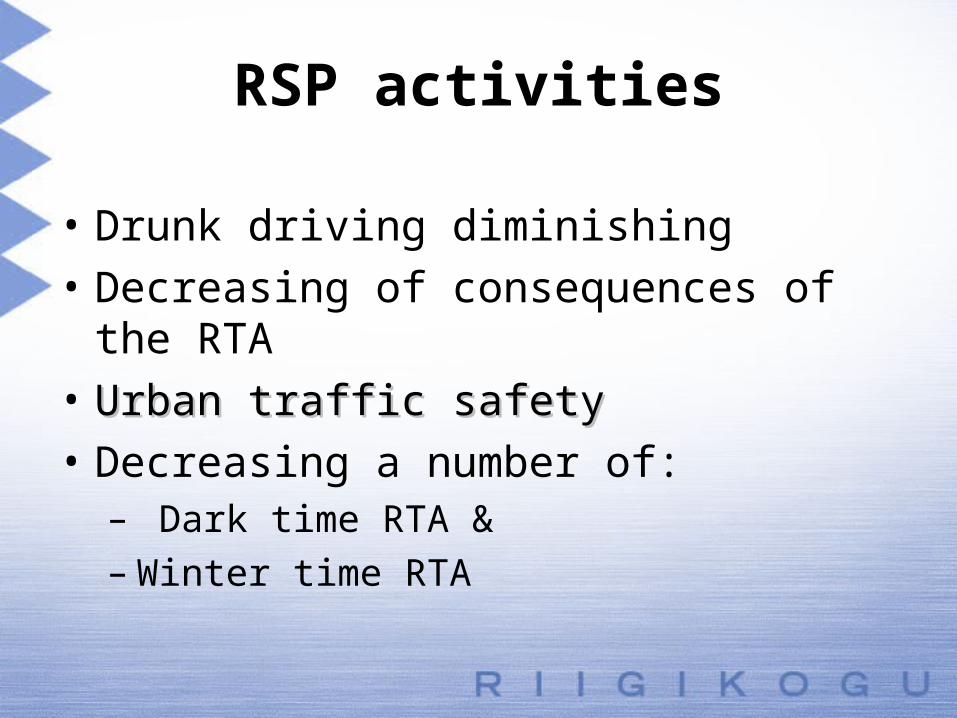
RSP activities
• Drunk driving diminishing
• Decreasing of consequences of the RTA
• Urban traffic safetyUrban traffic safety
• Decreasing a number of:– Dark time RTA &– Winter time RTA
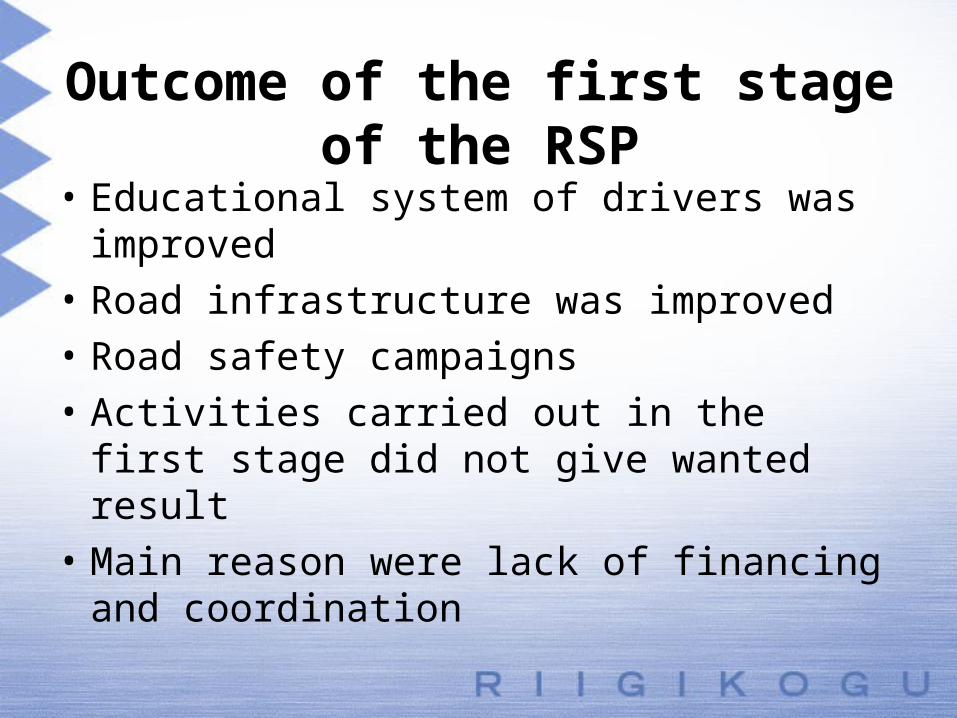
Outcome of the first stage of the RSP
• Educational system of drivers was improved
• Road infrastructure was improved
• Road safety campaigns
• Activities carried out in the first stage did not give wanted result
• Main reason were lack of financing and coordination
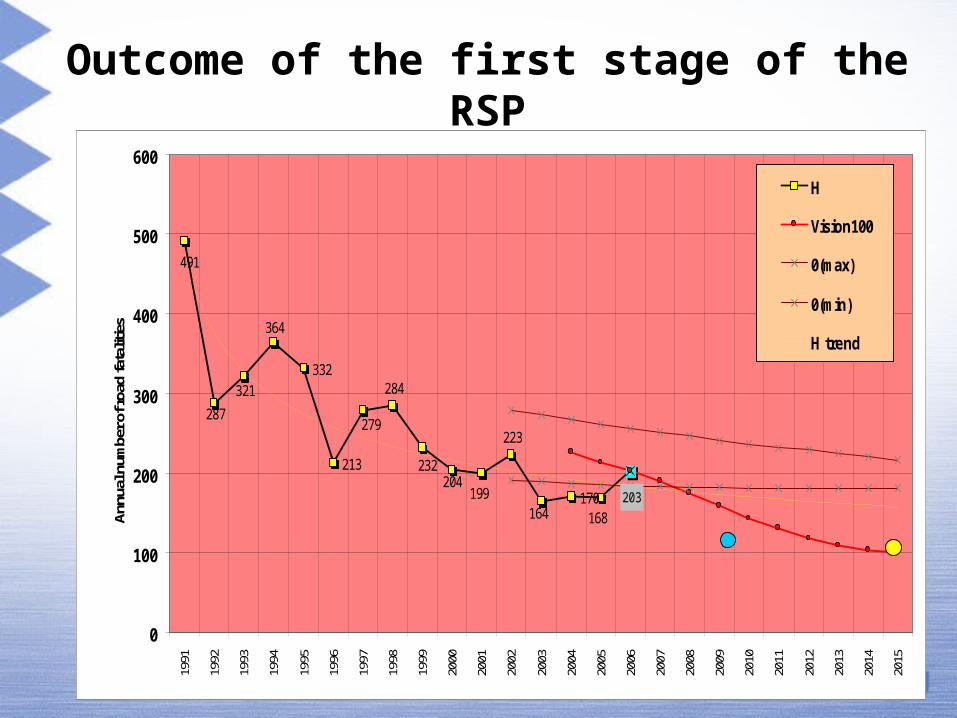
332
213
170 203
168164
223
199
284
232204
279
364
321
287
491
0
100
200
300
400
500
600
1991
1992
1993
1994
1995
1996
1997
1998
1999
2000
2001
2002
2003
2004
2005
2006
2007
2008
2009
2010
2011
2012
2013
2014
2015
Ann
ual n
umbe
r of r
oad
fata
litie
s
H
Vision100
0(max)
0(min)
H trend
Outcome of the first stage of the RSP
Activities in the second stage of the RSP
• Improvement of legislation (Road Traffic Act etc)
• Education and training
• Traffic control
• Traffic campaigns
• Traffic environment
• Supporting measures for road safety
• Coordination
Thank you!
Margus Lepik Member of the Economic Affairs Committee
of the Parliament of Estonia
http://www.riigikogu.ee/