Embed Size (px)
Citation preview
Robeco QI Global Dynamic Duration
Société d’Investissement à Capital Variable
Incorporated under Luxembourg law
RCS B47 779
Semi-Annual Report1 January – 30 June 2017
Robeco QI Global Dynamic Duration 2
Contents
General information 3
Report of the Board of Directors 5
General 5
General introduction 5
Investment results 7
Performance analysis 7
Sustainability investing 8
Other data 11
Financial statements 15
Statement of net assets 15
Number of shares outstanding 16
Notes to the financial statements as at 30 June 2017 17
Exchange rates 28
Investment portfolio 29
Robeco QI Global Dynamic Duration 3
General information
Robeco QI Global Dynamic Duration (hereafter ‘the Company’)
Undertaking for collective investment in transferable securities incorporated as a ‘Société d’Investissement à Capital
Variable’ (SICAV) under Luxembourg law. Register of Companies
RCS Luxembourg B 47 779 Registered Office
Centre Etoile
11/13, Boulevard de la Foire
L-1528 Luxembourg
Grand Duchy of Luxembourg Board of Directors
D.R. (Rob) van Bommel, Managing Director, Robeco, Rotterdam, the Netherlands.
E.J. (Edith) Siermann (until 26-5-2017)
S. (Stefan) Gordijn (until 26-5-2017)
J.H. (Jeroen) van den Akker (since 26-5-2017), Head Operational Risk Management Robeco, Rotterdam, The
Netherlands
H.P. (Pierre) de Knijff (since 26-5-2017), Deputy Director Fund Accounting & Operations Robeco, Rotterdam, The
Netherlands Management Company
Robeco Luxembourg S.A.
Airport center
5, rue Heienhaff (2nd floor)
L-1736 Senningerberg
Grand Duchy of Luxembourg Cabinet de révision agréé (independent auditor)
KPMG Luxembourg, Société coopérative
39, Avenue John F. Kennedy
L-1855 Luxembourg
Grand Duchy of Luxembourg Depositary, Domiciliary and Paying Agent
RBC Investor Services Bank S.A.
14, Porte de France
L-4360 Esch-sur-Alzette
Grand Duchy of Luxembourg Administration Agent and Registrar
Robeco Luxembourg S.A.
Delegated to:
RBC Investor Services Bank S.A.
14, Porte de France
L-4360 Esch-sur-Alzette
Grand Duchy of Luxembourg Investment Adviser
Robeco Luxembourg S.A.
Delegated to:
Robeco Institutional Asset Management B.V. (“RIAM”)
Weena 850, NL-3014 DA Rotterdam, The Netherlands
Robeco QI Global Dynamic Duration 4
Fund Manager
Appointed by RIAM:
Olaf Penninga
Subscriptions and publications
No subscription can be accepted on the basis of financial reports such as this report. Subscriptions may only be
accepted on the basis of the current prospectus, supplemented by the Company’s latest annual report, and in the event
that the Company’s annual report has been published more than eight months previously, its latest semi-annual
report. Financial reports, the prospectus and the Key Investor Information Document are available through the website
www.robeco.com and may be obtained free of charge at the Company’s registered office.
Representative and paying agent in Switzerland
Robeco Switzerland A.G., Josefstrasse 218, CH-8005 Zurich, is the Company’s appointed representative in Switzerland.
Copies of the Key Investor Information Document and prospectus, Articles of incorporation, (semi) annual reports and a
list of all purchases and sales in the investment portfolio during the reporting period are available from the above
address free of charge. UBS Switzerland A.G., Bahnhofstrasse 45, CH-8001 Zurich (Postal address Badenerstrasse 574,
Postfach, CH-8098 Zürich) is the Company’s paying agent in Switzerland.
Information service in Germany
Copies of the articles of incorporation, Key Investor Information Document and prospectus and the annual and
semiannual reports may be obtained free of charge from the offices of the information service in Germany: Robeco
Deutschland, Taunusanlage 17, D-60325 Frankfurt am Main. The prices at which shares are issued and repurchased
are published on www.robeco.de. A list of all purchases and sales in the Company’s investment portfolio during the
reporting period is available at the paying agent/information service in Germany free of charge.
Language versions
This report is also published in German. Only the English edition is binding.
Robeco QI Global Dynamic Duration 5
Report of the Board of Directors
General
Website
Up-to-date information about the fund’s investment policy, performance and investment portfolio can be found on
www.robeco.com/luxembourg. New share classes
Activation of share classes
Share class Effective
class IH JPY shares 19/05/2017
Name change
Following the Extraordinary General Meeting held on 3 March 2017 the name of the fund was changed from Robeco Lux-o-rente
to Robeco QI Global Dynamic Duration. This change is effective from 31 March 2017.
Changes to the prospectus
Some changes (effective March 2017) have been made to the Company's prospectus. A letter to shareholders detailing
these changes is available at the Company’s registered office.
General introduction Economy
The global economy has performed well in the first half of 2017. Gloom has made way for optimism, and there has
been a broad-based increase in economic activity. The consensus is that global growth will ultimately reach 3.5% in
2017. One notable feature is that the momentum in economic activity has been mainly in the developed economies.
The United States posted growth of 2.1% in the first quarter, but underlying there has been a powerful increase in jobs
that has reduced unemployment further to 4.3%. Uncertainty regarding the implications of President Trump’s policy
has not been visible in the improved sentiment among consumers and producers so far. The contrast with the turbulent
year in 2016 in the Eurozone is even sharper, with growth above the historical average in the first six months of 1.9%
and the influential IFO confidence indicator in Germany at its highest level since German unification. Activity has also
picked up in Japan, with growth of 1.3% in the first quarter and a further improvement in producer sentiment in the
second quarter. In China, the economy put on an unexpected spurt and grew by 6.9% in the first quarter, followed by a
more moderate rate of growth. The authorities are benefiting from the continuing growth in the run-up to the
important Chinese party congress in the autumn at which Xi Jinping will attempt to consolidate his power. The Chinese
authorities are, however, still trying to slow the excessive and unsustainably rapid growth of domestic borrowing,
because they are aware of the risks. In Japan the labor market is showing signs of tightness, as is also the case
elsewhere in the G7. The common thread is that despite the tightness of labor markets, wage growth is still clearly
lagging so far. The waning power of the unions, labor-saving technology and the still below average level of labor
productivity are all factors in this unusual development. But economic growth is mainly driven by consumers and to a
lesser extent by an increase in business investment. An increase in consumer spending in an environment of moderate
wage growth suggests that many households are dipping into savings.
At the same time, the broad increase in consumer spending illustrates the return of confidence and the effect of years
of cheap-money policy by the central banks. This has been supported by political developments in the Eurozone. In
France, the newly elected President Macron comfortably saw off the extreme right-wing candidate Le Pen in the
elections on a pro-European and liberal economic manifesto. There are also signs that support for euroskepticism has
waned elsewhere in the Eurozone over the past six months. The investment climate in the Eurozone continues to be
favorable, due to low costs of finance, rising consumer spending, reduced political uncertainty and a reduced risk that
the Eurozone will disintegrate. On the other hand, with its choice of Brexit the United Kingdom has entered a turbulent
period after Prime Minister May lost her majority in the House of Commons after a weak election campaign.
The recovery in oil prices has led to a slight increase in consumer prices in the past six months. But oil prices are still
volatile, and inflation adjusted for energy prices is still historically low despite higher consumer spending. Core inflation
Robeco QI Global Dynamic Duration 6
in the Eurozone is running at 1.2% and is therefore still a long way away from the sustainable, broad-based and self-
reinforcing inflation scenario that the European Central Bank (ECB) would like to see. Core inflation is also still low in
the United States, even though the Federal Reserve (Fed) has raised its policy rate with two increases of a quarter of a
percentage point. The lack of any strong wage growth is preventing a tighter interest-rate policy. It has become clear in
the past period that the boards of central banks are increasingly discussing a gradual reduction in their active support
for the bond markets in the coming years, especially if the current economic situation develops into rising inflation. At a
meeting in Sintra, ECB President Draghi clearly expressed his confidence in a return to inflation figures reflecting the
ECB’s target of ‘inflation close to but below 2%’.
The earnings recession in the United States is clearly over, as evidenced by the double-digit earnings figures reported
for the first quarter. This recovery in underlying business profitability, along with the improved economic outlook, has
provided a powerful boost to stock markets. The MSCI All Country World Index generated a return of 11.5% in US dollar
terms in the first half of 2017. In euros, this amounts to 3.1%, given the strong appreciation of the trade-weighted
euro in this period. This currency effect is partly due to expectations in the currency market that we are approaching the
point at which the ECB will take steps to reverse its extremely accommodative monetary policy in the Eurozone.
Bond markets outlook
The outlook for returns on government bonds could be described as challenging. Economic growth is picking up in
various parts of the world and central banks are increasingly reviewing their extremely accommodative stance in recent
years. Bonds appear to be especially vulnerable in the Eurozone, given the still historically low levels of interest rates.
The ECB is expected to announce that it will be further reducing its supporting purchases later this year. One reason
why a further rise in capital market rates may be limited is the moderate development of inflation. We accordingly
expect that it will still take some considerable time before the ECB raises its official short-term interest rate. Inflation is
still low in the United States as well, despite a steady fall in unemployment. We expect the Fed to raise short-term rates
once more this year and also to make a start on reducing its balance sheet by reducing its reinvestments. This will not
necessarily lead to a further rise in capital market rates in the United States.
Corporate bonds will continue to be supported by the search for yield. The current bond-buying programs of the
European and Japanese central banks are still providing a huge boost to liquidity. The growth of earnings at many
businesses also explains why the corporate bond market is still healthy. Valuations in several sub-markets, however,
look less attractive. For high-yield bonds in particular, the additional interest received is now less convincing in view of
the risk. We are still positive regarding the return outlook for subordinated and other bonds issued by financial
institutions. A scenario of rising capital market rates and steeper yield curves will be good news for the profitability of
banks and insurers. The valuations in this category still look attractive, even after the good performance in the first half
of 2017.
We also see investment opportunities in emerging markets bonds issued in local currency. The interest differential with
developed markets has narrowed, but still offers an attractive spread. The central banks have room to reduce their
official short-term rates now that inflation is falling in many countries, particularly in Latin America. The outlook for
growth in emerging countries is mixed and the continuing build-up of debt in China remains a risk. On the other hand,
this investment category has less to fear from the Fed now that an aggressive tightening policy looks less likely given
the moderate development of inflation.
Robeco QI Global Dynamic Duration 7
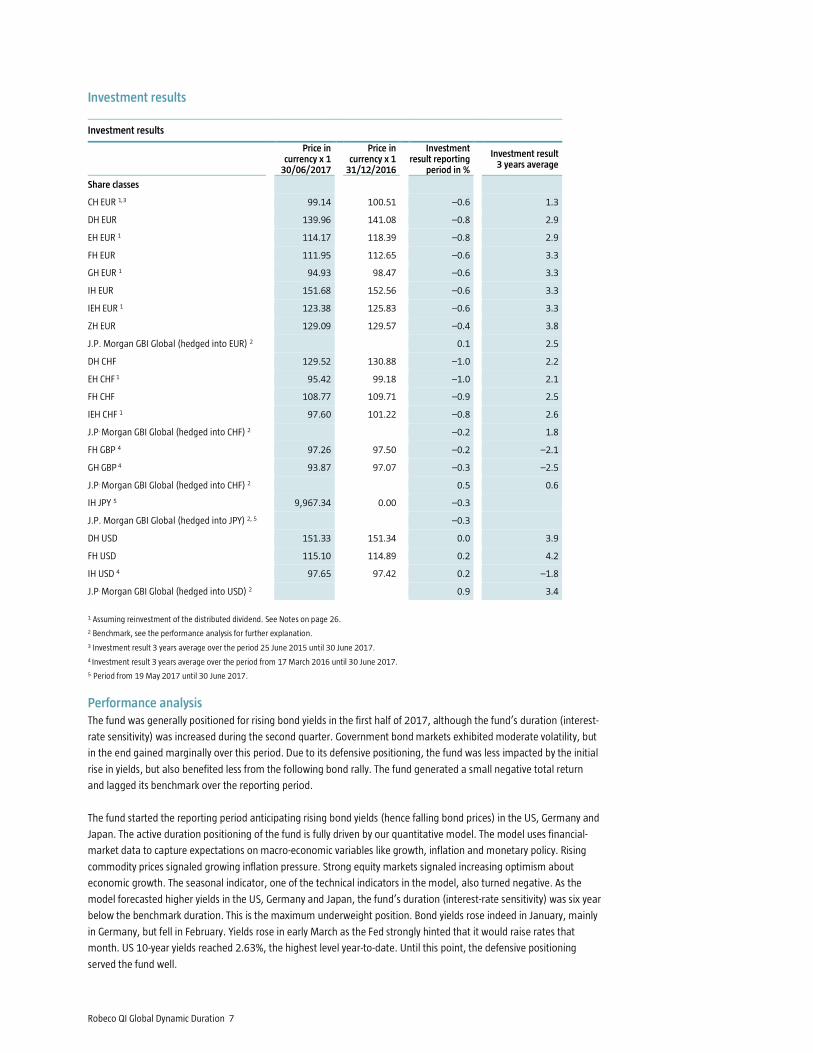
Investment results
Investment results
Price in
currency x 1 30/06/2017
Price in
currency x 1 31/12/2016
Investment
result reporting period in %
Investment result
3 years average
Share classes
CH EUR 1,3 99.14 100.51 –0.6 1.3
DH EUR 139.96 141.08 –0.8 2.9
EH EUR 1 114.17 118.39 –0.8 2.9
FH EUR 111.95 112.65 –0.6 3.3
GH EUR 1 94.93 98.47 –0.6 3.3
IH EUR 151.68 152.56 –0.6 3.3
IEH EUR 1 123.38 125.83 –0.6 3.3
ZH EUR 129.09 129.57 –0.4 3.8
J.P. Morgan GBI Global (hedged into EUR) 2 0.1 2.5
DH CHF 129.52 130.88 –1.0 2.2
EH CHF 1 95.42 99.18 –1.0 2.1
FH CHF 108.77 109.71 –0.9 2.5
IEH CHF 1 97.60 101.22 –0.8 2.6
J.P. Morgan GBI Global (hedged into CHF) 2 –0.2 1.8
FH GBP 4 97.26 97.50 –0.2 –2.1
GH GBP 4 93.87 97.07 –0.3 –2.5
J.P. Morgan GBI Global (hedged into CHF) 2 0.5 0.6
IH JPY 5 9,967.34 0.00 –0.3
J.P. Morgan GBI Global (hedged into JPY) 2, 5 –0.3
DH USD 151.33 151.34 0.0 3.9
FH USD 115.10 114.89 0.2 4.2
IH USD 4 97.65 97.42 0.2 –1.8
J.P. Morgan GBI Global (hedged into USD) 2 0.9 3.4
1 Assuming reinvestment of the distributed dividend. See Notes on page 26.
2 Benchmark, see the performance analysis for further explanation.
3 Investment result 3 years average over the period 25 June 2015 until 30 June 2017.
4 Investment result 3 years average over the period from 17 March 2016 until 30 June 2017.
5 Period from 19 May 2017 until 30 June 2017.
Performance analysis The fund was generally positioned for rising bond yields in the first half of 2017, although the fund’s duration (interest-
rate sensitivity) was increased during the second quarter. Government bond markets exhibited moderate volatility, but
in the end gained marginally over this period. Due to its defensive positioning, the fund was less impacted by the initial
rise in yields, but also benefited less from the following bond rally. The fund generated a small negative total return
and lagged its benchmark over the reporting period.
The fund started the reporting period anticipating rising bond yields (hence falling bond prices) in the US, Germany and
Japan. The active duration positioning of the fund is fully driven by our quantitative model. The model uses financial-
market data to capture expectations on macro-economic variables like growth, inflation and monetary policy. Rising
commodity prices signaled growing inflation pressure. Strong equity markets signaled increasing optimism about
economic growth. The seasonal indicator, one of the technical indicators in the model, also turned negative. As the
model forecasted higher yields in the US, Germany and Japan, the fund’s duration (interest-rate sensitivity) was six year
below the benchmark duration. This is the maximum underweight position. Bond yields rose indeed in January, mainly
in Germany, but fell in February. Yields rose in early March as the Fed strongly hinted that it would raise rates that
month. US 10-year yields reached 2.63%, the highest level year-to-date. Until this point, the defensive positioning
served the fund well.
Robeco QI Global Dynamic Duration 8
The dovish comments accompanying the Fed’s rate hike and the failure of the Trump administration to replace the
health care bill pushed yields down again. The latter delayed the implementation of the fiscal stimulus that markets
had expected. Bond yields fell as the theme of “reflation” faded. US first-quarter growth disappointed, stimulus was
delayed and core inflation surprised to the downside. The model became less negative on bonds, but it remained
negative for the US. Falling oil prices signaled reduced inflationary pressure and the trend variable improved as well.
The underweight position in Germany was closed in March, followed by the position in Japan in April. The model
remained negative on Japan for a few weeks longer than on Germany due to the valuation indicator. For US bonds the
model remained negative due to the monetary policy variable (further Fed rate hikes expected). The fund thus
benefited only partially from the rally in bonds in April and May.
In June the model turned positive on Japanese bonds. The inflation and trend variables improved for all markets. The
model signal only changed for Japan as the monetary policy variable was very positive for Japan, because the Bank of
Japan maintains its supportive policy while the Fed is normalizing policy and the ECB is gradually turning towards
normalization as well.
US 10-year yields reached their lowest level year-to-date in mid-June, at 2.13%. US and German yields rebounded in
the last part of June. Comments from ECB president Draghi and Bank of England governor Carney triggered a global
rise in yields. Market participants interpreted these comments as signs of a coordinated move towards monetary policy
normalization. Only Japanese bonds were hardly impacted. With its US underweight position, the fund was less
impacted by this rise in yields.
With an underweight position in the US, a neutral position in Germany and an overweight position in Japan, the fund’s
overall duration was in line with that of the benchmark at the end of June.
Sustainability investing Integrated approach
Robeco adopts a holistic approach to integrating sustainability into investment decisions. Sustainability is a long-term
driver for change in markets, countries and companies which in turn can impact future performance. From an
investment perspective, we believe the inclusion of material sustainability factors strengthens our investment process
and leads to better-informed investment decisions. The integration of sustainability factors in our investment strategies
is well embedded in the organization. Our portfolio managers and analysts closely cooperate with the engagement
specialists from the Active Ownership and Sustainability Investing Research team. We base our judgments about the
sustainability of companies and countries in which we invest on a combination of proprietary sustainability research
and research from leading providers including RobecoSAM, Sustainalytics, RepRisk and Glass Lewis. Our research is
further enriched with information we derive from our active conversations with companies and countries about their
sustainability performance.
Stewardship Policy
Carrying out stewardship responsibilities is an integral part of Robeco’s sustainability investing approach. Robeco has a
Stewardship policy in place and is a signatory to different Stewardship Codes including the UK Stewardship Code and
the Japanese Stewardship Code. Robeco’s stewardship activities are executed within our organization; we do not
outsource stewardship activities. Exercising voting rights and engagement are important aspects of our stewardship
approach.
Principles for Responsible Investment (PRI)
Robeco’s focus on sustainability investing is underlined by the commitment to the United Nations supported Principles
for Responsible Investment (PRI). Robeco was awarded three years in a row with the highest score of the PRI
assessment, which confirms the companies’ leading position in the field of Sustainability Investing.
Sustainable Development Goals
On 25 September 2015, the United Nations General Assembly formally adopted the universal, integrated and
transformative 2030 Agenda for Sustainable Development, along with a set of 17 Sustainable Development Goals
(SDGs). The SDGs build on the success of the Millennium Development Goals and addresses a range of social needs
including education, health, social protection, and job opportunities, while tackling climate change and environmental
Robeco QI Global Dynamic Duration 9
protection. As a signatory of the Dutch SDG Investing Agenda, Robeco is committed to contribute to the SDGs as we
consider them as catalytic drivers for positive change. Furthermore Robeco is involved in various initiatives that
investigate how the investment industry can contribute to the realization of SDGs.
Sustainability investing carried out by funds at Robeco is implemented with minimum restrictions to the investment
universe, and consists of a combination of effective measures:
Exercising voting rights
Engagement
Exclusions
Integrating ESG factors1 into the investment processes.
French Energy Transition Law
In France a law was introduced to encourage asset owners to integrate climate risk as well as environmental and social
dimensions in their public disclosures. The aim of this law is to channel funds to the Energy Transition and Green
Growth. Robeco offers in its ESG proposition the option to decarbonize portfolios, measure the impact of this
decarbonisation and report on the impact of it, which fully meets the requirements of this law.
Exercising voting rights
Given the type of investments of the fund, exercising of voting rights is not applicable.
Engagement
Robeco actively uses its ownership rights to engage with companies on behalf of our clients in a constructive manner.
We believe improvements in sustainable corporate behavior can result in an improved risk return profile of our
investments. Robeco aims to improve a company’s behavior on environmental, social and/or corporate governance
(ESG) related issues with the aim of improving the long term performance of the company and ultimately the quality of
investments for our clients.
Robeco enters into active dialogue with companies about good corporate governance and a socially responsible
corporate policy. In our opinion this will increase shareholder value for the investors in the longer term. We use an
integral approach, which combines the expertise of our investment analysts, our sustainability investing research
analysts and our engagement specialists. By using financially material information as the basis for our talks, we strive
to ensure that our dialogue introduces added value and improves the risk/return profile of the company. This enables
us to generate value for both the investors and the company.
Robeco also engages with companies that breach the UN Global Compact. The UN Global Compact defines several
universal principles with which organizations must comply. These principles are of a general nature and focus on
respecting human rights, good working conditions, combating corruption and exercising due care for the environment.
If a company structurally breaches one or more of these principles, Robeco starts a dialogue with it. If after three years
of dialogue, a company has made insufficient progress in eliminating or mitigating the breach, Robeco can decide to
exclude the company from its investment universe.
Exclusions
Robeco's exclusion policy is based on three main exclusion criteria. Firstly, it excludes companies that are involved in
the production of controversial weapons or essential components for such weapons, or that derive income from the
sale or transport of these weapons. We base our policy of not investing in such companies on a legislative amendment
in the Netherlands governing investments in cluster-munition companies effective since 1 January 2013. Secondly,
there is a policy for excluding countries. Robeco considers any country that systematically violates the human rights of
its citizens to be controversial. These exclusions relate to investment-related sanctions that are imposed by the UN, US
or EU. Thirdly, an unsuccessful dialogue may in time lead to a company's exclusion from the investment universe. In
such cases a dialogue with a company concerns serious and systematic violations of widely accepted international
directives on good corporate governance. Robeco focuses in particular on the United Nations Global Compact. The
Executive Committees of RIAM and RobecoSAM have the final authority to exclude companies and countries.
1 ESG stands for environmental, social and governance.
Robeco QI Global Dynamic Duration 10
Integrating ESG factors into the investment processes
Government Bonds:
Sustainability has become a main building block of our sovereign country allocation framework, together with
economic cycle and debt sustainability. The power of country sustainability analyses lies in its capability of identifying
potential issues for countries in an early stage. Our Country Sustainability Ranking creates a systematic framework
which is easily assessable and provides valuable input for our investment decisions.
Luxembourg, 30 August 2017
The Board of Directors
Past performance is no indication of current or future performance. These performance data do not take account of the commissions and costs incurred on the issue and redemption of units.
Robeco QI Global Dynamic Duration 11
Other data
Savings directive information Robeco QI Global Dynamic Duration is subject to the EU savings directive.
Stock-exchange listing Robeco QI Global Dynamic Duration class DH EUR shares are listed on the Luxembourg Stock Exchange.
Auditors No external audit has been conducted.
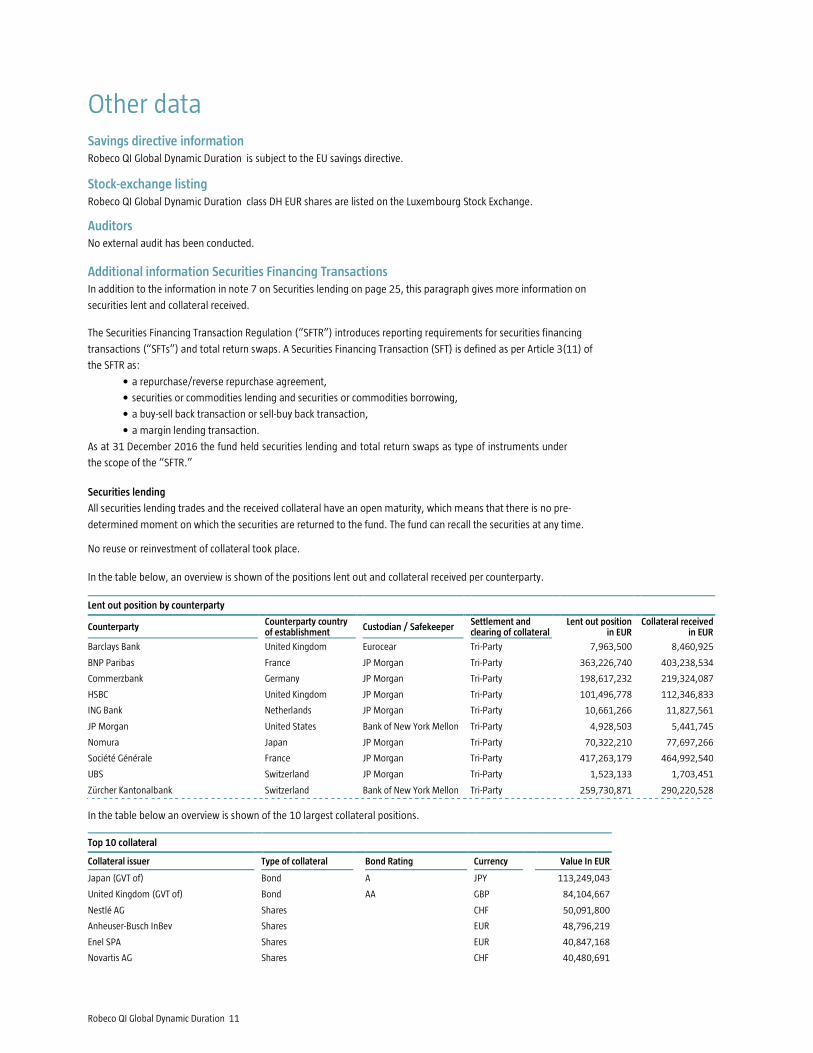
Additional information Securities Financing Transactions In addition to the information in note 7 on Securities lending on page 25, this paragraph gives more information on
securities lent and collateral received.
The Securities Financing Transaction Regulation (“SFTR”) introduces reporting requirements for securities financing
transactions (“SFTs”) and total return swaps. A Securities Financing Transaction (SFT) is defined as per Article 3(11) of
the SFTR as:
• a repurchase/reverse repurchase agreement,
• securities or commodities lending and securities or commodities borrowing,
• a buy-sell back transaction or sell-buy back transaction,
• a margin lending transaction.
As at 31 December 2016 the fund held securities lending and total return swaps as type of instruments under
the scope of the “SFTR.”
Securities lending
All securities lending trades and the received collateral have an open maturity, which means that there is no pre-
determined moment on which the securities are returned to the fund. The fund can recall the securities at any time. No reuse or reinvestment of collateral took place.
In the table below, an overview is shown of the positions lent out and collateral received per counterparty.
Lent out position by counterparty
Counterparty Counterparty country of establishment Custodian / Safekeeper Settlement and
clearing of collateral Lent out position in EUR Collateral received
in EUR
Barclays Bank United Kingdom Eurocear Tri-Party 7,963,500 8,460,925
BNP Paribas France JP Morgan Tri-Party 363,226,740 403,238,534
Commerzbank Germany JP Morgan Tri-Party 198,617,232 219,324,087
HSBC United Kingdom JP Morgan Tri-Party 101,496,778 112,346,833
ING Bank Netherlands JP Morgan Tri-Party 10,661,266 11,827,561
JP Morgan United States Bank of New York Mellon Tri-Party 4,928,503 5,441,745
Nomura Japan JP Morgan Tri-Party 70,322,210 77,697,266
Société Générale France JP Morgan Tri-Party 417,263,179 464,992,540
UBS Switzerland JP Morgan Tri-Party 1,523,133 1,703,451
Zürcher Kantonalbank Switzerland Bank of New York Mellon Tri-Party 259,730,871 290,220,528
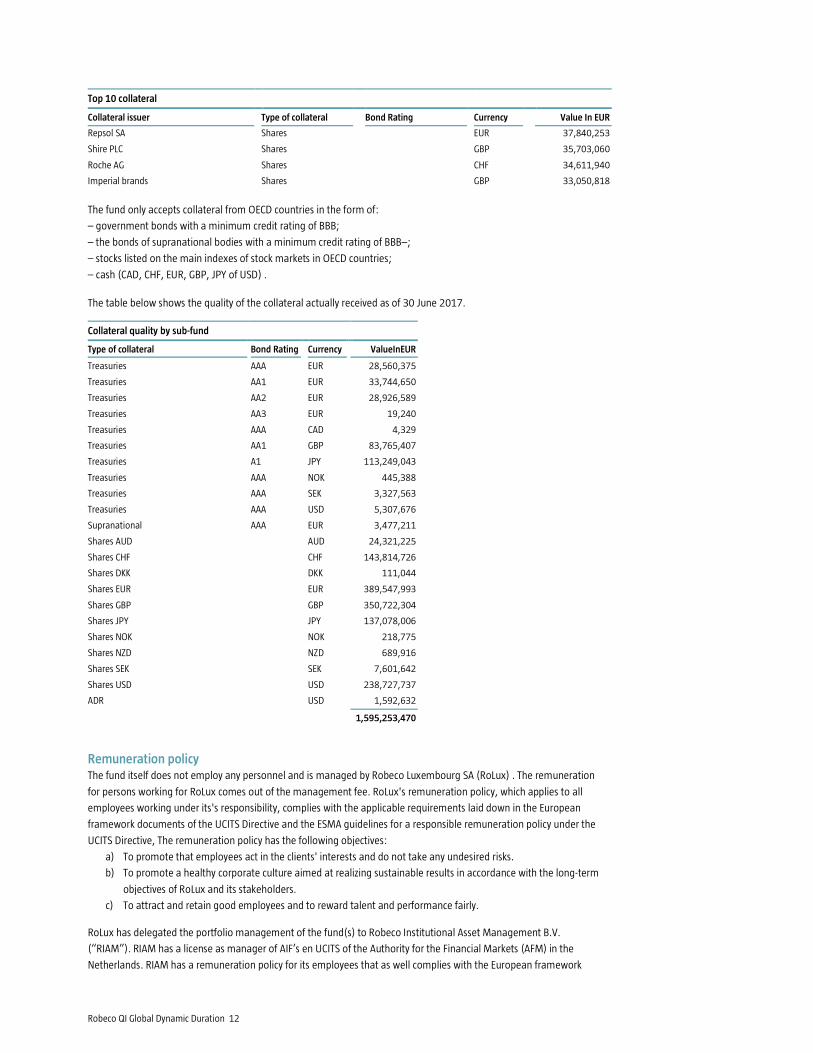
In the table below an overview is shown of the 10 largest collateral positions.
Top 10 collateral
Collateral issuer Type of collateral Bond Rating Currency Value In EUR
Japan (GVT of) Bond A JPY 113,249,043
United Kingdom (GVT of) Bond AA GBP 84,104,667
Nestlé AG Shares CHF 50,091,800
Anheuser-Busch InBev Shares EUR 48,796,219
Enel SPA Shares EUR 40,847,168
Novartis AG Shares CHF 40,480,691
Robeco QI Global Dynamic Duration 12
Top 10 collateral
Collateral issuer Type of collateral Bond Rating Currency Value In EUR
Repsol SA Shares EUR 37,840,253
Shire PLC Shares GBP 35,703,060
Roche AG Shares CHF 34,611,940
Imperial brands Shares GBP 33,050,818
The fund only accepts collateral from OECD countries in the form of:
– government bonds with a minimum credit rating of BBB;
– the bonds of supranational bodies with a minimum credit rating of BBB–;
– stocks listed on the main indexes of stock markets in OECD countries;
– cash (CAD, CHF, EUR, GBP, JPY of USD) .
The table below shows the quality of the collateral actually received as of 30 June 2017.
Collateral quality by sub-fund
Type of collateral Bond Rating Currency ValueInEUR
Treasuries AAA EUR 28,560,375
Treasuries AA1 EUR 33,744,650
Treasuries AA2 EUR 28,926,589
Treasuries AA3 EUR 19,240
Treasuries AAA CAD 4,329
Treasuries AA1 GBP 83,765,407
Treasuries A1 JPY 113,249,043
Treasuries AAA NOK 445,388
Treasuries AAA SEK 3,327,563
Treasuries AAA USD 5,307,676
Supranational AAA EUR 3,477,211
Shares AUD AUD 24,321,225
Shares CHF CHF 143,814,726
Shares DKK DKK 111,044
Shares EUR EUR 389,547,993
Shares GBP GBP 350,722,304
Shares JPY JPY 137,078,006
Shares NOK NOK 218,775
Shares NZD NZD 689,916
Shares SEK SEK 7,601,642
Shares USD USD 238,727,737
ADR USD 1,592,632
1,595,253,470
Remuneration policy The fund itself does not employ any personnel and is managed by Robeco Luxembourg SA (RoLux) . The remuneration
for persons working for RoLux comes out of the management fee. RoLux's remuneration policy, which applies to all
employees working under its's responsibility, complies with the applicable requirements laid down in the European
framework documents of the UCITS Directive and the ESMA guidelines for a responsible remuneration policy under the
UCITS Directive, The remuneration policy has the following objectives:
a) To promote that employees act in the clients' interests and do not take any undesired risks.
b) To promote a healthy corporate culture aimed at realizing sustainable results in accordance with the long-term
objectives of RoLux and its stakeholders.
c) To attract and retain good employees and to reward talent and performance fairly.
RoLux has delegated the portfolio management of the fund(s) to Robeco Institutional Asset Management B.V.
(“RIAM”). RIAM has a license as manager of AIF’s en UCITS of the Authority for the Financial Markets (AFM) in the
Netherlands. RIAM has a remuneration policy for its employees that as well complies with the European framework
Robeco QI Global Dynamic Duration 13
documents of the of the UCITS directive en AIFMD and the ESMA guidelines for a responsible remuneration policy under
the UCITS directive and AIFMD.
Responsibility for the remuneration policy
RoLux’ remuneration Policy is determined and applied by and on behalf of RoLux with the approval of its shareholder,
the (Board of) Robeco Holding B.V. For each review the (Board of) Robeco Holding B.V. shall obtain prior advice from
the Supervisory Board of Robeco Institutional Asset management B.V., which is also responsible for the oversight over
RoLux’s operations, including the remuneration of its staff. In the application and evaluation of the remuneration
policy, RoLux occasionally makes use of the services of various external advisers.
Fixed salary
Each individual employee’s fixed salary is determined on the basis of function and experience according to RoLux’
salary ranges and in reference to the benchmarks of the investment management industry in the relevant region. The
fixed salary is deemed adequate remuneration for the employee to properly execute his or her responsibilities,
regardless of whether or not variable remuneration is received.
Variable remuneration
The total available variable remuneration pool is established annually by and on behalf of RoLux and approved by the
(remuneration committee of the) Supervisory Board of Robeco. With respect to Directors of RoLux, it is noted that the
shareholder of RoLux determines their remuneration.
The total budget is based, in principle, on a percentage of the operating result. To ensure that the total variable
remuneration is an accurate representation of performance and does not adversely affect RoLux’ financial situation,
the total amount of variable remuneration is determined taking the following factors into account:
1. The financial result compared to the budgeted result and long-term objectives;
2. The required risk-minimization measures and the measurable risks.
To the extent the variable remuneration pool allows, each employee’s variable remuneration will be determined at the
reasonable discretion of RoLux, taking into account individual and team and/or department performance, assessed on
the basis of pre-agreed financial and non-financial performance factors (“KPIs”) . If this performance-related variable
remuneration (partly) exceeds the fixed threshold amount, 40% of the payment will be deferred for a period of at least
three years. The deferred parts will be converted into hypothetical ‘Robeco Group’ shares, the value of which moves
with the company's future results. Negative performance has a decreasing effect on an employee’s variable
remuneration, which can even go down to zero.
Identified Staff
RoLux has a specific and more stringent remuneration policy for staff who may have a material impact on the risk
profile of the fund. These persons are designated to be 'Identified Staff'. For 2016, in addition to the Board, RoLux has
identified 1 other person as Identified Staff. Among other things the performance targets of these staff that are used to
determine the award of variable pay are subject to additional risk analyses, both prior to the performance year and at
the end when the results are evaluated. In addition, in all cases at least 70% of the payment of variable remuneration
granted to these employees will be deferred for a period of four years, whereby 50% will be converted into hypothetical
'Robeco Group' shares whose value will follow the company's future results.
Risk control
RoLux has implemented additional risk-management measures with regard to the variable remuneration. For instance,
RoLux has the possibility with regard to all employees to reclaim the granted variable remuneration ('claw-back') when
this has been based on incorrect information, fraudulent acts, serious improper behavior, serious negligence in the
performance of his tasks or behavior that has resulted to considerable losses for RoLux. After the granting but before
the actual payment of the deferred variable remuneration components to Identified Staff, an additional assessment is
performed to check whether new information would result in decreasing the previously granted remuneration
components (the so-called ‘malus arrangement’). The malus arrangement can be applied because of (i) misconduct or
serious mistakes (ii) a considerable deterioration of RoLux financial results that was not foreseen at the time the
remuneration was granted (iii) a serious violation of the risk management system, leading to changed circumstances
compared with the granting of the variable remuneration or (iv) fraud committed by the employee concerned.
Annual assessment

Robeco QI Global Dynamic Duration 14
RoLux's remuneration policy and the application thereof was evaluated in 2016 under the responsibility of the
Supervisory Board, advised by the Remuneration Committee. In this case, special attention was given to the new ESMA
guidelines for a responsible remuneration policy under the UCITS Directive. This resulted in a number of changes in the
remuneration policy that were not of a material nature.
Robeco QI Global Dynamic Duration 15
Financial statements
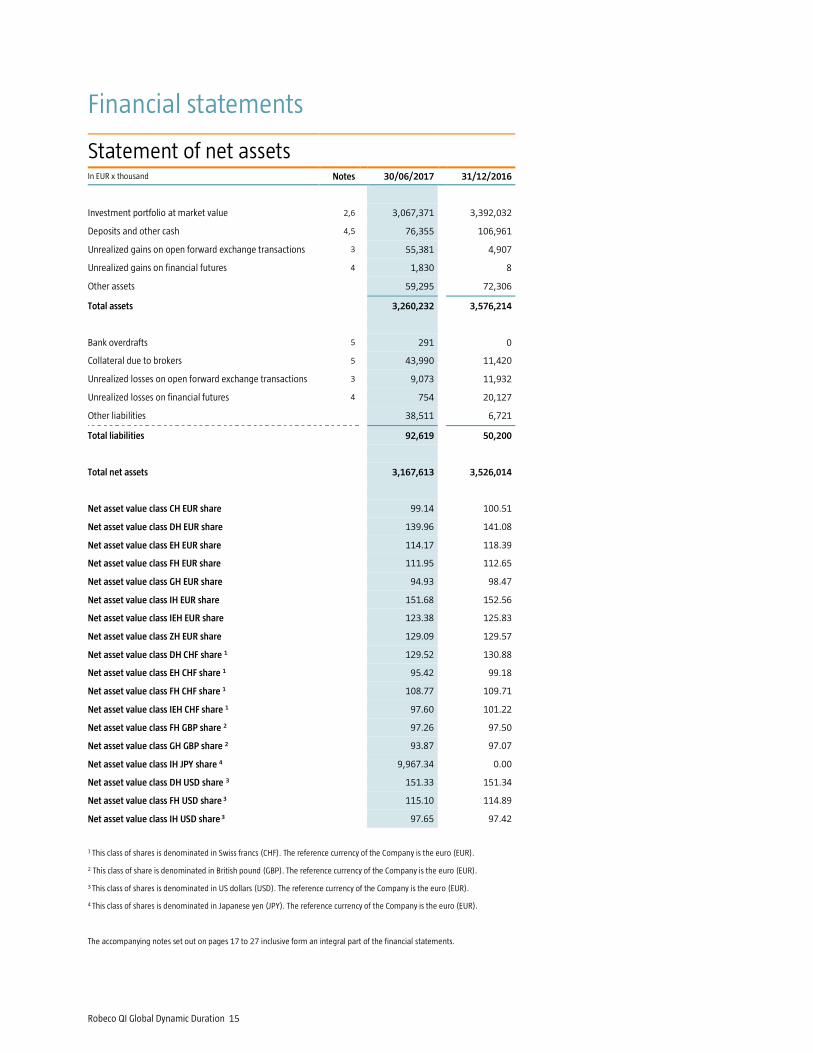
Statement of net assets In EUR x thousand Notes 30/06/2017 31/12/2016
Investment portfolio at market value 2,6 3,067,371 3,392,032
Deposits and other cash 4,5 76,355 106,961
Unrealized gains on open forward exchange transactions 3 55,381 4,907
Unrealized gains on financial futures 4 1,830 8
Other assets 59,295 72,306
Total assets 3,260,232 3,576,214
Bank overdrafts 5 291 0
Collateral due to brokers 5 43,990 11,420
Unrealized losses on open forward exchange transactions 3 9,073 11,932
Unrealized losses on financial futures 4 754 20,127
Other liabilities 38,511 6,721
Total liabilities 92,619 50,200
Total net assets 3,167,613 3,526,014
Net asset value class CH EUR share 99.14 100.51
Net asset value class DH EUR share 139.96 141.08
Net asset value class EH EUR share 114.17 118.39
Net asset value class FH EUR share 111.95 112.65
Net asset value class GH EUR share 94.93 98.47
Net asset value class IH EUR share 151.68 152.56
Net asset value class IEH EUR share 123.38 125.83
Net asset value class ZH EUR share 129.09 129.57
Net asset value class DH CHF share 1 129.52 130.88
Net asset value class EH CHF share 1 95.42 99.18
Net asset value class FH CHF share 1 108.77 109.71
Net asset value class IEH CHF share 1 97.60 101.22
Net asset value class FH GBP share 2 97.26 97.50
Net asset value class GH GBP share 2 93.87 97.07
Net asset value class IH JPY share 4 9,967.34 0.00
Net asset value class DH USD share 3 151.33 151.34
Net asset value class FH USD share 3 115.10 114.89
Net asset value class IH USD share 3 97.65 97.42
1 This class of shares is denominated in Swiss francs (CHF). The reference currency of the Company is the euro (EUR).
2 This class of share is denominated in British pound (GBP). The reference currency of the Company is the euro (EUR).
3 This class of shares is denominated in US dollars (USD). The reference currency of the Company is the euro (EUR).
4 This class of shares is denominated in Japanese yen (JPY). The reference currency of the Company is the euro (EUR).
The accompanying notes set out on pages 17 to 27 inclusive form an integral part of the financial statements.
Robeco QI Global Dynamic Duration 16
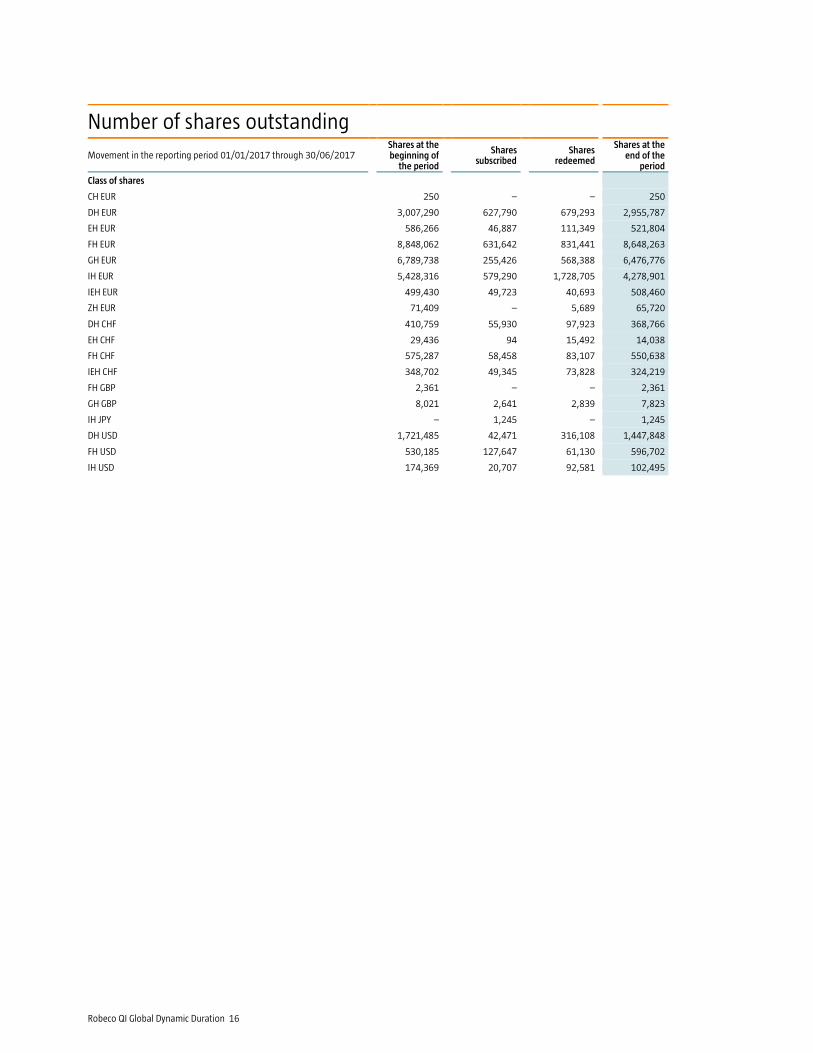
Number of shares outstanding
Movement in the reporting period 01/01/2017 through 30/06/2017 Shares at the beginning of
the period
Shares subscribed
Shares
redeemed
Shares at the end of the
period
Class of shares
CH EUR 250 – – 250
DH EUR 3,007,290 627,790 679,293 2,955,787
EH EUR 586,266 46,887 111,349 521,804
FH EUR 8,848,062 631,642 831,441 8,648,263
GH EUR 6,789,738 255,426 568,388 6,476,776
IH EUR 5,428,316 579,290 1,728,705 4,278,901
IEH EUR 499,430 49,723 40,693 508,460
ZH EUR 71,409 – 5,689 65,720
DH CHF 410,759 55,930 97,923 368,766
EH CHF 29,436 94 15,492 14,038
FH CHF 575,287 58,458 83,107 550,638
IEH CHF 348,702 49,345 73,828 324,219
FH GBP 2,361 – – 2,361
GH GBP 8,021 2,641 2,839 7,823
IH JPY – 1,245 – 1,245
DH USD 1,721,485 42,471 316,108 1,447,848
FH USD 530,185 127,647 61,130 596,702
IH USD 174,369 20,707 92,581 102,495
Robeco QI Global Dynamic Duration 17
Notes to the financial statements as at 30 June 2017 1 General Following the Extraordinary General Meeting held on 3 March 2017 the name of the fund was changed from Robeco Lux-o-rente
to Robeco QI Global Dynamic Duration. This change is effective from 31 March 2017. Robeco QI Global Dynamic Duration , (‘the
Company’) was incorporated on 2 June 1994 for an undetermined period of time as an open ended investment company based
in Luxembourg, issuing and redeeming its shares on a daily basis at prices based on the respective net asset value. Its Articles of
Incorporation were published in the ‘Mémorial, Recueil des Sociétés et Associations’, of the Grand Duchy of Luxembourg (the
’Mémorial’) on 11 July 1994. The Articles of Incorporation were last amended on 31 March 2017 and such amendments were
published on 3 April 2017 in the Recueil Electronique des Sociétés et Associations ('RESA", formerly: Mémorial). Robeco QI Global
Dynamic Duration is a ‘Société d’Investissement à Capital Variable’ (Investment Company with variable capital) pursuant to the
law of 10 August 1915, as amended, on commercial companies and to part I of the modified law of 17 December 2010 on
undertakings for collective investment of the Grand Duchy of Luxembourg. The Board of Directors has the authority to issue
different classes of shares in the Company. Details on the characteristics of such share classes offered by the Company will be
determined by the Board of Directors. The Directors of the Company may at any time decide upon the issue of class AH, DH, DHHi,
D2H, FH, FHHi, IH, IHHi, MH, M2H and ZH shares (accumulating) and class A1H, BH, D3H, BHHi, BxH, CH, CHHi, CxH, EH, GH, IBH,
IBxH, IExH, IEH, M3H, ZBH and ZEH shares (distribution). The reference currency of the Classes of Shares may be the euro (EUR),
the US dollar (USD), the British pound (GBP), the Swiss franc (CHF), the Japanese yen (JPY), the Canadian dollar (CAD), the
Mexican peso (MXN), the Hong Kong dollar (HKD), the Singapore dollar (SGD), the Swedish crown (SEK), the Norwegian crown
(NOK), the Danish crown (DKK), the Australian dollar (AUD) or the South African rand (ZAR). Only the shares mentioned in the
paragraph ‘Share capital’ are active at the reporting date.
Share capital
The capital of the Company will automatically be adjusted in case additional shares are issued or outstanding shares
are redeemed without special announcements or measure of publicity being necessary in relation thereto.
Class CH, FH and GH shares are available in certain countries, subject to the relevant regulatory approval, through
specific distributors, selected by the Board of Directors.
Class DH and EH shares are available to all investors.
Class ZH shares are only available for institutional investors:
− who are (in)directly wholly or partly owned by Robeco Groep N.V. (‘Members of the Robeco Group’)
− which consist of Investment fund(s) and/or investment structure(s) which are (co-)managed and/or (sub) advised
by Members of the Robeco Group
− who are institutional clients of Members of the Robeco Group and are as such subject to separate (management,
advisory or other) fees payable to such Members of the Robeco Group.
The ultimate decision whether an institutional investor qualifies for the ZH class is at the discretion of the Board of
Directors of the Company.
Class IH and IEH shares are available to institutional investors within the meaning of article 174 (2) of the law of 17
December 2010 on collective investment undertakings and may only be subscribed directly with the Registrar. Class IH,
and IEH shares have a minimum subscription amount of EUR 500,000. The Board of Directors can waive this minimum
subscription amount at its discretion. Additional subscriptions must be for a minimum of EUR 10,000.
The Company, for the account of classes of shares for which the currency of expression is USD, GBP, JPY or CHF (collectively or
individually ‘hedged class(es)’), engages in currency hedging transactions to preserve, to the extent possible, the value of the
assets attributable to the Hedged classes The attention of the investors is drawn to the fact that the Company has several classes
of shares which distinguish themselves by, inter alia, their reference currency and that they are exposed to the risk that the net
asset value of a class denominated in one currency can move unfavourable vis-à-vis another class denominated in another
currency.
Sales commissions
The maximum sales commission is 3%, except for shares that are only available to institutional Investors for which the
maximum sales commission is 0.50%. For class ZH shares, no sales commission is applicable. The percentages
represent a percentage of the total subscription amount. This commission rate has to be considered as a maximum
rate and the sales agents may decide at their discretion to waive this sales commission in whole or in part. The
Robeco QI Global Dynamic Duration 18
Company reserves the right to refuse any subscription request at any time. Sales commissions are not booked in the
fund.
Dividend policy
The general policy regarding the appropriation of net income and capital gains is as follows:
Class DH, FH, IH and ZH shares
Income is automatically reinvested and added to the relevant class of shares and will thus contribute to a further
increase in value of the total net assets.
Class CH, EH, GH and IEH shares
After the end of the reporting period, the Company proposes what distribution shall be made from the net proceeds
attributable to the relevant class of shares. The annual general meeting of shareholders will determine the dividend
payment. The Board of Directors of the Company may decide to distribute interim dividends in accordance with
Luxembourg law.
General remarks
As provided by the 2010 law, the Company may decide to distribute dividends with no other limit than the obligation
that any such dividend distribution does not reduce the net asset value of the Company below the legal minimum
amount. Similarly, the Company may decide to distribute interim dividends and may decide to pay dividends in shares.
If dividends are distributed, payments of cash dividends to registered shareholders are made in the currency of the
relevant class to such shareholders at the addresses they have given to the Registrar. Dividend announcements
(including names of paying agents) shall be published in a leading newspaper circulating in the countries where the
Company’s shares have been sold as determined by the Board of Directors. Dividends not collected within five years will
lapse and accrue for the benefit of the Company in accordance with Luxembourg law.
Open-ended fund
Robeco QI Global Dynamic Duration is an open-ended investment company, meaning that, barring exceptional
circumstances, Robeco QI Global Dynamic Duration issues and purchases its shares on a daily basis at prices at net
asset value. The Company reserves the right to refuse any subscription request at any time.
Swing pricing
Shares are issued and redeemed on the basis of the net asset value per share. However, the actual costs of purchasing
or selling assets and investments for a sub-fund may deviate from the latest available prices, as appropriate, in
calculating the net asset value per share. This deviation can be caused by duties and charges and spread from buying
and selling prices of the underlying investments (“spreads”). These costs have an adverse effect on the value of a sub-
fund and its underlying share classes and are known as dilution. To mitigate the effects of dilution, the Directors may,
at their discretion, make a dilution adjustment to the net asset value per share. The Directors will retain the discretion
in relation to the circumstances under which to make such a dilution adjustment. At the end of the reporting period, no
swing adjustment was made.
Pooling and co-management
For the purpose of efficient management and to reduce administrative costs, the Board of Directors may decide to co-
manage some or all of the assets of the Company and other Luxembourg UCIs of the Robeco Group (‘co-managed
units’). In this case, the assets from different co-managed units will be jointly managed using the technique of pooling.
Assets that are co-managed will be referred to using the term ‘pool’. Such pools will only be used for the purposes of
internal management. They will not constitute distinct legal entities and will not be directly accessible to investors. Each
co-managed unit will have its own assets allocated to it. During the reporting period no pooling or co-management
took place.
Affiliated parties
Robeco QI Global Dynamic Duration is affiliated to the entities belonging to Robeco Groep N.V. The affiliation with
Robeco Groep N.V. is the result of the possibility of having decisive control or a substantial influence on the Company’s
business policy. Robeco Group N.V. is part of ORIX Corporation. The management structure of Robeco Groep N.V., in
which significant authority is allocated to its independent supervisory board, is such that ORIX Corporation does not
have any meaningful say in or influence on the Company’s business policy. Robeco Groep N.V. pursues an independent
investment policy on behalf of its affiliated investment companies, taking into account the interest of the investors
involved. Besides services of other market parties, Robeco QI Global Dynamic Duration also utilizes the services of one
or more of these affiliated entities including transactions relating to securities, treasury, derivatives, securities lending,
Robeco QI Global Dynamic Duration 19
and subscriptions and redemptions of its own shares, as well as management activities. Transactions are executed at
market rates.
Financial instruments
Risks
Transactions in financial instruments may lead the Company to be subject to the risks described below or to the
Company transferring these risks to another party.
General investment risk
The value of your investments may fluctuate. Past performance is no guarantee of future results. The net asset value of
the Company is affected by developments in the financial markets and may both rise and fall. Shareholders run the risk
that their investments may end up being worth less than the amount invested or even worth nothing. General
investment risk can be broken down into market risk, concentration risk and currency risk.
Bonds or other debt securities involve credit risk to the issuer which may be evidenced by the issuer's credit rating.
Securities which are subordinated and/or have a lower credit rating are generally considered to have a higher credit
risk and a greater possibility of default than more highly rated securities. In the event that any issuer of bonds or other
debt securities experiences financial or economic difficulties, this may affect the value of the relevant securities and any
amounts paid on such securities. This may in turn affect the NAV per share.
Market risk
The net asset value of the Company is sensitive to market movements. In addition, investors should be aware of the
possibility that the value of investments may vary as a result of changes in political, economic or market circumstances.
No assurance can, therefore, be given that the sub-fund’s investment objective will be achieved. It cannot be
guaranteed either that the value of a share in a sub-fund will not fall below its value at the time of acquisition.
Concentration risk
Based on its investment policy, the Company may invest in financial instruments from issuing institutions that (mainly)
operate within the same sector or region, or in the same market. If this is the case, the concentration of the investment
portfolio of the Company may cause events that have an effect on these issuing institutions to have a greater effect on
the Company assets than would occur with a less concentrated investment portfolio.
Currency risk
All or part of the Company’s investments may be invested in currencies other than the euro. As a result, fluctuations in
exchange rates may have both a negative and a positive effect on the investment result of the Company.
The Company limits the general investment risk by investing in bonds and other marketable debt securities and
instruments (which may include certificates of deposit, money-market instruments and commercial papers) of issuers
from any member state of the OECD or supranational issuers guaranteed by one or more member states of the OECD
and with a minimum rating of ’A’ in the Standard & Poor’s or other recognized credit rating agencies lists.
Counterparty risk
A counterparty of the Company may fail to fulfil its obligations towards the Company. This risk is limited as much as
possible by taking every possible care in the selection of counter parties. Wherever it is customary in the market, the
Company will demand and obtain collateral.
Risk of lending financial instruments
In the case of financial-instrument lending transactions, the Company runs the risk that the borrower cannot comply
with its obligation to return the financial instruments on the agreed date or furnish the requested collateral. The
lending policy of the Company is designed to control these risks as much as possible.
The lending policy of the fund is designed to control these risks as much as possible. The credit worthiness of
counterparties in securities-lending transactions is assessed on the basis of how independent rating agencies regard
their short-term credit worthiness and on the basis of their net assets. Guarantees given by parent companies are also
taken into account. The fund only accepts collateral from OECD countries in the form of:
– government bonds with a minimum credit rating of BBB;
– the bonds of supranational bodies with a minimum credit rating of BBB–;
– stocks listed on the main indexes of stock markets in OECD countries;
– cash (CAD, CHF, EUR, GBP, JPY of USD).
Robeco QI Global Dynamic Duration 20
As of balance-sheet date, the fund had received collateral ensuing from securities-lending transactions. More
information can be found under note 7 on page 25.
Liquidity risk
The actual buying and selling prices of financial instruments in which the Company invests partly depend upon the
liquidity of the financial instruments in question. It is possible that a position taken on behalf of the Company cannot be
quickly liquidated in good time and at a reasonable price due to a lack of liquidity in the market in terms of supply and
demand. The Company minimizes this risk by mainly investing in financial instruments that are tradable on a daily
basis.
Euro currency risk
All or part of the assets of the Company may be invested in securities denominated in Euro. In the event of any
adjustments, including a full break-up, an exit of individual countries or other circumstances that may result in the
emergence or re-introduction of national currencies, the Company runs the risks that value of its investments is reduced
and/or the liquidity of its investments is (temporarily) reduced, regardless of the measures the Company may seek to
reduce this risk.
Operational risk
The operational risk is the non inherent risk remaining after determining the risks as detailed above (general
investment risk, counterparty, liquidity or risk of lending financial instruments). It mainly includes risks resulting
from breakdowns in internal procedures, people and systems.
Insight into actual risks
The report of the Board of Directors, the statement of net assets, the Notes to the financial statements and the
Investments portfolio, which include currency classification of the investments, give an insight into the actual risks at
the end of the reporting period.
Risk management
Managing risk is a part of the investment process as a whole and with the help of advanced systems, the risks outlined
above are limited, measured and monitored on the basis of fixed risk measures.
Policy regarding the use of derivatives
Investing implies that positions are taken. As it is possible to use various instruments, including derivative instruments,
to construct an identical position, the selection of derivatives is subordinate to the positioning of an investment
portfolio. In our published information, attention is given primarily to the overall position, and secondarily to the
nature and volume of the financial instruments employed.
Derivative instruments
The unrealized results of derivative instruments are reported in the statement of net assets and are disclosed by
contract. Commitments to derivatives are not included in the statement of net assets. They are, however, explained in
the notes. The derivatives instruments listed in the notes are transacted through third party brokers. Those brokers hold
collateral described under the note of the instrument involved. The company is exposed to counterparty risk in respect
of all amounts including collateral due to it from such brokers.
2 Summary of significant accounting principles
General
Unless stated otherwise, the items shown in the financial statements are included at their nominal value and expressed
in the reference currency of the Company. The reference currency of the Company is the euro. This semi-annual report
covers the period from 1 January 2017 through 30 June 2017.
Preparation and presentation of financial statements
The financial statements are prepared and presented in accordance with Luxembourg generally accepted accounting
principles for investment funds.
Robeco QI Global Dynamic Duration 21
Foreign currencies
Transactions in currencies other than the reference currency of the Company are converted into the reference currency
at the exchange rates prevailing at the time of the transaction. The market value of the investments, assets and
liabilities expressed in currencies other than the reference currency of the Company are converted into the Company’s
reference currency at the exchange rates prevailing at the end of the reporting period. The table on page 28 shows the
exchange rates as at 30 June 2017.
Valuation of investments
Transferable securities, money market instruments and/or financial derivative instruments listed on an official stock
exchange listing
These instruments are valued at their last available price; in the event that there should be several such markets, on the
basis of the last available price of the main market for the relevant security or asset. Should the last available market
price for a given transferable security money market instruments and/or financial derivative instruments not truly
reflect its fair market value, then that transferable security money market instruments and/or financial derivative
instruments is valued on the basis of the probable sales price which the Board of Directors deems prudent to assume.
Fixed income securities not traded on such markets are generally valued at the last available price or yield equivalents
obtained from one or more dealers or pricing services approved by the Board of Directors, or any other price deemed
appropriate by the Board of Directors.
Transferable securities and/or money market instruments dealt in on another regulated market
These instruments are valued on the basis of their last available market price. Should the last available market price for
a given transferable security and/or money market instrument not truly reflect its fair market value, then that
transferable security and/or money market instrument is valued by the Board of Directors on the basis of the probable
sales price which the Board of Directors deems prudent to assume.
Transferable securities and/or money market instruments not listed or dealt in on any stock exchange or on any
regulated market
In the event that any assets are not listed or dealt in on any stock exchange or on any regulated market, or if, with
respect to assets listed or dealt in on any stock exchange, or on any regulated market as aforesaid, the above valuation
methods are inappropriate or misleading, the Board of Directors may adopt any other appropriate valuation principles
for the assets of the Company.
Investments of the Company primarily invested in markets which are closed for business at the time the Company is
valued are normally valued using the prices at the previous close of business.
Market volatility may result in the latest available prices not accurately reflecting the fair value of the Company’s
investments. This situation could be exploited by investors who are aware of the direction of market movements, and
who might deal to exploit the difference between the next published Net Asset Value and the fair value of the
Company’s investments. By these investors paying less than the fair value for shares on issue, or receiving more than
the fair value for shares on redemption, other shareholders may suffer a dilution in the value of their investment. To
prevent this, the Company may, during periods of market volatility, adjust the Net Asset Value per Share prior to
publication to reflect more accurately the fair value of the Company’s investments. Adjustment will be made provided
that such change exceeds the threshold as determined by the Board of Directors. If an adjustment is made, it will be
applied consistently to all classes of shares. At the end of the reporting period, no such adjustments were made.
Investment transactions and investment income
Securities are initially recorded at cost, and where applicable on the basis of exchange rates prevailing on the date they
are purchased. Results on sales of securities are determined on the basis of the average cost method (for futures first in
first out method). Investment transactions are accounted for on the trade date. Interest income is recorded on an
accrual basis. Discounts/Premiums on zero coupon bonds are accreted as adjustments to interest income.
Interest and capital gains on securities may be subject to withholding or capital gains taxes in certain countries.
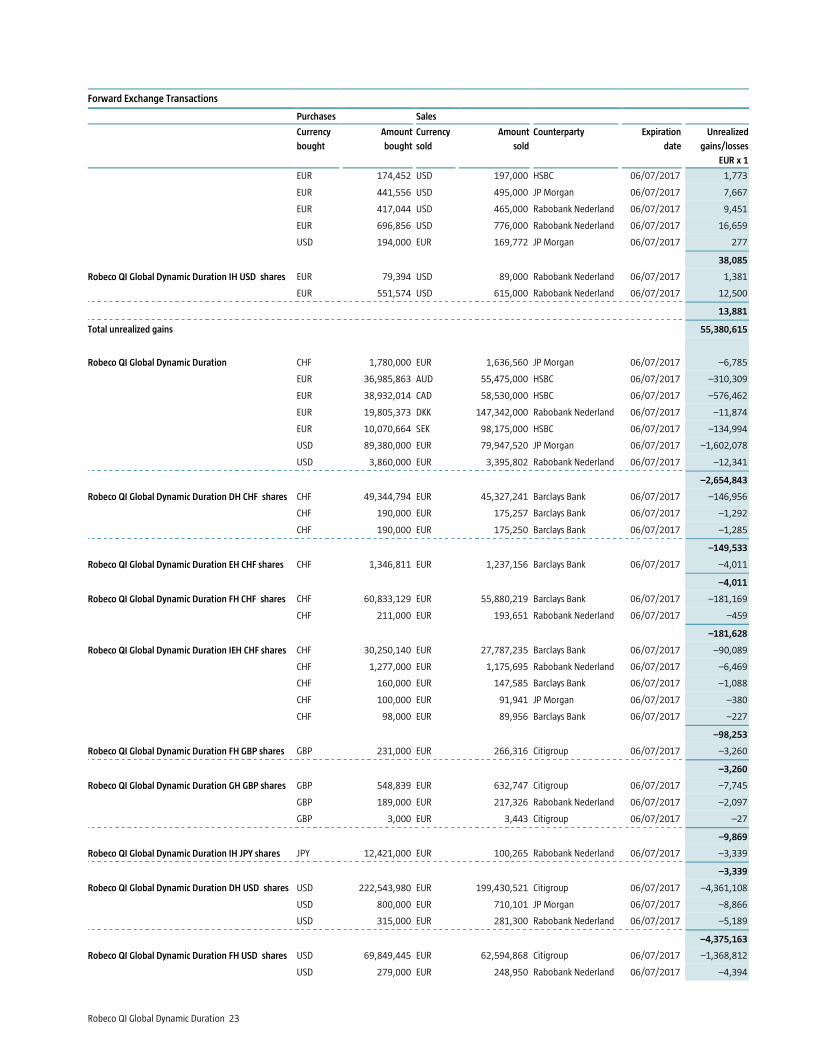
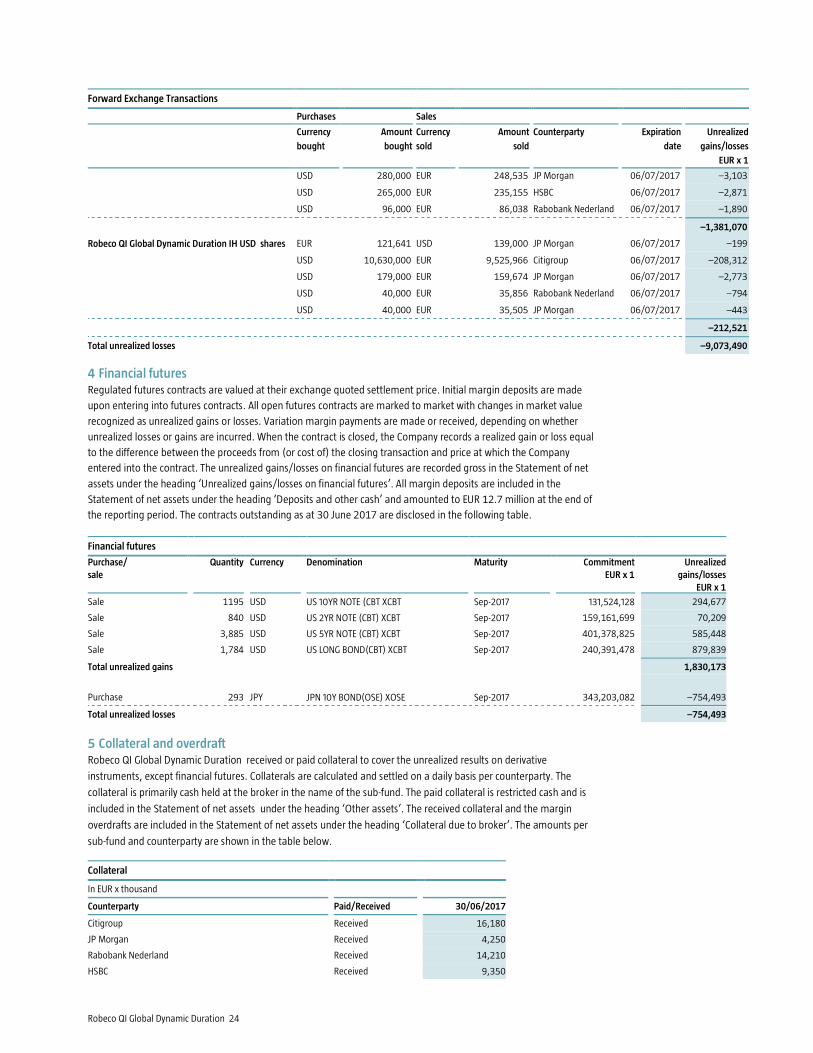
3 Open forward exchange transactions Open forward exchange transactions are valued with market practice valuation models using forwards rates based on
exchange and interest rates applicable at 30 June 2017. The unrealized results of these transactions have been
recorded gross in the Statement of net assets under the heading ’Unrealized gains/losses on open forward exchange
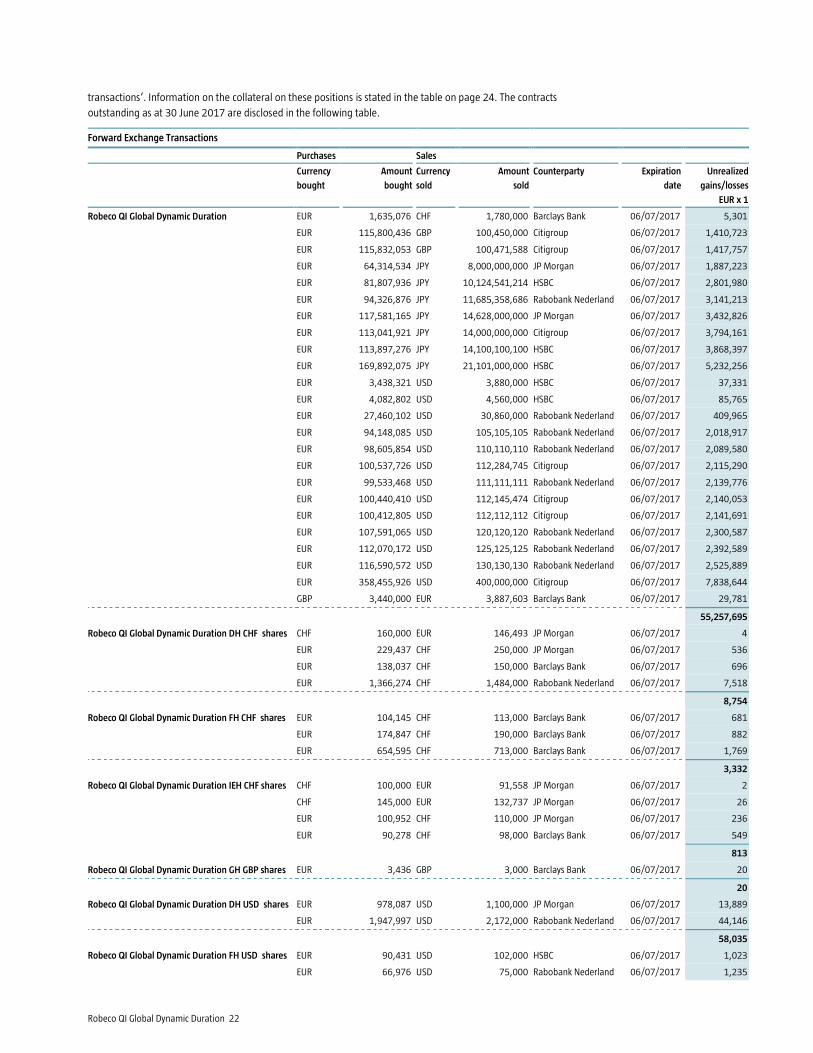
Robeco QI Global Dynamic Duration 22
transactions’. Information on the collateral on these positions is stated in the table on page 24. The contracts
outstanding as at 30 June 2017 are disclosed in the following table.
Forward Exchange Transactions
Purchases Sales
Currency Amount Currency Amount Counterparty Expiration Unrealized
bought bought sold sold date gains/losses
EUR x 1
Robeco QI Global Dynamic Duration EUR 1,635,076 CHF 1,780,000 Barclays Bank 06/07/2017 5,301
EUR 115,800,436 GBP 100,450,000 Citigroup 06/07/2017 1,410,723
EUR 115,832,053 GBP 100,471,588 Citigroup 06/07/2017 1,417,757
EUR 64,314,534 JPY 8,000,000,000 JP Morgan 06/07/2017 1,887,223
EUR 81,807,936 JPY 10,124,541,214 HSBC 06/07/2017 2,801,980
EUR 94,326,876 JPY 11,685,358,686 Rabobank Nederland 06/07/2017 3,141,213
EUR 117,581,165 JPY 14,628,000,000 JP Morgan 06/07/2017 3,432,826
EUR 113,041,921 JPY 14,000,000,000 Citigroup 06/07/2017 3,794,161
EUR 113,897,276 JPY 14,100,100,100 HSBC 06/07/2017 3,868,397
EUR 169,892,075 JPY 21,101,000,000 HSBC 06/07/2017 5,232,256
EUR 3,438,321 USD 3,880,000 HSBC 06/07/2017 37,331
EUR 4,082,802 USD 4,560,000 HSBC 06/07/2017 85,765
EUR 27,460,102 USD 30,860,000 Rabobank Nederland 06/07/2017 409,965
EUR 94,148,085 USD 105,105,105 Rabobank Nederland 06/07/2017 2,018,917
EUR 98,605,854 USD 110,110,110 Rabobank Nederland 06/07/2017 2,089,580
EUR 100,537,726 USD 112,284,745 Citigroup 06/07/2017 2,115,290
EUR 99,533,468 USD 111,111,111 Rabobank Nederland 06/07/2017 2,139,776
EUR 100,440,410 USD 112,145,474 Citigroup 06/07/2017 2,140,053
EUR 100,412,805 USD 112,112,112 Citigroup 06/07/2017 2,141,691
EUR 107,591,065 USD 120,120,120 Rabobank Nederland 06/07/2017 2,300,587
EUR 112,070,172 USD 125,125,125 Rabobank Nederland 06/07/2017 2,392,589
EUR 116,590,572 USD 130,130,130 Rabobank Nederland 06/07/2017 2,525,889
EUR 358,455,926 USD 400,000,000 Citigroup 06/07/2017 7,838,644
GBP 3,440,000 EUR 3,887,603 Barclays Bank 06/07/2017 29,781
55,257,695
Robeco QI Global Dynamic Duration DH CHF shares CHF 160,000 EUR 146,493 JP Morgan 06/07/2017 4
EUR 229,437 CHF 250,000 JP Morgan 06/07/2017 536
EUR 138,037 CHF 150,000 Barclays Bank 06/07/2017 696
EUR 1,366,274 CHF 1,484,000 Rabobank Nederland 06/07/2017 7,518
8,754
Robeco QI Global Dynamic Duration FH CHF shares EUR 104,145 CHF 113,000 Barclays Bank 06/07/2017 681
EUR 174,847 CHF 190,000 Barclays Bank 06/07/2017 882
EUR 654,595 CHF 713,000 Barclays Bank 06/07/2017 1,769
3,332
Robeco QI Global Dynamic Duration IEH CHF shares CHF 100,000 EUR 91,558 JP Morgan 06/07/2017 2
CHF 145,000 EUR 132,737 JP Morgan 06/07/2017 26
EUR 100,952 CHF 110,000 JP Morgan 06/07/2017 236
EUR 90,278 CHF 98,000 Barclays Bank 06/07/2017 549
813
Robeco QI Global Dynamic Duration GH GBP shares EUR 3,436 GBP 3,000 Barclays Bank 06/07/2017 20
20
Robeco QI Global Dynamic Duration DH USD shares EUR 978,087 USD 1,100,000 JP Morgan 06/07/2017 13,889
EUR 1,947,997 USD 2,172,000 Rabobank Nederland 06/07/2017 44,146
58,035
Robeco QI Global Dynamic Duration FH USD shares EUR 90,431 USD 102,000 HSBC 06/07/2017 1,023
EUR 66,976 USD 75,000 Rabobank Nederland 06/07/2017 1,235
Robeco QI Global Dynamic Duration 23
Forward Exchange Transactions
Purchases Sales
Currency Amount Currency Amount Counterparty Expiration Unrealized
bought bought sold sold date gains/losses
EUR x 1
EUR 174,452 USD 197,000 HSBC 06/07/2017 1,773
EUR 441,556 USD 495,000 JP Morgan 06/07/2017 7,667
EUR 417,044 USD 465,000 Rabobank Nederland 06/07/2017 9,451
EUR 696,856 USD 776,000 Rabobank Nederland 06/07/2017 16,659
USD 194,000 EUR 169,772 JP Morgan 06/07/2017 277
38,085
Robeco QI Global Dynamic Duration IH USD shares EUR 79,394 USD 89,000 Rabobank Nederland 06/07/2017 1,381
EUR 551,574 USD 615,000 Rabobank Nederland 06/07/2017 12,500
13,881
Total unrealized gains 55,380,615
Robeco QI Global Dynamic Duration CHF 1,780,000 EUR 1,636,560 JP Morgan 06/07/2017 –6,785
EUR 36,985,863 AUD 55,475,000 HSBC 06/07/2017 –310,309
EUR 38,932,014 CAD 58,530,000 HSBC 06/07/2017 –576,462
EUR 19,805,373 DKK 147,342,000 Rabobank Nederland 06/07/2017 –11,874
EUR 10,070,664 SEK 98,175,000 HSBC 06/07/2017 –134,994
USD 89,380,000 EUR 79,947,520 JP Morgan 06/07/2017 –1,602,078
USD 3,860,000 EUR 3,395,802 Rabobank Nederland 06/07/2017 –12,341
–2,654,843
Robeco QI Global Dynamic Duration DH CHF shares CHF 49,344,794 EUR 45,327,241 Barclays Bank 06/07/2017 –146,956
CHF 190,000 EUR 175,257 Barclays Bank 06/07/2017 –1,292
CHF 190,000 EUR 175,250 Barclays Bank 06/07/2017 –1,285
–149,533
Robeco QI Global Dynamic Duration EH CHF shares CHF 1,346,811 EUR 1,237,156 Barclays Bank 06/07/2017 –4,011
–4,011
Robeco QI Global Dynamic Duration FH CHF shares CHF 60,833,129 EUR 55,880,219 Barclays Bank 06/07/2017 –181,169
CHF 211,000 EUR 193,651 Rabobank Nederland 06/07/2017 –459
–181,628
Robeco QI Global Dynamic Duration IEH CHF shares CHF 30,250,140 EUR 27,787,235 Barclays Bank 06/07/2017 –90,089
CHF 1,277,000 EUR 1,175,695 Rabobank Nederland 06/07/2017 –6,469
CHF 160,000 EUR 147,585 Barclays Bank 06/07/2017 –1,088
CHF 100,000 EUR 91,941 JP Morgan 06/07/2017 –380
CHF 98,000 EUR 89,956 Barclays Bank 06/07/2017 –227
–98,253
Robeco QI Global Dynamic Duration FH GBP shares GBP 231,000 EUR 266,316 Citigroup 06/07/2017 –3,260
–3,260
Robeco QI Global Dynamic Duration GH GBP shares GBP 548,839 EUR 632,747 Citigroup 06/07/2017 –7,745
GBP 189,000 EUR 217,326 Rabobank Nederland 06/07/2017 –2,097
GBP 3,000 EUR 3,443 Citigroup 06/07/2017 –27
–9,869
Robeco QI Global Dynamic Duration IH JPY shares JPY 12,421,000 EUR 100,265 Rabobank Nederland 06/07/2017 –3,339
–3,339
Robeco QI Global Dynamic Duration DH USD shares USD 222,543,980 EUR 199,430,521 Citigroup 06/07/2017 –4,361,108
USD 800,000 EUR 710,101 JP Morgan 06/07/2017 –8,866
USD 315,000 EUR 281,300 Rabobank Nederland 06/07/2017 –5,189
–4,375,163
Robeco QI Global Dynamic Duration FH USD shares USD 69,849,445 EUR 62,594,868 Citigroup 06/07/2017 –1,368,812
USD 279,000 EUR 248,950 Rabobank Nederland 06/07/2017 –4,394
Robeco QI Global Dynamic Duration 24
Forward Exchange Transactions
Purchases Sales
Currency Amount Currency Amount Counterparty Expiration Unrealized
bought bought sold sold date gains/losses
EUR x 1
USD 280,000 EUR 248,535 JP Morgan 06/07/2017 –3,103
USD 265,000 EUR 235,155 HSBC 06/07/2017 –2,871
USD 96,000 EUR 86,038 Rabobank Nederland 06/07/2017 –1,890
–1,381,070
Robeco QI Global Dynamic Duration IH USD shares EUR 121,641 USD 139,000 JP Morgan 06/07/2017 –199
USD 10,630,000 EUR 9,525,966 Citigroup 06/07/2017 –208,312
USD 179,000 EUR 159,674 JP Morgan 06/07/2017 –2,773
USD 40,000 EUR 35,856 Rabobank Nederland 06/07/2017 –794
USD 40,000 EUR 35,505 JP Morgan 06/07/2017 –443
–212,521
Total unrealized losses –9,073,490
4 Financial futures Regulated futures contracts are valued at their exchange quoted settlement price. Initial margin deposits are made
upon entering into futures contracts. All open futures contracts are marked to market with changes in market value
recognized as unrealized gains or losses. Variation margin payments are made or received, depending on whether
unrealized losses or gains are incurred. When the contract is closed, the Company records a realized gain or loss equal
to the difference between the proceeds from (or cost of) the closing transaction and price at which the Company
entered into the contract. The unrealized gains/losses on financial futures are recorded gross in the Statement of net
assets under the heading ‘Unrealized gains/losses on financial futures’. All margin deposits are included in the
Statement of net assets under the heading ‘Deposits and other cash’ and amounted to EUR 12.7 million at the end of
the reporting period. The contracts outstanding as at 30 June 2017 are disclosed in the following table.
Financial futures
Purchase/ Quantity Currency Denomination Maturity Commitment Unrealized
sale EUR x 1 gains/losses
EUR x 1
Sale 1195 USD US 10YR NOTE (CBT XCBT Sep-2017 131,524,128 294,677
Sale 840 USD US 2YR NOTE (CBT) XCBT Sep-2017 159,161,699 70,209
Sale 3,885 USD US 5YR NOTE (CBT) XCBT Sep-2017 401,378,825 585,448
Sale 1,784 USD US LONG BOND(CBT) XCBT Sep-2017 240,391,478 879,839
Total unrealized gains 1,830,173
Purchase 293 JPY JPN 10Y BOND(OSE) XOSE Sep-2017 343,203,082 –754,493
Total unrealized losses –754,493
5 Collateral and overdraft Robeco QI Global Dynamic Duration received or paid collateral to cover the unrealized results on derivative
instruments, except financial futures. Collaterals are calculated and settled on a daily basis per counterparty. The
collateral is primarily cash held at the broker in the name of the sub-fund. The paid collateral is restricted cash and is
included in the Statement of net assets under the heading ‘Other assets’. The received collateral and the margin
overdrafts are included in the Statement of net assets under the heading ‘Collateral due to broker’. The amounts per
sub-fund and counterparty are shown in the table below.
Collateral
In EUR x thousand
Counterparty Paid/Received 30/06/2017
Citigroup Received 16,180
JP Morgan Received 4,250
Rabobank Nederland Received 14,210
HSBC Received 9,350
Robeco QI Global Dynamic Duration 25
The Company has access to an overdraft facility (the "Facility"), established with the Depositary, intended to provide for
short-term/temporary financing if necessary, subject to certain restrictions, in connection with abnormal redemption
activity. Each portfolio of the Company is limited to borrowing 10% of its respective net assets. Borrowings pursuant to
the facility are subject to interest at a mutually agreed upon rate and security by the underlying assets of each portfolio.
The number of days to refund in case of a temporary overdraft is set at 30 days.
6 Investment portfolio The investment portfolio is included at the end of this report.
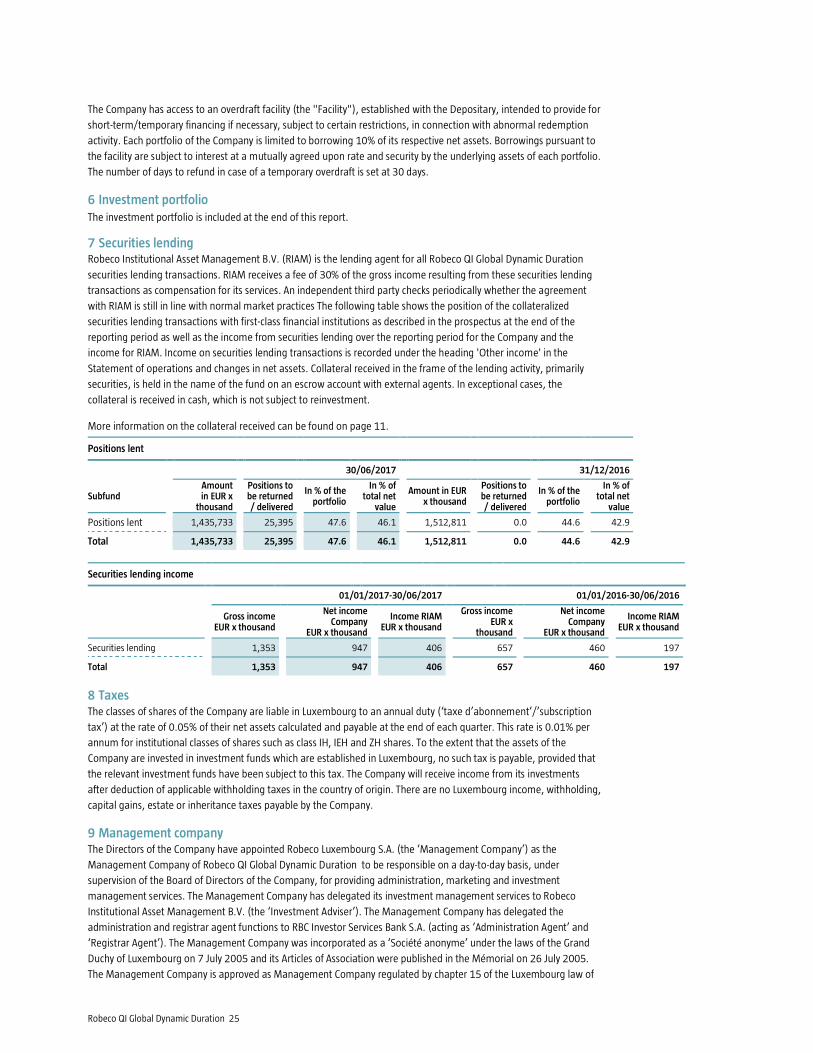
7 Securities lending Robeco Institutional Asset Management B.V. (RIAM) is the lending agent for all Robeco QI Global Dynamic Duration
securities lending transactions. RIAM receives a fee of 30% of the gross income resulting from these securities lending
transactions as compensation for its services. An independent third party checks periodically whether the agreement
with RIAM is still in line with normal market practices The following table shows the position of the collateralized
securities lending transactions with first-class financial institutions as described in the prospectus at the end of the
reporting period as well as the income from securities lending over the reporting period for the Company and the
income for RIAM. Income on securities lending transactions is recorded under the heading 'Other income' in the
Statement of operations and changes in net assets. Collateral received in the frame of the lending activity, primarily
securities, is held in the name of the fund on an escrow account with external agents. In exceptional cases, the
collateral is received in cash, which is not subject to reinvestment.
More information on the collateral received can be found on page 11.
Positions lent
30/06/2017 31/12/2016
Subfund
Amount in EUR x
thousand
Positions to be returned / delivered
In % of the
portfolio
In % of total net
value
Amount in EUR x thousand
Positions to be returned / delivered
In % of the
portfolio
In % of total net
value
Positions lent 1,435,733 25,395 47.6 46.1 1,512,811 0.0 44.6 42.9
Total 1,435,733 25,395 47.6 46.1 1,512,811 0.0 44.6 42.9
Securities lending income
01/01/2017-30/06/2017 01/01/2016-30/06/2016
Gross income
EUR x thousand
Net income Company
EUR x thousand
Income RIAM EUR x thousand
Gross income
EUR x thousand
Net income Company
EUR x thousand
Income RIAM EUR x thousand
Securities lending 1,353 947 406 657 460 197
Total 1,353 947 406 657 460 197
8 Taxes
The classes of shares of the Company are liable in Luxembourg to an annual duty (‘taxe d’abonnement’/’subscription
tax’) at the rate of 0.05% of their net assets calculated and payable at the end of each quarter. This rate is 0.01% per
annum for institutional classes of shares such as class IH, IEH and ZH shares. To the extent that the assets of the
Company are invested in investment funds which are established in Luxembourg, no such tax is payable, provided that
the relevant investment funds have been subject to this tax. The Company will receive income from its investments
after deduction of applicable withholding taxes in the country of origin. There are no Luxembourg income, withholding,
capital gains, estate or inheritance taxes payable by the Company.
9 Management company The Directors of the Company have appointed Robeco Luxembourg S.A. (the ‘Management Company’) as the
Management Company of Robeco QI Global Dynamic Duration to be responsible on a day-to-day basis, under
supervision of the Board of Directors of the Company, for providing administration, marketing and investment
management services. The Management Company has delegated its investment management services to Robeco
Institutional Asset Management B.V. (the ‘Investment Adviser’). The Management Company has delegated the
administration and registrar agent functions to RBC Investor Services Bank S.A. (acting as ‘Administration Agent’ and
‘Registrar Agent’). The Management Company was incorporated as a ‘Société anonyme’ under the laws of the Grand
Duchy of Luxembourg on 7 July 2005 and its Articles of Association were published in the Mémorial on 26 July 2005.
The Management Company is approved as Management Company regulated by chapter 15 of the Luxembourg law of
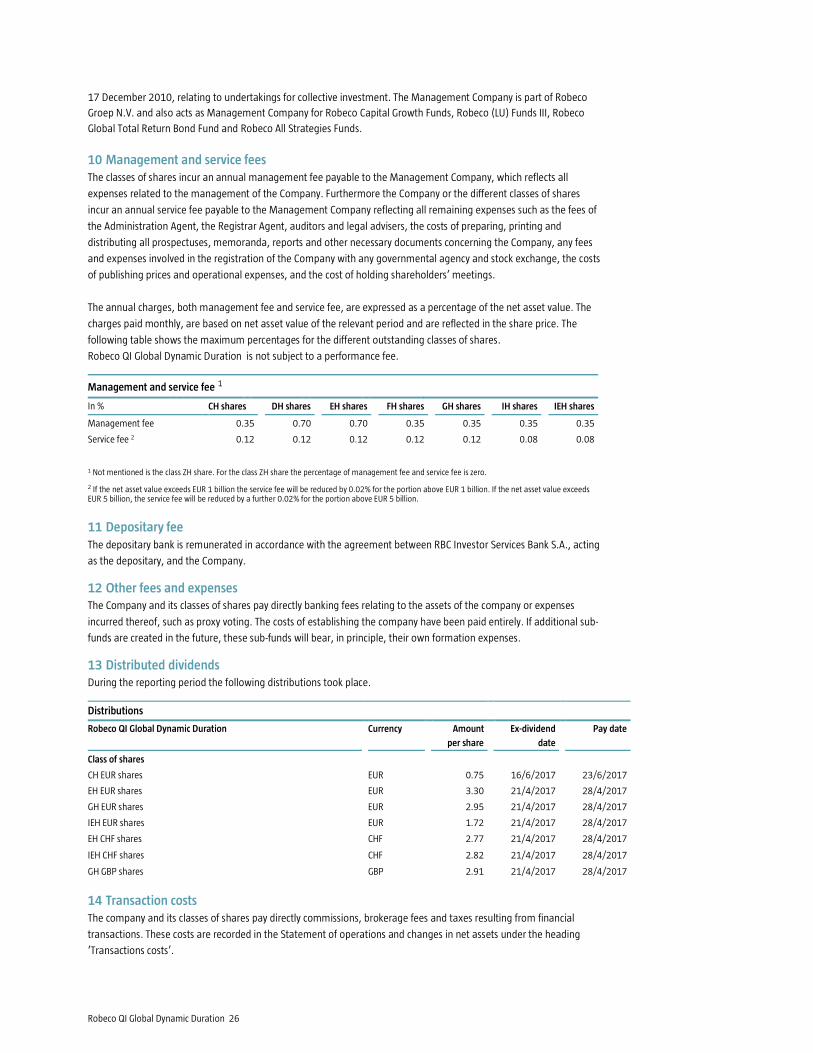
Robeco QI Global Dynamic Duration 26
17 December 2010, relating to undertakings for collective investment. The Management Company is part of Robeco
Groep N.V. and also acts as Management Company for Robeco Capital Growth Funds, Robeco (LU) Funds III, Robeco
Global Total Return Bond Fund and Robeco All Strategies Funds.
10 Management and service fees The classes of shares incur an annual management fee payable to the Management Company, which reflects all
expenses related to the management of the Company. Furthermore the Company or the different classes of shares
incur an annual service fee payable to the Management Company reflecting all remaining expenses such as the fees of
the Administration Agent, the Registrar Agent, auditors and legal advisers, the costs of preparing, printing and
distributing all prospectuses, memoranda, reports and other necessary documents concerning the Company, any fees
and expenses involved in the registration of the Company with any governmental agency and stock exchange, the costs
of publishing prices and operational expenses, and the cost of holding shareholders’ meetings.
The annual charges, both management fee and service fee, are expressed as a percentage of the net asset value. The
charges paid monthly, are based on net asset value of the relevant period and are reflected in the share price. The
following table shows the maximum percentages for the different outstanding classes of shares.
Robeco QI Global Dynamic Duration is not subject to a performance fee.
Management and service fee 1
In % CH shares DH shares EH shares FH shares GH shares IH shares IEH shares
Management fee 0.35 0.70 0.70 0.35 0.35 0.35 0.35
Service fee 2 0.12 0.12 0.12 0.12 0.12 0.08 0.08
1 Not mentioned is the class ZH share. For the class ZH share the percentage of management fee and service fee is zero.
2 If the net asset value exceeds EUR 1 billion the service fee will be reduced by 0.02% for the portion above EUR 1 billion. If the net asset value exceeds EUR 5 billion, the service fee will be reduced by a further 0.02% for the portion above EUR 5 billion.
11 Depositary fee The depositary bank is remunerated in accordance with the agreement between RBC Investor Services Bank S.A., acting
as the depositary, and the Company.
12 Other fees and expenses The Company and its classes of shares pay directly banking fees relating to the assets of the company or expenses
incurred thereof, such as proxy voting. The costs of establishing the company have been paid entirely. If additional sub-
funds are created in the future, these sub-funds will bear, in principle, their own formation expenses.
13 Distributed dividends During the reporting period the following distributions took place.
Distributions
Robeco QI Global Dynamic Duration Currency Amount Ex-dividend Pay date
per share date
Class of shares
CH EUR shares EUR 0.75 16/6/2017 23/6/2017
EH EUR shares EUR 3.30 21/4/2017 28/4/2017
GH EUR shares EUR 2.95 21/4/2017 28/4/2017
IEH EUR shares EUR 1.72 21/4/2017 28/4/2017
EH CHF shares CHF 2.77 21/4/2017 28/4/2017
IEH CHF shares CHF 2.82 21/4/2017 28/4/2017
GH GBP shares GBP 2.91 21/4/2017 28/4/2017
14 Transaction costs The company and its classes of shares pay directly commissions, brokerage fees and taxes resulting from financial
transactions. These costs are recorded in the Statement of operations and changes in net assets under the heading
‘Transactions costs’.
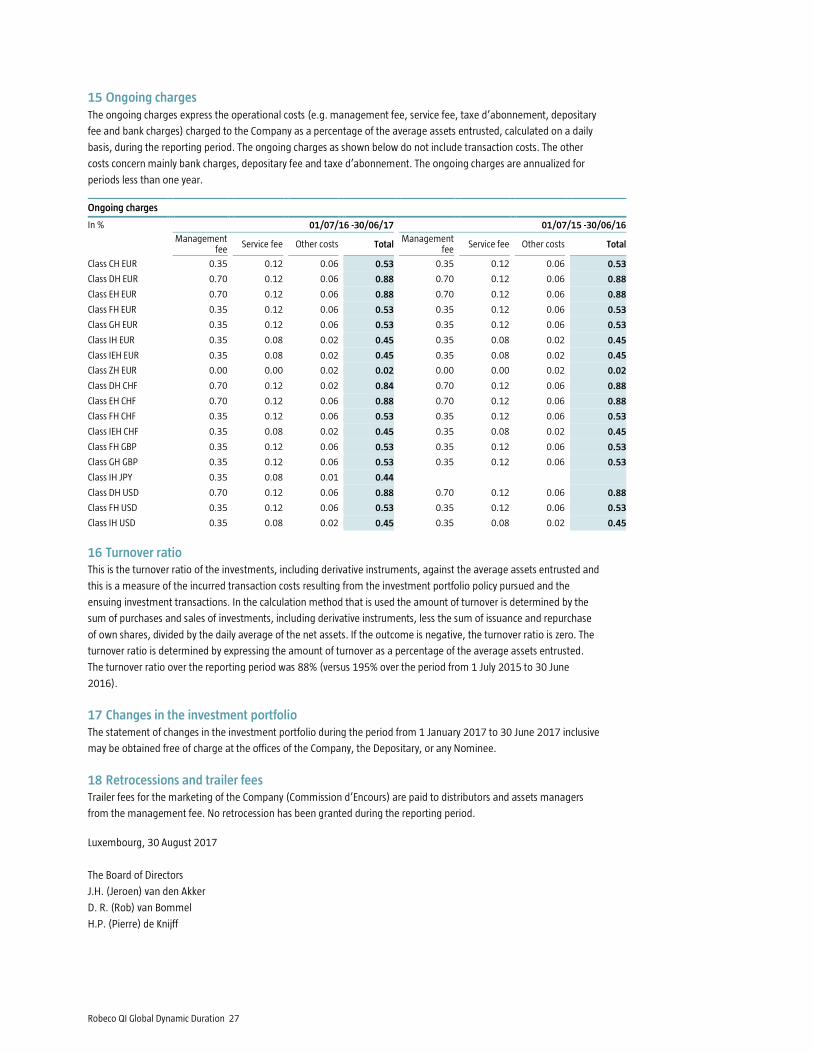
Robeco QI Global Dynamic Duration 27
15 Ongoing charges The ongoing charges express the operational costs (e.g. management fee, service fee, taxe d’abonnement, depositary
fee and bank charges) charged to the Company as a percentage of the average assets entrusted, calculated on a daily
basis, during the reporting period. The ongoing charges as shown below do not include transaction costs. The other
costs concern mainly bank charges, depositary fee and taxe d’abonnement. The ongoing charges are annualized for
periods less than one year.
Ongoing charges
In % 01/07/16 -30/06/17 01/07/15 -30/06/16
Management
fee Service fee Other costs Total
Management fee
Service fee Other costs Total
Class CH EUR 0.35 0.12 0.06 0.53 0.35 0.12 0.06 0.53
Class DH EUR 0.70 0.12 0.06 0.88 0.70 0.12 0.06 0.88
Class EH EUR 0.70 0.12 0.06 0.88 0.70 0.12 0.06 0.88
Class FH EUR 0.35 0.12 0.06 0.53 0.35 0.12 0.06 0.53
Class GH EUR 0.35 0.12 0.06 0.53 0.35 0.12 0.06 0.53
Class IH EUR 0.35 0.08 0.02 0.45 0.35 0.08 0.02 0.45
Class IEH EUR 0.35 0.08 0.02 0.45 0.35 0.08 0.02 0.45
Class ZH EUR 0.00 0.00 0.02 0.02 0.00 0.00 0.02 0.02
Class DH CHF 0.70 0.12 0.02 0.84 0.70 0.12 0.06 0.88
Class EH CHF 0.70 0.12 0.06 0.88 0.70 0.12 0.06 0.88
Class FH CHF 0.35 0.12 0.06 0.53 0.35 0.12 0.06 0.53
Class IEH CHF 0.35 0.08 0.02 0.45 0.35 0.08 0.02 0.45
Class FH GBP 0.35 0.12 0.06 0.53 0.35 0.12 0.06 0.53
Class GH GBP 0.35 0.12 0.06 0.53 0.35 0.12 0.06 0.53
Class IH JPY 0.35 0.08 0.01 0.44
Class DH USD 0.70 0.12 0.06 0.88 0.70 0.12 0.06 0.88
Class FH USD 0.35 0.12 0.06 0.53 0.35 0.12 0.06 0.53
Class IH USD 0.35 0.08 0.02 0.45 0.35 0.08 0.02 0.45
16 Turnover ratio This is the turnover ratio of the investments, including derivative instruments, against the average assets entrusted and
this is a measure of the incurred transaction costs resulting from the investment portfolio policy pursued and the
ensuing investment transactions. In the calculation method that is used the amount of turnover is determined by the
sum of purchases and sales of investments, including derivative instruments, less the sum of issuance and repurchase
of own shares, divided by the daily average of the net assets. If the outcome is negative, the turnover ratio is zero. The
turnover ratio is determined by expressing the amount of turnover as a percentage of the average assets entrusted.
The turnover ratio over the reporting period was 88% (versus 195% over the period from 1 July 2015 to 30 June
2016).
17 Changes in the investment portfolio The statement of changes in the investment portfolio during the period from 1 January 2017 to 30 June 2017 inclusive
may be obtained free of charge at the offices of the Company, the Depositary, or any Nominee.
18 Retrocessions and trailer fees Trailer fees for the marketing of the Company (Commission d’Encours) are paid to distributors and assets managers
from the management fee. No retrocession has been granted during the reporting period.
Luxembourg, 30 August 2017
The Board of Directors
J.H. (Jeroen) van den Akker
D. R. (Rob) van Bommel
H.P. (Pierre) de Knijff
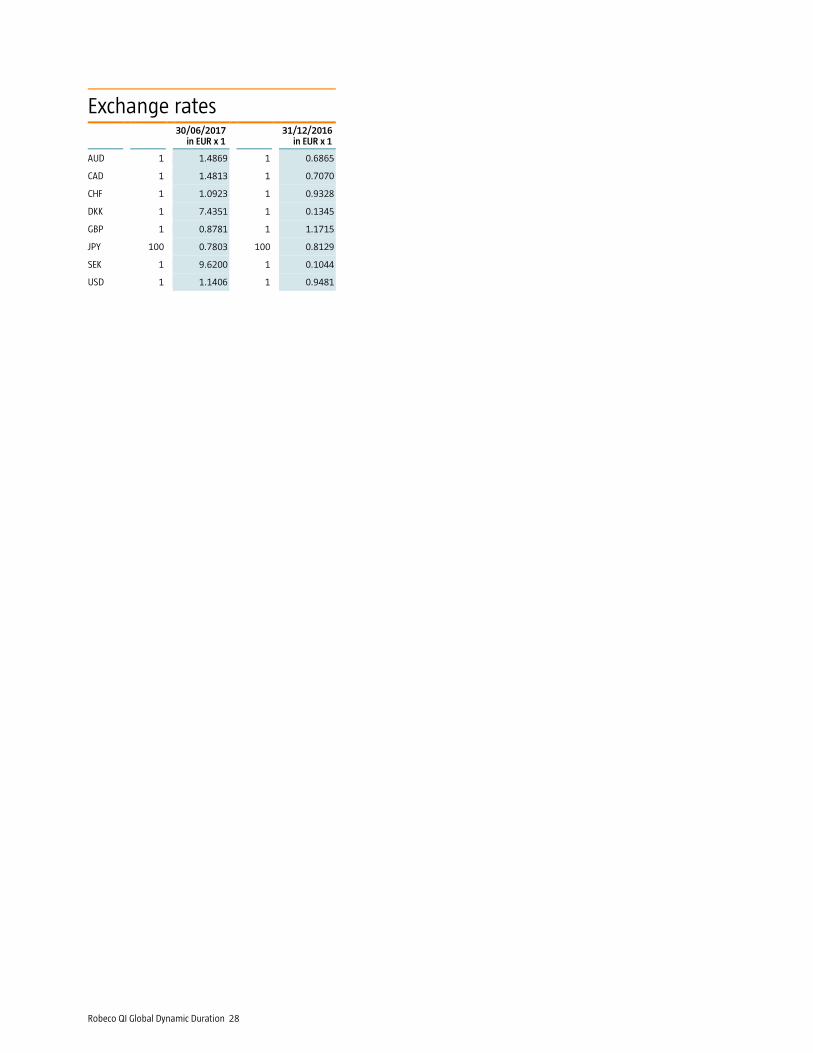
Robeco QI Global Dynamic Duration 28
Exchange rates
30/06/2017 in EUR x 1
31/12/2016
in EUR x 1
AUD 1 1.4869 1 0.6865
CAD 1 1.4813 1 0.7070
CHF 1 1.0923 1 0.9328
DKK 1 7.4351 1 0.1345
GBP 1 0.8781 1 1.1715
JPY 100 0.7803 100 0.8129
SEK 1 9.6200 1 0.1044
USD 1 1.1406 1 0.9481
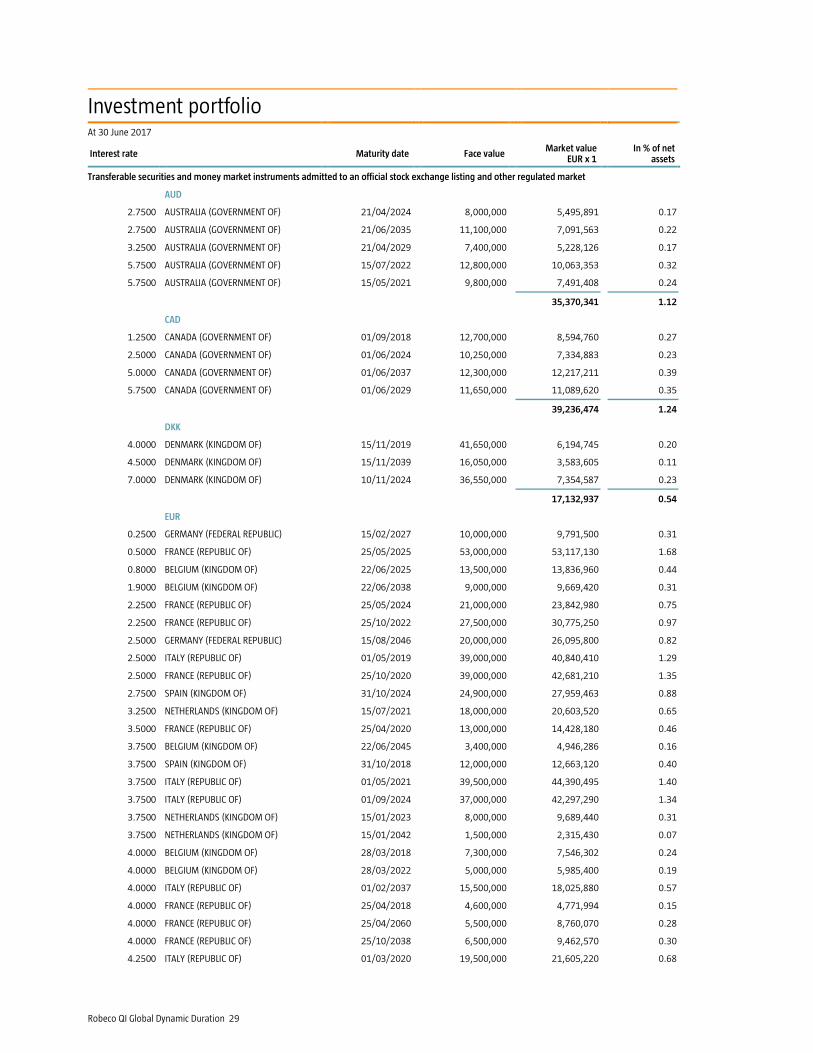
Robeco QI Global Dynamic Duration 29
Investment portfolio
At 30 June 2017
Interest rate Maturity date Face value Market value
EUR x 1
In % of net assets
Transferable securities and money market instruments admitted to an official stock exchange listing and other regulated market
AUD
2.7500 AUSTRALIA (GOVERNMENT OF) 21/04/2024 8,000,000 5,495,891 0.17
2.7500 AUSTRALIA (GOVERNMENT OF) 21/06/2035 11,100,000 7,091,563 0.22
3.2500 AUSTRALIA (GOVERNMENT OF) 21/04/2029 7,400,000 5,228,126 0.17
5.7500 AUSTRALIA (GOVERNMENT OF) 15/07/2022 12,800,000 10,063,353 0.32
5.7500 AUSTRALIA (GOVERNMENT OF) 15/05/2021 9,800,000 7,491,408 0.24
35,370,341 1.12
CAD
1.2500 CANADA (GOVERNMENT OF) 01/09/2018 12,700,000 8,594,760 0.27
2.5000 CANADA (GOVERNMENT OF) 01/06/2024 10,250,000 7,334,883 0.23
5.0000 CANADA (GOVERNMENT OF) 01/06/2037 12,300,000 12,217,211 0.39
5.7500 CANADA (GOVERNMENT OF) 01/06/2029 11,650,000 11,089,620 0.35
39,236,474 1.24
DKK
4.0000 DENMARK (KINGDOM OF) 15/11/2019 41,650,000 6,194,745 0.20
4.5000 DENMARK (KINGDOM OF) 15/11/2039 16,050,000 3,583,605 0.11
7.0000 DENMARK (KINGDOM OF) 10/11/2024 36,550,000 7,354,587 0.23
17,132,937 0.54
EUR
0.2500 GERMANY (FEDERAL REPUBLIC) 15/02/2027 10,000,000 9,791,500 0.31
0.5000 FRANCE (REPUBLIC OF) 25/05/2025 53,000,000 53,117,130 1.68
0.8000 BELGIUM (KINGDOM OF) 22/06/2025 13,500,000 13,836,960 0.44
1.9000 BELGIUM (KINGDOM OF) 22/06/2038 9,000,000 9,669,420 0.31
2.2500 FRANCE (REPUBLIC OF) 25/05/2024 21,000,000 23,842,980 0.75
2.2500 FRANCE (REPUBLIC OF) 25/10/2022 27,500,000 30,775,250 0.97
2.5000 GERMANY (FEDERAL REPUBLIC) 15/08/2046 20,000,000 26,095,800 0.82
2.5000 ITALY (REPUBLIC OF) 01/05/2019 39,000,000 40,840,410 1.29
2.5000 FRANCE (REPUBLIC OF) 25/10/2020 39,000,000 42,681,210 1.35
2.7500 SPAIN (KINGDOM OF) 31/10/2024 24,900,000 27,959,463 0.88
3.2500 NETHERLANDS (KINGDOM OF) 15/07/2021 18,000,000 20,603,520 0.65
3.5000 FRANCE (REPUBLIC OF) 25/04/2020 13,000,000 14,428,180 0.46
3.7500 BELGIUM (KINGDOM OF) 22/06/2045 3,400,000 4,946,286 0.16
3.7500 SPAIN (KINGDOM OF) 31/10/2018 12,000,000 12,663,120 0.40
3.7500 ITALY (REPUBLIC OF) 01/05/2021 39,500,000 44,390,495 1.40
3.7500 ITALY (REPUBLIC OF) 01/09/2024 37,000,000 42,297,290 1.34
3.7500 NETHERLANDS (KINGDOM OF) 15/01/2023 8,000,000 9,689,440 0.31
3.7500 NETHERLANDS (KINGDOM OF) 15/01/2042 1,500,000 2,315,430 0.07
4.0000 BELGIUM (KINGDOM OF) 28/03/2018 7,300,000 7,546,302 0.24
4.0000 BELGIUM (KINGDOM OF) 28/03/2022 5,000,000 5,985,400 0.19
4.0000 ITALY (REPUBLIC OF) 01/02/2037 15,500,000 18,025,880 0.57
4.0000 FRANCE (REPUBLIC OF) 25/04/2018 4,600,000 4,771,994 0.15
4.0000 FRANCE (REPUBLIC OF) 25/04/2060 5,500,000 8,760,070 0.28
4.0000 FRANCE (REPUBLIC OF) 25/10/2038 6,500,000 9,462,570 0.30
4.2500 ITALY (REPUBLIC OF) 01/03/2020 19,500,000 21,605,220 0.68
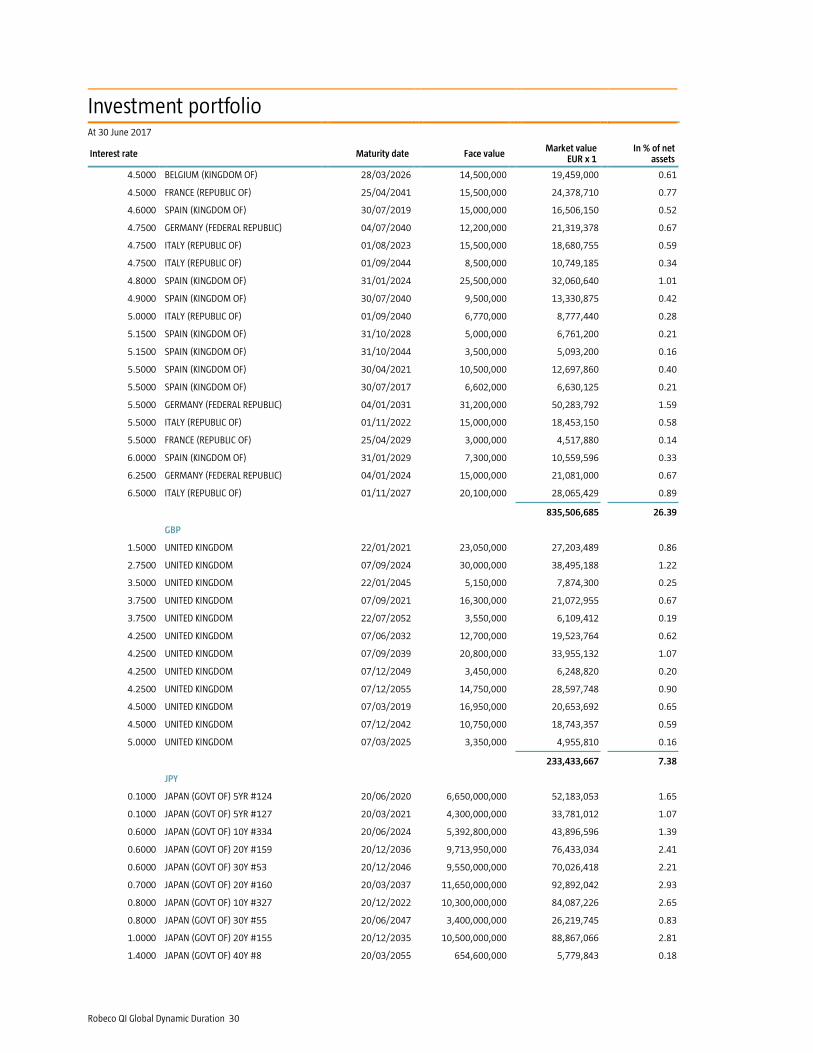
Robeco QI Global Dynamic Duration 30
Investment portfolio
At 30 June 2017
Interest rate Maturity date Face value Market value
EUR x 1
In % of net assets
4.5000 BELGIUM (KINGDOM OF) 28/03/2026 14,500,000 19,459,000 0.61
4.5000 FRANCE (REPUBLIC OF) 25/04/2041 15,500,000 24,378,710 0.77
4.6000 SPAIN (KINGDOM OF) 30/07/2019 15,000,000 16,506,150 0.52
4.7500 GERMANY (FEDERAL REPUBLIC) 04/07/2040 12,200,000 21,319,378 0.67
4.7500 ITALY (REPUBLIC OF) 01/08/2023 15,500,000 18,680,755 0.59
4.7500 ITALY (REPUBLIC OF) 01/09/2044 8,500,000 10,749,185 0.34
4.8000 SPAIN (KINGDOM OF) 31/01/2024 25,500,000 32,060,640 1.01
4.9000 SPAIN (KINGDOM OF) 30/07/2040 9,500,000 13,330,875 0.42
5.0000 ITALY (REPUBLIC OF) 01/09/2040 6,770,000 8,777,440 0.28
5.1500 SPAIN (KINGDOM OF) 31/10/2028 5,000,000 6,761,200 0.21
5.1500 SPAIN (KINGDOM OF) 31/10/2044 3,500,000 5,093,200 0.16
5.5000 SPAIN (KINGDOM OF) 30/04/2021 10,500,000 12,697,860 0.40
5.5000 SPAIN (KINGDOM OF) 30/07/2017 6,602,000 6,630,125 0.21
5.5000 GERMANY (FEDERAL REPUBLIC) 04/01/2031 31,200,000 50,283,792 1.59
5.5000 ITALY (REPUBLIC OF) 01/11/2022 15,000,000 18,453,150 0.58
5.5000 FRANCE (REPUBLIC OF) 25/04/2029 3,000,000 4,517,880 0.14
6.0000 SPAIN (KINGDOM OF) 31/01/2029 7,300,000 10,559,596 0.33
6.2500 GERMANY (FEDERAL REPUBLIC) 04/01/2024 15,000,000 21,081,000 0.67
6.5000 ITALY (REPUBLIC OF) 01/11/2027 20,100,000 28,065,429 0.89
835,506,685 26.39
GBP
1.5000 UNITED KINGDOM 22/01/2021 23,050,000 27,203,489 0.86
2.7500 UNITED KINGDOM 07/09/2024 30,000,000 38,495,188 1.22
3.5000 UNITED KINGDOM 22/01/2045 5,150,000 7,874,300 0.25
3.7500 UNITED KINGDOM 07/09/2021 16,300,000 21,072,955 0.67
3.7500 UNITED KINGDOM 22/07/2052 3,550,000 6,109,412 0.19
4.2500 UNITED KINGDOM 07/06/2032 12,700,000 19,523,764 0.62
4.2500 UNITED KINGDOM 07/09/2039 20,800,000 33,955,132 1.07
4.2500 UNITED KINGDOM 07/12/2049 3,450,000 6,248,820 0.20
4.2500 UNITED KINGDOM 07/12/2055 14,750,000 28,597,748 0.90
4.5000 UNITED KINGDOM 07/03/2019 16,950,000 20,653,692 0.65
4.5000 UNITED KINGDOM 07/12/2042 10,750,000 18,743,357 0.59
5.0000 UNITED KINGDOM 07/03/2025 3,350,000 4,955,810 0.16
233,433,667 7.38
JPY
0.1000 JAPAN (GOVT OF) 5YR #124 20/06/2020 6,650,000,000 52,183,053 1.65
0.1000 JAPAN (GOVT OF) 5YR #127 20/03/2021 4,300,000,000 33,781,012 1.07
0.6000 JAPAN (GOVT OF) 10Y #334 20/06/2024 5,392,800,000 43,896,596 1.39
0.6000 JAPAN (GOVT OF) 20Y #159 20/12/2036 9,713,950,000 76,433,034 2.41
0.6000 JAPAN (GOVT OF) 30Y #53 20/12/2046 9,550,000,000 70,026,418 2.21
0.7000 JAPAN (GOVT OF) 20Y #160 20/03/2037 11,650,000,000 92,892,042 2.93
0.8000 JAPAN (GOVT OF) 10Y #327 20/12/2022 10,300,000,000 84,087,226 2.65
0.8000 JAPAN (GOVT OF) 30Y #55 20/06/2047 3,400,000,000 26,219,745 0.83
1.0000 JAPAN (GOVT OF) 20Y #155 20/12/2035 10,500,000,000 88,867,066 2.81
1.4000 JAPAN (GOVT OF) 40Y #8 20/03/2055 654,600,000 5,779,843 0.18
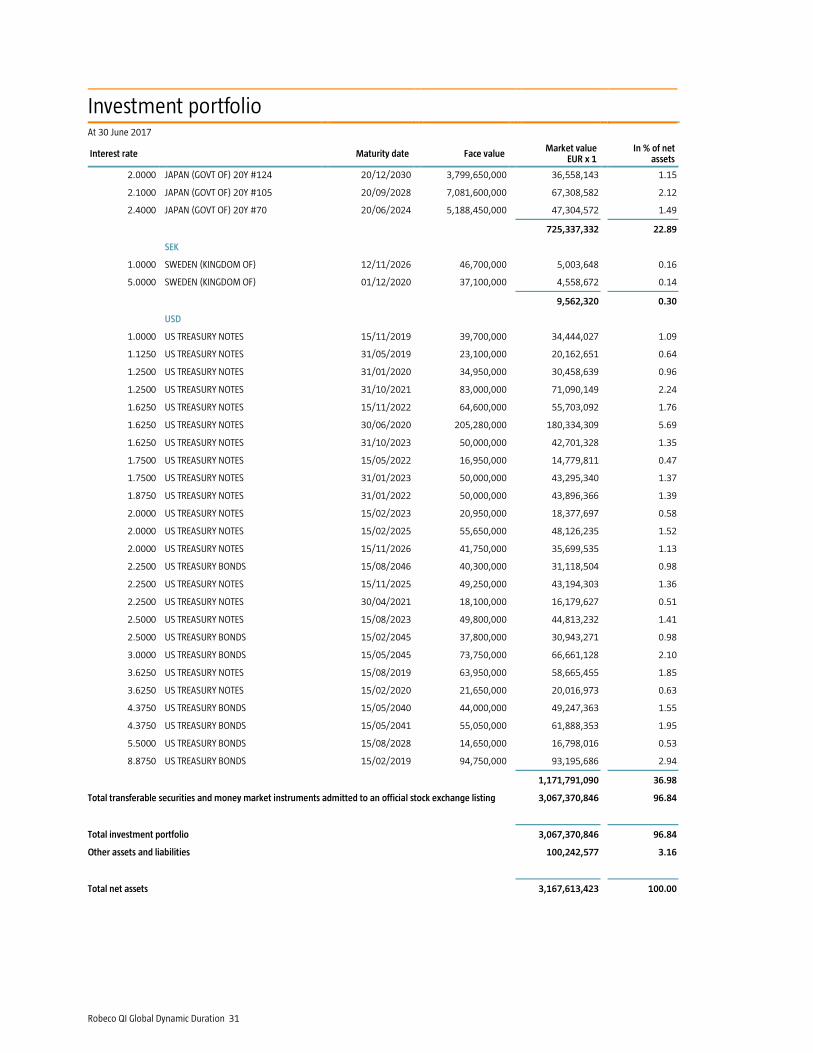
Robeco QI Global Dynamic Duration 31
Investment portfolio
At 30 June 2017
Interest rate Maturity date Face value Market value
EUR x 1
In % of net assets
2.0000 JAPAN (GOVT OF) 20Y #124 20/12/2030 3,799,650,000 36,558,143 1.15
2.1000 JAPAN (GOVT OF) 20Y #105 20/09/2028 7,081,600,000 67,308,582 2.12
2.4000 JAPAN (GOVT OF) 20Y #70 20/06/2024 5,188,450,000 47,304,572 1.49
725,337,332 22.89
SEK
1.0000 SWEDEN (KINGDOM OF) 12/11/2026 46,700,000 5,003,648 0.16
5.0000 SWEDEN (KINGDOM OF) 01/12/2020 37,100,000 4,558,672 0.14
9,562,320 0.30
USD
1.0000 US TREASURY NOTES 15/11/2019 39,700,000 34,444,027 1.09
1.1250 US TREASURY NOTES 31/05/2019 23,100,000 20,162,651 0.64
1.2500 US TREASURY NOTES 31/01/2020 34,950,000 30,458,639 0.96
1.2500 US TREASURY NOTES 31/10/2021 83,000,000 71,090,149 2.24
1.6250 US TREASURY NOTES 15/11/2022 64,600,000 55,703,092 1.76
1.6250 US TREASURY NOTES 30/06/2020 205,280,000 180,334,309 5.69
1.6250 US TREASURY NOTES 31/10/2023 50,000,000 42,701,328 1.35
1.7500 US TREASURY NOTES 15/05/2022 16,950,000 14,779,811 0.47
1.7500 US TREASURY NOTES 31/01/2023 50,000,000 43,295,340 1.37
1.8750 US TREASURY NOTES 31/01/2022 50,000,000 43,896,366 1.39
2.0000 US TREASURY NOTES 15/02/2023 20,950,000 18,377,697 0.58
2.0000 US TREASURY NOTES 15/02/2025 55,650,000 48,126,235 1.52
2.0000 US TREASURY NOTES 15/11/2026 41,750,000 35,699,535 1.13
2.2500 US TREASURY BONDS 15/08/2046 40,300,000 31,118,504 0.98
2.2500 US TREASURY NOTES 15/11/2025 49,250,000 43,194,303 1.36
2.2500 US TREASURY NOTES 30/04/2021 18,100,000 16,179,627 0.51
2.5000 US TREASURY NOTES 15/08/2023 49,800,000 44,813,232 1.41
2.5000 US TREASURY BONDS 15/02/2045 37,800,000 30,943,271 0.98
3.0000 US TREASURY BONDS 15/05/2045 73,750,000 66,661,128 2.10
3.6250 US TREASURY NOTES 15/08/2019 63,950,000 58,665,455 1.85
3.6250 US TREASURY NOTES 15/02/2020 21,650,000 20,016,973 0.63
4.3750 US TREASURY BONDS 15/05/2040 44,000,000 49,247,363 1.55
4.3750 US TREASURY BONDS 15/05/2041 55,050,000 61,888,353 1.95
5.5000 US TREASURY BONDS 15/08/2028 14,650,000 16,798,016 0.53
8.8750 US TREASURY BONDS 15/02/2019 94,750,000 93,195,686 2.94
1,171,791,090 36.98
Total transferable securities and money market instruments admitted to an official stock exchange listing 3,067,370,846 96.84
Total investment portfolio 3,067,370,846 96.84
Other assets and liabilities 100,242,577 3.16
Total net assets 3,167,613,423 100.00