Embed Size (px)
Citation preview
July 31, 2007 Robert Deegan Superintendent/President Palomar College 1140 W. Mission Rd. San Marcos, CA 92069 Dear Robert: We are pleased to convey to you the Institutional Report on results from the 2007 national administration of the Community College Survey of Student Engagement (CCSSE) for Palomar College. This letter provides important information about the contents of the report and about upgrades and additions to CCSSE services and resources for your college. Contents of the Institutional Report Notebook
an overview providing selected aggregate results for the 2007 CCSSE Cohort (see description below) and offering suggested ways to understand and use CCSSE data;
a “First Look” report, providing a summary of the items on which your college’s performance is
statistically and practically above or below the mean for the comparison group of community and technical colleges;
the “Frequency Report: All Students,” providing alongside each survey item the response frequencies for your institution and notation indicating items on which your institution’s results differ from the comparison group to a degree that is statistically and practically significant;
CCSSE’s standard reports on means comparisons and response frequencies for each survey item;
CCSSE benchmarks for your college, including an overview that describes the benchmarks for effective educational practice, with notes on interpretation and appropriate uses;
recommendations on “Using CCSSE Results,” as well as tips on how to communicate the results and then use the data to drive decision making at your institution;
results from the Community College Faculty Survey of Student Engagement (CCFSSE), if your college elected to participate in the third national administration of that survey in spring 2007, or, if your college did not participate in the faculty survey, we are providing an example report; and
a codebook for use in work with the data files.

Notes on CCSSE 2007 To support both understanding and use of the survey results, we would like to highlight the following features of the information you are receiving from CCSSE:
CCSSE now utilizes a 3-year cohort of participating colleges in all of its data analyses, including the computation of benchmark scores. The cohort of colleges that participated in 2005 through 2007 is referred to as the 2007 CCSSE Cohort throughout all reports and documentation. This approach increases the total number of institutions and students contributing to the national dataset, which in turn increases the reliability of the overall results. In addition, the 3-year cohort approach minimizes the impact, in any given year, of participation by statewide consortia.
Institutional data will be available on the CCSSE Web site at the time you receive this Institutional
Report. This enables people in your college to generate a wide variety of custom reports using the award-winning interactive capabilities at www.ccsse.org.
In addition, you can now download an electronic version of your Institutional Report and data file
by following the instructions at: http://www.ccsse.org/members/IR/. You will need your Members Only username and password to log on. Note that the file is password protected; you will also need your Members Only password to unzip it. Access to your files will be available on the CCSSE Web site until September 15th. (Because reports are available on the Web, we are not including a CD-ROM with this hard copy of your Institutional Report. If you would like a CD-ROM of your Institutional Report of results, we will create and ship one for $25.) In accordance with Texas state law and The University of Texas policies, CCSSE will no longer provide student-identifier data in the Institutional Report raw data file available for download via the CCSSE Web site. For those colleges that depend upon the student identifier field in the CCSSE raw data file for institutional analyses, we will be happy to release that information in a separate and secure transmission. If you would like these data, please contact your liaison, and CCSSE will provide you the raw data file with student identifiers included on an encrypted CD-ROM. The decryption password will be supplied in an email.
CCSSE has established a regular feature that will allow participating colleges and national
researchers to delve more deeply into areas of student experience and institutional performance that are key to student success. The five 2007 “special focus questions” elicited new information about students’ educational experiences during their earliest weeks of college. Results from these responses are provided in the Frequency Distributions section of your Institutional Report and will be highlighted in CCSSE’s 2007 National Report. In future years, the special focus will be determined by college interests and national trends.
As you know, we believe strongly that completion of the survey and reporting of the results are only the beginning of an important process for your institution. Communication of the results to key groups – both internally and externally – is the next significant step. And using the results to improve student learning and retention is, of course, the ultimate goal. As part of our effort to support you in this work, CCSSE provides a number of tools and resources in the “Members Only” section of the CCSSE Web site at www.ccsse.org. Included are tips for understanding and using survey results, along with templates for a local executive summary of survey results and a PowerPoint presentation, etc. Your institutional username and password for access to the Members Only section of the Web site are: Username: Palomar Password: KEQAVKFQ In addition, these useful companion resources are available free on the CCSSE Web site: the Course Feedback Form, an end-of-course evaluation instrument that is aligned with CCSSE items on effective educational practice; a Classroom Observation Form, developed for local use in faculty development and evaluation programs; a Focus Group Toolkit including all the materials needed to plan and conduct student focus groups that may add rich qualitative data to your understanding of student engagement;

and a 6-part Accreditation Toolkit (one version for each of the regional accrediting associations) that provides guidance on using student engagement results in the self-study and reaffirmation process. New from CCSSE: the Survey of Entering Student Engagement (SENSE) Across the country, community college leaders are recognizing the critical importance of focusing institutional attention on students’ experience during their earliest weeks of college. In order to support efforts to strengthen student success by improving strategies for working with new students, CCSSE is developing a new Survey of Entering Student Engagement. With support provided by the Lumina Foundation and the Houston Endowment, Inc., the new survey will be piloted at 22 community colleges in fall 2007. Shortly thereafter, we will issue an invitation to participate in the fall 2008 national field test. Stay tuned for additional information. Once again, we send our thanks for your involvement in CCSSE and your efforts to ensure the quality of community college education. With best regards,
Kay McClenney Director

Annotated Table of Contents
Annotated Table of Contents Page � of 4
Community College Surveyof Student Engagement
CCSSE Overview
Overview of National 2007 CCSSE Cohort Survey Results (pp. �-�8)The overview provides a general understanding of the findings from the 2007 CCSSE
Cohort. The information includes an examination of member colleges and consortia composition, comparisons between CCSSE institutions and all students at public community
colleges, a review of selected findings, and information on understanding your results.
2007 CCSSE Cohort FrequenciesThis report provides item-by-item percentage responses for the 2007 CCSSE Cohort (students who
participated in CCSSE from 2005 through 2007). It is designed to provide a summary of the results contained in the Frequency Distributions Report and is presented in the same layout as The Community College Student Report.
College Results: A Synopsis
Table �: Respondents to Underlying Populations This table details respondent characteristics from your college compared to population data for
(1) your college, (2) similarly-sized 2007 CCSSE Cohort colleges, and 3) all 2007 CCSSE Cohort colleges. The specific characteristics examined include gender, race/ethnicity, age, and enrollment status.
First Look: All Students This report for all students at your institution highlights those items where your college falls notably
above or below the mean of your comparison group. It is designed to provide a summary of results displayed following the Means Summary tab.
First Look: Enrollment Status Breakout This report by enrollment status (part- and full-time) highlights those items where your college falls
notably above or below the mean of your comparison group. It too is designed to provide a summary of results displayed following the Means Summary tab.
Frequency Report: All Students This report provides item-by-item percentage responses for all students at your institution. In addition,
the far right column contains asterisks indicating those items that are significantly different, when applicable, from your comparison group at p < .001 and with an effect size greater than or equal to .2.
Means Summary
Means Summary Report: All Students (pp. M�-M9) This report provides item-by-item means for all students at your institution contrasted with a

Annotated Table of Contents Page 2 of 4
comparison group and the 2007 CCSSE Cohort.
Summary Statistics: All Students (pp. M�0-M�3) This report presents statistics on all students at your institution contrasted with a comparison group
and the 2007 CCSSE Cohort.
Means Summary Report: Enrollment Status Breakout (pp. M�4-M22) This report provides item-by-item means for all students at your institution by enrollment status
(part- and full-time) contrasted with a comparison group and the 2007 CCSSE Cohort.
Summary Statistics: Part-Time Students (pp. M23-M26) This report presents statistics on part-time students at your institution contrasted with a comparison
group and the 2007 CCSSE Cohort.
Summary Statistics: Full-Time Students (pp. M27-M30) This report presents statistics on full-time students at your institution contrasted with a comparison
group and the 2007 CCSSE Cohort.
Frequency Distributions
Frequency Distributions by Enrollment Status and All Students (pp. F�-F�4) This report summarizes the observed frequencies of occurrence (counts and percentages) of the values
for each item on The Community College Student Report. Data are presented for all, part-time, and full-time students at your college, a comparison group, and the 2007 CCSSE Cohort. Please note: certain demographic items (gender, race/ethnicity, age, and enrollment status) do not appear on this report but can be found in Table 1.
2007 CCSSE Special Focus Questions Frequencies This report summarizes the observed frequencies of occurrence (counts and percentages) of the values
for the five CCSSE Special Focus Questions included with the Community College Student Report. Data are presented for all, part-time, and full-time students at your college, a comparison group, and the 2007 CCSSE Cohort.
2007 Consortium Supplemental Questions Frequencies�
This report summarizes the observed frequencies of occurrence (counts and percentages) of the values for your consortium’s supplemental questions only. Data are presented for all, part-time, and full-time students at your college compared to your consortium.
2007 Institution-Level Supplemental Questions Frequencies2
This report summarizes the observed frequencies of occurrence (counts and percentages) of the values for your institution’s supplemental questions only. Data are presented for all, part-time, and full-time students at your college.
� You will only receive the 2007 Consortium Supplemental Questions Frequencies Report if your college participated in a CCSSE consortium that chose to add specific questions to the survey.
2 You will only receive the 2007 Institution-Level Supplemental Questions Frequencies if your college participated in the 2007 Institution-Level Supplemental Questions Pilot.

Annotated Table of Contents Page 3 of 4
Benchmark Reports
2007 Benchmark Overview (pp. �-5) The overview provides detailed information about CCSSE’s Five Benchmarks of Effective Educational
Practice (Active and Collaborative Learning, Student Effort, Academic Challenge, Student-Faculty Interaction, and Support for Learners), information to aid in understanding and using the benchmarks, and CCSSE’s policy statement on the “Responsible Uses of CCSSE Data.”
2007 Benchmark Summary Table, Deciles, and Bar Charts and Benchmark Item Composition: All Students (pp. B�-B7)3
This is a series of reports, beginning with a Summary Table, which provides scores on each of the five benchmarks for your institution, a comparison group, and the 2007 CCSSE Cohort colleges. Meanwhile, the Benchmark Deciles Report, on page B2, highlights the five benchmark deciles for all students at your institution. Finally, the third report – Bar Charts and Benchmark Item Composition ─ uses bar charts to represent the data provided in the summary table, for all students for each benchmark (pp. B3 - B7).
2007 Benchmark Summary Table, Deciles, and Bar Charts and Benchmark Item Composition: Enrollment Status Breakout (pp. B8-B�9)
This series of reports contains the same reports described above broken down by enrollment status (part- and full-time) for your institution, a comparison group, and 2007 CCSSE Cohort colleges.
2007 Benchmark Summary Table, Deciles, and Bar Charts and Benchmark Item Composition: Credit Hour Status Breakout (pp. B20-B3�)
This series of reports contains the same reports described above broken down by credit hour status (0 to 29 and 30+ credits) for your institution, a comparison group, and the 2007 CCSSE Cohort colleges.
Codebook
2007 Codebook (pp. �-�3) The codebook provides information on the structure, contents, and layout of the CCSSE dataset.
2007 Consortium Supplemental Questions Codebook4 The codebook includes the exact items used as additional questions for your consortium, variable names associated with additional survey items, and response values for each variable.
2007 Institution-Level Supplemental Questions Codebook5 The codebook includes the exact items used as additional questions for your institution, variable names associated with additional survey items, and response values for each variable.
Using CCSSE Results (pp. 1-7)
This section provides a series of recommendations on interpreting and communicating your CCSSE results as well as ideas on ways to use data to drive decision making at your institution.
3 Please note that for consortium comparison reports, there are no decile reports; therefore, page numbers will not correspond exactly to those listed below. 4 You will only receive the 2007 Consortium Supplemental Questions Codebook if your college participated in a CCSSE consortium that chose to add specific questions to the survey.
5 You will only receive the 2007 Institution-Level Supplemental Questions Codebook if your college participated in the 2007 Institution-Level Supplemental Questions Pilot.

Annotated Table of Contents Page 4 of 4
CCFSSE
Overview of National 2007 CCFSSE Cohort Survey Results (pp. �-9) The overview provides a general understanding of the project and highlights selected findings from the
2007 cohort of colleges participating in the faculty survey.
2007 CCFSSE Cohort Colleges An alphabetical list of all institutions participating in the CCFSSE from 2005 through 2007.
Student and Faculty Frequency Distributions (pp. SFC�-FF�0) The first report provides side-by-side frequency data from faculty (part-time, full-time, and all faculty), and
all-student data from the 2007 CCSSE administration for your institution. The second report summarizes the observed frequencies of occurrence (counts and percentages) of the values for all faculty survey items that do not correspond to similar items on the student survey. Example reports are provided if your institution did not participate.
2007 CCFSSE Cohort Participating Faculty Report (pp. SFC�-FF�0) This report provides aggregated side-by-side frequency data as well as frequency distributions for the
2007 CCFSSE Cohort colleges.
2007 CCFSSE Codebook (pp. �-�3) The codebook provides information on the structure, contents, and layout of the CCFSSE dataset.

Community College Survey of Student Engagement
2007 Institutional Report Overview of National 2007 CCSSE Cohort
Survey Results
Overview of National 2007 CCSSE Cohort Survey Results Page � of �8
1 For returning participants, the college’s most recent year of participation is included in data analyses. For example, if a college participated in 2005 and 2007, only the 2007 data would be used in the three-year cohort.2 Size classifications are based on the college’s enrollment size during their most recent year of CCSSE participation; this may or may not match the college’s current size classification.3 These designations are based on the Carnegie Foundation Classification of Institutions of Higher Education.
Introduction The Community College Survey
of Student Engagement (CCSSE) provides information about effective
educational practice in community colleges and assists institutions in using
that information to promote improvements in student learning and persistence. CCSSE’s
goal is to provide member colleges with results that can be used to inform decision making
and target institutional improvements. Student engagement, or the amount of time and energy that
students invest in meaningful educational practices, is the underlying foundation for CCSSE’s work. CCSSE’s survey instrument, the Community College Student Report (CCSR), is designed to capture student engagement as a measure of institutional quality.
CCSSE again this year has used a three-year cohort of participating colleges (2005 through 2007) in all of its data analyses, including the computation of benchmark scores. This cohort is referred to as the 2007 CCSSE Cohort throughout all reports and documentation.�
This approach increases the total number of institutions and students contributing to the national dataset, which in turn increases the reliability of the overall results. In addition, the three-year cohort approach minimizes the impact, in any given year, of participation by statewide consortia.
This overview encompasses four key sections and is organized to provide a general understanding of findings from the 2007 CCSSE Cohort. First, 2007 CCSSE Cohort colleges and student respondents are highlighted as well as data concerning the 2007 CCSSE Consortia. Second, CCSSE institutions and their students are compared to all U.S. public community colleges. In the third section, selected findings are showcased. In the fourth section, information is provided to help college leaders understand and use their CCSSE results.
CCSSE Member Colleges
The 2007 CCSSE Cohort is comprised of a total of 525 institutions across 48 states, plus British Columbia and the Marshall Islands. Two hundred sixty of these member colleges are classified as small (< 4,500), 136 as medium (4,500-7,999), 83 as large (8,000-14,999), and 46 as extra-large institutions (�5,000 + credit students).2 One hundred two of the Cohort member colleges are classified as urban-serving, ��3 as suburban-serving, and 3�0 as rural-serving.3
CCSSE ConsortiaA CCSSE consortium may comprise three or more colleges in a multi-college district, system, or state ─ or alternatively, a group of five or more colleges with common interests or challenges. Consortium members share reports and can add customized questions to the survey.
2007 CCSSE membership includes statewide participation in Alaska, Florida, Louisiana, Massachusetts, North Dakota, and Wyoming; other state-based consortia include Illinois, Kentucky, Minnesota, Northeast Minnesota, South Carolina, Tennessee, and Texas. The Alaska, Florida, Illinois, Kentucky, Massachusetts, Minnesota, Northwest, South Carolina, and Wyoming consortia added questions to the Community College Student Report for purposes of statewide assessment, to respond to accrediting agencies, and/or for internal review.
All colleges from Alamo Community College District and North Harris Montgomery Coummunity College District in Texas are participating as CCSSE consortia. Also, the Northwest Consortium is comprised of six Washington community colleges and one community college located in British Columbia.
Launched in 2006, the Student Support Partnership Integrating Resources and Education (SSPIRE) Initiative is supported by the James Irvine Foundation and includes nine California community colleges. SSPIRE colleges aspire to raise academic achievement, rates of persistence, and degree completion among primarily young, low-income, under-prepared, and traditionally underserved students. The CCSSE-SSPIRE Consortium provides opportunities

Overview of National 2007 CCSSE Cohort Survey Results Page 2 of �8
4 See exclusionary rules on pg. 3
for SSPIRE colleges to review CCSSE and CCFSSE results, discuss those results and needs for improvement during specialized CCSSE workshops, and implement improvement initiatives that focus on SSPIRE goals.
This is the third year for the Achieving the Dream Consortium. The Achieving the Dream Consortium comprises 22 colleges from 7 states that are part of a national initiative focused on improving success rates for community college students, particularly those that traditionally have been underserved in American higher education.
The Hispanic Student Success (HSS) Consortium is a group of colleges that are designated by the federal government as Hispanic-Serving Institutions (those with at least 25% Hispanic full-time equivalent enrollment and of the Hispanic student enrollment at least 50% are low income) and/or hold current membership in the Hispanic Association of Colleges and Universities (HACU). Also in its fourth year, the HSS Consortium brings together �5 institutions across six states to build collaborative and networking relationships and to highlight promising practices through publications and at national and regional community college conferences. This consortium also adds questions to the Community College Student Report and will use CCSSE data and comparative reports to make informed decisions about how to improve these unique institutions.
This is the fourth year for the Texas Small Colleges Consortium. These �0 Texas small community colleges have joined CCSSE to gain valuable information about the engagement, learning, and retention of the students they serve -- and to build institutional capacity for collecting, understanding, and using data about educational practices and student success. With support from the Houston Endowment, Inc., six of the institutions gathered and reviewed baseline data in 2005, sought to implement necessary changes for improvement in 2006, and have administered a follow-up survey this year.
Student Respondents
Credit classes are randomly selected – stratified by time of day (morning, afternoon, and evening) – from institutional class data files to participate in the survey. Of those sampled, 3�0,0�3 students submitted usable surveys. The number of completed surveys produced an overall “percent of target” rate of 79%. Percent of target rate is the ratio of the adjusted number of completed surveys to target sample sizes. The adjusted survey count is the number of usable surveys that were filled out properly and did not fall into any of the exclusionary categories.4
Student Respondent Profile To compare the characteristics of student respondents to the characteristics of the underlying student population for each participating college, CCSSE uses the data reported by the institution in its most recent IPEDS Enrollment Report for the following variables: gender, race and ethnicity, student age, and enrollment status (part- or full-time). The data are aggregated to compare the 2007 CCSSE Cohort survey respondent population to the total student population of the 2007 CCSSE Cohort member colleges.
GenderOf the 301,506 student respondents who answered this item, 40% are male and 60% are female. This mirrors the full population of 2007 CCSSE Cohort community college students, comprised of 4�% males and 59% females.
Age2007 CCSSE Cohort student respondents range in age from 18 to 65+. Approximately 90% are between 18 and 39; 66% are 18 to 24, while 24% are 25 to 39.
Racial IdentificationSixty-five percent of student respondents identify themselves as White/non-Hispanic, 11% as Hispanic/Latino/Spanish, �2% as Black or African American, and 5% as Asian. Two percent of the student respondents are Native American. Four percent marked “other” when responding to the question, “What is your racial identification?”
International StudentsResponses to the question, “Are you an international student or foreign national?” reflect variations related to college size. Four percent of small college respondents indicate that they are international students, while 5% of medium-size college respondents indicate the same. In large institutions, 9% of the students who completed the survey indicate international/foreign student status. Extra-large institutions have the highest representation of international students at �0%.
Enrollment StatusSixty-nine percent of the student respondents report attending college full-time, while 37% of the 2007 CCSSE Cohort colleges’ total student population attended full-time. Only 3�% of the surveyed students report being part-time college students, compared to 63% as reported to IPEDS. This inverse representation is a result of the sampling technique and the in-class administration process. For this reason, survey results are either weighted or disaggregated on the full-time/part-time variable so that reports will accurately reflect the underlying student population.

Overview of National 2007 CCSSE Cohort Survey Results Page 3 of �8
5 If a student does not answer any of the 21 sub-items on item 4, answers “Very Often” to all 21 items, or answers “Never” to all, the survey is excluded.
The results for the following student respondent categories are weighted according to the most recent IPEDS population data.
Limited English Speaking StudentsStudents with limited English speaking skills, or those whose native language is not English, comprise a significant proportion of students in community colleges. Among CCSSE participants, small institutions include 6% non-native English speakers, while �0% of medium institutions’ students are non-native English speakers. Comparatively, large numbers of non-native English speaking students attend large (�7% of enrollees) and extra-large institutions (24%).
First-Generation StatusThirty-four percent of students indicate that neither parent has earned a degree higher than a high school diploma nor has college experience; accordingly, these students are considered “first-generation” status. Of these first-generation students who provided responses for mother’s and father’s education level, 66% percent indicate that their mothers’ highest level of education is a high school diploma, and 61% indicate that level for their fathers.
Educational AttainmentSixty-eight percent of the respondents report starting their college careers at the community college where they completed the survey. Meanwhile, 73% of students indicate that their highest level of educational attainment is a high school diploma or GED; 18% report either a certificate or an associate degree; 5% have earned a bachelor’s degree; and 2% have earned an advanced degree.
Credit Hours Earned Forty-six percent of students report having completed fewer than �5 credit hours; 2�% have completed �5-29 credit hours; and 33% have completed more than 30 credit hours.
GradesForty-four percent of students report that they earned grades of B+ or higher, while 2% of students report that they earned grades of C- or lower.
External CommitmentsFifty-seven percent of students work 2� or more hours per week; 23% of students care for dependents between � and 10 hours per week; and 69% of students spend between 1 and 5 hours per week commuting to and from class.
Excluded RespondentsThe total counts of respondents in an institution’s raw data file will differ from the numbers reported in the institutional reports due to intentional exclusion of certain surveys. Exclusions serve the purpose of ensuring that all institutional reports are based on the same sampling methods and that results are therefore comparable across institutions. Respondents may be excluded from institutional reports for the following reasons:
The respondent did not indicate whether he or she was enrolled part- or full-time at the institution. Because all results are either weighted or broken down by enrollment status, this is essential information for reporting.
The survey is invalid.5
The student reported his or her age as under �8. The student indicated that he or she had taken the
survey in a previous class or did not respond to the item.
Oversampled respondents are not included. These are surveys that individual institutions paid an additional fee to acquire. Because there are no requirements stipulating how these students are sampled, these data are not included in the standard institutional report.
Respondents Included in the College’s Raw Data FileRaw data files contain responses from all students who completed the CCSR, including oversample and/or on-line respondents, with the exception of invalid surveys and those completed by students under the age of �8.

Overview of National 2007 CCSSE Cohort Survey Results Page 4 of �8
Table 1: Colleges by Size and Urbanicity
2007 CCSSE Cohort Member
Colleges
National Population7
2007 CCSSE Cohort Proportion
of National Population
By Size
# of Institutions 5�8 �,047 49%
Small (up to 4,499) 254 561 45%
Medium (4,500-7,999) 136 238 57%
Large (8,000-14,999) 82 �5� 54%
Extra-Large (15,000+) 46 97 47%
By Urbanicity
# of Institutions 5�8 �,059 49%
Urban-serving �0� �87 54%
Suburban-serving ��0 22� 50%
Rural-serving 307 651 47%
6 Hospital-based institutions, private institutions, and institutions located outside the fifty states are not included in representation charts.7 Includes all colleges in the target population that have valid IPEDS data.
RepresentationCCSSE Institutions Compared to All U.S. Public Community Colleges
Table � provides information about the representation of the 2007 CCSSE Cohort member colleges as compared to community and technical colleges across the nation.6 CCSSE uses the most recent IPEDS enrollment data for comparisons in this table.

Overview of National 2007 CCSSE Cohort Survey Results Page 5 of �8
Table 2: Enrollments by Size and Urbanicity
Students Enrolled in 2007 CCSSE Cohort Member
Colleges
National Student Population in
Community Colleges
Proportion of Students Enrolled
in 2007 CCSSE Cohort Member
CollegesCredit
EnrollmentCredit
Enrollment
3,391,101 CCSSE students
6,365,137 national population 53%
By Size
Small (up to 4,499) 611,747 �,249,83� 49%
Medium (4,500-7,999) 784,322 �,395,08� 56%
Large (8,000-14,999) 896,192 1,634,076 55%
Extra-Large (15,000+) �,098,840 2,086,149 53%
By Urbanicity
Urban-serving �,2�9,7�� 2,�42,387 57%
Suburban-serving 997,4�5 �,938,3�3 5�%
Rural-serving �,�73,975 2,284,437 5�%
CCSSE Member College Enrollments Compared to All U.S. Public Community Colleges
Table 2 shows the number of credit-enrolled students from CCSSE member colleges as compared to the number across the nation by size and urbanicity.8 Overall, CCSSE’s 2007 Cohort survey respondents represent a total credit enrollment of 3,39�,�0� students across 5�8 CCSSE member colleges. CCSSE’s entire college membership represents approximately 49% of the nation’s community colleges (�,059 accredited, public associate degree-granting institutions) and 53% of the national student population (6,365,137 credit students).
8 Hospital-based institutions, private institutions, and institutions located outside the fifty states are not included in representation charts.

Overview of National 2007 CCSSE Cohort Survey Results Page 6 of 18
Table 3: Adjusted Respondents by Size and Urbanicity
2007 CCSSE Cohort Member Colleges’
Adjusted Respondents9
2007 CCSSE Cohort Member Colleges’
EnrollmentsRespondents Credit Enrollments
310,013 students (�00%) 3,404,271 students (�00%)
By Size
Small (up to 4,499) �05,787 (34%) 616,121 (�8%)
Medium (4,500-7,999) 86,636 (28%) 784,322 (23%)
Large (8,000-14,999) 68,500 (22%) 904,988 (27%)
Extra-Large (15,000+) 49,090 (16%) �,098,840 (32%)
By Urbanicity
Urban-serving 75,776 (24%) �,220,473 (36%)
Suburban-serving 78,641 (26%) �,007,42� (30%)
Rural-serving 155,596 (50%) 1,176,377 (34%)
9 Minus exclusions (see exclusionary rules on pg. 3).
CCSSE Student Respondents across Member Institutions
Table 3 shows a comparison of the adjusted number of CCSSE cohort survey respondents displayed alongside the total student enrollment at participating colleges. The column labeled “2007 CCSSE Cohort Member Colleges Adjusted Respondents” shows the number of usable surveys (those not affected by CCSSE’s exclusionary rules). The column labeled, “2007 CCSSE Cohort Member Colleges Enrollments” reflects institutions’ populations as reported to IPEDS for the most recent enrollment reports.
These data are displayed by institutional size (small, medium, large, and extra-large) as well as urbanicity (rural, suburban, and urban). The data from Table 3 highlight an over-representation of student respondents from small institutions, which in turn results in an under-representation of respondents from extra-large colleges.

Overview of National 2007 CCSSE Cohort Survey Results Page 7 of �8
Selected FindingsMany crucial questions that community colleges need answered — What are our students’ goals? What issues keep our students from persisting? How effectively are we engaging students in the classroom? How satisfied are our students with the support services we offer? — can be answered by investigating the percentage of student responses to specific CCSSE survey items.
This section on Selected Findings from the 2007 CCSSE Cohort data is organized in terms of seven key topics: Educational Goals, Time on Task, Relationships, Academic Experience, Barriers to Persistence, Student Satisfaction, and Student and Academic Support Services.
Educational GoalsCommunity colleges have multiple missions and goals, as do their students. Students responding to the survey are given the opportunity to mark Primary Goal, Secondary Goal, or Not a Goal in response to a list of possible goals for attending their particular college. As a result, many students mark more than one primary goal; therefore, the percentages in the table below do not sum to �00%.
As seen in Table 4, students identify various educational goals. Fifty-eight percent of the student respondents identify obtaining an associate degree as a primary goal. Fifty-one percent are interested in transferring to a 4-year college or university, while 4�% are primarily interested in obtaining or updating job-related skills. Twenty-nine percent of respondents seek to change careers, and 29% aspire to complete a certification program.
Time on TaskStudents’ behaviors contribute significantly to their learning and the likelihood that they will attain their educational goals. “Time on task” is a key variable, and there are a variety of settings and means through which students may apply themselves to the learning process.
Table 4: Educational Goals
Primary goal
Secondary goal Not a goal
Complete a certification program 29% �9% 52%
Obtain an associate degree 58% 2�% 2�%
Transfer to a 4-year college or university 5�% 2�% 27%
Obtain or update job-related skills 4�% 27% 32%
Self-improvement/personal enjoyment 39% 35% 26%
Change careers 29% 16% 55%
Table 5: Time on Task
Part-time Full-time
5 hours or fewer
6-20 hours
More than 21 hours
5 hours or fewer
6-20 hours
More than 21 hours
Preparing for class 5�% 43% 6% 38% 50% �2%
Working for pay �9% �4% 66% 3�% 24% 46%
Participating in college-sponsored activities 97% 3% 0% 93% 6% 2%
Table 5 highlights that only �2% of full-time students spend more than 2� hours per week preparing for class while 38% spend 5 hours or fewer preparing for class.

Overview of National 2007 CCSSE Cohort Survey Results Page 8 of �8
0%10%20%30%40%50%60%70%80%90%
Less favorable(1 through 3)
(4) More favorable(5 through 7)
Figure 1: Relationships
Relationships with other studentsRelationships with instructorsRelationships with administrative personnel and offices
Not surprisingly, part-time students spend more time working for pay, more than 2� hours per week, than their full-time counterparts (66% vs. 46%); however, these findings highlight the competing priorities facing all students attending community colleges. Finally, there is minimal participation in college-sponsored activities among all students.
RelationshipsMany educators believe in the power of their individual connections to students – a belief that is supported by higher education research as well. In point of fact, the level of student-faculty interaction is one of the most powerful predictors of student persistence in college. And, in numerous focus groups conducted with community college students, it was found that when asked to cite the factor that was most important in helping them stay in school and succeed there, students inevitably talk about relationships.
Various items on the survey can address the level and extent of students’ relational experience while attending the college. Item 4q on the survey asks students to indicate how often they worked with instructors on activities other than coursework. Nearly three-fourths (72%) indicated they “Never” engaged in such activities. When asked how much their college encouraged contact among students from different economic, social, and racial or ethnic backgrounds, 47% stated that this occurred “Quite a bit/
Very much.” Over two-thirds (70%) indicated that their college provided “Some/Very little” of the support needed to thrive socially while only 9% indicated this occurred “Very much.” Finally, 78% of their friends are “Quite a bit/Extremely” supportive of their attending the college while 86% of their families were supportive of this decision.
Figure � highlights results from item �� on the survey, which ask specifically about students’ relationships with other students, instructors, and administrative personnel and offices at the college. Overall, students gave high ratings to their relationships. Regarding relationships with other students, respondents judged the quality of their relationships quite favorably with a rating of 5 or higher given by 77%. An even higher percentage (83%) gave favorable ratings to the quality of their relationships with instructors, while relationships with administrative personnel and offices were given a slightly lower favorable rating (62%).

Overview of National 2007 CCSSE Cohort Survey Results Page 9 of �8
Academic ExperienceA positive academic experience is a product of many ingredients, one of which is the amount of time and energy that students invest in their academic work. The CCSR asks students to respond to seven survey items in order to gauge how actively they are involved in their education. Students are given the opportunity to mark Very Often, Often, Sometimes, or Never in response to items such as the following:
Asked questions in class or contributed to class discussions
Made a class presentation Worked with other students on
projects during class Worked with classmates outside of
class to prepare assignments
While some students are highly involved in their academic experience (those who marked Often or Very Often), others are less engaged, as illustrated by their responses of Never, as displayed in Figure 2.
Developmental Education and ESLCommunity colleges have quite diverse student populations, and in order to adequately serve student needs, the institutions offer a variety of courses and special programs. Item 8 on the CCSR asks students to identify which course paths they are following. As shown in Figure 3, large percentages of students either have taken or plan to enroll in developmental reading, writing, and/or math
0%
10%
20%
30%
40%
50%
60%
70%
Asked questions inclass or
contributed to classdiscussions
Made a classpresentation
Worked w ith otherstudents on
projects duringclass
Worked w ithclassmates outsideof class to prepareclass assignments
Figure 2: Academic Experience
Often or Very Often Never
0%5%
10%15%20%25%30%35%40%45%50%
Developmental readingcourse
Developmental writingcourse
Developmental mathcourse
English as a secondlanguage course
Figure 3: Developmental Education and ESL(Have Done or Plan to Do)
courses, while a smaller percentage plan on taking an ESL course.

Overview of National 2007 CCSSE Cohort Survey Results Page �0 of �8
Study Skills and Orientation CoursesA third of students have taken or will enroll in a study skills course, and 39% have taken or will enroll in an orientation course, as highlighted in Figure 4.
Student LearningStudent respondents indicate how much their coursework emphasizes intellectual processes such as memorization, the application of theories and concepts to practical problems, analysis, synthesis and organization, making value judgments, and using learned information to perform new skills. Figure 5 illustrates students’ perceptions of the extent to which their respective colleges promote these cognitive activities.
Table 6: Curricular Experiences
Have done or
Plan to do
Internship, field experience, co-op experience, or clinical assignment 57%
Honors course 26%
Organized learning communities (linked courses/study groups led by faculty or counselors)
26%
Curricular ExperienceTable 6 shows the percentage of students who have taken or plan to enroll in internships, honors courses, or organized learning communities.
0%
5%
10%
15%
20%
25%
30%
35%
40%
Study skills course College orientation program orcourse
Figure 4: Study Skills and Orientation Courses(Have Done or Plan to Do)
Figure 5: Student Learning(Quite a bit or Very Much)
0%
10%
20%
30%
40%
50%
60%
70%
Memorizing facts, ideas, ormethods from your courses andreadings so you can repeat them
in pretty much the same form
Analyzing the basic elements ofan idea, experience, or theory
Synthesizing and organizingideas, information, or experiences
in new w ays
Applying theories or concepts topractical problems or in new
situations

Overview of National 2007 CCSSE Cohort Survey Results Page �� of �8
Barriers to PersistenceCCSSE also asks students to indicate the issues that would require them to withdraw from college. That is, what keeps students from achieving their educational goals? The percentage of students who report that the various factors would result in their withdrawing from class or from college is highlighted in Figure 6. Again, students could mark more than one factor; therefore, percentages will
not sum to �00%. Other barriers to persistence include lack of peer or familial support. Twenty-two percent of students report that their friends are Somewhat or Not Very supportive of “your attending this college” while only �4% respond similarly about support from their immediate families.
Student SatisfactionA useful measure of satisfaction is whether a student recommends a service or institution to others. The CCSR asks students if they would recommend their college to a friend or family member. Ninety-four percent report they would make such a recommendation. Another item asks students to evaluate their entire educational experience. Eighty-six percent describe their experience as Good or Excellent, and only �% rate their experience as Poor.
Another measure of student satisfaction is the percent of returning or successful students. Sixty-five percent of the students indicate that they plan to enroll in their college within the next �2 months, while �2% report that they have accomplished their goals and will not be returning. On the other hand, twenty-two percent report they are uncertain or have no plans to return.
0% 5% 10% 15% 20% 25% 30% 35% 40% 45%
Lack of finances
Academicallyunprepared
Caring for dependents
Working full-time
Figure 6: Barriers to Persistence(Likely or Very Likely)
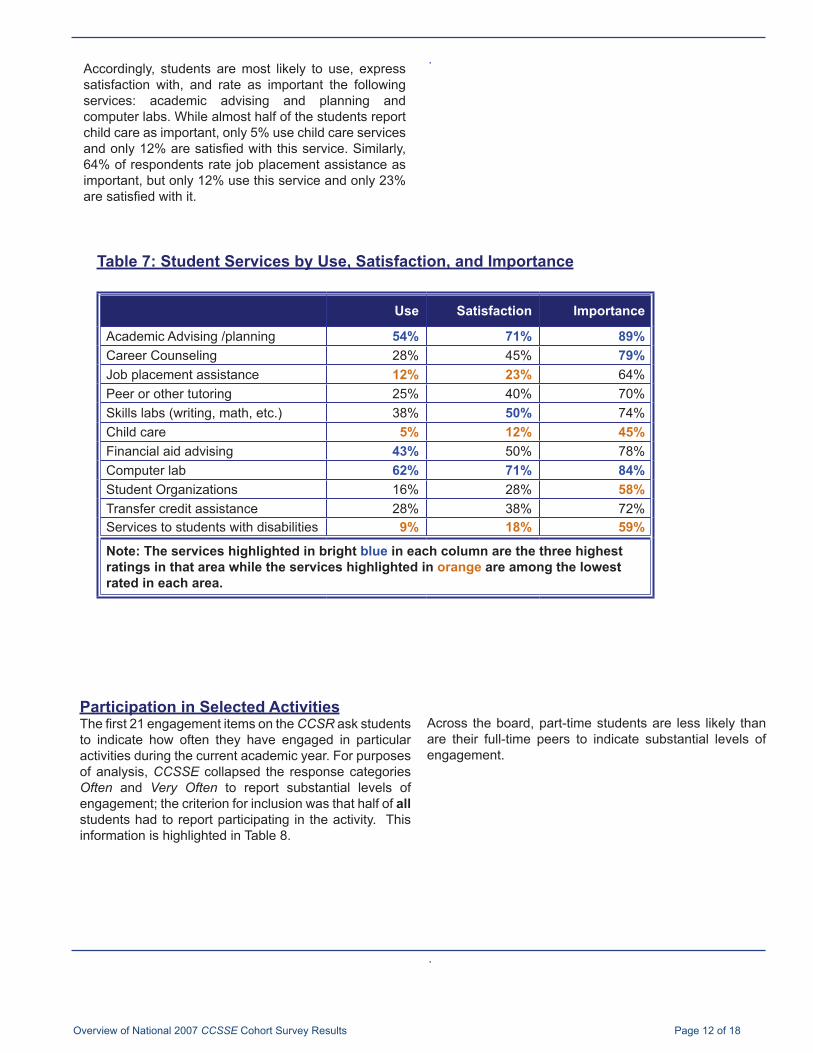
Student and Academic Support ServicesOften surveys ask a combination of questions relating to satisfaction, use, or importance levels of services, but rarely are surveys designed in a way that asks students to link all three, as does CCSSE. Table 7 displays use, satisfaction, and importance of a number of key academic and student support services. The first column reports the percentage of students who say that they used the service either Sometimes or Often; the second column shows the percentage of students who report they are Somewhat or Very Satisfied with the service; and the third column reports the percentage of students who rate the service as Somewhat or Very Important.
Overview of National 2007 CCSSE Cohort Survey Results Page �2 of �8
Across the board, part-time students are less likely than are their full-time peers to indicate substantial levels of engagement.
Participation in Selected ActivitiesThe first 21 engagement items on the CCSR ask students to indicate how often they have engaged in particular activities during the current academic year. For purposes of analysis, CCSSE collapsed the response categories Often and Very Often to report substantial levels of engagement; the criterion for inclusion was that half of all students had to report participating in the activity. This information is highlighted in Table 8.
Table 7: Student Services by Use, Satisfaction, and Importance
Use Satisfaction Importance
Academic Advising /planning 54% 71% 89%Career Counseling 28% 45% 79%Job placement assistance 12% 23% 64%Peer or other tutoring 25% 40% 70%Skills labs (writing, math, etc.) 38% 50% 74%Child care 5% 12% 45%Financial aid advising 43% 50% 78%Computer lab 62% 71% 84%Student Organizations 16% 28% 58%Transfer credit assistance 28% 38% 72%Services to students with disabilities 9% 18% 59%
Note: The services highlighted in bright blue in each column are the three highest ratings in that area while the services highlighted in orange are among the lowest rated in each area.
Accordingly, students are most likely to use, express satisfaction with, and rate as important the following services: academic advising and planning and computer labs. While almost half of the students report child care as important, only 5% use child care services and only 12% are satisfied with this service. Similarly, 64% of respondents rate job placement assistance as important, but only �2% use this service and only 23% are satisfied with it.

Overview of National 2007 CCSSE Cohort Survey Results Page �3 of �8
In comparison, it is also important to note what students are not doing in college as frequently as one might expect. To report the least frequent activities, CCSSE uses the never response category. Table 9 consists of items where 30% or more of all students report never engaging in that particular activity.
Table 9: Percentage of Students Who Reported Never Participating in Selected Activities by Enrollment Status
Least Frequent Student Activity Items All Part-Time Full-time
Participated in a community-based project as a part of a regular course 79% 83% 73%
Tutored or taught other students (paid or voluntary) 73% 78% 67%
Worked with instructors on activities other than coursework 72% 76% 65%
Skipped class 50% 56% 4�%
Discussed ideas from your readings or classes with instructors outside of class 47% 53% 40%
Worked with classmates outside of class to prepare class assignments 42% 49% 32%
Made a class presentation 32% 40% 2�%
Talked about career plans with an instructor or advisor 32% 37% 24%
Came to class without completing readings or assignments 30% 34% 24%
Part-time students are more likely than are their full-time peers to report never when responding to student activity items.
Table 8: Percentage of Students Who Reported Participating Often or Very Often in Selected Activities by Enrollment Status
Most Frequent Student Activity Items All Part-Time Full-time
Asked questions in class or contributed to class discussions 64% 63% 66%
Used the Internet or instant messaging to work on an assignment 61% 56% 70%
Worked on a paper or project that required integrating ideas or information from various sources 59% 53% 69%
Received prompt feedback (written or oral) from instructors on your performance 56% 55% 57%

Overview of National 2007 CCSSE Cohort Survey Results Page �4 of �8
Table 10: 2007 CCSSE Special Focus Questions
Question Response Options
1. By the end of my FIRST FOUR WEEKS at this college, I had met with an advisor to discuss my educational goals.
A=YesB=No, I met with an advisor by the end of my first four weeks at this college, but we did not discuss my educational goalsC=No, I did not meet with an advisor by the end of my first four weeks at this collegeD=No, I have discussed educational goals with an advisor, but it did not happen by the end of my first four weeks at this collegeE=I do not recall
2. By the end of my FIRST FOUR WEEKS at this college, I had completed an initial assessment test to determine which reading, writing, and math courses I should enroll in.
A=YesB=NoC=I do not recall
3. By the end of my FIRST FOUR WEEKS at this college, my instructors had used teaching techniques that encouraged me to become actively involved in the classroom.
A=Very oftenB=OftenC=SometimesD=Never E=I do not recall
4. How satisfied were you with the quality of your college’s orientation course or program for new students?
A=Very Satisfied
B=Somewhat Satisfied
C=Not at all Satisfied
D=Have not attended an orientation course or program
5. Rate your overall satisfaction with this college’s processes for working with new students – including the admissions process, the financial aid office, new student assessment, your first class registration experience, etc.
A=Very SatisfiedB=Somewhat Satisfied
C=Somewhat Dissatisfied
D=Very Dissatisfied
Results from these responses are provided in the Frequency Distributions section of your Institutional Report and will be highlighted in CCSSE’s 2007 National Report. In future years, the special focus will be determined by college interests and national trends.
2007 Special Focus Questions: The Entering Student ExperienceCCSSE has established a regular feature that will allow participating colleges and national researchers to delve more deeply into areas of student experience and institutional performance that are key to student success. The five 2007 “special focus questions” elicited new information about students’ educational experiences during their earliest weeks of college.

Overview of National 2007 CCSSE Cohort Survey Results Page �5 of �8
Entering Student Experience ResultsEvidence suggests that college students’ earliest experiences play an important role in whether they persist and achieve their educational goals. Orientation courses, initial assessment tests, and advising are key pieces of the entering student experience. Forty-three percent of all students report having met with an advisor in the first four weeks at their particular college to discuss their educational goals, and over half of all students report completing an initial assessment test. However, only 39% of part-time students, as compared
with almost half of full-time students, report having met with an advisor. Part-time students also report being less likely than their full-time counterparts to have completed an initial assessment (51% vs. 62%). One quarter of full-time students responded that they had not attended an orientation course at their college, while 38% of part-time students reported never having done so. Further, part-time students who did attend an orientation course or program report being less satisfied with it than full-time students.
Table 11: Selected Special Focus Questions Frequencies
Part-time Full-time All Students
By the end of my FIRST FOUR WEEKS at this college, I had met with an advisor to discuss my educational goals.
Yes 39% 49% 43%
No, I met with an advisor by the end of my first four weeks at this college, but we did not discuss my educational goals
7% 8% 7%
No, I did not meet with an advisor by the end of my first four weeks at this college 32% 23% 28%
No, I have discussed educational goals with an advisor, but it did not happen by the end of my first four weeks at this college
�3% �2% �3%
I do not recall �0% 8% 9%
By the end of my FIRST FOUR WEEKS at this college, I had completed an initial assessment test to determine which reading, writing, and math courses I should enroll in.
Yes 5�% 62% 56%
No 40% 29% 36%
I do not recall 8% 9% 9% How satisfied were you with the quality of your college’s orientation course or program for new students?
Very Satisfied 22% 26% 24%
Somewhat Satisfied 33% 4�% 36%
Not at all Satisfied 6% 8% 7%
Have not attended an orientation course or program 38% 25% 32%

Overview of National 2007 CCSSE Cohort Survey Results Page 16 of 18
�0Please see the Benchmark Overview for specific information regarding calculations of benchmark scores.
CCSSE in Action: Understanding Survey ResultsCCSSE recommends that college leaders familiarize themselves with CCSSE findings before communicating about the results. The following are some things to consider:
CCSSE Benchmarks10
Benchmarks are groups of conceptually related items that address key areas of student engagement, learning, and persistence. CCSSE’s five benchmarks denote areas that educational research has shown to be important in high-quality educational practice. The five benchmarks of effective educational practice in community colleges are active and collaborative learning, student effort, academic challenge, student-faculty interaction, and support for learners. These benchmarks are tools that can be used to compare college performance across benchmarks, to similarly sized institutions, and to the full CCSSE population of community colleges.
As a reminder, the benchmark results highlight data from the 2007 CCSSE Cohort, which includes 525 institutions and 3�0,0�3 student respondents. The larger number of institutions and students contributing to the national dataset increases the reliability of the overall results. In addition, the three-year cohort approach minimizes the impact, in any given year, of statewide consortia participation.
Enrollment StatusEnrollment status (part-time versus full-time) receives special attention in CCSSE reports; all results are either presented separately for part-time and full-time students or are weighted by enrollment status. In the CCSSE sampling procedure, classes are selected, not students. Accordingly, full-time students, who by definition are enrolled in more classes than part-time students, are more likely to be sampled. As a result, though approximately two-thirds of the students enrolled at the participating institutions are part-time students, the proportion in the CCSSE sample is nearly opposite. In the data analysis process, therefore, CCSSE assigns weights to responses based on respondents’ enrollment status, thereby producing more accurate measures of student engagement.
Weighting is a technique that proportionally adjusts an individual respondent’s contribution to a statistic, such as a mean or frequency; thus, some responses are weighted more heavily than others. If subgroups (e.g., part- versus full-time students) differ in their responses, then aggregate results will be biased in favor of the larger subgroup. Bias occurs, for example, when a disproportionate number of
full-time students complete the survey as compared to the population.
With the assignment of weights, subgroups (part-time) that are disproportionately small in the sample relative to the population have larger weights that increase their impact on summary statistics; the converse is true for subgroups (full-time) that are disproportionately large in the sample relative to the population.
There are several other individual characteristics, such as race, sex, or credit hours completed, where there could potentially be differences in subgroups. This observation begs the question: Why does CCSSE weight data on enrollment status and not on other individual characteristics? The answer is simple: there is no reason to do it. The only systematic bias that occurs is with enrollment status.
Effect Size as a Measure of Notable DifferencesEffect size is a measure of group differences. In the CCSSE results, it refers to mean differences between your institution and the group of colleges to which your institution is being compared divided by their standard deviation. This procedure rescales all effect sizes to the same scale (differences in standard deviations) and thus allows for comparisons.
CCSSE uses both statistical significance and standardized effect sizes to identify items on which a college’s perform-ance differs from comparison groups. An asterisk (*) highlights items for which students’ responses differ at a statistically significant level (p < .001) and have standardized effect sizes equal to or greater than (.2). Statistical significance is based on the effect size, the number of respondents, and the variability in their responses; as a single number, it also is the probability that the observed difference between outcomes would occur where there is truly no difference. While this is a useful guideline for identifying differences between groups, very small differences can be statistically significant in very large sample sizes such as the CCSSE national data set. Thus, items where notable differences occurred were identified as standardized effect sizes of (.2) or greater.
Statistical Significance Meets Practical SignificanceIn addition to focusing on items meeting the criteria highlighted above, look for patterns in students’ responses. For example, are students consistently above or below the mean of the comparison group in certain areas of engagement? Are the differences explainable in terms of a college’s mission, the nature of the undergraduate program, or certain students’ characteristics? Also, do not rely exclusively on statistical significance tests to identify

Overview of National 2007 CCSSE Cohort Survey Results Page �7 of �8
��See pp. �-2 for information about CCSSE consortia.
areas that warrant attention. A consistent pattern of scoring above the mean, even though all the items may not reach statistical significance, may indicate the institution is doing the right things in terms of good educational practice. At the same time, some institutions have very high expectations for student engagement and may fall short of their own aspirations even though comparisons with other institutions are favorable. And in some cases, of course, it may be that the national mean is itself unacceptably low.
CCSSE Consortia ResultsCCSSE consortium colleges that added questions to the survey instrument will find their corresponding frequency results behind the Frequency Distributions tab.�� In addition to a college’s comparison to its consortium group and the 2007 CCSSE Cohort, a consortium college also will receive a comparison to other colleges in its size category.
OversamplingCCSSE’s sample sizes are determined by institutional size, as reported in IPEDS. Colleges may elect to oversample in order to examine results for specific groups (such as students enrolled in developmental courses or students attending particular campus sites) or in order to increase overall sample size. The oversample dataset is included on CCSSE’s Web site for download.
Student Identifier Data In accordance with Texas state law and The University of Texas policies, CCSSE will no longer provide student-identifier data in the Institutional Report raw data file available for download via the CCSSE Web site. For those colleges that depend upon the student identifier field in the CCSSE raw data file for institutional analyses, we will be happy to release that information in a separate and secure transmission. If you would like these data, please contact your liaison, and CCSSE will provide you the raw data file with student identifiers included on an encrypted CD-ROM. The decryption password will be supplied in an email.

Overview of National 2007 CCSSE Cohort Survey Results Page �8 of �8
Fast FactsSurvey Instrument: The Community College Student Report (CCSR)
Paper administration, in-class completion time ranges from 35 to 50 minutes to complete Web-based administration; approximately �5 minutes to complete (available only in oversample situations).
CCSSE Participants 3�0,0�3 students from 525 institutions in 48 states have completed the CCSR between 2005 and 2007.
2007 CCSSE Cohort RespondentsGender: Male student respondents – 40% Female student respondents – 60%
Race/Ethnicity
Asian – 5% Black – �2% Latino/Hispanic – 11% International – 6% Native American – 2% White – 65% Other – 4%
Enrollment Status: Part-time – 31% Full-time – 69%
2007 CCSSE Consortia Statewide and state-based consortia include Alaska, Florida, Illinois, Kentucky, Louisiana, Massachusetts,
Minnesota, North Dakota, Northeast Minnesota, Northwest, South Carolina, Tennessee, Texas, and Wyoming. Regional and district-wide consortia include the Northwest Consortium, the Alamo Community College District
Consortium, and the North Harris Montgomery Community College District Consortium. Texas Small Colleges Consortium: �0 small colleges across Texas Hispanic Student Success Consortium: 15 colleges Achieving the Dream Consortium: 22 colleges SSPIRE Consortium: 9 colleges
CCSSE Benchmarks of Effective Educational Practice Active and Collaborative Learning (items: 4a, 4b, 4f, 4g, 4h, 4i, and 4r) Student Effort (items: 4c, 4d, 4e, 6b, 10a, 13d1, 13e1, and 13h1) Academic Challenge (items: 4p, 5b, 5c, 5d, 5e, 5f, 6a, 6c, 7, 9a) Student-Faculty Interaction (items: 4k,4l,4m,4n,4o,and 4q) Support for Learners (items: 9b, 9c, 9d, 9e, 9f, �3a�, and �3b�)
Validity and ReliabilityCCSSE’s validation research study, “Exploring Relationships Between Student Engagement and Student Outcomes in Community Colleges: Report on Validation Research,” is available on the CCSSE Web site.
Future Plans Pilot of Survey of Entering Student Engagement (SENSE) -- fall 2007 (invitation only) Focus group research on entering student experiences in community colleges -- fall 2007 - fall 2008 National Field Test of Survey of Entering Student Engagement (SENSE) -- fall 2008 (open to limited
registration) National Administration of Survey of Entering Student Engagement (SENSE) -- fall 2009 Development of a survey of online student engagement (TBA)

2007 CCSSE Cohort Frequencies This report provides item-by-item percentage responses for the 2007 CCSSE Cohort (students who participated in CCSSE from 2005 through 2007). For returning participants, the college’s most recent year of participation is included. For example, if a college participated in 2006 and 2007, only the 2007 data are used in the 2007 CCSSE Cohort. The report is designed to provide a summary of the results contained in the Frequency Distributions Report and is presented in the same layout as The Community College Student Report. This is NOT institution-level data but rather frequencies for all students contained in the 2007 CCSSE Cohort.
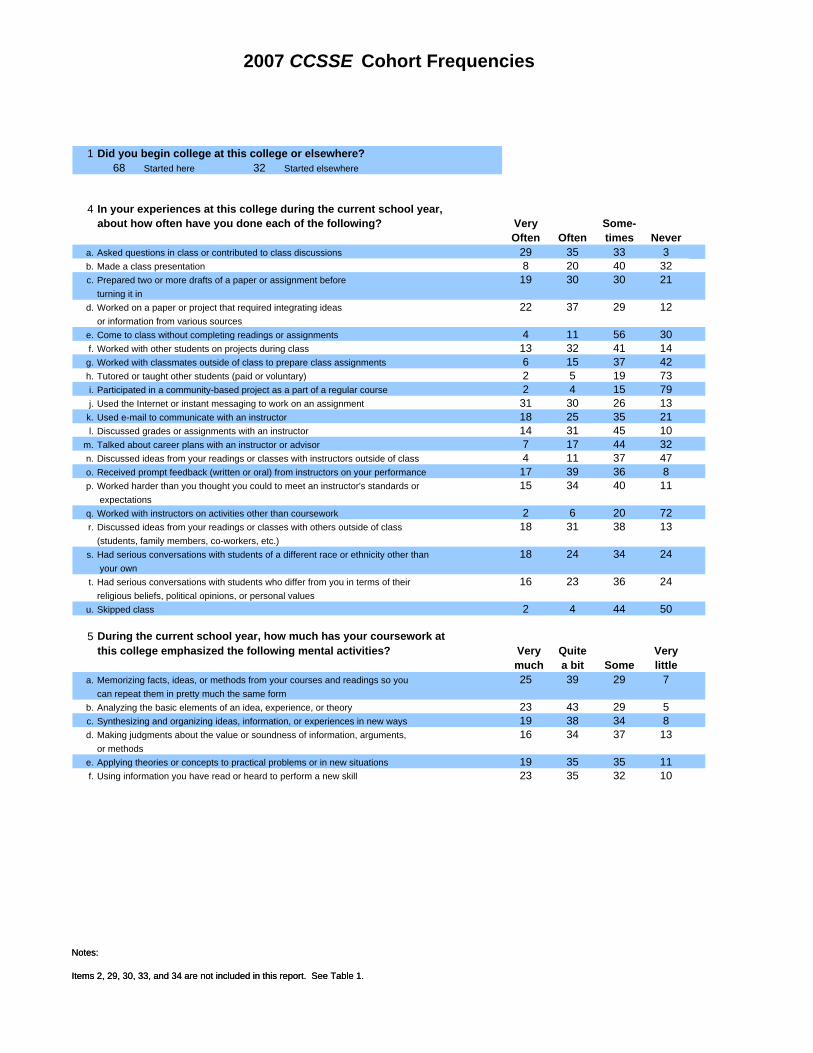
1 Did you begin college at this college or elsewhere?68 Started here 32 Started elsewhere
4 In your experiences at this college during the current school year, about how often have you done each of the following? Very Some-
Often Often times Nevera. Asked questions in class or contributed to class discussions 29 35 33 3b. Made a class presentation 8 20 40 32c. Prepared two or more drafts of a paper or assignment before 19 30 30 21
turning it ind. Worked on a paper or project that required integrating ideas 22 37 29 12
or information from various sourcese. Come to class without completing readings or assignments 4 11 56 30f. Worked with other students on projects during class 13 32 41 14g. Worked with classmates outside of class to prepare class assignments 6 15 37 42h. Tutored or taught other students (paid or voluntary) 2 5 19 73i. Participated in a community-based project as a part of a regular course 2 4 15 79j. Used the Internet or instant messaging to work on an assignment 31 30 26 13
k. Used e-mail to communicate with an instructor 18 25 35 21l. Discussed grades or assignments with an instructor 14 31 45 10
m. Talked about career plans with an instructor or advisor 7 17 44 32n. Discussed ideas from your readings or classes with instructors outside of class 4 11 37 47o. Received prompt feedback (written or oral) from instructors on your performance 17 39 36 8p. Worked harder than you thought you could to meet an instructor's standards or 15 34 40 11
2007 CCSSE Cohort Frequencies
Notes:
Items 2, 29, 30, 33, and 34 are not included in this report. See Table 1.
y g y expectations
q. Worked with instructors on activities other than coursework 2 6 20 72r. Discussed ideas from your readings or classes with others outside of class 18 31 38 13
(students, family members, co-workers, etc.)s. Had serious conversations with students of a different race or ethnicity other than 18 24 34 24
your ownt. Had serious conversations with students who differ from you in terms of their 16 23 36 24
religious beliefs, political opinions, or personal valuesu. Skipped class 2 4 44 50
5 During the current school year, how much has your coursework at this college emphasized the following mental activities? Very Quite Very
much a bit Some littlea. Memorizing facts, ideas, or methods from your courses and readings so you 25 39 29 7
can repeat them in pretty much the same formb. Analyzing the basic elements of an idea, experience, or theory 23 43 29 5c. Synthesizing and organizing ideas, information, or experiences in new ways 19 38 34 8d. Making judgments about the value or soundness of information, arguments, 16 34 37 13
or methodse. Applying theories or concepts to practical problems or in new situations 19 35 35 11f. Using information you have read or heard to perform a new skill 23 35 32 10
Notes:
Items 2, 29, 30, 33, and 34 are not included in this report. See Table 1.
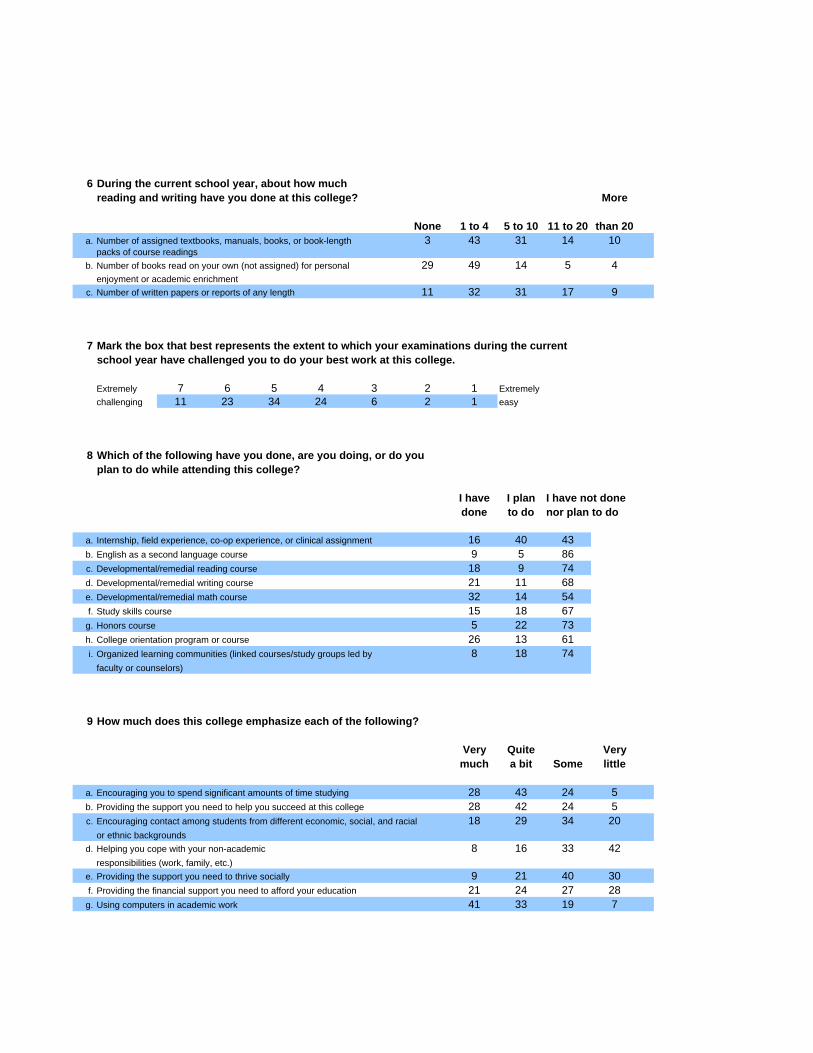
6 During the current school year, about how much reading and writing have you done at this college? More
None 1 to 4 5 to 10 11 to 20 than 20a. Number of assigned textbooks, manuals, books, or book-length 3 43 31 14 10
packs of course readings b. Number of books read on your own (not assigned) for personal 29 49 14 5 4
enjoyment or academic enrichmentc. Number of written papers or reports of any length 11 32 31 17 9
7 Mark the box that best represents the extent to which your examinations during the current school year have challenged you to do your best work at this college.
Extremely 7 6 5 4 3 2 1 Extremelychallenging 11 23 34 24 6 2 1 easy
8 Which of the following have you done, are you doing, or do you plan to do while attending this college?
I have I plan I have not donedone to do nor plan to do
a. Internship, field experience, co-op experience, or clinical assignment 16 40 43b. English as a second language course 9 5 86c. Developmental/remedial reading course 18 9 74d. Developmental/remedial writing course 21 11 68e. Developmental/remedial math course 32 14 54f. Study skills course 15 18 67
g. Honors course 5 22 73h. College orientation program or course 26 13 61i. Organized learning communities (linked courses/study groups led by 8 18 74
faculty or counselors)
9 How much does this college emphasize each of the following?
Very Quite Verymuch a bit Some little
a. Encouraging you to spend significant amounts of time studying 28 43 24 5b. Providing the support you need to help you succeed at this college 28 42 24 5c. Encouraging contact among students from different economic, social, and racial 18 29 34 20
or ethnic backgroundsd. Helping you cope with your non-academic 8 16 33 42
responsibilities (work, family, etc.)e. Providing the support you need to thrive socially 9 21 40 30f. Providing the financial support you need to afford your education 21 24 27 28
g. Using computers in academic work 41 33 19 7

10 About how many hours do you spend in a typical 7-day week doing each of the following?
None 1 – 5 6 - 10 11 - 20 21 - 30 Morethan 30
a. Preparing for class (studying, reading, writing, rehearsing, 2 44 29 16 5 3doing homework, or other activities related to your program)
b. Working for pay 20 5 6 12 17 40c. Participating in college-sponsored activities (organizations, 83 12 3 1 1 1
campus publications, student government, intercollegiate orintramural sports,etc.)
d. Providing care for dependents living with you (parents, 44 15 8 6 4 23children, spouse, etc.)
e. Commuting to and from classes 7 69 16 5 1 2
11 Mark the number that best represents the quality of your relationships with peopleat this college.
Your relationship with:
a. Other Students
Friendly, supportive, 7 6 5 4 3 2 1 Unfriendly, unsupportive,sense of belonging 27 28 22 16 5 2 1 sense of alienation
b. Instructors
Available, helpful, 7 6 5 4 3 2 1 Unavailable, unhelpful,sympathetic 30 32 21 12 4 2 1 unsympatheticsympathetic 30 32 21 12 4 2 1 unsympathetic
c. Administrative Personnel & Offices
Helpful, considerate, 7 6 5 4 3 2 1 Unhelpful, inconsiderate,flexible 18 22 22 20 9 5 3 rigid
12 How much has YOUR EXPERIENCE AT THIS COLLEGE contributed to your knowledge,skills, and personal development in the following areas?
Very Quite Verymuch a bit Some little
a. Acquiring a broad general education 28 42 24 6b. Acquiring job or work-related knowledge and skills 21 30 30 18c. Writing clearly and effectively 21 38 29 12d. Speaking clearly and effectively 19 35 31 15e. Thinking critically and analytically 25 42 26 7f. Solving numerical problems 20 34 30 17g. Using computing and information technology 25 32 28 14h. Working effectively with others 21 36 32 10i. Learning effectively on your own 27 41 26 7j. Understanding yourself 21 31 30 17k. Understanding people of other racial and ethnic 16 26 34 24l. Developing a personal code of values and ethics 15 26 34 25
m. Contributing to the welfare of your community 9 18 35 38n. Developing clearer career goals 23 32 29 16o. Gaining information about career opportunities 21 29 30 20

13 This section has three parts. Please answer all three sections, indicating(1) HOW OFTEN you use the following services, (2) HOW SATISFIED you are with the services, and (3) HOW IMPORTANT the services are to you AT THIS COLLEGE.
(1) Frequency of (2) Satisfaction (3) Importance Use
Don't
Some- Rarely/ know Some- Not Some- NotOften times Never N.A. Very what at all N.A. Very what at all
a. Academic advising/planning 12 42 36 10 27 44 10 19 61 28 11b. Career counseling 5 23 50 21 16 29 13 41 50 29 22c. Job placement assistance 3 9 46 42 7 16 13 64 36 28 36d. Peer or other tutoring 7 18 46 29 17 23 10 51 39 31 30e. Skill labs (writing, math, etc.) 14 24 37 24 22 28 7 42 43 31 25f. Child care 2 3 37 58 5 7 10 78 27 18 55g. Financial aid advising 17 26 32 24 25 25 13 36 60 18 23h. Computer lab 32 30 24 14 43 28 5 23 59 25 16i. Student organizations 5 11 44 40 9 19 10 61 23 35 42j. Transfer credit assistance 7 21 36 36 15 23 12 51 51 21 28k. Services to students with 4 5 32 60 8 10 8 75 44 15 41
disabilities
14 How likely is it that the following issues would cause you to withdraw from class orfrom this college? (Please respond to each item) Some-
Very what Notlikely Likely likely likelylikely Likely likely likely
a. Working full-time 20 18 21 41b. Caring for dependents 13 16 22 49c. Academically unprepared 7 12 23 58d. Lack of finances 26 18 23 33e. Transfer to a 4-year college or university 31 18 17 34
15 How supportive are your friends of your attending this college? 49 Extremely 18 Somewhat 29 Quite a bit 4 Not Very
16 How supportive is your immediate family of your attending 66 Extremely 11 Somewhat this college? 20 Quite a bit 3 Not Very
17 Indicate which of the following are your reasons/goals for attending this college.(Please respond to each item)
Primary Secondary Notgoal goal a goal
a. Complete a certificate program 29 19 52b. Obtain an associate degree 58 21 21c. Transfer to a 4-year college or university 51 21 27d. Obtain or update job-related skills 41 27 32e. Self-improvement/personal enjoyment 39 35 26f. Change careers 29 16 55

18 Indicate which of the following are sources you use to pay your tuition at this college. (Please respond to each item)
Major Minor Notsource source a source
a. My own income/savings 40 28 32b. Parent or spouse/significant other's income/savings 29 18 53c. Employer contributions 8 8 84d. Grants & scholarships 33 11 56e. Student loans (bank, etc.) 19 8 73f. Public assistance 7 5 89
19 Since high school, which of the following types of schools have you attended other than the one you are now attending? (Please mark all that apply)
8 Proprietary (private) school or training program9 Public vocational-technical school
20 Another community or technical college23 4-year college or university50 None
20 When do you plan to take classes at this college again?
12 I will accomplish my goal(s) during this term and will not be returning5 I have no current plan to return
65 Within the next 12 months17 Uncertain
21 At this college in what range is your overall college grade average?21 At this college, in what range is your overall college grade average?
16 A 28 A- to B+ 24 B19 B- to C+ 8 C 2 C- or lower3 Do not have a GPA at this school1 Pass/fail classes only
22 When do you most frequently take classes at this college? (Mark one only)
68 Day classes (morning or afternoon)31 Evening classes1 Weekend classes
23 How many TOTAL credit hours have you earned at this college, not counting thecourses you are currently taking this term?
13 none 33 1-14 credits21 15-29 credits 13 30-44 credits11 45-60 credits 9 over 60 credits

24 At what other types of institutions are you taking classes this term?(Please mark all that apply)
86 None2 High school1 Vocational/technical school2 Another community or technical college4 4-year college/university3 Other
25 How many classes are you presently taking at OTHER institutions?24
83 None 4 1 class 4 2 classes3 3 classes 5 4 classes or more
26 Would you recommend this college to a friend or family member?16
94 Yes 6 No
27 How would you evaluate your entire educational experience at this college?
30 Excellent 56 Good 13 Fair 1 Poor
28 Do you have children who live with you?
31 Yes 69 No
31 Are you married?
25 Yes 75 No
32 Is English your native (first) language?
88 Yes 12 No
35 What is the highest academic credential you have earned?
3 None73 High school diploma or GED10 Vocational/technical certificate8 Associate degree5 Bachelor's degree2 Master's/doctoral/professional degree
36 What is the highest level of education obtained by your:
Father Mothera. Not a high school graduate 16 14b. High school diploma or GED 32 33c. Some college, did not complete degree 14 17d. Associate degree 7 11e. Bachelor's degree 13 13f. Master's degree/1st professional 7 6g. Doctorate degree 2 1h. Unknown 8 5

Respondents to Underlying Populations
Table 1, on the following page, details respondent characteristics from your college as well as population data for: 1) your college, 2) similarly-sized 2007 CCSSE Cohort colleges (colleges that participated in CCSSE from 2005 through 2007), and 3) all 2007 CCSSE Cohort colleges. The specific characteristics examined include gender, race/ethnicity, age, and enrollment status. Please note: Enrollment status (part-time versus full-time) receives special attention in CCSSE reports; all results are either presented separately for part-time and full-time students or are weighted by enrollment status. In the CCSSE sampling procedure, classes are selected, not students. Accordingly, full-time students, who by definition are enrolled in more classes than part-time students, are more likely to be sampled. As a result, though approximately two-thirds of the students enrolled at the participating institutions are part-time students, the proportion in the CCSSE sample is nearly opposite. In the data analysis process, therefore, CCSSE assigns weights to responses based on respondents’ enrollment status, thereby producing more accurate measures of student engagement.

Palomar College
2007 Cohort 2007 CCSSESize Group Cohort
Your Your Comparison CollegesRespondents Population Population Population
GenderMale 46% 51% 43% 41%Female 54% 49% 57% 59%
Race/EthnicityAmerican Indian or other Native American 1% 1% 1% 1%Asian, Asian American, or Pacific Islander 8% 9% 9% 6%Black or African American, Non-Hispanic 4% 3% 14% 14%White, Non-Hispanic 57% 57% 47% 59%Hispanic, Latino, Spanish 17% 22% 21% 14%Other 7% 6% 5% 5%International Student or Foreign National 7% 1% 3% 2%
Table 1Respondents to Underlying Populations Comparisons:
Comparison Group and All 2007 CCSSE Cohort Colleges
Notes:
Population data are those reported by colleges for the most recent IPEDS enrollment report.
Respondents include only data used in the national CCSSE analysis as in accordance with the CCSSE data exclusion rules.
International Student or Foreign National 7% 1% 3% 2%Student Age
18 to 19 31% 25% 20% 23%20 to 21 26% 19% 19% 18%22 to 24 13% 16% 16% 15%25 to 29 10% 12% 15% 14%30 to 39 8% 11% 15% 15%40 to 49 5% 9% 9% 9%50 to 64 5% 6% 4% 4%65 and over 2% 2% 1% 1%
Enrollment StatusFull - Time 58% 32% 34% 37%Part - Time 42% 68% 66% 63%
Notes:
Population data are those reported by colleges for the most recent IPEDS enrollment report.
Respondents include only data used in the national CCSSE analysis as in accordance with the CCSSE data exclusion rules.

First Look The following two reports highlight those items where your college falls notably above or below the mean of your comparison group. The first report provides this data for all students at your college while the second provides the data by enrollment status (part- and full-time). It is designed to provide a summary of the results that are displayed following the Means Summary tab. The items listed are significant at p < .001 with an effect size greater than or equal to .2. The effect size represents the magnitude of the discrepancy between your college and the comparison group in the student or institutional behavior represented by the item. Using both probability and effect size measures increases the likelihood that the quality of the student experience represented by the item(s) is appreciably different from other colleges of similar size; and the results, therefore, may be of practical as well as statistical significance.

Palomar College: First Look
Compared with other ExLarge colleges
Above the Mean
No items above the mean
Below the Mean
COLLEGE ACTIVITIES
4b. Made a class presentation
4c. Prepared two or more drafts of a paper or assignment before turning it in
4d. Worked on a paper or project that required integrating ideas or information from various sources
4j. Used the Internet or instant messaging to work on an assignment
4l. Discussed grades or assignments with an instructor
4p. Worked harder than you thought you could to meet an instructor's standards or expectations
6c. Number of written papers or reports of any length
OPINIONS ABOUT YOUR SCHOOL
9g. Using computers in academic work
EDUCATIONAL AND PERSONAL GROWTH
12c. Writing clearly and effectively
12g. Using computing and information technology
STUDENT SERVICES
13d1. Frequency: Peer or other tutoring
13g1. Frequency: Financial aid advising
13h1. Frequency: Computer lab
13h2. Satisfaction: Computer lab
13c3. Importance: Job placement assistance
13g3. Importance: Financial aid advising
13h3. Importance: Computer lab
13i3. Importance: Student organizations

Palomar College: First Look
Compared with other ExLarge colleges
COLLEGE EXPERIENCES
14d. Lack of finances

Palomar College: First Look
Compared with other ExLarge colleges
Above the Mean
COLLEGE EXPERIENCES Part- Time
Full- Time
14e. Transfer to a 4-year college or university *
Below the Mean
COLLEGE ACTIVITIES Part- Time
Full- Time
4b. Made a class presentation * 4c. Prepared two or more drafts of a paper or assignment before turning it in * 4d. Worked on a paper or project that required integrating ideas or information from various sources
*
4g. Worked with classmates outside of class to prepare class assignments * 4i. Participated in a community--based project as a part of a regular course * 4j. Used the Internet or instant messaging to work on an assignment * 4l. Discussed grades or assignments with an instructor * 4p. Worked harder than you thought you could to meet an instructor's standards or expectations
*
6c. Number of written papers or reports of any length * *
OPINIONS ABOUT YOUR SCHOOL Part- Time
Full- Time
9g. Using computers in academic work *
EDUCATIONAL AND PERSONAL GROWTH Part- Time
Full- Time
12b. Acquiring job or work-related knowledge and skills * 12c. Writing clearly and effectively * 12g. Using computing and information technology * * 12m. Contributing to the welfare of your community *

Palomar College: First Look
Compared with other ExLarge colleges
STUDENT SERVICES Part- Time
Full- Time
13d1. Frequency: Peer or other tutoring * 13g1. Frequency: Financial aid advising * * 13h1. Frequency: Computer lab * * 13h2. Satisfaction: Computer lab * 13a3. Importance: Academic advising/planning * 13b3. Importance: Career counseling * 13c3. Importance: Job placement assistance * 13d3. Importance: Peer or other tutoring * 13g3. Importance: Financial aid advising * 13h3. Importance: Computer lab * * 13i3. Importance: Student organizations * 13j3. Importance: Transfer credit assistance *
COLLEGE EXPERIENCES Part- Time
Full- Time
14d. Lack of finances *

Frequency Report: All Students This report provides item-by-item percentage responses for all students at your institution. In addition, the far right column contains asterisks for those items that are significantly different, when applicable, from your comparison group at p < .001 with an effect size greater than or equal to .2.

1 Did you begin college at this college or elsewhere?63 Started here 37 Started elsewhere
4 In your experiences at this college during the current school year, about how often have you done each of the following? Very Some-
Often Often times Nevera. Asked questions in class or contributed to class discussions 23 33 39 4b. Made a class presentation 5 17 37 41 *c. Prepared two or more drafts of a paper or assignment before 13 26 29 32 *
turning it ind. Worked on a paper or project that required integrating ideas 17 32 31 20 *
or information from various sourcese. Come to class without completing readings or assignments 4 12 53 32f. Worked with other students on projects during class 14 32 38 15g. Worked with classmates outside of class to prepare class assignments 4 11 35 49h. Tutored or taught other students (paid or voluntary) 2 4 18 76i. Participated in a community-based project as a part of a regular course 1 3 13 83j. Used the Internet or instant messaging to work on an assignment 25 27 30 18 *
k. Used e-mail to communicate with an instructor 16 23 40 21l. Discussed grades or assignments with an instructor 8 27 48 17 *
m. Talked about career plans with an instructor or advisor 4 14 40 42n. Discussed ideas from your readings or classes with instructors outside of class 3 9 35 53o. Received prompt feedback (written or oral) from instructors on your performance 15 38 36 11p. Worked harder than you thought you could to meet an instructor's standards or 8 30 43 19 *
The Community College Student Report 2007Palomar College
Compared with other ExLarge Colleges
Notes:
* indicates a significant difference and effect size =>.2 between your college and your comparison group.
Items 2, 29, 30, 33, and 34 are not included in this report. See Table 1.
expectationsq. Worked with instructors on activities other than coursework 1 6 18 76r. Discussed ideas from your readings or classes with others outside of class 18 31 37 14
(students, family members, co-workers, etc.)s. Had serious conversations with students of a different race or ethnicity other than 21 24 32 23
your ownt. Had serious conversations with students who differ from you in terms of their 17 21 35 27
religious beliefs, political opinions, or personal valuesu. Skipped class 2 4 46 48
5 During the current school year, how much has your coursework at this college emphasized the following mental activities? Very Quite Very
much a bit Some littlea. Memorizing facts, ideas, or methods from your courses and readings so you 22 39 29 10
can repeat them in pretty much the same formb. Analyzing the basic elements of an idea, experience, or theory 25 40 28 8c. Synthesizing and organizing ideas, information, or experiences in new ways 19 34 35 12d. Making judgments about the value or soundness of information, arguments, 16 30 35 19
or methodse. Applying theories or concepts to practical problems or in new situations 18 33 34 15f. Using information you have read or heard to perform a new skill 22 35 30 13
Notes:
* indicates a significant difference and effect size =>.2 between your college and your comparison group.
Items 2, 29, 30, 33, and 34 are not included in this report. See Table 1.

6 During the current school year, about how much reading and writing have you done at this college? More
None 1 to 4 5 to 10 11 to 20 than 20a. Number of assigned textbooks, manuals, books, or book-length 5 47 28 12 8
packs of course readings b. Number of books read on your own (not assigned) for personal 25 52 14 4 4
enjoyment or academic enrichmentc. Number of written papers or reports of any length 23 36 23 12 7 *
7 Mark the box that best represents the extent to which your examinations during the current school year have challenged you to do your best work at this college.
Extremely 7 6 5 4 3 2 1 Extremelychallenging 8 21 34 26 7 3 1 easy
8 Which of the following have you done, are you doing, or do you plan to do while attending this college?
I have I plan I have not donedone to do nor plan to do
a. Internship, field experience, co-op experience, or clinical assignment 14 29 57b. English as a second language course 8 5 87c. Developmental/remedial reading course 10 13 77d. Developmental/remedial writing course 13 17 69e. Developmental/remedial math course 19 20 61f. Study skills course 12 18 70
g. Honors course 4 16 81h. College orientation program or course 15 13 73i. Organized learning communities (linked courses/study groups led by 5 16 79
faculty or counselors)
9 How much does this college emphasize each of the following?
Very Quite Verymuch a bit Some little
a. Encouraging you to spend significant amounts of time studying 24 45 26 5b. Providing the support you need to help you succeed at this college 26 41 27 6c. Encouraging contact among students from different economic, social, and racial 16 29 33 22
or ethnic backgroundsd. Helping you cope with your non-academic 7 14 33 46
responsibilities (work, family, etc.)e. Providing the support you need to thrive socially 6 19 37 38f. Providing the financial support you need to afford your education 15 19 29 37
g. Using computers in academic work 27 32 25 15 *

10 About how many hours do you spend in a typical 7-day week doing each of the following?
None 1 – 5 6 - 10 11 - 20 21 - 30 Morethan 30
a. Preparing for class (studying, reading, writing, rehearsing, 2 48 30 14 4 2doing homework, or other activities related to your program)
b. Working for pay 19 5 6 13 21 36c. Participating in college-sponsored activities (organizations, 89 7 2 1 1 1
campus publications, student government, intercollegiate orintramural sports,etc.)
d. Providing care for dependents living with you (parents, 51 17 9 5 3 15children, spouse, etc.)
e. Commuting to and from classes 6 74 14 4 1 1
11 Mark the number that best represents the quality of your relationships with peopleat this college.
Your relationship with:
a. Other Students
Friendly, supportive, 7 6 5 4 3 2 1 Unfriendly, unsupportive,sense of belonging 22 25 22 21 6 4 2 sense of alienation
b. Instructors
Available, helpful, 7 6 5 4 3 2 1 Unavailable, unhelpful,sympathetic 32 31 21 11 4 1 1 unsympatheticsympathetic 32 31 21 11 4 1 1 unsympathetic
c. Administrative Personnel & Offices
Helpful, considerate, 7 6 5 4 3 2 1 Unhelpful, inconsiderate,flexible 15 21 24 24 9 5 3 rigid
12 How much has YOUR EXPERIENCE AT THIS COLLEGE contributed to your knowledge,skills, and personal development in the following areas?
Very Quite Verymuch a bit Some little
a. Acquiring a broad general education 26 38 26 9b. Acquiring job or work-related knowledge and skills 15 24 33 28c. Writing clearly and effectively 16 34 33 18 *d. Speaking clearly and effectively 16 31 32 21e. Thinking critically and analytically 22 40 27 11f. Solving numerical problems 17 32 30 21g. Using computing and information technology 15 27 35 23 *h. Working effectively with others 17 33 37 13i. Learning effectively on your own 24 41 26 9j. Understanding yourself 19 27 31 23k. Understanding people of other racial and ethnic 16 24 32 28l. Developing a personal code of values and ethics 14 21 33 32
m. Contributing to the welfare of your community 7 14 32 47n. Developing clearer career goals 18 28 29 25o. Gaining information about career opportunities 16 24 31 28

13 This section has three parts. Please answer all three sections, indicating(1) HOW OFTEN you use the following services, (2) HOW SATISFIED you are with the services, and (3) HOW IMPORTANT the services are to you AT THIS COLLEGE.
(1) Frequency of (2) Satisfaction (3) Importance Use
Don't
Some- Rarely/ know Some- Not Some- NotOften times Never N.A. Very what at all N.A. Very what at all
a. Academic advising/planning 9 34 42 16 18 39 12 32 57 26 18b. Career counseling 5 22 50 23 13 27 13 46 47 28 24c. Job placement assistance 2 5 49 43 4 11 13 72 26 29 46 *d. Peer or other tutoring 5 13 50 33 * 11 20 9 60 34 29 38e. Skill labs (writing, math, etc.) 14 21 38 26 20 23 8 49 42 27 31f. Child care 1 2 40 57 3 5 10 82 23 17 60g. Financial aid advising 7 13 41 38 * 12 15 13 59 43 19 38 *h. Computer lab 19 23 34 24 * 28 26 6 39 * 45 25 29 *i. Student organizations 3 7 46 45 4 15 10 71 18 30 52 *j. Transfer credit assistance 6 20 41 33 11 24 12 53 49 21 31k. Services to students with 4 4 35 57 8 7 8 77 36 16 47
disabilities
14 How likely is it that the following issues would cause you to withdraw from class orfrom this college? (Please respond to each item) Some-
Very what Notlikely Likely likely likelylikely Likely likely likely
a. Working full-time 21 19 21 39b. Caring for dependents 12 15 22 52c. Academically unprepared 6 11 22 60d. Lack of finances 19 16 22 43 *e. Transfer to a 4-year college or university 37 16 14 33
15 How supportive are your friends of your attending this college? 44 Extremely 21 Somewhat 30 Quite a bit 5 Not Very
16 How supportive is your immediate family of your attending 64 Extremely 13 Somewhat this college? 21 Quite a bit 3 Not Very
17 Indicate which of the following are your reasons/goals for attending this college.(Please respond to each item)
Primary Secondary Notgoal goal a goal
a. Complete a certificate program 23 19 58b. Obtain an associate degree 32 30 38c. Transfer to a 4-year college or university 60 12 28d. Obtain or update job-related skills 31 30 39e. Self-improvement/personal enjoyment 40 33 27f. Change careers 22 14 64

18 Indicate which of the following are sources you use to pay your tuition at this college. (Please respond to each item)
Major Minor Notsource source a source
a. My own income/savings 56 23 21b. Parent or spouse/significant other's income/savings 40 15 45c. Employer contributions 5 5 90d. Grants & scholarships 13 6 81e. Student loans (bank, etc.) 4 3 92f. Public assistance 5 3 92
19 Since high school, which of the following types of schools have you attended other than the one you are now attending? (Please mark all that apply)
8 Proprietary (private) school or training program10 Public vocational-technical school28 Another community or technical college24 4-year college or university43 None
20 When do you plan to take classes at this college again?
9 I will accomplish my goal(s) during this term and will not be returning3 I have no current plan to return
71 Within the next 12 months17 Uncertain
21 At this college in what range is your overall college grade average?21 At this college, in what range is your overall college grade average?
15 A 22 A- to B+ 24 B16 B- to C+ 12 C 5 C- or lower4 Do not have a GPA at this school1 Pass/fail classes only
22 When do you most frequently take classes at this college? (Mark one only)
68 Day classes (morning or afternoon)31 Evening classes1 Weekend classes
23 How many TOTAL credit hours have you earned at this college, not counting thecourses you are currently taking this term?
11 none 34 1-14 credits21 15-29 credits 14 30-44 credits11 45-60 credits 9 over 60 credits

24 At what other types of institutions are you taking classes this term?(Please mark all that apply)
83 None2 High school2 Vocational/technical school3 Another community or technical college5 4-year college/university3 Other
25 How many classes are you presently taking at OTHER institutions?24
81 None 6 1 class 6 2 classes2 3 classes 5 4 classes or more
26 Would you recommend this college to a friend or family member?16
96 Yes 4 No
27 How would you evaluate your entire educational experience at this college?
33 Excellent 54 Good 11 Fair 1 Poor
28 Do you have children who live with you?
20 Yes 80 No
31 Are you married?
27 Yes 73 No
32 Is English your native (first) language?
82 Yes 18 No
35 What is the highest academic credential you have earned?
3 None71 High school diploma or GED8 Vocational/technical certificate8 Associate degree6 Bachelor's degree4 Master's/doctoral/professional degree
36 What is the highest level of education obtained by your:
Father Mothera. Not a high school graduate 17 15b. High school diploma or GED 19 23c. Some college, did not complete degree 20 23d. Associate degree 6 9e. Bachelor's degree 16 15f. Master's degree/1st professional 11 8g. Doctorate degree 3 1h. Unknown 8 7

Means Summary There are five reports contained in this section. The first two reports present data for all students and the final three present data for students by enrollment status (part-and full-time). The Means Summary Report (pp. M1 - M9) provides item-by-item means for all students at your institution contrasted with a comparison group and the 2007 CCSSE Cohort (students who participated in CCSSE from 2005 through 2007). Below is a description of the layout of this report: Item The items from The Community College Student Report appear in the left column in the same order they appear on the instrument. Because the report lists means and mean comparison information, only those items that have numerically scaled responses appear. The items measuring other educational experiences (practicum experiences, study abroad, etc.) do not appear because their response sets are categorical (yes, no, undecided). Please refer to the Frequencies Distributions for details on these items. Variable The name of each variable appears in the second column for easy reference to your data file and the summary statistics reports. Class The class appears in the third column and corresponds to the sample for which the data are reported (e.g., all students, part-time students, or full-time students). Mean A mean is the arithmetic average of all responses on a particular item. Means are provided for your institution, a comparison group, and for the 2007 CCSSE Cohort. Sig (Statistical Significance) A t test, a statistical procedure used to compare two means, is conducted between your college and comparison group as well as your college and the 2007 CCSSE Cohort. The statistical significance – the probability of the observed difference occurring were there truly no differences between the means – is reported. For the comparison group and the 2007 CCSSE Cohort mean differences that are significant at the p < .001 level and have an effect size greater than or equal to .2 (see below) are indicated by a single asterisk (*). Effect Size The actual magnitude of some item score differences may seem trivial, even though they are highly reliable and statistically significant. For this reason, CCSSE also reports the effect size (only when the value is greater than or equal to .2) associated with those item comparisons that are statistically significant. The effect size represents the magnitude of the discrepancy in the student or institutional behavior represented by the item.

The Summary Statistics Report (pp. M10 - M13) presents statistics on all students at your institution contrasted with a comparison group and the 2007 CCSSE Cohort. A description of the layout of this report is provided below: Variable Names The name of each variable; this is the same name contained in the second column of the Means Summary Report: All Students. # of respondents The total number of respondents for your college, a comparison group, and the 2007 CCSSE Cohort are listed. As a reminder, respondents may be excluded from institutional reports for the following reasons: 1) the respondent did not indicate whether he or she was enrolled part- or full-time at the institution, 2) the survey is invalid, 3) the student reported his or her age as under 18, or; 4) the student indicated that he or she had taken the survey in a previous class. Mean Arithmetic average of all responses on a particular item. Standard deviation A statistic used as a measure of the dispersion or variation in a distribution, equal to the square root of the arithmetic mean of the squares of the deviations from the arithmetic mean; more generally, a measure of the extent to which numbers are spread around their average. Std error of the mean A measurement of error when a sample mean is used to estimate the mean of the population from which the sample was drawn. The standard error of the mean is computed as the standard deviation of the original population divided by the square root of the sample size. Significance The probability of the observed difference occurring were there truly no differences between the means. For the comparison group and the 2007 CCSSE Cohort, mean differences that are significant at the p < .001 level and have an effect size greater than or equal to .2 are indicated by a single asterisk (*). Effect size The effect size represents the magnitude of the discrepancy in the student or institutional behavior represented by the item. For a more detailed description, see above. The next series of reports, found on pages M14 through M30, contain the same reports described above broken down by enrollment status for your institution, a comparison group, and the 2007 CCSSE Cohort.

Community College Survey of Student EngagementMeans Summary Report: All Students
Your College
Item Variable Class Mean Mean Sig* Effect Size Mean Sig* Effect SizeAll Students N = 1268
COLLEGE ACTIVITIES
Academic, Intellectual and Social Experiences
4. In your experiences at this college during the current school year, about how often have you done each of the following?
1=Never, 2=Sometimes, 3=Often, 4=Very often
a. Asked questions in class or contributed to class discussions CLQUEST All Students 2.75 2.84 2.91
b. Made a class presentation CLPRESEN All Students 1.86 2.05 * -0.21 2.04
c. Prepared two or more drafts of a paper or assignment before REWROPAP All Students 2.21 2.46 * -0.24 2.47 * -0.25turning it in
d. Worked on a paper or project that required integrating ideas or INTEGRAT All Students 2.47 2.69 * -0.23 2.70 * -0.24
Palomar CollegeOther ExLarge Colleges 2007 CCSSE Cohort
All Other ExLarge N = 47822 All Other Colleges N = 308745
d. Worked on a paper or project that required integrating ideas or All Students 2.47 2.69 0.23 2.70 0.24information from various sources
e. Came to class without completing readings or assignments CLUNPREP All Students 1.88 1.92 1.88
f. Worked with other students on projects during class CLASSGRP All Students 2.45 2.44 2.46
g. Worked with classmates outside of class to prepare OCCGRP All Students 1.69 1.84 1.84 class assignments
h. Tutored or taught other students (paid or voluntary) TUTOR All Students 1.32 1.37 1.36
i. Participated in a community-based project as a part of a COMMPROJ All Students 1.23 1.29 1.29 regular course
j. Used the Internet or instant messaging to work on an INTERNET All Students 2.58 2.80 * -0.21 2.79 * -0.21assignment
k. Used email to communicate with an instructor EMAIL All Students 2.34 2.43 2.41
l. Discussed grades or assignments with an instructor FACGRADE All Students 2.25 2.44 * -0.22 2.49 * -0.28
m. Talked about career plans with an instructor or advisor FACPLANS All Students 1.80 1.92 1.99 * -0.22
* T-tests: 2-tailed M1

Community College Survey of Student EngagementMeans Summary Report: All Students
Your College
Item Variable Class Mean Mean Sig* Effect Size Mean Sig* Effect Size
Other ExLarge Colleges 2007 CCSSE Cohort
COLLEGE ACTIVITIES
Academic, Intellectual, and Social Experiences continuedn. Discussed ideas from your readings or classes with FACIDEAS All Students 1.62 1.68 1.72
instructors outside of class o. Received prompt feedback (written or oral) from instructors on FACFEED All Students 2.57 2.61 2.65
your performance p. Worked harder than you thought you could to meet an WORKHARD All Students 2.28 2.48 * -0.23 2.52 * -0.28
instructor's standards or expectations q. Worked with instructors on activities other than coursework FACOTH All Students 1.32 1.36 1.39
r. Discussed ideas from your readings or classes with others OOCIDEAS All Students 2.54 2.54 2.55
outside of class (students, family members, coworkers, etc.) s. Had serious conversations with students of a different race DIVRSTUD All Students 2.42 2.43 2.36
or ethnicity than your own t. Had serious conversations with students who differ from you DIFFSTUD All Students 2.30 2.33 2.32
in terms of their religious beliefs, political opinions, or personal values
1=Never, 2=Sometimes, 3=Often, 4=Very often
g p p p u. Skipped class SKIPCLAS All Students 1.60 1.61 1.58
Character of Mental Activities
5. During the current school year, how much has your coursework at this college emphasized the following mental activities?
a. Memorizing facts, ideas, or methods from your courses and MEMORIZE All Students 2.73 2.81 2.82 readings so you can repeat them in pretty much the same form
b. Analyzing the basic elements of an idea, experience, or theory ANALYZE All Students 2.82 2.85 2.82
c. Synthesizing and organizing ideas, information, or experiences SYNTHESZ All Students 2.60 2.70 2.69 in new ways
d. Making judgments about the value or soundness of EVALUATE All Students 2.42 2.54 2.53 information, arguments, or methods
e. Applying theories or concepts to practical problems or in new APPLYING All Students 2.54 2.62 2.62 situations
f. Using information you have read or heard to perform a PERFORM All Students 2.67 2.70 2.72 new skill.
1=Very little, 2=Some, 3=Quite a bit, 4=Very much
* T-tests: 2-tailed M2

Community College Survey of Student EngagementMeans Summary Report: All Students
Your College
Item Variable Class Mean Mean Sig* Effect Size Mean Sig* Effect Size
Other ExLarge Colleges 2007 CCSSE Cohort
COLLEGE ACTIVITIES
Reading and Writing
6. During the current school year, about how much reading and writing have you done at this college?
a. Number of assigned textbooks, manuals, books, or READASGN All Students 2.71 2.84 2.85 book-length packs of course readings
b. Number of books read on your own (not assigned) for READOWN All Students 2.10 2.10 2.07 personal enjoyment or academic enrichment
c. Number of written papers or reports of any length WRITEANY All Students 2.45 2.81 * -0.33 2.81 * -0.33
Nature of Exams
7. Mark the box that best represents the extent to which your examinations during the current school year have challenged you to do your best work at this college
EXAMS All Students 4.82 4.92 5.00
1=None, 2=Between 1 and 4, 3=Between 5 and 10, 4=Between 11 and 20, 5=More than 20
1=Extremely easy to 7=Extremely challenging
OPINIONS ABOUT YOUR SCHOOL
Institutional Emphasis9. How much does this college emphasize each of the following?
a. Encouraging you to spend significant amounts of time ENVSCHOL All Students 2.89 2.93 2.94 studying
b. Providing the support you need to help you succeed at this ENVSUPRT All Students 2.88 2.90 2.93 college
c. Encouraging contact among students from different economic, ENVDIVRS All Students 2.39 2.49 2.45 social, and racial or ethnic backgrounds
d. Helping you cope with your non-academic responsibilities ENVNACAD All Students 1.81 1.87 1.90 (work, family, etc.)
e. Providing the support you need to thrive socially ENVSOCAL All Students 1.94 2.06 2.08
f. Providing the financial support you need to afford your FINSUPP All Students 2.12 2.28 2.37 * -0.23education
g. Using computers in academic work ENVCOMP All Students 2.71 3.04 * -0.34 3.08 * -0.38
1=Very little, 2=Some, 3=Quite a bit, 4=Very much
* T-tests: 2-tailed M3

Community College Survey of Student EngagementMeans Summary Report: All Students
Your College
Item Variable Class Mean Mean Sig* Effect Size Mean Sig* Effect Size
Other ExLarge Colleges 2007 CCSSE Cohort
WEEKLY ACTIVITIES
10. About how many hours do you spend in a typical 7 - day week doing each of the following?
a. Preparing for class (studying, reading, writing, rehearsing, ACADPR01 All Students 1.75 1.85 1.88 doing homework, or other activities related to your program)
b. Working for pay PAYWORK All Students 3.19 3.37 3.23
c. Participating in college-sponsored activities (organizations, campus COCURR01 All Students 0.22 0.23 0.27 publications, student government, intercollegiate or intramural sports, etc.)
d. Providing care for dependents living with you (parents, children, CAREDE01 All Students 1.35 1.62 1.82 * -0.23spouse, etc.)
e. Commuting to and from classes COMMUTE All Students 1.24 1.29 1.31
Quality of Relationships
0=None, 1=1-5 hours/week, 2=6-10 hours/week, 3=11-20 hours/week, 4=21-30 hours/week, 5=More than 30 hours/week
Quality of Relationships
11. Mark the box that best represents the quality of your relationships with people at this college.
a. Relationships with other students ENVSTU All Students 5.19 5.32 5.47 * -0.21
b. Relationships with instuctors ENVFAC All Students 5.70 5.56 5.65
c. Relationships with administrative personnel and offices ENVADM All Students 4.84 4.75 4.93
1=Unfriendly, unsupportive, sense of alienation to 7=Friendly, supportive, sense of belonging
1=Unavailable, unhelpful, unsympathetic to 7=Available, helpful, sympathetic
1=Unhelpful, inconsiderate, rigid to 7=Helpful, considerate, flexible
* T-tests: 2-tailed M4

Community College Survey of Student EngagementMeans Summary Report: All Students
Your College
Item Variable Class Mean Mean Sig* Effect Size Mean Sig* Effect Size
Other ExLarge Colleges 2007 CCSSE Cohort
EDUCATIONAL AND PERSONAL GROWTH
Knowledge, Skills & Personal Development
12. How much has YOUR EXPERIENCE AT THIS COLLEGE contributed to your knowledge, skills, and personal development in the following areas?
a. Acquiring a broad general education GNGENLED All Students 2.81 2.93 2.93
b. Acquiring job or work-related knowledge and skills GNWORK All Students 2.27 2.44 2.55 * -0.27
c. Writing clearly and effectively GNWRITE All Students 2.47 2.67 * -0.22 2.68 * -0.22
d. Speaking clearly and effectively GNSPEAK All Students 2.42 2.59 2.58
Thi ki iti ll d l ti ll GNANALY All St d t 2 74 2 83 2 85
1=Very little, 2=Some, 3=Quite a bit, 4=Very much
e. Thinking critically and analytically GNANALY All Students 2.74 2.83 2.85
f. Solving numerical problems GNSOLVE All Students 2.44 2.54 2.57
g. Using computing and information technology GNCMPTS All Students 2.36 2.64 * -0.28 2.69 * -0.33
h. Working effectively with others GNOTHERS All Students 2.54 2.64 2.69
i. Learning effectively on your own GNINQ All Students 2.79 2.85 2.88
j. Understanding yourself GNSELF All Students 2.42 2.56 2.57
k. Understanding people of other racial and ethnic backgrounds GNDIVERS All Students 2.27 2.39 2.34
l. Developing a personal code of values and ethics GNETHICS All Students 2.17 2.32 2.32
m. Contributing to the welfare of your community GNCOMMUN All Students 1.80 1.94 1.97
n. Developing clearer career goals CARGOAL All Students 2.40 2.58 2.62 * -0.22
o. Gaining information about career opportunities GAINCAR All Students 2.29 2.47 2.51 * -0.21
* T-tests: 2-tailed M5

Community College Survey of Student EngagementMeans Summary Report: All Students
Your College
Item Variable Class Mean Mean Sig* Effect Size Mean Sig* Effect Size
Other ExLarge Colleges 2007 CCSSE Cohort
STUDENT SERVICES
13.1 How often do you use the following services?a. Frequency: Academic advising/planning USEACAD All Students 1.61 1.69 1.74
b. Frequency: Career counseling USECACOU All Students 1.41 1.46 1.43
c. Frequency: Job placement assistance USEJOBPL All Students 1.16 1.22 1.25
d. Frequency: Peer or other tutoring USETUTOR All Students 1.34 1.47 * -0.20 1.45
e. Frequency: Skill labs (writing, math, etc.) USELAB All Students 1.68 1.69 1.71
f. Frequency: Child care USECHLD All Students 1.11 1.15 1.18
g. Frequency: Financial aid advising USEFAADV All Students 1.45 1.73 * -0.36 1.80 * -0.46
0=Don’t know/N.A, 1=Rarely/never, 2=Sometimes, 3=Often
h. Frequency: Computer lab USECOMLB All Students 1.79 2.05 * -0.32 2.09 * -0.38
i. Frequency: Student organizations USESTORG All Students 1.23 1.30 1.34
j. Frequency: Transfer credit assistance USETRCRD All Students 1.49 1.54 1.55
k. Frequency: Services to students with disabilities USEDISAB All Students 1.26 1.27 1.30
* T-tests: 2-tailed M6

Community College Survey of Student EngagementMeans Summary Report: All Students
Your College
Item Variable Class Mean Mean Sig* Effect Size Mean Sig* Effect Size
Other ExLarge Colleges 2007 CCSSE Cohort
STUDENT SERVICES
13.2 How satisfied are you with the services?a. Satisfaction: Academic advising/planning SATACAD All Students 2.08 2.15 2.21
b. Satisfaction: Career counseling SATCACOU All Students 2.00 2.04 2.04
c. Satisfaction: Job placement assistance SATJOBPL All Students 1.69 1.79 1.82
d. Satisfaction: Peer or other tutoring SATTUTOR All Students 2.04 2.14 2.14
e. Satisfaction: Skill labs (writing, math, etc.) SATLAB All Students 2.25 2.24 2.25
f. Satisfaction: Child care SATCHLD All Students 1.65 1.74 1.76
g. Satisfaction: Financial aid advising SATFAADV All Students 1.97 2.10 2.18 * -0.29
0=N.A.,1=Not at all, 2=Somewhat, 3=Very
h. Satisfaction: Computer lab SATCOMLB All Students 2.36 2.49 * -0.21 2.49 * -0.22
i. Satisfaction: Student organizations SATSTORG All Students 1.81 1.92 1.96 * -0.22
j. Satisfaction: Transfer credit assistance SATTRCRD All Students 1.98 2.04 2.06
k. Satisfaction: Services to students with disabilities SATDISAB All Students 2.00 1.98 2.00
* T-tests: 2-tailed M7

Community College Survey of Student EngagementMeans Summary Report: All Students
Your College
Item Variable Class Mean Mean Sig* Effect Size Mean Sig* Effect Size
Other ExLarge Colleges 2007 CCSSE Cohort
STUDENT SERVICES
13.3 How important are the services to you?a. Importance: Academic advising/planning IMPACAD All Students 2.39 2.50 2.50
b. Importance: Career counseling IMPCACOU All Students 2.23 2.33 2.28
c. Importance: Job placement assistance IMPJOBPL All Students 1.80 2.00 * -0.24 2.01 * -0.25
d. Importance: Peer or other tutoring IMPTUTOR All Students 1.96 2.11 2.08
e. Importance: Skill labs (writing, math, etc.) IMPLAB All Students 2.10 2.20 2.18
f. Importance: Child care IMPCHLD All Students 1.63 1.72 1.73
g. Importance: Financial aid advising IMPFAADV All Students 2.05 2.32 * -0.32 2.37 * -0.38
1=Not at all, 2=Somewhat, 3=Very
h. Importance: Computer lab IMPCOMLB All Students 2.16 2.42 * -0.35 2.43 * -0.37
i. Importance: Student organizations IMPSTORG All Students 1.66 1.82 * -0.20 1.81
j. Importance: Transfer credit assistance IMPTRCRD All Students 2.18 2.27 2.23
k. Importance: Services to students with disabilities IMPDISAB All Students 1.89 2.02 2.02
* T-tests: 2-tailed M8

Community College Survey of Student EngagementMeans Summary Report: All Students
Your College
Item Variable Class Mean Mean Sig* Effect Size Mean Sig* Effect Size
Other ExLarge Colleges 2007 CCSSE Cohort
COLLEGE EXPERIENCES
14. How likely is it that the following issues would cause you to withdraw from class or from this college?
a. Working full-time WRKFULL All Students 2.23 2.24 2.17
b. Caring for dependents CAREDEP All Students 1.87 1.92 1.92
c. Academically unprepared ACADUNP All Students 1.64 1.73 1.67
d. Lack of finances LACKFIN All Students 2.10 2.34 * -0.21 2.38 * -0.24
e. Transfer to a 4-year college or university TRANSFER All Students 2.58 2.61 2.46
15 How supportive are your friends of your attending this FRNDSUPP All Students 3 13 3 19 3 23
1=Not likely, 2=Somewhat likely, 3=Likely, 4=Very likely
1=Not very, 2=Somewhat, 3=Quite a bit, 4=Extremely
15. How supportive are your friends of your attending this FRNDSUPP All Students 3.13 3.19 3.23 college?
16. How supportive is your immediate family of your attending FAMSUPP All Students 3.46 3.46 3.50 this college?
23. How many TOTAL credit hours have you earned at this college, TOTCHRS All Students 2.06 2.07 2.02 not counting the courses you are currently taking this term?
25. How many classes are you presently taking at OTHER OTHINST All Students 1.44 1.43 1.42 institutions?
27. How would you evaluate your entire educational experience ENTIREXP All Students 3.19 3.12 3.15 at this college?
0=None, 1=1-14 credits, 2=15-29 credits, 3=30-44 credits, 4=45-60 credits, 5= over 60 credits
1=None, 2=1 class, 3=2 classes, 4=3 classes, 5=4 classes or more
1=Poor, 2=Fair, 3=Good, 4=Excellent
1=Not very, 2=Somewhat, 3=Quite a bit, 4=Extremely
* T-tests: 2-tailed M9

Community College Survey of Student Engagement
# of respondents mean standard deviation std error of the mean significance effect size
Variable Names Your College
Other ExLarge Colleges
2007 CCSSE Cohort Your College
Other ExLarge Colleges
2007 CCSSE Cohort Your College
Other ExLarge Colleges
2007 CCSSE Cohort Your College
Other ExLarge Colleges
2007 CCSSE Cohort
Other ExLarge
Colleges*2007 CCSSE
Cohort*
Other ExLarge Colleges
2007 CCSSE Cohort
CLQUEST 1266 47,739 308,328 2.75 2.84 2.91 0.86 0.85 0.85 0.024 0.004 0.002 0.000 0.000 -0.10 -0.18CLPRESEN 1261 47,543 307,087 1.86 2.05 2.04 0.87 0.92 0.91 0.025 0.004 0.002 0.000 0.000 -0.21 -0.19REWROPAP 1263 47,361 306,045 2.21 2.46 2.47 1.03 1.03 1.03 0.029 0.005 0.002 0.000 0.000 -0.24 -0.25INTEGRAT 1255 47,374 306,410 2.47 2.69 2.70 0.99 0.95 0.95 0.028 0.004 0.002 0.000 0.000 -0.23 -0.24CLUNPREP 1256 47,284 305,553 1.88 1.92 1.88 0.76 0.75 0.74 0.021 0.003 0.001 0.030 0.702 -0.06 -0.01CLASSGRP 1254 47,221 305,043 2.45 2.44 2.46 0.92 0.89 0.89 0.026 0.004 0.002 0.572 0.846 0.02 -0.01OCCGRP 1257 47,383 306,044 1.69 1.84 1.84 0.82 0.87 0.88 0.023 0.004 0.002 0.000 0.000 -0.16 -0.17TUTOR 1257 47,493 306,891 1.32 1.37 1.36 0.65 0.70 0.69 0.018 0.003 0.001 0.012 0.017 -0.07 -0.07
COMMPROJ 1257 47,337 305,589 1.23 1.29 1.29 0.56 0.63 0.64 0.016 0.003 0.001 0.001 0.000 -0.09 -0.10INTERNET 1252 47,296 305,548 2.58 2.80 2.79 1.05 1.03 1.03 0.030 0.005 0.002 0.000 0.000 -0.21 -0.21
EMAIL 1256 47,352 305,830 2.34 2.43 2.41 0.98 0.99 1.01 0.028 0.005 0.002 0.004 0.016 -0.08 -0.07FACGRADE 1257 47,345 305,994 2.25 2.44 2.49 0.84 0.86 0.86 0.024 0.004 0.002 0.000 0.000 -0.22 -0.28FACPLANS 1254 47 366 305 645 1 80 1 92 1 99 0 83 0 86 0 87 0 023 0 004 0 002 0 000 0 000 -0 14 -0 22
Palomar CollegeSummary Statistics: All Students
FACPLANS 1254 47,366 305,645 1.80 1.92 1.99 0.83 0.86 0.87 0.023 0.004 0.002 0.000 0.000 0.14 0.22FACIDEAS 1252 47,219 305,254 1.62 1.68 1.72 0.77 0.81 0.82 0.022 0.004 0.001 0.005 0.000 -0.08 -0.13FACFEED 1253 47,287 305,526 2.57 2.61 2.65 0.87 0.87 0.86 0.025 0.004 0.002 0.101 0.001 -0.05 -0.10
WORKHARD 1257 47,352 305,947 2.28 2.48 2.52 0.86 0.88 0.87 0.024 0.004 0.002 0.000 0.000 -0.23 -0.28FACOTH 1249 46,902 303,505 1.32 1.36 1.39 0.63 0.68 0.71 0.018 0.003 0.001 0.033 0.000 -0.06 -0.10
OOCIDEAS 1259 47,492 306,829 2.54 2.54 2.55 0.95 0.94 0.93 0.027 0.004 0.002 0.976 0.622 0.00 -0.01DIVRSTUD 1261 47,439 306,651 2.42 2.43 2.36 1.06 1.04 1.04 0.030 0.005 0.002 0.765 0.021 -0.01 0.07DIFFSTUD 1257 47,387 306,365 2.30 2.33 2.32 1.04 1.03 1.01 0.029 0.005 0.002 0.209 0.330 -0.04 -0.03SKIPCLAS 1260 47,560 307,047 1.60 1.61 1.58 0.67 0.67 0.67 0.019 0.003 0.001 0.692 0.252 -0.01 0.03MEMORIZE 1263 47,622 307,741 2.73 2.81 2.82 0.92 0.90 0.89 0.026 0.004 0.002 0.002 0.001 -0.09 -0.09ANALYZE 1257 47,496 306,866 2.82 2.85 2.82 0.90 0.84 0.84 0.025 0.004 0.002 0.163 0.753 -0.04 -0.01
SYNTHESZ 1253 47,268 305,537 2.60 2.70 2.69 0.92 0.89 0.87 0.026 0.004 0.002 0.000 0.000 -0.12 -0.11EVALUATE 1254 47,309 306,061 2.42 2.54 2.53 0.97 0.92 0.91 0.027 0.004 0.002 0.000 0.000 -0.14 -0.13APPLYING 1256 47,398 306,560 2.54 2.62 2.62 0.95 0.92 0.91 0.027 0.004 0.002 0.003 0.001 -0.08 -0.09PERFORM 1260 47,589 307,510 2.67 2.70 2.72 0.96 0.94 0.92 0.027 0.004 0.002 0.272 0.041 -0.03 -0.06
READASGN 1232 47,014 304,415 2.71 2.84 2.85 1.00 1.03 1.03 0.029 0.005 0.002 0.000 0.000 -0.13 -0.14READOWN 1234 47,078 304,715 2.10 2.10 2.07 0.97 0.98 1.00 0.028 0.005 0.002 0.973 0.317 0.00 0.03WRITEANY 1233 46,996 304,311 2.45 2.81 2.81 1.16 1.12 1.12 0.033 0.005 0.002 0.000 0.000 -0.33 -0.33
* T-tests: 2-tailed M10

Community College Survey of Student Engagement
# of respondents mean standard deviation std error of the mean significance effect size
Variable Names Your College
Other ExLarge Colleges
2007 CCSSE Cohort Your College
Other ExLarge Colleges
2007 CCSSE Cohort Your College
Other ExLarge Colleges
2007 CCSSE Cohort Your College
Other ExLarge Colleges
2007 CCSSE Cohort
Other ExLarge
Colleges*2007 CCSSE
Cohort*
Other ExLarge Colleges
2007 CCSSE Cohort
Palomar CollegeSummary Statistics: All Students
EXAMS 1186 44,952 292,130 4.82 4.92 5.00 1.23 1.20 1.20 0.036 0.006 0.002 0.004 0.000 -0.08 -0.14ENVSCHOL 1232 47,048 304,689 2.89 2.93 2.94 0.83 0.85 0.84 0.024 0.004 0.002 0.085 0.019 -0.05 -0.07ENVSUPRT 1227 46,971 304,270 2.88 2.90 2.93 0.87 0.86 0.85 0.025 0.004 0.002 0.491 0.038 -0.02 -0.06ENVDIVRS 1224 46,882 303,569 2.39 2.49 2.45 1.00 1.00 1.00 0.029 0.005 0.002 0.001 0.051 -0.10 -0.06ENVNACAD 1223 46,848 303,609 1.81 1.87 1.90 0.91 0.94 0.95 0.026 0.004 0.002 0.011 0.000 -0.07 -0.10ENVSOCAL 1223 46,582 302,212 1.94 2.06 2.08 0.90 0.93 0.93 0.026 0.004 0.002 0.000 0.000 -0.13 -0.16FINSUPP 1220 46,648 302,674 2.12 2.28 2.37 1.06 1.10 1.10 0.030 0.005 0.002 0.000 0.000 -0.14 -0.23
ENVCOMP 1228 46,958 304,166 2.71 3.04 3.08 1.03 0.95 0.94 0.029 0.004 0.002 0.000 0.000 -0.34 -0.38ACADPR01 1227 46,928 303,863 1.75 1.85 1.88 0.98 1.04 1.07 0.028 0.005 0.002 0.001 0.000 -0.10 -0.12PAYWORK 1223 46,745 302,903 3.19 3.37 3.23 1.89 1.88 1.94 0.054 0.009 0.004 0.001 0.481 -0.09 -0.02COCURR01 1224 46,818 303,339 0.22 0.23 0.27 0.75 0.67 0.72 0.021 0.003 0.001 0.376 0.016 -0.03 -0.07CAREDE01 1217 46,688 302,699 1.35 1.62 1.82 1.81 1.93 2.05 0.052 0.009 0.004 0.000 0.000 -0.14 -0.23COMMUTE 1225 46 699 303 035 1 24 1 29 1 31 0 76 0 86 0 88 0 022 0 004 0 002 0 030 0 003 -0 06 -0 09COMMUTE 1225 46,699 303,035 1.24 1.29 1.31 0.76 0.86 0.88 0.022 0.004 0.002 0.030 0.003 -0.06 -0.09
ENVSTU 1229 46,891 304,021 5.19 5.32 5.47 1.45 1.38 1.34 0.041 0.006 0.002 0.001 0.000 -0.10 -0.21ENVFAC 1227 46,938 304,215 5.70 5.56 5.65 1.25 1.27 1.26 0.036 0.006 0.002 0.000 0.111 0.12 0.05ENVADM 1226 46,834 303,765 4.84 4.75 4.93 1.50 1.58 1.57 0.043 0.007 0.003 0.040 0.035 0.06 -0.06
GNGENLED 1226 46,846 303,692 2.81 2.93 2.93 0.93 0.87 0.86 0.027 0.004 0.002 0.000 0.000 -0.13 -0.13GNWORK 1219 46,737 303,179 2.27 2.44 2.55 1.02 1.03 1.02 0.029 0.005 0.002 0.000 0.000 -0.17 -0.27GNWRITE 1221 46,763 303,281 2.47 2.67 2.68 0.96 0.94 0.93 0.027 0.004 0.002 0.000 0.000 -0.22 -0.22GNSPEAK 1223 46,766 303,175 2.42 2.59 2.58 0.98 0.97 0.96 0.028 0.004 0.002 0.000 0.000 -0.18 -0.17GNANALY 1222 46,745 303,011 2.74 2.83 2.85 0.92 0.88 0.88 0.026 0.004 0.002 0.001 0.000 -0.10 -0.12GNSOLVE 1223 46,705 302,835 2.44 2.54 2.57 1.00 1.00 0.99 0.029 0.005 0.002 0.001 0.000 -0.10 -0.12GNCMPTS 1220 46,727 302,906 2.36 2.64 2.69 0.99 1.02 1.00 0.029 0.005 0.002 0.000 0.000 -0.28 -0.33
GNOTHERS 1223 46,726 303,040 2.54 2.64 2.69 0.91 0.92 0.92 0.026 0.004 0.002 0.000 0.000 -0.11 -0.17GNINQ 1218 46,754 303,078 2.79 2.85 2.88 0.90 0.90 0.89 0.026 0.004 0.002 0.040 0.001 -0.06 -0.09
GNSELF 1224 46,699 302,768 2.42 2.56 2.57 1.04 1.02 1.01 0.030 0.005 0.002 0.000 0.000 -0.13 -0.14GNDIVERS 1224 46,677 302,600 2.27 2.39 2.34 1.03 1.02 1.01 0.030 0.005 0.002 0.000 0.022 -0.12 -0.07GNETHICS 1224 46,650 302,613 2.17 2.32 2.32 1.02 1.02 1.01 0.029 0.005 0.002 0.000 0.000 -0.15 -0.15
GNCOMMUN 1221 46,552 302,008 1.80 1.94 1.97 0.91 0.96 0.96 0.026 0.004 0.002 0.000 0.000 -0.15 -0.18CARGOAL 1223 46,702 302,942 2.40 2.58 2.62 1.05 1.02 1.01 0.030 0.005 0.002 0.000 0.000 -0.18 -0.22
* T-tests: 2-tailed M11

Community College Survey of Student Engagement
# of respondents mean standard deviation std error of the mean significance effect size
Variable Names Your College
Other ExLarge Colleges
2007 CCSSE Cohort Your College
Other ExLarge Colleges
2007 CCSSE Cohort Your College
Other ExLarge Colleges
2007 CCSSE Cohort Your College
Other ExLarge Colleges
2007 CCSSE Cohort
Other ExLarge
Colleges*2007 CCSSE
Cohort*
Other ExLarge Colleges
2007 CCSSE Cohort
Palomar CollegeSummary Statistics: All Students
GAINCAR 1224 46,790 303,398 2.29 2.47 2.51 1.05 1.04 1.03 0.030 0.005 0.002 0.000 0.000 -0.17 -0.21USEACAD 1061 42,136 275,860 1.61 1.69 1.74 0.66 0.67 0.68 0.021 0.003 0.001 0.000 0.000 -0.12 -0.20
USECACOU 978 37,365 239,330 1.41 1.46 1.43 0.59 0.63 0.61 0.019 0.003 0.001 0.013 0.307 -0.08 -0.03USEJOBPL 704 26,768 175,319 1.16 1.22 1.25 0.44 0.50 0.52 0.017 0.003 0.001 0.001 0.000 -0.13 -0.16USETUTOR 845 33,168 215,510 1.34 1.47 1.45 0.60 0.67 0.66 0.021 0.004 0.001 0.000 0.000 -0.20 -0.18
USELAB 926 35,377 229,542 1.68 1.69 1.71 0.77 0.75 0.76 0.026 0.004 0.002 0.775 0.323 -0.01 -0.03USECHLD 533 18,774 123,846 1.11 1.15 1.18 0.40 0.46 0.51 0.017 0.003 0.001 0.051 0.001 -0.09 -0.14
USEFAADV 781 33,782 230,516 1.45 1.73 1.80 0.68 0.77 0.77 0.025 0.004 0.002 0.000 0.000 -0.36 -0.46USECOMLB 965 39,821 261,606 1.79 2.05 2.09 0.79 0.79 0.79 0.026 0.004 0.002 0.000 0.000 -0.32 -0.38USESTORG 706 27,369 183,493 1.23 1.30 1.34 0.51 0.57 0.60 0.020 0.004 0.001 0.001 0.000 -0.13 -0.19USETRCRD 861 30,969 194,283 1.49 1.54 1.55 0.64 0.68 0.68 0.022 0.004 0.002 0.032 0.010 -0.08 -0.09USEDISAB 531 18,611 121,345 1.26 1.27 1.30 0.60 0.60 0.62 0.026 0.004 0.002 0.795 0.243 -0.01 -0.05SATACAD 871 36 804 245 601 2 08 2 15 2 21 0 63 0 63 0 64 0 022 0 003 0 001 0 006 0 000 -0 10 -0 20SATACAD 871 36,804 245,601 2.08 2.15 2.21 0.63 0.63 0.64 0.022 0.003 0.001 0.006 0.000 -0.10 -0.20
SATCACOU 676 27,271 175,900 2.00 2.04 2.04 0.68 0.68 0.69 0.027 0.004 0.002 0.107 0.122 -0.07 -0.06SATJOBPL 331 15,664 110,106 1.69 1.79 1.82 0.70 0.70 0.71 0.039 0.006 0.002 0.017 0.001 -0.14 -0.18SATTUTOR 485 22,805 148,236 2.04 2.14 2.14 0.69 0.69 0.70 0.032 0.005 0.002 0.003 0.002 -0.14 -0.15
SATLAB 628 26,309 173,229 2.25 2.24 2.25 0.68 0.66 0.65 0.028 0.004 0.002 0.908 0.843 0.00 -0.01SATCHLD 210 9,042 63,930 1.65 1.74 1.76 0.76 0.75 0.77 0.053 0.008 0.003 0.096 0.049 -0.12 -0.14
SATFAADV 516 26,827 191,926 1.97 2.10 2.18 0.75 0.74 0.73 0.035 0.005 0.002 0.000 0.000 -0.17 -0.29SATCOMLB 766 34,616 232,423 2.36 2.49 2.49 0.64 0.61 0.61 0.024 0.003 0.001 0.000 0.000 -0.21 -0.22SATSTORG 366 16,897 119,751 1.81 1.92 1.96 0.63 0.67 0.67 0.035 0.005 0.002 0.003 0.000 -0.17 -0.22SATTRCRD 608 22,907 147,160 1.98 2.04 2.06 0.66 0.70 0.71 0.028 0.005 0.002 0.046 0.007 -0.09 -0.12SATDISAB 260 10,846 75,384 2.00 1.98 2.00 0.82 0.77 0.77 0.051 0.008 0.003 0.703 0.910 0.02 -0.01IMPACAD 1169 44,637 290,984 2.39 2.50 2.50 0.76 0.69 0.68 0.022 0.003 0.001 0.000 0.000 -0.15 -0.16
IMPCACOU 1161 44,082 287,625 2.23 2.33 2.28 0.81 0.79 0.79 0.024 0.004 0.001 0.000 0.024 -0.13 -0.07IMPJOBPL 1138 43,521 283,865 1.80 2.00 2.01 0.82 0.84 0.85 0.024 0.004 0.002 0.000 0.000 -0.24 -0.25IMPTUTOR 1144 43,498 283,895 1.96 2.11 2.08 0.84 0.82 0.82 0.025 0.004 0.002 0.000 0.000 -0.18 -0.15
IMPLAB 1134 43,336 282,850 2.10 2.20 2.18 0.84 0.81 0.81 0.025 0.004 0.002 0.000 0.001 -0.12 -0.10IMPCHLD 1134 43,023 281,017 1.63 1.72 1.73 0.83 0.86 0.86 0.025 0.004 0.002 0.001 0.000 -0.10 -0.11
IMPFAADV 1133 43,380 283,787 2.05 2.32 2.37 0.89 0.85 0.83 0.027 0.004 0.002 0.000 0.000 -0.32 -0.38
* T-tests: 2-tailed M12

Community College Survey of Student Engagement
# of respondents mean standard deviation std error of the mean significance effect size
Variable Names Your College
Other ExLarge Colleges
2007 CCSSE Cohort Your College
Other ExLarge Colleges
2007 CCSSE Cohort Your College
Other ExLarge Colleges
2007 CCSSE Cohort Your College
Other ExLarge Colleges
2007 CCSSE Cohort
Other ExLarge
Colleges*2007 CCSSE
Cohort*
Other ExLarge Colleges
2007 CCSSE Cohort
Palomar CollegeSummary Statistics: All Students
IMPCOMLB 1142 43,712 285,191 2.16 2.42 2.43 0.84 0.76 0.75 0.025 0.004 0.001 0.000 0.000 -0.35 -0.37IMPSTORG 1113 42,834 280,258 1.66 1.82 1.81 0.76 0.79 0.78 0.023 0.004 0.001 0.000 0.000 -0.20 -0.20IMPTRCRD 1136 43,492 283,637 2.18 2.27 2.23 0.87 0.84 0.85 0.026 0.004 0.002 0.000 0.077 -0.11 -0.05IMPDISAB 1133 43,242 282,426 1.89 2.02 2.02 0.91 0.92 0.92 0.027 0.004 0.002 0.000 0.000 -0.14 -0.14WRKFULL 1233 46,697 302,644 2.23 2.24 2.17 1.17 1.18 1.17 0.033 0.005 0.002 0.760 0.080 -0.01 0.05CAREDEP 1228 46,578 302,021 1.87 1.92 1.92 1.06 1.08 1.07 0.030 0.005 0.002 0.064 0.079 -0.05 -0.05ACADUNP 1229 46,406 300,935 1.64 1.73 1.67 0.91 0.95 0.93 0.026 0.004 0.002 0.002 0.330 -0.09 -0.03LACKFIN 1223 46,498 301,668 2.10 2.34 2.38 1.15 1.18 1.19 0.033 0.005 0.002 0.000 0.000 -0.21 -0.24
TRANSFER 1222 46,566 302,035 2.58 2.61 2.46 1.28 1.24 1.25 0.037 0.006 0.002 0.317 0.001 -0.03 0.09FRNDSUPP 1232 46,701 302,778 3.13 3.19 3.23 0.91 0.90 0.89 0.026 0.004 0.002 0.013 0.000 -0.07 -0.11FAMSUPP 1226 46,557 301,921 3.46 3.46 3.50 0.81 0.82 0.80 0.023 0.004 0.001 0.838 0.061 -0.01 -0.05TOTCHRS 1205 46,313 300,343 2.06 2.07 2.02 1.48 1.49 1.48 0.043 0.007 0.003 0.785 0.346 -0.01 0.03OTHINST 1213 46 263 300 448 1 44 1 43 1 42 1 04 1 05 1 05 0 030 0 005 0 002 0 795 0 508 0 01 0 02OTHINST 1213 46,263 300,448 1.44 1.43 1.42 1.04 1.05 1.05 0.030 0.005 0.002 0.795 0.508 0.01 0.02
ENTIREXP 1214 46,263 300,465 3.19 3.12 3.15 0.68 0.67 0.68 0.020 0.003 0.001 0.000 0.021 0.11 0.07
* T-tests: 2-tailed M13

Community College Survey of Student EngagementMeans Summary Report: Enrollment Status Breakout
Your College
Item Variable Class Mean Mean Sig* Effect Size Mean Sig* Effect Size
COLLEGE ACTIVITIES
Academic, Intellectual and Social Experiences
4. In your experiences at this college during the current school year, about how often have you done each of the following?
1=Never, 2=Sometimes, 3=Often, 4=Very often
a. Asked questions in class or contributed to class discussions CLQUEST Part - Time 2.73 2.82 2.88 Full - Time 2.81 2.88 2.94
b. Made a class presentation CLPRESEN Part - Time 1.75 1.93 * -0.20 1.90 Full - Time 2.10 2.27 2.24
c. Prepared two or more drafts of a paper or assignment before REWROPAP Part - Time 2.08 2.36 * -0.27 2.36 * -0.26turning it in Full - Time 2.48 2.65 2.64
d. Worked on a paper or project that required integrating ideas or INTEGRAT Part - Time 2.31 2.56 * -0.27 2.55 * -0.25
All Other ExLarge N = 47822
All Other ExLarge (Part-Time) N = 17415
All Other ExLarge (Full-Time) N = 30407
Palomar CollegeOther ExLarge Colleges 2007 CCSSE Cohort
All Students N = 1268 All Other Colleges N = 308745
All Other Colleges (Part-Time) N = 95819
All Other Colleges (Full-Time) N = 212926
All Part-Time Students N = 531
All Full-Time Students N = 737
d. Worked on a paper or project that required integrating ideas or Part Time 2.31 2.56 0.27 2.55 0.25information from various sources Full - Time 2.82 2.94 2.92
e. Came to class without completing readings or assignments CLUNPREP Part - Time 1.80 1.88 1.82 Full - Time 2.03 2.01 1.98
f. Worked with other students on projects during class CLASSGRP Part - Time 2.42 2.38 2.38 Full - Time 2.51 2.55 2.57
g. Worked with classmates outside of class to prepare OCCGRP Part - Time 1.64 1.75 1.72 class assignments Full - Time 1.81 2.00 * -0.22 2.01 * -0.23
h. Tutored or taught other students (paid or voluntary) TUTOR Part - Time 1.28 1.32 1.30 Full - Time 1.40 1.47 1.46
i. Participated in a community-based project as a part of a COMMPROJ Part - Time 1.23 1.24 1.23 regular course Full - Time 1.23 1.38 * -0.21 1.38 * -0.21
j. Used the Internet or instant messaging to work on an INTERNET Part - Time 2.37 2.68 * -0.29 2.65 * -0.26assignment Full - Time 3.02 3.02 3.00
k. Used email to communicate with an instructor EMAIL Part - Time 2.16 2.31 2.28 Full - Time 2.73 2.64 2.62
l. Discussed grades or assignments with an instructor FACGRADE Part - Time 2.14 2.37 * -0.27 2.41 * -0.31Full - Time 2.50 2.57 2.61
m. Talked about career plans with an instructor or advisor FACPLANS Part - Time 1.68 1.84 1.87 * -0.23Full - Time 2.04 2.08 2.15
* T-tests: 2-tailed M14

Community College Survey of Student EngagementMeans Summary Report: Enrollment Status Breakout
Your College
Item Variable Class Mean Mean Sig* Effect Size Mean Sig* Effect Size
Other ExLarge Colleges 2007 CCSSE Cohort
COLLEGE ACTIVITIES
Academic, Intellectual, and Social Experiences continuedn. Discussed ideas from your readings or classes with FACIDEAS Part - Time 1.59 1.62 1.64
instructors outside of class Full - Time 1.66 1.79 1.83 * -0.20o. Received prompt feedback (written or oral) from instructors on FACFEED Part - Time 2.54 2.59 2.64
your performance Full - Time 2.64 2.64 2.67 p. Worked harder than you thought you could to meet an WORKHARD Part - Time 2.20 2.43 * -0.26 2.46 * -0.30
instructor's standards or expectations Full - Time 2.44 2.58 2.60 q. Worked with instructors on activities other than coursework FACOTH Part - Time 1.29 1.32 1.32
Full - Time 1.38 1.44 1.49 r. Discussed ideas from your readings or classes with others OOCIDEAS Part - Time 2.48 2.50 2.51
outside of class (students, family members, coworkers, etc.) Full - Time 2.65 2.60 2.61 s. Had serious conversations with students of a different race DIVRSTUD Part - Time 2.32 2.37 2.29
or ethnicity than your own Full - Time 2.65 2.55 2.48 t. Had serious conversations with students who differ from you DIFFSTUD Part - Time 2.17 2.25 2.22
in terms of their religious beliefs, political opinions, or personal values Full - Time 2.57 2.49 2.48
1=Never, 2=Sometimes, 3=Often, 4=Very often
g p p p u. Skipped class SKIPCLAS Part - Time 1.53 1.55 1.50
Full - Time 1.76 1.72 1.69
Character of Mental Activities
5. During the current school year, how much has your coursework at this college emphasized the following mental activities?
a. Memorizing facts, ideas, or methods from your courses and MEMORIZE Part - Time 2.65 2.77 2.77 readings so you can repeat them in pretty much the same form Full - Time 2.91 2.89 2.88
b. Analyzing the basic elements of an idea, experience, or theory ANALYZE Part - Time 2.74 2.81 2.78 Full - Time 2.98 2.94 2.90
c. Synthesizing and organizing ideas, information, or experiences SYNTHESZ Part - Time 2.53 2.65 2.64 in new ways Full - Time 2.74 2.79 2.77
d. Making judgments about the value or soundness of EVALUATE Part - Time 2.30 2.47 2.45 information, arguments, or methods Full - Time 2.66 2.68 2.65
e. Applying theories or concepts to practical problems or in new APPLYING Part - Time 2.47 2.56 2.55 situations Full - Time 2.68 2.72 2.72
f. Using information you have read or heard to perform a PERFORM Part - Time 2.66 2.65 2.66 new skill. Full - Time 2.68 2.78 2.81
1=Very little, 2=Some, 3=Quite a bit, 4=Very much
* T-tests: 2-tailed M15

Community College Survey of Student EngagementMeans Summary Report: Enrollment Status Breakout
Your College
Item Variable Class Mean Mean Sig* Effect Size Mean Sig* Effect Size
Other ExLarge Colleges 2007 CCSSE Cohort
COLLEGE ACTIVITIES
Reading and Writing
6. During the current school year, about how much reading and writing have you done at this college?
a. Number of assigned textbooks, manuals, books, or READASGN Part - Time 2.54 2.69 2.67 book-length packs of course readings Full - Time 3.07 3.12 3.12
b. Number of books read on your own (not assigned) for READOWN Part - Time 2.10 2.10 2.09 personal enjoyment or academic enrichment Full - Time 2.12 2.11 2.06
c. Number of written papers or reports of any length WRITEANY Part - Time 2.19 2.61 * -0.38 2.57 * -0.35Full - Time 2.98 3.19 * -0.20 3.16
Nature of Exams
7. Mark the box that best represents the extent to which your examinations during the current school year have challenged you
EXAMS Part - Time 4.80 4.91 4.97
to do your best work at this college Full - Time 4.88 4.96 5.03
1=None, 2=Between 1 and 4, 3=Between 5 and 10, 4=Between 11 and 20, 5=More than 20
1=Extremely easy to 7=Extremely challenging
OPINIONS ABOUT YOUR SCHOOL
Institutional Emphasis9. How much does this college emphasize each of the following?
a. Encouraging you to spend significant amounts of time ENVSCHOL Part - Time 2.81 2.89 2.89 studying Full - Time 3.04 3.01 3.02
b. Providing the support you need to help you succeed at this ENVSUPRT Part - Time 2.86 2.87 2.89 college Full - Time 2.92 2.95 2.98
c. Encouraging contact among students from different economic, ENVDIVRS Part - Time 2.33 2.45 2.40 social, and racial or ethnic backgrounds Full - Time 2.53 2.57 2.52
d. Helping you cope with your non-academic responsibilities ENVNACAD Part - Time 1.78 1.84 1.86 (work, family, etc.) Full - Time 1.85 1.94 1.96
e. Providing the support you need to thrive socially ENVSOCAL Part - Time 1.88 2.01 2.02 Full - Time 2.05 2.15 2.17
f. Providing the financial support you need to afford your FINSUPP Part - Time 2.01 2.18 2.25 * -0.22education Full - Time 2.36 2.45 2.54
g. Using computers in academic work ENVCOMP Part - Time 2.54 2.93 * -0.40 2.95 * -0.42Full - Time 3.08 3.23 3.25
1=Very little, 2=Some, 3=Quite a bit, 4=Very much
* T-tests: 2-tailed M16

Community College Survey of Student EngagementMeans Summary Report: Enrollment Status Breakout
Your College
Item Variable Class Mean Mean Sig* Effect Size Mean Sig* Effect Size
Other ExLarge Colleges 2007 CCSSE Cohort
WEEKLY ACTIVITIES
10. About how many hours do you spend in a typical 7 - day week doing each of the following?
a. Preparing for class (studying, reading, writing, rehearsing, ACADPR01 Part - Time 1.59 1.73 1.74 doing homework, or other activities related to your program) Full - Time 2.08 2.09 2.09
b. Working for pay PAYWORK Part - Time 3.39 3.62 3.59 Full - Time 2.77 2.88 2.76
c. Participating in college-sponsored activities (organizations, campus COCURR01 Part - Time 0.17 0.18 0.18 publications, student government, intercollegiate or intramural sports, etc.) Full - Time 0.32 0.34 0.39
d. Providing care for dependents living with you (parents, children, CAREDE01 Part - Time 1.51 1.77 2.04 * -0.25spouse, etc.) Full - Time 1.02 1.33 1.51 * -0.25
e. Commuting to and from classes COMMUTE Part - Time 1.16 1.23 1.23 Full - Time 1.40 1.40 1.43
Quality of Relationships
0=None, 1=1-5 hours/week, 2=6-10 hours/week, 3=11-20 hours/week, 4=21-30 hours/week, 5=More than 30 hours/week
Quality of Relationships
11. Mark the box that best represents the quality of your relationships with people at this college.
a. Relationships with other students ENVSTU Part - Time 5.17 5.30 5.44 Full - Time 5.22 5.35 5.51 * -0.22
b. Relationships with instuctors ENVFAC Part - Time 5.81 5.60 5.70 Full - Time 5.47 5.47 5.57
c. Relationships with administrative personnel and offices ENVADM Part - Time 4.88 4.77 4.94 Full - Time 4.76 4.70 4.91
1=Unfriendly, unsupportive, sense of alienation to 7=Friendly, supportive, sense of belonging
1=Unavailable, unhelpful, unsympathetic to 7=Available, helpful, sympathetic
1=Unhelpful, inconsiderate, rigid to 7=Helpful, considerate, flexible
* T-tests: 2-tailed M17

Community College Survey of Student EngagementMeans Summary Report: Enrollment Status Breakout
Your College
Item Variable Class Mean Mean Sig* Effect Size Mean Sig* Effect Size
Other ExLarge Colleges 2007 CCSSE Cohort
EDUCATIONAL AND PERSONAL GROWTH
Knowledge, Skills & Personal Development
12. How much has YOUR EXPERIENCE AT THIS COLLEGE contributed to your knowledge, skills, and personal development in the following areas?
a. Acquiring a broad general education GNGENLED Part - Time 2.69 2.86 2.85 Full - Time 3.07 3.06 3.04
b. Acquiring job or work-related knowledge and skills GNWORK Part - Time 2.30 2.41 2.48 Full - Time 2.20 2.48 * -0.28 2.62 * -0.42
c. Writing clearly and effectively GNWRITE Part - Time 2.36 2.59 * -0.24 2.59 * -0.24Full - Time 2.70 2.82 2.80
d. Speaking clearly and effectively GNSPEAK Part - Time 2.33 2.52 2.50 Full - Time 2.61 2.72 2.70
Thi ki iti ll d l ti ll GNANALY P t Ti 2 67 2 77 2 78
1=Very little, 2=Some, 3=Quite a bit, 4=Very much
e. Thinking critically and analytically GNANALY Part - Time 2.67 2.77 2.78 Full - Time 2.88 2.94 2.95
f. Solving numerical problems GNSOLVE Part - Time 2.37 2.46 2.47 Full - Time 2.61 2.69 2.70
g. Using computing and information technology GNCMPTS Part - Time 2.28 2.56 * -0.27 2.59 * -0.30Full - Time 2.53 2.78 * -0.26 2.83 * -0.31
h. Working effectively with others GNOTHERS Part - Time 2.52 2.59 2.62 Full - Time 2.59 2.74 2.79 * -0.23
i. Learning effectively on your own GNINQ Part - Time 2.78 2.81 2.83 Full - Time 2.81 2.92 2.94
j. Understanding yourself GNSELF Part - Time 2.40 2.51 2.50 Full - Time 2.46 2.65 2.65
k. Understanding people of other racial and ethnic backgrounds GNDIVERS Part - Time 2.21 2.33 2.27 Full - Time 2.40 2.51 2.44
l. Developing a personal code of values and ethics GNETHICS Part - Time 2.12 2.26 2.24 Full - Time 2.26 2.42 2.43
m. Contributing to the welfare of your community GNCOMMUN Part - Time 1.79 1.90 1.91 Full - Time 1.81 2.02 * -0.21 2.05 * -0.24
n. Developing clearer career goals CARGOAL Part - Time 2.32 2.51 2.53 * -0.21Full - Time 2.56 2.69 2.74
o. Gaining information about career opportunities GAINCAR Part - Time 2.24 2.40 2.41 Full - Time 2.40 2.58 2.64 * -0.24
* T-tests: 2-tailed M18

Community College Survey of Student EngagementMeans Summary Report: Enrollment Status Breakout
Your College
Item Variable Class Mean Mean Sig* Effect Size Mean Sig* Effect Size
Other ExLarge Colleges 2007 CCSSE Cohort
STUDENT SERVICES
13.1 How often do you use the following services?a. Frequency: Academic advising/planning USEACAD Part - Time 1.52 1.65 1.69 * -0.24
Full - Time 1.77 1.77 1.81 b. Frequency: Career counseling USECACOU Part - Time 1.37 1.45 1.41
Full - Time 1.48 1.50 1.46 c. Frequency: Job placement assistance USEJOBPL Part - Time 1.15 1.21 1.21
Full - Time 1.17 1.25 1.29 * -0.21d. Frequency: Peer or other tutoring USETUTOR Part - Time 1.30 1.44 * -0.21 1.42
Full - Time 1.41 1.54 1.50 e. Frequency: Skill labs (writing, math, etc.) USELAB Part - Time 1.65 1.65 1.66
Full - Time 1.74 1.76 1.77 f. Frequency: Child care USECHLD Part - Time 1.12 1.13 1.16
Full - Time 1.09 1.17 1.20 * -0.22g. Frequency: Financial aid advising USEFAADV Part - Time 1.39 1.67 * -0.37 1.73 * -0.45
Full - Time 1.57 1.83 * -0.33 1.89 * -0.41
0=Don’t know/N.A, 1=Rarely/never, 2=Sometimes, 3=Often
Full Time 1.57 1.83 0.33 1.89 0.41h. Frequency: Computer lab USECOMLB Part - Time 1.68 1.95 * -0.33 1.97 * -0.36
Full - Time 2.00 2.21 * -0.27 2.24 * -0.32i. Frequency: Student organizations USESTORG Part - Time 1.18 1.25 1.27
Full - Time 1.31 1.38 1.43 j. Frequency: Transfer credit assistance USETRCRD Part - Time 1.41 1.50 1.51
Full - Time 1.62 1.62 1.60 k. Frequency: Services to students with disabilities USEDISAB Part - Time 1.25 1.25 1.27
Full - Time 1.29 1.30 1.33
* T-tests: 2-tailed M19

Community College Survey of Student EngagementMeans Summary Report: Enrollment Status Breakout
Your College
Item Variable Class Mean Mean Sig* Effect Size Mean Sig* Effect Size
Other ExLarge Colleges 2007 CCSSE Cohort
STUDENT SERVICES
13.2 How satisfied are you with the services?a. Satisfaction: Academic advising/planning SATACAD Part - Time 2.05 2.15 2.20 * -0.22
Full - Time 2.13 2.15 2.22 b. Satisfaction: Career counseling SATCACOU Part - Time 1.97 2.04 2.03
Full - Time 2.05 2.05 2.06 c. Satisfaction: Job placement assistance SATJOBPL Part - Time 1.68 1.77 1.78
Full - Time 1.72 1.82 1.86 d. Satisfaction: Peer or other tutoring SATTUTOR Part - Time 1.97 2.12 2.11
Full - Time 2.16 2.17 2.17 e. Satisfaction: Skill labs (writing, math, etc.) SATLAB Part - Time 2.21 2.23 2.23
Full - Time 2.30 2.27 2.28 f. Satisfaction: Child care SATCHLD Part - Time 1.62 1.72 1.72
Full - Time 1.73 1.78 1.80 g. Satisfaction: Financial aid advising SATFAADV Part - Time 1.91 2.07 2.14 * -0.30
Full - Time 2.06 2.14 2.22 * -0.22
0=N.A.,1=Not at all, 2=Somewhat, 3=Very
Full Time 2.06 2.14 2.22 0.22h. Satisfaction: Computer lab SATCOMLB Part - Time 2.30 2.46 * -0.24 2.46 * -0.24
Full - Time 2.45 2.53 2.53 i. Satisfaction: Student organizations SATSTORG Part - Time 1.74 1.89 1.89
Full - Time 1.92 1.97 2.02 j. Satisfaction: Transfer credit assistance SATTRCRD Part - Time 1.92 2.03 2.05
Full - Time 2.06 2.07 2.08 k. Satisfaction: Services to students with disabilities SATDISAB Part - Time 1.96 1.95 1.96
Full - Time 2.07 2.02 2.05
* T-tests: 2-tailed M20

Community College Survey of Student EngagementMeans Summary Report: Enrollment Status Breakout
Your College
Item Variable Class Mean Mean Sig* Effect Size Mean Sig* Effect Size
Other ExLarge Colleges 2007 CCSSE Cohort
STUDENT SERVICES
13.3 How important are the services to you?a. Importance: Academic advising/planning IMPACAD Part - Time 2.29 2.47 * -0.25 2.46 * -0.23
Full - Time 2.61 2.57 2.57 b. Importance: Career counseling IMPCACOU Part - Time 2.13 2.30 * -0.21 2.24
Full - Time 2.42 2.38 2.34 c. Importance: Job placement assistance IMPJOBPL Part - Time 1.73 1.97 * -0.28 1.96 * -0.26
Full - Time 1.94 2.04 2.08 d. Importance: Peer or other tutoring IMPTUTOR Part - Time 1.89 2.07 * -0.21 2.03
Full - Time 2.10 2.18 2.15 e. Importance: Skill labs (writing, math, etc.) IMPLAB Part - Time 2.03 2.16 2.13
Full - Time 2.26 2.27 2.25 f. Importance: Child care IMPCHLD Part - Time 1.60 1.71 1.70
Full - Time 1.71 1.74 1.76 g. Importance: Financial aid advising IMPFAADV Part - Time 1.94 2.27 * -0.38 2.29 * -0.41
Full - Time 2.30 2.43 2.48 * -0.24
1=Not at all, 2=Somewhat, 3=Very
Full Time 2.30 2.43 2.48 0.24h. Importance: Computer lab IMPCOMLB Part - Time 2.05 2.36 * -0.39 2.34 * -0.36
Full - Time 2.37 2.53 * -0.24 2.56 * -0.28i. Importance: Student organizations IMPSTORG Part - Time 1.56 1.77 * -0.26 1.74 * -0.23
Full - Time 1.86 1.91 1.91 j. Importance: Transfer credit assistance IMPTRCRD Part - Time 2.03 2.22 * -0.22 2.17
Full - Time 2.48 2.37 2.31 * 0.21k. Importance: Services to students with disabilities IMPDISAB Part - Time 1.83 1.99 1.98
Full - Time 2.03 2.07 2.09
* T-tests: 2-tailed M21

Community College Survey of Student EngagementMeans Summary Report: Enrollment Status Breakout
Your College
Item Variable Class Mean Mean Sig* Effect Size Mean Sig* Effect Size
Other ExLarge Colleges 2007 CCSSE Cohort
COLLEGE EXPERIENCES
14. How likely is it that the following issues would cause you to withdraw from class or from this college?
a. Working full-time WRKFULL Part - Time 2.25 2.29 2.21 Full - Time 2.18 2.14 2.11
b. Caring for dependents CAREDEP Part - Time 1.89 1.94 1.93 Full - Time 1.81 1.89 1.90
c. Academically unprepared ACADUNP Part - Time 1.63 1.70 1.65 Full - Time 1.68 1.77 1.70
d. Lack of finances LACKFIN Part - Time 2.02 2.35 * -0.27 2.37 * -0.29Full - Time 2.26 2.34 2.39
e. Transfer to a 4-year college or university TRANSFER Part - Time 2.34 2.50 2.36 Full - Time 3.09 2.83 * 0.22 2.63 * 0.37
15 How supportive are your friends of your attending this FRNDSUPP Part - Time 3 12 3 20 3 23
1=Not likely, 2=Somewhat likely, 3=Likely, 4=Very likely
1=Not very, 2=Somewhat, 3=Quite a bit, 4=Extremely
15. How supportive are your friends of your attending this FRNDSUPP Part Time 3.12 3.20 3.23 college? Full - Time 3.15 3.17 3.23
16. How supportive is your immediate family of your attending FAMSUPP Part - Time 3.45 3.45 3.48 this college? Full - Time 3.47 3.48 3.53
23. How many TOTAL credit hours have you earned at this college, TOTCHRS Part - Time 1.94 1.98 1.87 not counting the courses you are currently taking this term? Full - Time 2.32 2.23 2.20
25. How many classes are you presently taking at OTHER OTHINST Part - Time 1.47 1.43 1.42 institutions? Full - Time 1.38 1.45 1.42
27. How would you evaluate your entire educational experience ENTIREXP Part - Time 3.23 3.13 3.16 at this college? Full - Time 3.12 3.11 3.14
1=None, 2=1 class, 3=2 classes, 4=3 classes, 5=4 classes or more
1=Poor, 2=Fair, 3=Good, 4=Excellent
1=Not very, 2=Somewhat, 3=Quite a bit, 4=Extremely
0=None, 1=1-14 credits, 2=15-29 credits, 3=30-44 credits, 4=45-60 credits, 5= over 60 credits
* T-tests: 2-tailed M22

Community College Survey of Student Engagement
# of respondents mean standard deviation std error of the mean significance effect size
Variable Names Your College
Other ExLarge Colleges
2007 CCSSE Cohort Your College
Other ExLarge Colleges
2007 CCSSE Cohort Your College
Other ExLarge Colleges
2007 CCSSE Cohort Your College
Other ExLarge Colleges
2007 CCSSE Cohort
Other ExLarge
Colleges*2007 CCSSE
Cohort*
Other ExLarge Colleges
2007 CCSSE Cohort
CLQUEST 530 17,376 95,661 2.73 2.82 2.88 0.86 0.86 0.85 0.037 0.007 0.003 0.018 0.000 -0.10 -0.18CLPRESEN 528 17,299 95,192 1.75 1.93 1.90 0.86 0.91 0.90 0.037 0.007 0.003 0.000 0.000 -0.20 -0.16REWROPAP 528 17,222 94,862 2.08 2.36 2.36 1.02 1.04 1.04 0.044 0.008 0.003 0.000 0.000 -0.27 -0.26INTEGRAT 527 17,217 94,929 2.31 2.56 2.55 0.99 0.97 0.97 0.043 0.007 0.003 0.000 0.000 -0.27 -0.25CLUNPREP 523 17,209 94,745 1.80 1.88 1.82 0.77 0.74 0.73 0.034 0.006 0.002 0.025 0.665 -0.10 -0.02CLASSGRP 525 17,185 94,584 2.42 2.38 2.38 0.96 0.92 0.91 0.042 0.007 0.003 0.266 0.282 0.05 0.05OCCGRP 527 17,269 94,948 1.64 1.75 1.72 0.81 0.85 0.85 0.035 0.006 0.003 0.004 0.025 -0.13 -0.10TUTOR 524 17,294 95,204 1.28 1.32 1.30 0.60 0.65 0.63 0.026 0.005 0.002 0.175 0.435 -0.06 -0.03
COMMPROJ 528 17,230 94,734 1.23 1.24 1.23 0.57 0.58 0.57 0.025 0.004 0.002 0.656 0.979 -0.02 0.00INTERNET 526 17,202 94,742 2.37 2.68 2.65 1.04 1.05 1.05 0.045 0.008 0.003 0.000 0.000 -0.29 -0.26
EMAIL 526 17,217 94,774 2.16 2.31 2.28 0.95 0.98 1.00 0.041 0.008 0.003 0.001 0.010 -0.15 -0.11FACGRADE 527 17,228 94,821 2.14 2.37 2.41 0.82 0.86 0.85 0.036 0.007 0.003 0.000 0.000 -0.27 -0.31FACPLANS 522 17 239 94 712 1 68 1 84 1 87 0 78 0 83 0 84 0 034 0 006 0 003 0 000 0 000 -0 18 -0 23
Palomar CollegeSummary Statistics: Part - Time Students
FACPLANS 522 17,239 94,712 1.68 1.84 1.87 0.78 0.83 0.84 0.034 0.006 0.003 0.000 0.000 0.18 0.23FACIDEAS 525 17,154 94,524 1.59 1.62 1.64 0.76 0.79 0.79 0.033 0.006 0.003 0.445 0.214 -0.03 -0.05FACFEED 523 17,197 94,643 2.54 2.59 2.64 0.88 0.88 0.87 0.038 0.007 0.003 0.130 0.009 -0.07 -0.11
WORKHARD 525 17,206 94,789 2.20 2.43 2.46 0.86 0.88 0.88 0.037 0.007 0.003 0.000 0.000 -0.26 -0.30FACOTH 523 17,037 93,976 1.29 1.32 1.32 0.60 0.65 0.65 0.026 0.005 0.002 0.331 0.286 -0.04 -0.05
OOCIDEAS 526 17,278 95,095 2.48 2.50 2.51 0.97 0.94 0.94 0.042 0.007 0.003 0.622 0.480 -0.02 -0.03DIVRSTUD 526 17,236 94,987 2.32 2.37 2.29 1.06 1.04 1.03 0.046 0.008 0.003 0.208 0.508 -0.06 0.03DIFFSTUD 525 17,219 94,890 2.17 2.25 2.22 1.04 1.02 1.00 0.045 0.008 0.003 0.080 0.259 -0.08 -0.05SKIPCLAS 526 17,292 95,155 1.53 1.55 1.50 0.66 0.66 0.64 0.029 0.005 0.002 0.430 0.327 -0.03 0.04MEMORIZE 527 17,310 95,398 2.65 2.77 2.77 0.94 0.91 0.91 0.041 0.007 0.003 0.003 0.002 -0.13 -0.13ANALYZE 525 17,260 95,075 2.74 2.81 2.78 0.93 0.85 0.85 0.040 0.006 0.003 0.084 0.258 -0.08 -0.05
SYNTHESZ 520 17,176 94,628 2.53 2.65 2.64 0.95 0.90 0.88 0.042 0.007 0.003 0.002 0.003 -0.14 -0.13EVALUATE 520 17,193 94,812 2.30 2.47 2.45 0.98 0.93 0.92 0.043 0.007 0.003 0.000 0.000 -0.18 -0.17APPLYING 521 17,238 94,977 2.47 2.56 2.55 0.98 0.93 0.92 0.043 0.007 0.003 0.026 0.032 -0.10 -0.09PERFORM 524 17,294 95,296 2.66 2.65 2.66 0.99 0.95 0.93 0.043 0.007 0.003 0.729 0.905 0.02 0.01
READASGN 509 17,055 94,174 2.54 2.69 2.67 0.97 1.01 1.00 0.043 0.008 0.003 0.001 0.004 -0.15 -0.13READOWN 512 17,084 94,260 2.10 2.10 2.09 0.98 0.98 1.00 0.043 0.008 0.003 0.838 0.855 -0.01 0.01WRITEANY 511 17,051 94,107 2.19 2.61 2.57 1.13 1.10 1.10 0.050 0.008 0.004 0.000 0.000 -0.38 -0.35
* T-tests: 2-tailed M23

Community College Survey of Student Engagement
# of respondents mean standard deviation std error of the mean significance effect size
Variable Names Your College
Other ExLarge Colleges
2007 CCSSE Cohort Your College
Other ExLarge Colleges
2007 CCSSE Cohort Your College
Other ExLarge Colleges
2007 CCSSE Cohort Your College
Other ExLarge Colleges
2007 CCSSE Cohort
Other ExLarge
Colleges*2007 CCSSE
Cohort*
Other ExLarge Colleges
2007 CCSSE Cohort
Palomar CollegeSummary Statistics: Part - Time Students
EXAMS 483 16,214 89,693 4.80 4.91 4.97 1.28 1.24 1.24 0.058 0.010 0.004 0.055 0.002 -0.09 -0.14ENVSCHOL 511 17,057 94,148 2.81 2.89 2.89 0.83 0.86 0.85 0.037 0.007 0.003 0.056 0.033 -0.09 -0.09ENVSUPRT 507 17,015 93,961 2.86 2.87 2.89 0.88 0.87 0.86 0.039 0.007 0.003 0.784 0.337 -0.01 -0.04ENVDIVRS 504 16,972 93,620 2.33 2.45 2.40 1.00 0.99 1.00 0.045 0.008 0.003 0.008 0.100 -0.12 -0.07ENVNACAD 506 16,937 93,583 1.78 1.84 1.86 0.91 0.94 0.94 0.040 0.007 0.003 0.167 0.063 -0.06 -0.08ENVSOCAL 507 16,819 93,077 1.88 2.01 2.02 0.90 0.92 0.92 0.040 0.007 0.003 0.003 0.001 -0.13 -0.14FINSUPP 505 16,837 93,150 2.01 2.18 2.25 1.06 1.09 1.10 0.047 0.008 0.004 0.000 0.000 -0.16 -0.22
ENVCOMP 509 16,997 93,852 2.54 2.93 2.95 1.04 0.98 0.98 0.046 0.008 0.003 0.000 0.000 -0.40 -0.42ACADPR01 510 17,043 94,040 1.59 1.73 1.74 0.90 0.98 0.98 0.040 0.007 0.003 0.001 0.001 -0.14 -0.15PAYWORK 503 16,962 93,619 3.39 3.62 3.59 1.88 1.83 1.87 0.084 0.014 0.006 0.005 0.020 -0.13 -0.10COCURR01 506 16,975 93,767 0.17 0.18 0.18 0.67 0.59 0.57 0.030 0.005 0.002 0.596 0.716 -0.02 -0.02CAREDE01 501 16,942 93,579 1.51 1.77 2.04 1.91 2.01 2.11 0.085 0.015 0.007 0.005 0.000 -0.13 -0.25COMMUTE 505 16 936 93 708 1 16 1 23 1 23 0 70 0 82 0 80 0 031 0 006 0 003 0 048 0 049 -0 09 -0 09COMMUTE 505 16,936 93,708 1.16 1.23 1.23 0.70 0.82 0.80 0.031 0.006 0.003 0.048 0.049 -0.09 -0.09
ENVSTU 508 17,030 93,987 5.17 5.30 5.44 1.50 1.39 1.36 0.067 0.011 0.004 0.035 0.000 -0.10 -0.19ENVFAC 509 17,047 94,094 5.81 5.60 5.70 1.24 1.27 1.26 0.055 0.010 0.004 0.000 0.042 0.16 0.09ENVADM 506 16,971 93,799 4.88 4.77 4.94 1.51 1.57 1.57 0.067 0.012 0.005 0.122 0.359 0.07 -0.04
GNGENLED 505 16,981 93,767 2.69 2.86 2.85 0.95 0.90 0.89 0.042 0.007 0.003 0.000 0.000 -0.19 -0.18GNWORK 503 16,935 93,594 2.30 2.41 2.48 1.04 1.03 1.03 0.047 0.008 0.003 0.017 0.000 -0.11 -0.18GNWRITE 504 16,927 93,575 2.36 2.59 2.59 0.98 0.96 0.96 0.044 0.007 0.003 0.000 0.000 -0.24 -0.24GNSPEAK 503 16,941 93,520 2.33 2.52 2.50 1.00 0.98 0.97 0.045 0.008 0.003 0.000 0.000 -0.19 -0.17GNANALY 503 16,933 93,508 2.67 2.77 2.78 0.95 0.90 0.90 0.043 0.007 0.003 0.013 0.007 -0.11 -0.12GNSOLVE 504 16,902 93,344 2.37 2.46 2.47 1.02 1.02 1.01 0.046 0.008 0.003 0.033 0.016 -0.10 -0.11GNCMPTS 502 16,916 93,436 2.28 2.56 2.59 0.98 1.03 1.03 0.044 0.008 0.003 0.000 0.000 -0.27 -0.30
GNOTHERS 503 16,922 93,476 2.52 2.59 2.62 0.91 0.93 0.93 0.040 0.007 0.003 0.085 0.012 -0.08 -0.11GNINQ 501 16,943 93,527 2.78 2.81 2.83 0.91 0.91 0.90 0.041 0.007 0.003 0.538 0.225 -0.03 -0.05
GNSELF 503 16,909 93,405 2.40 2.51 2.50 1.05 1.02 1.01 0.047 0.008 0.003 0.022 0.023 -0.10 -0.10GNDIVERS 504 16,901 93,336 2.21 2.33 2.27 1.05 1.02 1.01 0.047 0.008 0.003 0.009 0.185 -0.12 -0.06GNETHICS 504 16,901 93,338 2.12 2.26 2.24 1.04 1.02 1.01 0.046 0.008 0.003 0.003 0.007 -0.13 -0.12
GNCOMMUN 501 16,859 93,114 1.79 1.90 1.91 0.93 0.95 0.95 0.041 0.007 0.003 0.007 0.003 -0.12 -0.13CARGOAL 505 16,909 93,439 2.32 2.51 2.53 1.06 1.03 1.02 0.047 0.008 0.003 0.000 0.000 -0.19 -0.21
* T-tests: 2-tailed M24

Community College Survey of Student Engagement
# of respondents mean standard deviation std error of the mean significance effect size
Variable Names Your College
Other ExLarge Colleges
2007 CCSSE Cohort Your College
Other ExLarge Colleges
2007 CCSSE Cohort Your College
Other ExLarge Colleges
2007 CCSSE Cohort Your College
Other ExLarge Colleges
2007 CCSSE Cohort
Other ExLarge
Colleges*2007 CCSSE
Cohort*
Other ExLarge Colleges
2007 CCSSE Cohort
Palomar CollegeSummary Statistics: Part - Time Students
GAINCAR 504 16,945 93,601 2.24 2.40 2.41 1.06 1.04 1.03 0.047 0.008 0.003 0.000 0.000 -0.16 -0.17USEACAD 406 14,708 81,643 1.52 1.65 1.69 0.64 0.66 0.67 0.032 0.005 0.002 0.000 0.000 -0.20 -0.24
USECACOU 367 13,117 70,606 1.37 1.45 1.41 0.57 0.62 0.61 0.030 0.005 0.002 0.022 0.210 -0.12 -0.07USEJOBPL 272 9,325 50,351 1.15 1.21 1.21 0.44 0.49 0.49 0.027 0.005 0.002 0.086 0.074 -0.11 -0.11USETUTOR 322 11,401 62,098 1.30 1.44 1.42 0.58 0.66 0.65 0.033 0.006 0.003 0.000 0.001 -0.21 -0.19
USELAB 352 12,201 66,233 1.65 1.65 1.66 0.77 0.75 0.76 0.041 0.007 0.003 0.979 0.850 0.00 -0.01USECHLD 211 6,797 37,340 1.12 1.13 1.16 0.41 0.44 0.48 0.029 0.005 0.002 0.608 0.259 -0.04 -0.08
USEFAADV 290 11,441 65,213 1.39 1.67 1.73 0.65 0.77 0.78 0.038 0.007 0.003 0.000 0.000 -0.37 -0.45USECOMLB 364 13,518 74,392 1.68 1.95 1.97 0.77 0.80 0.80 0.041 0.007 0.003 0.000 0.000 -0.33 -0.36USESTORG 257 9,051 49,954 1.18 1.25 1.27 0.47 0.54 0.55 0.029 0.006 0.002 0.036 0.012 -0.13 -0.16USETRCRD 312 10,573 56,463 1.41 1.50 1.51 0.61 0.67 0.67 0.035 0.006 0.003 0.027 0.011 -0.13 -0.15USEDISAB 215 6,633 35,812 1.25 1.25 1.27 0.58 0.59 0.60 0.040 0.007 0.003 0.926 0.710 -0.01 -0.03SATACAD 301 12 340 69 590 2 05 2 15 2 20 0 67 0 64 0 65 0 038 0 006 0 002 0 011 0 000 -0 15 -0 22SATACAD 301 12,340 69,590 2.05 2.15 2.20 0.67 0.64 0.65 0.038 0.006 0.002 0.011 0.000 -0.15 -0.22
SATCACOU 239 9,210 49,329 1.97 2.04 2.03 0.70 0.70 0.71 0.045 0.007 0.003 0.098 0.167 -0.11 -0.09SATJOBPL 125 5,080 28,620 1.68 1.77 1.78 0.74 0.72 0.73 0.066 0.010 0.004 0.153 0.117 -0.13 -0.14SATTUTOR 179 7,290 39,938 1.97 2.12 2.11 0.71 0.72 0.73 0.053 0.008 0.004 0.006 0.007 -0.21 -0.20
SATLAB 227 8,563 46,879 2.21 2.23 2.23 0.72 0.68 0.68 0.048 0.007 0.003 0.748 0.687 -0.02 -0.03SATCHLD 86 3,048 17,712 1.62 1.72 1.72 0.78 0.77 0.78 0.085 0.014 0.006 0.239 0.235 -0.13 -0.13
SATFAADV 173 8,516 50,573 1.91 2.07 2.14 0.81 0.77 0.77 0.061 0.008 0.003 0.008 0.000 -0.20 -0.30SATCOMLB 267 11,013 61,650 2.30 2.46 2.46 0.68 0.64 0.64 0.042 0.006 0.003 0.000 0.000 -0.24 -0.24SATSTORG 117 4,979 28,434 1.74 1.89 1.89 0.66 0.71 0.71 0.061 0.010 0.004 0.022 0.017 -0.21 -0.22SATTRCRD 189 7,320 40,296 1.92 2.03 2.05 0.72 0.73 0.73 0.052 0.008 0.004 0.050 0.015 -0.14 -0.18SATDISAB 107 3,576 20,471 1.96 1.95 1.96 0.83 0.79 0.79 0.081 0.013 0.006 0.922 0.973 0.01 0.00IMPACAD 480 16,066 89,205 2.29 2.47 2.46 0.80 0.71 0.71 0.037 0.006 0.002 0.000 0.000 -0.25 -0.23
IMPCACOU 474 15,855 88,059 2.13 2.30 2.24 0.84 0.81 0.82 0.038 0.006 0.003 0.000 0.005 -0.21 -0.13IMPJOBPL 466 15,668 86,795 1.73 1.97 1.96 0.81 0.85 0.86 0.038 0.007 0.003 0.000 0.000 -0.28 -0.26IMPTUTOR 469 15,640 86,732 1.89 2.07 2.03 0.85 0.83 0.84 0.039 0.007 0.003 0.000 0.000 -0.21 -0.17
IMPLAB 462 15,566 86,424 2.03 2.16 2.13 0.86 0.82 0.83 0.040 0.007 0.003 0.000 0.006 -0.17 -0.13IMPCHLD 466 15,474 86,049 1.60 1.71 1.70 0.82 0.86 0.86 0.038 0.007 0.003 0.005 0.008 -0.13 -0.12
IMPFAADV 465 15,564 86,795 1.94 2.27 2.29 0.90 0.87 0.86 0.042 0.007 0.003 0.000 0.000 -0.38 -0.41
* T-tests: 2-tailed M25

Community College Survey of Student Engagement
# of respondents mean standard deviation std error of the mean significance effect size
Variable Names Your College
Other ExLarge Colleges
2007 CCSSE Cohort Your College
Other ExLarge Colleges
2007 CCSSE Cohort Your College
Other ExLarge Colleges
2007 CCSSE Cohort Your College
Other ExLarge Colleges
2007 CCSSE Cohort
Other ExLarge
Colleges*2007 CCSSE
Cohort*
Other ExLarge Colleges
2007 CCSSE Cohort
Palomar CollegeSummary Statistics: Part - Time Students
IMPCOMLB 464 15,733 87,182 2.05 2.36 2.34 0.88 0.79 0.80 0.041 0.006 0.003 0.000 0.000 -0.39 -0.36IMPSTORG 459 15,396 85,670 1.56 1.77 1.74 0.73 0.79 0.78 0.034 0.006 0.003 0.000 0.000 -0.26 -0.23IMPTRCRD 463 15,645 86,806 2.03 2.22 2.17 0.89 0.86 0.87 0.041 0.007 0.003 0.000 0.001 -0.22 -0.16IMPDISAB 468 15,549 86,410 1.83 1.99 1.98 0.91 0.92 0.93 0.042 0.007 0.003 0.000 0.000 -0.18 -0.16WRKFULL 514 16,956 93,552 2.25 2.29 2.21 1.18 1.19 1.18 0.052 0.009 0.004 0.488 0.435 -0.03 0.03CAREDEP 509 16,904 93,300 1.89 1.94 1.93 1.09 1.09 1.08 0.048 0.008 0.004 0.317 0.381 -0.04 -0.04ACADUNP 512 16,831 92,914 1.63 1.70 1.65 0.92 0.95 0.92 0.040 0.007 0.003 0.064 0.616 -0.08 -0.02LACKFIN 508 16,891 93,237 2.02 2.35 2.37 1.15 1.18 1.19 0.051 0.009 0.004 0.000 0.000 -0.27 -0.29
TRANSFER 506 16,889 93,234 2.34 2.50 2.36 1.27 1.24 1.24 0.057 0.010 0.004 0.003 0.680 -0.14 -0.02FRNDSUPP 514 16,963 93,592 3.12 3.20 3.23 0.92 0.89 0.89 0.040 0.007 0.003 0.038 0.005 -0.09 -0.12FAMSUPP 511 16,924 93,359 3.45 3.45 3.48 0.81 0.83 0.81 0.036 0.006 0.003 0.977 0.484 0.00 -0.03TOTCHRS 505 16,821 92,851 1.94 1.98 1.87 1.46 1.51 1.49 0.065 0.012 0.005 0.510 0.335 -0.03 0.04OTHINST 507 16 799 92 938 1 47 1 43 1 42 1 02 0 98 0 99 0 045 0 008 0 003 0 347 0 302 0 04 0 05OTHINST 507 16,799 92,938 1.47 1.43 1.42 1.02 0.98 0.99 0.045 0.008 0.003 0.347 0.302 0.04 0.05
ENTIREXP 507 16,801 92,959 3.23 3.13 3.16 0.69 0.67 0.67 0.031 0.005 0.002 0.001 0.019 0.15 0.10
* T-tests: 2-tailed M26

Community College Survey of Student Engagement
# of respondents mean standard deviation std error of the mean significance effect size
Variable Names Your College
Other ExLarge Colleges
2007 CCSSE Cohort Your College
Other ExLarge Colleges
2007 CCSSE Cohort Your College
Other ExLarge Colleges
2007 CCSSE Cohort Your College
Other ExLarge Colleges
2007 CCSSE Cohort
Other ExLarge
Colleges*2007 CCSSE
Cohort*
Other ExLarge Colleges
2007 CCSSE Cohort
CLQUEST 736 30,363 212,667 2.81 2.88 2.94 0.84 0.85 0.84 0.031 0.005 0.002 0.036 0.000 -0.08 -0.16CLPRESEN 733 30,244 211,895 2.10 2.27 2.24 0.86 0.90 0.89 0.032 0.005 0.002 0.000 0.000 -0.20 -0.16REWROPAP 735 30,139 211,183 2.48 2.65 2.64 1.01 0.99 0.99 0.037 0.006 0.002 0.000 0.000 -0.17 -0.17INTEGRAT 728 30,157 211,481 2.82 2.94 2.92 0.89 0.86 0.86 0.033 0.005 0.002 0.000 0.003 -0.13 -0.11CLUNPREP 733 30,075 210,808 2.03 2.01 1.98 0.72 0.74 0.74 0.027 0.004 0.002 0.345 0.062 0.04 0.07CLASSGRP 729 30,036 210,459 2.51 2.55 2.57 0.82 0.84 0.84 0.030 0.005 0.002 0.299 0.103 -0.04 -0.06OCCGRP 730 30,114 211,096 1.81 2.00 2.01 0.82 0.89 0.90 0.030 0.005 0.002 0.000 0.000 -0.22 -0.23TUTOR 733 30,199 211,687 1.40 1.47 1.46 0.74 0.77 0.76 0.027 0.004 0.002 0.027 0.054 -0.08 -0.07
COMMPROJ 729 30,107 210,855 1.23 1.38 1.38 0.55 0.72 0.71 0.020 0.004 0.002 0.000 0.000 -0.21 -0.21INTERNET 726 30,094 210,806 3.02 3.02 3.00 0.94 0.95 0.95 0.035 0.005 0.002 0.945 0.615 0.00 0.02
EMAIL 730 30,135 211,056 2.73 2.64 2.62 0.94 0.96 0.99 0.035 0.006 0.002 0.009 0.001 0.10 0.12FACGRADE 730 30,117 211,173 2.50 2.57 2.61 0.83 0.85 0.85 0.031 0.005 0.002 0.031 0.000 -0.08 -0.14FACPLANS 732 30 127 210 933 2 04 2 08 2 15 0 87 0 89 0 89 0 032 0 005 0 002 0 317 0 001 -0 04 -0 12
Palomar CollegeSummary Statistics: Full - Time Students
FACPLANS 732 30,127 210,933 2.04 2.08 2.15 0.87 0.89 0.89 0.032 0.005 0.002 0.317 0.001 0.04 0.12FACIDEAS 727 30,065 210,730 1.66 1.79 1.83 0.80 0.84 0.84 0.030 0.005 0.002 0.000 0.000 -0.15 -0.20FACFEED 730 30,090 210,883 2.64 2.64 2.67 0.85 0.84 0.83 0.031 0.005 0.002 0.977 0.233 0.00 -0.04
WORKHARD 732 30,146 211,158 2.44 2.58 2.60 0.85 0.87 0.86 0.031 0.005 0.002 0.000 0.000 -0.16 -0.19FACOTH 726 29,865 209,529 1.38 1.44 1.49 0.68 0.73 0.76 0.025 0.004 0.002 0.035 0.000 -0.08 -0.14
OOCIDEAS 733 30,214 211,734 2.65 2.60 2.61 0.89 0.93 0.92 0.033 0.005 0.002 0.119 0.184 0.06 0.05DIVRSTUD 735 30,203 211,664 2.65 2.55 2.48 1.02 1.04 1.04 0.038 0.006 0.002 0.009 0.000 0.10 0.17DIFFSTUD 732 30,168 211,475 2.57 2.49 2.48 1.01 1.02 1.01 0.037 0.006 0.002 0.059 0.021 0.07 0.09SKIPCLAS 734 30,268 211,892 1.76 1.72 1.69 0.66 0.69 0.68 0.024 0.004 0.001 0.086 0.005 0.06 0.10MEMORIZE 736 30,312 212,343 2.91 2.89 2.88 0.85 0.86 0.86 0.031 0.005 0.002 0.521 0.401 0.02 0.03ANALYZE 732 30,236 211,791 2.98 2.94 2.90 0.81 0.81 0.81 0.030 0.005 0.002 0.147 0.005 0.05 0.11
SYNTHESZ 733 30,092 210,909 2.74 2.79 2.77 0.85 0.86 0.85 0.031 0.005 0.002 0.118 0.374 -0.06 -0.03EVALUATE 734 30,116 211,249 2.66 2.68 2.65 0.91 0.89 0.89 0.034 0.005 0.002 0.634 0.676 -0.02 0.02APPLYING 735 30,160 211,583 2.68 2.72 2.72 0.89 0.89 0.89 0.033 0.005 0.002 0.317 0.235 -0.04 -0.04PERFORM 736 30,295 212,214 2.68 2.78 2.81 0.91 0.91 0.90 0.033 0.005 0.002 0.001 0.000 -0.12 -0.15
READASGN 723 29,959 210,241 3.07 3.12 3.12 0.98 1.01 1.02 0.036 0.006 0.002 0.149 0.162 -0.05 -0.05READOWN 722 29,994 210,455 2.12 2.11 2.06 0.96 0.99 1.00 0.036 0.006 0.002 0.816 0.142 0.01 0.05WRITEANY 722 29,945 210,204 2.98 3.19 3.16 1.07 1.06 1.07 0.040 0.006 0.002 0.000 0.000 -0.20 -0.17
* T-tests: 2-tailed M27

Community College Survey of Student Engagement
# of respondents mean standard deviation std error of the mean significance effect size
Variable Names Your College
Other ExLarge Colleges
2007 CCSSE Cohort Your College
Other ExLarge Colleges
2007 CCSSE Cohort Your College
Other ExLarge Colleges
2007 CCSSE Cohort Your College
Other ExLarge Colleges
2007 CCSSE Cohort
Other ExLarge
Colleges*2007 CCSSE
Cohort*
Other ExLarge Colleges
2007 CCSSE Cohort
Palomar CollegeSummary Statistics: Full - Time Students
EXAMS 703 28,738 202,437 4.88 4.96 5.03 1.14 1.14 1.15 0.043 0.007 0.003 0.052 0.000 -0.07 -0.13ENVSCHOL 721 29,991 210,541 3.04 3.01 3.02 0.80 0.83 0.83 0.030 0.005 0.002 0.313 0.414 0.04 0.03ENVSUPRT 720 29,956 210,309 2.92 2.95 2.98 0.85 0.86 0.85 0.032 0.005 0.002 0.455 0.077 -0.03 -0.07ENVDIVRS 720 29,910 209,949 2.53 2.57 2.52 0.98 1.01 1.00 0.037 0.006 0.002 0.242 0.913 -0.04 0.00ENVNACAD 717 29,911 210,026 1.85 1.94 1.96 0.91 0.96 0.96 0.034 0.006 0.002 0.020 0.002 -0.09 -0.11ENVSOCAL 716 29,763 209,135 2.05 2.15 2.17 0.89 0.94 0.93 0.033 0.005 0.002 0.006 0.000 -0.10 -0.13FINSUPP 715 29,811 209,524 2.36 2.45 2.54 1.05 1.11 1.10 0.039 0.006 0.002 0.021 0.000 -0.09 -0.17
ENVCOMP 719 29,961 210,314 3.08 3.23 3.25 0.91 0.86 0.85 0.034 0.005 0.002 0.000 0.000 -0.17 -0.20ACADPR01 717 29,885 209,823 2.08 2.09 2.09 1.08 1.13 1.15 0.040 0.007 0.003 0.886 0.843 -0.01 -0.01PAYWORK 720 29,783 209,284 2.77 2.88 2.76 1.86 1.89 1.92 0.069 0.011 0.004 0.097 0.906 -0.06 0.00COCURR01 718 29,843 209,572 0.32 0.34 0.39 0.90 0.80 0.87 0.033 0.005 0.002 0.649 0.047 -0.02 -0.07CAREDE01 716 29,746 209,120 1.02 1.33 1.51 1.56 1.75 1.91 0.058 0.010 0.004 0.000 0.000 -0.18 -0.25COMMUTE 720 29 763 209 327 1 40 1 40 1 43 0 86 0 93 0 96 0 032 0 005 0 002 0 907 0 384 0 00 -0 03COMMUTE 720 29,763 209,327 1.40 1.40 1.43 0.86 0.93 0.96 0.032 0.005 0.002 0.907 0.384 0.00 -0.03
ENVSTU 721 29,861 210,034 5.22 5.35 5.51 1.33 1.36 1.33 0.050 0.008 0.003 0.008 0.000 -0.10 -0.22ENVFAC 718 29,891 210,121 5.47 5.47 5.57 1.25 1.26 1.25 0.047 0.007 0.003 0.900 0.040 0.00 -0.08ENVADM 720 29,863 209,966 4.76 4.70 4.91 1.50 1.59 1.58 0.056 0.009 0.003 0.340 0.010 0.04 -0.10
GNGENLED 721 29,865 209,925 3.07 3.06 3.04 0.82 0.81 0.81 0.031 0.005 0.002 0.799 0.353 0.01 0.03GNWORK 716 29,802 209,585 2.20 2.48 2.62 0.97 1.01 1.01 0.036 0.006 0.002 0.000 0.000 -0.28 -0.42GNWRITE 717 29,836 209,706 2.70 2.82 2.80 0.86 0.89 0.89 0.032 0.005 0.002 0.000 0.001 -0.14 -0.12GNSPEAK 720 29,825 209,655 2.61 2.72 2.70 0.92 0.93 0.93 0.034 0.005 0.002 0.001 0.006 -0.12 -0.10GNANALY 719 29,812 209,503 2.88 2.94 2.95 0.84 0.85 0.84 0.031 0.005 0.002 0.111 0.054 -0.06 -0.07GNSOLVE 719 29,803 209,491 2.61 2.69 2.70 0.94 0.95 0.94 0.035 0.006 0.002 0.016 0.011 -0.09 -0.10GNCMPTS 718 29,811 209,470 2.53 2.78 2.83 1.01 0.98 0.96 0.038 0.006 0.002 0.000 0.000 -0.26 -0.31
GNOTHERS 720 29,804 209,564 2.59 2.74 2.79 0.93 0.91 0.89 0.035 0.005 0.002 0.000 0.000 -0.17 -0.23GNINQ 717 29,811 209,551 2.81 2.92 2.94 0.89 0.89 0.87 0.033 0.005 0.002 0.002 0.000 -0.12 -0.14
GNSELF 721 29,790 209,363 2.46 2.65 2.65 1.02 1.01 1.00 0.038 0.006 0.002 0.000 0.000 -0.19 -0.19GNDIVERS 720 29,776 209,264 2.40 2.51 2.44 0.99 1.01 1.00 0.037 0.006 0.002 0.003 0.267 -0.11 -0.04GNETHICS 720 29,749 209,275 2.26 2.42 2.43 1.00 1.01 1.00 0.037 0.006 0.002 0.000 0.000 -0.16 -0.17
GNCOMMUN 720 29,693 208,894 1.81 2.02 2.05 0.88 0.97 0.97 0.033 0.006 0.002 0.000 0.000 -0.21 -0.24CARGOAL 718 29,793 209,503 2.56 2.69 2.74 1.01 1.00 0.98 0.038 0.006 0.002 0.000 0.000 -0.14 -0.19
* T-tests: 2-tailed M28

Community College Survey of Student Engagement
# of respondents mean standard deviation std error of the mean significance effect size
Variable Names Your College
Other ExLarge Colleges
2007 CCSSE Cohort Your College
Other ExLarge Colleges
2007 CCSSE Cohort Your College
Other ExLarge Colleges
2007 CCSSE Cohort Your College
Other ExLarge Colleges
2007 CCSSE Cohort
Other ExLarge
Colleges*2007 CCSSE
Cohort*
Other ExLarge Colleges
2007 CCSSE Cohort
Palomar CollegeSummary Statistics: Full - Time Students
GAINCAR 720 29,845 209,797 2.40 2.58 2.64 1.02 1.02 1.01 0.038 0.006 0.002 0.000 0.000 -0.18 -0.24USEACAD 655 27,428 194,217 1.77 1.77 1.81 0.69 0.69 0.69 0.027 0.004 0.002 0.952 0.137 0.00 -0.06
USECACOU 611 24,248 168,724 1.48 1.50 1.46 0.67 0.66 0.64 0.027 0.004 0.002 0.512 0.402 -0.03 0.03USEJOBPL 432 17,443 124,968 1.17 1.25 1.29 0.47 0.53 0.56 0.022 0.004 0.002 0.001 0.000 -0.16 -0.21USETUTOR 523 21,767 153,412 1.41 1.54 1.50 0.65 0.70 0.69 0.029 0.005 0.002 0.000 0.005 -0.18 -0.12
USELAB 574 23,176 163,309 1.74 1.76 1.77 0.80 0.78 0.78 0.033 0.005 0.002 0.541 0.400 -0.03 -0.04USECHLD 322 11,977 86,506 1.09 1.17 1.20 0.38 0.49 0.54 0.021 0.004 0.002 0.003 0.000 -0.17 -0.22
USEFAADV 491 22,341 165,303 1.57 1.83 1.89 0.75 0.79 0.78 0.034 0.005 0.002 0.000 0.000 -0.33 -0.41USECOMLB 601 26,303 187,214 2.00 2.21 2.24 0.83 0.78 0.77 0.034 0.005 0.002 0.000 0.000 -0.27 -0.32USESTORG 449 18,318 133,539 1.31 1.38 1.43 0.61 0.64 0.67 0.029 0.005 0.002 0.014 0.000 -0.12 -0.17USETRCRD 549 20,396 137,820 1.62 1.62 1.60 0.71 0.71 0.71 0.030 0.005 0.002 0.938 0.640 0.00 0.02USEDISAB 316 11,978 85,533 1.29 1.30 1.33 0.64 0.63 0.65 0.036 0.006 0.002 0.751 0.289 -0.02 -0.06SATACAD 570 24 464 176 011 2 13 2 15 2 22 0 63 0 64 0 64 0 027 0 004 0 002 0 663 0 001 -0 02 -0 14SATACAD 570 24,464 176,011 2.13 2.15 2.22 0.63 0.64 0.64 0.027 0.004 0.002 0.663 0.001 -0.02 -0.14
SATCACOU 437 18,061 126,571 2.05 2.05 2.06 0.71 0.70 0.70 0.034 0.005 0.002 0.977 0.857 0.00 -0.01SATJOBPL 206 10,584 81,486 1.72 1.82 1.86 0.68 0.72 0.73 0.047 0.007 0.003 0.055 0.005 -0.14 -0.19SATTUTOR 306 15,515 108,298 2.16 2.17 2.17 0.68 0.70 0.71 0.039 0.006 0.002 0.883 0.796 -0.01 -0.01
SATLAB 401 17,746 126,350 2.30 2.27 2.28 0.65 0.66 0.66 0.033 0.005 0.002 0.294 0.421 0.05 0.04SATCHLD 124 5,994 46,218 1.73 1.78 1.80 0.74 0.76 0.78 0.066 0.010 0.004 0.447 0.295 -0.07 -0.09
SATFAADV 343 18,311 141,353 2.06 2.14 2.22 0.75 0.76 0.74 0.041 0.006 0.002 0.037 0.000 -0.11 -0.22SATCOMLB 499 23,603 170,773 2.45 2.53 2.53 0.62 0.60 0.60 0.028 0.004 0.001 0.004 0.003 -0.13 -0.13SATSTORG 249 11,918 91,317 1.92 1.97 2.02 0.67 0.69 0.70 0.042 0.006 0.002 0.232 0.022 -0.08 -0.15SATTRCRD 419 15,587 106,864 2.06 2.07 2.08 0.66 0.71 0.72 0.032 0.006 0.002 0.771 0.685 -0.01 -0.02SATDISAB 153 7,270 54,913 2.07 2.02 2.05 0.79 0.79 0.78 0.064 0.009 0.003 0.408 0.720 0.07 0.03IMPACAD 689 28,571 201,779 2.61 2.57 2.57 0.64 0.64 0.63 0.024 0.004 0.001 0.066 0.056 0.07 0.07
IMPCACOU 687 28,227 199,566 2.42 2.38 2.34 0.74 0.76 0.76 0.028 0.005 0.002 0.163 0.006 0.05 0.11IMPJOBPL 672 27,853 197,070 1.94 2.04 2.08 0.82 0.83 0.83 0.032 0.005 0.002 0.002 0.000 -0.12 -0.16IMPTUTOR 675 27,858 197,163 2.10 2.18 2.15 0.83 0.80 0.80 0.032 0.005 0.002 0.010 0.081 -0.10 -0.07
IMPLAB 672 27,770 196,426 2.26 2.27 2.25 0.80 0.78 0.78 0.031 0.005 0.002 0.724 0.680 -0.01 0.02IMPCHLD 668 27,549 194,968 1.71 1.74 1.76 0.86 0.86 0.87 0.033 0.005 0.002 0.387 0.145 -0.03 -0.06
IMPFAADV 668 27,816 196,992 2.30 2.43 2.48 0.84 0.80 0.77 0.032 0.005 0.002 0.000 0.000 -0.16 -0.24
* T-tests: 2-tailed M29

Community College Survey of Student Engagement
# of respondents mean standard deviation std error of the mean significance effect size
Variable Names Your College
Other ExLarge Colleges
2007 CCSSE Cohort Your College
Other ExLarge Colleges
2007 CCSSE Cohort Your College
Other ExLarge Colleges
2007 CCSSE Cohort Your College
Other ExLarge Colleges
2007 CCSSE Cohort
Other ExLarge
Colleges*2007 CCSSE
Cohort*
Other ExLarge Colleges
2007 CCSSE Cohort
Palomar CollegeSummary Statistics: Full - Time Students
IMPCOMLB 678 27,979 198,009 2.37 2.53 2.56 0.75 0.68 0.67 0.029 0.004 0.001 0.000 0.000 -0.24 -0.28IMPSTORG 654 27,438 194,588 1.86 1.91 1.91 0.80 0.79 0.78 0.031 0.005 0.002 0.130 0.089 -0.06 -0.07IMPTRCRD 673 27,847 196,831 2.48 2.37 2.31 0.74 0.80 0.83 0.029 0.005 0.002 0.000 0.000 0.14 0.21IMPDISAB 665 27,693 196,016 2.03 2.07 2.09 0.90 0.91 0.91 0.035 0.005 0.002 0.201 0.085 -0.05 -0.07WRKFULL 719 29,741 209,092 2.18 2.14 2.11 1.14 1.16 1.15 0.042 0.007 0.003 0.455 0.135 0.03 0.06CAREDEP 719 29,674 208,721 1.81 1.89 1.90 1.01 1.06 1.06 0.037 0.006 0.002 0.043 0.032 -0.08 -0.08ACADUNP 717 29,575 208,021 1.68 1.77 1.70 0.91 0.97 0.94 0.034 0.006 0.002 0.009 0.503 -0.10 -0.03LACKFIN 715 29,607 208,431 2.26 2.34 2.39 1.16 1.18 1.19 0.043 0.007 0.003 0.087 0.004 -0.06 -0.11
TRANSFER 716 29,677 208,801 3.09 2.83 2.63 1.15 1.21 1.24 0.043 0.007 0.003 0.000 0.000 0.22 0.37FRNDSUPP 718 29,738 209,186 3.15 3.17 3.23 0.90 0.90 0.88 0.033 0.005 0.002 0.430 0.012 -0.03 -0.09FAMSUPP 715 29,633 208,562 3.47 3.48 3.53 0.82 0.82 0.78 0.031 0.005 0.002 0.678 0.033 -0.02 -0.08TOTCHRS 700 29,492 207,492 2.32 2.23 2.20 1.48 1.44 1.44 0.056 0.008 0.003 0.115 0.028 0.06 0.08OTHINST 706 29 464 207 510 1 38 1 45 1 42 1 08 1 17 1 14 0 041 0 007 0 003 0 149 0 450 -0 05 -0 03OTHINST 706 29,464 207,510 1.38 1.45 1.42 1.08 1.17 1.14 0.041 0.007 0.003 0.149 0.450 -0.05 -0.03
ENTIREXP 707 29,462 207,506 3.12 3.11 3.14 0.65 0.67 0.68 0.024 0.004 0.001 0.836 0.448 0.01 -0.03
* T-tests: 2-tailed M30

Frequency Distributions This report summarizes the observed frequencies of occurrence (counts and percentages) of the values for each item on The Community College Student Report. Data are presented for all, part-time, and full-time students at your college, a comparison group, and the 2007 CCSSE Cohort (i.e. all students who participated in CCSSE from 2005 through 2007). Please note, certain demographic items (gender, race/ethnicity, age, and enrollment status) do not appear on this report but can be found in Table 1.

2007 Frequency Distributions
Count Col % Count Col % Count Col % Count Col % Count Col % Count Col % Count Col % Count Col % Count Col %1. Did you begin college at this Started here 301 56.8 10823 62.4 60034 62.8 564 76.5 22693 74.7 159577 75.1 799 63.1 31790 66.6 210186 68.2
college or elsewhere? Started elsewhere 229 43.2 6535 37.6 35517 37.2 173 23.5 7673 25.3 53039 24.9 468 36.9 15908 33.4 97875 31.8Total 530 100.0 17358 100.0 95551 100.0 737 100.0 30366 100.0 212616 100.0 1266 100.0 47697 100.0 308060 100.0
4a. Asked questions in class or Never 26 4.9 622 3.6 2772 2.9 21 2.9 842 2.8 4629 2.2 54 4.3 1569 3.3 8016 2.6contributed to class Sometimes 210 39.6 6391 36.8 32714 34.2 281 38.2 10447 34.4 67269 31.6 496 39.2 17139 35.9 102265 33.2discussions Often 176 33.2 5888 33.9 33189 34.7 250 34.0 10670 35.1 76210 35.8 423 33.4 16387 34.3 108553 35.2
Very often 118 22.3 4475 25.8 26986 28.2 184 25.0 8404 27.7 64559 30.4 293 23.1 12634 26.5 89461 29.0Total 530 100.0 17376 100.0 95661 100.0 736 100.0 30363 100.0 212667 100.0 1266 100.0 47729 100.0 308295 100.0
4b. Made a class presentation Never 254 48.1 6543 37.8 37790 39.7 185 25.2 5989 19.8 43917 20.7 515 40.8 14955 31.5 98104 32.0Sometimes 173 32.8 6591 38.1 35412 37.2 345 47.1 13214 43.7 94342 44.5 470 37.3 19027 40.0 123506 40.2
Often 79 15.0 2930 16.9 15708 16.5 150 20.5 7848 25.9 52701 24.9 211 16.7 9566 20.1 61152 19.9Very often 22 4.2 1235 7.1 6282 6.6 53 7.2 3193 10.6 20935 9.9 65 5.1 3977 8.4 24194 7.9
Total 528 100.0 17299 100.0 95192 100.0 733 100.0 30244 100.0 211895 100.0 1261 100.0 47525 100.0 306957 100.04c. Prepared two or more drafts of Never 195 36.9 4381 25.4 24644 26.0 148 20.1 4295 14.3 30800 14.6 399 31.6 10237 21.6 65423 21.4
a paper or assignment before Sometimes 151 28.6 5168 30.0 27764 29.3 222 30.2 9036 30.0 62981 29.8 367 29.1 14199 30.0 90452 29.6turning it in Often 125 23.7 4770 27.7 26268 27.7 231 31.4 9733 32.3 68268 32.3 330 26.1 13833 29.2 90373 29.5
Very often 57 10.8 2903 16.9 16186 17.1 134 18.2 7075 23.5 49134 23.3 166 13.2 9062 19.1 59683 19.5Total 528 100.0 17222 100.0 94862 100.0 735 100.0 30139 100.0 211183 100.0 1262 100.0 47331 100.0 305931 100.0
4d. Worked on a paper or project Never 135 25.6 2751 16.0 15672 16.5 48 6.6 1520 5.0 10863 5.1 246 19.6 5778 12.2 36327 11.9that required integrating ideas Sometimes 165 31.3 5275 30.6 29467 31.0 219 30.1 7577 25.1 54842 25.9 389 30.9 13593 28.7 88993 29.1
Your CollegeOther ExLarge
Colleges2007 CCSSE
Cohort
Part-Time Full-Time All Students (weighted data *)Palomar College
Your CollegeOther ExLarge
Colleges2007 CCSSE
Cohort Your CollegeOther ExLarge
Colleges2007 CCSSE
Cohort
or information from various Often 158 30.0 5920 34.4 32132 33.8 274 37.6 12356 41.0 86304 40.8 407 32.4 17366 36.7 112438 36.7sources Very often 69 13.1 3271 19.0 17658 18.6 187 25.7 8704 28.9 59472 28.1 215 17.1 10598 22.4 68478 22.4
Total 527 100.0 17217 100.0 94929 100.0 728 100.0 30157 100.0 211481 100.0 1257 100.0 47336 100.0 306236 100.04e. Came to class without Never 197 37.7 5283 30.7 32537 34.3 142 19.4 6754 22.5 49817 23.6 399 31.8 13146 27.8 91515 30.0
completing readings or Sometimes 250 47.8 9436 54.8 50185 53.0 461 62.9 17862 59.4 125025 59.3 659 52.6 26661 56.4 169670 55.5assignments Often 58 11.1 1811 10.5 8851 9.3 94 12.8 3970 13.2 25989 12.3 146 11.6 5434 11.5 32350 10.6
Very often 18 3.4 679 3.9 3172 3.3 36 4.9 1489 5.0 9977 4.7 49 3.9 2032 4.3 11933 3.9Total 523 100.0 17209 100.0 94745 100.0 733 100.0 30075 100.0 210808 100.0 1253 100.0 47273 100.0 305468 100.0
4f. Worked with other students on Never 98 18.7 2998 17.4 16341 17.3 61 8.4 2744 9.1 17842 8.5 193 15.4 6835 14.5 41471 13.6projects during class Sometimes 186 35.4 6920 40.3 38100 40.3 322 44.2 12301 41.0 86262 41.0 479 38.2 19141 40.5 123807 40.6
Often 163 31.0 5078 29.5 28194 29.8 256 35.1 10804 36.0 75922 36.1 405 32.3 15043 31.9 98953 32.5Very often 78 14.9 2189 12.7 11949 12.6 90 12.3 4187 13.9 30433 14.5 176 14.1 6192 13.1 40709 13.3
Total 525 100.0 17185 100.0 94584 100.0 729 100.0 30036 100.0 210459 100.0 1254 100.0 47212 100.0 304939 100.04g. Worked with classmates Never 282 53.5 8163 47.3 46691 49.2 298 40.8 9778 32.5 67966 32.2 622 49.5 19981 42.2 128849 42.1
outside of class to prepare Sometimes 171 32.4 6082 35.2 32149 33.9 305 41.8 12642 42.0 87782 41.6 445 35.4 17801 37.6 113446 37.1class assignments Often 55 10.4 2207 12.8 11682 12.3 95 13.0 5568 18.5 39897 18.9 142 11.3 6990 14.7 46081 15.1
Very often 19 3.6 817 4.7 4426 4.7 32 4.4 2126 7.1 15451 7.3 48 3.9 2632 5.6 17640 5.8Total 527 100.0 17269 100.0 94948 100.0 730 100.0 30114 100.0 211096 100.0 1258 100.0 47404 100.0 306016 100.0
4h. Tutored or taught other Never 410 78.2 13233 76.5 73898 77.6 526 71.8 20260 67.1 142630 67.4 956 76.2 34806 73.3 225133 73.4students (paid or voluntary) Sometimes 91 17.4 2982 17.2 15817 16.6 142 19.4 6858 22.7 48484 22.9 226 18.0 9085 19.1 59078 19.3
Often 14 2.7 726 4.2 3697 3.9 42 5.7 2032 6.7 13584 6.4 46 3.6 2407 5.1 15109 4.9Very often 9 1.7 353 2.0 1792 1.9 23 3.1 1049 3.5 6989 3.3 27 2.2 1198 2.5 7551 2.5
Total 524 100.0 17294 100.0 95204 100.0 733 100.0 30199 100.0 211687 100.0 1254 100.0 47496 100.0 306871 100.04i. Participated in a community- Never 440 83.3 14216 82.5 78923 83.3 599 82.2 22072 73.3 153924 73.0 1044 83.0 37561 79.4 241342 79.0
based project as a part of a Sometimes 63 11.9 2156 12.5 11327 12.0 101 13.9 5437 18.1 39299 18.6 158 12.5 6825 14.4 45168 14.8regular course Often 18 3.4 617 3.6 3185 3.4 21 2.9 1775 5.9 12101 5.7 41 3.2 2066 4.4 13240 4.3
Very often 7 1.3 241 1.4 1299 1.4 8 1.1 823 2.7 5531 2.6 16 1.3 877 1.9 5754 1.9Total 528 100.0 17230 100.0 94734 100.0 729 100.0 30107 100.0 210855 100.0 1259 100.0 47330 100.0 305505 100.0
* Data was weighted according to the full-time/part-time population data from IPEDS.
*Regarding Blank Cells: Please see Table 1 for unweighted sample and population values. F1

2007 Frequency Distributions
Count Col % Count Col % Count Col % Count Col % Count Col % Count Col % Count Col % Count Col % Count Col %Your College
Other ExLarge Colleges
2007 CCSSE Cohort
Part-Time Full-Time All Students (weighted data *)
Your CollegeOther ExLarge
Colleges2007 CCSSE
Cohort Your CollegeOther ExLarge
Colleges2007 CCSSE
Cohort
4j. Used the Internet or instant Never 125 23.8 2814 16.4 16225 17.1 50 6.9 2190 7.3 16048 7.6 231 18.4 6261 13.2 40302 13.2messaging to work on an Sometimes 178 33.8 4668 27.1 26110 27.6 164 22.6 6730 22.4 47879 22.7 380 30.3 12049 25.5 78188 25.6assignment Often 125 23.8 4960 28.8 27059 28.6 237 32.6 9534 31.7 67471 32.0 333 26.6 14082 29.8 91681 30.0
Very often 98 18.6 4760 27.7 25348 26.8 275 37.9 11640 38.7 79408 37.7 310 24.7 14884 31.5 95308 31.2Total 526 100.0 17202 100.0 94742 100.0 726 100.0 30094 100.0 210806 100.0 1254 100.0 47275 100.0 305479 100.0
4k. Used email to communicate Never 136 25.9 3912 22.7 23991 25.3 69 9.5 3603 12.0 29429 13.9 259 20.7 8983 19.0 63528 20.8with an instructor Sometimes 231 43.9 6641 38.6 34838 36.8 237 32.5 10473 34.8 70913 33.6 506 40.3 17583 37.2 108203 35.4
Often 96 18.3 4070 23.6 21692 22.9 243 33.3 9219 30.6 61710 29.2 289 23.0 12356 26.1 77880 25.5Very often 63 12.0 2594 15.1 14253 15.0 181 24.8 6840 22.7 49004 23.2 202 16.0 8402 17.8 56065 18.3
Total 526 100.0 17217 100.0 94774 100.0 730 100.0 30135 100.0 211056 100.0 1256 100.0 47323 100.0 305676 100.04l. Discussed grades or Never 113 21.4 2330 13.5 11591 12.2 64 8.8 2468 8.2 14437 6.8 219 17.4 5525 11.7 30428 9.9
assignments with an instructor Sometimes 258 49.0 8118 47.1 44538 47.0 333 45.6 12952 43.0 89039 42.2 602 47.9 21623 45.7 137675 45.0Often 125 23.7 4804 27.9 27277 28.8 239 32.7 9872 32.8 71318 33.8 334 26.6 13992 29.6 94382 30.9
Very often 31 5.9 1976 11.5 11415 12.0 94 12.9 4825 16.0 36379 17.2 102 8.1 6193 13.1 43334 14.2Total 527 100.0 17228 100.0 94821 100.0 730 100.0 30117 100.0 211173 100.0 1258 100.0 47333 100.0 305819 100.0
4m. Talked about career plans with Never 254 48.7 6820 39.6 35248 37.2 209 28.6 8362 27.8 51083 24.2 528 42.2 16829 35.5 96654 31.6an instructor or advisor Sometimes 192 36.8 7237 42.0 40952 43.2 337 46.0 13523 44.9 95863 45.4 497 39.7 20339 43.0 135179 44.3
Often 63 12.1 2388 13.9 13645 14.4 132 18.0 5849 19.4 44452 21.1 175 14.0 7468 15.8 52702 17.3Very often 13 2.5 794 4.6 4867 5.1 54 7.4 2393 7.9 19535 9.3 51 4.1 2718 5.7 20953 6.9
Total 522 100.0 17239 100.0 94712 100.0 732 100.0 30127 100.0 210933 100.0 1251 100.0 47354 100.0 305488 100.04n. Discussed ideas from your Never 286 54.5 9248 53.9 49642 52.5 372 51.2 12953 43.1 85091 40.4 669 53.4 23653 50.1 144561 47.4
readings or classes with Sometimes 181 34.5 5738 33.4 32666 34.6 255 35.1 11807 39.3 86490 41.0 434 34.7 16741 35.5 113875 37.3instructors outside of class Often 43 8.2 1590 9.3 9083 9.6 74 10.2 3942 13.1 28681 13.6 110 8.8 5005 10.6 34447 11.3
Very often 15 2.9 578 3.4 3133 3.3 26 3.6 1363 4.5 10468 5.0 39 3.1 1776 3.8 12145 4.0Total 525 100.0 17154 100.0 94524 100.0 727 100.0 30065 100.0 210730 100.0 1253 100.0 47175 100.0 305028 100.0
4o. Received prompt feedback Never 63 12.0 1790 10.4 8764 9.3 62 8.5 2267 7.5 13793 6.5 137 10.9 4449 9.4 24834 8.1(written or oral) from Sometimes 191 36.5 6220 36.2 33391 35.3 258 35.3 11294 37.5 77271 36.6 452 36.1 17329 36.7 109601 35.9instructors on your Often 195 37.3 6358 37.0 36050 38.1 293 40.1 11651 38.7 83759 39.7 478 38.2 17756 37.6 118390 38.8performance Very often 74 14.1 2829 16.5 16438 17.4 117 16.0 4878 16.2 36060 17.1 185 14.7 7726 16.3 52517 17.2
Total 523 100.0 17197 100.0 94643 100.0 730 100.0 30090 100.0 210883 100.0 1251 100.0 47261 100.0 305342 100.04p. Worked harder than you Never 113 21.5 2394 13.9 12338 13.0 95 13.0 2902 9.6 18320 8.7 236 18.8 5878 12.4 34298 11.2
thought you could to meet an Sometimes 232 44.2 7165 41.6 38931 41.1 297 40.6 11737 38.9 82343 39.0 540 43.0 19266 40.7 123241 40.3instructors standards or Often 143 27.2 5497 31.9 30816 32.5 262 35.8 10741 35.6 75775 35.9 376 30.0 15702 33.2 103584 33.9expectations Very often 37 7.0 2150 12.5 12704 13.4 78 10.7 4766 15.8 34720 16.4 103 8.2 6461 13.7 44627 14.6
Total 525 100.0 17206 100.0 94789 100.0 732 100.0 30146 100.0 211158 100.0 1255 100.0 47308 100.0 305750 100.04q. Worked with instructors on Never 406 77.6 13092 76.8 71841 76.4 519 71.5 20297 68.0 136119 65.0 945 75.7 34546 73.7 216919 71.5
activities other than Sometimes 87 16.6 2760 16.2 15781 16.8 145 20.0 6699 22.4 50559 24.1 221 17.7 8600 18.4 60534 20.0coursework Often 25 4.8 884 5.2 4665 5.0 53 7.3 2141 7.2 16767 8.0 70 5.6 2757 5.9 18972 6.3
Very often 5 1.0 301 1.8 1689 1.8 9 1.2 728 2.4 6084 2.9 13 1.0 943 2.0 6860 2.3Total 523 100.0 17037 100.0 93976 100.0 726 100.0 29865 100.0 209529 100.0 1249 100.0 46846 100.0 303285 100.0
4r. Discussed ideas from your Never 86 16.3 2471 14.3 13306 14.0 66 9.0 3314 11.0 22125 10.4 176 14.0 6256 13.2 38395 12.5readings or classes with others Sometimes 196 37.3 6675 38.6 36587 38.5 259 35.3 11417 37.8 80048 37.8 461 36.6 18201 38.3 117484 38.3outside of class (students, Often 149 28.3 5128 29.7 28608 30.1 270 36.8 9494 31.4 67879 32.1 390 31.0 14362 30.2 94772 30.9family members, coworkers, etc.) Very often 95 18.1 3004 17.4 16594 17.4 138 18.8 5989 19.8 41682 19.7 230 18.3 8659 18.2 56033 18.3
Total 526 100.0 17278 100.0 95095 100.0 733 100.0 30214 100.0 211734 100.0 1258 100.0 47477 100.0 306683 100.04s. Had serious conversations Never 141 26.8 4097 23.8 25261 26.6 114 15.5 5537 18.3 42417 20.0 292 23.2 10422 22.0 74103 24.2
with students of a different race Sometimes 176 33.5 5739 33.3 32703 34.4 213 29.0 9535 31.6 70840 33.5 403 32.0 15508 32.7 104624 34.1or ethnicity other than your own Often 111 21.1 4267 24.8 21638 22.8 222 30.2 8072 26.7 53454 25.3 302 24.0 12027 25.4 72403 23.6
Very often 98 18.6 3133 18.2 15385 16.2 186 25.3 7059 23.4 44953 21.2 261 20.8 9435 19.9 55320 18.1Total 526 100.0 17236 100.0 94987 100.0 735 100.0 30203 100.0 211664 100.0 1259 100.0 47392 100.0 306450 100.0
4t. Had serious conversations Never 164 31.2 4747 27.6 26200 27.6 121 16.5 5698 18.9 38571 18.2 333 26.6 11638 24.6 72709 23.7with students who differ from you Sometimes 188 35.8 6011 34.9 34954 36.8 239 32.7 10240 33.9 75099 35.5 437 34.8 16386 34.6 111607 36.5in terms of their religious beliefs, Often 93 17.7 3894 22.6 20488 21.6 209 28.6 7882 26.1 55656 26.3 266 21.2 11270 23.8 71963 23.5political opinions, or personal values Very often 80 15.2 2567 14.9 13248 14.0 163 22.3 6348 21.0 42149 19.9 219 17.5 8055 17.0 49880 16.3
Total 525 100.0 17219 100.0 94890 100.0 732 100.0 30168 100.0 211475 100.0 1255 100.0 47348 100.0 306158 100.04u. Skipped class Never 284 54.0 9001 52.1 53327 56.0 250 34.1 11855 39.2 87506 41.3 599 47.6 22574 47.5 152819 49.8
Sometimes 216 41.1 7313 42.3 37203 39.1 426 58.0 15830 52.3 107356 50.7 585 46.5 21771 45.8 134988 44.0Often 15 2.9 679 3.9 3206 3.4 40 5.4 1821 6.0 12005 5.7 46 3.7 2224 4.7 13321 4.3
Very often 11 2.1 299 1.7 1419 1.5 18 2.5 762 2.5 5025 2.4 28 2.2 957 2.0 5758 1.9Total 526 100.0 17292 100.0 95155 100.0 734 100.0 30268 100.0 211892 100.0 1258 100.0 47525 100.0 306886 100.0
* Data was weighted according to the full-time/part-time population data from IPEDS.
*Regarding Blank Cells: Please see Table 1 for unweighted sample and population values. F2

2007 Frequency Distributions
Count Col % Count Col % Count Col % Count Col % Count Col % Count Col % Count Col % Count Col % Count Col %Your College
Other ExLarge Colleges
2007 CCSSE Cohort
Part-Time Full-Time All Students (weighted data *)
Your CollegeOther ExLarge
Colleges2007 CCSSE
Cohort Your CollegeOther ExLarge
Colleges2007 CCSSE
Cohort
5a. Memorizing facts, ideas, or Very little 66 12.5 1514 8.7 8198 8.6 35 4.8 1663 5.5 11397 5.4 127 10.0 3610 7.6 22220 7.2methods from your courses Some 160 30.4 5146 29.7 28536 29.9 193 26.2 8081 26.7 58361 27.5 366 29.0 13632 28.6 89094 29.0and readings so you can repeat Quite a bit 195 37.0 6482 37.4 35849 37.6 310 42.1 12463 41.1 85857 40.4 487 38.6 18451 38.8 119399 38.8them in pretty much the same form Very much 106 20.1 4168 24.1 22815 23.9 198 26.9 8105 26.7 56728 26.7 281 22.3 11892 25.0 76925 25.0
Total 527 100.0 17310 100.0 95398 100.0 736 100.0 30312 100.0 212343 100.0 1261 100.0 47586 100.0 307637 100.05b. Analyzing the basic elements of an Very little 52 9.9 1048 6.1 6079 6.4 22 3.0 1070 3.5 8132 3.8 97 7.7 2464 5.2 16534 5.4
idea, experience, or theory Some 154 29.3 5125 29.7 28805 30.3 179 24.5 7681 25.4 58162 27.5 349 27.8 13399 28.2 89907 29.3Quite a bit 197 37.5 7208 41.8 39845 41.9 322 44.0 13567 44.9 93252 44.0 497 39.6 20344 42.9 131016 42.7Very much 122 23.2 3879 22.5 20346 21.4 209 28.6 7918 26.2 52245 24.7 313 24.9 11247 23.7 69239 22.6
Total 525 100.0 17260 100.0 95075 100.0 732 100.0 30236 100.0 211791 100.0 1255 100.0 47454 100.0 306696 100.05c. Synthesizing and organizing ideas, Very little 76 14.6 1704 9.9 8789 9.3 44 6.0 1802 6.0 12660 6.0 148 11.9 4036 8.5 24339 8.0
information, or experiences in new Some 185 35.6 5860 34.1 33329 35.2 252 34.4 9509 31.6 69123 32.8 439 35.2 15707 33.3 104900 34.4ways Quite a bit 166 31.9 6311 36.7 35230 37.2 288 39.3 11999 39.9 83718 39.7 428 34.3 17881 37.9 116686 38.2
Very much 93 17.9 3301 19.2 17280 18.3 149 20.3 6782 22.5 45408 21.5 233 18.7 9602 20.3 59402 19.5Total 520 100.0 17176 100.0 94628 100.0 733 100.0 30092 100.0 210909 100.0 1248 100.0 47226 100.0 305328 100.0
5d. Making judgments about the value Very little 124 23.8 2658 15.5 14708 15.5 71 9.7 2688 8.9 19518 9.2 241 19.3 6243 13.2 39645 13.0or soundness of information, Some 185 35.6 6409 37.3 36130 38.1 255 34.7 10302 34.2 75088 35.5 441 35.3 17122 36.2 113605 37.1arguments, or methods Quite a bit 142 27.3 5499 32.0 30221 31.9 259 35.3 11146 37.0 76801 36.4 373 29.9 15949 33.7 103145 33.7
Very much 69 13.3 2627 15.3 13753 14.5 149 20.3 5980 19.9 39842 18.9 194 15.5 7954 16.8 49497 16.2Total 520 100.0 17193 100.0 94812 100.0 734 100.0 30116 100.0 211249 100.0 1248 100.0 47268 100.0 305892 100.0
5e. Applying theories or concepts to Very little 93 17.9 2273 13.2 11972 12.6 67 9.1 2517 8.3 16911 8.0 188 15.0 5443 11.5 32837 10.7practical problems or in new Some 181 34.7 6087 35.3 34605 36.4 240 32.7 9925 32.9 70368 33.3 426 34.1 16325 34.5 107900 35.2situations Quite a bit 157 30.1 5817 33.7 32135 33.8 286 38.9 11274 37.4 78636 37.2 412 33.0 16598 35.0 107914 35.2
Very much 90 17.3 3061 17.8 16265 17.1 142 19.3 6444 21.4 45668 21.6 224 17.9 9008 19.0 57744 18.8Total 521 100.0 17238 100.0 94977 100.0 735 100.0 30160 100.0 211583 100.0 1251 100.0 47374 100.0 306395 100.0
5f. Using information you have read Very little 75 14.3 2065 11.9 10597 11.1 75 10.2 2522 8.3 15587 7.3 163 13.0 5061 10.6 29316 9.5or heard to perform a new skill Some 149 28.4 5687 32.9 31565 33.1 234 31.8 9061 29.9 63366 29.9 371 29.5 15144 31.8 97936 31.9
Quite a bit 177 33.8 5786 33.5 32847 34.5 281 38.2 11121 36.7 78399 36.9 442 35.2 16456 34.6 109119 35.5Very much 123 23.5 3756 21.7 20287 21.3 146 19.8 7591 25.1 54862 25.9 280 22.3 10887 22.9 71001 23.1
Total 524 100.0 17294 100.0 95296 100.0 736 100.0 30295 100.0 212214 100.0 1256 100.0 47548 100.0 307372 100.06a. Number of assigned textbooks, None 30 5.9 603 3.5 3724 4.0 14 1.9 469 1.6 3342 1.6 57 4.6 1335 2.8 9159 3.0
manuals, books, or book-length Between 1 and 4 286 56.2 8851 51.9 49357 52.4 208 28.8 8545 28.5 60477 28.8 580 47.4 20536 43.8 129765 42.7packs of course readings Between 5 and 10 115 22.6 4267 25.0 23383 24.8 293 40.5 11641 38.9 81563 38.8 347 28.4 14004 29.8 92954 30.6
Between 11 and 20 44 8.6 1892 11.1 9913 10.5 133 18.4 5534 18.5 37774 18.0 144 11.8 6418 13.7 41351 13.6More than 20 34 6.7 1442 8.5 7797 8.3 75 10.4 3770 12.6 27085 12.9 96 7.9 4637 9.9 30839 10.1
Total 509 100.0 17055 100.0 94174 100.0 723 100.0 29959 100.0 210241 100.0 1224 100.0 46930 100.0 304068 100.06b. Number of books read on your own None 133 26.0 4529 26.5 26293 27.9 171 23.7 7805 26.0 61469 29.2 310 25.2 12441 26.5 87222 28.7
(not assigned) for personal Between 1 and 4 262 51.2 8462 49.5 46047 48.9 389 53.9 15189 50.6 102403 48.7 639 52.0 23447 49.9 147995 48.6enjoyment or academic enrichment Between 5 and 10 76 14.8 2569 15.0 13291 14.1 97 13.4 4245 14.2 27647 13.1 177 14.4 6896 14.7 41500 13.6
Between 11 and 20 17 3.3 823 4.8 4623 4.9 37 5.1 1474 4.9 9982 4.7 48 3.9 2265 4.8 14710 4.8More than 20 24 4.7 701 4.1 4006 4.2 28 3.9 1281 4.3 8954 4.3 54 4.4 1957 4.2 12926 4.2
Total 512 100.0 17084 100.0 94260 100.0 722 100.0 29994 100.0 210455 100.0 1229 100.0 47006 100.0 304353 100.06c. Number of written papers or reports None 157 30.7 2523 14.8 14929 15.9 40 5.5 1077 3.6 8174 3.9 278 22.6 5119 10.9 33343 11.0
of any length Between 1 and 4 196 38.4 6241 36.6 34539 36.7 224 31.0 7244 24.2 53800 25.6 442 36.0 15140 32.3 97613 32.1Between 5 and 10 88 17.2 4805 28.2 26342 28.0 245 33.9 10656 35.6 72579 34.5 277 22.6 14425 30.7 93158 30.7
Between 11 and 20 42 8.2 2343 13.7 12327 13.1 139 19.3 6884 23.0 47836 22.8 144 11.8 7968 17.0 51852 17.1More than 20 28 5.5 1139 6.7 5970 6.3 74 10.2 4084 13.6 27815 13.2 86 7.0 4264 9.1 27933 9.2
Total 511 100.0 17051 100.0 94107 100.0 722 100.0 29945 100.0 210204 100.0 1227 100.0 46916 100.0 303900 100.07. Mark the box that best represents Extremely easy 9 1.9 194 1.2 1062 1.2 3 0.4 188 0.7 1248 0.6 16 1.4 449 1.0 2761 0.9
the extent to which your 2 17 3.5 397 2.4 1990 2.2 18 2.6 483 1.7 3257 1.6 38 3.2 982 2.2 5728 2.0examinations during the current 3 30 6.2 1078 6.6 5467 6.1 53 7.5 1636 5.7 10208 5.0 78 6.6 2834 6.3 16486 5.7school year have challenged you to 4 131 27.1 4130 25.5 21633 24.1 161 22.9 7064 24.6 47029 23.2 301 25.7 11273 25.2 69174 23.8do your best work at this college 5 158 32.7 5266 32.5 29176 32.5 265 37.7 10369 36.1 72100 35.6 402 34.3 15101 33.7 98378 33.8
6 96 19.9 3552 21.9 20282 22.6 159 22.6 6550 22.8 48429 23.9 243 20.8 9928 22.2 67379 23.2Extremely challenging 42 8.7 1597 9.8 10083 11.2 44 6.3 2448 8.5 20166 10.0 92 7.9 4196 9.4 31072 10.7
Total 483 100.0 16214 100.0 89693 100.0 703 100.0 28738 100.0 202437 100.0 1171 100.0 44762 100.0 290976 100.08a. Internship, field experience, coop
experience, or clinical assignmentI have not done, nor plan
to do 293 58.1 8048 47.6 43335 46.4 397 55.7 12067 40.5 80525 38.5 694 57.3 21016 45.1 130100 43.1
I plan to do 140 27.8 6611 39.1 36197 38.8 225 31.6 13174 44.2 89318 42.7 351 29.0 19062 40.9 121899 40.4I have done 71 14.1 2252 13.3 13846 14.8 91 12.8 4553 15.3 39174 18.7 165 13.7 6505 14.0 49806 16.5
* Data was weighted according to the full-time/part-time population data from IPEDS.
*Regarding Blank Cells: Please see Table 1 for unweighted sample and population values. F3

2007 Frequency Distributions
Count Col % Count Col % Count Col % Count Col % Count Col % Count Col % Count Col % Count Col % Count Col %Your College
Other ExLarge Colleges
2007 CCSSE Cohort
Part-Time Full-Time All Students (weighted data *)
Your CollegeOther ExLarge
Colleges2007 CCSSE
Cohort Your CollegeOther ExLarge
Colleges2007 CCSSE
Cohort
Total 504 100.0 16911 100.0 93378 100.0 713 100.0 29794 100.0 209017 100.0 1211 100.0 46583 100.0 301805 100.0
* Data was weighted according to the full-time/part-time population data from IPEDS.
*Regarding Blank Cells: Please see Table 1 for unweighted sample and population values. F4

2007 Frequency Distributions
Count Col % Count Col % Count Col % Count Col % Count Col % Count Col % Count Col % Count Col % Count Col %Your College
Other ExLarge Colleges
2007 CCSSE Cohort
Part-Time Full-Time All Students (weighted data *)
Your CollegeOther ExLarge
Colleges2007 CCSSE
Cohort Your CollegeOther ExLarge
Colleges2007 CCSSE
Cohort
8b. English as a second language course I have not done, nor plan to do 434 85.3 14105 83.3 80688 86.4 639 89.5 24073 80.7 177849 85.1 1056 86.6 38455 82.4 259357 85.9
I plan to do 29 5.7 927 5.5 4937 5.3 25 3.5 1509 5.1 10961 5.2 61 5.0 2480 5.3 16053 5.3I have done 46 9.0 1910 11.3 7803 8.4 50 7.0 4232 14.2 20153 9.6 102 8.4 5710 12.2 26509 8.8
Total 509 100.0 16942 100.0 93428 100.0 714 100.0 29814 100.0 208963 100.0 1220 100.0 46645 100.0 301920 100.08c. Developmental/remedial reading
courseI have not done, nor plan
to do 392 77.5 12153 71.9 69761 74.7 537 75.2 20259 68.0 150047 71.8 932 76.7 32858 70.5 222088 73.6
I plan to do 69 13.6 1891 11.2 8646 9.3 82 11.5 2836 9.5 16154 7.7 157 12.9 4897 10.5 25964 8.6I have done 45 8.9 2869 17.0 15031 16.1 95 13.3 6689 22.5 42802 20.5 125 10.3 8827 18.9 53894 17.8
Total 506 100.0 16913 100.0 93438 100.0 714 100.0 29784 100.0 209003 100.0 1215 100.0 46581 100.0 301946 100.08d. Developmental/remedial writing course I have not done, nor plan
to do 358 70.8 11299 66.8 64442 69.0 476 66.6 18738 62.9 137430 65.7 843 69.4 30526 65.5 204408 67.7
I plan to do 94 18.6 2382 14.1 11068 11.8 107 15.0 3471 11.6 19945 9.5 212 17.4 6108 13.1 32756 10.8I have done 54 10.7 3237 19.1 17944 19.2 132 18.5 7589 25.5 51793 24.8 160 13.2 9966 21.4 64924 21.5
Total 506 100.0 16918 100.0 93454 100.0 715 100.0 29798 100.0 209168 100.0 1215 100.0 46601 100.0 302088 100.08e. Developmental/remedial math course I have not done, nor plan
to do 315 62.7 9352 55.3 51410 55.1 409 57.0 15081 50.7 108407 51.9 737 60.9 24994 53.7 162427 53.8
I plan to do 107 21.3 3043 18.0 15008 16.1 121 16.9 4229 14.2 25112 12.0 240 19.9 7728 16.6 43322 14.4I have done 80 15.9 4504 26.7 26924 28.8 187 26.1 10439 35.1 75343 36.1 233 19.2 13816 29.7 95974 31.8
Total 502 100.0 16899 100.0 93342 100.0 717 100.0 29749 100.0 208862 100.0 1210 100.0 46538 100.0 301723 100.08f. Study skills course I have not done, nor plan
to do 352 70.4 11098 65.6 64316 68.9 494 69.6 18484 62.2 135677 65.0 844 70.1 30014 64.5 203093 67.3to doI plan to do 90 18.0 3449 20.4 16984 18.2 125 17.6 5721 19.2 35207 16.9 215 17.9 9284 19.9 52980 17.6
I have done 58 11.6 2373 14.0 12073 12.9 91 12.8 5526 18.6 37931 18.2 144 12.0 7267 15.6 45676 15.1Total 500 100.0 16920 100.0 93373 100.0 710 100.0 29731 100.0 208815 100.0 1203 100.0 46565 100.0 301749 100.0
8g. Honors course I have not done, nor plan to do 416 83.0 12385 73.6 70811 76.2 535 75.6 19024 64.2 142469 68.5 970 80.6 32645 70.4 220155 73.3
I plan to do 69 13.8 3791 22.5 18710 20.1 143 20.2 8541 28.8 52397 25.2 191 15.8 11426 24.6 66142 22.0I have done 16 3.2 660 3.9 3448 3.7 30 4.2 2054 6.9 13185 6.3 42 3.5 2286 4.9 14236 4.7
Total 501 100.0 16836 100.0 92969 100.0 708 100.0 29619 100.0 208051 100.0 1203 100.0 46356 100.0 300534 100.08h. College orientation program or course I have not done, nor plan
to do 377 74.8 10468 62.0 60481 64.8 485 68.4 15972 53.7 116668 55.9 879 72.8 27499 59.1 184202 61.1
I plan to do 61 12.1 2430 14.4 12599 13.5 99 14.0 4316 14.5 27331 13.1 153 12.7 6681 14.4 40059 13.3I have done 66 13.1 3994 23.6 20203 21.7 125 17.6 9439 31.8 64720 31.0 176 14.5 12338 26.5 77234 25.6
Total 504 100.0 16892 100.0 93283 100.0 709 100.0 29727 100.0 208719 100.0 1209 100.0 46518 100.0 301495 100.08i. Organized learning communities (linked
courses/study groups led byI have not done, nor plan
to do 410 81.0 12499 73.7 70938 75.8 533 74.9 20384 68.4 147892 70.6 959 79.1 33600 72.0 223024 73.7
faculty or counselors) I plan to do 77 15.2 3246 19.1 16397 17.5 128 18.0 6131 20.6 39204 18.7 195 16.1 9136 19.6 54268 17.9I have done 19 3.8 1213 7.2 6249 6.7 51 7.2 3300 11.1 22304 10.7 59 4.8 3946 8.5 25191 8.3
Total 506 100.0 16958 100.0 93584 100.0 712 100.0 29815 100.0 209400 100.0 1214 100.0 46681 100.0 302483 100.09a. Encouraging you to spend Very little 29 5.7 980 5.7 4885 5.2 23 3.2 1225 4.1 7847 3.7 60 4.9 2431 5.2 13980 4.6
significant amounts of time Some 145 28.4 4386 25.7 24585 26.1 146 20.2 6565 21.9 46376 22.0 316 25.8 11450 24.4 74404 24.5studying Quite a bit 229 44.8 7262 42.6 40297 42.8 328 45.5 12805 42.7 90209 42.8 552 45.0 20030 42.7 130414 42.9
Very much 108 21.1 4429 26.0 24381 25.9 224 31.1 9396 31.3 66109 31.4 298 24.3 13039 27.8 85410 28.1Total 511 100.0 17057 100.0 94148 100.0 721 100.0 29991 100.0 210541 100.0 1227 100.0 46950 100.0 304209 100.0
9b. Providing the support you need to Very little 32 6.3 1067 6.3 5427 5.8 40 5.6 1563 5.2 9911 4.7 74 6.1 2769 5.9 16225 5.3help you succeed at this college Some 141 27.8 4458 26.2 23884 25.4 171 23.8 7190 24.0 48257 22.9 323 26.5 11908 25.4 73974 24.4
Quite a bit 202 39.8 7166 42.1 39997 42.6 313 43.5 12451 41.6 88328 42.0 500 41.0 19658 41.9 128733 42.4Very much 132 26.0 4324 25.4 24653 26.2 196 27.2 8752 29.2 63813 30.3 322 26.4 12527 26.7 84796 27.9
Total 507 100.0 17015 100.0 93961 100.0 720 100.0 29956 100.0 210309 100.0 1220 100.0 46862 100.0 303729 100.09c. Encouraging contact among Very little 123 24.4 3327 19.6 19649 21.0 121 16.8 5024 16.8 36793 17.5 267 21.9 8721 18.7 59334 19.6
students from different economic, Some 168 33.3 5707 33.6 32352 34.6 236 32.8 9289 31.1 68819 32.8 403 33.2 15278 32.7 102789 33.9social, and racial or ethnic Quite a bit 138 27.4 4966 29.3 26089 27.9 226 31.4 9097 30.4 62227 29.6 348 28.7 13890 29.7 86552 28.6backgrounds Very much 75 14.9 2972 17.5 15530 16.6 137 19.0 6500 21.7 42110 20.1 197 16.2 8868 19.0 54187 17.9
Total 504 100.0 16972 100.0 93620 100.0 720 100.0 29910 100.0 209949 100.0 1215 100.0 46758 100.0 302862 100.09d. Helping you cope with your non- Very little 244 48.2 7777 45.9 41685 44.5 307 42.8 12154 40.6 81845 39.0 565 46.5 20570 44.1 127414 42.1
academic responsibilities (work, Some 160 31.6 5308 31.3 30320 32.4 260 36.3 10038 33.6 72762 34.6 403 33.1 15011 32.1 101265 33.4family, etc.) Quite a bit 70 13.8 2619 15.5 14535 15.5 98 13.7 5141 17.2 36857 17.5 168 13.8 7503 16.1 49739 16.4
Very much 32 6.3 1233 7.3 7043 7.5 52 7.3 2578 8.6 18562 8.8 81 6.6 3609 7.7 24420 8.1Total 506 100.0 16937 100.0 93583 100.0 717 100.0 29911 100.0 210026 100.0 1216 100.0 46693 100.0 302838 100.0
* Data was weighted according to the full-time/part-time population data from IPEDS.
*Regarding Blank Cells: Please see Table 1 for unweighted sample and population values. F5

2007 Frequency Distributions
Count Col % Count Col % Count Col % Count Col % Count Col % Count Col % Count Col % Count Col % Count Col %Your College
Other ExLarge Colleges
2007 CCSSE Cohort
Part-Time Full-Time All Students (weighted data *)
Your CollegeOther ExLarge
Colleges2007 CCSSE
Cohort Your CollegeOther ExLarge
Colleges2007 CCSSE
Cohort
9e. Providing the support you need to Very little 209 41.2 5747 34.2 31242 33.6 213 29.7 8296 27.9 54789 26.2 457 37.5 14807 31.9 91422 30.3thrive socially Some 175 34.5 6519 38.8 36517 39.2 311 43.4 11734 39.4 84926 40.6 455 37.4 18099 39.0 120374 39.9
Quite a bit 96 18.9 3236 19.2 17910 19.2 136 19.0 6823 22.9 48421 23.2 231 19.0 9558 20.6 63024 20.9Very much 27 5.3 1317 7.8 7408 8.0 56 7.8 2910 9.8 20999 10.0 75 6.1 3938 8.5 26565 8.8
Total 507 100.0 16819 100.0 93077 100.0 716 100.0 29763 100.0 209135 100.0 1217 100.0 46402 100.0 301385 100.09f. Providing the financial support you Very little 211 41.8 6000 35.6 30760 33.0 187 26.2 7697 25.8 46984 22.4 446 36.8 14916 32.1 85634 28.4
need to afford your education Some 148 29.3 4574 27.2 25486 27.4 208 29.1 7900 26.5 55397 26.4 355 29.2 12519 26.9 81685 27.1Quite a bit 78 15.4 3542 21.0 20118 21.6 199 27.8 7255 24.3 54309 25.9 236 19.4 10338 22.2 71103 23.6Very much 68 13.5 2721 16.2 16786 18.0 121 16.9 6959 23.3 52834 25.2 177 14.6 8689 18.7 63318 21.0
Total 505 100.0 16837 100.0 93150 100.0 715 100.0 29811 100.0 209524 100.0 1214 100.0 46462 100.0 301740 100.09g. Using Computers in academic work Very little 100 19.6 1686 9.9 9147 9.7 44 6.1 1222 4.1 7961 3.8 187 15.3 3685 7.9 22002 7.2
Some 144 28.3 3766 22.2 20060 21.4 138 19.2 4851 16.2 32518 15.5 310 25.4 9374 20.0 57337 18.9Quite a bit 154 30.3 5521 32.5 30636 32.6 255 35.5 9832 32.8 69694 33.1 390 31.9 15272 32.6 99955 32.9Very much 111 21.8 6024 35.4 34009 36.2 282 39.2 14056 46.9 100141 47.6 335 27.4 18502 39.5 124210 40.9
Total 509 100.0 16997 100.0 93852 100.0 719 100.0 29961 100.0 210314 100.0 1222 100.0 46833 100.0 303505 100.010a. Preparing for class (studying, None 14 2.7 330 1.9 1962 2.1 5 0.7 343 1.1 2782 1.3 26 2.1 784 1.7 5514 1.8
reading, writing, rehearsing, doing 1-5 hours 278 54.5 8456 49.6 46206 49.1 254 35.4 10913 36.5 77325 36.9 592 48.4 21186 45.2 134136 44.2homework, or other activities 6-10 hours 144 28.2 4941 29.0 27309 29.0 234 32.6 9089 30.4 62297 29.7 362 29.6 13816 29.5 88838 29.3related to your program) 11-20 hours 54 10.6 2364 13.9 13222 14.1 150 20.9 6061 20.3 41929 20.0 170 13.9 7519 16.0 49934 16.4
21-30 hours 15 2.9 648 3.8 3573 3.8 49 6.8 2257 7.6 16462 7.8 51 4.2 2372 5.1 16473 5.4More than 30 hours 5 1.0 304 1.8 1768 1.9 25 3.5 1222 4.1 9028 4.3 22 1.8 1191 2.5 8669 2.9
Total 510 100.0 17043 100.0 94040 100.0 717 100.0 29885 100.0 209823 100.0 1223 100.0 46868 100.0 303564 100.010b W ki f N 86 17 1 2439 14 4 14491 15 5 172 23 9 6746 22 7 52098 24 9 234 19 3 8067 17 3 59277 19 610b. Working for pay None 86 17.1 2439 14.4 14491 15.5 172 23.9 6746 22.7 52098 24.9 234 19.3 8067 17.3 59277 19.6
1-5 hours 21 4.2 708 4.2 3914 4.2 43 6.0 1664 5.6 12844 6.1 58 4.8 2175 4.7 15240 5.06-10 hours 29 5.8 904 5.3 4795 5.1 49 6.8 1960 6.6 14203 6.8 74 6.1 2689 5.8 17684 5.8
11-20 hours 58 11.5 1499 8.8 8110 8.7 118 16.4 5046 16.9 35010 16.7 159 13.1 5435 11.6 36381 12.021-30 hours 91 18.1 2589 15.3 13528 14.5 194 26.9 6680 22.4 44957 21.5 254 21.0 8319 17.8 52447 17.3
More than 30 hours 218 43.3 8823 52.0 48781 52.1 144 20.0 7687 25.8 50172 24.0 434 35.8 19981 42.8 121453 40.2Total 503 100.0 16962 100.0 93619 100.0 720 100.0 29783 100.0 209284 100.0 1213 100.0 46666 100.0 302481 100.0
10c. Participating in college-sponsored None 461 91.1 14921 87.9 82454 87.9 597 83.1 23463 78.6 158840 75.8 1077 88.5 39556 84.7 250478 82.7activities (organizations, campus 1-5 hours 27 5.3 1491 8.8 8405 9.0 68 9.5 4399 14.7 34953 16.7 81 6.7 5093 10.9 37245 12.3publications, student government, 6-10 hours 9 1.8 299 1.8 1628 1.7 24 3.3 990 3.3 7390 3.5 28 2.3 1068 2.3 7617 2.5intercollegiate or intramural sports, 11-20 hours 2 0.4 152 0.9 692 0.7 11 1.5 529 1.8 4313 2.1 9 0.8 560 1.2 3962 1.3etc.) 21-30 hours 2 0.4 47 0.3 240 0.3 7 1.0 220 0.7 1882 0.9 7 0.6 200 0.4 1612 0.5
More than 30 hours 5 1.0 65 0.4 348 0.4 11 1.5 242 0.8 2194 1.0 14 1.2 244 0.5 1977 0.7Total 506 100.0 16975 100.0 93767 100.0 718 100.0 29843 100.0 209572 100.0 1217 100.0 46721 100.0 302891 100.0
10d. Providing care for dependents None 244 48.7 7366 43.5 37457 40.0 403 56.3 14811 49.8 102380 49.0 618 51.2 21319 45.7 132472 43.8living with you (parents, children, 1-5 hours 80 16.0 2671 15.8 13281 14.2 146 20.4 5549 18.7 34833 16.7 210 17.4 7812 16.8 45859 15.2spouse, etc.) 6-10 hours 44 8.8 1425 8.4 7135 7.6 59 8.2 2753 9.3 16393 7.8 104 8.6 4043 8.7 23127 7.7
11-20 hours 28 5.6 1103 6.5 5757 6.2 30 4.2 1811 6.1 11547 5.5 62 5.1 2954 6.3 17722 5.921-30 hours 19 3.8 717 4.2 4117 4.4 12 1.7 1016 3.4 7185 3.4 38 3.1 1841 3.9 12057 4.0
More than 30 hours 86 17.2 3660 21.6 25832 27.6 66 9.2 3806 12.8 36782 17.6 176 14.6 8641 18.5 71049 23.5Total 501 100.0 16942 100.0 93579 100.0 716 100.0 29746 100.0 209120 100.0 1208 100.0 46610 100.0 302286 100.0
10e. Commuting to and from classes None 35 6.9 1186 7.0 6154 6.6 28 3.9 1918 6.4 14495 6.9 72 5.9 3185 6.8 20841 6.91-5 hours 392 77.6 12547 74.1 69852 74.5 479 66.5 19044 64.0 128543 61.4 901 74.0 32896 70.6 208348 68.8
6-10 hours 55 10.9 2100 12.4 11944 12.7 147 20.4 5534 18.6 42431 20.3 170 14.0 6767 14.5 48244 15.911-20 hours 14 2.8 610 3.6 3241 3.5 44 6.1 2080 7.0 14901 7.1 47 3.9 2230 4.8 15114 5.021-30 hours 4 0.8 188 1.1 922 1.0 9 1.3 580 1.9 3866 1.8 11 0.9 652 1.4 4047 1.3
More than 30 hours 5 1.0 305 1.8 1595 1.7 13 1.8 607 2.0 5091 2.4 15 1.3 881 1.9 6085 2.0Total 505 100.0 16936 100.0 93708 100.0 720 100.0 29763 100.0 209327 100.0 1216 100.0 46611 100.0 302679 100.0
11a. Other students Unfriendly,unsupportive, sense of alienation 10 2.0 209 1.2 904 1.0 4 0.6 318 1.1 1894 0.9 18 1.5 545 1.2 2837 0.9
2 22 4.3 429 2.5 2005 2.1 17 2.4 694 2.3 4007 1.9 45 3.7 1149 2.5 6237 2.13 27 5.3 962 5.6 4472 4.8 53 7.4 1660 5.6 9121 4.3 73 6.0 2630 5.6 13831 4.64 107 21.1 3125 18.3 15538 16.5 142 19.7 4998 16.7 30524 14.5 252 20.6 8312 17.7 47585 15.75 105 20.7 3910 23.0 20974 22.3 170 23.6 6886 23.1 45973 21.9 264 21.6 10767 23.0 67282 22.26 120 23.6 4449 26.1 25156 26.8 198 27.5 8363 28.0 60993 29.0 304 24.9 12543 26.8 84247 27.7
Friendly,supportive, sense of belonging 117 23.0 3946 23.2 24938 26.5 137 19.0 6942 23.2 57522 27.4 266 21.7 10886 23.2 81589 26.9
Total 508 100.0 17030 100.0 93987 100.0 721 100.0 29861 100.0 210034 100.0 1222 100.0 46832 100.0 303607 100.0
* Data was weighted according to the full-time/part-time population data from IPEDS.
*Regarding Blank Cells: Please see Table 1 for unweighted sample and population values. F6

2007 Frequency Distributions
Count Col % Count Col % Count Col % Count Col % Count Col % Count Col % Count Col % Count Col % Count Col %Your College
Other ExLarge Colleges
2007 CCSSE Cohort
Part-Time Full-Time All Students (weighted data *)
Your CollegeOther ExLarge
Colleges2007 CCSSE
Cohort Your CollegeOther ExLarge
Colleges2007 CCSSE
Cohort
11b. Instructors Unavailable,unhelpful, unsympathetic 3 0.6 120 0.7 600 0.6 4 0.6 209 0.7 1416 0.7 7 0.6 328 0.7 1970 0.6
2 6 1.2 263 1.5 1392 1.5 13 1.8 483 1.6 3212 1.5 17 1.4 730 1.6 4561 1.53 14 2.8 660 3.9 3220 3.4 38 5.3 1318 4.4 8225 3.9 44 3.6 1896 4.0 11014 3.64 52 10.2 2143 12.6 10805 11.5 86 12.0 4177 14.0 26203 12.5 132 10.8 6111 13.0 36047 11.95 99 19.4 3684 21.6 18681 19.9 173 24.1 7328 24.5 47923 22.8 256 20.9 10607 22.6 63981 21.16 146 28.7 5314 31.2 29192 31.0 250 34.8 9636 32.2 68353 32.5 374 30.7 14807 31.6 96265 31.7
Available,helpful, sympathetic 189 37.1 4863 28.5 30204 32.1 154 21.4 6740 22.5 54789 26.1 392 32.1 12402 26.5 90018 29.6
Total 509 100.0 17047 100.0 94094 100.0 718 100.0 29891 100.0 210121 100.0 1222 100.0 46881 100.0 303855 100.011c. Administrative personnel and offices Unhelpful,inconsiderate,
rigid 12 2.4 648 3.8 3095 3.3 25 3.5 1282 4.3 7290 3.5 33 2.7 1861 4.0 10174 3.4
2 24 4.7 887 5.2 4530 4.8 38 5.3 1824 6.1 10957 5.2 60 4.9 2593 5.5 15044 5.03 44 8.7 1687 9.9 7992 8.5 71 9.9 2998 10.0 18376 8.8 110 9.1 4655 10.0 25998 8.64 126 24.9 3887 22.9 19167 20.4 150 20.8 6693 22.4 41604 19.8 287 23.6 10619 22.7 60870 20.15 116 22.9 3858 22.7 20832 22.2 181 25.1 6856 23.0 47528 22.6 288 23.6 10644 22.8 67924 22.46 95 18.8 3398 20.0 20522 21.9 179 24.9 6097 20.4 47334 22.5 253 20.7 9440 20.2 67456 22.2
Helpful,considerate, flexible 89 17.6 2606 15.4 17661 18.8 76 10.6 4113 13.8 36877 17.6 187 15.3 6916 14.8 55760 18.4
Total 506 100.0 16971 100.0 93799 100.0 720 100.0 29863 100.0 209966 100.0 1218 100.0 46728 100.0 303227 100.012a. Acquiring a broad general education Very little 59 11.7 1313 7.7 6958 7.4 31 4.3 1075 3.6 7369 3.5 113 9.3 2947 6.3 17513 5.8
Some 154 30.5 4246 25.0 24464 26.1 128 17.8 5813 19.5 43148 20.6 321 26.4 10787 23.1 72270 23.8Quite a bit 175 34.7 6866 40.4 38096 40.6 323 44.8 13218 44.3 93170 44.4 462 37.9 19542 41.8 128137 42.3Very much 117 23.2 4556 26.8 24249 25.9 239 33.1 9759 32.7 66238 31.6 321 26.4 13473 28.8 85212 28.1
Total 505 100.0 16981 100.0 93767 100.0 721 100.0 29865 100.0 209925 100.0 1217 100.0 46749 100.0 303132 100.012b. Acquiring job or work-related Very little 138 27.4 3940 23.3 19399 20.7 199 27.8 5868 19.7 32864 15.7 334 27.6 10242 22.0 55772 18.4
knowledge and skills Some 160 31.8 5171 30.5 28228 30.2 257 35.9 9379 31.5 62003 29.6 401 33.1 14383 30.8 90485 29.9Quite a bit 122 24.3 4769 28.2 27401 29.3 179 25.0 8870 29.8 65972 31.5 297 24.5 13412 28.8 91767 30.3Very much 83 16.5 3055 18.0 18566 19.8 81 11.3 5685 19.1 48746 23.3 180 14.8 8596 18.4 64592 21.3
Total 503 100.0 16935 100.0 93594 100.0 716 100.0 29802 100.0 209585 100.0 1211 100.0 46634 100.0 302616 100.012c. Writing clearly and effectively Very little 113 22.4 2527 14.9 13956 14.9 63 8.8 2257 7.6 15971 7.6 219 18.0 5770 12.4 35858 11.8
Some 170 33.7 5101 30.1 28406 30.4 219 30.5 8157 27.3 58822 28.0 397 32.7 13610 29.2 89193 29.5Quite a bit 148 29.4 6022 35.6 33309 35.6 306 42.7 12044 40.4 85167 40.6 408 33.7 17362 37.2 114142 37.7Very much 73 14.5 3277 19.4 17904 19.1 129 18.0 7378 24.7 49746 23.7 189 15.6 9893 21.2 63430 21.0
Total 504 100.0 16927 100.0 93575 100.0 717 100.0 29836 100.0 209706 100.0 1213 100.0 46636 100.0 302623 100.012d. Speaking clearly and effectively Very little 124 24.7 2946 17.4 16556 17.7 89 12.4 3218 10.8 22593 10.8 251 20.7 7035 15.1 44710 14.8
Some 161 32.0 5270 31.1 29885 32.0 235 32.6 8608 28.9 62833 30.0 391 32.2 14126 30.3 94294 31.2Quite a bit 145 28.8 5682 33.5 30928 33.1 266 36.9 11208 37.6 78504 37.4 382 31.5 16334 35.0 105804 35.0Very much 73 14.5 3043 18.0 16151 17.3 130 18.1 6791 22.8 45725 21.8 190 15.7 9159 19.6 57689 19.1
Total 503 100.0 16941 100.0 93520 100.0 720 100.0 29825 100.0 209655 100.0 1213 100.0 46654 100.0 302496 100.012e. Thinking critically and Very little 66 13.1 1467 8.7 7979 8.5 38 5.3 1465 4.9 9952 4.8 128 10.6 3427 7.3 21031 7.0
analytically Some 141 28.0 4814 28.4 26205 28.0 187 26.0 7311 24.5 50649 24.2 332 27.4 12634 27.1 79986 26.5Quite a bit 189 37.6 6776 40.0 37888 40.5 314 43.7 12718 42.7 89813 42.9 480 39.5 19092 40.9 125638 41.5Very much 107 21.3 3876 22.9 21436 22.9 180 25.0 8318 27.9 59089 28.2 273 22.5 11478 24.6 75745 25.0
Total 503 100.0 16933 100.0 93508 100.0 719 100.0 29812 100.0 209503 100.0 1213 100.0 46632 100.0 302399 100.012f. Solving numerical problems Very little 126 25.0 3528 20.9 19240 20.6 93 12.9 3577 12.0 23986 11.4 256 21.1 8271 17.8 50612 16.8
Some 147 29.2 5098 30.2 27693 29.7 232 32.3 8707 29.2 62219 29.7 366 30.2 13893 29.8 89878 29.8Quite a bit 152 30.2 5195 30.7 29327 31.4 258 35.9 10761 36.1 76467 36.5 389 32.0 15190 32.6 101464 33.6Very much 79 15.7 3081 18.2 17084 18.3 136 18.9 6758 22.7 46819 22.3 203 16.7 9218 19.8 60136 19.9
Total 504 100.0 16902 100.0 93344 100.0 719 100.0 29803 100.0 209491 100.0 1214 100.0 46572 100.0 302090 100.012g. Using computing and Very little 124 24.7 3138 18.6 16510 17.7 130 18.1 3442 11.5 20969 10.0 273 22.6 7483 16.1 43336 14.3
information technology Some 181 36.1 4929 29.1 26898 28.8 226 31.5 8022 26.9 55012 26.3 418 34.6 13198 28.3 83890 27.8Quite a bit 131 26.1 5098 30.1 28760 30.8 216 30.1 9952 33.4 72251 34.5 331 27.4 14593 31.3 97924 32.4Very much 66 13.1 3751 22.2 21268 22.8 146 20.3 8395 28.2 61238 29.2 187 15.5 11326 24.3 77093 25.5
Total 502 100.0 16916 100.0 93436 100.0 718 100.0 29811 100.0 209470 100.0 1210 100.0 46600 100.0 302244 100.012h. Working effectively with others Very little 66 13.1 2104 12.4 10989 11.8 86 11.9 2588 8.7 15749 7.5 155 12.7 5160 11.1 30029 9.9
Some 189 37.6 5867 34.7 31613 33.8 262 36.4 9293 31.2 62598 29.9 451 37.2 15568 33.4 97147 32.1Quite a bit 170 33.8 5828 34.4 32683 35.0 235 32.6 11131 37.3 80340 38.3 405 33.4 16566 35.5 110295 36.5Very much 78 15.5 3123 18.5 18191 19.5 137 19.0 6792 22.8 50877 24.3 202 16.6 9318 20.0 64905 21.5
Total 503 100.0 16922 100.0 93476 100.0 720 100.0 29804 100.0 209564 100.0 1213 100.0 46612 100.0 302375 100.0
* Data was weighted according to the full-time/part-time population data from IPEDS.
*Regarding Blank Cells: Please see Table 1 for unweighted sample and population values. F7

2007 Frequency Distributions
Count Col % Count Col % Count Col % Count Col % Count Col % Count Col % Count Col % Count Col % Count Col %Your College
Other ExLarge Colleges
2007 CCSSE Cohort
Part-Time Full-Time All Students (weighted data *)
Your CollegeOther ExLarge
Colleges2007 CCSSE
Cohort Your CollegeOther ExLarge
Colleges2007 CCSSE
Cohort
12i. Learning effectively on your Very little 48 9.6 1447 8.5 7370 7.9 55 7.7 1937 6.5 12087 5.8 108 9.0 3666 7.9 21072 7.0own Some 130 25.9 4551 26.9 24805 26.5 197 27.5 7215 24.2 50443 24.1 319 26.4 12073 25.9 77130 25.5
Quite a bit 206 41.1 6758 39.9 37590 40.2 292 40.7 12009 40.3 85515 40.8 495 41.0 18681 40.0 122653 40.6Very much 117 23.4 4187 24.7 23762 25.4 173 24.1 8650 29.0 61506 29.4 285 23.6 12230 26.2 81573 27.0
Total 501 100.0 16943 100.0 93527 100.0 717 100.0 29811 100.0 209551 100.0 1208 100.0 46650 100.0 302429 100.012j. Understanding yourself Very little 121 24.1 3295 19.5 17911 19.2 148 20.5 4610 15.5 30872 14.7 278 22.9 8399 18.0 52042 17.2
Some 154 30.6 5126 30.3 28721 30.7 231 32.0 8434 28.3 61395 29.3 377 31.1 13811 29.7 91413 30.3Quite a bit 133 26.4 5104 30.2 28485 30.5 205 28.4 9584 32.2 67606 32.3 329 27.1 14408 30.9 94591 31.3Very much 95 18.9 3384 20.0 18288 19.6 137 19.0 7162 24.0 49490 23.6 230 18.9 9961 21.4 64082 21.2
Total 503 100.0 16909 100.0 93405 100.0 721 100.0 29790 100.0 209363 100.0 1214 100.0 46580 100.0 302128 100.012k. Understanding people of other Very little 160 31.7 4163 24.6 24879 26.7 149 20.7 5475 18.4 42057 20.1 342 28.2 10455 22.5 72381 24.0
racial and ethnic backgrounds Some 154 30.6 5682 33.6 31937 34.2 255 35.4 9590 32.2 70919 33.9 390 32.1 15439 33.2 103135 34.2Quite a bit 114 22.6 4352 25.7 22951 24.6 197 27.4 8783 29.5 58687 28.0 293 24.2 12612 27.1 78553 26.0Very much 76 15.1 2704 16.0 13569 14.5 119 16.5 5928 19.9 37601 18.0 189 15.5 8049 17.3 47840 15.8
Total 504 100.0 16901 100.0 93336 100.0 720 100.0 29776 100.0 209264 100.0 1215 100.0 46554 100.0 301910 100.012l. Developing a personal code of Very little 176 34.9 4759 28.2 26151 28.0 191 26.5 6473 21.8 43312 20.7 391 32.2 12039 25.9 75049 24.9
values and ethics Some 159 31.5 5471 32.4 31436 33.7 254 35.3 9595 32.3 70200 33.5 398 32.8 15058 32.4 101794 33.7Quite a bit 101 20.0 4209 24.9 22611 24.2 174 24.2 8459 28.4 59216 28.3 260 21.4 12186 26.2 78484 26.0Very much 68 13.5 2462 14.6 13140 14.1 101 14.0 5222 17.6 36547 17.5 166 13.7 7260 15.6 46604 15.4
Total 504 100.0 16901 100.0 93338 100.0 720 100.0 29749 100.0 209275 100.0 1215 100.0 46542 100.0 301930 100.012m. Contributing to the welfare of Very little 246 49.1 7180 42.6 38647 41.5 313 43.5 10876 36.6 71788 34.4 572 47.3 18806 40.5 115554 38.4
your community Some 150 29.9 5517 32.7 31567 33.9 271 37.6 10278 34.6 75919 36.3 392 32.4 15526 33.4 105632 35.1Quite a bit 71 14.2 2790 16.5 15241 16.4 93 12.9 5617 18.9 40255 19.3 167 13.8 8067 17.4 53146 17.6Very much 34 6.8 1372 8.1 7659 8.2 43 6.0 2922 9.8 20932 10.0 79 6.5 4038 8.7 26965 8.9
Total 501 100.0 16859 100.0 93114 100.0 720 100.0 29693 100.0 208894 100.0 1210 100.0 46438 100.0 301297 100.012n. Developing clearer career Very little 142 28.1 3342 19.8 17622 18.9 126 17.5 4206 14.1 26229 12.5 300 24.7 8268 17.8 48738 16.1
goals Some 147 29.1 5021 29.7 28028 30.0 216 30.1 8260 27.7 57088 27.2 358 29.4 13534 29.1 87263 28.9Quite a bit 129 25.5 5056 29.9 28530 30.5 227 31.6 9828 33.0 71148 34.0 334 27.5 14440 31.0 96994 32.1Very much 87 17.2 3490 20.6 19259 20.6 149 20.8 7499 25.2 55038 26.3 223 18.4 10338 22.2 69279 22.9
Total 505 100.0 16909 100.0 93439 100.0 718 100.0 29793 100.0 209503 100.0 1215 100.0 46581 100.0 302274 100.012o. Gaining information about Very little 156 31.0 4008 23.7 21468 22.9 165 22.9 5230 17.5 32531 15.5 344 28.4 10010 21.4 59577 19.7
career opportunities Some 154 30.6 5241 30.9 29462 31.5 226 31.4 8778 29.4 60949 29.1 374 30.8 14193 30.4 92315 30.5Quite a bit 113 22.4 4545 26.8 25421 27.2 204 28.3 9066 30.4 65660 31.3 296 24.3 13136 28.1 87822 29.0Very much 81 16.1 3151 18.6 17250 18.4 125 17.4 6771 22.7 50657 24.1 200 16.5 9332 20.0 63034 20.8
Total 504 100.0 16945 100.0 93601 100.0 720 100.0 29845 100.0 209797 100.0 1215 100.0 46671 100.0 302747 100.013a1. Frequency: Academic Do not know/N.A. 98 19.4 2059 12.3 10921 11.8 53 7.5 2065 7.0 13252 6.4 189 15.6 4831 10.5 28551 9.5
advising/planning Rarely/never 226 44.8 6652 39.7 35145 38.0 247 34.9 10330 35.0 67443 32.5 503 41.7 17615 38.2 106531 35.6Sometimes 147 29.2 6486 38.7 36785 39.7 310 43.8 13052 44.3 95742 46.1 409 33.8 18729 40.6 127218 42.5
Often 33 6.5 1570 9.4 9713 10.5 98 13.8 4046 13.7 31032 15.0 107 8.9 4994 10.8 37120 12.4Total 504 100.0 16767 100.0 92564 100.0 708 100.0 29493 100.0 207469 100.0 1208 100.0 46168 100.0 299420 100.0
13b1. Frequency: Career counseling Do not know/N.A. 137 27.2 3569 21.4 21589 23.4 94 13.3 5135 17.5 37917 18.3 275 22.8 9239 20.1 63409 21.3Rarely/never 247 49.0 8165 48.9 46030 49.9 376 53.3 14291 48.6 104194 50.4 608 50.4 22493 48.9 149722 50.2
Sometimes 104 20.6 4059 24.3 20187 21.9 175 24.8 7780 26.5 51253 24.8 265 22.0 11482 25.0 68950 23.1Often 16 3.2 893 5.4 4389 4.8 60 8.5 2177 7.4 13277 6.4 59 4.9 2752 6.0 16172 5.4
Total 504 100.0 16686 100.0 92195 100.0 705 100.0 29383 100.0 206641 100.0 1207 100.0 45966 100.0 298253 100.013c1. Frequency: Job placement Do not know/N.A. 230 45.8 7220 43.6 41167 45.0 268 38.3 11730 40.2 80331 39.1 521 43.4 19372 42.5 125686 42.4
assistance Rarely/never 239 47.6 7767 46.9 41790 45.7 374 53.4 13830 47.4 95896 46.7 594 49.5 21467 47.1 136447 46.1Sometimes 24 4.8 1192 7.2 6677 7.3 42 6.0 2794 9.6 22138 10.8 62 5.2 3665 8.0 26264 8.9
Often 9 1.8 366 2.2 1884 2.1 16 2.3 819 2.8 6934 3.4 23 1.9 1100 2.4 7788 2.6Total 502 100.0 16545 100.0 91518 100.0 700 100.0 29173 100.0 205299 100.0 1201 100.0 45604 100.0 296185 100.0
13d1. Frequency: Peer or other Do not know/N.A. 180 35.9 5118 31.0 29251 32.0 179 25.5 7310 25.1 51561 25.2 391 32.6 13211 29.0 86300 29.2tutoring Rarely/never 247 49.2 7470 45.2 41436 45.4 356 50.7 12707 43.7 94286 46.0 597 49.7 20335 44.7 135054 45.7
Sometimes 54 10.8 2863 17.3 14993 16.4 119 17.0 6447 22.2 42095 20.5 153 12.7 8641 19.0 53511 18.1Often 21 4.2 1068 6.5 5669 6.2 48 6.8 2613 9.0 17031 8.3 60 5.0 3313 7.3 20817 7.0
Total 502 100.0 16519 100.0 91349 100.0 702 100.0 29077 100.0 204973 100.0 1202 100.0 45501 100.0 295682 100.013e1. Frequency: Skill labs (writing, Do not know/N.A. 152 30.2 4297 26.0 24962 27.4 132 18.7 5859 20.2 41107 20.1 320 26.5 10892 24.0 71789 24.3
math, etc.) Rarely/never 188 37.3 6367 38.6 34315 37.6 278 39.4 10435 35.9 73106 35.8 458 38.0 17115 37.7 108521 36.8Sometimes 100 19.8 3778 22.9 20429 22.4 168 23.8 7898 27.2 55293 27.0 255 21.1 11117 24.5 72061 24.4
Often 64 12.7 2056 12.5 11489 12.6 128 18.1 4843 16.7 34910 17.1 174 14.4 6309 13.9 42673 14.5Total 504 100.0 16498 100.0 91195 100.0 706 100.0 29035 100.0 204416 100.0 1207 100.0 45433 100.0 295044 100.0
* Data was weighted according to the full-time/part-time population data from IPEDS.
*Regarding Blank Cells: Please see Table 1 for unweighted sample and population values. F8

2007 Frequency Distributions
Count Col % Count Col % Count Col % Count Col % Count Col % Count Col % Count Col % Count Col % Count Col %Your College
Other ExLarge Colleges
2007 CCSSE Cohort
Part-Time Full-Time All Students (weighted data *)
Your CollegeOther ExLarge
Colleges2007 CCSSE
Cohort Your CollegeOther ExLarge
Colleges2007 CCSSE
Cohort
13f1. Frequency: Child care Do not know/N.A. 293 58.1 9685 58.8 53887 59.1 381 54.2 17056 58.7 117914 57.7 686 56.9 26673 58.7 172338 58.4Rarely/never 193 38.3 6142 37.3 33334 36.5 304 43.2 10527 36.3 74413 36.4 481 39.9 16759 36.9 107713 36.5
Sometimes 11 2.2 398 2.4 2198 2.4 8 1.1 866 3.0 6512 3.2 22 1.8 1199 2.6 8161 2.8Often 7 1.4 257 1.6 1808 2.0 10 1.4 584 2.0 5581 2.7 17 1.4 780 1.7 6882 2.3
Total 504 100.0 16482 100.0 91227 100.0 703 100.0 29033 100.0 204420 100.0 1205 100.0 45411 100.0 295093 100.013g1. Frequency: Financial aid Do not know/N.A. 210 42.0 5068 30.7 26007 28.5 214 30.4 6704 23.1 39275 19.2 459 38.3 12722 28.0 71998 24.4
advising Rarely/never 205 41.0 5906 35.8 30744 33.7 291 41.3 9274 31.9 60896 29.8 493 41.1 15632 34.4 94422 32.0Sometimes 58 11.6 3396 20.6 21049 23.1 121 17.2 7687 26.5 62121 30.4 161 13.4 10328 22.7 77950 26.4
Often 27 5.4 2139 13.0 13420 14.7 79 11.2 5380 18.5 42286 20.7 87 7.3 6781 14.9 50799 17.2Total 500 100.0 16509 100.0 91220 100.0 705 100.0 29045 100.0 204578 100.0 1200 100.0 45462 100.0 295170 100.0
13h1. Frequency: Computer lab Do not know/N.A. 139 27.6 3028 18.3 16969 18.6 108 15.2 2804 9.6 17561 8.6 286 23.7 6952 15.3 42423 14.4Rarely/never 186 37.0 4740 28.6 25370 27.8 207 29.2 5871 20.2 38823 19.0 416 34.5 11672 25.6 70905 24.0
Sometimes 109 21.7 4759 28.8 26107 28.6 188 26.5 9017 31.0 64080 31.3 280 23.2 13484 29.6 87883 29.7Often 69 13.7 4019 24.3 22915 25.1 206 29.1 11415 39.2 84311 41.2 225 18.6 13453 29.5 94300 31.9
Total 503 100.0 16546 100.0 91361 100.0 709 100.0 29107 100.0 204775 100.0 1207 100.0 45562 100.0 295511 100.013i1. Frequency: Student Do not know/N.A. 244 48.7 7333 44.8 40744 44.9 250 35.8 10529 36.5 69754 34.3 534 44.6 18887 41.8 118473 40.4
organizations Rarely/never 220 43.9 7254 44.3 39447 43.5 345 49.4 12860 44.6 89993 44.3 547 45.6 20053 44.4 128564 43.8Sometimes 28 5.6 1327 8.1 7760 8.6 69 9.9 3865 13.4 30281 14.9 83 7.0 4490 9.9 33122 11.3
Often 9 1.8 470 2.9 2747 3.0 35 5.0 1593 5.5 13265 6.5 34 2.8 1703 3.8 13235 4.5Total 501 100.0 16384 100.0 90698 100.0 699 100.0 28847 100.0 203293 100.0 1198 100.0 45133 100.0 293395 100.0
13j1. Frequency: Transfer credit Do not know/N.A. 191 38.0 5984 36.1 35032 38.3 160 22.6 8757 30.0 67375 32.8 399 33.0 15564 34.1 107011 36.1assistance Rarely/never 205 40.8 6375 38.5 33427 36.5 285 40.2 10557 36.2 72993 35.6 490 40.6 17211 37.7 106816 36.1
Sometimes 86 17.1 3162 19.1 17419 19.0 190 26.8 7072 24.3 46756 22.8 244 20.2 9494 20.8 60870 20.6Often 21 4.2 1036 6.3 5617 6.1 74 10.4 2767 9.5 18071 8.8 75 6.2 3336 7.3 21358 7.2
Total 503 100.0 16557 100.0 91495 100.0 709 100.0 29153 100.0 205195 100.0 1207 100.0 45605 100.0 296054 100.013k1. Frequency: Services to Do not know/N.A. 289 57.3 9944 60.0 55840 60.9 390 55.2 17178 58.9 119987 58.4 684 56.7 27227 59.6 177266 59.8
students with disabilities Rarely/never 177 35.1 5464 33.0 29167 31.8 256 36.3 9470 32.5 65829 32.0 428 35.5 14960 32.8 94616 31.9Sometimes 22 4.4 647 3.9 3752 4.1 28 4.0 1392 4.8 11194 5.4 51 4.2 1921 4.2 14026 4.7
Often 16 3.2 522 3.1 2893 3.2 32 4.5 1116 3.8 8510 4.1 44 3.6 1538 3.4 10635 3.6Total 504 100.0 16577 100.0 91652 100.0 706 100.0 29156 100.0 205520 100.0 1207 100.0 45645 100.0 296543 100.0
13a2. Satisfaction: Academic N.A. 187 38.3 3850 23.8 20213 22.5 129 18.5 4318 15.0 27144 13.4 375 31.9 9291 20.8 54267 18.6advising/planning Not at all 59 12.1 1741 10.8 9175 10.2 81 11.6 3554 12.3 21101 10.4 140 11.9 5087 11.4 29896 10.2
Somewhat 167 34.2 7032 43.4 37484 41.7 332 47.5 13803 48.0 94444 46.5 453 38.5 20122 45.0 127667 43.8Very 75 15.4 3567 22.0 22931 25.5 157 22.5 7107 24.7 60466 29.8 208 17.7 10254 22.9 79909 27.4
Total 488 100.0 16190 100.0 89803 100.0 699 100.0 28782 100.0 203155 100.0 1177 100.0 44754 100.0 291739 100.013b2. Satisfaction: Career N.A. 247 50.8 6817 42.5 39541 44.5 258 37.1 10435 36.6 74781 37.1 544 46.4 17970 40.6 119264 41.3
Counseling Not at all 63 13.0 2040 12.7 11641 13.1 98 14.1 3959 13.9 27911 13.9 156 13.3 5836 13.2 38898 13.5Somewhat 121 24.9 4743 29.6 24572 27.6 219 31.5 9251 32.5 63608 31.6 317 27.0 13534 30.5 84858 29.4
Very 55 11.3 2427 15.1 13116 14.8 120 17.3 4851 17.0 35052 17.4 155 13.2 6965 15.7 45895 15.9Total 486 100.0 16027 100.0 88870 100.0 695 100.0 28496 100.0 201352 100.0 1172 100.0 44305 100.0 288915 100.0
13c2. Satisfaction: Job placement N.A. 350 73.7 10760 67.9 59042 67.4 468 69.4 17545 62.4 117538 59.1 826 72.3 28871 66.0 181461 63.6assistance Not at all 60 12.6 2029 12.8 11336 12.9 84 12.5 3905 13.9 28074 14.1 144 12.6 5787 13.2 38424 13.5
Somewhat 45 9.5 2173 13.7 12185 13.9 96 14.2 4723 16.8 36739 18.5 126 11.0 6474 14.8 45503 16.0Very 20 4.2 878 5.5 5099 5.8 26 3.9 1956 7.0 16673 8.4 47 4.1 2642 6.0 19871 7.0
Total 475 100.0 15840 100.0 87662 100.0 674 100.0 28129 100.0 199024 100.0 1142 100.0 43773 100.0 285259 100.013d2. Satisfaction: Peer or other N.A. 302 62.8 8516 53.9 47755 54.5 378 55.3 12619 44.9 90713 45.6 699 60.4 22194 50.8 144777 50.7
tutoring Not at all 48 10.0 1489 9.4 8539 9.7 50 7.3 2697 9.6 19172 9.6 106 9.1 4155 9.5 27684 9.7Somewhat 89 18.5 3465 21.9 18328 20.9 156 22.8 7494 26.6 51126 25.7 230 19.9 10287 23.5 65409 22.9
Very 42 8.7 2336 14.8 13071 14.9 100 14.6 5324 18.9 38000 19.1 123 10.6 7070 16.2 47468 16.6Total 481 100.0 15806 100.0 87693 100.0 684 100.0 28134 100.0 199011 100.0 1158 100.0 43707 100.0 285338 100.0
13e2. Satisfaction: Skill labs (writing, N.A. 251 52.5 7208 45.7 40596 46.4 278 40.9 10328 36.8 72065 36.3 561 48.8 18537 42.5 119723 42.1math, etc.) Not at all 40 8.4 1215 7.7 6633 7.6 43 6.3 2147 7.6 14583 7.3 89 7.7 3351 7.7 21309 7.5
Somewhat 99 20.7 4197 26.6 22849 26.1 194 28.6 8719 31.1 62394 31.4 267 23.2 12306 28.2 80968 28.5Very 88 18.4 3151 20.0 17397 19.9 164 24.2 6880 24.5 49373 24.9 233 20.3 9415 21.6 62577 22.0
Total 478 100.0 15771 100.0 87475 100.0 679 100.0 28074 100.0 198415 100.0 1150 100.0 43609 100.0 284577 100.013f2. Satisfaction: Child care N.A. 390 81.9 12635 80.6 69427 79.7 554 81.7 21936 78.5 151219 76.6 938 81.9 34626 79.8 221643 78.2
Not at all 49 10.3 1455 9.3 8566 9.8 55 8.1 2540 9.1 19645 10.0 110 9.6 3999 9.2 28105 9.9Somewhat 21 4.4 1006 6.4 5613 6.4 48 7.1 2244 8.0 16204 8.2 60 5.3 3030 7.0 20506 7.2
Very 16 3.4 587 3.7 3533 4.1 21 3.1 1210 4.3 10369 5.3 38 3.3 1723 4.0 13092 4.6Total 476 100.0 15683 100.0 87139 100.0 678 100.0 27930 100.0 197437 100.0 1146 100.0 43378 100.0 283345 100.0
* Data was weighted according to the full-time/part-time population data from IPEDS.
*Regarding Blank Cells: Please see Table 1 for unweighted sample and population values. F9

2007 Frequency Distributions
Count Col % Count Col % Count Col % Count Col % Count Col % Count Col % Count Col % Count Col % Count Col %Your College
Other ExLarge Colleges
2007 CCSSE Cohort
Part-Time Full-Time All Students (weighted data *)
Your CollegeOther ExLarge
Colleges2007 CCSSE
Cohort Your CollegeOther ExLarge
Colleges2007 CCSSE
Cohort
13g2. Satisfaction: Financial aid N.A. 307 64.0 7247 46.0 37063 42.3 334 49.3 9783 34.8 57328 28.9 683 59.3 18289 41.9 103438 36.3advising Not at all 64 13.3 2226 14.1 11770 13.4 88 13.0 4090 14.6 26526 13.4 152 13.2 6227 14.3 38238 13.4
Somewhat 60 12.5 3468 22.0 19815 22.6 147 21.7 7488 26.7 56658 28.5 178 15.5 10352 23.7 72142 25.3Very 49 10.2 2822 17.9 18988 21.7 108 16.0 6733 24.0 58169 29.3 139 12.1 8746 20.1 71206 25.0
Total 480 100.0 15763 100.0 87636 100.0 677 100.0 28094 100.0 198681 100.0 1152 100.0 43614 100.0 285023 100.013h2. Satisfaction: Computer lab N.A. 213 44.4 4831 30.5 26143 29.8 189 27.5 4570 16.2 28455 14.3 450 38.9 11135 25.4 66170 23.2
Not at all 34 7.1 866 5.5 5039 5.7 34 4.9 1328 4.7 9592 4.8 74 6.4 2271 5.2 15331 5.4Somewhat 118 24.6 4253 26.8 23376 26.6 204 29.7 8383 29.8 60302 30.3 304 26.2 12201 27.9 80492 28.2
Very 115 24.0 5894 37.2 33235 37.9 261 37.9 13892 49.3 100879 50.6 330 28.5 18192 41.5 123608 43.3Total 480 100.0 15844 100.0 87793 100.0 688 100.0 28173 100.0 199228 100.0 1158 100.0 43800 100.0 285601 100.0
13i2. Satisfaction: Student N.A. 355 75.2 10601 68.0 58246 67.2 416 62.6 15830 57.0 105407 53.6 806 71.2 27647 64.2 172894 61.3organizations Not at all 45 9.5 1570 10.1 8905 10.3 66 9.9 3005 10.8 21153 10.8 109 9.7 4450 10.3 29462 10.4
Somewhat 58 12.3 2403 15.4 13675 15.8 137 20.6 6236 22.5 47088 23.9 169 15.0 7722 17.9 54510 19.3Very 14 3.0 1006 6.5 5854 6.8 46 6.9 2677 9.6 23076 11.7 48 4.2 3271 7.6 25159 8.9
Total 472 100.0 15580 100.0 86680 100.0 665 100.0 27748 100.0 196724 100.0 1133 100.0 43091 100.0 282025 100.013j2. Satisfaction: Transfer credit N.A. 285 60.1 8464 53.6 47411 54.1 256 37.9 12532 44.6 92041 46.3 604 53.0 22080 50.6 145068 50.8
assistance Not at all 57 12.0 1837 11.6 9885 11.3 79 11.7 3437 12.2 23845 12.0 136 11.9 5174 11.8 32875 11.5Somewhat 90 19.0 3458 21.9 18462 21.0 235 34.8 7586 27.0 51020 25.7 275 24.1 10330 23.7 65585 23.0
Very 42 8.9 2025 12.8 11949 13.6 105 15.6 4564 16.2 31999 16.1 126 11.0 6078 13.9 41761 14.6Total 474 100.0 15784 100.0 87707 100.0 675 100.0 28119 100.0 198905 100.0 1141 100.0 43661 100.0 285290 100.0
13k2. Satisfaction: Services to N.A. 368 77.5 12152 77.3 66921 76.6 521 77.3 20712 74.0 143414 72.3 884 77.4 33109 76.1 212230 74.6students with disabilities Not at all 39 8.2 1210 7.7 6846 7.8 42 6.2 2174 7.8 15213 7.7 87 7.6 3352 7.7 22063 7.8
Somewhat 33 6.9 1317 8.4 7597 8.7 58 8.6 2785 10.0 21776 11.0 85 7.5 3889 8.9 27732 9.8Very 35 7.4 1049 6.7 6028 6.9 53 7.9 2311 8.3 17924 9.0 86 7.5 3138 7.2 22310 7.8
Total 475 100.0 15728 100.0 87392 100.0 674 100.0 27982 100.0 198327 100.0 1142 100.0 43487 100.0 284335 100.013a3. Importance: Academic Not at all 105 21.9 2107 13.1 11738 13.2 58 8.4 2259 7.9 14897 7.4 203 17.5 5033 11.3 31072 10.7
advising/planning Somewhat 132 27.5 4369 27.2 25117 28.2 150 21.8 7801 27.3 57333 28.4 297 25.6 12138 27.3 82316 28.4Very 243 50.6 9590 59.7 52350 58.7 481 69.8 18511 64.8 129549 64.2 659 56.9 27247 61.3 176430 60.9
Total 480 100.0 16066 100.0 89205 100.0 689 100.0 28571 100.0 201779 100.0 1159 100.0 44418 100.0 289818 100.013b3. Importance: Career counseling Not at all 138 29.1 3472 21.9 21426 24.3 103 15.0 4780 16.9 35682 17.9 281 24.5 8866 20.2 61877 21.6
Somewhat 135 28.5 4131 26.1 24162 27.4 194 28.2 8025 28.4 60843 30.5 326 28.4 11841 27.0 82665 28.9Very 201 42.4 8252 52.0 42471 48.2 390 56.8 15422 54.6 103041 51.6 541 47.1 23137 52.8 141793 49.5
Total 474 100.0 15855 100.0 88059 100.0 687 100.0 28227 100.0 199566 100.0 1148 100.0 43845 100.0 286334 100.013c3. Importance: Job placement Not at all 233 50.0 5914 37.7 33957 39.1 245 36.5 8915 32.0 60684 30.8 514 45.6 15470 35.7 100318 35.5
assistance Somewhat 126 27.0 4289 27.4 22603 26.0 220 32.7 8808 31.6 60519 30.7 326 28.9 12508 28.9 79271 28.1Very 107 23.0 5465 34.9 30235 34.8 207 30.8 10130 36.4 75867 38.5 287 25.5 15337 35.4 102882 36.4
Total 466 100.0 15668 100.0 86795 100.0 672 100.0 27853 100.0 197070 100.0 1127 100.0 43314 100.0 282471 100.013d3. Importance: Peer or other Not at all 195 41.6 4959 31.7 29137 33.6 199 29.5 6916 24.8 50839 25.8 427 37.6 12699 29.4 85797 30.4
tutoring Somewhat 129 27.5 4676 29.9 25451 29.3 209 31.0 8988 32.3 64950 32.9 324 28.6 13297 30.7 87370 30.9Very 145 30.9 6005 38.4 32144 37.1 267 39.6 11954 42.9 81374 41.3 382 33.7 17260 39.9 109250 38.7
Total 469 100.0 15640 100.0 86732 100.0 675 100.0 27858 100.0 197163 100.0 1133 100.0 43256 100.0 282417 100.013e3. Importance: Skill labs (writing, Not at all 166 35.9 4203 27.0 24632 28.5 148 22.0 5690 20.5 41181 21.0 351 31.4 10629 24.7 71225 25.3
math, etc.) Somewhat 118 25.5 4616 29.7 25675 29.7 202 30.1 8901 32.1 65643 33.4 303 27.0 13170 30.6 88351 31.4Very 178 38.5 6747 43.3 36117 41.8 322 47.9 13179 47.5 89602 45.6 466 41.6 19279 44.8 121816 43.3
Total 462 100.0 15566 100.0 86424 100.0 672 100.0 27770 100.0 196426 100.0 1120 100.0 43078 100.0 281393 100.013f3. Importance: Child care Not at all 289 62.0 8604 55.6 48493 56.4 369 55.2 14603 53.0 101587 52.1 673 59.8 23397 54.7 152490 54.5
Somewhat 76 16.3 2767 17.9 14617 17.0 121 18.1 5419 19.7 38006 19.5 190 16.9 7931 18.5 50669 18.1Very 101 21.7 4103 26.5 22939 26.7 178 26.6 7527 27.3 55375 28.4 262 23.3 11469 26.8 76640 27.4
Total 466 100.0 15474 100.0 86049 100.0 668 100.0 27549 100.0 194968 100.0 1124 100.0 42797 100.0 279799 100.013g3. Importance: Financial aid Not at all 204 43.9 4371 28.1 23504 27.1 164 24.6 5449 19.6 33241 16.9 422 37.6 10802 25.1 63868 22.6
advising Somewhat 86 18.5 2696 17.3 14657 16.9 142 21.3 5053 18.2 35836 18.2 218 19.4 7605 17.6 49642 17.6Very 175 37.6 8497 54.6 48634 56.0 362 54.2 17314 62.2 127915 64.9 483 43.0 24694 57.3 168927 59.8
Total 465 100.0 15564 100.0 86795 100.0 668 100.0 27816 100.0 196992 100.0 1123 100.0 43101 100.0 282437 100.013h3. Importance: Computer lab Not at all 166 35.8 3090 19.6 17812 20.4 113 16.7 3055 10.9 19648 9.9 332 29.5 7195 16.5 45319 16.0
Somewhat 107 23.1 3907 24.8 21652 24.8 201 29.6 6935 24.8 48557 24.5 284 25.2 10806 24.8 70212 24.7Very 191 41.2 8736 55.5 47718 54.7 364 53.7 17989 64.3 129804 65.6 510 45.3 25495 58.6 168195 59.3
Total 464 100.0 15733 100.0 87182 100.0 678 100.0 27979 100.0 198009 100.0 1127 100.0 43496 100.0 283726 100.013i3. Importance: Student Not at all 265 57.7 6954 45.2 39958 46.6 260 39.8 9862 35.9 68648 35.3 574 51.9 17872 42.0 116632 41.8
organizations Somewhat 130 28.3 5069 32.9 27770 32.4 226 34.6 10283 37.5 74539 38.3 335 30.3 14703 34.5 97406 34.9Very 64 13.9 3373 21.9 17942 20.9 168 25.7 7293 26.6 51401 26.4 196 17.7 10020 23.5 64812 23.2
Total 459 100.0 15396 100.0 85670 100.0 654 100.0 27438 100.0 194588 100.0 1105 100.0 42596 100.0 278850 100.0* Data was weighted according to the full-time/part-time population data from IPEDS.
*Regarding Blank Cells: Please see Table 1 for unweighted sample and population values. F10

2007 Frequency Distributions
Count Col % Count Col % Count Col % Count Col % Count Col % Count Col % Count Col % Count Col % Count Col %Your College
Other ExLarge Colleges
2007 CCSSE Cohort
Part-Time Full-Time All Students (weighted data *)
Your CollegeOther ExLarge
Colleges2007 CCSSE
Cohort Your CollegeOther ExLarge
Colleges2007 CCSSE
Cohort
13j3. Importance: Transfer credit Not at all 176 38.0 4428 28.3 26855 30.9 102 15.2 5709 20.5 46119 23.4 343 30.5 11117 25.7 78845 27.9assistance Somewhat 95 20.5 3281 21.0 17981 20.7 144 21.4 6080 21.8 43828 22.3 233 20.8 9220 21.3 60686 21.5
Very 192 41.5 7936 50.7 41970 48.3 427 63.4 16058 57.7 106884 54.3 546 48.7 22924 53.0 142794 50.6Total 463 100.0 15645 100.0 86806 100.0 673 100.0 27847 100.0 196831 100.0 1122 100.0 43261 100.0 282325 100.0
13k3. Importance: Services to Not at all 239 51.1 6704 43.1 38021 44.0 262 39.4 10640 38.4 73651 37.6 533 47.3 17855 41.5 115903 41.2students with disabilities Somewhat 71 15.2 2262 14.5 12326 14.3 124 18.6 4437 16.0 31747 16.2 183 16.3 6484 15.1 42659 15.2
Very 158 33.8 6583 42.3 36063 41.7 279 42.0 12616 45.6 90618 46.2 410 36.4 18672 43.4 122547 43.6Total 468 100.0 15549 100.0 86410 100.0 665 100.0 27693 100.0 196016 100.0 1126 100.0 43011 100.0 281110 100.0
14a. Working full-time Not likely 198 38.5 6274 37.0 37074 39.6 277 38.5 12581 42.3 90309 43.2 474 38.5 18129 38.9 124250 41.1Somewhat likely 101 19.6 3494 20.6 19721 21.1 174 24.2 6105 20.5 44024 21.1 260 21.1 9579 20.5 63770 21.1
Likely 102 19.8 3187 18.8 16592 17.7 133 18.5 5294 17.8 36047 17.2 239 19.4 8615 18.5 53011 17.5Very likely 113 22.0 4001 23.6 20165 21.6 135 18.8 5761 19.4 38712 18.5 258 21.0 10321 22.1 61254 20.3
Total 514 100.0 16956 100.0 93552 100.0 719 100.0 29741 100.0 209092 100.0 1230 100.0 46643 100.0 302286 100.014b. Caring for dependents Not likely 263 51.7 8298 49.1 45586 48.9 378 52.6 14877 50.1 104017 49.8 635 52.0 23010 49.5 148342 49.2
Somewhat likely 107 21.0 3608 21.3 20851 22.3 163 22.7 6554 22.1 46744 22.4 263 21.6 10041 21.6 67583 22.4Likely 71 13.9 2730 16.2 14477 15.5 113 15.7 4789 16.1 33370 16.0 177 14.5 7504 16.1 47465 15.7
Very likely 68 13.4 2268 13.4 12386 13.3 65 9.0 3454 11.6 24590 11.8 146 12.0 5960 12.8 38204 12.7Total 509 100.0 16904 100.0 93300 100.0 719 100.0 29674 100.0 208721 100.0 1222 100.0 46514 100.0 301594 100.0
14c. Academically unprepared Not likely 313 61.1 9565 56.8 55525 59.8 410 57.2 15670 53.0 117656 56.6 734 59.9 25741 55.6 175597 58.4Somewhat likely 111 21.7 3913 23.2 20823 22.4 173 24.1 7370 24.9 49833 24.0 275 22.5 11022 23.8 69348 23.1
Likely 55 10.7 2131 12.7 10554 11.4 91 12.7 4187 14.2 26123 12.6 139 11.4 6104 13.2 35610 11.9Very likely 33 6.4 1222 7.3 6012 6.5 43 6.0 2348 7.9 14409 6.9 77 6.3 3466 7.5 19925 6.6
Total 512 100.0 16831 100.0 92914 100.0 717 100.0 29575 100.0 208021 100.0 1226 100.0 46332 100.0 300479 100.014d. Lack of finances Not likely 237 46.7 5680 33.6 30743 33.0 258 36.1 10101 34.1 67702 32.5 527 43.3 15700 33.8 98406 32.7
Somewhat likely 112 22.0 3916 23.2 21416 23.0 163 22.8 6696 22.6 46701 22.4 272 22.3 10672 23.0 68585 22.8Likely 69 13.6 3079 18.2 16815 18.0 142 19.9 5462 18.4 39112 18.8 190 15.6 8495 18.3 55391 18.4
Very likely 90 17.7 4216 25.0 24263 26.0 152 21.3 7348 24.8 54916 26.3 230 18.9 11585 24.9 78934 26.2Total 508 100.0 16891 100.0 93237 100.0 715 100.0 29607 100.0 208431 100.0 1218 100.0 46453 100.0 301315 100.0
14e. Transfer to a 4-year college or Not likely 204 40.3 5407 32.0 34625 37.1 120 16.8 6798 22.9 59673 28.6 398 32.7 13441 28.9 102239 33.9university Somewhat likely 77 15.2 2951 17.5 16532 17.7 82 11.5 4348 14.7 33735 16.2 170 14.0 7699 16.6 51547 17.1
Likely 76 15.0 3129 18.5 16081 17.2 128 17.9 5715 19.3 38580 18.5 194 15.9 8703 18.7 53230 17.7Very likely 149 29.4 5402 32.0 25996 27.9 386 53.9 12816 43.2 76813 36.8 454 37.3 16643 35.8 94504 31.3
Total 506 100.0 16889 100.0 93234 100.0 716 100.0 29677 100.0 208801 100.0 1216 100.0 46486 100.0 301521 100.015. How supportive are your Not very 26 5.1 733 4.3 3889 4.2 32 4.5 1367 4.6 8493 4.1 60 4.9 2060 4.4 12437 4.1
friends of your attending this Somewhat 111 21.6 3222 19.0 17014 18.2 148 20.6 5942 20.0 37868 18.1 262 21.3 9028 19.3 54926 18.2college? Quite a bit 154 30.0 4929 29.1 26762 28.6 221 30.8 8603 28.9 59952 28.7 372 30.2 13539 29.0 86704 28.7
Extremely 223 43.4 8079 47.6 45927 49.1 317 44.2 13826 46.5 102873 49.2 537 43.6 22028 47.2 148347 49.1Total 514 100.0 16963 100.0 93592 100.0 718 100.0 29738 100.0 209186 100.0 1230 100.0 46655 100.0 302414 100.0
16. How supportive is your Not very 12 2.3 563 3.3 2805 3.0 22 3.1 1012 3.4 5791 2.8 32 2.6 1559 3.4 8789 2.9immediate family of your Somewhat 68 13.3 2013 11.9 10505 11.3 85 11.9 3205 10.8 20249 9.7 157 12.9 5351 11.5 31878 10.6attending this college? Quite a bit 109 21.3 3610 21.3 19566 21.0 144 20.1 5922 20.0 39990 19.2 256 21.0 9703 20.9 61054 20.2
Extremely 322 63.0 10738 63.4 60483 64.8 464 64.9 19494 65.8 142532 68.3 778 63.6 29911 64.3 199870 66.3Total 511 100.0 16924 100.0 93359 100.0 715 100.0 29633 100.0 208562 100.0 1223 100.0 46524 100.0 301591 100.0
17a. Complete a certificate program Not a goal 283 56.5 8973 54.2 49018 53.5 421 59.8 16099 55.1 104861 50.9 691 57.5 24800 54.4 154897 52.2Secondary goal 89 17.8 3090 18.7 16870 18.4 157 22.3 5980 20.5 41497 20.1 231 19.2 8811 19.3 56719 19.1
Primary goal 129 25.7 4482 27.1 25650 28.0 126 17.9 7137 24.4 59734 29.0 279 23.2 12012 26.3 85111 28.7Total 501 100.0 16545 100.0 91538 100.0 704 100.0 29216 100.0 206092 100.0 1201 100.0 45623 100.0 296727 100.0
17b. Obtain an Associate degree Not a goal 200 39.9 4049 24.3 22339 24.2 237 33.4 5133 17.4 33256 16.0 455 37.8 10052 21.9 62353 20.9Secondary goal 139 27.7 3624 21.7 18046 19.6 241 33.9 7212 24.5 45640 22.0 358 29.7 10402 22.6 61363 20.5
Primary goal 162 32.3 9009 54.0 51897 56.2 232 32.7 17072 58.0 128416 61.9 391 32.4 25517 55.5 175091 58.6Total 501 100.0 16682 100.0 92282 100.0 710 100.0 29417 100.0 207312 100.0 1204 100.0 45971 100.0 298807 100.0
17c. Transfer to a 4-year college or Not a goal 193 39.0 4147 24.8 28973 31.5 44 6.2 3241 11.0 42136 20.3 339 28.3 9260 20.1 81399 27.3university Secondary goal 64 12.9 3389 20.3 20699 22.5 76 10.6 4705 15.9 41166 19.9 146 12.2 8662 18.8 63842 21.4
Primary goal 238 48.1 9176 54.9 42335 46.0 595 83.2 21575 73.1 123945 59.8 713 59.5 28165 61.1 153051 51.3Total 495 100.0 16712 100.0 92007 100.0 715 100.0 29521 100.0 207247 100.0 1197 100.0 46087 100.0 298291 100.0
17d. Obtain or update job-related Not a goal 178 35.7 5730 34.7 29995 32.8 317 45.0 10595 36.3 65817 32.0 463 38.7 16028 35.2 95686 32.3skills Secondary goal 146 29.3 4453 27.0 23868 26.1 232 33.0 8493 29.1 57659 28.0 365 30.5 12617 27.7 79735 26.9
Primary goal 174 34.9 6340 38.4 37588 41.1 155 22.0 10079 34.6 82211 40.0 368 30.8 16911 37.1 120919 40.8Total 498 100.0 16523 100.0 91451 100.0 704 100.0 29167 100.0 205687 100.0 1196 100.0 45557 100.0 296341 100.0
* Data was weighted according to the full-time/part-time population data from IPEDS.
*Regarding Blank Cells: Please see Table 1 for unweighted sample and population values. F11

2007 Frequency Distributions
Count Col % Count Col % Count Col % Count Col % Count Col % Count Col % Count Col % Count Col % Count Col %Your College
Other ExLarge Colleges
2007 CCSSE Cohort
Part-Time Full-Time All Students (weighted data *)
Your CollegeOther ExLarge
Colleges2007 CCSSE
Cohort Your CollegeOther ExLarge
Colleges2007 CCSSE
Cohort
17e. Self-improvement/personal Not a goal 123 24.6 4358 26.2 23666 25.7 217 30.6 8544 29.2 56325 27.3 319 26.5 12476 27.2 78208 26.3enjoyment Secondary goal 147 29.4 5581 33.5 30782 33.5 295 41.5 10534 36.0 74414 36.0 401 33.3 15747 34.4 102928 34.6
Primary goal 230 46.0 6697 40.3 37468 40.8 198 27.9 10201 34.8 75694 36.7 483 40.2 17594 38.4 116516 39.1Total 500 100.0 16636 100.0 91916 100.0 710 100.0 29279 100.0 206433 100.0 1203 100.0 45818 100.0 297652 100.0
17f. Change careers Not a goal 294 59.5 8652 52.1 45761 49.8 524 73.9 19139 65.4 126521 61.3 765 64.2 25993 56.8 162460 54.6Secondary goal 76 15.4 2902 17.5 15568 16.9 85 12.0 4451 15.2 30887 15.0 170 14.3 7623 16.7 48037 16.1
Primary goal 124 25.1 5057 30.4 30533 33.2 100 14.1 5664 19.4 48965 23.7 257 21.5 12145 26.5 87016 29.2Total 494 100.0 16611 100.0 91862 100.0 709 100.0 29254 100.0 206373 100.0 1192 100.0 45761 100.0 297512 100.0
18a. My own income/savings Not a source 86 17.1 3836 22.9 25094 27.1 212 30.2 10202 34.7 79481 38.5 256 21.3 12479 27.1 95738 32.0Minor source 91 18.1 3913 23.4 22752 24.6 233 33.2 9392 31.9 67420 32.6 276 22.9 12149 26.4 83755 28.0Major source 326 64.8 9007 53.8 44591 48.2 257 36.6 9803 33.3 59745 28.9 672 55.8 21478 46.6 119223 39.9
Total 503 100.0 16756 100.0 92437 100.0 702 100.0 29397 100.0 206646 100.0 1203 100.0 46106 100.0 298716 100.018b. Parent or spouse/significant Not a source 262 52.1 9396 56.5 53817 58.7 215 30.5 11645 39.7 92993 45.1 544 45.2 23228 50.6 157690 53.1
other's income/savings Minor source 68 13.5 2797 16.8 14433 15.7 123 17.4 5867 20.0 42077 20.4 178 14.8 8232 17.9 52654 17.7Major source 173 34.4 4450 26.7 23411 25.5 368 52.1 11826 40.3 71267 34.5 483 40.1 14412 31.4 86743 29.2
Total 503 100.0 16643 100.0 91661 100.0 706 100.0 29338 100.0 206337 100.0 1205 100.0 45872 100.0 297088 100.018c. Employer contributions Not a source 445 89.4 13478 81.4 73618 80.6 637 91.7 25468 87.6 180815 88.3 1073 90.1 38125 83.7 247823 83.9
Minor source 25 5.0 1483 9.0 7789 8.5 40 5.8 2239 7.7 14703 7.2 63 5.3 3871 8.5 23491 8.0Major source 28 5.6 1594 9.6 9879 10.8 18 2.6 1372 4.7 9201 4.5 55 4.7 3578 7.9 24082 8.2
Total 498 100.0 16555 100.0 91286 100.0 695 100.0 29079 100.0 204719 100.0 1191 100.0 45574 100.0 295396 100.018d. Grants & scholarships Not a source 427 86.1 11729 70.5 59591 65.0 489 69.6 15784 53.8 90079 43.6 963 80.8 29605 64.6 165304 55.6
Minor source 19 3.8 1366 8.2 8382 9.1 74 10.5 3341 11.4 27338 13.2 71 6.0 4278 9.3 32779 11.0M j 50 10 1 3534 21 3 23766 25 9 140 19 9 10206 34 8 89045 43 1 158 13 2 11955 26 1 99261 33 4Major source 50 10.1 3534 21.3 23766 25.9 140 19.9 10206 34.8 89045 43.1 158 13.2 11955 26.1 99261 33.4
Total 496 100.0 16629 100.0 91739 100.0 703 100.0 29331 100.0 206462 100.0 1192 100.0 45838 100.0 297345 100.018e. Student loans (bank, etc.) Not a source 458 92.0 13610 82.1 71614 78.3 650 93.0 22347 76.4 140566 68.2 1101 92.3 36527 79.9 217701 73.4
Minor source 16 3.2 1087 6.6 6337 6.9 25 3.6 2334 8.0 18441 9.0 40 3.3 3232 7.1 23335 7.9Major source 24 4.8 1886 11.4 13559 14.8 24 3.4 4572 15.6 46971 22.8 52 4.4 5957 13.0 55556 18.7
Total 498 100.0 16583 100.0 91510 100.0 699 100.0 29253 100.0 205978 100.0 1193 100.0 45716 100.0 296591 100.018f. Public assistance Not a source 462 93.1 15147 91.4 82805 90.6 629 89.7 25612 87.7 177383 86.2 1097 92.0 41148 90.1 262674 88.7
Minor source 16 3.2 636 3.8 3534 3.9 26 3.7 1525 5.2 11888 5.8 40 3.4 1968 4.3 14040 4.7Major source 18 3.6 789 4.8 5071 5.5 46 6.6 2070 7.1 16439 8.0 54 4.6 2557 5.6 19552 6.6
Total 496 100.0 16572 100.0 91410 100.0 701 100.0 29207 100.0 205710 100.0 1191 100.0 45672 100.0 296266 100.019. Proprietary (private) school or No response 485 91.3 15678 90.0 87012 90.8 692 93.9 28252 92.9 199719 93.8 1168 92.1 43540 91.0 284457 92.1
training program Response 46 8.7 1737 10.0 8807 9.2 45 6.1 2155 7.1 13207 6.2 100 7.9 4282 9.0 24288 7.9Total 531 100.0 17415 100.0 95819 100.0 737 100.0 30407 100.0 212926 100.0 1268 100.0 47822 100.0 308745 100.0
Public vocational-technical No response 463 87.2 15659 89.9 85722 89.5 700 95.0 28244 92.9 196646 92.4 1137 89.7 43497 91.0 279845 90.6school Response 68 12.8 1756 10.1 10097 10.5 37 5.0 2163 7.1 16280 7.6 131 10.3 4325 9.0 28900 9.4
Total 531 100.0 17415 100.0 95819 100.0 737 100.0 30407 100.0 212926 100.0 1268 100.0 47822 100.0 308745 100.0Another community or technical college No response 354 66.7 13499 77.5 73440 76.6 605 82.1 25888 85.1 179660 84.4 907 71.6 38360 80.2 246774 79.9
Response 177 33.3 3916 22.5 22379 23.4 132 17.9 4519 14.9 33266 15.6 361 28.4 9462 19.8 61971 20.1Total 531 100.0 17415 100.0 95819 100.0 737 100.0 30407 100.0 212926 100.0 1268 100.0 47822 100.0 308745 100.0
Four year college or university No response 379 71.4 12451 71.5 69816 72.9 644 87.4 24801 81.6 175512 82.4 969 76.5 35835 74.9 237881 77.0Response 152 28.6 4964 28.5 26003 27.1 93 12.6 5606 18.4 37414 17.6 299 23.5 11987 25.1 70864 23.0
Total 531 100.0 17415 100.0 95819 100.0 737 100.0 30407 100.0 212926 100.0 1268 100.0 47822 100.0 308745 100.0None No response 345 65.0 10305 59.2 55202 57.6 284 38.5 12801 42.1 87252 41.0 717 56.6 25419 53.2 155598 50.4
Response 186 35.0 7110 40.8 40617 42.4 453 61.5 17606 57.9 125674 59.0 551 43.4 22403 46.8 153147 49.6Total 531 100.0 17415 100.0 95819 100.0 737 100.0 30407 100.0 212926 100.0 1268 100.0 47822 100.0 308745 100.0
20. When do you plan to take classes at this college again?
I will accomplish my goals this term and will not be
returning35 6.9 1707 10.1 9187 9.9 100 14.1 4372 14.8 30511 14.7 112 9.2 5454 11.8 35895 11.9
I have no current plan to return 13 2.6 750 4.5 4760 5.1 26 3.7 1349 4.6 11809 5.7 35 2.9 2083 4.5 16338 5.4
Within the next 12 months 371 72.9 11504 68.3 62180 66.9 479 67.4 19006 64.4 131375 63.3 866 71.1 30999 66.9 195638 65.1
Uncertain 90 17.7 2885 17.1 16877 18.1 106 14.9 4774 16.2 33992 16.4 205 16.8 7788 16.8 52568 17.5
Total 509 100.0 16846 100.0 93004 100.0 711 100.0 29501 100.0 207687 100.0 1218 100.0 46324 100.0 300439 100.0
* Data was weighted according to the full-time/part-time population data from IPEDS.
*Regarding Blank Cells: Please see Table 1 for unweighted sample and population values. F12

2007 Frequency Distributions
Count Col % Count Col % Count Col % Count Col % Count Col % Count Col % Count Col % Count Col % Count Col %Your College
Other ExLarge Colleges
2007 CCSSE Cohort
Part-Time Full-Time All Students (weighted data *)
Your CollegeOther ExLarge
Colleges2007 CCSSE
Cohort Your CollegeOther ExLarge
Colleges2007 CCSSE
Cohort
21. At this college, in what range is your Pass/fail classes only 4 0.8 133 0.8 735 0.8 3 0.4 102 0.3 737 0.4 8 0.7 293 0.6 1859 0.6overall college grade average? Do not have a GPA at
this school 26 5.1 615 3.7 3420 3.7 21 3.0 532 1.8 3185 1.5 54 4.4 1392 3.0 8309 2.8
C- or lower 28 5.5 491 2.9 2302 2.5 27 3.9 596 2.0 4223 2.0 60 5.0 1208 2.6 6962 2.3C 58 11.4 1379 8.2 6932 7.5 83 11.9 2465 8.4 16805 8.1 140 11.5 3825 8.3 23446 7.8
B- to C+ 69 13.5 3166 18.8 16026 17.3 152 21.7 6148 20.9 42703 20.6 195 16.1 9033 19.5 56099 18.7B 119 23.3 3930 23.4 20790 22.4 189 27.0 7774 26.4 52658 25.4 297 24.5 11295 24.4 70812 23.6
A- to B+ 115 22.5 4362 25.9 25291 27.2 157 22.5 8154 27.7 59241 28.6 273 22.5 12271 26.5 83075 27.7A 92 18.0 2747 16.3 17316 18.7 67 9.6 3685 12.5 27921 13.5 187 15.4 6937 15.0 49357 16.5
Total 511 100.0 16823 100.0 92812 100.0 699 100.0 29456 100.0 207473 100.0 1215 100.0 46253 100.0 299918 100.022. When do you most frequently take
classes at this college?Day classes (morning or
afternoon) 293 58.8 8561 51.6 49386 53.7 624 88.5 24661 84.6 179680 87.3 818 68.4 28842 63.2 202940 68.2
Evening classes 200 40.2 7792 47.0 41629 45.3 81 11.5 4444 15.2 25721 12.5 370 30.9 16395 35.9 92552 31.1Weekend classes 5 1.0 226 1.4 981 1.1 0 0.0 54 0.2 348 0.2 8 0.7 425 0.9 1939 0.7
Total 498 100.0 16579 100.0 91996 100.0 705 100.0 29159 100.0 205749 100.0 1197 100.0 45662 100.0 297430 100.023. How many TOTAL credit hours None 64 12.7 2354 14.0 14680 15.8 61 8.7 2612 8.9 19024 9.2 138 11.4 5632 12.2 38979 13.0
have you earned at this college, 1-14 credits 190 37.6 5828 34.6 33588 36.2 187 26.7 8668 29.4 60818 29.3 412 34.2 15196 32.8 99478 33.2not counting the courses you 15-29 credits 96 19.0 3259 19.4 17382 18.7 166 23.7 6645 22.5 49908 24.1 247 20.5 9476 20.5 62819 20.9are currently taking this term? 30-44 credits 66 13.1 2116 12.6 10991 11.8 111 15.9 4980 16.9 32882 15.8 168 14.0 6515 14.1 40358 13.5
45-60 credits 46 9.1 1648 9.8 8321 9.0 105 15.0 4067 13.8 27627 13.3 132 11.0 5159 11.1 32424 10.8Over 60 credits 43 8.5 1616 9.6 7889 8.5 70 10.0 2520 8.5 17233 8.3 108 9.0 4296 9.3 25909 8.6Total 505 100.0 16821 100.0 92851 100.0 700 100.0 29492 100.0 207492 100.0 1205 100.0 46273 100.0 299968 100.0
24 N N 103 19 4 2948 16 9 15531 16 2 96 13 0 3679 12 1 22493 10 6 220 17 4 7251 15 2 42751 13 824. None No response 103 19.4 2948 16.9 15531 16.2 96 13.0 3679 12.1 22493 10.6 220 17.4 7251 15.2 42751 13.8Response 428 80.6 14467 83.1 80288 83.8 641 87.0 26728 87.9 190433 89.4 1048 82.6 40571 84.8 265994 86.2
Total 531 100.0 17415 100.0 95819 100.0 737 100.0 30407 100.0 212926 100.0 1268 100.0 47822 100.0 308745 100.0High school No response 521 98.1 17069 98.0 92991 97.0 727 98.6 29987 98.6 210289 98.8 1246 98.3 46976 98.2 301541 97.7
Response 10 1.9 346 2.0 2828 3.0 10 1.4 420 1.4 2637 1.2 22 1.7 846 1.8 7204 2.3Total 531 100.0 17415 100.0 95819 100.0 737 100.0 30407 100.0 212926 100.0 1268 100.0 47822 100.0 308745 100.0
Vocational/technical school No response 521 98.1 17238 99.0 94782 98.9 732 99.3 30195 99.3 210985 99.1 1249 98.5 47388 99.1 305581 99.0Response 10 1.9 177 1.0 1037 1.1 5 0.7 212 0.7 1941 0.9 19 1.5 434 0.9 3164 1.0
Total 531 100.0 17415 100.0 95819 100.0 737 100.0 30407 100.0 212926 100.0 1268 100.0 47822 100.0 308745 100.0Another community or No response 511 96.2 16958 97.4 93224 97.3 721 97.8 29804 98.0 209245 98.3 1227 96.7 46691 97.6 301788 97.7technical college Response 20 3.8 457 2.6 2595 2.7 16 2.2 603 2.0 3681 1.7 41 3.3 1131 2.4 6957 2.3
Total 531 100.0 17415 100.0 95819 100.0 737 100.0 30407 100.0 212926 100.0 1268 100.0 47822 100.0 308745 100.04- year college/ university No response 496 93.4 16449 94.5 91256 95.2 719 97.6 29527 97.1 207796 97.6 1201 94.7 45605 95.4 297035 96.2
Response 35 6.6 966 5.5 4563 4.8 18 2.4 880 2.9 5130 2.4 67 5.3 2217 4.6 11710 3.8Total 531 100.0 17415 100.0 95819 100.0 737 100.0 30407 100.0 212926 100.0 1268 100.0 47822 100.0 308745 100.0
Other No response 519 97.7 16755 96.2 92589 96.6 702 95.3 29301 96.4 205906 96.7 1229 97.0 46039 96.3 298490 96.7Response 12 2.3 660 3.8 3230 3.4 35 4.7 1106 3.6 7020 3.3 39 3.0 1783 3.7 10255 3.3
Total 531 100.0 17415 100.0 95819 100.0 737 100.0 30407 100.0 212926 100.0 1268 100.0 47822 100.0 308745 100.025. How many classes are you None 397 78.3 13532 80.6 75342 81.1 612 86.7 25219 85.6 179827 86.7 981 81.0 38065 82.4 250405 83.4
presently taking at OTHER 1 class 36 7.1 981 5.8 5278 5.7 22 3.1 653 2.2 4517 2.2 71 5.8 2108 4.6 12537 4.2institutions? 2 classes 41 8.1 1134 6.8 5854 6.3 13 1.8 514 1.7 3044 1.5 74 6.1 2307 5.0 12794 4.3
3 classes 13 2.6 700 4.2 3612 3.9 13 1.8 786 2.7 4710 2.3 28 2.3 1682 3.6 9688 3.24 classes or more 20 3.9 452 2.7 2852 3.1 46 6.5 2292 7.8 15412 7.4 58 4.8 2061 4.5 14782 4.9
Total 507 100.0 16799 100.0 92938 100.0 706 100.0 29464 100.0 207510 100.0 1212 100.0 46223 100.0 300206 100.026 Would you recommend this Yes 488 96.4 15991 95.4 88121 94.9 670 95.0 27774 94.4 193230 93.3 1161 96.0 43859 95.0 282277 94.2
college to a friend or family member? No 18 3.6 778 4.6 4688 5.1 35 5.0 1658 5.6 13929 6.7 48 4.0 2296 5.0 17471 5.8Total 506 100.0 16769 100.0 92809 100.0 705 100.0 29432 100.0 207159 100.0 1210 100.0 46154 100.0 299748 100.0
27. How would you evaluate your Poor 7 1.4 215 1.3 1162 1.3 10 1.4 409 1.4 2996 1.4 17 1.4 606 1.3 4023 1.3entire educational experience at Fair 55 10.8 2190 13.0 11417 12.3 83 11.7 3868 13.1 26464 12.8 135 11.1 6023 13.0 37559 12.5this college? Good 259 51.1 9642 57.4 51765 55.7 428 60.5 17195 58.4 117206 56.5 656 54.1 26678 57.7 168131 56.0
Excellent 186 36.7 4754 28.3 28615 30.8 186 26.3 7990 27.1 60840 29.3 405 33.4 12920 27.9 90519 30.1Total 507 100.0 16801 100.0 92959 100.0 707 100.0 29462 100.0 207506 100.0 1212 100.0 46227 100.0 300232 100.0
28. Do you have children who live Yes 118 23.3 5040 30.1 33826 36.4 96 13.6 5527 18.8 49156 23.7 245 20.2 12062 26.1 93464 31.2with you? No 388 76.7 11728 69.9 58984 63.6 609 86.4 23892 81.2 158002 76.3 965 79.8 34085 73.9 206291 68.8
Total 506 100.0 16768 100.0 92810 100.0 705 100.0 29419 100.0 207158 100.0 1210 100.0 46147 100.0 299755 100.0
* Data was weighted according to the full-time/part-time population data from IPEDS.
*Regarding Blank Cells: Please see Table 1 for unweighted sample and population values. F13

2007 Frequency Distributions
Count Col % Count Col % Count Col % Count Col % Count Col % Count Col % Count Col % Count Col % Count Col %Your College
Other ExLarge Colleges
2007 CCSSE Cohort
Part-Time Full-Time All Students (weighted data *)
Your CollegeOther ExLarge
Colleges2007 CCSSE
Cohort Your CollegeOther ExLarge
Colleges2007 CCSSE
Cohort
29. Mark your age group. 18 to 19 81 16.1 2466 14.8 14198 15.4 298 42.1 9838 33.5 70008 33.920 to 21 97 19.3 3020 18.1 15153 16.4 216 30.6 8675 29.6 56257 27.222 to 24 76 15.1 3015 18.1 14631 15.9 86 12.2 4482 15.3 27372 13.325 to 29 63 12.5 2827 16.9 14850 16.1 64 9.1 2963 10.1 21060 10.230 to 39 66 13.1 2782 16.7 16721 18.1 25 3.5 2112 7.2 18737 9.140 to 49 45 8.9 1698 10.2 10887 11.8 13 1.8 928 3.2 9310 4.550 to 64 55 10.9 787 4.7 5072 5.5 5 0.7 288 1.0 3518 1.7
65+ 20 4.0 99 0.6 765 0.8 0 0.0 50 0.2 296 0.1Total 503 100.0 16694 100.0 92277 100.0 707 100.0 29336 100.0 206558 100.0
30. Sex: Male 244 48.1 6776 40.4 34068 36.7 312 44.0 12742 43.3 86283 41.6Female 263 51.9 10014 59.6 58824 63.3 397 56.0 16700 56.7 121115 58.4
Total 507 100.0 16790 100.0 92892 100.0 709 100.0 29442 100.0 207398 100.031. Marital status Yes 181 35.8 4572 27.2 29545 31.8 57 8.0 3604 12.2 31805 15.3 326 26.9 10165 22.0 74986 25.0
No 325 64.2 12219 72.8 63298 68.2 652 92.0 25846 87.8 175570 84.7 886 73.1 36037 78.0 224953 75.0Total 506 100.0 16791 100.0 92843 100.0 709 100.0 29450 100.0 207375 100.0 1212 100.0 46201 100.0 299939 100.0
32. Is English your native (first) Yes 409 81.0 12859 76.6 80638 86.8 587 82.8 21859 74.3 182303 87.9 987 81.6 35029 75.8 263295 87.7language? No 96 19.0 3931 23.4 12275 13.2 122 17.2 7580 25.7 25103 12.1 223 18.4 11165 24.2 36797 12.3
Total 505 100.0 16790 100.0 92913 100.0 709 100.0 29439 100.0 207406 100.0 1210 100.0 46194 100.0 300092 100.033. Are you an international Yes 31 6.2 1398 8.4 5501 6.0 47 6.7 3293 11.2 13489 6.5
student or foreign national? No 471 93.8 15289 91.6 86785 94.0 658 93.3 25997 88.8 192857 93.5Total 502 100.0 16687 100.0 92286 100.0 705 100.0 29290 100.0 206346 100.0
34. What is your racial identification? (Mark American Indian or other 5 1 0 155 0 9 1590 1 7 8 1 1 270 0 9 4012 2 0only one) Native American 5 1.0 155 0.9 1590 1.7 8 1.1 270 0.9 4012 2.0
Asian, Asian American, or Pacific Islander 36 7.3 1601 9.7 4602 5.0 76 10.9 3482 12.0 11490 5.6
Native Hawaiian 0 0.0 33 0.2 287 0.3 3 0.4 55 0.2 694 0.3
Black or African American 17 3.4 2178 13.1 11701 12.8 26 3.7 3385 11.6 23972 11.7
White, Non-Hispanic 290 58.6 8341 50.3 58424 63.7 412 58.9 14288 49.1 134906 65.7
Hispanic, Latino, Spanish 107 21.6 3351 20.2 11552 12.6 126 18.0 5908 20.3 21700 10.6
Other 40 8.1 909 5.5 3611 3.9 48 6.9 1736 6.0 8485 4.1
Total 495 100.0 16568 100.0 91767 100.0 699 100.0 29124 100.0 205259 100.035. What is the highest academic
credential you have earned? None 20 4.0 396 2.4 3017 3.3 4 0.6 511 1.8 3490 1.7 35 2.9 981 2.2 8082 2.7
High school diploma or GED 309 62.3 10933 66.4 60287 66.3 618 88.2 24215 83.5 170395 83.5 841 70.6 32829 72.4 216012 73.3
Vocational / technical certificate 46 9.3 1585 9.6 10327 11.4 34 4.9 1638 5.6 14388 7.0 94 7.9 3742 8.2 28276 9.6
Associate degree 48 9.7 1545 9.4 8327 9.2 37 5.3 1631 5.6 10754 5.3 98 8.3 3657 8.1 22432 7.6
Bachelor's degree 42 8.5 1547 9.4 6902 7.6 5 0.7 817 2.8 4230 2.1 71 6.0 3223 7.1 15302 5.2
Master's / doctoral / professional degree 31 6.3 454 2.8 2119 2.3 3 0.4 189 0.7 889 0.4 52 4.4 932 2.1 4442 1.5
Total 496 100.0 16460 100.0 90979 100.0 701 100.0 29001 100.0 204146 100.0 1191 100.0 45365 100.0 294545 100.0
* Data was weighted according to the full-time/part-time population data from IPEDS.
*Regarding Blank Cells: Please see Table 1 for unweighted sample and population values. F14

2007 Frequency Distributions
Count Col % Count Col % Count Col % Count Col % Count Col % Count Col % Count Col % Count Col % Count Col %Your College
Other ExLarge Colleges
2007 CCSSE Cohort
Part-Time Full-Time All Students (weighted data *)
Your CollegeOther ExLarge
Colleges2007 CCSSE
Cohort Your CollegeOther ExLarge
Colleges2007 CCSSE
Cohort
36m. Highest level of education: mother Not a high school graduate 81 17.2 2435 15.7 13033 15.2 72 10.9 3396 12.6 21589 11.4 171 15.2 6196 14.5 37369 13.6
High school diploma or GED 109 23.1 4596 29.6 28806 33.6 140 21.1 7265 26.9 60147 31.9 254 22.5 12201 28.6 90724 32.9
Some college, did not complete degree 102 21.7 2548 16.4 13826 16.1 166 25.1 4712 17.5 32518 17.2 257 22.8 7145 16.8 45638 16.6
Associate degree 41 8.7 1581 10.2 8907 10.4 55 8.3 3037 11.3 23702 12.6 97 8.6 4518 10.6 31419 11.4
Bachelor's degree 63 13.4 2184 14.0 10493 12.2 123 18.6 4488 16.6 26237 13.9 170 15.0 6386 15.0 35423 12.9
Master's degree / First professional 35 7.4 1073 6.9 5424 6.3 58 8.8 2116 7.8 12896 6.8 89 7.9 3086 7.2 17829 6.5
Doctorate degree 5 1.1 192 1.2 803 0.9 7 1.1 376 1.4 1858 1.0 12 1.1 554 1.3 2612 0.9
Unknown 35 7.4 936 6.0 4497 5.2 41 6.2 1602 5.9 9843 5.2 79 7.0 2534 5.9 14392 5.2
Total 471 100.0 15545 100.0 85789 100.0 662 100.0 26992 100.0 188790 100.0 1129 100.0 42621 100.0 275406 100.036f. Highest level of education: father Not a high school
graduate 96 20.2 2688 17.2 15617 18.0 65 9.8 3689 13.6 27454 14.4 192 16.9 6828 15.9 45901 16.5
High school diploma or GED 93 19.5 4059 25.9 26996 31.2 123 18.5 6829 25.2 60454 31.6 219 19.2 11020 25.7 88014 31.6
Some college, did not 91 19 1 2209 14 1 11988 13 8 150 22 6 4053 14 9 28522 14 9 230 20 2 6183 14 4 39731 14 3complete degree 91 19.1 2209 14.1 11988 13.8 150 22.6 4053 14.9 28522 14.9 230 20.2 6183 14.4 39731 14.3
Associate degree 27 5.7 1011 6.5 5709 6.6 47 7.1 2105 7.8 15303 8.0 70 6.1 2969 6.9 20238 7.3
Bachelor's degree 69 14.5 2387 15.2 11026 12.7 121 18.2 4527 16.7 26072 13.6 179 15.7 6748 15.7 36133 13.0
Master's degree / Ist professional 46 9.7 1353 8.6 6083 7.0 83 12.5 2692 9.9 13772 7.2 120 10.6 3904 9.1 19452 7.0
Doctorate degree 16 3.4 524 3.3 2208 2.5 20 3.0 838 3.1 4201 2.2 37 3.2 1410 3.3 6611 2.4
Unknown 38 8.0 1422 9.1 6977 8.1 56 8.4 2388 8.8 15348 8.0 93 8.1 3835 8.9 22328 8.0
Total 476 100.0 15653 100.0 86604 100.0 665 100.0 27121 100.0 191126 100.0 1139 100.0 42897 100.0 278408 100.0
* Data was weighted according to the full-time/part-time population data from IPEDS.
*Regarding Blank Cells: Please see Table 1 for unweighted sample and population values. F15

2007 CCSSE Special Focus Questions Frequencies
This report summarizes the observed frequencies of occurrence (counts and percentages) of the values for the five 2007 CCSSE special focus questions included with The Community College Student Report. Data are presented for all, part-time, and full-time students at your college, a comparison group, and the 2007 CCSSE Cohort.

CCSSE Special Focus Questions
Response
By the end of my FIRST FOUR WEEKS at this college, I had met with an advisor to discuss my educational goals.
Your College Other ExLarge Colleges 2007 CCSSE Participants
Part-Time Full-Time All Students (weighted) Part-Time Full-Time
All Students (weighted) Part-Time Full-Time
All Students (weighted)
Count % Count % Count % Count % Count % Count % Count % Count % Count %
Yes 120 27% 264 44% 340 33% 3436 38% 7678 48% 10271 41% 16444 39% 48797 49% 61213 43%
No, I met with an advisor by the end of my first four weeks at this college, but we did not discuss my educational goals 21 5% 26 4% 48 5% 670 7% 1187 7% 1868 7% 3015 7% 7497 8% 10369 7%
No, I did not meet with an advisor by the end of my first four weeks at this college 204 47% 155 26% 417 40% 2878 32% 3801 24% 7331 29% 13404 32% 22569 23% 39176 28%
No, I have discussed educational goals with an advisor, but it did not happen by the end of my first four weeks at this college 55 13% 99 17% 144 14% 1245 14% 2148 13% 3412 14% 5488 13% 12068 12% 17735 13%
I do not recall 38 9% 55 9% 92 9% 898 10% 1329 8% 2353 9% 4106 10% 8392 8% 12974 9%
Total 438 100% 599 100% 1041 100% 9127 100% 16143 100% 25235 100% 42457 100% 99323 100% 141467 100%
Response
By the end of my FIRST FOUR WEEKS at this college, I had completed an initial assessment test to determine which reading, writing, and math courses I should enroll in.
Your College Other ExLarge Colleges 2007 CCSSE Participants
Part-Time Full-Time All Students (weighted) Part-Time Full-Time
All Students (weighted) Part-Time Full-Time
All Students (weighted)
Count % Count % Count % Count % Count % Count % Count % Count % Count %
Yes 169 39% 366 62% 475 46% 4682 52% 10131 63% 13902 56% 21591 52% 61225 62% 78239 56%
No 237 54% 188 32% 489 47% 3597 40% 4559 29% 9012 36% 16780 40% 28631 29% 49516 35%
I do not recall 29 7% 38 6% 68 7% 718 8% 1273 8% 1994 8% 3507 8% 8473 9% 11995 9%
Total 435 100% 592 100% 1032 100% 8997 100% 15963 100% 24907 100% 41878 100% 98329 100% 139749 100%

CCSSE Special Focus Questions
Response
By the end of my FIRST FOUR WEEKS at this college, my instructors had used teaching techniques that encouraged me to become actively involved in the classroom.
Your College Other ExLarge Colleges 2007 CCSSE Participants
Part-Time Full-Time All Students (weighted) Part-Time Full-Time
All Students (weighted) Part-Time Full-Time
All Students (weighted)
Count % Count % Count % Count % Count % Count % Count % Count % Count %
Very often 151 35% 166 28% 337 33% 2699 30% 4550 28% 7332 29% 13613 32% 30374 31% 44711 32%
Often 128 29% 183 31% 309 30% 2702 30% 5167 32% 7698 31% 12634 30% 31585 32% 43242 31%
Sometimes 106 24% 176 30% 269 26% 2489 27% 4642 29% 7013 28% 10928 26% 27413 28% 37453 27%
Never 28 6% 29 5% 61 6% 587 6% 901 6% 1551 6% 2658 6% 5065 5% 8111 6%
I do not recall 22 5% 42 7% 59 6% 600 7% 787 5% 1505 6% 2454 6% 4475 5% 7387 5%
Total 435 100% 596 100% 1035 100% 9077 100% 16047 100% 25098 100% 42287 100% 98912 100% 140904 100%
Response
How satisfied were you with the quality of your college's orientation course or program for new students?
Your College Other ExLarge Colleges 2007 CCSSE Participants
Part-Time Full-Time All Students (weighted) Part-Time Full-Time
All Students (weighted) Part-Time Full-Time
All Students (weighted)
Count % Count % Count % Count % Count % Count % Count % Count % Count %
Very Satisfied 77 18% 99 17% 180 17% 1904 21% 3826 24% 5530 22% 9373 22% 25663 26% 33836 24%
Somewhat Satisfied 122 28% 230 39% 324 32% 3222 36% 6855 43% 9539 38% 13713 33% 40138 41% 50574 36%
Not at all Satisfied 23 5% 44 7% 62 6% 662 7% 1574 10% 2045 8% 2697 6% 8317 8% 10130 7%
Have not attended an orientation course or program 212 49% 217 37% 464 45% 3182 35% 3667 23% 7726 31% 16066 38% 24037 24% 45102 32%
Total 434 100% 590 100% 1030 100% 8970 100% 15922 100% 24839 100% 41849 100% 98155 100% 139642 100%

CCSSE Special Focus Questions
Response
Rate your overall satisfaction with this college's processes for working with new students - including the admissions process, the financial aid office, new student assessment, your first class registration experience, etc.
Your College Other ExLarge Colleges 2007 CCSSE Participants
Part-Time Full-Time All Students (weighted) Part-Time Full-Time
All Students (weighted) Part-Time Full-Time
All Students (weighted)
Count % Count % Count % Count % Count % Count % Count % Count % Count %
Very Satisfied 139 32% 182 31% 326 32% 2648 30% 4840 30% 7407 30% 14000 34% 34754 35% 48232 35%
Somewhat Satisfied 244 57% 319 54% 572 56% 4707 53% 8245 52% 12991 53% 20901 50% 48178 49% 69148 50%
Somewhat Dissatisfied 34 8% 75 13% 96 9% 1182 13% 2133 13% 3277 13% 5175 12% 11468 12% 16666 12%
Very Dissatisfied 12 3% 15 3% 28 3% 382 4% 667 4% 1052 4% 1613 4% 3651 4% 5213 4%
Total 429 100% 591 100% 1022 100% 8919 100% 15885 100% 24727 100% 41689 100% 98051 100% 139259 100%

2007 Institutional Report Benchmarks of Effective Educational Practice
1For returning participants, the college’s most recent year of participation is included in data analyses. For example, if a college participated in 2006 and 2007, only the 2007 data would be used in the 3-year cohort.
2007 Institutional Report: Benchmarks of Effective Educational Practice Page 1 of 5
Community College Survey of Student Engagement
of benchmark scores.1 This cohort is referred to as the 2007 CCSSE Cohort throughout all reports and documentation.
This new approach increases the total number of institutions and students contributing to the national dataset, which in turn increases the reliability of the overall results. In addition, the 3-year cohort approach minimizes the impact, in any given year, of statewide consortia participation.
The benchmarks are briefly described below.
Active and Collaborative LearningStudents learn more when they are actively involved in their education and have opportunities to think about and apply what they are learning in different settings. Through collaboration with others to solve problems or master challenging content, students develop valuable skills that prepare them to deal with the kinds of situations and problems they will encounter in the workplace, community, and their personal lives. The seven survey items that contribute to this benchmark are these:
During the current school year, how often have you Asked questions in class or contributed to class discussions Made a class presentation Worked with other students on projects during class Worked with classmates outside of class to prepare class assignments Tutored or taught other students (paid or voluntary) Participated in a community-based project as a part of a regular course Discussed ideas from your readings or classes with others outside of class (students, family members, co-workers, etc.)
The Community College Survey of Student Engagement
(CCSSE) utilizes a set of five benchmarks of effective
educational practice in community colleges. These benchmarks allow
member institutions, with missions focused on teaching, learning, and
student success, to gauge and monitor their performance in areas that are truly central to
their work. In addition, participating colleges have the opportunity to make appropriate and
useful comparisons between their performance and that of other groups of similar colleges.
Community colleges differ significantly — even dramatically — from one another on variables including size, location, resources, enrollment patterns, and student characteristics. It is important to take these differences into account when interpreting benchmark scores — especially when making institutional comparisons. Furthermore, the Community College Survey of Student Engagement has adopted an official policy on “Responsible Uses of CCSSE Data.” Please review the policy, which is provided as an appendix to this report.
CCSSE’s Benchmarks
The five benchmarks encompass 38 engagement items from the CCSSE survey that reflect many of the most important aspects of the student experience. These institutional practices and student behaviors are some of the most powerful contributors to effective teaching, learning, student retention, and student success.
CCSSE has again used this year a 3-year cohort of participating colleges (2005 through 2007) in all of its data analyses, including the computation

2007 Institutional Report: Benchmarks of Effective Educational Practice Page 2 of 5
Student EffortStudents’ own behaviors contribute significantly to their learning and the likelihood that they will successfully attain their educational goals. “Time on task” is a key variable, and there are a variety of settings and means through which students may apply themselves to the learning process. Associated with this benchmark are eight survey items indicating student behavior in these terms:
During the current school year, how often have you Prepared two or more drafts of a paper or assignment before turning it in Worked on a paper or project that required integrating ideas or information from various sources Come to class without completing readings or assignments (reverse coded) Used peer or other tutoring Used skill labs Used a computer lab
During the current school year How many books did you read on your own (not assigned) for personal enjoyment or academic enrichment How many hours did you spend in a typical week preparing for class (studying, reading, writing, rehearsing or other activities related to your program)
Academic ChallengeChallenging intellectual and creative work is central to student learning and collegiate quality. Ten items from The Community College Student Report correspond to components of academic challenge including the nature and amount of assigned academic work, the complexity of cognitive tasks presented to students, and the standards faculty members use to evaluate student performance. Specifically, Academic Challenge includes the following items:
During the current school year, how often have you Worked harder than you thought you could to meet an instructor’s standards or expectations
How much does your coursework at this college emphasize
Analyzing the basic elements of an idea, experience, or theory Synthesizing and organizing ideas, information, or experiences in new ways
Making judgments about the value or soundness of information, arguments, or methods Applying theories or concepts to practical problems or in new situations Using information you have read or heard to perform a new skill
During the current school year How many assigned textbooks, manuals, books, or book-length packs of course readings did you read How many papers or reports of any length did you write To what extent have your examinations challenged you to do your best work
How much does this college emphasize Encouraging you to spend significant amounts of time studying
Student-Faculty InteractionThe more contact students have with their teachers, the more likely they are to learn effectively and to persist toward achievement of their educational goals. Personal interaction with faculty members strengthens students’ connections to the college and helps them focus on their academic progress. Working with an instructor on a project or serving with faculty members on a college committee lets students see first-hand how experts identify and solve practical problems. Through such interactions, faculty members become role models, mentors, and guides for continuous, lifelong learning. The six items used in this benchmark are about students’ experience in these areas:
During the current school year, how often have you Used email to communicate with an instructor Discussed grades or assignments with an instructor Talked about career plans with an instructor or advisor Discussed ideas from your readings or classes with instructors outside of class Received prompt feedback (written or oral) from instructors on your performance Worked with instructors on activities other than coursework
Support for LearnersStudents perform better and are more satisfied at colleges that are committed to their success and

2007 Institutional Report: Benchmarks of Effective Educational Practice Page 3 of 5
cultivate positive working and social relationships among different groups on campus. Community college students also benefit from services targeted to assist them with academic and career planning, academic skill development, and other issues that may affect both learning and retention. The seven survey items contributing to this benchmark include the following:
How much does this college emphasize Providing the support you need to help you succeed at this college Encouraging contact among students from different economic, social, and racial or ethnic backgrounds Helping you cope with your non-academic responsibilities (work, family, etc.) Providing the support you need to thrive socially Providing the financial support you need to afford your education
During the current school year, how often have you Used academic advising/ planning services Used career counseling services
Understanding and Using Benchmarks
What are benchmark scores?Benchmark scores provide a useful way to look at an institution’s data by creating groups of conceptually related items that address key areas of student engagement. As described above, these areas are active and collaborative learning, student effort, academic challenge, student-faculty interaction, and support for learners. These are five areas that have been shown through research to be important in high-quality educational practice. Through examining empirical results of factor analytic models and with input from its Technical Advisory Panel, CCSSE grouped together survey items related to each of these areas.
In order to create the benchmark scores, the survey items associated with each benchmark are first rescaled so that all items are on the same scale (0 to 1). Next, the benchmark scores are computed by averaging the scores of the related survey items. Finally, the scores are standardized around the mean of the 3-year cohort so that respondents’ scores have a mean of 50, weighted by full- and part-time attendance status, and a standard deviation of 25.
Benchmark scores are then computed by averaging the scores on the associated items.
Rescaling scores increases the value of the scores in the following two ways: 1) all of the benchmarks are on the same scale, enabling comparisons across benchmarks; and 2) the scores provide information about how an individual institution is doing relative to other institutions.
Having scores on the same scale makes comparisons across benchmarks more meaningful than comparisons using raw scores. The limitation of using raw scores is illustrated by the fact that there are some aspects of student engagement that will nearly always take place with greater frequency than others. For example, students may typically engage in activities such as homework more frequently than they engage in talking with instructors about career plans, so raw scores will always be higher for homework than for talking with instructors. Without knowing what a typical score is for each of these engagement areas, college faculty and staff have little basis for determining where their institutional strengths and weaknesses may lie.
Knowing that all benchmarks are on the same scale makes it immediately obvious that a particular college’s scores are either above or below those for other participating schools. Knowing that the mean is at 50 across all students in the sample enhances the score’s usefulness for benchmarking, as the score contains information about whether an institution’s performance is better or worse than average − and how much better or worse. For example, benchmark scores of 55 on Student Effort and 42 on Student-Faculty Interaction would indicate to a college that the institution is performing relatively better in regard to Student Effort than in regard to Student-Faculty Interaction. Further, the benchmark scores allow the college to understand that the results are above the average for participating institutions on one benchmark and below average on the other. Thus the data may be used both to identify relative strengths and to zero in on areas in which the college may need to improve.
What can a college do with the benchmarks?There are a number of ways that college leaders might choose to use the benchmarks and the comparison information provided in this report. Examples are

2007 Institutional Report: Benchmarks of Effective Educational Practice Page 4 of 5
provided below:
A starting point for understanding your campus findings — Multiple pages of survey data presented at the individual item level may be daunting. Where does one start when there are over 150 items addressing a variety of topics? The benchmark scores provide a manageable starting point for reviewing and understanding your CCSSE data.
For example, suppose that you have a college mission statement that expresses a commitment to faculty involvement with students. But you note that the college’s student-faculty interaction benchmark score is lower than those for the comparison group and for the 2007 CCSSE Cohort. Therefore, you decide that this is the area you want to target for improvement. To help you understand more precisely what the differences are, CCSSE suggests that you drill down to the item level, look at the percentage of students responding in each category, and compare the responses to those in your comparison groups. This will allow you to identify the specific items that are problem areas, and then target these areas, creating appropriate initiatives to build student-faculty interaction.
Understanding the big picture — CCSSE reports data for important breakout groups for each benchmark, enabling college leaders to review how their colleges are performing overall, by part- and full-time attendance status, and by credit hours earned. This view provides the big picture of student engagement and involvement.
Talking points — Benchmark scores are designed to help colleges investigate student engagement in key areas that — according to research — contribute to effective educational practice (Chickering and Gamson, 1987). Colleges can use these scores to prompt dialogue about effective teaching and learning. Scores likewise can be used to focus attention on programs and policies that may be in need of improvement – and on those worthy of celebration.
Institutional comparisons — Until recently, community and technical colleges have had little opportunity to make valid and appropriate cross-institutional comparisons, particularly with regard to important dimensions of teaching and learning.
Many national surveys do not employ strict sampling protocols, thus making comparisons less meaningful and potentially inappropriate. CCSSE employs a strict sampling protocol which allows for appropriate cross-institutional comparisons. CCSSE controls the sample selection, thereby ensuring that all class sections have equal chances of being selected. What this means is that no college has the opportunity to skew the results by sampling only highly engaging classes, and therefore, every college is on the same playing field.
Colleges can target areas that need improvement both by considering their own institutional aspirations and priorities and by comparing their benchmark scores with groups of similar colleges. After identifying other colleges that are high performers on a particular benchmark, a college can initiate communication to explore the educational practices that may be contributing to enhanced effectiveness at benchmark institutions.
Subsequent analyses — Any or all of the benchmark scores can be used as variables in subsequent analyses using the CCSSE student record data for your college, which was provided with your Institutional Report. The benchmark scores can also be used in conjunction with traditional institutional data, such as grades and demographic data, to understand the factors that really matter in student success.
POLICY STATEMENT ON RESPONSIBLE USES OF CCSSE DATA
In accessing the CCSSE database and using the CCSSE data search tools, the user agrees to the following CCSSE policy positions regarding responsible and appropriate uses of the survey data.
CCSSE supports uses of survey data for benchmarking effective educational practices, for targeting and monitoring progress in quality improvement, and for public reporting in ways that serve to increase understanding of collegiate quality and to support institutional efforts to improve undergraduate student learning and retention. CCSSE especially supports public reporting of student engagement results in ways that enable thoughtful, responsible institutional comparisons while encouraging and celebrating institutional diversity.

2007 Institutional Report: Benchmarks of Effective Educational Practice Page 5 of 5
CCSSE does not support the use of student engagement survey results for the purpose of ranking community and technical colleges. Such uses would obscure complex dimensions of institutional performance and student behavior.
Because of differences in institutional focus, student characteristics, and resources, comparisons of survey results from two single institutions serve little constructive purpose and may in fact be wholly inappropriate. CCSSE’s data search tools therefore provide group comparisons, using aggregated data from at least three institutions.
Appropriate interpretation of survey data will take into account the institutional context (mission, size, urbanicity, program mix, and so on) as well as the characteristics of a particular institution’s student population – for example, the proportions of full- vs. part-time students, traditional college-age vs. non-traditional-age students, students who are academically under-prepared as they enter the institution, and students with various educational goals.

Benchmark Reports This section contains nine reports presenting data for all students, for students by enrollment status (e.g., part- and full-time), and for students by credit hour status (0 to 29 and 30+ credits). The first report, on page B1, is a Summary Table of scores for all students on each of the five benchmarks: 1) Active and Collaborative Learning, 2) Student Effort, 3) Academic Challenge, 4) Student-Faculty Interactions, and 5) Support for Learners for your institution, a comparison group, and the 2007 CCSSE Cohort. The CCSSE Benchmark Deciles Report, on page B2, highlights the five benchmark deciles for all students at your institution. Deciles are percentile scores that divide the frequency of benchmark scores into ten equal groups. A percentile represents the point at or below which a specified percentage of the college benchmark scores fall. For example, the 60th percentile represents the point at or below which 60 percent of the college benchmark scores fall for the respective comparison group. Deciles are listed for the 2007 CCSSE Cohort and for each appropriate breakdown according to college size and urbanicity. To help you gauge your college’s performance relative to the comparison groups, the shaded area on the tables indicate the deciles that are less than or equal to your benchmark scores. The third report – Bar Charts and Benchmark Item Composition - uses bar charts to represent the data provided in the summary table, for all students for each benchmark (pp. B3 - B7). In addition, it provides a listing of items from The Community College Student Report making up that particular benchmark (e.g., Active and Collaborative Learning), the means associated with each item and whether your college’s mean is above or below the mean for the comparison group as well as the 2007 CCSSE Cohort. The next series of reports, found on pages B8 through B19, contain the same reports described above broken down by enrollment status for your institution, a comparison group, and the 2007 CCSSE Cohort. The final set of reports, pages B20 through B31, highlight data for all students by credit hour status for your institution, a comparison group, and the 2007 CCSSE Cohort. Please note that for consortium reports, there are no deciles reports; hence, the page numbers will not correspond to those listed above.

B1

B2

Active and Collaborative Learning Bar Charts and Benchmark Item Composition - All Students
description
Description - Students learn more when they are actively involved in their education and have opportunities to think about and apply what they are learning in different settings. Through collaborating with others to solve problems or master challenging content, students develop valuable skills that prepare them to deal with the kinds of situations and problems they will encounter in the workplace, the community, and their personal lives.
Benchmark Scores
Palomar College ExLarge Colleges 2007 CCSSE Cohort
All Students 45.5 49.2 50.0
[NOTE: Directional arrows in charts highlight those items where your college falls notably above or below the mean of your comparison group. The items listed are significant at p < .001 with an effect size greater than or equal to .2.]
B3

Student Effort Bar Charts and Benchmark Item Composition - All Students
description
Description - Students' own behaviors contribute significantly to their learning and the likelihood that they will successfully attain their educational goals.
Benchmark Scores
Palomar College ExLarge Colleges 2007 CCSSE Cohort
All Students 43.0 49.2 50.0
[NOTE: Directional arrows in charts highlight those items where your college falls notably above or below the mean of your comparison group. The items listed are significant at p < .001 with an effect size greater than or equal to .2.]
B4

Academic Challenge Bar Charts and Benchmark Item Composition - All Students
description
Description - Challenging intellectual and creative work is central to student learning and collegiate quality. Ten survey items address the nature and amount of assigned academic work, the complexity of cognitive tasks presented to students, and the standards faculty members use to evaluate student performance.
Benchmark Scores
Palomar College ExLarge Colleges 2007 CCSSE Cohort
All Students 44.4 49.5 50.0
[NOTE: Directional arrows in charts highlight those items where your college falls notably above or below the mean of your comparison group. The items listed are significant at p < .001 with an effect size greater than or equal to .2.]
B5

Student-Faculty Interaction Bar Charts and Benchmark Item Composition - All Students
description
Description - In general, the more contact students have with their teachers, the more likely they are to learn effectively and persist toward achievement of their educational goals. Through such interactions, faculty members become role models, mentors, and guides for continuous, lifelong learning.
Benchmark Scores
Palomar College ExLarge Colleges 2007 CCSSE Cohort
All Students 44.4 48.3 50.0
[NOTE: Directional arrows in charts highlight those items where your college falls notably above or below the mean of your comparison group. The items listed are significant at p < .001 with an effect size greater than or equal to .2.]
B6

Support for Learners Bar Charts and Benchmark Item Composition - All Students
description
Description - Students perform better and are more satisfied at colleges that are committed to their success and cultivate positive working and social relationships among different groups on campus.
Benchmark Scores
Palomar College ExLarge Colleges 2007 CCSSE Cohort
All Students 45.3 48.9 50.0
[NOTE: Directional arrows in charts highlight those items where your college falls notably above or below the mean of your comparison group. The items listed are significant at p < .001 with an effect size greater than or equal to .2.]
B7

B8

B9
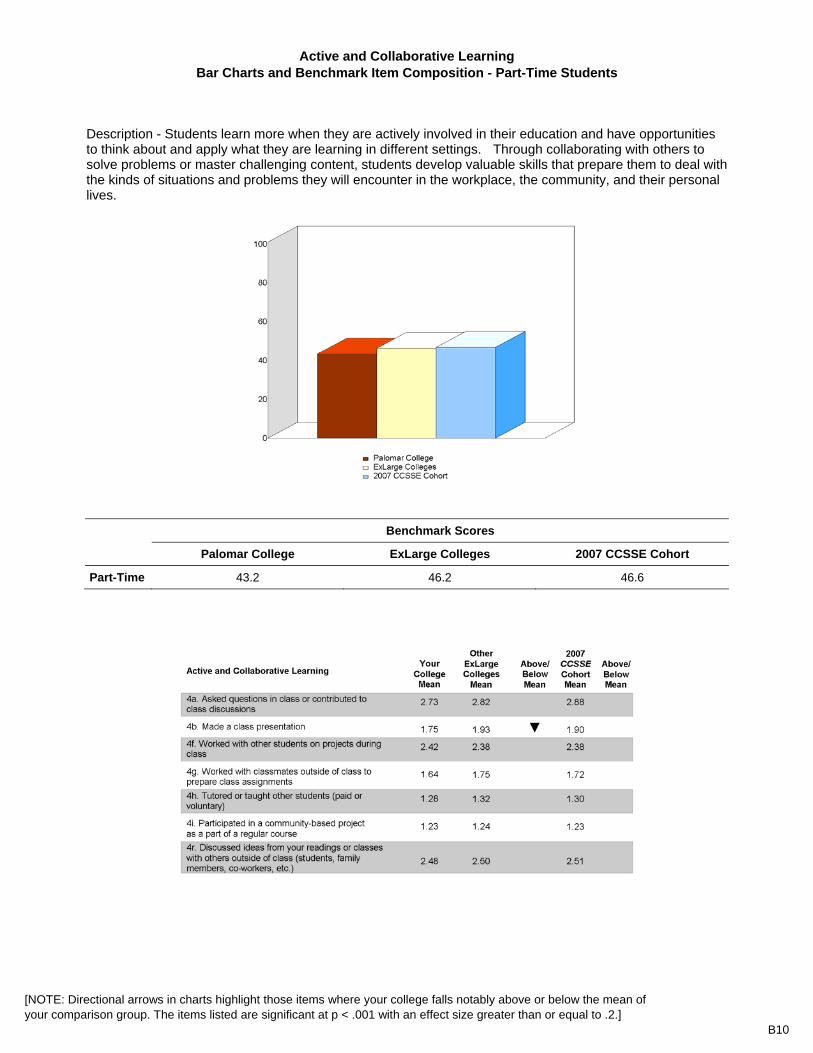
Active and Collaborative Learning Bar Charts and Benchmark Item Composition - Part-Time Students
description
Description - Students learn more when they are actively involved in their education and have opportunities to think about and apply what they are learning in different settings. Through collaborating with others to solve problems or master challenging content, students develop valuable skills that prepare them to deal with the kinds of situations and problems they will encounter in the workplace, the community, and their personal lives.
Benchmark Scores
Palomar College ExLarge Colleges 2007 CCSSE Cohort
Part-Time 43.2 46.2 46.6
[NOTE: Directional arrows in charts highlight those items where your college falls notably above or below the mean of your comparison group. The items listed are significant at p < .001 with an effect size greater than or equal to .2.]
B10

Student Effort Bar Charts and Benchmark Item Composition - Part-Time Students
description
Description - Students' own behaviors contribute significantly to their learning and the likelihood that they will successfully attain their educational goals.
Benchmark Scores
Palomar College ExLarge Colleges 2007 CCSSE Cohort
Part-Time 39.8 46.0 46.8
[NOTE: Directional arrows in charts highlight those items where your college falls notably above or below the mean of your comparison group. The items listed are significant at p < .001 with an effect size greater than or equal to .2.]
B11

Academic Challenge Bar Charts and Benchmark Item Composition - Part-Time Students
description
Description - Challenging intellectual and creative work is central to student learning and collegiate quality. Ten survey items address the nature and amount of assigned academic work, the complexity of cognitive tasks presented to students, and the standards faculty members use to evaluate student performance.
Benchmark Scores
Palomar College ExLarge Colleges 2007 CCSSE Cohort
Part-Time 40.5 46.4 46.4
[NOTE: Directional arrows in charts highlight those items where your college falls notably above or below the mean of your comparison group. The items listed are significant at p < .001 with an effect size greater than or equal to .2.]
B12

Student-Faculty Interaction Bar Charts and Benchmark Item Composition - Part-Time Students
description
Description - In general, the more contact students have with their teachers, the more likely they are to learn effectively and persist toward achievement of their educational goals. Through such interactions, faculty members become role models, mentors, and guides for continuous, lifelong learning.
Benchmark Scores
Palomar College ExLarge Colleges 2007 CCSSE Cohort
Part-Time 40.7 45.5 46.8
[NOTE: Directional arrows in charts highlight those items where your college falls notably above or below the mean of your comparison group. The items listed are significant at p < .001 with an effect size greater than or equal to .2.]
B13

Support for Learners Bar Charts and Benchmark Item Composition - Part-Time Students
description
Description - Students perform better and are more satisfied at colleges that are committed to their success and cultivate positive working and social relationships among different groups on campus.
Benchmark Scores
Palomar College ExLarge Colleges 2007 CCSSE Cohort
Part-Time 42.9 47.0 48.4
[NOTE: Directional arrows in charts highlight those items where your college falls notably above or below the mean of your comparison group. The items listed are significant at p < .001 with an effect size greater than or equal to .2.]
B14

Active and Collaborative Learning Bar Charts and Benchmark Item Composition - Full-Time Students
description
Description - Students learn more when they are actively involved in their education and have opportunities to think about and apply what they are learning in different settings. Through collaborating with others to solve problems or master challenging content, students develop valuable skills that prepare them to deal with the kinds of situations and problems they will encounter in the workplace, the community, and their personal lives.
Benchmark Scores
Palomar College ExLarge Colleges 2007 CCSSE Cohort
Full-Time 50.6 54.9 56.2
[NOTE: Directional arrows in charts highlight those items where your college falls notably above or below the mean of your comparison group. The items listed are significant at p < .001 with an effect size greater than or equal to .2.]
B15

Student Effort Bar Charts and Benchmark Item Composition - Full-Time Students
description
Description - Students' own behaviors contribute significantly to their learning and the likelihood that they will successfully attain their educational goals.
Benchmark Scores
Palomar College ExLarge Colleges 2007 CCSSE Cohort
Full-Time 49.8 55.1 55.5
[NOTE: Directional arrows in charts highlight those items where your college falls notably above or below the mean of your comparison group. The items listed are significant at p < .001 with an effect size greater than or equal to .2.]
B16

Academic Challenge Bar Charts and Benchmark Item Composition - Full-Time Students
description
Description - Challenging intellectual and creative work is central to student learning and collegiate quality. Ten survey items address the nature and amount of assigned academic work, the complexity of cognitive tasks presented to students, and the standards faculty members use to evaluate student performance.
Benchmark Scores
Palomar College ExLarge Colleges 2007 CCSSE Cohort
Full-Time 52.9 55.4 55.6
[NOTE: Directional arrows in charts highlight those items where your college falls notably above or below the mean of your comparison group. The items listed are significant at p < .001 with an effect size greater than or equal to .2.]
B17

Student-Faculty Interaction Bar Charts and Benchmark Item Composition - Full-Time Students
description
Description - In general, the more contact students have with their teachers, the more likely they are to learn effectively and persist toward achievement of their educational goals. Through such interactions, faculty members become role models, mentors, and guides for continuous, lifelong learning.
Benchmark Scores
Palomar College ExLarge Colleges 2007 CCSSE Cohort
Full-Time 52.3 53.7 56.0
[NOTE: Directional arrows in charts highlight those items where your college falls notably above or below the mean of your comparison group. The items listed are significant at p < .001 with an effect size greater than or equal to .2.]
B18

Support for Learners Bar Charts and Benchmark Item Composition - Full-Time Students
description
Description - Students perform better and are more satisfied at colleges that are committed to their success and cultivate positive working and social relationships among different groups on campus.
Benchmark Scores
Palomar College ExLarge Colleges 2007 CCSSE Cohort
Full-Time 50.3 52.3 53.8
[NOTE: Directional arrows in charts highlight those items where your college falls notably above or below the mean of your comparison group. The items listed are significant at p < .001 with an effect size greater than or equal to .2.]
B19
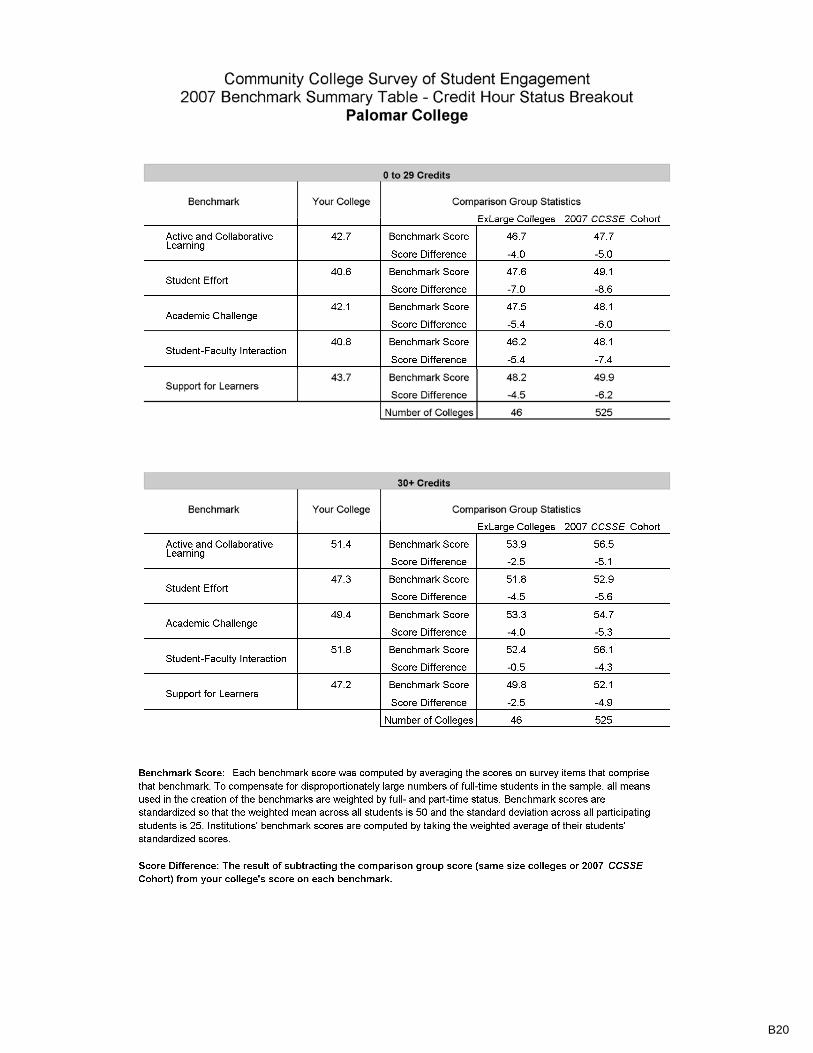
B20

B21

Active and Collaborative Learning Bar Charts and Benchmark Item Composition - 0 to 29 Credits Students
description
Description - Students learn more when they are actively involved in their education and have opportunities to think about and apply what they are learning in different settings. Through collaborating with others to solve problems or master challenging content, students develop valuable skills that prepare them to deal with the kinds of situations and problems they will encounter in the workplace, the community, and their personal lives.
Benchmark Scores
Palomar College ExLarge Colleges 2007 CCSSE Cohort
0 to 29 Credits 42.7 46.7 47.7
[NOTE: Directional arrows in charts highlight those items where your college falls notably above or below the mean of your comparison group. The items listed are significant at p < .001 with an effect size greater than or equal to .2.]
B22

Student Effort Bar Charts and Benchmark Item Composition - 0 to 29 Credits Students
description
Description - Students' own behaviors contribute significantly to their learning and the likelihood that they will successfully attain their educational goals.
Benchmark Scores
Palomar College ExLarge Colleges 2007 CCSSE Cohort
0 to 29 Credits 40.6 47.6 49.1
[NOTE: Directional arrows in charts highlight those items where your college falls notably above or below the mean of your comparison group. The items listed are significant at p < .001 with an effect size greater than or equal to .2.]
B23

Academic Challenge Bar Charts and Benchmark Item Composition - 0 to 29 Credits Students
description
Description - Challenging intellectual and creative work is central to student learning and collegiate quality. Ten survey items address the nature and amount of assigned academic work, the complexity of cognitive tasks presented to students, and the standards faculty members use to evaluate student performance.
Benchmark Scores
Palomar College ExLarge Colleges 2007 CCSSE Cohort
0 to 29 Credits 42.1 47.5 48.1
[NOTE: Directional arrows in charts highlight those items where your college falls notably above or below the mean of your comparison group. The items listed are significant at p < .001 with an effect size greater than or equal to .2.]
B24

Student-Faculty Interaction Bar Charts and Benchmark Item Composition - 0 to 29 Credits Students
description
Description - In general, the more contact students have with their teachers, the more likely they are to learn effectively and persist toward achievement of their educational goals. Through such interactions, faculty members become role models, mentors, and guides for continuous, lifelong learning.
Benchmark Scores
Palomar College ExLarge Colleges 2007 CCSSE Cohort
0 to 29 Credits 40.8 46.2 48.1
[NOTE: Directional arrows in charts highlight those items where your college falls notably above or below the mean of your comparison group. The items listed are significant at p < .001 with an effect size greater than or equal to .2.]
B25

Support for Learners Bar Charts and Benchmark Item Composition - 0 to 29 Credits Students
description
Description - Students perform better and are more satisfied at colleges that are committed to their success and cultivate positive working and social relationships among different groups on campus.
Benchmark Scores
Palomar College ExLarge Colleges 2007 CCSSE Cohort
0 to 29 Credits 43.7 48.2 49.9
[NOTE: Directional arrows in charts highlight those items where your college falls notably above or below the mean of your comparison group. The items listed are significant at p < .001 with an effect size greater than or equal to .2.]
B26

Active and Collaborative Learning Bar Charts and Benchmark Item Composition - 30+ Credits Students
description
Description - Students learn more when they are actively involved in their education and have opportunities to think about and apply what they are learning in different settings. Through collaborating with others to solve problems or master challenging content, students develop valuable skills that prepare them to deal with the kinds of situations and problems they will encounter in the workplace, the community, and their personal lives.
Benchmark Scores
Palomar College ExLarge Colleges 2007 CCSSE Cohort
30+ Credits 51.4 53.9 56.5
[NOTE: Directional arrows in charts highlight those items where your college falls notably above or below the mean of your comparison group. The items listed are significant at p < .001 with an effect size greater than or equal to .2.]
B27

Student Effort Bar Charts and Benchmark Item Composition - 30+ Credits Students
description
Description - Students' own behaviors contribute significantly to their learning and the likelihood that they will successfully attain their educational goals.
Benchmark Scores
Palomar College ExLarge Colleges 2007 CCSSE Cohort
30+ Credits 47.3 51.8 52.9
[NOTE: Directional arrows in charts highlight those items where your college falls notably above or below the mean of your comparison group. The items listed are significant at p < .001 with an effect size greater than or equal to .2.]
B28

Academic Challenge Bar Charts and Benchmark Item Composition - 30+ Credits Students
description
Description - Challenging intellectual and creative work is central to student learning and collegiate quality. Ten survey items address the nature and amount of assigned academic work, the complexity of cognitive tasks presented to students, and the standards faculty members use to evaluate student performance.
Benchmark Scores
Palomar College ExLarge Colleges 2007 CCSSE Cohort
30+ Credits 49.4 53.3 54.7
[NOTE: Directional arrows in charts highlight those items where your college falls notably above or below the mean of your comparison group. The items listed are significant at p < .001 with an effect size greater than or equal to .2.]
B29

Student-Faculty Interaction Bar Charts and Benchmark Item Composition - 30+ Credits Students
description
Description - In general, the more contact students have with their teachers, the more likely they are to learn effectively and persist toward achievement of their educational goals. Through such interactions, faculty members become role models, mentors, and guides for continuous, lifelong learning.
Benchmark Scores
Palomar College ExLarge Colleges 2007 CCSSE Cohort
30+ Credits 51.8 52.4 56.1
[NOTE: Directional arrows in charts highlight those items where your college falls notably above or below the mean of your comparison group. The items listed are significant at p < .001 with an effect size greater than or equal to .2.]
B30
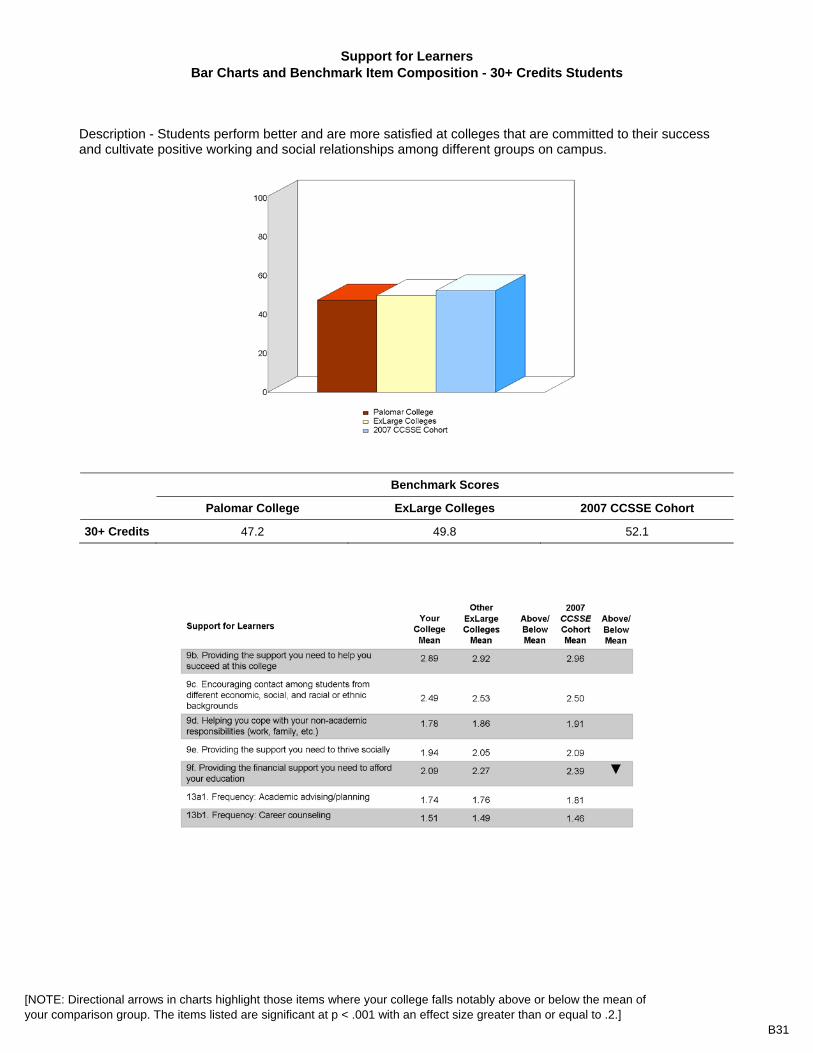
Support for Learners Bar Charts and Benchmark Item Composition - 30+ Credits Students
description
Description - Students perform better and are more satisfied at colleges that are committed to their success and cultivate positive working and social relationships among different groups on campus.
Benchmark Scores
Palomar College ExLarge Colleges 2007 CCSSE Cohort
30+ Credits 47.2 49.8 52.1
[NOTE: Directional arrows in charts highlight those items where your college falls notably above or below the mean of your comparison group. The items listed are significant at p < .001 with an effect size greater than or equal to .2.]
B31

2007 Codebook CCSSE’s data dictionary begins on the next page. It provides information on the structure, contents, and layout of the CCSSE dataset. Specifically, the codebook includes variable names associated with items, information about response values for those variables, and codes used to indicate missing data or invalid responses. In addition, the codebook lists exact items from The Community College Student Report (CCSR), Course Master Data File elements, course-level data from the Class Information Sheet, the part- v. full-time status weight variable, raw benchmark scores, exclusionary criteria, CCSSE Special Focus Questions, and derived variables used in various Web site analyses.

1
CCSSE 2007 Codebook Please note the following for the CCSSE dataset:
•Invalid responses are coded as missing “.”
Item # Variable Name Item Description/Variable Label Response Value SURVEYNO Survey Number 1
ENTER Did you begin college at this college or elsewhere?
1=Started here 2=Started elsewhere
2 ENRLMENT Thinking about this current academic term, how would you characterize your enrollment at this college?
1= Less than full-time 2=Full-time
3 SRVAGAIN Have you taken this survey in another class this term?
1=Yes 2=No
4) In your experiences at this college during the current school year, about how often have you done each of the following? NOTE: All items below have the following response values:
1=Never 2=Sometimes 3=Often 4=Very often
Item # Variable Name Item Description/Variable Label 4a CLQUEST Asked questions in class or contributed to class discussions 4b CLPRESEN Made a class presentation 4c REWROPAP Prepared two or more drafts of a paper or assignment before
turning it in 4d INTEGRAT Worked on a paper or project that required integrating ideas
or information from various sources 4e CLUNPREP Come to class without completing readings or assignments 4f CLASSGRP Worked with other students on projects during class 4g OCCGRP Worked with classmates outside of class to prepare class
assignments 4h TUTOR Tutored or taught other students (paid or voluntary) 4i COMMPROJ Participated in a community-based project as a part of a
regular course 4j INTERNET Used the Internet or instant messaging to work on an
assignment 4k EMAIL Used email to communicate with an instructor 4l FACGRADE Discussed grades or assignments with an instructor 4m FACPLANS Talked about career plans with an instructor or advisor 4n FACIDEAS Discussed ideas from your readings or classes with
instructors outside of class 4o FACFEED Received prompt feedback (written or oral) from instructors
on your performance

2
Item # Variable Name Item Description/Variable Label
4p WORKHARD Worked harder than you thought you could to meet an instructor's standards or expectations
4q FACOTH Worked with instructors on activities other than coursework
4r OOCIDEAS Discussed ideas from your readings or classes with others outside of class (students, family members, co-workers, etc.)
4s DIVRSTUD Had serious conversations with students of a different race or ethnicity other than your own
4t DIFFSTUD Had serious conversations with students who differ from you in terms of their religious beliefs, political opinions, or personal values
4u SKIPCLAS Skipped class
5) During the current school year, how much has your coursework at this college emphasized the following mental activities? NOTE: All items below have the following response values:
1=Very little 2=Some 3=Quite a bit 4=Very much
Item # Variable Name Item Description/Variable Label 5a MEMORIZE Memorizing facts, ideas, or methods from your courses and
readings so you can repeat them in pretty much the same form
5b ANALYZE Analyzing the basic elements of an idea, experience, or theory
5c SYNTHESZ Synthesizing and organizing ideas, information, or experiences in new ways
5d EVALUATE Making judgments about the value or soundness of information, arguments, or methods
5e APPLYING Applying theories or concepts to practical problems or in new situations
5f PERFORM Using information you have read or heard to perform a new skill.

3
6) During the current school year, about how much reading and writing have you done at this college? NOTE: All items below have the following response values:
1=None 2=Between 1 and 4 3=Between 5 and 10 4=Between 11 and 20 5=More than 20
Item # Variable Name Item Description/Variable Label 6a READASGN Number of assigned textbooks, manuals, books, or book-
length packs of course readings 6b READOWN Number of books read on your own (not assigned) for
personal enjoyment or academic enrichment 6c WRITEANY Number of written papers or reports of any length
Item # Variable Name Item Description/Variable Label Response Value 7
EXAMS Mark the box that best represents the extent to which your examinations during the current school year have challenged you to do your best work at this college
Responses range from 1 to 7, with scale anchors described: (1) Extremely easy (7) Extremely challenging
8) Which of the following have you done, are you doing, or do you plan to do while attending this college? NOTE: All items below have the following response values:
1=I Have Not Done, Nor Plan To Do 2=I Plan To Do 3=I Have Done
Item # Variable Name Item Description/Variable Label 8a INTERN Internship, field experience, co-op experience, or clinical
assignment 8b ESL English as a second language course 8c DEVREAD Developmental/remedial reading course 8d DEVWRITE Developmental/remedial writing course 8e DEVMATH Developmental/remedial math course 8f STUDSKIL Study skills course 8g HONORS Honors course 8h ORIEN College orientation program or course 8i LRNCOMM Organized learning communities (linked courses/study
groups led by faculty or counselors)

4
9) How much does this college emphasize each of the following? NOTE: All items below have the following response values:
1=Very little 2=Some 3=Quite a bit 4=Very much
Item # Variable Name Item Description/Variable Label 9a ENVSCHOL Encouraging you to spend significant amounts of time
studying 9b ENVSUPRT Providing the support you need to help you succeed at this
college 9c ENVDIVRS Encouraging contact among students from different
economic, social, and racial or ethnic backgrounds 9d ENVNACAD Helping you cope with your non-academic responsibilities
(work, family, etc.) 9e ENVSOCAL Providing the support you need to thrive socially 9f FINSUPP Providing the financial support you need to afford your
education 9g ENVCOMP Using computers in academic work
10) About how many hours do you spend in a typical 7-day week doing each of the following? NOTE: All items below have the following response values:
0=None 1=1-5 hours 2=6-10 hours 3=11-20 hours 4=21-30 hours 5=More than 30 hours
Item # Variable Name Item Description/Variable Label 10a
ACADPR01 Preparing for class (studying, reading, writing, rehearsing, doing homework, or other activities related to your program)
10b PAYWORK Working for pay 10c
COCURR01 Participating in college-sponsored activities (organizations, campus publications, student government, intercollegiate or intramural sports, etc.)
10d
CAREDE01 Providing care for dependents living with you (parents, children, spouse, etc.)
10e COMMUTE Commuting to and from classes

5
11) Mark the box that best represents the quality of your relationships with people at this college. Your relationship with:
Item # Variable Name Item Description/Variable Label Response Value 11a ENVSTU Other students Responses range from 1 to 7, with
scale anchors described as: (1) Unfriendly, unsupportive, sense of alienation (7) Friendly, supportive, sense of belonging
11b ENVFAC Instructors Responses range from 1 to 7, with scale anchors described as: (1) Unavailable, unhelpful, unsympathetic (7) Available, helpful, sympathetic
11c ENVADM Administrative personnel and offices Responses range from 1 to 7, with scale anchors described as: (1) Unhelpful, inconsiderate, rigid (7) Helpful, considerate, flexible
12) How much has YOUR EXPERIENCE AT THIS COLLEGE contributed to your knowledge, skills, and personal development in the following areas? NOTE: All items below have the following response values:
1=Very little 2=Some 3=Quite a bit 4=Very much
Item # Variable Name Item Description/Variable Label 12a GNGENLED Acquiring a broad general education 12b GNWORK Acquiring job or work-related knowledge and skills 12c GNWRITE Writing clearly and effectively 12d GNSPEAK Speaking clearly and effectively 12e GNANALY Thinking critically and analytically 12f GNSOLVE Solving numerical problems 12g GNCMPTS Using computing and information technology 12h GNOTHERS Working effectively with others 12i GNINQ Learning effectively on your own 12j GNSELF Understanding yourself 12k GNDIVERS Understanding people of other racial and ethnic backgrounds12l GNETHICS Developing a personal code of values and ethics 12m GNCOMMUN Contributing to the welfare of your community 12n CARGOAL Developing clearer career goals 12o GAINCAR Gaining information about career opportunities

6
13a) Indicate how often you use the following services. NOTE: All items below have the following response values:
0=Don’t Know/N.A 1=Rarely/never 2=Sometimes 3=Often
Item # Variable Name Item Description/Variable Label 13a1 USEACAD Frequency: Academic advising/planning 13b1 USECACOU Frequency: Career counseling 13c1 USEJOBPL Frequency: Job placement assistance 13d1 USETUTOR Frequency: Peer or other tutoring 13e1 USELAB Frequency: Skill labs (writing, math, etc.) 13f1 USECHLD Frequency: Child care 13g1 USEFAADV Frequency: Financial aid advising 13h1 USECOMLB Frequency: Computer lab 13i1 USESTORG Frequency: Student organizations 13j1 USETRCRD Frequency: Transfer credit assistance 13k1 USEDISAB Frequency: Services to students with disabilities
13b) Indicate how satisfied you are with the services at this college. NOTE: All items below have the following response values:
0=N.A. 1=Not at all 2=Somewhat 3=Very
Item # Variable Name Item Description/Variable Label 13a2 SATACAD Satisfaction: Academic advising/planning 13b2 SATCACOU Satisfaction: Career Counseling 13c2 SATJOBPL Satisfaction: Job placement assistance 13d2 SATTUTOR Satisfaction: Peer or other tutoring 13e2 SATLAB Satisfaction: Skill labs (writing, math, etc.) 13f2 SATCHLD Satisfaction: Child care 13g2 SATFAADV Satisfaction: Financial aid advising 13h2 SATCOMLB Satisfaction: Computer lab 13i2 SATSTORG Satisfaction: Student organizations 13j2 SATTRCRD Satisfaction: Transfer credit assistance 13k2 SATDISAB Satisfaction: Services to students with disabilities
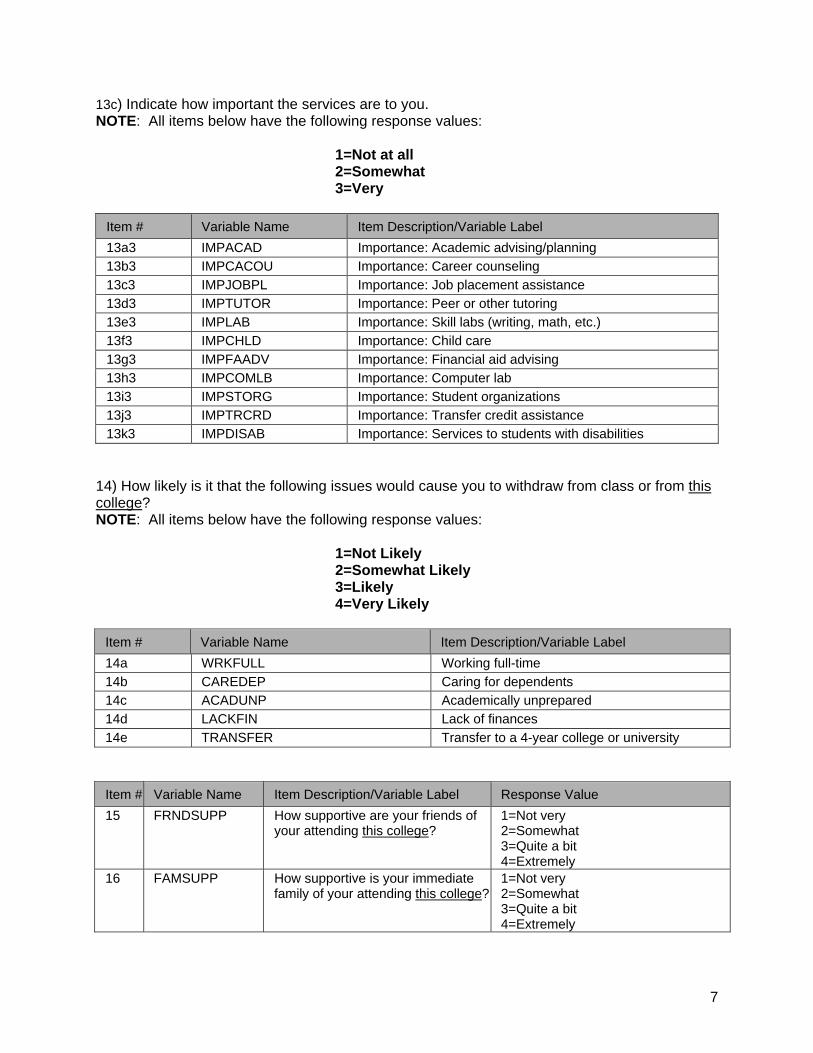
7
13c) Indicate how important the services are to you. NOTE: All items below have the following response values:
1=Not at all 2=Somewhat 3=Very
Item # Variable Name Item Description/Variable Label 13a3 IMPACAD Importance: Academic advising/planning 13b3 IMPCACOU Importance: Career counseling 13c3 IMPJOBPL Importance: Job placement assistance 13d3 IMPTUTOR Importance: Peer or other tutoring 13e3 IMPLAB Importance: Skill labs (writing, math, etc.) 13f3 IMPCHLD Importance: Child care 13g3 IMPFAADV Importance: Financial aid advising 13h3 IMPCOMLB Importance: Computer lab 13i3 IMPSTORG Importance: Student organizations 13j3 IMPTRCRD Importance: Transfer credit assistance 13k3 IMPDISAB Importance: Services to students with disabilities
14) How likely is it that the following issues would cause you to withdraw from class or from this college? NOTE: All items below have the following response values:
1=Not Likely 2=Somewhat Likely 3=Likely 4=Very Likely
Item # Variable Name Item Description/Variable Label 14a WRKFULL Working full-time 14b CAREDEP Caring for dependents 14c ACADUNP Academically unprepared 14d LACKFIN Lack of finances 14e TRANSFER Transfer to a 4-year college or university
Item # Variable Name Item Description/Variable Label Response Value 15
FRNDSUPP How supportive are your friends of your attending this college?
1=Not very 2=Somewhat 3=Quite a bit 4=Extremely
16
FAMSUPP How supportive is your immediate family of your attending this college?
1=Not very 2=Somewhat 3=Quite a bit 4=Extremely

8
17) Indicate which of the following are your reasons/goals for attending this college. NOTE: All items below have the following response values:
1=Not a goal 2=Secondary goal 3=Primary goal
Item # Variable Name Item Description/Variable Label 17a CERTPRGM Complete a certificate program
17b ASSOCDEG Obtain an associate degree 17c TR4YR Transfer to a 4-year college or university 17d OBUPSKIL Obtain or update job-related skills 17e SLFIMP Self-improvement/personal enjoyment 17f CARCHNG Change careers
18) Indicate which of the following are sources you use to pay your tuition at this college. (Please respond to each item) NOTE: All items below have the following response values:
1=Not a source 2=Minor source 3=Major source
Item # Variable Name Item Description/Variable Label
18a OWNINC My own income/savings 18b PARSPINC Parent or spouse/significant other’s
income/savings 18c EMPLOYER Employer contributions 18d GRANTS Grants and scholarships 18e STULOANS Student loans (bank, etc.) 18f PUBASSIT Public assistance
19) Since high school, which of the following types of schools have you attended other than the one you are now attending? This question asks students to select all options that apply. To permit multiple responses, the question is represented in the codebook by five separate items the student either checks or does not check. NOTE: All items below have the following response values:
0=No response 1=Response
Item # Variable Name Item Description/Variable Label 19a PROPSCH Proprietary (private) school or training program 19b VOCTECH Public vocational-technical school 19c COMMCOLL Another community or technical college 19d FOURYEAR 4-year college or university 19e NONESC None

9
Item # Variable Name Item Description/Variable Label Response Value 20 TAKAGAIN When do you plan to take classes at
this college again? 1=I will accomplish my goal(s) this term and will not be returning 2=I have no current plans to return 3=Within the next 12 months
4= Uncertain 21 GPA At this college, in what range is your
overall college grade average? 1=Pass/fail classes only 2=Do not have a GPA at this school 3=C- or lower 4=C 5=B- to C+ 6=B 7=A- to B+ 8=A
22 TIMCLASS When do you most frequently take classes at this college?
1=Day classes (morning or afternoon)2=Evening classes 3=Weekend classes
23 TOTCHRS How many TOTAL credit hours have you earned at this college, not counting the courses you are currently taking this term?
0=None 1=1 – 14 credits 2=15 – 29 credits 3=30 – 44 credits 4=45 – 60 credits 5= over 60 credits
24) At what other types of institutions are you taking classes this term? This question asks students to select all options that apply. To permit multiple responses, the question is represented in the codebook by six separate items the student either checks or does not check. NOTE: All items below have the following response values:
0=No response 1=Response
Item # Variable Name Item Description/Variable Label 24a OTCLSNON None 24b OTCLSHS High school 24c OTCLSVT Vocational/technical school 24d OTCLSCC Another community or technical college 24e OTCLS4Y 4-year college/ university 24f OTCLASS Other

10
Item # Variable Name Item Description/Variable Label Response Value 25
OTHINST How many classes are you presently taking at OTHER institutions?
1=None 2=1 class 3=2 classes 4=3 classes 5=4 classes or more
26 RECOMMEN Would you recommend this college
to a friend or family member? 1=Yes 2=No
27 ENTIREXP How would you evaluate your entire educational experience at this college?
1=Poor 2=Fair 3=Good 4=Excellent
28 HAVKID Do you have children who live with you?
1=Yes 2=No
29 AGENEW Mark your age group 1=Under 18 2=18 to 19 3=20 to 21 4=22 to 24 5=25 to 29 6=30 to 39 7=40 to 49 8=50 to 64 9=65+
30 SEX Your sex 1=Male 2=Female
31 MARRY Are you married? 1=Yes 2=No
32 ENGFIRST Is English your native (first) language?
1=Yes 2=No
33 INTERNAT Are you an international student or foreign national?
1=Yes 2=No
34 RERACE What is your racial identification? (Mark only one)
1=American Indian or other Native American 2=Asian, Asian American or Pacific Islander 3=Native Hawaiian 4=Black or African American, Non-Hispanic 5=White, Non-Hispanic 6=Hispanic, Latino, Spanish 7=Other
35
HIACCRED What is the highest academic credential you have earned?
1=None 2=High school diploma or GED 3=Vocational/technical certificate 4= Associate degree 5= Bachelor’s degree 6= Master's/doctoral/professional degree

11
Item # Variable Name Item Description/Variable Label Response Value 36m
MOTHED Highest level of education: mother
1=Not a high school graduate 2=High school diploma or GED 3=Some college, did not complete degree 4=Associate degree 5=Bachelor’s degree 6=Master's/1st professional degree 7=Doctorate degree 8=Unknown
36f
FATHED Highest level of education: father
1=Not a high school graduate 2=High school diploma or GED 3=Some college, did not complete degree 4=Associate degree 5=Bachelor’s degree 6=Master's/1st professional degree 7=Doctorate degree 8=Unknown
37
MAJOR Using the list provided, please write the code indicating your major
38 STID Student Identification Number The items below contain course level data from the Course Master Data File:
Variable Name Item Description/Variable Label Response Value psample Record in primary sample 0=False
1=True in Survey number in range for packet 0=False
1=True sdate Course start date edate Course end date timegrp Administration Time Group 1=Morning (Before Noon)
2=Afternoon (Noon to 4:59) 3=Evening (5:00 or later)
camploc Campus location
secno Section number
courseno Course number
courname Course full name
bldg Building
room Room
meetdays Class meeting days
instrnam Instructor name
depart Department
actenrol Actual enrollment
stime Class start time
etime Class end time

12
The items below refer to derived CCSSE variables:
Variable Name Item Description/Variable Label Response Value
credit Credit hours completed 1=Students with 0-29 Credits 2=Students with 30 or More Credits
stud_age_class Traditional/Nontraditional age students 1=Traditional Age Student (24 and younger)
2=Nontraditional Age Student (25 and older)
developmental Developmental/Nondevelopmental coursework
1=Nondevelopmental 2=Developmental
generation First-Generation/Not First-Generation Students
1=First-Generation (neither parent attended college)
2=Not First-Generation (at least one parent attended college)
credential Credential/Noncredential seeking 1=Noncredential Seeking 2=Credential Seeking
The items below contain course level data from the class information sheet:
Variable Name Item Description/Variable Label Response Value SRVADMN Survey administered by 1=Faculty 2=Survey Administrator FACFTPT Faculty member’s status 1=Full-time 2=Part-time NUMSTU Number of students in attendance ADMNTIME Total administration time: in minutes ADMNDATE Administration date SPNEEDS How many students in this class have special needs? SEMHRS Number of credit hours taught this semester by faculty member teaching this class:
Semester system hours QRTHRS Number of credit hours taught this semester by faculty member teaching this class:
Quarter system hours The items below are calculated weights and benchmarks:
Variable Name Item Description/Variable Label iweight Institutional weight based on part-time/full-time enrollment actcoll Active and collaborative learning benchmark score (rescaled from 0 to 1) stueff Student effort benchmark score (rescaled from 0 to 1) acchall Academic challenge benchmark score (rescaled from 0 to 1) stufac Student-faculty interaction benchmark score (rescaled from 0 to 1) support Support for learners benchmark score (rescaled from 0 to 1)

13
The items below are standardized benchmarks:
Variable Name Item Description/Variable Label actcoll_std Standardized active and collaborative learning benchmark score (mean of 50) stueff_std Standardized student effort benchmark score (mean of 50) acchall_std Standardized academic challenge benchmark score (mean of 50) stufac_std Standardized student-faculty interaction benchmark score (mean of 50) support_std Standardized support for learners benchmark score (mean of 50)
The items below refer to the CCSSE Supplemental Questions:
Variable Name Item Description/Variable Label Response Value
COLLQ149 By the end of my FIRST FOUR WEEKS at this college, I had met with an advisor to discuss my educational goals.
1= Yes 2= No, I met with an advisor by the end of my first four weeks at this college, but we did not discuss my educational goals 3= No, I did not meet with an advisor by the end of my first four weeks at this college 4= No, I have discussed educational goals with an advisor, but it did not happen by the end of my first four weeks at this college 5= I do not recall
COLLQ150 By the end of my FIRST FOUR WEEKS at this college, I had completed an initial assessment test to determine which reading, writing, and math courses I should enroll in.
1= Yes 2= No 3= I do not recall
COLLQ151 By the end of my FIRST FOUR WEEKS at this college, my instructors had used teaching techniques that encouraged me to become actively involved in the classroom.
1= Very often 2= Often 3= Sometimes 4= Never 5= I do not recall
COLLQ152 How satisfied were you with the quality of your college's orientation course or program for new students?
1= Very Satisfied 2= Somewhat Satisfied 3= Not at all Satisfied 4= Have not attended an orientation course or program
COLLQ153 Rate your overall satisfaction with this college's processes for working with new students - including the admissions process, the financial aid office, new student assessment, your first class registration experience, etc.
1= Very Satisfied 2= Somewhat Satisfied 3= Somewhat Dissatisfied 4= Very Dissatisfied

1See Benchmark Overview for a detailed description of the five CCSSE benchmarks.
2007 Institutional Report: Using CCSSE Results Page 1 of 7
Community College Survey of Student Engagement
2007 Institutional Report Using CCSSE Results
Approaching Your CCSSE Results
Introduction
Each member college’s results should be considered in terms of its own
mission, institutional focus, and student characteristics. However, CCSSE has
developed a set of recommendations regarding the analysis and interpretation of your results
based on feedback from member institutions, conference and workshop presentations, and experts in the field.
The “Big Picture”
CCSSE recommends asking general questions first and using Institutional Report tables to help answer such questions. General questions might include
What data confirm facts you already knew? What results had you not expected? Is your sample representative of your entire population of students?
Tables from the report that assist with this general review include
Table 1: Respondents to Underlying Populations Comparisons — This one-page table details respondent characteristics from your college compared to population data for 1) your college, 2) similarly-sized 2007 CCSSE Cohort colleges, and 3) the 2007 CCSSE Cohort. The specific characteristics examined include gender, race/ethnicity, age, and enrollment status.
First Look — These reports highlight those items where your college falls notably above or below the mean of your comparison group broken out by all students and enrollment status (part- and full-time).
Frequency Report: All Students — This report provides item-by-item percentage responses for all students at your institution. In addition, it displays asterisks for those items that are significantly different, when applicable, from your comparison group.
Benchmark Reports — Benchmarks are groups of conceptually related survey items that address key areas of student engagement. CCSSE’s five benchmarks denote areas that educational research has shown to be important in quality educational practice.1 The benchmarks are used to compare your institution’s performance to that of similar institutions and with the 2007 CCSSE Cohort. Data are presented in both tabular and graph form.
Digging Deeper
CCSSE also recommends taking the time to examine your results in greater detail, especially the items that comprise the five CCSSE benchmarks. Review of individual survey items can shed light on specific aspects of your institution’s efforts that are not detailed in the “big picture” reports mentioned previously. Both the Means Summary and Frequency Distribution tables assist with such efforts.
Means Summary — These reports provide item-by-item means for students at your institution contrasted with a comparison group and the CCSSE Cohort. Other useful statistics found in these reports include 1) significance, 2) effect size, 3) standard deviation, and 4) standard error of the mean. The actual magnitude of some item score differences may seem trivial, even though they are highly reliable and statistically significant; hence, the presentation of the effect size indicator and other statistics which aid in the interpretation of the magnitude of the differences on any given item.

2007 Institutional Report: Using CCSSE Results Page 2 of 7
Frequency Distributions — This report summarizes the observed frequencies of occurrence (counts and percentages) of the values for each item on the survey. Such statistics are useful for easily locating the highest and lowest scores as well as understanding how the data are distributed across response categories.
Reaching for Excellence
Standardized reports are an easy way to assess whether an individual college is performing above or below the mean as well as allowing for comparisons across similar colleges. While such reports are quite useful, they should only serve as a starting point. Better educational outcomes are the result of using data wisely and being relentless about putting it in front of faculty and staff – and using the data to focus effort and promote positive change. Given such requirements, CCSSE also provides the following tips for examining and interpreting your data.
Tip #1: Compare your college to high-performing collegesCCSSE provides a Benchmark Deciles Report for each institution, which provides an indication of your college’s performance relative to the highest-performing colleges. Your college may aspire, for example, to attain performance on one or more benchmarks that is equivalent to the performances of the top ten percent of community colleges nationally. The decile report lets you know where you stand in relation to that aspiration. Deciles are percentiles that divide the frequency of benchmark scores into 10 equal groups.
Deciles are listed for the 2007 CCSSE Cohort of colleges and for each appropriate breakdown according to size and urbanicity. To help gauge a college’s performance relative to the comparison groups, the shaded area on the tables indicates the deciles that are less than or equal to your benchmark scores.
The definition of “high-performing” certainly may vary, but CCSSE typically classifies high performers as those institutions scoring at or above the 80th percentile on at least three benchmarks.
In addition, CCSSE encourages colleges to review the work of MetLife Foundation Best-Practice Colleges. Selection of these award-winning colleges is based on the institutions’ performances on a retention index
reflecting results on three CCSSE benchmarks that are related to student retention.
Brief descriptions of the award winners are located on CCSSE’s Web site: http://www.ccsse.org/retention/bestpractices.cfm.
Tip #2: Measure your college’s performance in terms of your least-engaged student groupIn certain cases, colleges may know which group on campus is least engaged, while in others, further analysis of the data helps yield that information. In each scenario, filtering and calculations using your raw data file will be necessary.
CCSSE has developed classifications for the following groups of students that are typically of interest in community college efforts to improve student outcomes:
1) First generation students: those who are the first in their immediate families to attend college
2) Developmental students: those who have taken or plan to take developmental courses while attending college
3) High-risk students: those with multiple risk factors such as being single parents, having to care for dependents, attending college part-time, etc.
You may also wish to explore levels of engagement of minority student groups, returning female students, or other groups.
Please contact CCSSE for information regarding the survey items used in creating these groups.
Once you have identified your least-engaged group, CCSSE recommends that you run comparisons between this group and the remainder of your college population, as well as comparing the results for the least-engaged group and the 2007 CCSSE Cohort.
Tip #3: Gauge work in areas most strongly valuedCCSSE always recommends examining your results in light of your institution’s vision, mission, and/or strategic objectives. Before reviewing your data, you may want to identify key issues by answering questions like these:
What are the high-priority objectives in your college’s strategic plan? What benchmarks, trends, or services are most important to your college? Examples might include particular benchmarks (academic challenge, student-faculty interaction, etc.); critical issues,

2007 Institutional Report: Using CCSSE Results Page 3 of 7
such as retention; and services that are key to student success, such as academic advising or college orientation. What educational practices most concern your college? How do your mission and specific programs at your college relate to the CCSSE benchmarks and survey items? What new programs are being developed at your college?
For example, if your college scored low on student-faculty interaction, a high priority on your campus, then ascertain the specific survey items of that benchmark that require attention; or, if your college scored high on all benchmarks, focus on ways to continue strengthening these areas.
Tip #4: Compare where you are now with where you want to beAnother useful way to examine your institution’s results is to perform a gap analysis looking at where you are now versus where you want to be. Questions to consider include
What issues have been identified for your college through self-study for reaffirmation of accreditation — or recommendations from the visiting team? What strengths or opportunities for improvement in your college have been identified through other data-gathering or institutional research efforts? Are there emerging trends that fit with your college’s strengths? Are there emerging trends that amplify areas where your college needs improvement?
Once questions such as these have been addressed, utilizing your CCSSE results in conjunction with other institutionally-relevant data, a set of strategic goals can be established and then pursued at your college. CCSSE in Action: Communicating about and Using your Results
High levels of student engagement are the product of an institution-wide commitment, not discrete initiatives. In other words, quality education is not an event — it’s a culture. CCSSE is committed to helping you build that culture at your college, and we provide a Communications Toolkit as a key resource for those efforts.
The 7-step plan below can be tailored and implemented to help you share your college’s results and launch a dialogue with key internal and external constituencies. CCSSE’s Web site (www.ccsse.org) also offers various resources, including an online search engine, references, and other tools to help you communicate about your results.
Step 1:Identify your internal and external audiences. Internal constituencies may include governing board members, administrators, faculty, staff, and students. External audiences might include the media, policymakers, business leaders, K-12 educators, and community-based organizations. What do you want them to know about the survey and your results? What questions will they have? What do you want them to do with the information?
Step 2:Set parameters — for yourself and your various audiences — that establish what data will and won’t be used for. For example, you may choose to use results to design faculty development opportunities, noting that they are inappropriate for use in evaluation of individual faculty members. You may want to use data immediately with external audiences, or you may choose to focus internally at first and then, at a later date, demonstrate data-driven changes to external constituents.
Step 3:Develop storylines that relate to issues relevant to your college and geographic area. Ask yourself, “What are the stories our students are telling us through this survey? What do these stories say about the educational experience we are providing?” Examples of potential storylines are included in the “Communication Tools” located at http://www.ccsse.org/members/communications.cfm.
Step 4:Engage your audiences, particularly your internal audiences, in ways that encourage them to move forward. Create forums that help people understand what the data mean so they can use the information to develop improvement strategies.
Step 5:Work within your college’s culture. For example, some colleges may want to organize conversations by department; others will benefit more from interdisciplinary and cross-functional discussions.

2007 Institutional Report: Using CCSSE Results Page 4 of 7
Some will find it natural to incorporate improvement initiatives into their annual planning process, and some will want to convene an annual convocation or launch a special initiative on student engagement.
Step 6:Listen to your various audiences. The best ideas often come from unexpected places. By all means, report back to the college community on action taken in response to survey results — and the ideas generated in discussions about the survey. And don’t forget students. The survey emphasizes that they have a role to play in their own learning, and these are their observations on their educational experiences. Meet with student government and encourage student-faculty discussions. Consider using selected CCSSE items in new venues, such as incorporating them into students’ evaluations of courses and faculty. The CCSSE Course Feedback Form is an instrument that could be used in this manner: http://www.ccsse.org/publications/toolkit.cfm.
Step 7:Don’t shy away from the data. Information, whether positive or negative, can help improve educational practice and performance. Use it to dispel myths, showcase your college’s best practices, and set the bar higher for the future.
CCSSE’s Web site, www.ccsse.org, is aimed at promoting public understanding of the work of community colleges, supporting institutional improvement, and advancing public discussion about new ways of defining and examining quality in higher education.
The Web site is a primary vehicle for putting survey results in context. Special features for CCSSE member colleges include a CCSSE Toolkit (http://www.ccsse.org/members/communications.cfm) that contains resources to help colleges understand their survey results, communicate them to various audiences, and use them to target institutional improvement initiatives. The “Communications” section of the Toolkit contains the following documents:
Drop-In Overview TemplateCCSSE suggests that you complete the Drop-in Overview template and then circulate a copy of it to key constituency groups. Once it is completed, it can be used to conduct guided conversations or
focus groups to promote a better understanding of your institution’s survey findings and their potential implications for improvement initiatives.
Developing Storylines to Communicate ResultsThese sample storylines use hypothetical situations with hypothetical data to provide ideas for stories that can be told using CCSSE results. This isn’t about spin. CCSSE’s purpose is to be straightforward about data, both when the results make us shine and when they cause us to question — and improve — our current practices. These storylines are intended to inform, engage, and highlight important issues. Similar stories, geared to your college, your community, and your survey results, might be used with internal college groups, governing board members, community groups, and other audiences.
PowerPoint Presentation TemplateUse this PowerPoint template as a starting point for custom presentations to both internal and external audiences.
Sample News ReleaseCustomize this sample press release to highlight your college’s CCSSE results.
Sample News Release for College NewspaperUse this sample news release for your college newspaper to introduce the CCSR to your students - what it is, what it measures, and what it can do.
Sample Fact SheetCustomize this sample fact sheet to highlight your college’s CCSSE results.
Sample Letters to the EditorThese sample letters to the editor provide background on key issues. Customize them with your specific CCSSE results and tie them to events in your area.
Tips for Working with the MediaUse these tips so you can be better prepared to talk with the media about your CCSSE results and other aspects of college quality and performance.

2007 Institutional Report: Using CCSSE Results Page � of 7
The “Using CCSSE” section of the Toolkit contains the following documents:
Tips on Gaining Support for Using CCSSECCSSE will be most valuable to the colleges if there are college-wide communication efforts both prior to survey administration and after results are returned. Dialogue with faculty, staff, and administrators about the purpose of the survey and its connection to college issues and priorities, and sharing information about how results can advance college goals, will engage college faculty and staff who can make positive change.
Tips for Engaging Faculty to Strengthen Student Success
This guide offers tips to help faculty understand CCSSE as a valuable tool for strengthening student success, tips on ways faculty can engage in using CCSSE results, and examples of how other colleges have elicited faculty participation with their CCSSE results.
Faculty PredictionsUse this document to jump-start discussions with faculty and staff. Start the session by asking participants to provide the answers they predict (or hope) students provided. Then have the full group go through the items and provide the actual student responses from your Institutional Report. Discuss whether and why faculty predictions differ from actual student responses.
Student Services Staff PredictionsUse this document to jump-start discussions with student services staff. Start the session by asking participants to provide the answers they predict (or hope) students provided. Then have the full group go through the items and provide the actual student responses from your Institutional Report. Discuss whether and why student services staff predictions differ from actual student responses.
Use these toolkit items to help you communicate and use your college’s results and launch a dialogue with key internal and external constituencies. All the tools can be customized for your college.
Additional CCSSE Web Site Resources
The CCSSE Accreditation Toolkits Because all regional accreditation associations require evidence of student learning and of efforts to improve student outcomes, CCSSE results could be
appropriately used in institutional self-studies. This information is particularly powerful if CCSSE results are corroborated by other institutional data such as results from other national or local surveys, review of institutional records, or student focus groups. The CCSSE Accreditation Toolkits are individually tailored for each of the six regional higher education accrediting bodies. Each toolkit includes
a model regional accreditation timeline and advice about including CCSSE administrations in that timeline a section that aligns the CCSSE items to your accrediting body’s standards and criteria examples of how colleges in your accrediting region have used CCSSE results for their review purposes
The CCSSE Course Feedback Form The CCSSE Course Feedback Form — an end-of-course evaluation instrument for course-level and program-level assessment — was developed with the assistance of an advisory panel of administrators, counselors, and faculty members from six CCSSE member colleges. The instrument is based on student engagement items from the CCSSE survey and additional course feedback items submitted and reviewed by our advisory panel members. The CCSSE Course Feedback Form is provided free of charge and is intended for local administration and data analysis.
The CCSSE Classroom Observation Form The CCSSE Classroom Observation Form was designed as a professional development tool to be used by deans, department heads, mentor faculty, and peer faculty. The instrument includes standard classroom review items, but keeps student engagement as its primary area of focus. The CCSSE Classroom Observation Form is provided free of charge and is intended for local data collection and analysis, in accord with the college’s policies.
The Student Focus Group Toolkit Your CCSSE data provide a great deal of information to help you identify strengths and areas in need of improvement at your college. Generally, the data will point you to specific areas where you’ll want to focus your attention. Before you begin to consider improvement strategies, you may want to learn more about student experiences in those areas pinpointed through the CCSSE survey. CCSSE encourages you to hold focus groups to gather this information. These structured discussions will help you better understand

2007 Institutional Report: Using CCSSE Results Page � of 7
students’ experiences, as well as uncover possible strategies to consider for improvement. They will provide qualitative information to enhance your CCSSE data. The Student Focus Group Toolkit contains instructions for planning focus groups and recruiting focus group participants, discussion tools to use during the focus groups, and a focus group summary report sample.
The Web site also features a comprehensive search-the-data section — for example, the user can generate a report showing CCSSE results for all large, urban colleges; for all small, rural colleges; or for the participating colleges in a particular state or accrediting region. Results are presented in drill-down charts that display information in easy-to-manage steps. Users first see a graph that shows general results; then, they can click on various parts of the graph to get the details behind the numbers at http://www.ccsse.org/members/search/.
We intend to regularly update the CCSSE Web site with other examples about how community colleges are using their CCSSE data as we learn about them. In that regard, please keep us informed about how you are using, or plan to use, your CCSSE results by contacting CCSSE at [email protected] or at �12-471-�807.
CCSSE in Action: CCSSE Member Colleges Communicate about their Results
Paradise Valley Community College (Arizona)Paradise Valley Community College (PVCC) held a series of workshops to provide an overview of CCSSE survey data and lay out an action plan and timeline. The action plan called on each division or department to share CCSSE findings with faculty and staff, identify data-driven strategies for improving teaching and learning, and document ways in which faculty and staff implemented the pilot strategies. A series of e-briefings related to CCSSE shared promising practices from other colleges and relevant research. For example, “A Dozen Easy-to-Implement CCSSE Plans for Faculty” included suggestions such as scheduling appointments with students and requiring internship experiences. PVCC also created the Student Engagement-CCSSE Awards, through which faculty members who submitted CCSSE action plans could win stipends to purchase resources for teaching and learning.
Illinois Central College (IL) When Illinois Central College (ICC) received its CCSSE results, the college gathered faculty members and staff to review them. Participants broke into small groups and discussed four questions regarding the college’s results: Do the data reflect your experience at ICC? Do the data mean something for you in your role? Is average where we want to be as a college? If not, how can we attempt to improve the results in the future? Each group focused on one benchmark. Participants then shared responses and suggestions for improvement.
North Hennepin Community College (MN)To engage faculty members in reviewing CCSSE results, North Hennepin Community College gathered faculty members and asked them to predict students’ responses to the survey items. Instead of doing this exercise on paper, the college used personal response system “clickers” and got immediate feedback after posing each question. The actual student data then were displayed for discussion. After getting this feedback, the faculty members were randomly divided into groups and assigned one CCSSE benchmark. Each group identified two priorities for change related to their benchmark. These priorities now are part of the college’s assessment plan initiatives.
CCSSE in Action: CCSSE Member Colleges Use their Results
Cedar Valley College (TX)After its first CCSSE administration, Cedar Valley College (CVC) set a goal of making tutoring available to more students. The first objective was to provide tutoring to every CVC student who needed it, a change from the earlier practice of providing tutoring only to students who met particular guidelines. CVC created a tutoring center located in the middle of its campus to provide tutoring in all disciplines, for all students. The president committed funds to the center, and the college hired a director, employed additional tutors, and trained tutors extensively. The new tutoring center established relationships with faculty members, who broadly advertised its services. When CVC completed its second CCSSE administration, the college scored significantly higher than other colleges in the frequency of use of tutoring services. CVC also learned that students ranked tutoring as one of the three services with which they were most satisfied.

2007 Institutional Report: Using CCSSE Results Page 7 of 7
Greenfield Community College (MA)Greenfield Community College has implemented significant changes in student services as a result of using CCSSE. Despite receiving high scores on all benchmarks, the college fell below the national average in contributing to students’ knowledge, skills, and personal development in the areas of identifying clearer career goals and gaining information about career opportunities. Furthermore, despite average scores in satisfaction with career counseling services, the center was clearly underutilized. As a result, the Career Center implemented an outreach initiative to educate faculty, staff and students about career counseling services and their impact on student persistence. The Career Center was also moved to a more visible location on campus, in close proximity to the Academic Advising Center, where several collaborative initiatives are taking place. In addition, a pilot study is underway to examine the impact of career counseling in the advising process to improve retention among liberal arts students.
Miami Dade College (FL)Miami Dade College (MDC) created several new initiatives based on its CCSSE findings. The college developed long-term academic planners that map out students’ courses, term by term, so students can chart their progress toward their goals. In an effort to improve transfer assistance, the college held general and discipline-specific transfer workshops on each campus and launched a campaign to emphasize the advantages of completing an associate degree prior to transferring. MDC also developed a dual degree opportunity with Florida International University (FIU) so students can be dually admitted to the two institutions. Students can complete their associate degrees while making connections with FIU faculty and staff and preparing to transfer to upper division programs.
J. Sargeant Reynolds Community College (VA)At J. Sargeant Reynolds Community College, CCSSE results revealed low levels of engagement with various services, particularly academic and career advising. As a result of those findings, the college developed a new student orientation program. Results from surveys and other data indicate that high percentages of participants either clarified or changed their curriculum as a result of the early advising. In addition, new data suggest that participants were retained at a higher rate than nonparticipants.

Community College Survey of Student Engagement
2007 Institutional Report Overview of National 2007 CCFSSE
Cohort Survey Results
Overview of National 2007 CCFSSE Cohort Survey Results Page � of 9
Introduction The Community College Faculty
Survey of Student Engagement (CCFSSE) was piloted in the fall of
2004 and administered for the first time nationally in the spring of 2005 by
the Community College Survey of Student Engagement (CCSSE). The CCFSSE,
designed as a companion to the Community College Student Report, elicits information from
faculty about their teaching practices, the ways they spend their professional time, both in and out of class,
and their perceptions regarding students’ educational experiences.
The CCFSSE results will not only help member colleges identify areas of strength, but will also enable them to recognize challenges or gaps that may require further consideration. CCSSE member colleges are already using student survey results for internal review, benchmarking, and responding to accrediting agencies. The CCFSSE can be used to strengthen those endeavors and to promote faculty involvement. Furthermore, results from the CCFSSE can be used to target areas of focus for faculty development programs.
The CCFSSE report enables participating institutions to view faculty expectations and perceptions of student engagement alongside student responses. However, it is important to remember that the side-by-side tables, while illustrative, are not entirely equivalent – that is, the CCSSE asks students to report perceptions and experiences across the period of the current academic year. Faculty, in contrast, are asked to describe their practices in a specific selected course, as well as to indicate their perceptions of student experiences in the college more generally.
Nonetheless, the comparisons of student and faculty responses provide a useful prompt for campus discussions, particularly in those areas where students and faculty seem to be reporting divergent perceptions of the same experience.
Beginning this year, CCFSSE will utilize a three-year cohort of 223 participating colleges (2005, 2006, and 2007) in all of its data analyses.� This cohort is referred to as the 2007 CCFSSE Cohort throughout all reports and documentation. This new approach increases the total number of institutions and faculty contributing to the national dataset, which in turn increases the reliability of the overall results.
This overview is divided into two sections and is organized to provide a general understanding of survey administration and of selected findings from the 2007 CCFSSE Cohort. In the first section, we describe how the survey was administered and compare the 2007 CCFSSE Cohort with the national population of two-year colleges.
In the second section, we highlight selected findings from the 2007 CCFSSE Cohort and make some comparisons to 2007 CCSSE Cohort results.
2007 CCFSSE Cohort Institutions and Respondents
All institutions that participated in the 2007 CCSSE survey administration were invited to participate in the CCFSSE. The survey was administered via the Web: faculty members at participating institutions were sent an invitation email and asked to respond to an online survey. All faculty members who taught spring credit courses were invited to participate. The CCFSSE survey was completed by 20,586 faculty members across the 2005, 2006, and 2007 administrations.
Response RatesThe average institutional response rate for the 2007 CCFSSE administration was 35%.2
�For returning participants, the college’s most recent year of CCFSSE participation is included in data analyses. For example, if a college participated in 2006 and 2007, only the 2007 data would be used in the three-year cohort.2The CCFSSE institutional response rate is the number of surveys returned divided by the attempted number of survey invitations sent.

Overview of National 2007 CCFSSE Cohort Survey Results Page 2 of 9
Representation of InstitutionsTable � provides information about the representation ofthe 2007 CCFSSE Cohort member colleges as comparedto community and technical colleges across the nation.
Representation of Faculty Respondents
The 2007 CCFSSE Cohort faculty respondents generally mirror the national two-year college faculty population, with the exception of employment status, as illustrated in Table 2.
Gender55% of all respondents to the CCFSSE were female, and 45% of respondents were male. Nationally, women comprise 49% of faculty at two-year institutions.
Race and EthnicityThe 2007 CCFSSE Cohort respondents’ race and ethnicity closely parallel the NCES faculty data for two-year institutions.4
Employment StatusSixty percent of 2007 CCFSSE Cohort respondents identified themselves as full-time faculty members, while 40% indicated that they were employed on a part-time basis. These percentages are quite different from NCES national data, which indicate that only 33% of community college faculty members are employed full-time. Faculty members at participating CCFSSE institutions are sent an email invitation and asked to respond to the survey online. The inverse employment status representation is likely a product of colleges being unable to provide as many valid email addresses for part-time faculty as full-time.
3National population data do not include hospital-based or private institutions.4U.S. Department of Education, National Center for Education Statistics, 2004 National Study of Postsecondary Faculty (NSOPF:04)
Table 1. Colleges by Size and Urbanicity
2007 CCFSSE Cohort Member Colleges
National Population3
2007 CCFSSECohort Proportionof NationalPopulation
By Size
# of Institutions 223 �,047 2�%
Small (up to 4,499) 99 56� �8%
Medium (4,500-7,999) 52 238 22%
Large (8,000-14,999) 50 �5� 33%Extra-Large (15,000+) 22 97 23%
By Urbanicity
# of Institutions 223 �,059 2�%
Urban-serving 48 �87 26%
Suburban-serving 48 22� 22%
Rural-serving �27 65� 20%

Overview of National 2007 CCFSSE Cohort Survey Results Page 3 of 9
52004 NCES data do not include the category “Native Hawaiian.”
Academic Rank
Table 3 illustrates the percentage of all faculty respondents by academic rank as compared to national data. As shown, CCFSSE respondents report much higher percentages—42% altogether—of professor, associate professor, and assistant professor ranks than those reported in national findings (19%), while the national data show 3�% of all two-year faculty hold some “other” rank than those listed, much higher than the 6% reported by CCFSSE respondents.
There are also significant differences in the responses of part-time and full-time faculty. Seventy-seven percent of part-time respondents hold the rank of instructor or lecturer, as opposed to 38% of full-time faculty, and only �4% of part-time participants hold any rank of professor—assistant, associate, or full—while 60% of full-time faculty have these titles.
Table 2. Respondents versus National Population
2007 CCFSSE Cohort
National Population
Gender
Male 45% 5�%
Female 55% 49%
Race/EthnicityAmerican Indian or other Native American �% <�%
Asian, Asian American or Pacific Islander 3% 3%
Native Hawaiian <�% -5
Black or African American, Non-Hispanic 6% 7%
White, Non-Hispanic 82% 83%Hispanic, Latino, Spanish 6% 5%
Other 3% 2%
Employment StatusFull-time 60% 33%
Part-time 40% 67%
Table 3. Academic Rank
2007 CCFSSE Cohort
National Population
Professor 2�% �0%
Associate Professor ��% 5%
Assistant Professor �0% 4%
Instructor or Lecturer 53% 50%
Other 6% 3�%

Overview of National 2007 CCFSSE Cohort Survey Results Page 4 of 9
Selected Findings This section of the overview features selected findings from the 2007 CCFSSE Cohort.
Class Size as Compared to College Size The largest percentage of faculty at large and extra-large colleges reported that between 20 and 29 students were enrolled in their classes; at small colleges, 29% of faculty report teaching classes this size, and 35% of medium sized college faculty reported teaching classes this size.
How Faculty Spend Their Time: Professional Activities
Table 5 highlights the teaching-related and other professional activities on which full- and part-time faculty reported spending their time in a typical 7-day week.6 As expected, full-time faculty reported spending more hours teaching students than their part-time counterparts. Interestingly, though, roughly equal percentages of both groups spent � and �2 hours a week on the remaining teaching-related activities.
6Percentages will not total to �00 in all cases because data from the “None” category has been excluded.
Forty-one percent of small college faculty teach classes that are �0-�9 students in size, but a substantial percentage of faculty from the other sized colleges reported these class enrollments as well. Interestingly, all faculty who responded to the survey reported teaching quite low percentages of large classes, which include those over 39 students.
Table 4. Class Sizes across Colleges by Size
Class Size<10 10-19 20-29 30-39 40-69 70>
College Size
Extra-Large (15,000+) 5% 34% 4�% �4% 4% �%
Large (8,000-14,999) 9% 37% 38% ��% 3% �%
Medium (4,500-7,999)�2% 38% 35% ��% 3% �%
Small (up to 4,499) �8% 4�% 29% 7% 3% �%
However, a significantly larger percentage of full-time faculty spent between � and �2 hours on other professional activities such as advising students, working with students on activities other than coursework, and conducting service activities.
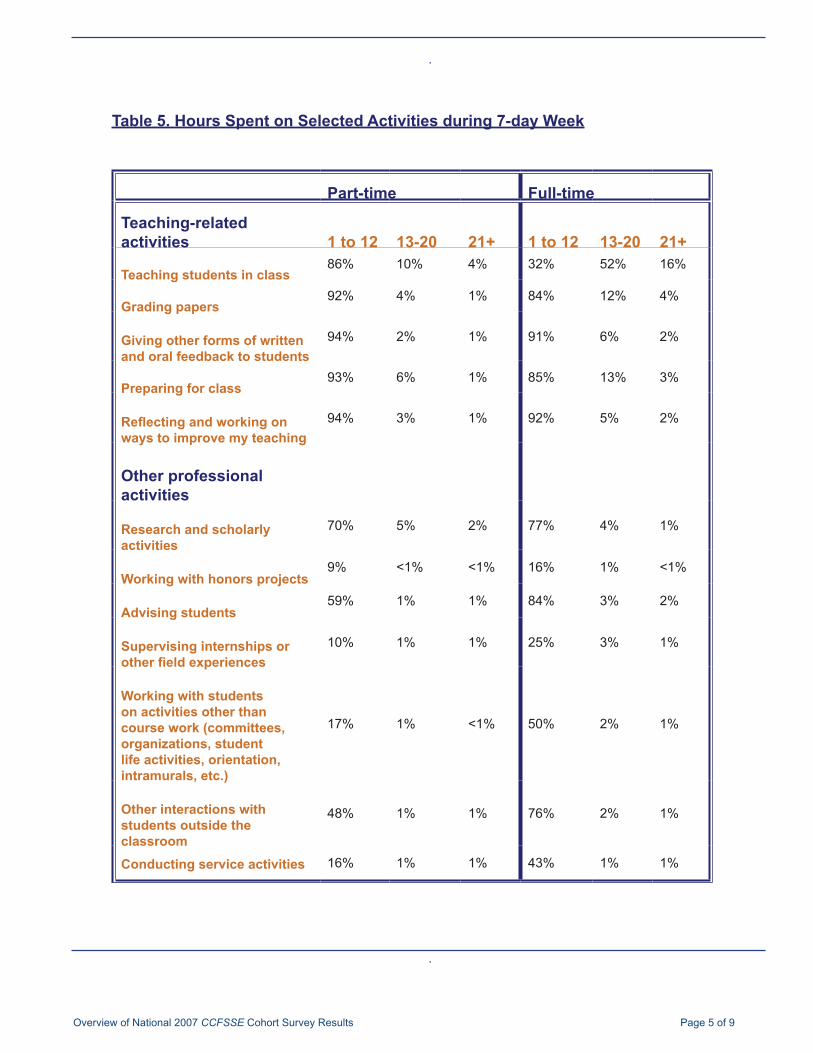
Overview of National 2007 CCFSSE Cohort Survey Results Page 5 of 9
Table 5. Hours Spent on Selected Activities during 7-day Week
Part-time Full-time
Teaching-related activities 1 to 12 13-20 21+ 1 to 12 13-20 21+
Teaching students in class86% �0% 4% 32% 52% �6%
Grading papers92% 4% �% 84% �2% 4%
Giving other forms of written and oral feedback to students
94% 2% �% 9�% 6% 2%
Preparing for class93% 6% �% 85% �3% 3%
Reflecting and working on ways to improve my teaching
94% 3% �% 92% 5% 2%
Other professional activities
Research and scholarly activities
70% 5% 2% 77% 4% �%
Working with honors projects9% <�% <�% �6% �% <�%
Advising students59% �% �% 84% 3% 2%
Supervising internships or other field experiences
�0% �% �% 25% 3% �%
Working with students on activities other than course work (committees, organizations, student life activities, orientation, intramurals, etc.)
�7% �% <�% 50% 2% �%
Other interactions with students outside the classroom
48% �% �% 76% 2% �%
Conducting service activities
�6% �% �% 43% �% �%

Overview of National 2007 CCFSSE Cohort Survey Results Page 6 of 9
How Faculty Spend Their Time: Class Time
Question #�6 asks faculty to report the percentage of class time spent on activities such as lecture, student computer use, and in-class writing. Almost a third of faculty respondents revealed spending 50-�00% of their class time lecturing.
On the other hand, over 90% of respondents reported spending less than 20% of their class time on in-class writing. Similarly, 50% of faculty conveyed spending no class time on student computer use, and over half of respondents reported devoting less than �0% of their class time to small group activities.
Table 6. Percent of Class Time Spent on Various Activities (All Faculty)
0% 1-9%10-19%
20-29%
30-39%
40-49% 50-74%
75-100%
Lecture 2% �3% �5% �3% �2% �4% 22% 9%
Teacher-led discussion 4% 23% 25% �9% ��% 8% 8% 3%
Teacher-student shared responsibility 25% 27% �9% �2% 6% 5% 5% 2%
Student computer use
50% 23% 9% 5% 3% 3% 4% 4%
Small group activities 2�% 32% 2�% �2% 6% 4% 4% �%
Student presentations
40% 36% �3% 5% 3% 2% 2% �%
In-class writing 50% 30% �0% 4% 2% �% �% �%
Testing and evaluation
5% 46% 3�% �0% 4% 2% 2% �%
Performances in applied and fine arts
9�% 4% �% �% �% <�% �% �%
Experiential 65% �2% 6% 5% 3% 3% 4% 2%
Hands-on practice 27% �9% �5% �0% 6% 6% 9% 8%

Overview of National 2007 CCFSSE Cohort Survey Results Page 7 of 9
The percentage of class time spent on various activities fluctuates quite a bit depending upon the number of years faculty members have taught, as shown in Table 7. Instructors in their first year of teaching most closely parallel instructors who have been in the profession 30-39 years in terms of how much time is devoted to varying classroom activities. However, those who have been teaching �-4 years more closely parallel those who have been teaching 5-9 years in many instructional categories.
Teachers who have taught �0-�9 years were more likely to spend their class time on teacher-led discussion and small group activities than were teachers in any other category. In fact, over a third of the teachers in this category reported that they devote a minimum of 75% of their class time to small group activities; similarly, over a quarter of the instructors in this category report devoting at least half of their class time to in-class writing.
Table 7. Percentage of Class Time Spent on Various Activities Based on Number of Years Teaching (All Faculty)
Number of years teaching
First year 1-4 5-9 10-19 20-29 30-39Lecture
30-39% 5% �9% 23% 30% �5% 6%40-49% 5% 20% 25% 28% �5% 7%50-74% 6% 20% 24% 27% �5% 7%75-�00% 6% 20% 22% 25% �5% 9%Teacher-led discussion
30-39% 5% 2�% 24% 28% �6% 6%40-49% 5% 20% 24% 28% �5% 7%50-74% 6% 22% 24% 28% �3% 7%75-�00% 6% 25% 24% 23% �2% 7%Student computer use
30-39% 5% �8% 28% 25% �7% 6%40-49% 4% �6% 29% 27% �6% 7%50-74% 5% �7% 27% 3�% �3% 6%75-�00% 6% �8% 29% 26% �5% 6%Small group activities
30-39% 5% 2�% 24% 30% �3% 5%40-49% 6% 22% 26% 26% �4% 6%50-74% 7% 23% 27% 28% �0% 5%75-�00% 8% �6% 22% 35% �2% 7%In-class writing
30-39% 5% �9% 24% 27% �6% 6%40-49% 5% �9% 26% 3�% �0% 8%50-74% 4% 20% 28% 26% �5% 5%75-�00% 2% 29% 24% 27% ��% 6%

Overview of National 2007 CCFSSE Cohort Survey Results Page 8 of 9
Faculty Perceptions about Student Engagement
On the CCFSSE survey, faculty members are asked how often students interact with them, in and out of class. Table 8 presents the percentage of faculty who report that students interact with them often or very often; the table also indicates how the 2007 CCSSE Cohort responded to the same items.7
Table 8. Student-Faculty Interactions (Response of “Often” or “Very Often”)
Faculty Responses
StudentResponses
Use e-mail to communicate with you 59% 44%
Discuss grades or assignments with you 7�% 45%
Talk about career plans with you
40% 24%
Discuss ideas from your readings or classes with you outside of class 30% �5%
Receive prompt feedback (written or oral) from you about their performance
93% 56%
As the table highlights, on every item listed, faculty reported higher rates of interaction than students, most notably with respect to receiving prompt feedback (written and oral) and discussing grades or assignments.
Student and Faculty Responses by Benchmark
Figure �, Student and Faculty Responses by Benchmark, highlights side-by-side responses to CCSSE’s five benchmark areas of effective educational practice.8 When student and faculty views are presented side-by-side in this Overview, as they are in Table 8 and Figure �, the student responses include data only from colleges that are members of the 2007 CCFSSE Cohort.
Figure 1. Student and Faculty Responses by Benchmark
00.10.20.30.40.50.60.7
Active andCollaborative
Learning
StudentEffort
AcademicChallenge
Student-Faculty
Interaction
Support forLearners
Faculty Students
7These student responses only include data from colleges that are members of the 2007 CCFSSE Cohort.8For Figure �, data are presented in groupings of CCFSSE items that correspond to comparable CCSSE benchmark composition items (excluding items 6a, 6b, and 6c). Student data is not weighted in this graph as there is not a comparable weighting scheme for faculty. Data are means of items where items were rescaled between 0 and �.

Overview of National 2007 CCFSSE Cohort Survey Results Page 9 of 9
Suggested Steps for Reviewing, Understanding, and Using CCFSSE Results
Examine the gaps between faculty and student responses on items of interest to your institution.
Examine how faculty spend their time as well as what activities they incorporate into class time.
Review and present the findings to faculty with all the caveats noted above.
Engage faculty in discussions about the results and solicit suggestions on how to address any gaps or other issues of concern to faculty.
Provide faculty with information on ways the administration will support faculty recommendations for change.

2007 CCFSSE Cohort
2007CCFSSECohort Page1of5
Community College Surveyof Student Engagement
AikenTechnicalCollege Graniteville SC 2006AlvinCommunityCollege Alvin TX 2007
AmericanRiverCollege Sacramento CA 2007AngelinaCollege Lufkin TX 2007
Anoka-RamseyCommunityCollege CoonRapids MN 2006Asheville-BuncombeTechnicalCommunity
College Asheville NC 2007Asnuntuck Community College Enfield CT 2006
AustinCommunityCollege Austin TX 2007BigSandyCommunityandTechnicalCollege Prestonsburg KY 2007BismarckStateCollege Bismarck ND 2007BossierParishCommunityCollege BossierCity LA 2007BrazosportCollege LakeJackson TX 2007BrevardCommunityCollege Cocoa FL 2007BrookhavenCollege FarmersBranch TX 2006BunkerHillCommunityCollege Boston MA 2007BurlingtonCountyCollege Pemberton NJ 2007ButlerCountyCommunityCollege(KS) ElDorado KS 2006ButlerCountyCommunityCollege(PA) Butler PA 2006CaldwellCommunityCollegeandTechnicalInstitute Hudson NC 2007CapeCodCommunityCollege WestBarnstable MA 2007CapitalCommunityCollege Hartford CT 2006CarrollCommunityCollege Westminster MD 2006CarteretCommunityCollege MoreheadCity NC 2006CasperCollege Casper WY 2007CentralArizonaCollege Coolidge AZ 2006CentralCommunityCollege GrandIsland NE 2007CentralFloridaCommunityCollege Ocala FL 2007CentralLakesCollege Brainerd MN 2006CentralMaineCommunityCollege Auburn ME 2007CentralWyomingCollege Riverton WY 2007CenturyCollege WhiteBearLake MN 2007Chandler-GilbertCommunityCollege Chandler AZ 2007ChattanoogaStateTechnicalCommunityCollege Chattanooga TN 2007ChipolaCollege Marianna FL 2007CityCollegeofSanFrancisco SanFrancisco CA 2007ClevelandStateCommunityCollege Cleveland TN 2007CoastalCarolinaCommunityCollege Jacksonville NC 2007CoastalGeorgiaCommunityCollege Brunswick GA 2005CollegeofAlameda Alameda CA 2007CollegeofLakeCounty Grayslake IL 2007CollegeoftheMainland TexasCity TX 2006CollegeoftheMarshallIslands Majuro MH 2007CollegeoftheSiskiyous Weed CA 2006
Year of most recent CCFSSE
Institution City State participation

2007CCFSSECohort Page2of5
Year of most recent CCFSSE Institution City State participation
ColoradoMountainCollege GlenwoodSpringsCO 2007ColumbiaStateCommunityCollege Columbia TN 2006CommunityCollegeofAlleghenyCounty Pittsburgh PA 2007CommunityCollegeofDenver Denver CO 2005CommunityCollegeofSouthernNevada LasVegas NV 2006CumberlandCountyCollege Vineland NJ 2007CyFairCollege Cypress TX 2007DanvilleCommunityCollege Danville VA 2007DaytonaBeachCommunityCollege DaytonaBeach FL 2007DeAnzaCollege Cupertino CA 2007DelMarCollege CorpusChristi TX 2007DelgadoCommunityCollege NewOrleans LA 2007DeltaCollege UniversityCenter MI 2007DurhamTechnicalCommunityCollege Durham NC 2005EasternWyomingCollege Torrington WY 2007Eastfield College Mesquite TX 2007EdisonCollege FortMyers FL 2007ElCentroCollege Dallas TX 2007ElPasoCommunityCollege ElPaso TX 2007ElizabethtownCommunity&TechnicalCollege Elizabethtown KY 2007EstrellaMountainCommunityCollege Avondale AZ 2006FairmontStateCommunityandTechnicalCollege Fairmont WV 2005FloridaCommunityCollegeatJacksonville Jacksonville FL 2007GalvestonCollege Galveston TX 2006GatewayCommunityandTechnicalCollege Ft.Mitchell KY 2007GatewayCommunityCollege NewHaven CT 2006GeneseeCommunityCollege Batavia NY 2007GloucesterCountyCollege Sewell NJ 2007GrandRapidsCommunityCollege GrandRapids MI 2005GraysonCountyCollege Denison TX 2006GreenvilleTechnicalCollege Greenville SC 2007GuilfordTechnicalCommunityCollege Jamestown NC 2007GulfCoastCommunityCollege PanamaCity FL 2007HaroldWashingtonCollege Chicago IL 2005HawaiiCommunityCollege Hilo HI 2006HazardCommunityandTechnicalCollege Hazard KY 2006HesstonCollege Hesston KS 2007HousatonicCommunityCollege Bridgeport CT 2006HowardCollege BigSpring TX 2006IllinoisValleyCommunityCollege Oglesby IL 2006IndianRiverCommunityCollege FortPierce FL 2007IsothermalCommunityCollege Spindale NC 2007ItawambaCommunityCollege Fulton MS 2006IvyTechCommunityCollege-CentralIndiana Indianapolis IN 2007J.SargeantReynoldsCommunityCollege Richmond VA 2005JacksonCommunityCollege Jackson MI 2006JacksonStateCommunityCollege Jackson TN 2006JamesA.RhodesStateCollege Lima OH 2007JolietJrCollege Joliet IL 2007KankakeeCommunityCollege Kankakee IL 2005KenaiPeninsulaCollege-UAA Soldotna AK 2007KingsboroughCommunityCollege Brooklyn NY 2005KingwoodCollege Houston TX 2007

2007CCFSSECohort Page�of5
Year of most recent CCFSSE Institution City State participation
KirkwoodCommunityCollege CedarRapids IA 2007KirtlandCommunityCollege Roscommon MI 2007KodiakCollege,UniversityofAlaskaAnchorage Kodiak AK 2007LaGuardiaCommunityCollege LongIslandCity NY 2005LakeCityCommunityCollege LakeCity FL 2007LakeRegionStateCollege DevilsLake ND 2007LakeSuperiorCollege Duluth MN 2007LamarInstituteofTechnology Beaumont TX 2006LamarStateCollege-Orange Orange TX 2007LaneyCollege Oakland CA 2007LaramieCountyCommunityCollege Cheyenne WY 2007LeeCollege Baytown TX 2007LorainCountyCommunityCollege Elyria OH 2006LouisburgCollege Louisburg NC 2006ManateeCommunityCollege Bradenton FL 2007ManchesterCommunityCollege Manchester CT 2006MassachusettsBayCommunityCollege WellesleyHills MA 2007MassasoitCommunityCollege Brockton MA 2007McHenryCountyCollege CrystalLake IL 2007MercedCollege Merced CA 2007MiamiDadeCollege Miami FL 2007MidMichiganCommunityCollege Harrison MI 2007MiddleGeorgiaCollege Cochran GA 2007MiddlesexCommunityCollege Lowell MA 2007MidlandsTechnicalCollege Columbia SC 2007MinotStateUniversity-Bottineau Bottineau ND 2007MontanaStateUniversityBillings Billings MT 2007MontgomeryCollege Conroe TX 2007MontgomeryCountyCommunityCollege BlueBell PA 2007Mt.SanAntonioCollege Walnut CA 2007NaugatuckValleyCommunityCollege Waterbury CT 2006NewMexicoJuniorCollege Hobbs NM 2007NewMexicoMilitaryInstitute Roswell NM 2006NewRiverCommunityandTechnicalCollege Beckley WV 2005NHCommunityTechnicalCollege-Manchester Manchester NH 2006NHCommunityTechnicalCollege-Stratham Stratham NH 2006North Central State College Mansfield OH 2006NorthDakotaStateCollegeofScience Wahpeton ND 2007NorthHarrisCollege Houston TX 2007NorthLakeCollege Irving TX 2006NortheastIowaCommunityCollege Calmar IA 2006NortheastLakeviewCollege SanAntonio TX 2007NortheastMississippiCommunityCollege Booneville MS 2007NortheastStateTechnicalCommunityCollege Blountville TN 2006NortheastTexasCommunityCollege MtPleasant TX 2007Northern Maine Community College Presque Isle ME 2007NorthernOklahomaCollege Tonkawa OK 2006NorthwestCollege Powell WY 2007NorthwestIndianCollege Bellingham WA 2005NorthwestVistaCollege SanAntonio TX 2007OuachitaTechnicalCollege Malvern AR 2007OwensboroCommunityandTechnicalCollege Owensboro KY 2007PaloAltoCollege SanAntonio TX 2007

2007CCFSSECohort Page�of5
Year of most recent CCFSSE Institution City State participation
PasadenaCityCollege Pasadena CA 2007Pasco-HernandoCommunityCollege NewPortRichey FL 2007PaulD.CampCommunityCollege Franklin VA 2005PellissippiStateTechnicalCommunityCollege Knoxville TN 2006PensacolaJuniorCollege Pensacola FL 2007PhoenixCollege Phoenix AZ 2006PiedmontVirginiaCommunityCollege Charlottesville VA 2005PittCommunityCollege Winterville NC 2006PolkCommunityCollege WinterHaven FL 2007PrinceWilliamSoundCommunityCollege Valdez AK 2007PuebloCommunityCollege Pueblo CO 2007ReadingAreaCommunityCollege Reading PA 2007RedlandsCommunityCollege ElReno OK 2007RichlandCollege Dallas TX 2006Rowan-CabarrusCommunityCollege Salisbury NC 2006SalemCommunityCollege CarneysPoint NJ 2007SalishKootenaiCollege Pablo MT 2007SanAntonioCollege SanAntonio TX 2005SanDiegoMesaCollege SanDiego CA 2007SanJacintoCollege-CentralCampus Pasadena TX 2007SanJacintoCollege-NorthCampus Pasadena TX 2007SanJacintoCollege-SouthCampus Pasadena TX 2007SantaAnaCollege SantaAna CA 2007SantaFeCommunityCollege(FL) Gainesville FL 2007SantaFeCommunityCollege(NM) SantaFe NM 2007SchoolcraftCollege Livonia MI 2007SeminoleCommunityCollege Sanford FL 2007SheltonStateCommunityCollege Tuscaloosa AL 2007SheridanCollege Sheridan WY 2007SinclairCommunityCollege Dayton OH 2007SouthFloridaCommunityCollege AvonPark FL 2007SouthMountainCommunityCollege Phoenix AZ 2007SouthTexasCollege McAllen TX 2007SoutheastKentuckyCommunity&TechnicalCollege Cumberland KY 2006SoutheasternCommunityCollege(IA) WestBurlington IA 2007SouthernMaineCommunityCollege SouthPortland ME 2006SouthwestTennesseeCommunityCollege Memphis TN 2007SouthwestTexasJuniorCollege Uvalde TX 2006SouthwesternIllinoisCollege Belleville IL 2005SouthwesternOregonCommunityCollege CoosBay OR 2007SpoonRiverCollege Canton Il 2007St.PetersburgCollege St.Petersburg FL 2007St.Philip’sCollege SanAntonio TX 2007TaftCollege Taft CA 2007TallahasseeCommunityCollege Tallahassee FL 2007TananaValleyCampus,UniversityofAlaskaFairbanks Fairbanks AK 2007TechnicalCollegeoftheLowcountry Beaufort SC 2007TheCommunityCollegeofBaltimoreCounty Baltimore MD 2006TheVictoriaCollege Victoria TX 2006ThreeRiversCommunityCollege Norwich CT 2006TomballCollege Tomball TX 2007TrinityValleyCommunityCollege Athens TX 2007TruckeeMeadowsCommunityCollege Reno NV 2005

2007CCFSSECohort Page5of5
Year of most recent CCFSSE Institution City State participation
UniversityofAlaskaMatanuskaSusitnaCollege Palmer AK 2007UniversityofAlaskaSoutheastKetchikancampus Juneau AK 2007UniversityofArkansasCommunityCollegeatBatesville Batesville AR 2007UniversityofCincinnatiClermontCollege Batavia OH 2006UniversityofNewMexico-Gallup Gallup NM 2006UniversityofNewMexico-TaosBranch Taos NM 2006ValenciaCommunityCollege Orlando FL 2007VictorValleyCollege Victorville CA 2007VincennesUniversity Vincennes IN 2007WaltersStateCommunityCollege Morristown TN 2006WarrenCountyCommunityCollege Washington NJ 2005WashingtonStateCommunityCollege Marietta OH 2007WayneCommunityCollege Goldsboro NC 2007WestKentuckyCommunityandTechnicalCollege Paducah KY 2007WestVirginiaStateCommunityandTechnicalCollege Institute WV 2007WesternNebraskaCommunityCollege Scottsbluff NE 2007WesternWyomingCommunityCollege RockSprings WY 2007WhartonCountyJuniorCollege Wharton TX 2007WilburWrightCollege Chicago IL 2007WillistonStateCollege Williston ND 2007YorkTechnicalCollege RockHill SC 2007

2007 CCFSSE Student and Faculty Frequency Distributions
There are two reports in this section. The first report summarizes the observed frequencies of occurrence (counts and percentages) of the values for generally equivalent items from your institution’s faculty (part-time, full-time, and all faculty) on the Community College Faculty Survey of Student Engagement (CCFSSE), and all student data from your institution’s in-class administration of the Community College Student Report (CCSR). With regard to this report, please note that for the faculty survey, faculty are asked to respond to certain items with regard to one selected course; for other items, faculty are asked to indicate their perceptions of overall student experiences and institutional practices. On the student survey, students are asked about their overall experience at the college, not their experience in a particular class. The second report summarizes the observed frequencies of occurrence (counts and percentages) from your institution’s faculty for all faculty survey items that do not appear on the student survey. Data are presented for part-time, full-time, and all faculty respondents from your institution. For colleges that did not participate in the faculty survey, an example report is provided.

2007 CCFSSE Student and Faculty Frequency DistributionsExample College
2007 CCFSSE Faculty Responses 2007 CCSSE Student Responses
Count Percent Count Percent Count Percent Count PercentDon't Know 0 0% 0 0% 0 0%
Never 0 0% 1 1% 1 1% Never 42 4%Sometimes 8 27% 19 22% 27 23% Sometimes 425 39%
Often 13 43% 34 39% 47 40% Often 371 34%Very Often 9 30% 33 38% 42 36% Very Often 248 23%
Total 30 100% 87 100% 117 100% Total 1086 100%Don't Know 0 0% 0 0% 0 0%
Never 15 50% 40 46% 55 47% Never 412 38%Sometimes 10 33% 25 29% 35 30% Sometimes 411 38%
Often 4 13% 13 15% 17 15% Often 180 17%Very Often 1 3% 9 10% 10 9% Very Often 77 7%
Total 30 100% 87 100% 117 100% Total 1080 100%Don't Know 2 7% 14 16% 16 14%
Never 15 50% 34 40% 49 43% Never 221 20%Sometimes 7 23% 25 29% 32 28% Sometimes 319 29%
Often 3 10% 7 8% 10 9% Often 322 30%Very Often 3 10% 5 6% 8 7% Very Often 221 20%
Total 30 100% 85 100% 115 100% Total 1083 100%Don't Know 1 3% 3 3% 4 3%
Never 7 23% 21 24% 28 24% Never 134 12%Sometimes 10 33% 18 21% 28 24% Sometimes 345 32%
Often 7 23% 21 24% 28 24% Often 367 34%Very Often 5 17% 23 27% 28 24% Very Often 235 22%
Total 30 100% 86 100% 116 100% Total 1081 100%D 't K 2 7% 2 2% 4 3%H ft d t d t i l t d ti I i t thi ll d i th t h l
All Students
How often do students in your selected course section ask questions in class or contribute to class discussions
How often do students in your selected course section make a class presentation
Part-Time Faculty
In your experience at this college during the current school year, about how often have you worked on a paper or project that required integrating ideas or information from various sources
In your experiences at this college during the current school year, about how often have you asked questions in class or contributed to class discussions
Full-Time Faculty All Faculty
In your experience at this college during the current school year, about how often have you made a class presentation
In your experience at this college during the current school year, about how often have you prepared two or more drafts of a paper or assignment before turning it in
How often do students in your selected course section prepare two or more drafts of a paper or assignment before turning it in
How often do students in your selected course section work on a paper that requires integrating ideas or information from various sources
Don't Know 2 7% 2 2% 4 3% Never 1 3% 1 1% 2 2% Never 242 22%
Sometimes 16 53% 40 46% 56 48% Sometimes 666 62%Often 9 30% 31 36% 40 34% Often 134 12%
Very Often 2 7% 13 15% 15 13% Very Often 38 4%Total 30 100% 87 100% 117 100% Total 1080 100%
Don't Know 0 0% 3 3% 3 3% Never 6 20% 14 16% 20 17% Never 234 22%
Sometimes 11 37% 30 34% 41 35% Sometimes 465 43%Often 8 27% 25 29% 33 28% Often 285 26%
Very Often 5 17% 15 17% 20 17% Very Often 95 9%Total 30 100% 87 100% 117 100% Total 1079 100%
Don't Know 5 17% 10 12% 15 13% Never 5 17% 7 8% 12 10% Never 514 48%
Sometimes 14 47% 40 47% 54 47% Sometimes 364 34%Often 6 20% 21 24% 27 23% Often 137 13%
Very Often 0 0% 8 9% 8 7% Very Often 59 6%Total 30 100% 86 100% 116 100% Total 1075 100%
Don't Know 14 47% 22 25% 36 31% Never 6 20% 12 14% 18 15% Never 800 74%
Sometimes 7 23% 39 45% 46 39% Sometimes 218 20%Often 3 10% 11 13% 14 12% Often 41 4%
Very Often 0 0% 3 3% 3 3% Very Often 22 2%Total 30 100% 87 100% 117 100% Total 1081 100%
Don't Know 13 43% 22 25% 35 30% Never 12 40% 46 53% 58 50% Never 851 79%
Sometimes 4 13% 10 11% 14 12% Sometimes 156 14%Often 1 3% 3 3% 4 3% Often 49 5%
Very Often 0 0% 6 7% 6 5% Very Often 25 2%Total 30 100% 87 100% 117 100% Total 1081 100%
How often do students in your selected course section participate in a community-based project as a part of a regular course
In your experiences at this college during the current school year, about how often have you participated in a community-based project as a part of a regular course
How often do students in your selected course section work with classmates outside of class to prepare class assignments
In your experience at this college during the current school year, about how often have you worked with classmates outside of class to prepare class assignments
How often do students in your selected course section tutor or teach other students (paid or voluntary)
In your experience at this college during the current school year, about how often have you tutored or taught other students (paid or voluntary)
How often do students in your selected course section work with other students on projects during class
In your experience at this college during the current school year, about how often have you worked with other students on projects during class
How often do students in your selected course section come to class without completing readings or assignments
In your experiences at this college during the current school year, about how often have you come to class without completing readings or assignments
SFC1

2007 CCFSSE Student and Faculty Frequency DistributionsExample College
2007 CCFSSE Faculty Responses 2007 CCSSE Student Responses
Count Percent Count Percent Count Percent Count PercentAll StudentsPart-Time Faculty Full-Time Faculty All Faculty
Don't Know 6 20% 19 22% 25 21% Never 7 23% 10 11% 17 15% Never 199 18%
Sometimes 10 33% 21 24% 31 26% Sometimes 302 28%Often 1 3% 18 21% 19 16% Often 287 27%
Very Often 6 20% 19 22% 25 21% Very Often 295 27%Total 30 100% 87 100% 117 100% Total 1083 100%
Don't Know 0 0% 0 0% 0 0% Never 2 7% 4 5% 6 5% Never 342 32%
Sometimes 14 47% 45 52% 59 51% Sometimes 399 37%Often 8 27% 22 26% 30 26% Often 194 18%
Very Often 6 20% 15 17% 21 18% Very Often 143 13%Total 30 100% 86 100% 116 100% Total 1077 100%
Don't Know 0 0% 0 0% 0 0% Never 0 0% 0 0% 0 0% Never 134 12%
Sometimes 8 27% 32 37% 40 34% Sometimes 522 48%Often 14 47% 37 43% 51 44% Often 295 27%
Very Often 8 27% 17 20% 25 22% Very Often 126 12%Total 30 100% 86 100% 116 100% Total 1078 100%
Don't Know 0 0% 0 0% 0 0% Never 4 13% 2 2% 6 5% Never 396 37%
Sometimes 20 67% 54 63% 74 64% Sometimes 469 44%Often 6 20% 25 29% 31 27% Often 151 14%
Very Often 0 0% 5 6% 5 4% Very Often 60 6%Total 30 100% 86 100% 116 100% Total 1075 100%
D 't K 0 0% 0 0% 0 0%
How often do students in your selected course section talk about career plans with you
In your experiences at this college during the current school year, about how often have you talked about career plans with an instructor or advisor
H ft d t d t i l t d ti I i t thi ll d i th t h l
How often do students in your selected course section discuss grades or assignments with you
In your experience at this college during the current school year, about how often have you discussed grades or assignments with an instructor
How often do students in your selected course section use the internet or instant messaging to work on an assignment
In your experience at this college during the current school year, about how often have you used the internet or instant messaging to work on an assignment
How often do students in your selected course section use e-mail to communicate with you
In your experience at this college during the current school year, about how often have you used e-mail to communicate with an instructor
Don't Know 0 0% 0 0% 0 0% Never 4 13% 9 10% 13 11% Never 586 55%
Sometimes 19 63% 60 70% 79 68% Sometimes 363 34%Often 6 20% 13 15% 19 16% Often 89 8%
Very Often 1 3% 4 5% 5 4% Very Often 37 3%Total 30 100% 86 100% 116 100% Total 1075 100%
Don't Know 0 0% 0 0% 0 0% Never 0 0% 1 1% 1 1% Never 140 13%
Sometimes 5 17% 2 2% 7 6% Sometimes 452 42%Often 12 40% 37 43% 49 42% Often 337 31%
Very Often 13 43% 46 53% 59 51% Very Often 151 14%Total 30 100% 86 100% 116 100% Total 1080 100%
Don't Know 2 7% 8 9% 10 9% Never 0 0% 0 0% 0 0% Never 129 12%
Sometimes 8 27% 30 34% 38 32% Sometimes 424 39%Often 15 50% 33 38% 48 41% Often 380 35%
Very Often 5 17% 16 18% 21 18% Very Often 150 14%Total 30 100% 87 100% 117 100% Total 1083 100%
Don't Know 0 0% 0 0% 0 0% Never 22 73% 46 53% 68 58% Never 855 81%
Sometimes 8 27% 32 37% 40 34% Sometimes 148 14%Often 0 0% 5 6% 5 4% Often 45 4%
Very Often 0 0% 4 5% 4 3% Very Often 14 1%Total 30 100% 87 100% 117 100% Total 1061 100%
Don't Know 12 41% 33 38% 45 39% Never 0 0% 2 2% 2 2% Never 143 13%
Sometimes 13 45% 25 29% 38 33% Sometimes 395 37%Often 2 7% 22 25% 24 21% Often 324 30%
Very Often 2 7% 5 6% 7 6% Very Often 217 20%Total 29 100% 87 100% 116 100% Total 1079 100%
Don't Know 7 23% 22 26% 29 25% Never 0 0% 3 3% 3 3% Never 220 20%
Sometimes 10 33% 22 26% 32 28% Sometimes 337 31%Often 10 33% 24 28% 34 29% Often 264 24%
Very Often 3 10% 15 17% 18 16% Very Often 262 24%Total 30 100% 86 100% 116 100% Total 1082 100%
How often do students in your selected course section have serious conversations with students of a different race or ethnicity other than their own
In your experience at this college during the current school year, about how often have you had serious conversations with students of a different race or ethnicity other than your own
How often do students in your selected course section discuss ideas from their readings or classes with others outside of class (students, family members, co-workers, etc.)
In your experience at this college during the current school year, about how often have you discussed ideas from your readings or classes with others outside of class (students, family members, co-workers, etc.)
How often do students in your selected course section work harder than they thought they could to meet your standards or expectations
In your experience at this college during the current school year, about how often have you worked harder than you thought you could to meet an instructor's standards or expectations
How often do students in your selected course section work with you on activities other than coursework
In your experiences at this college during the current school year, about how often have you worked with instructors on activities other than coursework
How often do students in your selected course section receive prompt feedback (written or oral) from you about their performance
In your experience at this college during the current school year, about how often have you received prompt feedback (written or oral) from instructors on your performance
How often do students in your selected course section discuss ideas from their readings or classes with you outside of class
In your experience at this college during the current school year, about how often have you discussed ideas from your readings or classes with instructors outside of class
SFC2

2007 CCFSSE Student and Faculty Frequency DistributionsExample College
2007 CCFSSE Faculty Responses 2007 CCSSE Student Responses
Count Percent Count Percent Count Percent Count PercentAll StudentsPart-Time Faculty Full-Time Faculty All Faculty
Don't Know 12 40% 33 38% 45 38% Never 0 0% 2 2% 2 2% Never 236 22%
Sometimes 9 30% 22 25% 31 26% Sometimes 365 34%Often 9 30% 19 22% 28 24% Often 259 24%
Very Often 0 0% 11 13% 11 9% Very Often 221 20%Total 30 100% 87 100% 117 100% Total 1082 100%
Don't Know 1 3% 1 1% 2 2% Never 1 3% 0 0% 1 1% Never 458 42%
Sometimes 23 77% 66 76% 89 76% Sometimes 540 50%Often 3 10% 16 18% 19 16% Often 60 5%
Very Often 2 7% 4 5% 6 5% Very Often 26 2%Total 30 100% 87 100% 117 100% Total 1085 100%
Very Little 6 20% 12 14% 18 16% Very Little 60 6%Some 7 23% 32 37% 39 34% Some 324 30%
Quite a bit 14 47% 27 31% 41 35% Quite a bit 444 41%Very Much 3 10% 15 17% 18 16% Very Much 259 24%
Total 30 100% 86 100% 116 100% Total 1087 100%Very Little 1 3% 4 5% 5 4% Very Little 64 6%
Some 8 27% 8 9% 16 14% Some 331 31%Quite a bit 13 43% 44 52% 57 50% Quite a bit 456 42%Very Much 8 27% 29 34% 37 32% Very Much 233 21%
Total 30 100% 85 100% 115 100% Total 1085 100%Very Little 1 3% 3 3% 4 3% Very Little 107 10%
Some 10 33% 10 12% 20 17% Some 382 35%Q it bit 12 40% 42 49% 54 47% Q it bit 375 35%
During the current school year, how much doe the coursework in your selected course section emphasize synthesizing and
i i id i f ti i i
During the current school year, how much has your coursework at this college emphasized synthesizing and
i i id i f ti i i
During the current school year, how much does the coursework in your selected course section emphasize memorizing facts, ideas, or methods so the students can repeat them in pretty much the same form
During the current school year, how much has your coursework at this college emphasized memorizing facts, ideas, or methods from your courses and readings so you can repeat them in pretty much the same form
During the current school year, how much does the coursework in your selected course section emphasize analyzing the basic elements of an idea, experience, or theory
During the current school year, how much has your coursework at this college emphasized analyzing the basic elements of an idea, experience, or theory
How often do students in your selected course section skip class
In your experience at this college during the current school year, about how often have you skipped class
How often do students in your selected course section have serious conversations with students who differ from them in terms of their religious beliefs, political opinions, or personal values
In your experience at this college during the current school year, about how often have you had serious conversations with students who differ from you in terms of their religious beliefs, political opinions, or personal values
Quite a bit 12 40% 42 49% 54 47% Quite a bit 375 35%Very Much 7 23% 31 36% 38 33% Very Much 215 20%
Total 30 100% 86 100% 116 100% Total 1079 100%Very Little 3 10% 4 5% 7 6% Very Little 144 13%
Some 13 43% 30 35% 43 37% Some 394 36%Quite a bit 8 27% 30 35% 38 33% Quite a bit 356 33%Very Much 6 20% 22 26% 28 24% Very Much 186 17%
Total 30 100% 86 100% 116 100% Total 1080 100%Very Little 1 3% 3 3% 4 3% Very Little 140 13%
Some 14 47% 14 16% 28 24% Some 405 37%Quite a bit 10 33% 40 46% 50 43% Quite a bit 365 34%Very Much 5 17% 30 34% 35 30% Very Much 177 16%
Total 30 100% 87 100% 117 100% Total 1086 100%Very Little 7 23% 7 8% 14 12% Very Little 132 12%
Some 9 30% 20 23% 29 25% Some 351 32%Quite a bit 7 23% 36 41% 43 37% Quite a bit 385 35%Very Much 7 23% 24 28% 31 26% Very Much 219 20%
Total 30 100% 87 100% 117 100% Total 1086 100%None 1 3% 2 2% 3 3% None 23 2%
1 20 67% 46 53% 66 56% 1 to 4 472 44%2-3 7 23% 29 33% 36 31% 5 to 10 343 32%4-6 1 3% 4 5% 5 4% 11 to 20 134 12%
More than 6 1 3% 6 7% 7 6% More than 20 106 10%Total 30 100% 87 100% 117 100% Total 1078 100%
None 10 33% 28 32% 38 32% None 138 13%1 5 17% 11 13% 16 14% 1 to 4 396 37%
2 to 3 4 13% 14 16% 18 15% 5 to 10 315 29%4 to 6 4 13% 11 13% 15 13% 11 to 20 149 14%
More than 6 7 23% 23 26% 30 26% More than 20 83 8%Total 30 100% 87 100% 117 100% Total 1080 100%
During the current school year, how much does the coursework in your selected course section emphasize having students use information they have read or heard to perform a new skill
During the current school year, how much has your coursework at this college emphasized using information you have read or heard to perform a new skill
During the current school year, how much does the coursework in your selected course section emphasize making judgments about the value or soundness of information, arguments, or methods
During the current school year, how much has your coursework at this college emphasized making judgments about the value or soundness of information, arguments, or methods
During the current school year, how much does the coursework in your selected course section emphasize applying theories or concepts to practical problems or in new situations
During the current school year, how much has your coursework at this college emphasized applying theories or concepts to practical problems or in new situations
organizing ideas, information, or experiences in new ways
organizing ideas, information, or experiences in new ways
In your selected course section, what is the number of written papers or reports of any length that your students write
During the current school year, about what number of written papers or reports of any length do you write
In your selected course section, what is the number of assigned textbooks, manuals, books, or book-length packs of course readings that your students read
During the current school year, about what number of assigned textbooks, manuals, books, or book-length packs of course readings do you read
SFC3

2007 CCFSSE Student and Faculty Frequency DistributionsExample College
2007 CCFSSE Faculty Responses 2007 CCSSE Student Responses
Count Percent Count Percent Count Percent Count PercentAll StudentsPart-Time Faculty Full-Time Faculty All Faculty
Extremely Easy (1) 1 3% 0 0% 1 1% Extremely Easy (1) 8 1%(2) 0 0% 0 0% 0 0% (2) 14 1%(3) 0 0% 0 0% 0 0% (3) 53 5%(4) 4 14% 10 11% 14 12% (4) 233 22%(5) 14 48% 26 30% 40 34% (5) 351 34%(6) 9 31% 35 40% 44 38% (6) 261 25%
Extremely Challenging (7) 1 3% 16 18% 17 15% Extremely Challenging (7) 124 12%Total 29 100% 87 100% 116 100% Total 1045 100%
Not important 7 23% 19 22% 26 22% I have not done, nor plan to do 488 45%Somewhat important 10 33% 33 38% 43 37% I plan to do 467 43%
Very important 13 43% 35 40% 48 41% I have done 128 12%Total 30 100% 87 100% 117 100% Total 1083 100%
Not important 3 10% 11 13% 14 12% I have not done, nor plan to do 941 88%Somewhat important 9 30% 24 28% 33 28% I plan to do 55 5%
Very important 18 60% 52 60% 70 60% I have done 75 7%Total 30 100% 87 100% 117 100% Total 1071 100%
Not important 2 7% 0 0% 2 2% I have not done, nor plan to do 735 68%Somewhat important 6 20% 16 18% 22 19% I plan to do 66 6%
Very important 22 73% 71 82% 93 79% I have done 273 25%Total 30 100% 87 100% 117 100% Total 1074 100%
Not important 2 7% 0 0% 2 2% I have not done, nor plan to do 759 70%Somewhat important 6 20% 20 23% 26 22% I plan to do 101 9%
Very important 22 73% 67 77% 89 76% I have done 217 20%Total 30 100% 87 100% 117 100% Total 1078 100%
N t i t t 4 14% 7 8% 11 9% I h t d l t d 350 33%
How important is it to you that students participate in internships, field experience, co-op experience, or clinical assignment
Student activities: Internship, field experience, co-op experience, or clinical assignment
Select the circle that best represents the extent to which your examinations of student performance (eg. Exams, portfolio) challenge students to do their best work
Mark the response that best represents the extent to which your examinations during the current school year have challenged you to do your best work at this college
How important is it to you that students participate in developmental/remedial reading courses
Student activities: Developmental/remedial reading course
How important is it to you that students participate in English as a second language courses
Student activities: English as a second language course
H i t t i it t th t t d t ti i t i St d t ti iti D l t l/ di l th
How important is it to you that students participate in developmental/remedial writing courses
Student activities: Developmental/remedial writing course
Not important 4 14% 7 8% 11 9% I have not done, nor plan to do 350 33%Somewhat important 6 21% 17 20% 23 20% I plan to do 168 16%
Very important 19 66% 63 72% 82 71% I have done 556 52%Total 29 100% 87 100% 116 100% Total 1074 100%
Not important 1 3% 0 0% 1 1% I have not done, nor plan to do 695 64%Somewhat important 10 33% 20 23% 30 26% I plan to do 204 19%
Very important 19 63% 67 77% 86 74% I have done 179 17%Total 30 100% 87 100% 117 100% Total 1078 100%
Not important 5 17% 17 20% 22 19% I have not done, nor plan to do 763 71%Somewhat important 12 40% 35 40% 47 40% I plan to do 263 25%
Very important 13 43% 35 40% 48 41% I have done 46 4%Total 30 100% 87 100% 117 100% Total 1072 100%
Not important 3 10% 8 9% 11 9% I have not done, nor plan to do 378 35%Somewhat important 11 38% 31 36% 42 36% I plan to do 123 11%
Very important 15 52% 48 55% 63 54% I have done 573 53%Total 29 100% 87 100% 116 100% Total 1075 100%
Not important 7 23% 19 22% 26 22% I have not done, nor plan to do 776 72%Somewhat important 15 50% 47 54% 62 53% I plan to do 218 20%
Very important 8 27% 21 24% 29 25% I have done 84 8%Total 30 100% 87 100% 117 100% Total 1078 100%
Very Little 2 7% 9 10% 11 9% Very Little 56 5%Some 12 40% 31 36% 43 37% Some 215 20%
Quite a bit 10 33% 32 37% 42 36% Quite a bit 453 42%Very Much 6 20% 15 17% 21 18% Very Much 361 33%
Total 30 100% 87 100% 117 100% Total 1084 100%Very Little 1 3% 3 3% 4 3% Very Little 82 8%
Some 6 20% 14 16% 20 17% Some 313 29%Quite a bit 11 37% 40 46% 51 44% Quite a bit 414 38%Very Much 12 40% 30 34% 42 36% Very Much 275 25%
Total 30 100% 87 100% 117 100% Total 1083 100%Very Little 3 10% 7 8% 10 9% Very Little 246 23%
Some 3 10% 18 21% 21 18% Some 340 31%Quite a bit 14 47% 32 38% 46 40% Quite a bit 318 29%Very Much 10 33% 28 33% 38 33% Very Much 177 16%
Total 30 100% 85 100% 115 100% Total 1081 100%
How important is it to you that students participate in organized learning communities
Student activities: Organized learning communities
How important is it to you that students participate in a college orientation program or course
Student activities: College orientation program or course
How important is it to you that students participate in developmental/remedial math courses
Student activities: Developmental/remedial math course
How much does this college emphasize encouraging students to spend significant amounts of time studying
How much does this college emphasize encouraging you to spend significant amounts of time studying
How important is it to you that students participate in study skills courses
Student activities: Study skills course
How important is it to you that students participate in honors courses
Student activities: Honors course
How much does this college emphasize providing students the support they need to help them to succeed at this college
How much does this college emphasize providing the support you need to help you succeed at this college
How much does this college emphasize encouraging contact among students from different economic, social, and racial or ethnic backgrounds
How much does this college emphasize encouraging contact among students from different economic, social, and racial or ethnic backgrounds
SFC4

2007 CCFSSE Student and Faculty Frequency DistributionsExample College
2007 CCFSSE Faculty Responses 2007 CCSSE Student Responses
Count Percent Count Percent Count Percent Count PercentAll StudentsPart-Time Faculty Full-Time Faculty All Faculty
Very Little 4 13% 11 13% 15 13% Very Little 500 46%Some 12 40% 30 35% 42 37% Some 351 32%
Quite a bit 11 37% 31 36% 42 37% Quite a bit 150 14%Very Much 3 10% 13 15% 16 14% Very Much 82 8%
Total 30 100% 85 100% 115 100% Total 1083 100%Very Little 6 20% 15 18% 21 18% Very Little 366 34%
Some 17 57% 39 46% 56 49% Some 441 41%Quite a bit 5 17% 22 26% 27 23% Quite a bit 190 18%Very Much 2 7% 9 11% 11 10% Very Much 86 8%
Total 30 100% 85 100% 115 100% Total 1083 100%Very Little 1 3% 3 3% 4 3% Very Little 320 30%
Some 11 37% 16 18% 27 23% Some 277 26%Quite a bit 13 43% 44 51% 57 49% Quite a bit 231 21%Very Much 5 17% 24 28% 29 25% Very Much 251 23%
Total 30 100% 87 100% 117 100% Total 1080 100%Very Little 2 7% 2 2% 4 3% Very Little 103 10%
Some 4 14% 8 9% 12 10% Some 222 21%Quite a bit 12 41% 39 45% 51 44% Quite a bit 346 32%Very Much 11 38% 38 44% 49 42% Very Much 411 38%
Total 29 100% 87 100% 116 100% Total 1082 100%None 0 0% 0 0% 0 0% None 12 1%1 to 5 13 43% 43 51% 56 49% 1 to 5 513 48%
6 to 10 11 37% 25 29% 36 31% 6 to 10 295 27%11 to 20 6 20% 14 16% 20 17% 11 to 20 168 16%21 t 30 0 0% 2 2% 2 2% 21 t 30 59 5%
How much does this college emphasize providing students the support they need to thrive socially
How much does this college emphasize providing the support you need to thrive socially
How much does this college emphasize helping students cope with their non-academic responsibilities (work, family, etc.)
How much does this college emphasize helping you cope with your non-academic responsibilities (work, family, etc.)
How much does this college emphasize using computers in academic work
How much does this college emphasize using computers in academic work
How much does this college emphasize providing the financial support students need to afford their education
How much does this college emphasize providing the financial support you need to afford your education
About how many hours do you think full and part-time students at this college spend in a typical 7 - day week preparing for class (studying, reading, writing, rehearsing, doing homework, or other activities related to their programs)
About how many hours do you spend in a typical 7 - day week preparing for class (studying, reading, writing, rehearsing, doing homework, or other activities related to your programs)
21 to 30 0 0% 2 2% 2 2% 21 to 30 59 5%More than 30 0 0% 1 1% 1 1% More than 30 33 3%
Total 30 100% 85 100% 115 100% Total 1080 100%None 0 0% 1 1% 1 1% None 240 22%1 to 5 2 7% 0 0% 2 2% 1 to 5 39 4%
6 to 10 1 3% 2 2% 3 3% 6 to 10 60 6%11 to 20 3 10% 11 13% 14 12% 11 to 20 103 10%21 to 30 16 53% 36 42% 52 45% 21 to 30 187 17%
More than 30 8 27% 36 42% 44 38% More than 30 452 42%Total 30 100% 86 100% 116 100% Total 1082 100%
None 7 23% 25 29% 32 28% None 935 87%1 to 5 20 67% 54 64% 74 64% 1 to 5 100 9%
6 to 10 3 10% 1 1% 4 3% 6 to 10 28 3%11 to 20 0 0% 4 5% 4 3% 11 to 20 15 1%21 to 30 0 0% 0 0% 0 0% 21 to 30 1 0%
More than 30 0 0% 1 1% 1 1% More than 30 2 0%Total 30 100% 85 100% 115 100% Total 1081 100%
None 1 3% 0 0% 1 1% None 505 47%1 to 5 4 13% 6 7% 10 9% 1 to 5 146 14%
6 to 10 6 20% 15 17% 21 18% 6 to 10 67 6%11 to 20 9 30% 21 24% 30 26% 11 to 20 69 6%21 to 30 7 23% 28 33% 35 30% 21 to 30 48 4%
More than 30 3 10% 16 19% 19 16% More than 30 246 23%Total 30 100% 86 100% 116 100% Total 1081 100%
None 1 3% 0 0% 1 1% None 69 6%1 to 5 14 47% 42 49% 56 49% 1 to 5 709 66%
6 to 10 15 50% 34 40% 49 43% 6 to 10 210 19%11 to 20 0 0% 4 5% 4 3% 11 to 20 59 5%21 to 30 0 0% 3 4% 3 3% 21 to 30 16 1%
More than 30 0 0% 2 2% 2 2% More than 30 15 1%Total 30 100% 85 100% 115 100% Total 1078 100%
About how many hours do you think full and part-time students at this college spend in a typical 7 - day week working for pay
About how many hours do you spend in a typical 7 - day week working for pay
About how many hours do you think full and part-time students at this college spend in a typical 7 - day week participating in college-sponsored activities (organizations, campus publications, student government, intercollegiate or intramural sports, etc.)
About how many hours do you spend in a typical 7 - day week participating in college-sponsored activities (organizations, campus publications, student government, intercollegiate or intramural sports, etc.)
About how many hours do you think full and part-time students at this college spend in a typical 7 - day week commuting to and from class.
About how many hours do you spend in a typical 7 - day week commuting to and from class
About how many hours do you think full and part-time students at this college spend in a typical 7 - day week providing care for dependents living with them (parents, children, spouse, etc.)
About how many hours do you spend in a typical 7 - day week providing care for dependents living with you (parents, children, spouse, etc.)
SFC5

2007 CCFSSE Student and Faculty Frequency DistributionsExample College
2007 CCFSSE Faculty Responses 2007 CCSSE Student Responses
Count Percent Count Percent Count Percent Count PercentAll StudentsPart-Time Faculty Full-Time Faculty All Faculty
Unfriendly, unsupportive, sense of alienation (1) 0 0% 0 0% 0 0%
Unfriendly, unsupportive, sense of alienation (1) 17 2%
(2) 0 0% 0 0% 0 0% (2) 27 2%(3) 1 3% 8 9% 9 8% (3) 50 5%(4) 5 17% 10 12% 15 13% (4) 196 18%(5) 10 33% 27 31% 37 32% (5) 273 25%(6) 10 33% 30 35% 40 34% (6) 267 25%
Friendly, supportive, sense of belonging (7( 4 13% 11 13% 15 13%
Friendly, supportive, sense of belonging (7( 254 23%
Total 30 100% 86 100% 116 100% Total 1084 100%Unavailable, unhelpful,
unsympathetic (1) 0 0% 0 0% 0 0%Unavailable, unhelpful,
unsympathetic (1) 8 1%(2) 0 0% 1 1% 1 1% (2) 28 3%(3) 1 3% 3 3% 4 3% (3) 58 5%(4) 3 10% 11 13% 14 12% (4) 175 16%(5) 10 33% 26 30% 36 31% (5) 267 25%(6) 11 37% 34 40% 45 39% (6) 308 28%
Available, helpful, sympathetic (7) 5 17% 11 13% 16 14%
Available, helpful, sympathetic (7) 238 22%
Total 30 100% 86 100% 116 100% Total 1082 100%Unhelpful, inconsiderate, rigid
(1) 0 0% 1 1% 1 1%Unhelpful, inconsiderate, rigid
(1) 47 4%(2) 1 3% 6 7% 7 6% (2) 81 8%(3) 4 13% 9 10% 13 11% (3) 125 12%(4) 5 17% 22 26% 27 23% (4) 268 25%
Select the circle that best represents the quality of student relationships with administrative personnel and offices
Mark the number that best represents the quality of your relationships with administrative personnel and offices at this college
Select the circle that best represents the quality of student relationships with other students
Mark the number that best represents the quality of your relationships with other students at this college
Select the circle that best represents the quality of student relationships with instructors
Mark the number that best represents the quality of your relationships with instructors at this college
(4) 5 17% 22 26% 27 23% (4) 268 25%(5) 10 33% 26 30% 36 31% (5) 244 23%(6) 7 23% 16 19% 23 20% (6) 178 16%
Helpful, considerate, flexible (7) 3 10% 6 7% 9 8% Helpful, considerate, flexible (7) 139 13%Total 30 100% 86 100% 116 100% Total 1082 100%
None 0 0% 0 0% 0 0% Very little 1 3% 3 3% 4 3% Very little 64 6%
Some 8 27% 25 29% 33 28% Some 253 23%Quite a bit 16 53% 26 30% 42 36% Quite a bit 446 41%Very much 5 17% 33 38% 38 32% Very much 318 29%
Total 30 100% 87 100% 117 100% Total 1081 100%None 0 0% 0 0% 0 0%
Very little 3 10% 3 3% 6 5% Very little 282 26%Some 6 20% 26 30% 32 28% Some 335 31%
Quite a bit 12 40% 25 29% 37 32% Quite a bit 278 26%Very much 9 30% 32 37% 41 35% Very much 185 17%
Total 30 100% 86 100% 116 100% Total 1081 100%None 1 3% 2 2% 3 3%
Very little 1 3% 14 16% 15 13% Very little 138 13%Some 12 40% 26 30% 38 32% Some 316 29%
Quite a bit 7 23% 23 26% 30 26% Quite a bit 401 37%Very much 9 30% 22 25% 31 26% Very much 223 21%
Total 30 100% 87 100% 117 100% Total 1078 100%None 1 3% 2 2% 3 3%
Very little 4 13% 13 15% 17 15% Very little 180 17%Some 11 37% 28 32% 39 33% Some 311 29%
Quite a bit 6 20% 26 30% 32 27% Quite a bit 362 34%Very much 8 27% 18 21% 26 22% Very much 227 21%
Total 30 100% 87 100% 117 100% Total 1079 100%None 0 0% 0 0% 0 0%
Very little 0 0% 1 1% 1 1% Very little 69 6%Some 9 30% 15 17% 24 21% Some 281 26%
Quite a bit 11 37% 27 31% 38 32% Quite a bit 452 42%Very much 10 33% 44 51% 54 46% Very much 280 26%
Total 30 100% 87 100% 117 100% Total 1082 100%
To what extent do students' experiences in your selected course section contribute to their knowledge, skills, and personal development in speaking clearly and effectively
How much has your experience at this college contributed to your knowledge, skills, and personal development in speaking clearly and effectively
To what extent do students' experiences in your selected course section contribute to their knowledge, skills, and personal development in thinking critically and analytically
How much has your experience at this college contributed to your knowledge, skills, and personal development in thinking critically and analytically
To what extent do students' experiences in your selected course section contribute to their knowledge, skills, and personal development in writing clearly and effectively
How much has your experience at this college contributed to your knowledge, skills, and personal development in writing clearly and effectively
To what extent do students' experiences in your selected course section contribute to their knowledge, skills, and personal development in acquiring a broad general education
How much has your experience at this college contributed to your knowledge, skills, and personal development in acquiring a broad general education
To what extent do students' experiences in your selected course section contribute to their knowledge, skills, and personal development in acquiring job or work-related knowledge and skills
How much has your experience at this college contributed to your knowledge, skills, and personal development in acquiring job or work-related knowledge and skills
SFC6

2007 CCFSSE Student and Faculty Frequency DistributionsExample College
2007 CCFSSE Faculty Responses 2007 CCSSE Student Responses
Count Percent Count Percent Count Percent Count PercentAll StudentsPart-Time Faculty Full-Time Faculty All Faculty
None 13 43% 21 24% 34 29% Very little 5 17% 21 24% 26 22% Very little 197 18%
Some 5 17% 17 20% 22 19% Some 333 31%Quite a bit 0 0% 9 10% 9 8% Quite a bit 354 33%Very much 7 23% 19 22% 26 22% Very much 192 18%
Total 30 100% 87 100% 117 100% Total 1077 100%None 6 20% 7 8% 13 11%
Very little 3 10% 13 15% 16 14% Very little 185 17%Some 8 27% 27 31% 35 30% Some 302 28%
Quite a bit 5 17% 17 20% 22 19% Quite a bit 339 32%Very much 8 27% 23 26% 31 26% Very much 250 23%
Total 30 100% 87 100% 117 100% Total 1077 100%None 0 0% 1 1% 1 1%
Very little 3 10% 7 8% 10 9% Very little 143 13%Some 12 40% 35 40% 47 40% Some 368 34%
Quite a bit 10 33% 26 30% 36 31% Quite a bit 360 33%Very much 5 17% 18 21% 23 20% Very much 210 19%
Total 30 100% 87 100% 117 100% Total 1082 100%None 0 0% 0 0% 0 0%
Very little 1 3% 3 3% 4 3% Very little 96 9%Some 1 3% 12 14% 13 11% Some 278 26%
Quite a bit 19 63% 38 44% 57 49% Quite a bit 426 40%Very much 9 30% 34 39% 43 37% Very much 278 26%
Total 30 100% 87 100% 117 100% Total 1078 100%N 2 7% 2 2% 4 3%T h t t t d t d t ' i i l t d H h h i t thi ll t ib t d t
To what extent do students' experiences in your selected course section contribute to their knowledge, skills, and personal development in learning effectively on their own
How much has your experience at this college contributed to your knowledge, skills, and personal development in learning effectively on your own
To what extent do students' experiences in your selected course section contribute to their knowledge, skills, and personal development in using computing and information technology
How much has your experience at this college contributed to your knowledge, skills, and personal development in using computing and information technology
To what extent do students' experiences in your selected course section contribute to their knowledge, skills, and personal development in working effectively with others
How much has your experience at this college contributed to your knowledge, skills, and personal development in working effectively with others
To what extent do students' experiences in your selected course section contribute to their knowledge, skills, and personal development in solving numerical problems
How much has your experience at this college contributed to your knowledge, skills, and personal development in solving numerical problems
None 2 7% 2 2% 4 3% Very little 1 3% 14 16% 15 13% Very little 196 18%
Some 9 30% 24 28% 33 28% Some 292 27%Quite a bit 14 47% 25 29% 39 33% Quite a bit 337 31%Very much 4 13% 22 25% 26 22% Very much 254 24%
Total 30 100% 87 100% 117 100% Total 1079 100%None 2 7% 5 6% 7 6%
Very little 3 10% 13 15% 16 14% Very little 255 24%Some 11 37% 22 25% 33 28% Some 341 32%
Quite a bit 11 37% 26 30% 37 32% Quite a bit 299 28%Very much 3 10% 21 24% 24 21% Very much 182 17%
Total 30 100% 87 100% 117 100% Total 1076 100%None 0 0% 2 2% 2 2%
Very little 4 13% 7 8% 11 9% Very little 291 27%Some 15 50% 35 40% 50 43% Some 328 31%
Quite a bit 6 20% 26 30% 32 27% Quite a bit 289 27%Very much 5 17% 17 20% 22 19% Very much 167 16%
Total 30 100% 87 100% 117 100% Total 1076 100%None 1 3% 11 13% 12 10%
Very little 4 13% 14 16% 18 15% Very little 435 40%Some 10 33% 36 41% 46 39% Some 375 35%
Quite a bit 12 40% 18 21% 30 26% Quite a bit 187 17%Very much 3 10% 8 9% 11 9% Very much 78 7%
Total 30 100% 87 100% 117 100% Total 1075 100%None 1 3% 0 0% 1 1%
Very little 2 7% 9 10% 11 9% Very little 185 17%Some 8 27% 27 31% 35 30% Some 301 28%
Quite a bit 14 47% 29 33% 43 37% Quite a bit 353 33%Very much 5 17% 22 25% 27 23% Very much 241 22%
Total 30 100% 87 100% 117 100% Total 1081 100%None 3 10% 1 1% 4 3%
Very little 1 3% 14 16% 15 13% Very little 241 22%Some 13 43% 38 44% 51 44% Some 315 29%
Quite a bit 9 30% 20 23% 29 25% Quite a bit 320 30%Very much 4 13% 14 16% 18 15% Very much 204 19%
Total 30 100% 87 100% 117 100% Total 1081 100%
To what extent do students' experiences in your selected course section contribute to their knowledge, skills, and personal development in gaining information about career opportunities
How much has your experience at this college contributed to your knowledge, skills, and personal development in gaining information about career opportunities
To what extent do students' experiences in your selected course section contribute to their knowledge, skills, and personal development in contributing to the welfare of their community
How much has your experience at this college contributed to your knowledge, skills, and personal development in contributing to the welfare of your community
To what extent do students' experiences in your selected course section contribute to their knowledge, skills, and personal development in developing clearer career goals
How much has your experience at this college contributed to your knowledge, skills, and personal development in developing clearer career goals
To what extent do students' experiences in your selected course section contribute to their knowledge, skills, and personal development in developing a personal code of values and ethics
How much has your experience at this college contributed to your knowledge, skills, and personal development in developing a personal code of values and ethics
To what extent do students' experiences in your selected course section contribute to their knowledge, skills, and personal development in understanding themselves
How much has your experience at this college contributed to your knowledge, skills, and personal development in understanding yourself
To what extent do students' experiences in your selected course section contribute to their knowledge, skills, and personal development in understanding people of other racial and ethnic backgrounds
How much has your experience at this college contributed to your knowledge, skills, and personal development in understanding people of other racial and ethnic backgrounds
SFC7

2007 CCFSSE Student and Faculty Frequency DistributionsExample College
2007 CCFSSE Faculty Responses 2007 CCSSE Student Responses
Count Percent Count Percent Count Percent Count PercentAll StudentsPart-Time Faculty Full-Time Faculty All Faculty
Don't know/N.A. 0 0% 1 1% 1 1% Don't know/N.A. 94 9%Rarely or never 14 47% 13 15% 27 23% Rarely or never 396 37%
Sometimes 11 37% 46 54% 57 50% Sometimes 467 44%Often 5 17% 25 29% 30 26% Often 111 10%
Total 30 100% 85 100% 115 100% Total 1068 100%Don't know/N.A. 3 10% 3 3% 6 5% Don't know/N.A. 179 17%Rarely or never 17 57% 19 22% 36 31% Rarely or never 495 46%
Sometimes 8 27% 51 59% 59 51% Sometimes 320 30%Often 2 7% 13 15% 15 13% Often 71 7%
Total 30 100% 86 100% 116 100% Total 1065 100%Don't know/N.A. 5 17% 3 4% 8 7% Don't know/N.A. 471 44%Rarely or never 20 67% 33 39% 53 46% Rarely or never 476 45%
Sometimes 3 10% 38 45% 41 36% Sometimes 89 8%Often 2 7% 11 13% 13 11% Often 24 2%
Total 30 100% 85 100% 115 100% Total 1061 100%Don't know/N.A. 1 3% 1 1% 2 2% Don't know/N.A. 310 29%Rarely or never 8 27% 12 14% 20 17% Rarely or never 479 45%
Sometimes 14 47% 37 44% 51 44% Sometimes 205 20%Often 7 23% 35 41% 42 37% Often 59 6%
Total 30 100% 85 100% 115 100% Total 1053 100%Don't know/N.A. 2 7% 2 2% 4 3% Don't know/N.A. 257 24%Rarely or never 12 40% 11 13% 23 20% Rarely or never 391 37%
Sometimes 6 20% 39 45% 45 39% Sometimes 256 24%Often 10 33% 34 40% 44 38% Often 158 15%
T t l 30 100% 86 100% 116 100% T t l 1061 100%
How often do you refer students to peer or other tutoring How often do you use peer or other tutoring
How often do you refer students to skill labs (writing, math, etc.)
How often do you use skills labs (writing, math, etc.)
How often do you refer students to job placement assistance How often do you use job placement assistance
How often do you refer students to academic advising/planning
How often do you use academic advising/planning
How often do you refer students to career counseling How often do you use career counseling
Total 30 100% 86 100% 116 100% Total 1061 100%Don't know/N.A. 7 23% 11 13% 18 16% Don't know/N.A. 655 62%Rarely or never 20 67% 44 52% 64 56% Rarely or never 373 35%
Sometimes 3 10% 26 31% 29 25% Sometimes 21 2%Often 0 0% 4 5% 4 3% Often 10 1%
Total 30 100% 85 100% 115 100% Total 1059 100%Don't know/N.A. 4 13% 6 7% 10 9% Don't know/N.A. 242 23%Rarely or never 19 63% 35 41% 54 47% Rarely or never 331 32%
Sometimes 6 20% 31 36% 37 32% Sometimes 263 25%Often 1 3% 14 16% 15 13% Often 216 21%
Total 30 100% 86 100% 116 100% Total 1052 100%Don't know/N.A. 1 3% 2 2% 3 3% Don't know/N.A. 159 15%Rarely or never 8 28% 7 8% 15 13% Rarely or never 253 24%
Sometimes 11 38% 34 40% 45 39% Sometimes 319 30%Often 9 31% 42 49% 51 45% Often 323 31%
Total 29 100% 85 100% 114 100% Total 1054 100%Don't know/N.A. 6 20% 5 6% 11 10% Don't know/N.A. 434 41%Rarely or never 20 67% 38 45% 58 50% Rarely or never 474 45%
Sometimes 4 13% 32 38% 36 31% Sometimes 110 10%Often 0 0% 10 12% 10 9% Often 36 3%
Total 30 100% 85 100% 115 100% Total 1053 100%Don't know/N.A. 5 17% 2 2% 7 6% Don't know/N.A. 372 35%Rarely or never 22 73% 32 37% 54 47% Rarely or never 407 38%
Sometimes 3 10% 38 44% 41 35% Sometimes 218 21%Often 0 0% 14 16% 14 12% Often 62 6%
Total 30 100% 86 100% 116 100% Total 1058 100%Don't know/N.A. 1 3% 1 1% 2 2% Don't know/N.A. 629 59%Rarely or never 14 47% 12 14% 26 22% Rarely or never 361 34%
Sometimes 12 40% 52 60% 64 55% Sometimes 34 3%Often 3 10% 21 24% 24 21% Often 40 4%
Total 30 100% 86 100% 116 100% Total 1063 100%Not at all 0 0% 2 2% 2 2% Not at all 92 9%
Somewhat 9 30% 26 31% 35 31% Somewhat 281 27%Very 21 70% 56 67% 77 68% Very 668 64%
Total 30 100% 84 100% 114 100% Total 1041 100%
How important do you believe academic advising/planning is to students at this college
How important is academic advising/planning to you at this college
How often do you refer students to transfer credit assistance How often do you use transfer credit assistance
How often do you refer students to services to students with disabilities
How often do you use services to students with disabilities
How often do you refer students to student organizations How often do you use student organizations
How often do you refer students to financial aid advising How often do you use financial aid advising
How often do you refer students to computer labs How often do you use computer labs
How often do you refer students to child care How often do you use child care
SFC8

2007 CCFSSE Student and Faculty Frequency DistributionsExample College
2007 CCFSSE Faculty Responses 2007 CCSSE Student Responses
Count Percent Count Percent Count Percent Count PercentAll StudentsPart-Time Faculty Full-Time Faculty All Faculty
Not at all 1 3% 4 5% 5 4% Not at all 147 14%Somewhat 12 40% 25 30% 37 32% Somewhat 258 25%
Very 17 57% 55 65% 72 63% Very 620 60%Total 30 100% 84 100% 114 100% Total 1025 100%
Not at all 1 3% 1 1% 2 2% Not at all 379 37%Somewhat 15 50% 32 38% 47 41% Somewhat 275 27%
Very 14 47% 52 61% 66 57% Very 363 36%Total 30 100% 85 100% 115 100% Total 1018 100%
Not at all 1 3% 1 1% 2 2% Not at all 272 27%Somewhat 14 47% 25 29% 39 34% Somewhat 294 29%
Very 15 50% 59 69% 74 64% Very 446 44%Total 30 100% 85 100% 115 100% Total 1012 100%
Not at all 1 3% 0 0% 1 1% Not at all 219 22%Somewhat 8 27% 22 26% 30 26% Somewhat 276 27%
Very 21 70% 63 74% 84 73% Very 521 51%Total 30 100% 85 100% 115 100% Total 1016 100%
Not at all 1 3% 1 1% 2 2% Not at all 544 54%Somewhat 17 57% 32 38% 49 43% Somewhat 156 15%
Very 12 40% 52 61% 64 56% Very 313 31%Total 30 100% 85 100% 115 100% Total 1013 100%
Not at all 0 0% 0 0% 0 0% Not at all 186 18%Somewhat 8 27% 18 21% 26 23% Somewhat 123 12%
Very 22 73% 67 79% 89 77% Very 705 70%Total 30 100% 85 100% 115 100% Total 1014 100%
N t t ll 1 3% 0 0% 1 1% N t t ll 132 13%H i t t d b li t l b t t d t H i t t t l b t t thi ll
How important do you believe financial aid advising is to students at this college
How important is financial aid advising to you at this college
How important do you believe skills labs (writing, math, etc.) are to students at this college
How important are skills labs (writing, math, etc.) to you at this college
How important do you believe child care is to students at this college
How important is child care to you at this college
How important do you believe peer and other tutoring is to students at this college
How important is peer and other tutoring to you at this college
How important do you believe career counseling is to students at this college
How important is career counseling to you at this college
How important do you believe job placement assistance is to students at this college
How important is job placement assistance to you at this college
Not at all 1 3% 0 0% 1 1% Not at all 132 13%Somewhat 9 30% 16 19% 25 22% Somewhat 234 23%
Very 20 67% 69 81% 89 77% Very 650 64%Total 30 100% 85 100% 115 100% Total 1016 100%
Not at all 5 17% 12 14% 17 15% Not at all 392 39%Somewhat 20 67% 44 52% 64 56% Somewhat 377 38%
Very 5 17% 28 33% 33 29% Very 233 23%Total 30 100% 84 100% 114 100% Total 1002 100%
Not at all 1 3% 1 1% 2 2% Not at all 254 25%Somewhat 11 37% 26 31% 37 32% Somewhat 194 19%
Very 18 60% 58 68% 76 66% Very 564 56%Total 30 100% 85 100% 115 100% Total 1012 100%
Not at all 1 3% 0 0% 1 1% Not at all 402 40%Somewhat 9 30% 28 34% 37 33% Somewhat 131 13%
Very 20 67% 55 66% 75 66% Very 482 47%Total 30 100% 83 100% 113 100% Total 1015 100%
Not likely 1 3% 1 1% 2 2% Not likely 403 37%Somewhat likely 9 30% 7 8% 16 14% Somewhat likely 242 22%
Likely 5 17% 20 23% 25 22% Likely 173 16%Very likely 15 50% 58 67% 73 63% Very likely 261 24%
Total 30 100% 86 100% 116 100% Total 1080 100%Not likely 1 3% 2 2% 3 3% Not likely 525 49%
Somewhat likely 13 45% 10 12% 23 20% Somewhat likely 233 22%Likely 8 28% 28 33% 36 31% Likely 170 16%
Very likely 7 24% 46 53% 53 46% Very likely 144 13%Total 29 100% 86 100% 115 100% Total 1073 100%
Not likely 0 0% 1 1% 1 1% Not likely 543 51%Somewhat likely 2 7% 11 13% 13 11% Somewhat likely 296 28%
Likely 16 53% 23 27% 39 34% Likely 155 15%Very likely 12 40% 51 59% 63 54% Very likely 74 7%
Total 30 100% 86 100% 116 100% Total 1069 100%
How likely is it that being academically unprepared would cause students to withdraw from class or from this college
How likely is it that being academically unprepared would cause you to withdraw from class or from this college
How likely is it that caring for dependents would cause students to withdraw from class or from this college
How likely is it that caring for dependents would cause you to withdraw from class or from this college
How important do you believe services to students with disabilities are to students at this college
How important are services to students with disabilities to you at this college
How likely is it that working full-time would cause students to withdraw from class or from this college
How likely is it that working full-time would cause you to withdraw from class or from this college
How important do you believe transfer credit assistance is to students at this college
How important is transfer credit assistance to you at this college
How important do you believe computer labs are to students at this college
How important are computer labs to you at this college
How important do you believe student organizations are to students at this college
How important are student organizations to you at this college
SFC9

2007 CCFSSE Student and Faculty Frequency DistributionsExample College
2007 CCFSSE Faculty Responses 2007 CCSSE Student Responses
Count Percent Count Percent Count Percent Count PercentAll StudentsPart-Time Faculty Full-Time Faculty All Faculty
Not likely 0 0% 3 3% 3 3% Not likely 295 28%Somewhat likely 8 27% 20 23% 28 24% Somewhat likely 255 24%
Likely 15 50% 27 31% 42 36% Likely 180 17%Very likely 7 23% 36 42% 43 37% Very likely 338 32%
Total 30 100% 86 100% 116 100% Total 1069 100%Not likely 5 17% 11 13% 16 14% Not likely 253 23%
Somewhat likely 12 40% 35 41% 47 41% Somewhat likely 155 14%Likely 12 40% 22 26% 34 29% Likely 229 21%
Very likely 1 3% 18 21% 19 16% Very likely 439 41%Total 30 100% 86 100% 116 100% Total 1076 100%
How likely is it that transferring to a 4-year college or university would cause students to withdraw from class or from this college
How likely is it that transferring to a 4-year college or university would cause you to withdraw from class or from this college
How likely is it that lacking finances would cause students to withdraw from class or from this college
How likely is it that lack of finances would cause you to withdraw from class or from this college
SFC10

Example College
Count Percent Count Percent Count PercentFewer than 10 2 7% 2 2% 4 3%
10 to 19 11 37% 31 36% 42 36%20 to 29 13 43% 42 48% 55 47%30 to 39 4 13% 12 14% 16 14%40 to 69 0 0% 0 0% 0 0%
70 or more 0 0% 0 0% 0 0%Total 30 100% 87 100% 117 100%
None 6 20% 4 5% 10 9%1 to 3 7 23% 5 6% 12 10%4 to 6 2 7% 5 6% 7 6%7 to 9 3 10% 7 8% 10 9%
10 to 15 3 10% 13 15% 16 14%16 to 20 2 7% 9 10% 11 9%
21 or more 7 23% 44 51% 51 44%Total 30 100% 87 100% 117 100%
N.A. 4 13% 4 5% 8 7%Rarely or never 14 47% 31 36% 45 39%
Sometimes 11 37% 34 40% 45 39%Often 1 3% 17 20% 18 16%
Total 30 100% 86 100% 116 100%
How much do you incorporate the use of academic advising/planning into your selected course section
How many students are enrolled in your selected course section
Prior to the Spring semester, how many times have you taught your selected course?
2007 CCFSSE Faculty Only Frequency Distributions
Part-Time Faculty Full-Time Faculty All Faculty
Total 30 100% 86 100% 116 100%N.A. 4 14% 3 3% 7 6%
Rarely or never 16 55% 35 41% 51 44%Sometimes 8 28% 35 41% 43 37%
Often 1 3% 13 15% 14 12%Total 29 100% 86 100% 115 100%
N.A. 7 23% 15 17% 22 19%Rarely or never 19 63% 48 56% 67 58%
Sometimes 2 7% 20 23% 22 19%Often 2 7% 3 3% 5 4%
Total 30 100% 86 100% 116 100%N.A. 2 7% 3 3% 5 4%
Rarely or never 11 37% 25 29% 36 31%Sometimes 10 33% 32 37% 42 36%
Often 7 23% 26 30% 33 28%Total 30 100% 86 100% 116 100%
N.A. 3 11% 5 6% 8 7%Rarely or never 12 43% 31 36% 43 38%
Sometimes 6 21% 26 30% 32 28%Often 7 25% 24 28% 31 27%
Total 28 100% 86 100% 114 100%
How much do you incorporate the use of skills labs (writing, math, etc.) into your selected course section
How much do you incorporate the use of career counseling into your course section
How much do you incorporate the use of job placement assistance into your selected course section
How much do you incorporate the use of peer or other tutoring into your course section
FF1

Example College
Count Percent Count Percent Count Percent
2007 CCFSSE Faculty Only Frequency Distributions
Part-Time Faculty Full-Time Faculty All Faculty
N.A. 8 27% 22 26% 30 26%Rarely or never 20 67% 54 64% 74 65%
Sometimes 2 7% 8 10% 10 9%Often 0 0% 0 0% 0 0%
Total 30 100% 84 100% 114 100%N.A. 8 27% 18 21% 26 22%
Rarely or never 18 60% 46 53% 64 55%Sometimes 4 13% 19 22% 23 20%
Often 0 0% 3 3% 3 3%Total 30 100% 86 100% 116 100%
N.A. 3 10% 6 7% 9 8%Rarely or never 7 23% 18 21% 25 22%
Sometimes 10 33% 30 35% 40 34%Often 10 33% 32 37% 42 36%
Total 30 100% 86 100% 116 100%N.A. 7 24% 8 10% 15 13%
Rarely or never 20 69% 45 54% 65 58%Sometimes 2 7% 25 30% 27 24%
Often 0 0% 5 6% 5 4%Total 29 100% 83 100% 112 100%
How much do you incorporate the use of student organizations into your selected course section
How much do you incorporate the use of child care into your course section
How much do you incorporate the use of financial aid advising into your selected course section
How much do you incorporate the use of computer labs into your course section
Total 29 100% 83 100% 112 100%N.A. 8 27% 6 7% 14 12%
Rarely or never 19 63% 42 49% 61 53%Sometimes 3 10% 27 32% 30 26%
Often 0 0% 10 12% 10 9%Total 30 100% 85 100% 115 100%
N.A. 2 7% 4 5% 6 5%Rarely or never 16 53% 18 21% 34 30%
Sometimes 8 27% 48 56% 56 49%Often 4 13% 15 18% 19 17%
Total 30 100% 85 100% 115 100%Not likely 0 0% 0 0% 0 0%
Somewhat likely 6 21% 12 14% 18 16%Likely 16 55% 27 31% 43 37%
Very likely 7 24% 47 55% 54 47%Total 29 100% 86 100% 115 100%
None 0 0% 0 0% 0 0%1 to 4 10 33% 8 9% 18 15%5 to 8 6 20% 6 7% 12 10%
9 to 12 10 33% 13 15% 23 20%13 to 16 3 10% 30 34% 33 28%17 to 20 0 0% 22 25% 22 19%21 to 30 0 0% 7 8% 7 6%
31 or more 1 3% 1 1% 2 2%Total 30 100% 87 100% 117 100%
About how many hours do you spend in a typical 7-day week teaching students in class
How likely is it that personal issues would cause students to withdraw from class or from this college?
How much do you incorporate the use of transfer credit assistance into your course section
How much do you incorporate the use of services to students with disabilities into your selected course section
FF2
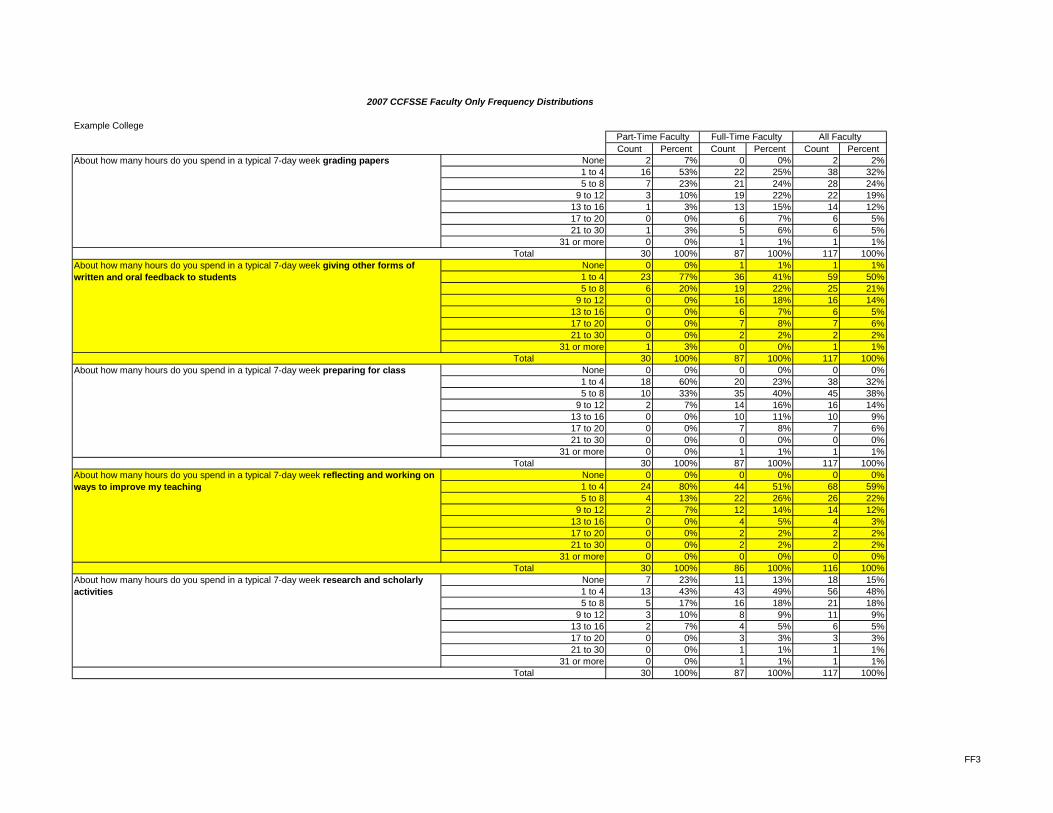
Example College
Count Percent Count Percent Count Percent
2007 CCFSSE Faculty Only Frequency Distributions
Part-Time Faculty Full-Time Faculty All Faculty
None 2 7% 0 0% 2 2%1 to 4 16 53% 22 25% 38 32%5 to 8 7 23% 21 24% 28 24%
9 to 12 3 10% 19 22% 22 19%13 to 16 1 3% 13 15% 14 12%17 to 20 0 0% 6 7% 6 5%21 to 30 1 3% 5 6% 6 5%
31 or more 0 0% 1 1% 1 1%Total 30 100% 87 100% 117 100%
None 0 0% 1 1% 1 1%1 to 4 23 77% 36 41% 59 50%5 to 8 6 20% 19 22% 25 21%
9 to 12 0 0% 16 18% 16 14%13 to 16 0 0% 6 7% 6 5%17 to 20 0 0% 7 8% 7 6%21 to 30 0 0% 2 2% 2 2%
31 or more 1 3% 0 0% 1 1%Total 30 100% 87 100% 117 100%
None 0 0% 0 0% 0 0%1 to 4 18 60% 20 23% 38 32%
About how many hours do you spend in a typical 7-day week giving other forms of written and oral feedback to students
About how many hours do you spend in a typical 7-day week preparing for class
About how many hours do you spend in a typical 7-day week grading papers
1 to 4 18 60% 20 23% 38 32%5 to 8 10 33% 35 40% 45 38%
9 to 12 2 7% 14 16% 16 14%13 to 16 0 0% 10 11% 10 9%17 to 20 0 0% 7 8% 7 6%21 to 30 0 0% 0 0% 0 0%
31 or more 0 0% 1 1% 1 1%Total 30 100% 87 100% 117 100%
None 0 0% 0 0% 0 0%1 to 4 24 80% 44 51% 68 59%5 to 8 4 13% 22 26% 26 22%
9 to 12 2 7% 12 14% 14 12%13 to 16 0 0% 4 5% 4 3%17 to 20 0 0% 2 2% 2 2%21 to 30 0 0% 2 2% 2 2%
31 or more 0 0% 0 0% 0 0%Total 30 100% 86 100% 116 100%
None 7 23% 11 13% 18 15%1 to 4 13 43% 43 49% 56 48%5 to 8 5 17% 16 18% 21 18%
9 to 12 3 10% 8 9% 11 9%13 to 16 2 7% 4 5% 6 5%17 to 20 0 0% 3 3% 3 3%21 to 30 0 0% 1 1% 1 1%
31 or more 0 0% 1 1% 1 1%Total 30 100% 87 100% 117 100%
About how many hours do you spend in a typical 7-day week research and scholarly activities
About how many hours do you spend in a typical 7-day week reflecting and working on ways to improve my teaching
FF3
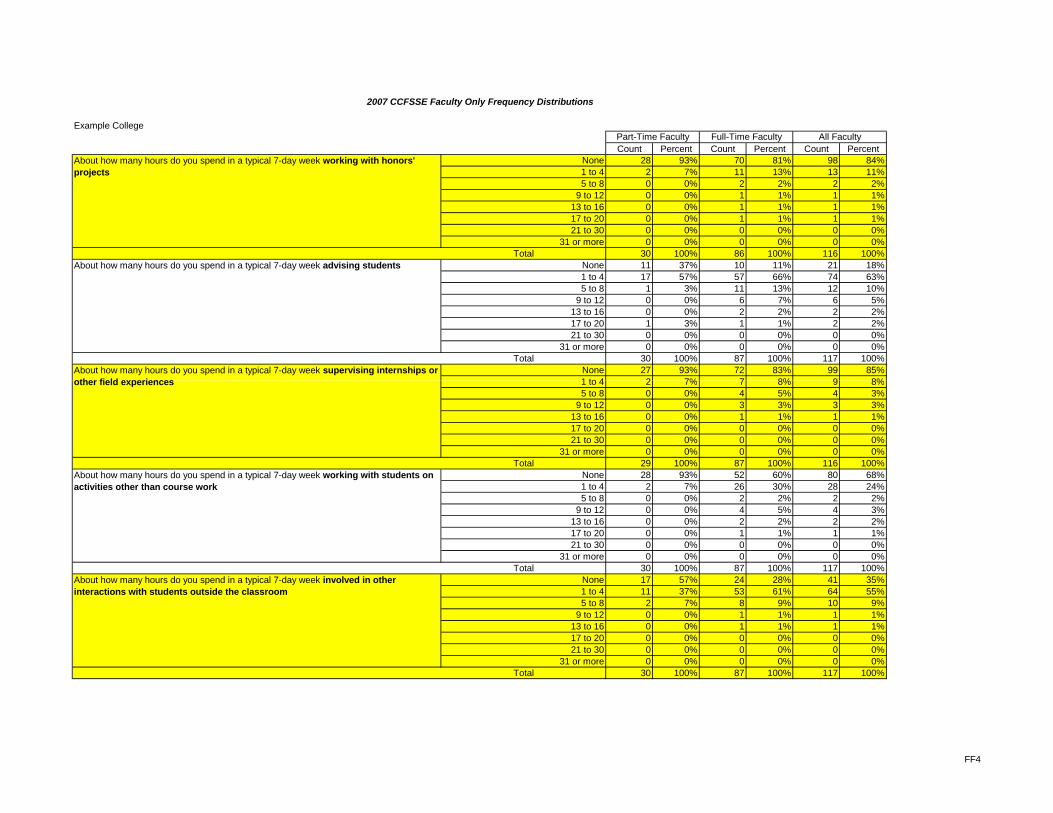
Example College
Count Percent Count Percent Count Percent
2007 CCFSSE Faculty Only Frequency Distributions
Part-Time Faculty Full-Time Faculty All Faculty
None 28 93% 70 81% 98 84%1 to 4 2 7% 11 13% 13 11%5 to 8 0 0% 2 2% 2 2%
9 to 12 0 0% 1 1% 1 1%13 to 16 0 0% 1 1% 1 1%17 to 20 0 0% 1 1% 1 1%21 to 30 0 0% 0 0% 0 0%
31 or more 0 0% 0 0% 0 0%Total 30 100% 86 100% 116 100%
None 11 37% 10 11% 21 18%1 to 4 17 57% 57 66% 74 63%5 to 8 1 3% 11 13% 12 10%
9 to 12 0 0% 6 7% 6 5%13 to 16 0 0% 2 2% 2 2%17 to 20 1 3% 1 1% 2 2%21 to 30 0 0% 0 0% 0 0%
31 or more 0 0% 0 0% 0 0%Total 30 100% 87 100% 117 100%
None 27 93% 72 83% 99 85%1 to 4 2 7% 7 8% 9 8%
About how many hours do you spend in a typical 7-day week supervising internships or other field experiences
About how many hours do you spend in a typical 7-day week working with honors' projects
About how many hours do you spend in a typical 7-day week advising students
1 to 4 2 7% 7 8% 9 8%5 to 8 0 0% 4 5% 4 3%
9 to 12 0 0% 3 3% 3 3%13 to 16 0 0% 1 1% 1 1%17 to 20 0 0% 0 0% 0 0%21 to 30 0 0% 0 0% 0 0%
31 or more 0 0% 0 0% 0 0%Total 29 100% 87 100% 116 100%
None 28 93% 52 60% 80 68%1 to 4 2 7% 26 30% 28 24%5 to 8 0 0% 2 2% 2 2%
9 to 12 0 0% 4 5% 4 3%13 to 16 0 0% 2 2% 2 2%17 to 20 0 0% 1 1% 1 1%21 to 30 0 0% 0 0% 0 0%
31 or more 0 0% 0 0% 0 0%Total 30 100% 87 100% 117 100%
None 17 57% 24 28% 41 35%1 to 4 11 37% 53 61% 64 55%5 to 8 2 7% 8 9% 10 9%
9 to 12 0 0% 1 1% 1 1%13 to 16 0 0% 1 1% 1 1%17 to 20 0 0% 0 0% 0 0%21 to 30 0 0% 0 0% 0 0%
31 or more 0 0% 0 0% 0 0%Total 30 100% 87 100% 117 100%
About how many hours do you spend in a typical 7-day week working with students on activities other than course work
About how many hours do you spend in a typical 7-day week involved in other interactions with students outside the classroom
other field experiences
FF4

Example College
Count Percent Count Percent Count Percent
2007 CCFSSE Faculty Only Frequency Distributions
Part-Time Faculty Full-Time Faculty All Faculty
None 25 83% 62 71% 87 74%1 to 4 5 17% 17 20% 22 19%5 to 8 0 0% 6 7% 6 5%
9 to 12 0 0% 1 1% 1 1%13 to 16 0 0% 1 1% 1 1%17 to 20 0 0% 0 0% 0 0%21 to 30 0 0% 0 0% 0 0%
31 or more 0 0% 0 0% 0 0%Total 30 100% 87 100% 117 100%
None 23 77% 30 35% 53 46%1 to 4 5 17% 29 34% 34 30%5 to 8 2 7% 13 15% 15 13%
9 to 12 0 0% 6 7% 6 5%13 to 16 0 0% 2 2% 2 2%17 to 20 0 0% 2 2% 2 2%21 to 30 0 0% 0 0% 0 0%
31 or more 0 0% 3 4% 3 3%Total 30 100% 85 100% 115 100%
None 25 83% 12 14% 37 32%1 to 4 4 13% 56 64% 60 51%
About how many hours do you spend in a typical 7-day week conducting service activities
About how many hours do you spend in a typical 7-day week coordination and/or administrative activities
About how many hours do you spend in a typical 7-day week participating on college committees or task forces 1 to 4 4 13% 56 64% 60 51%
5 to 8 1 3% 11 13% 12 10%9 to 12 0 0% 1 1% 1 1%
13 to 16 0 0% 6 7% 6 5%17 to 20 0 0% 0 0% 0 0%21 to 30 0 0% 1 1% 1 1%
31 or more 0 0% 0 0% 0 0%Total 30 100% 87 100% 117 100%
None 26 87% 33 38% 59 50%1 to 4 4 13% 49 56% 53 45%5 to 8 0 0% 3 3% 3 3%
9 to 12 0 0% 0 0% 0 0%13 to 16 0 0% 1 1% 1 1%17 to 20 0 0% 0 0% 0 0%21 to 30 0 0% 0 0% 0 0%
31 or more 0 0% 1 1% 1 1%Total 30 100% 87 100% 117 100%
0% 2 7% 1 1% 3 3%1 to 9% 2 7% 9 10% 11 9%
10 to 19% 4 14% 14 16% 18 16%20 to 29% 1 3% 11 13% 12 10%30 to 39% 0 0% 4 5% 4 3%40 to 49% 6 21% 15 17% 21 18%50 to 74% 12 41% 25 29% 37 32%
75 to 100% 2 7% 8 9% 10 9%Total 29 100% 87 100% 116 100%
In your selected course section, on average, what percent of class time is spent on lecture
committees or task forces
About how many hours do you spend in a typical 7-day week mentoring other faculty
FF5

Example College
Count Percent Count Percent Count Percent
2007 CCFSSE Faculty Only Frequency Distributions
Part-Time Faculty Full-Time Faculty All Faculty
0 3 11% 3 4% 6 5%1 to 9% 5 19% 24 29% 29 26%
10 to 19% 11 41% 19 23% 30 27%20 to 29% 4 15% 16 19% 20 18%30 to 39% 1 4% 10 12% 11 10%40 to 49% 0 0% 4 5% 4 4%50 to 74% 3 11% 5 6% 8 7%
75 to 100% 0 0% 3 4% 3 3%Total 27 100% 84 100% 111 100%
0% 8 28% 23 27% 31 27%1 to 9% 11 38% 25 29% 36 32%
10 to 19% 4 14% 12 14% 16 14%20 to 29% 3 10% 10 12% 13 11%30 to 39% 2 7% 5 6% 7 6%40 to 49% 0 0% 3 4% 3 3%50 to 74% 1 3% 6 7% 7 6%
75 to 100% 0 0% 1 1% 1 1%Total 29 100% 85 100% 114 100%
0 16 57% 40 46% 56 49%1 to 9% 2 7% 20 23% 22 19%
In your selected course section, on average, what percent of class time is spent on teacher-led discussion
In your selected course section, on average, what percent of class time is spent on teacher-student shared responsibility (seminar, discussion, etc.)
In your selected course section, on average, what percent of class time is spent on student computer use 1 to 9% 2 7% 20 23% 22 19%
10 to 19% 5 18% 4 5% 9 8%20 to 29% 1 4% 11 13% 12 10%30 to 39% 1 4% 5 6% 6 5%40 to 49% 1 4% 2 2% 3 3%50 to 74% 1 4% 3 3% 4 3%
75 to 100% 1 4% 2 2% 3 3%Total 28 100% 87 100% 115 100%
0% 11 38% 26 30% 37 32%1 to 9% 10 34% 27 31% 37 32%
10 to 19% 3 10% 12 14% 15 13%20 to 29% 3 10% 9 10% 12 10%30 to 39% 2 7% 7 8% 9 8%40 to 49% 0 0% 2 2% 2 2%50 to 74% 0 0% 1 1% 1 1%
75 to 100% 0 0% 2 2% 2 2%Total 29 100% 86 100% 115 100%
0 17 61% 36 42% 53 47%1 to 9% 6 21% 28 33% 34 30%
10 to 19% 3 11% 12 14% 15 13%20 to 29% 1 4% 4 5% 5 4%30 to 39% 1 4% 1 1% 2 2%40 to 49% 0 0% 1 1% 1 1%50 to 74% 0 0% 3 4% 3 3%
75 to 100% 0 0% 0 0% 0 0%Total 28 100% 85 100% 113 100%
In your selected course section, on average, what percent of class time is spent on small group activities
In your selected course section, on average, what percent of class time is spent on student presentations
student computer use
FF6

Example College
Count Percent Count Percent Count Percent
2007 CCFSSE Faculty Only Frequency Distributions
Part-Time Faculty Full-Time Faculty All Faculty
0% 17 61% 41 48% 58 51%1 to 9% 4 14% 22 26% 26 23%
10 to 19% 3 11% 11 13% 14 12%20 to 29% 2 7% 4 5% 6 5%30 to 39% 2 7% 4 5% 6 5%40 to 49% 0 0% 2 2% 2 2%50 to 74% 0 0% 1 1% 1 1%
75 to 100% 0 0% 0 0% 0 0%Total 28 100% 85 100% 113 100%
0 1 3% 2 2% 3 3%1 to 9% 16 55% 45 53% 61 54%
10 to 19% 11 38% 28 33% 39 34%20 to 29% 0 0% 5 6% 5 4%30 to 39% 1 3% 4 5% 5 4%40 to 49% 0 0% 0 0% 0 0%50 to 74% 0 0% 1 1% 1 1%
75 to 100% 0 0% 0 0% 0 0%Total 29 100% 85 100% 114 100%
0% 27 93% 76 90% 103 91%1 to 9% 1 3% 1 1% 2 2%
In your selected course section, on average, what percent of class time is spent on testing and evaluation
In your selected course section, on average, what percent of class time is spent on performances in applied and fine arts (dance drama music)
In your selected course section, on average, what percent of class time is spent on in-class writing
1 to 9% 1 3% 1 1% 2 2%10 to 19% 0 0% 3 4% 3 3%20 to 29% 0 0% 1 1% 1 1%30 to 39% 0 0% 0 0% 0 0%40 to 49% 0 0% 0 0% 0 0%50 to 74% 1 3% 3 4% 4 4%
75 to 100% 0 0% 0 0% 0 0%Total 29 100% 84 100% 113 100%
0 20 71% 58 67% 78 68%1 to 9% 4 14% 5 6% 9 8%
10 to 19% 1 4% 8 9% 9 8%20 to 29% 2 7% 4 5% 6 5%30 to 39% 0 0% 2 2% 2 2%40 to 49% 1 4% 5 6% 6 5%50 to 74% 0 0% 3 3% 3 3%
75 to 100% 0 0% 1 1% 1 1%Total 28 100% 86 100% 114 100%
0% 10 36% 22 26% 32 28%1 to 9% 6 21% 23 27% 29 25%
10 to 19% 6 21% 12 14% 18 16%20 to 29% 1 4% 5 6% 6 5%30 to 39% 1 4% 6 7% 7 6%40 to 49% 1 4% 6 7% 7 6%50 to 74% 2 7% 8 9% 10 9%
75 to 100% 1 4% 4 5% 5 4%Total 28 100% 86 100% 114 100%
In your selected course section, on average, what percent of class time is spent on hands-on practice
performances in applied and fine arts (dance, drama, music)
In your selected course section, on average, what percent of class time is spent on experiential (labs, field work, art exhibits, clinical placements, internships)
FF7

Example College
Count Percent Count Percent Count Percent
2007 CCFSSE Faculty Only Frequency Distributions
Part-Time Faculty Full-Time Faculty All Faculty
Part-time faculty 30 100% 0 0% 30 26%Full-time faculty 0 0% 87 100% 87 74%
Total 30 100% 87 100% 117 100%1 to 3 hours 4 13% 1 1% 5 4%4 to 6 hours 6 20% 4 5% 10 9%7 to 9 hours 5 17% 1 1% 6 5%
10 to 12 hours 5 17% 3 3% 8 7%13 to 15 hours 2 7% 9 10% 11 9%16 to 18 hours 5 17% 12 14% 17 15%19 to 21 hours 1 3% 1 1% 2 2%22 to 24 hours 0 0% 5 6% 5 4%25 to 27 hours 1 3% 4 5% 5 4%28 to 30 hours 1 3% 6 7% 7 6%
More than 30 hours 0 0% 41 47% 41 35%Total 30 100% 87 100% 117 100%
No 29 97% 79 91% 108 92%Yes 1 3% 8 9% 9 8%
Total 30 100% 87 100% 117 100%No 27 90% 77 89% 104 89%
Yes 3 10% 10 11% 13 11%
During the current academic year, is team teaching part of your teaching role at this college
During the current academic year, are linked courses part of your teaching role at this college
During this term, does your institution consider you to be employed part-time or full-time
What is the total number of credit hours you are scheduled to teach during the current academic year (including summer sessions) at this college
Yes 3 10% 10 11% 13 11%Total 30 100% 87 100% 117 100%
No 28 93% 72 83% 100 85%Yes 2 7% 15 17% 17 15%
Total 30 100% 87 100% 117 100%No 29 97% 75 86% 104 89%
Yes 1 3% 12 14% 13 11%Total 30 100% 87 100% 117 100%
No 28 93% 41 47% 69 59%Yes 2 7% 46 53% 48 41%
Total 30 100% 87 100% 117 100%No 30 100% 79 91% 109 93%
Yes 0 0% 8 9% 8 7%Total 30 100% 87 100% 117 100%
No 24 80% 48 55% 72 62%Yes 6 20% 39 45% 45 38%
Total 30 100% 87 100% 117 100%No 28 93% 74 85% 102 87%
Yes 2 7% 13 15% 15 13%Total 30 100% 87 100% 117 100%
No 26 87% 81 93% 107 91%Yes 4 13% 6 7% 10 9%
Total 30 100% 87 100% 117 100%
During the current academic year, are distance learning courses part of your teaching role at this college
During the current academic year, is service learning (community service) incorporated into your course part of your teaching role at this college
During the current academic year, are independent studies part of your teaching role at this college
During the current academic year, are capstone courses part of your teaching role at this college
During the current academic year, is academic advising part of your teaching role at this college
During the current academic year, is clinical and other field supervision of student work part of your teaching role at this college
college
During the current academic year, are learning communities part of your teaching role at this college
FF8

Example College
Count Percent Count Percent Count Percent
2007 CCFSSE Faculty Only Frequency Distributions
Part-Time Faculty Full-Time Faculty All Faculty
Other 3 10% 1 1% 4 3%Lecturer 3 10% 0 0% 3 3%
Instructor 22 73% 16 19% 38 33%Assistant Professor 1 3% 13 15% 14 12%Associate Professor 1 3% 22 26% 23 20%
Professor 0 0% 34 40% 34 29%Total 30 100% 86 100% 116 100%
No tenure system at this institution 0 0% 0 0% 0 0%Not on tenure track, although this
institution has a tenure system 30 100% 4 5% 34 29%On tenure track but not tenured 0 0% 12 14% 12 10%
Tenured 0 0% 70 81% 70 60%Total 30 100% 86 100% 116 100%
40 years or more 0 0% 5 6% 5 4%30 to 39 years 2 7% 18 21% 20 17%20 to 29 years 2 7% 21 24% 23 20%10 to 19 years 9 30% 30 35% 39 34%
5 to 9 years 8 27% 10 12% 18 16%1 to 4 years 5 17% 2 2% 7 6%
First year teacher 4 13% 0 0% 4 3%
How many years of teaching experience do you have in any college/university, not including graduate teaching assistant positions
Which of the following best describes your academic rank, title, or current position (Mark only one)
What is your current tenure status (Mark only one)
First-year teacher 4 13% 0 0% 4 3%Total 30 100% 86 100% 116 100%
Other 1 3% 0 0% 1 1%Associate degree 0 0% 0 0% 0 0%
Bachelor's degree 2 7% 3 3% 5 4%Master's degree 21 70% 59 69% 80 69%
Doctoral degree (e.g.,Ph.D., Ed.D.) 4 13% 21 24% 25 22%First professional degree (e.g.M.D.,
D.D.S., J.D., D.V.M.) 2 7% 3 3% 5 4%Total 30 100% 86 100% 116 100%
22 to 24 0 0% 0 0% 0 0%25 to 29 1 3% 0 0% 1 1%30 to 39 2 7% 10 12% 12 10%40 to 49 9 30% 19 22% 28 24%50 to 64 13 43% 51 59% 64 55%
65 or more 5 17% 6 7% 11 9%Total 30 100% 86 100% 116 100%
Male 18 60% 40 47% 58 50%Female 12 40% 45 53% 57 50%
Total 30 100% 85 100% 115 100%
What is the highest degree you have earned
What is your age group
What is your gender
FF9

Example College
Count Percent Count Percent Count Percent
2007 CCFSSE Faculty Only Frequency Distributions
Part-Time Faculty Full-Time Faculty All Faculty
United States citizen, native 29 97% 83 97% 112 97%United States citizen, naturalized 1 3% 3 3% 4 3%Permanent resident of the United
States (immigrant visa) 0 0% 0 0% 0 0%Temporary resident of the United
States (non-immigrant visa) 0 0% 0 0% 0 0%Total 30 100% 86 100% 116 100%
American Indian or Native American 0 0% 1 1% 1 1%Asian, Asian American, or Pacific
Islander 1 3% 3 4% 4 4%Native Hawaiian 0 0% 0 0% 0 0%
Black or African American, Non-Hispanic 0 0% 1 1% 1 1%
White, Non-Hispanic 24 83% 62 74% 86 76%Hispanic, Latino, or Spanish 2 7% 15 18% 17 15%
Other 2 7% 2 2% 4 4%Total 29 100% 84 100% 113 100%
No 22 73% 79 92% 101 87%Yes 8 27% 7 8% 15 13%
Total 30 100% 86 100% 116 100%
What is your citizenship status
What is your racial or ethnic identification (Mark only one)
Where are you employed outside of this college: Self-employed
Total 30 100% 86 100% 116 100%No 23 77% 86 100% 109 94%
Yes 7 23% 0 0% 7 6%Total 30 100% 86 100% 116 100%
No 29 97% 86 100% 115 99%Yes 1 3% 0 0% 1 1%
Total 30 100% 86 100% 116 100%No 26 87% 84 98% 110 95%
Yes 4 13% 2 2% 6 5%Total 30 100% 86 100% 116 100%
No 29 97% 86 100% 115 99%Yes 1 3% 0 0% 1 1%
Total 30 100% 86 100% 116 100%No 24 80% 83 97% 107 92%
Yes 6 20% 3 3% 9 8%Total 30 100% 86 100% 116 100%
No 23 77% 14 16% 37 32%Yes 7 23% 72 84% 79 68%
Total 30 100% 86 100% 116 100%
Where are you employed outside of this college: Part-time non-academic position
Where are you employed outside of this college: Work related to my teaching field at this college
Where are you employed outside of this college: Not employed elsewhere
Where are you employed outside of this college: Other college(s) in teaching position
Where are you employed outside of this college: Other college(s) in non-teaching position
Where are you employed outside of this college: Full-time non-academic position
FF10

2007 CCFSSE Cohort
Student and Faculty Frequency Distributions
There are two reports in this section. The first report summarizes the observed frequencies of occurrence (counts and percentages) of the values for generally equivalent items from all faculty (part-time, full-time, and all faculty) in the 2007 CCFSSE Cohort, and all student data from 2007 CCSSE Cohort colleges that are also members of the 2007 CCFSSE Cohort. The second report summarizes the observed frequencies of occurrence (counts and percentages) from the 2007 CCFSSE Cohort for all faculty survey items that do not appear on the student survey. Data are presented for part-time, full-time, and all faculty respondents.

2007 CCFSSE Student and Faculty Frequency Distributions
2007 CCFSSE Faculty Responses 2007 CCSSE Student Responses
Count Percent Count Percent Count Percent Count PercentDon't Know 2 0% 7 0% 9 0%
Never 20 0% 28 0% 48 0% Never 3828 3%Sometimes 1502 18% 1898 15% 3400 17% Sometimes 47281 34%
Often 2935 35% 4124 34% 7059 34% Often 49083 35%Very Often 3847 46% 6196 51% 10043 49% Very Often 39818 28%
Total 8306 100% 12253 100% 20559 100% Total 140010 100%Don't Know 29 0% 28 0% 57 0%
Never 2889 35% 4072 33% 6961 34% Never 44150 32%Sometimes 3230 39% 4897 40% 8127 40% Sometimes 55874 40%
Often 1191 14% 1791 15% 2982 15% Often 28275 20%Very Often 932 11% 1424 12% 2356 12% Very Often 11109 8%
Total 8271 100% 12212 100% 20483 100% Total 139408 100%Don't Know 922 11% 1012 8% 1934 10%
Never 3323 41% 4914 40% 8237 41% Never 29787 21%Sometimes 2237 27% 3524 29% 5761 28% Sometimes 41242 30%
Often 948 12% 1465 12% 2413 12% Often 40889 29%Very Often 761 9% 1220 10% 1981 10% Very Often 26995 19%
Total 8191 100% 12135 100% 20326 100% Total 138913 100%Don't Know 121 1% 96 1% 217 1%
Never 1580 19% 2031 17% 3611 18% Never 16242 12%Sometimes 2432 30% 3509 29% 5941 29% Sometimes 40783 29%
Often 2170 26% 3281 27% 5451 27% Often 50872 37%Very Often 1921 23% 3256 27% 5177 25% Very Often 31206 22%
How often do students in your selected course section prepare two or more drafts of a paper or assignment before turning it in
How often do students in your selected course section work on a paper that requires integrating ideas or information from various sources
In your experience at this college during the current school year, about how often have you made a class presentation
In your experience at this college during the current school year, about how often have you prepared two or more drafts of a paper or assignment before turning it in
In your experiences at this college during the current school year, about how often have you asked questions in class or contributed to class discussions
Full-Time Faculty All Faculty All Students
How often do students in your selected course section ask questions in class or contribute to class discussions
How often do students in your selected course section make a class presentation
Part-Time Faculty
In your experience at this college during the current school year, about how often have you worked on a paper or project that required integrating ideas or information from various sources
Total 8224 100% 12173 100% 20397 100% Total 139103 100%Don't Know 300 4% 346 3% 646 3%
Never 408 5% 394 3% 802 4% Never 40308 29%Sometimes 4910 59% 6686 55% 11596 57% Sometimes 77808 56%
Often 1889 23% 3293 27% 5182 25% Often 15053 11%Very Often 772 9% 1488 12% 2260 11% Very Often 5562 4%
Total 8279 100% 12207 100% 20486 100% Total 138731 100%Don't Know 112 1% 75 1% 187 1%
Never 1212 15% 1486 12% 2698 13% Never 18494 13%Sometimes 2964 36% 4012 33% 6976 34% Sometimes 55768 40%
Often 2138 26% 3321 27% 5459 27% Often 45296 33%Very Often 1847 22% 3317 27% 5164 25% Very Often 18897 14%
Total 8273 100% 12211 100% 20484 100% Total 138455 100%Don't Know 1497 18% 1458 12% 2955 14%
Never 1262 15% 1418 12% 2680 13% Never 58219 42%Sometimes 3505 42% 5292 43% 8797 43% Sometimes 51946 37%
Often 1460 18% 2730 22% 4190 20% Often 20845 15%Very Often 535 6% 1307 11% 1842 9% Very Often 7982 6%
Total 8259 100% 12205 100% 20464 100% Total 138992 100%Don't Know 3447 42% 3407 28% 6854 34%
Never 1315 16% 1676 14% 2991 15% Never 102107 73%Sometimes 2571 31% 4770 39% 7341 36% Sometimes 26902 19%
Often 700 8% 1727 14% 2427 12% Often 6955 5%Very Often 219 3% 622 5% 841 4% Very Often 3409 2%
Total 8252 100% 12202 100% 20454 100% Total 139373 100%Don't Know 2803 34% 2441 20% 5244 26%
Never 4011 49% 6375 52% 10386 51% Never 108820 78%Sometimes 985 12% 2213 18% 3198 16% Sometimes 21092 15%
Often 245 3% 633 5% 878 4% Often 6191 4%Very Often 169 2% 483 4% 652 3% Very Often 2669 2%
Total 8213 100% 12145 100% 20358 100% Total 138773 100%
How often do students in your selected course section come to class without completing readings or assignments
In your experiences at this college during the current school year, about how often have you come to class without completing readings or assignments
How often do students in your selected course section work with classmates outside of class to prepare class assignments
In your experience at this college during the current school year, about how often have you worked with classmates outside of class to prepare class assignments
How often do students in your selected course section work with other students on projects during class
In your experience at this college during the current school year, about how often have you worked with other students on projects during class
How often do students in your selected course section participate in a community-based project as a part of a regular course
In your experiences at this college during the current school year, about how often have you participated in a community-based project as a part of a regular course
How often do students in your selected course section tutor or teach other students (paid or voluntary)
In your experience at this college during the current school year, about how often have you tutored or taught other students (paid or voluntary)
SFC1

2007 CCFSSE Student and Faculty Frequency Distributions
2007 CCFSSE Faculty Responses 2007 CCSSE Student Responses
Count Percent Count Percent Count Percent Count PercentFull-Time Faculty All Faculty All StudentsPart-Time Faculty
Don't Know 1341 16% 1324 11% 2665 13% Never 782 9% 1130 9% 1912 9% Never 17771 13%
Sometimes 2454 30% 3556 29% 6010 29% Sometimes 35252 25%Often 1845 22% 2902 24% 4747 23% Often 41856 30%
Very Often 1824 22% 3273 27% 5097 25% Very Often 43918 32%Total 8246 100% 12185 100% 20431 100% Total 138798 100%
Don't Know 9 0% 16 0% 25 0% Never 275 3% 377 3% 652 3% Never 27110 20%
Sometimes 3049 37% 4676 38% 7725 38% Sometimes 49570 36%Often 2732 33% 3859 32% 6591 32% Often 36105 26%
Very Often 2224 27% 3288 27% 5512 27% Very Often 26012 19%Total 8289 100% 12216 100% 20505 100% Total 138797 100%
Don't Know 7 0% 8 0% 15 0% Never 46 1% 55 0% 101 0% Never 13884 10%
Sometimes 2554 31% 3191 26% 5745 28% Sometimes 62365 45%Often 3711 45% 5722 47% 9433 46% Often 42793 31%
Very Often 1966 24% 3230 26% 5196 25% Very Often 19837 14%Total 8284 100% 12206 100% 20490 100% Total 138879 100%
Don't Know 28 0% 13 0% 41 0% Never 695 8% 591 5% 1286 6% Never 44233 32%
Sometimes 4756 58% 6266 51% 11022 54% Sometimes 61409 44%Often 1939 23% 3403 28% 5342 26% Often 23795 17%
Very Often 849 10% 1906 16% 2755 13% Very Often 9383 7%
How often do students in your selected course section use e-mail to communicate with you
In your experience at this college during the current school year, about how often have you used e-mail to communicate with an instructor
How often do students in your selected course section use the internet or instant messaging to work on an assignment
In your experience at this college during the current school year, about how often have you used the internet or instant messaging to work on an assignment
How often do students in your selected course section talk about career plans with you
In your experiences at this college during the current school year, about how often have you talked about career plans with an instructor or advisor
How often do students in your selected course section discuss grades or assignments with you
In your experience at this college during the current school year, about how often have you discussed grades or assignments with an instructor
Total 8267 100% 12179 100% 20446 100% Total 138820 100%Don't Know 56 1% 44 0% 100 0%
Never 1145 14% 934 8% 2079 10% Never 66101 48%Sometimes 4835 59% 7204 59% 12039 59% Sometimes 51203 37%
Often 1589 19% 2908 24% 4497 22% Often 15710 11%Very Often 609 7% 1088 9% 1697 8% Very Often 5540 4%
Total 8234 100% 12178 100% 20412 100% Total 138553 100%Don't Know 7 0% 9 0% 16 0%
Never 23 0% 25 0% 48 0% Never 11292 8%Sometimes 619 7% 794 7% 1413 7% Sometimes 49883 36%
Often 3365 41% 4812 39% 8177 40% Often 53546 39%Very Often 4268 52% 6562 54% 10830 53% Very Often 23936 17%
Total 8282 100% 12202 100% 20484 100% Total 138657 100%Don't Know 674 8% 739 6% 1413 7%
Never 106 1% 132 1% 238 1% Never 15842 11%Sometimes 2857 34% 3984 33% 6841 33% Sometimes 56162 40%
Often 3491 42% 5236 43% 8727 43% Often 46916 34%Very Often 1162 14% 2133 17% 3295 16% Very Often 19973 14%
Total 8290 100% 12224 100% 20514 100% Total 138894 100%Don't Know 158 2% 137 1% 295 1%
Never 4562 55% 4221 35% 8783 43% Never 98454 71%Sometimes 2905 35% 6116 50% 9021 44% Sometimes 27541 20%
Often 499 6% 1327 11% 1826 9% Often 8599 6%Very Often 130 2% 394 3% 524 3% Very Often 3112 2%
Total 8254 100% 12195 100% 20449 100% Total 137706 100%Don't Know 2944 36% 3667 30% 6611 32%
Never 230 3% 262 2% 492 2% Never 17631 13%Sometimes 2960 36% 4466 37% 7426 36% Sometimes 53242 38%
Often 1654 20% 2922 24% 4576 22% Often 42872 31%Very Often 480 6% 880 7% 1360 7% Very Often 25541 18%
Total 8268 100% 12197 100% 20465 100% Total 139286 100%Don't Know 3124 38% 4091 34% 7215 35%
Never 317 4% 377 3% 694 3% Never 32978 24%Sometimes 1984 24% 3215 26% 5199 25% Sometimes 47182 34%
Often 1850 22% 2840 23% 4690 23% Often 33052 24%Very Often 987 12% 1660 14% 2647 13% Very Often 25964 19%
Total 8262 100% 12183 100% 20445 100% Total 139175 100%
How often do students in your selected course section receive prompt feedback (written or oral) from you about their performance
In your experience at this college during the current school year, about how often have you received prompt feedback (written or oral) from instructors on your performance
How often do students in your selected course section discuss ideas from their readings or classes with you outside of class
In your experience at this college during the current school year, about how often have you discussed ideas from your readings or classes with instructors outside of class
How often do students in your selected course section work with you on activities other than coursework
In your experiences at this college during the current school year, about how often have you worked with instructors on activities other than coursework
How often do students in your selected course section work harder than they thought they could to meet your standards or expectations
In your experience at this college during the current school year, about how often have you worked harder than you thought you could to meet an instructor's standards or expectations
How often do students in your selected course section have serious conversations with students of a different race or ethnicity other than their own
In your experience at this college during the current school year, about how often have you had serious conversations with students of a different race or ethnicity other than your own
How often do students in your selected course section discuss ideas from their readings or classes with others outside of class (students, family members, co-workers, etc.)
In your experience at this college during the current school year, about how often have you discussed ideas from your readings or classes with others outside of class (students, family members, co-workers, etc.)
SFC2

2007 CCFSSE Student and Faculty Frequency Distributions
2007 CCFSSE Faculty Responses 2007 CCSSE Student Responses
Count Percent Count Percent Count Percent Count PercentFull-Time Faculty All Faculty All StudentsPart-Time Faculty
Don't Know 3661 44% 4865 40% 8526 42% Never 354 4% 397 3% 751 4% Never 32836 24%
Sometimes 1889 23% 3116 26% 5005 25% Sometimes 50373 36%Often 1536 19% 2455 20% 3991 20% Often 32725 24%
Very Often 806 10% 1341 11% 2147 11% Very Often 23074 17%Total 8246 100% 12174 100% 20420 100% Total 139007 100%
Don't Know 331 4% 374 3% 705 3% Never 498 6% 960 8% 1458 7% Never 67655 49%
Sometimes 6164 75% 9053 74% 15217 74% Sometimes 62673 45%Often 988 12% 1414 12% 2402 12% Often 6311 5%
Very Often 292 4% 392 3% 684 3% Very Often 2735 2%Total 8273 100% 12193 100% 20466 100% Total 139374 100%
Very Little 1767 21% 2712 22% 4479 22% Very Little 10210 7%Some 2905 35% 4218 35% 7123 35% Some 40287 29%
Quite a bit 2316 28% 3421 28% 5737 28% Quite a bit 54503 39%Very Much 1302 16% 1868 15% 3170 15% Very Much 34702 25%
Total 8290 100% 12219 100% 20509 100% Total 139702 100%Very Little 277 3% 299 2% 576 3% Very Little 7395 5%
Some 1424 17% 1856 15% 3280 16% Some 40574 29%Quite a bit 3887 47% 5727 47% 9614 47% Quite a bit 59832 43%Very Much 2684 32% 4321 35% 7005 34% Very Much 31493 23%
Total 8272 100% 12203 100% 20475 100% Total 139295 100%Very Little 300 4% 358 3% 658 3% Very Little 11070 8%
How often do students in your selected course section skip class
In your experience at this college during the current school year, about how often have you skipped class
How often do students in your selected course section have serious conversations with students who differ from them in terms of their religious beliefs, political opinions, or personal values
In your experience at this college during the current school year, about how often have you had serious conversations with students who differ from you in terms of their religious beliefs, political opinions, or personal values
During the current school year, how much does the coursework in your selected course section emphasize analyzing the basic elements of an idea, experience, or theory
During the current school year, how much has your coursework at this college emphasized analyzing the basic elements of an idea, experience, or theory
During the current school year, how much does the coursework in your selected course section emphasize memorizing facts, ideas, or methods so the students can repeat them in pretty much the same form
During the current school year, how much has your coursework at this college emphasized memorizing facts, ideas, or methods from your courses and readings so you can repeat them in pretty much the same form
During the current school year, how much doe the coursework During the current school year, how much has your Some 1681 20% 2143 18% 3824 19% Some 47174 34%
Quite a bit 3430 41% 5023 41% 8453 41% Quite a bit 53297 38%Very Much 2856 35% 4681 38% 7537 37% Very Much 27100 20%
Total 8267 100% 12205 100% 20472 100% Total 138642 100%Very Little 793 10% 961 8% 1754 9% Very Little 17923 13%
Some 2318 28% 3167 26% 5485 27% Some 50781 37%Quite a bit 2907 35% 4473 37% 7380 36% Quite a bit 47503 34%Very Much 2234 27% 3582 29% 5816 28% Very Much 22651 16%
Total 8252 100% 12183 100% 20435 100% Total 138858 100%Very Little 458 6% 471 4% 929 5% Very Little 14871 11%
Some 1931 23% 2327 19% 4258 21% Some 48495 35%Quite a bit 3033 37% 4385 36% 7418 36% Quite a bit 49293 35%Very Much 2831 34% 5007 41% 7838 38% Very Much 26472 19%
Total 8253 100% 12190 100% 20443 100% Total 139130 100%Very Little 740 9% 855 7% 1595 8% Very Little 13233 9%
Some 2184 27% 2854 23% 5038 25% Some 44201 32%Quite a bit 2864 35% 4174 34% 7038 34% Quite a bit 50053 36%Very Much 2450 30% 4297 35% 6747 33% Very Much 32104 23%
Total 8238 100% 12180 100% 20418 100% Total 139592 100%None 382 5% 513 4% 895 4% None 4161 3%
1 4343 53% 5663 47% 10006 49% 1 to 4 59572 43%2-3 2717 33% 4504 37% 7221 35% 5 to 10 42354 31%4-6 339 4% 725 6% 1064 5% 11 to 20 18494 13%
More than 6 435 5% 749 6% 1184 6% More than 20 13433 10%Total 8216 100% 12154 100% 20370 100% Total 138015 100%
None 2009 25% 2808 23% 4817 24% None 15051 11%1 1268 16% 1887 16% 3155 16% 1 to 4 44447 32%
2 to 3 1813 22% 2869 24% 4682 23% 5 to 10 42678 31%4 to 6 1527 19% 2167 18% 3694 18% 11 to 20 23294 17%
More than 6 1557 19% 2377 20% 3934 19% More than 20 12471 9%Total 8174 100% 12108 100% 20282 100% Total 137941 100%
In your selected course section, what is the number of written papers or reports of any length that your students write
During the current school year, about what number of written papers or reports of any length do you write
In your selected course section, what is the number of assigned textbooks, manuals, books, or book-length packs of course readings that your students read
During the current school year, about what number of assigned textbooks, manuals, books, or book-length packs of course readings do you read
During the current school year, how much does the coursework in your selected course section emphasize making judgments about the value or soundness of information, arguments, or methods
During the current school year, how much has your coursework at this college emphasized making judgments about the value or soundness of information, arguments, or methods
in your selected course section emphasize synthesizing and organizing ideas, information, or experiences in new ways
coursework at this college emphasized synthesizing and organizing ideas, information, or experiences in new ways
During the current school year, how much does the coursework in your selected course section emphasize applying theories or concepts to practical problems or in new situations
During the current school year, how much has your coursework at this college emphasized applying theories or concepts to practical problems or in new situations
During the current school year, how much does the coursework in your selected course section emphasize having students use information they have read or heard to perform a new skill
During the current school year, how much has your coursework at this college emphasized using information you have read or heard to perform a new skill
SFC3

2007 CCFSSE Student and Faculty Frequency Distributions
2007 CCFSSE Faculty Responses 2007 CCSSE Student Responses
Count Percent Count Percent Count Percent Count PercentFull-Time Faculty All Faculty All StudentsPart-Time Faculty
Extremely Easy (1) 25 0% 31 0% 56 0% Extremely Easy (1) 1302 1%(2) 45 1% 59 0% 104 1% (2) 2654 2%(3) 184 2% 203 2% 387 2% (3) 7683 6%(4) 960 12% 1245 10% 2205 11% (4) 31682 24%(5) 3163 39% 4179 34% 7342 36% (5) 45039 34%(6) 3172 39% 5160 43% 8332 41% (6) 30187 23%
Extremely Challenging (7) 655 8% 1246 10% 1901 9% Extremely Challenging (7) 13610 10%Total 8204 100% 12123 100% 20327 100% Total 132157 100%
Not important 1213 15% 1413 12% 2626 13% I have not done, nor plan to do 59205 43%Somewhat important 2662 33% 3683 30% 6345 31% I plan to do 55452 40%
Very important 4248 52% 7024 58% 11272 56% I have done 22396 16%Total 8123 100% 12120 100% 20243 100% Total 137053 100%
Not important 1593 20% 2229 18% 3822 19% I have not done, nor plan to do 117310 86%Somewhat important 2633 33% 3773 31% 6406 32% I plan to do 7498 5%
Very important 3857 48% 6069 50% 9926 49% I have done 12274 9%Total 8083 100% 12071 100% 20154 100% Total 137082 100%
Not important 745 9% 580 5% 1325 7% I have not done, nor plan to do 100371 73%Somewhat important 2293 28% 2651 22% 4944 24% I plan to do 11565 8%
Very important 5056 62% 8867 73% 13923 69% I have done 25209 18%Total 8094 100% 12098 100% 20192 100% Total 137145 100%
Not important 701 9% 585 5% 1286 6% I have not done, nor plan to do 93258 68%Somewhat important 2138 26% 2683 22% 4821 24% I plan to do 14421 11%
Very important 5258 65% 8822 73% 14080 70% I have done 29483 21%
How important is it to you that students participate in developmental/remedial writing courses
Student activities: Developmental/remedial writing course
How important is it to you that students participate in English as a second language courses
Student activities: English as a second language course
How important is it to you that students participate in developmental/remedial reading courses
Student activities: Developmental/remedial reading course
How important is it to you that students participate in internships, field experience, co-op experience, or clinical assignment
Student activities: Internship, field experience, co-op experience, or clinical assignment
Select the circle that best represents the extent to which your examinations of student performance (e.g. Exams, portfolio) challenge students to do their best work
Mark the response that best represents the extent to which your examinations during the current school year have challenged you to do your best work at this college
Total 8097 100% 12090 100% 20187 100% Total 137161 100%Not important 1129 14% 870 7% 1999 10% I have not done, nor plan to do 73051 53%
Somewhat important 2251 28% 2704 22% 4955 25% I plan to do 19240 14%Very important 4697 58% 8525 70% 13222 66% I have done 44694 33%
Total 8077 100% 12099 100% 20176 100% Total 136985 100%Not important 424 5% 444 4% 868 4% I have not done, nor plan to do 92054 67%
Somewhat important 2535 31% 3668 30% 6203 31% I plan to do 24586 18%Very important 5179 64% 8008 66% 13187 65% I have done 20384 15%
Total 8138 100% 12120 100% 20258 100% Total 137024 100%Not important 1715 21% 2823 23% 4538 23% I have not done, nor plan to do 99527 73%
Somewhat important 3675 46% 5740 48% 9415 47% I plan to do 30425 22%Very important 2663 33% 3452 29% 6115 30% I have done 6605 5%
Total 8053 100% 12015 100% 20068 100% Total 136557 100%Not important 933 12% 1097 9% 2030 10% I have not done, nor plan to do 83796 61%
Somewhat important 3331 41% 4677 39% 8008 40% I plan to do 18368 13%Very important 3811 47% 6308 52% 10119 50% I have done 34769 25%
Total 8075 100% 12082 100% 20157 100% Total 136933 100%Not important 1464 18% 2298 19% 3762 19% I have not done, nor plan to do 101066 74%
Somewhat important 4123 51% 6295 52% 10418 52% I plan to do 24879 18%Very important 2435 30% 3411 28% 5846 29% I have done 11405 8%
Total 8022 100% 12004 100% 20026 100% Total 137350 100%Very Little 432 5% 880 7% 1312 7% Very Little 6404 5%
Some 2521 31% 3704 31% 6225 31% Some 33706 24%Quite a bit 3397 42% 4823 40% 8220 41% Quite a bit 59413 43%Very Much 1708 21% 2715 22% 4423 22% Very Much 38539 28%
Total 8058 100% 12122 100% 20180 100% Total 138062 100%Very Little 132 2% 242 2% 374 2% Very Little 7204 5%
Some 1103 14% 1879 15% 2982 15% Some 33510 24%Quite a bit 3237 40% 4609 38% 7846 39% Quite a bit 58604 43%Very Much 3657 45% 5420 45% 9077 45% Very Much 38524 28%
Total 8129 100% 12150 100% 20279 100% Total 137842 100%Very Little 506 6% 1062 9% 1568 8% Very Little 26463 19%
Some 2219 28% 3794 31% 6013 30% Some 46239 34%Quite a bit 2844 36% 4024 33% 6868 34% Quite a bit 39898 29%Very Much 2396 30% 3193 26% 5589 28% Very Much 24893 18%
Total 7965 100% 12073 100% 20038 100% Total 137492 100%
How much does this college emphasize encouraging contact among students from different economic, social, and racial or ethnic backgrounds
How much does this college emphasize encouraging contact among students from different economic, social, and racial or ethnic backgrounds
How much does this college emphasize providing students the support they need to help them to succeed at this college
How much does this college emphasize providing the support you need to help you succeed at this college
How much does this college emphasize encouraging students to spend significant amounts of time studying
How much does this college emphasize encouraging you to spend significant amounts of time studying
How important is it to you that students participate in developmental/remedial math courses
Student activities: Developmental/remedial math course
How important is it to you that students participate in study skills courses
Student activities: Study skills course
How important is it to you that students participate in honors courses
Student activities: Honors course
How important is it to you that students participate in organized learning communities
Student activities: Organized learning communities
How important is it to you that students participate in a college orientation program or course
Student activities: College orientation program or course
SFC4

2007 CCFSSE Student and Faculty Frequency Distributions
2007 CCFSSE Faculty Responses 2007 CCSSE Student Responses
Count Percent Count Percent Count Percent Count PercentFull-Time Faculty All Faculty All StudentsPart-Time Faculty
Very Little 846 11% 1520 13% 2366 12% Very Little 57750 42%Some 3099 39% 4703 39% 7802 39% Some 45644 33%
Quite a bit 2594 33% 3799 31% 6393 32% Quite a bit 22851 17%Very Much 1386 17% 2044 17% 3430 17% Very Much 11173 8%
Total 7925 100% 12066 100% 19991 100% Total 137417 100%Very Little 910 12% 1839 15% 2749 14% Very Little 40956 30%
Some 3346 43% 5303 44% 8649 43% Some 54513 40%Quite a bit 2450 31% 3401 28% 5851 29% Quite a bit 29125 21%Very Much 1153 15% 1484 12% 2637 13% Very Much 12133 9%
Total 7859 100% 12027 100% 19886 100% Total 136726 100%Very Little 239 3% 344 3% 583 3% Very Little 38897 28%
Some 1896 24% 2695 22% 4591 23% Some 37107 27%Quite a bit 3524 45% 5497 46% 9021 45% Quite a bit 32299 24%Very Much 2240 28% 3506 29% 5746 29% Very Much 28608 21%
Total 7899 100% 12042 100% 19941 100% Total 136910 100%Very Little 142 2% 153 1% 295 1% Very Little 9887 7%
Some 927 12% 1201 10% 2128 11% Some 25830 19%Quite a bit 2877 36% 4275 35% 7152 35% Quite a bit 45514 33%Very Much 4097 51% 6479 54% 10576 52% Very Much 56497 41%
Total 8043 100% 12108 100% 20151 100% Total 137728 100%None 44 1% 64 1% 108 1% None 2547 2%1 to 5 3909 49% 5392 45% 9301 47% 1 to 5 62175 45%
6 to 10 2834 36% 4403 37% 7237 36% 6 to 10 40139 29%
About how many hours do you think full and part-time students at this college spend in a typical 7 - day week preparing for class (studying, reading, writing, rehearsing, doing
About how many hours do you spend in a typical 7 - day week preparing for class (studying, reading, writing, rehearsing, doing homework, or other activities related to
How much does this college emphasize providing the financial support students need to afford their education
How much does this college emphasize providing the financial support you need to afford your education
How much does this college emphasize using computers in academic work
How much does this college emphasize using computers in academic work
How much does this college emphasize providing students the support they need to thrive socially
How much does this college emphasize providing the support you need to thrive socially
How much does this college emphasize helping students cope with their non-academic responsibilities (work, family, etc.)
How much does this college emphasize helping you cope with your non-academic responsibilities (work, family, etc.)
11 to 20 987 12% 1778 15% 2765 14% 11 to 20 22165 16%21 to 30 151 2% 291 2% 442 2% 21 to 30 7160 5%
More than 30 25 0% 66 1% 91 0% More than 30 3657 3%Total 7950 100% 11994 100% 19944 100% Total 137843 100%
None 39 0% 77 1% 116 1% None 26828 20%1 to 5 100 1% 159 1% 259 1% 1 to 5 6736 5%
6 to 10 337 4% 497 4% 834 4% 6 to 10 7999 6%11 to 20 1705 22% 2769 23% 4474 22% 11 to 20 16051 12%21 to 30 3128 40% 5428 45% 8556 43% 21 to 30 23802 17%
More than 30 2596 33% 3064 26% 5660 28% More than 30 55905 41%Total 7905 100% 11994 100% 19899 100% Total 137321 100%
None 1454 19% 2206 19% 3660 19% None 113445 82%1 to 5 5419 70% 8564 72% 13983 71% 1 to 5 17252 13%
6 to 10 655 8% 853 7% 1508 8% 6 to 10 3415 2%11 to 20 155 2% 232 2% 387 2% 11 to 20 1834 1%21 to 30 35 0% 38 0% 73 0% 21 to 30 683 0%
More than 30 7 0% 26 0% 33 0% More than 30 910 1%Total 7725 100% 11919 100% 19644 100% Total 137540 100%
None 234 3% 292 2% 526 3% None 60877 44%1 to 5 1134 15% 1607 14% 2741 14% 1 to 5 21068 15%
6 to 10 1442 19% 2157 18% 3599 18% 6 to 10 10602 8%11 to 20 1898 25% 2895 25% 4793 25% 11 to 20 8018 6%21 to 30 1344 17% 2299 20% 3643 19% 21 to 30 5482 4%
More than 30 1654 21% 2539 22% 4193 22% More than 30 31253 23%Total 7706 100% 11789 100% 19495 100% Total 137301 100%
None 101 1% 171 1% 272 1% None 10233 7%1 to 5 5106 65% 7135 60% 12241 62% 1 to 5 94502 69%
6 to 10 2008 26% 3596 30% 5604 28% 6 to 10 21486 16%11 to 20 477 6% 750 6% 1227 6% 11 to 20 6659 5%21 to 30 77 1% 170 1% 247 1% 21 to 30 1814 1%
More than 30 95 1% 120 1% 215 1% More than 30 2684 2%Total 7864 100% 11942 100% 19806 100% Total 137379 100%
About how many hours do you think full and part-time students at this college spend in a typical 7 - day week commuting to and from class.
About how many hours do you spend in a typical 7 - day week commuting to and from class
About how many hours do you think full and part-time students at this college spend in a typical 7 - day week providing care for dependents living with them (parents, children, spouse, etc.)
About how many hours do you spend in a typical 7 - day week providing care for dependents living with you (parents, children, spouse, etc.)
homework, or other activities related to their programs) your programs)
About how many hours do you think full and part-time students at this college spend in a typical 7 - day week participating in college-sponsored activities (organizations, campus publications, student government, intercollegiate or intramural sports, etc.)
About how many hours do you spend in a typical 7 - day week participating in college-sponsored activities (organizations, campus publications, student government, intercollegiate or intramural sports, etc.)
About how many hours do you think full and part-time students at this college spend in a typical 7 - day week working for pay
About how many hours do you spend in a typical 7 - day week working for pay
SFC5

2007 CCFSSE Student and Faculty Frequency Distributions
2007 CCFSSE Faculty Responses 2007 CCSSE Student Responses
Count Percent Count Percent Count Percent Count PercentFull-Time Faculty All Faculty All StudentsPart-Time Faculty
Unfriendly, unsupportive, sense of alienation (1) 8 0% 5 0% 13 0%
Unfriendly, unsupportive, sense of alienation (1) 1312 1%
(2) 35 0% 65 1% 100 0% (2) 2865 2%(3) 179 2% 305 3% 484 2% (3) 6409 5%(4) 957 12% 1556 13% 2513 13% (4) 21826 16%(5) 2565 32% 3927 33% 6492 32% (5) 30880 22%(6) 2787 35% 4308 36% 7095 35% (6) 38215 28%
Friendly, supportive, sense of belonging (7) 1513 19% 1871 16% 3384 17%
Friendly, supportive, sense of belonging (7) 36407 26%
Total 8044 100% 12037 100% 20081 100% Total 137914 100%Unavailable, unhelpful,
unsympathetic (1) 6 0% 10 0% 16 0%Unavailable, unhelpful,
unsympathetic (1) 875 1%(2) 24 0% 30 0% 54 0% (2) 1974 1%(3) 93 1% 145 1% 238 1% (3) 5117 4%(4) 537 7% 735 6% 1272 6% (4) 16450 12%(5) 1876 23% 2815 23% 4691 23% (5) 29219 21%(6) 3504 43% 5607 47% 9111 45% (6) 43570 32%
Available, helpful, sympathetic (7) 2032 25% 2710 22% 4742 24%
Available, helpful, sympathetic (7) 40791 30%
Total 8072 100% 12052 100% 20124 100% Total 137996 100%Unhelpful, inconsiderate, rigid
(1) 70 1% 196 2% 266 1%Unhelpful, inconsiderate, rigid
(1) 4643 3%(2) 197 2% 584 5% 781 4% (2) 6897 5%
Select the circle that best represents the quality of student relationships with instructors
Mark the number that best represents the quality of your relationships with instructors at this college
Select the circle that best represents the quality of student relationships with other students
Mark the number that best represents the quality of your relationships with other students at this college
Select the circle that best represents the quality of student relationships with administrative personnel and offices
Mark the number that best represents the quality of your relationships with administrative personnel and offices at this college
(3) 462 6% 1169 10% 1631 8% (3) 11964 9%(4) 1232 15% 2207 18% 3439 17% (4) 28081 20%(5) 2022 25% 3240 27% 5262 26% (5) 30960 22%(6) 2461 31% 3148 26% 5609 28% (6) 30304 22%
Helpful, considerate, flexible (7) 1509 19% 1456 12% 2965 15% Helpful, considerate, flexible (7) 24786 18%Total 7953 100% 12000 100% 19953 100% Total 137635 100%
None 29 0% 45 0% 74 0% Very little 228 3% 514 4% 742 4% Very little 7879 6%
Some 1643 20% 2766 23% 4409 22% Some 32459 24%Quite a bit 3421 42% 4859 40% 8280 41% Quite a bit 58186 42%Very much 2783 34% 3873 32% 6656 33% Very much 39088 28%
Total 8104 100% 12057 100% 20161 100% Total 137612 100%None 66 1% 76 1% 142 1%
Very little 428 5% 518 4% 946 5% Very little 25854 19%Some 1928 24% 2554 21% 4482 22% Some 41190 30%
Quite a bit 2799 35% 3789 31% 6588 33% Quite a bit 41356 30%Very much 2875 36% 5132 43% 8007 40% Very much 29001 21%
Total 8096 100% 12069 100% 20165 100% Total 137401 100%None 334 4% 328 3% 662 3%
Very little 1122 14% 1583 13% 2705 13% Very little 16047 12%Some 2484 31% 3920 33% 6404 32% Some 40101 29%
Quite a bit 2266 28% 3482 29% 5748 29% Quite a bit 52169 38%Very much 1882 23% 2745 23% 4627 23% Very much 29038 21%
Total 8088 100% 12058 100% 20146 100% Total 137354 100%None 224 3% 255 2% 479 2%
Very little 990 12% 1502 12% 2492 12% Very little 19997 15%Some 2682 33% 4113 34% 6795 34% Some 42250 31%
Quite a bit 2607 32% 3748 31% 6355 32% Quite a bit 48668 35%Very much 1585 20% 2425 20% 4010 20% Very much 26426 19%
Total 8088 100% 12043 100% 20131 100% Total 137341 100%None 33 0% 27 0% 60 0%
Very little 185 2% 247 2% 432 2% Very little 9435 7%Some 1199 15% 1368 11% 2567 13% Some 36130 26%
Quite a bit 2891 36% 4064 34% 6955 35% Quite a bit 57155 42%Very much 3794 47% 6350 53% 10144 50% Very much 34607 25%
Total 8102 100% 12056 100% 20158 100% Total 137328 100%
To what extent do students' experiences in your selected course section contribute to their knowledge, skills, and personal development in acquiring a broad general education
How much has your experience at this college contributed to your knowledge, skills, and personal development in acquiring a broad general education
To what extent do students' experiences in your selected course section contribute to their knowledge, skills, and personal development in writing clearly and effectively
How much has your experience at this college contributed to your knowledge, skills, and personal development in writing clearly and effectively
To what extent do students' experiences in your selected course section contribute to their knowledge, skills, and personal development in acquiring job or work-related knowledge and skills
How much has your experience at this college contributed to your knowledge, skills, and personal development in acquiring job or work-related knowledge and skills
To what extent do students' experiences in your selected course section contribute to their knowledge, skills, and personal development in thinking critically and analytically
How much has your experience at this college contributed to your knowledge, skills, and personal development in thinking critically and analytically
To what extent do students' experiences in your selected course section contribute to their knowledge, skills, and personal development in speaking clearly and effectively
How much has your experience at this college contributed to your knowledge, skills, and personal development in speaking clearly and effectively
SFC6

2007 CCFSSE Student and Faculty Frequency Distributions
2007 CCFSSE Faculty Responses 2007 CCSSE Student Responses
Count Percent Count Percent Count Percent Count PercentFull-Time Faculty All Faculty All StudentsPart-Time Faculty
None 2308 29% 2754 23% 5062 25% Very little 1928 24% 2682 22% 4610 23% Very little 22710 17%
Some 1521 19% 2413 20% 3934 20% Some 40656 30%Quite a bit 838 10% 1626 13% 2464 12% Quite a bit 46308 34%Very much 1484 18% 2593 21% 4077 20% Very much 27512 20%
Total 8079 100% 12068 100% 20147 100% Total 137186 100%None 519 6% 511 4% 1030 5%
Very little 963 12% 1172 10% 2135 11% Very little 19709 14%Some 2538 31% 3460 29% 5998 30% Some 37938 28%
Quite a bit 2076 26% 3377 28% 5453 27% Quite a bit 44528 32%Very much 2002 25% 3550 29% 5552 28% Very much 35067 26%
Total 8098 100% 12070 100% 20168 100% Total 137242 100%None 129 2% 103 1% 232 1%
Very little 580 7% 737 6% 1317 7% Very little 13367 10%Some 2465 30% 3210 27% 5675 28% Some 44225 32%
Quite a bit 2739 34% 4008 33% 6747 33% Quite a bit 49976 36%Very much 2193 27% 4015 33% 6208 31% Very much 29686 22%
Total 8106 100% 12073 100% 20179 100% Total 137254 100%None 12 0% 23 0% 35 0%
Very little 124 2% 186 2% 310 2% Very little 9637 7%Some 1404 17% 1997 17% 3401 17% Some 34913 25%
Quite a bit 3845 47% 5787 48% 9632 48% Quite a bit 55521 40%Very much 2723 34% 4086 34% 6809 34% Very much 37246 27%
To what extent do students' experiences in your selected course section contribute to their knowledge, skills, and personal development in using computing and information technology
How much has your experience at this college contributed to your knowledge, skills, and personal development in using computing and information technology
To what extent do students' experiences in your selected course section contribute to their knowledge, skills, and personal development in solving numerical problems
How much has your experience at this college contributed to your knowledge, skills, and personal development in solving numerical problems
To what extent do students' experiences in your selected course section contribute to their knowledge, skills, and personal development in learning effectively on their own
How much has your experience at this college contributed to your knowledge, skills, and personal development in learning effectively on your own
To what extent do students' experiences in your selected course section contribute to their knowledge, skills, and personal development in working effectively with others
How much has your experience at this college contributed to your knowledge, skills, and personal development in working effectively with others
Total 8108 100% 12079 100% 20187 100% Total 137318 100%None 182 2% 278 2% 460 2%
Very little 682 8% 1218 10% 1900 9% Very little 23321 17%Some 2432 30% 3759 31% 6191 31% Some 41098 30%
Quite a bit 2661 33% 3894 32% 6555 33% Quite a bit 43267 32%Very much 2078 26% 2842 24% 4920 25% Very much 29475 21%
Total 8035 100% 11991 100% 20026 100% Total 137161 100%None 579 7% 831 7% 1410 7%
Very little 1241 15% 1991 17% 3232 16% Very little 31932 23%Some 2485 31% 3853 32% 6338 32% Some 46760 34%
Quite a bit 2134 27% 3155 26% 5289 26% Quite a bit 36235 26%Very much 1612 20% 2214 18% 3826 19% Very much 22144 16%
Total 8051 100% 12044 100% 20095 100% Total 137071 100%None 291 4% 390 3% 681 3%
Very little 827 10% 1245 10% 2072 10% Very little 33609 25%Some 2811 35% 4099 34% 6910 34% Some 45854 33%
Quite a bit 2461 31% 3788 31% 6249 31% Quite a bit 35980 26%Very much 1658 21% 2522 21% 4180 21% Very much 21612 16%
Total 8048 100% 12044 100% 20092 100% Total 137054 100%None 674 8% 935 8% 1609 8%
Very little 1759 22% 2678 22% 4437 22% Very little 51913 38%Some 2926 37% 4279 36% 7205 36% Some 48016 35%
Quite a bit 1661 21% 2521 21% 4182 21% Quite a bit 24542 18%Very much 967 12% 1577 13% 2544 13% Very much 12336 9%
Total 7987 100% 11990 100% 19977 100% Total 136807 100%None 273 3% 372 3% 645 3%
Very little 1026 13% 1492 12% 2518 13% Very little 22154 16%Some 2945 37% 3941 33% 6886 34% Some 39566 29%
Quite a bit 2395 30% 3633 30% 6028 30% Quite a bit 43995 32%Very much 1419 18% 2606 22% 4025 20% Very much 31523 23%
Total 8058 100% 12044 100% 20102 100% Total 137238 100%None 537 7% 753 6% 1290 6%
Very little 1535 19% 2251 19% 3786 19% Very little 27183 20%Some 2785 35% 3764 31% 6549 33% Some 41571 30%
Quite a bit 1940 24% 2917 24% 4857 24% Quite a bit 39937 29%Very much 1228 15% 2327 19% 3555 18% Very much 28755 21%
Total 8025 100% 12012 100% 20037 100% Total 137446 100%
To what extent do students' experiences in your selected course section contribute to their knowledge, skills, and personal development in understanding people of other racial and ethnic backgrounds
How much has your experience at this college contributed to your knowledge, skills, and personal development in understanding people of other racial and ethnic backgrounds
To what extent do students' experiences in your selected course section contribute to their knowledge, skills, and personal development in understanding themselves
How much has your experience at this college contributed to your knowledge, skills, and personal development in understanding yourself
To what extent do students' experiences in your selected course section contribute to their knowledge, skills, and personal development in contributing to the welfare of their community
How much has your experience at this college contributed to your knowledge, skills, and personal development in contributing to the welfare of your community
To what extent do students' experiences in your selected course section contribute to their knowledge, skills, and personal development in developing a personal code of values and ethics
How much has your experience at this college contributed to your knowledge, skills, and personal development in developing a personal code of values and ethics
To what extent do students' experiences in your selected course section contribute to their knowledge, skills, and personal development in gaining information about career opportunities
How much has your experience at this college contributed to your knowledge, skills, and personal development in gaining information about career opportunities
To what extent do students' experiences in your selected course section contribute to their knowledge, skills, and personal development in developing clearer career goals
How much has your experience at this college contributed to your knowledge, skills, and personal development in developing clearer career goals
SFC7

2007 CCFSSE Student and Faculty Frequency Distributions
2007 CCFSSE Faculty Responses 2007 CCSSE Student Responses
Count Percent Count Percent Count Percent Count PercentFull-Time Faculty All Faculty All StudentsPart-Time Faculty
Don't know/N.A. 391 5% 158 1% 549 3% Don't know/N.A. 13011 10%Rarely or never 2201 27% 1796 15% 3997 20% Rarely or never 49040 36%
Sometimes 3991 49% 5860 49% 9851 49% Sometimes 57472 42%Often 1535 19% 4263 35% 5798 29% Often 16568 12%
Total 8118 100% 12077 100% 20195 100% Total 136092 100%Don't know/N.A. 582 7% 343 3% 925 5% Don't know/N.A. 28312 21%Rarely or never 3577 44% 4081 34% 7658 38% Rarely or never 68130 50%
Sometimes 3054 38% 5743 48% 8797 44% Sometimes 31725 23%Often 892 11% 1896 16% 2788 14% Often 7407 5%
Total 8105 100% 12063 100% 20168 100% Total 135575 100%Don't know/N.A. 902 11% 683 6% 1585 8% Don't know/N.A. 56867 42%Rarely or never 4506 56% 5755 48% 10261 51% Rarely or never 62636 47%
Sometimes 2101 26% 4188 35% 6289 31% Sometimes 11806 9%Often 565 7% 1426 12% 1991 10% Often 3346 2%
Total 8074 100% 12052 100% 20126 100% Total 134656 100%Don't know/N.A. 366 5% 160 1% 526 3% Don't know/N.A. 38488 29%Rarely or never 1867 23% 1636 14% 3503 17% Rarely or never 61382 46%
Sometimes 3294 41% 5381 45% 8675 43% Sometimes 24955 19%Often 2583 32% 4883 40% 7466 37% Often 9611 7%
Total 8110 100% 12060 100% 20170 100% Total 134437 100%Don't know/N.A. 561 7% 435 4% 996 5% Don't know/N.A. 32177 24%Rarely or never 2408 30% 2604 22% 5012 25% Rarely or never 49358 37%
Sometimes 2669 33% 4690 39% 7359 37% Sometimes 32751 24%
How often do you refer students to career counseling How often do you use career counseling
How often do you refer students to academic advising/planning
How often do you use academic advising/planning
How often do you refer students to peer or other tutoring How often do you use peer or other tutoring
How often do you refer students to job placement assistance How often do you use job placement assistance
How often do you refer students to skill labs (writing, math, etc.)
How often do you use skills labs (writing, math, etc.)
Often 2459 30% 4335 36% 6794 34% Often 19803 15%Total 8097 100% 12064 100% 20161 100% Total 134089 100%
Don't know/N.A. 1759 22% 2103 17% 3862 19% Don't know/N.A. 77971 58%Rarely or never 5304 66% 7481 62% 12785 64% Rarely or never 49490 37%
Sometimes 882 11% 2162 18% 3044 15% Sometimes 3676 3%Often 120 1% 289 2% 409 2% Often 2953 2%
Total 8065 100% 12035 100% 20100 100% Total 134089 100%Don't know/N.A. 982 12% 517 4% 1499 7% Don't know/N.A. 32646 24%Rarely or never 3724 46% 3327 28% 7051 35% Rarely or never 43749 33%
Sometimes 2643 33% 5710 47% 8353 41% Sometimes 35147 26%Often 731 9% 2500 21% 3231 16% Often 22669 17%
Total 8080 100% 12054 100% 20134 100% Total 134211 100%Don't know/N.A. 551 7% 314 3% 865 4% Don't know/N.A. 19232 14%Rarely or never 2044 25% 1959 16% 4003 20% Rarely or never 32538 24%
Sometimes 2890 36% 4750 39% 7640 38% Sometimes 40526 30%Often 2604 32% 5032 42% 7636 38% Often 42019 31%
Total 8089 100% 12055 100% 20144 100% Total 134316 100%Don't know/N.A. 1132 14% 644 5% 1776 9% Don't know/N.A. 53454 40%Rarely or never 4559 57% 4985 41% 9544 48% Rarely or never 58784 44%
Sometimes 1955 24% 4841 40% 6796 34% Sometimes 15217 11%Often 410 5% 1560 13% 1970 10% Often 6016 5%
Total 8056 100% 12030 100% 20086 100% Total 133472 100%Don't know/N.A. 1175 15% 755 6% 1930 10% Don't know/N.A. 48668 36%Rarely or never 4062 50% 4093 34% 8155 41% Rarely or never 48948 36%
Sometimes 2232 28% 5342 44% 7574 38% Sometimes 27529 20%Often 587 7% 1837 15% 2424 12% Often 9469 7%
Total 8056 100% 12027 100% 20083 100% Total 134614 100%Don't know/N.A. 764 9% 464 4% 1228 6% Don't know/N.A. 80196 60%Rarely or never 2749 34% 2830 24% 5579 28% Rarely or never 43580 32%
Sometimes 3411 42% 6496 54% 9907 49% Sometimes 6347 5%Often 1147 14% 2242 19% 3389 17% Often 4651 3%
Total 8071 100% 12032 100% 20103 100% Total 134774 100%Not at all 51 1% 72 1% 123 1% Not at all 13980 11%
Somewhat 1226 15% 1636 14% 2862 14% Somewhat 37065 28%Very 6778 84% 10339 86% 17117 85% Very 80766 61%
Total 8055 100% 12047 100% 20102 100% Total 131811 100%
How often do you refer students to child care How often do you use child care
How often do you refer students to computer labs How often do you use computer labs
How often do you refer students to financial aid advising How often do you use financial aid advising
How often do you refer students to transfer credit assistance How often do you use transfer credit assistance
How often do you refer students to student organizations How often do you use student organizations
How important do you believe academic advising/planning is to students at this college
How important is academic advising/planning to you at this college
How often do you refer students to services to students with disabilities
How often do you use services to students with disabilities
SFC8

2007 CCFSSE Student and Faculty Frequency Distributions
2007 CCFSSE Faculty Responses 2007 CCSSE Student Responses
Count Percent Count Percent Count Percent Count PercentFull-Time Faculty All Faculty All StudentsPart-Time Faculty
Not at all 83 1% 148 1% 231 1% Not at all 27451 21%Somewhat 1861 23% 3275 27% 5136 26% Somewhat 37455 29%
Very 6099 76% 8608 72% 14707 73% Very 65335 50%Total 8043 100% 12031 100% 20074 100% Total 130241 100%
Not at all 146 2% 355 3% 501 2% Not at all 45593 35%Somewhat 2361 29% 4151 35% 6512 32% Somewhat 36762 29%
Very 5523 69% 7505 62% 13028 65% Very 46184 36%Total 8030 100% 12011 100% 20041 100% Total 128539 100%
Not at all 114 1% 150 1% 264 1% Not at all 38128 30%Somewhat 2372 30% 3085 26% 5457 27% Somewhat 40055 31%
Very 5549 69% 8779 73% 14328 71% Very 50302 39%Total 8035 100% 12014 100% 20049 100% Total 128484 100%
Not at all 89 1% 146 1% 235 1% Not at all 32084 25%Somewhat 1703 21% 2469 21% 4172 21% Somewhat 40096 31%
Very 6239 78% 9409 78% 15648 78% Very 55845 44%Total 8031 100% 12024 100% 20055 100% Total 128024 100%
Not at all 547 7% 767 6% 1314 7% Not at all 68961 54%Somewhat 3745 47% 4985 42% 8730 44% Somewhat 23189 18%
Very 3709 46% 6230 52% 9939 50% Very 35104 28%Total 8001 100% 11982 100% 19983 100% Total 127254 100%
Not at all 78 1% 69 1% 147 1% Not at all 28879 22%Somewhat 1571 20% 1890 16% 3461 17% Somewhat 22475 17%
Very 6376 79% 10062 84% 16438 82% Very 77094 60%
How important do you believe job placement assistance is to students at this college
How important is job placement assistance to you at this college
How important do you believe career counseling is to students at this college
How important is career counseling to you at this college
How important do you believe skills labs (writing, math, etc.) are to students at this college
How important are skills labs (writing, math, etc.) to you at this college
How important do you believe peer and other tutoring is to students at this college
How important is peer and other tutoring to you at this college
How important do you believe financial aid advising is to students at this college
How important is financial aid advising to you at this college
How important do you believe child care is to students at this college
How important is child care to you at this college
Total 8025 100% 12021 100% 20046 100% Total 128449 100%Not at all 66 1% 77 1% 143 1% Not at all 20623 16%
Somewhat 1811 23% 2506 21% 4317 22% Somewhat 32440 25%Very 6153 77% 9428 78% 15581 78% Very 75805 59%
Total 8030 100% 12011 100% 20041 100% Total 128868 100%Not at all 744 9% 1042 9% 1786 9% Not at all 52486 41%
Somewhat 4781 60% 6818 57% 11599 58% Somewhat 44279 35%Very 2480 31% 4134 34% 6614 33% Very 30077 24%
Total 8005 100% 11994 100% 19999 100% Total 126842 100%Not at all 181 2% 259 2% 440 2% Not at all 35700 28%
Somewhat 2666 33% 3824 32% 6490 32% Somewhat 27759 22%Very 5150 64% 7894 66% 13044 65% Very 64910 51%
Total 7997 100% 11977 100% 19974 100% Total 128368 100%Not at all 130 2% 208 2% 338 2% Not at all 52352 41%
Somewhat 2305 29% 3380 28% 5685 29% Somewhat 19544 15%Very 5543 69% 8360 70% 13903 70% Very 55836 44%
Total 7978 100% 11948 100% 19926 100% Total 127732 100%Not likely 183 2% 237 2% 420 2% Not likely 55827 41%
Somewhat likely 1372 17% 1633 14% 3005 15% Somewhat likely 28898 21%Likely 2726 34% 3836 32% 6562 33% Likely 24345 18%
Very likely 3819 47% 6371 53% 10190 51% Very likely 28285 21%Total 8100 100% 12077 100% 20177 100% Total 137355 100%
Not likely 267 3% 350 3% 617 3% Not likely 67474 49%Somewhat likely 2088 26% 2649 22% 4737 24% Somewhat likely 30595 22%
Likely 3107 38% 4690 39% 7797 39% Likely 21586 16%Very likely 2621 32% 4374 36% 6995 35% Very likely 17429 13%
Total 8083 100% 12063 100% 20146 100% Total 137084 100%Not likely 251 3% 251 2% 502 2% Not likely 78788 58%
Somewhat likely 1745 22% 2018 17% 3763 19% Somewhat likely 32026 23%Likely 2875 35% 4120 34% 6995 35% Likely 16555 12%
Very likely 3228 40% 5681 47% 8909 44% Very likely 9169 7%Total 8099 100% 12070 100% 20169 100% Total 136538 100%
How important do you believe student organizations are to students at this college
How important are student organizations to you at this college
How important do you believe computer labs are to students at this college
How important are computer labs to you at this college
How important do you believe services to students with disabilities are to students at this college
How important are services to students with disabilities to you at this college
How important do you believe transfer credit assistance is to students at this college
How important is transfer credit assistance to you at this college
How likely is it that caring for dependents would cause students to withdraw from class or from this college
How likely is it that caring for dependents would cause you to withdraw from class or from this college
How likely is it that working full-time would cause students to withdraw from class or from this college
How likely is it that working full-time would cause you to withdraw from class or from this college
How likely is it that being academically unprepared would cause students to withdraw from class or from this college
How likely is it that being academically unprepared would cause you to withdraw from class or from this college
SFC9

2007 CCFSSE Student and Faculty Frequency Distributions
2007 CCFSSE Faculty Responses 2007 CCSSE Student Responses
Count Percent Count Percent Count Percent Count PercentFull-Time Faculty All Faculty All StudentsPart-Time Faculty
Not likely 532 7% 444 4% 976 5% Not likely 44973 33%Somewhat likely 2226 28% 2627 22% 4853 24% Somewhat likely 31208 23%
Likely 2805 35% 4217 35% 7022 35% Likely 25356 19%Very likely 2495 31% 4771 40% 7266 36% Very likely 35355 26%
Total 8058 100% 12059 100% 20117 100% Total 136893 100%Not likely 1365 17% 2356 20% 3721 19% Not likely 45456 33%
Somewhat likely 2811 35% 4301 36% 7112 35% Somewhat likely 23575 17%Likely 2570 32% 3496 29% 6066 30% Likely 24444 18%
Very likely 1304 16% 1879 16% 3183 16% Very likely 43570 32%Total 8050 100% 12032 100% 20082 100% Total 137045
How likely is it that lacking finances would cause students to withdraw from class or from this college
How likely is it that lack of finances would cause you to withdraw from class or from this college
How likely is it that transferring to a 4-year college or university would cause students to withdraw from class or from this college
How likely is it that transferring to a 4-year college or university would cause you to withdraw from class or from this college
SFC10

Count Percent Count Percent Count PercentFewer than 10 968 12% 1346 11% 2314 11%
10 to 19 3314 40% 4414 36% 7728 38%20 to 29 2975 36% 4347 36% 7322 36%30 to 39 773 9% 1398 11% 2171 11%40 to 69 200 2% 505 4% 705 3%
70 or more 24 0% 176 1% 200 1%Total 8254 100% 12186 100% 20440 100%
None 1254 15% 719 6% 1973 10%1 to 3 2184 26% 1801 15% 3985 19%4 to 6 1320 16% 1553 13% 2873 14%7 to 9 780 9% 1202 10% 1982 10%
10 to 15 966 12% 1784 15% 2750 13%16 to 20 576 7% 1395 11% 1971 10%
21 or more 1225 15% 3792 31% 5017 24%Total 8305 100% 12246 100% 20551 100%
N.A. 862 11% 835 7% 1697 8%Rarely or never 3378 42% 3853 32% 7231 36%
Sometimes 2736 34% 4447 37% 7183 36%Often 1090 14% 2909 24% 3999 20%
2007 CCFSSE Faculty Only Frequency Distributions
Part-Time Faculty Full-Time Faculty All Faculty
How many students are enrolled in your selected course section
Prior to the Spring semester, how many times have you taught your selected course?
How much do you incorporate the use of academic advising/planning into your selected course section
Often 1090 14% 2909 24% 3999 20%Total 8066 100% 12044 100% 20110 100%
N.A. 1016 13% 1040 9% 2056 10%Rarely or never 3678 46% 4699 39% 8377 42%
Sometimes 2445 30% 4112 34% 6557 33%Often 916 11% 2172 18% 3088 15%
Total 8055 100% 12023 100% 20078 100%N.A. 1347 17% 1484 12% 2831 14%
Rarely or never 4604 57% 6235 52% 10839 54%Sometimes 1568 20% 2898 24% 4466 22%
Often 516 6% 1390 12% 1906 10%Total 8035 100% 12007 100% 20042 100%
N.A. 600 7% 507 4% 1107 6%Rarely or never 2433 30% 2866 24% 5299 26%
Sometimes 3019 38% 5088 42% 8107 40%Often 1995 25% 3553 30% 5548 28%
Total 8047 100% 12014 100% 20061 100%N.A. 805 10% 819 7% 1624 8%
Rarely or never 2861 36% 3795 32% 6656 33%Sometimes 2414 30% 4163 35% 6577 33%
Often 1948 24% 3229 27% 5177 26%Total 8028 100% 12006 100% 20034 100%
How much do you incorporate the use of peer or other tutoring into your course section
How much do you incorporate the use of skills labs (writing, math, etc.) into your selected course section
How much do you incorporate the use of career counseling into your course section
How much do you incorporate the use of job placement assistance into your selected course section
FF1

Count Percent Count Percent Count Percent
2007 CCFSSE Faculty Only Frequency Distributions
Part-Time Faculty Full-Time Faculty All Faculty
N.A. 2255 28% 3031 25% 5286 26%Rarely or never 5152 64% 7624 64% 12776 64%
Sometimes 529 7% 1169 10% 1698 8%Often 79 1% 166 1% 245 1%
Total 8015 100% 11990 100% 20005 100%N.A. 1679 21% 1788 15% 3467 17%
Rarely or never 4579 57% 6039 50% 10618 53%Sometimes 1402 18% 3163 26% 4565 23%
Often 350 4% 1002 8% 1352 7%Total 8010 100% 11992 100% 20002 100%
N.A. 771 10% 650 5% 1421 7%Rarely or never 2353 29% 2616 22% 4969 25%
Sometimes 2491 31% 4274 36% 6765 34%Often 2431 30% 4468 37% 6899 34%
Total 8046 100% 12008 100% 20054 100%N.A. 1542 19% 1432 12% 2974 15%
Rarely or never 4706 59% 5956 50% 10662 53%Sometimes 1422 18% 3510 29% 4932 25%
Often 318 4% 1070 9% 1388 7%
How much do you incorporate the use of child care into your course section
How much do you incorporate the use of financial aid advising into your selected course section
How much do you incorporate the use of computer labs into your course section
How much do you incorporate the use of student organizations into your selected course section
Often 318 4% 1070 9% 1388 7%Total 7988 100% 11968 100% 19956 100%
N.A. 1622 20% 1639 14% 3261 16%Rarely or never 4596 58% 5823 49% 10419 52%
Sometimes 1435 18% 3399 28% 4834 24%Often 335 4% 1104 9% 1439 7%
Total 7988 100% 11965 100% 19953 100%N.A. 972 12% 953 8% 1925 10%
Rarely or never 3121 39% 3896 33% 7017 35%Sometimes 2867 36% 5232 44% 8099 41%
Often 1030 13% 1874 16% 2904 15%Total 7990 100% 11955 100% 19945 100%
Not likely 95 1% 72 1% 167 1%Somewhat likely 1874 23% 2032 17% 3906 19%
Likely 3155 39% 4401 37% 7556 38%Very likely 2940 36% 5517 46% 8457 42%
Total 8064 100% 12022 100% 20086 100%None 9 0% 7 0% 16 0%1 to 4 2800 35% 841 7% 3641 18%5 to 8 2722 34% 1258 10% 3980 20%
9 to 12 1440 18% 1745 15% 3185 16%13 to 16 554 7% 3679 31% 4233 21%17 to 20 276 3% 2580 21% 2856 14%21 to 30 197 2% 1601 13% 1798 9%
31 or more 111 1% 303 3% 414 2%Total 8109 100% 12014 100% 20123 100%
How much do you incorporate the use of transfer credit assistance into your course section
How much do you incorporate the use of services to students with disabilities into your selected course section
About how many hours do you spend in a typical 7-day week teaching students in class
How likely is it that personal issues would cause students to withdraw from class or from this college?
FF2

Count Percent Count Percent Count Percent
2007 CCFSSE Faculty Only Frequency Distributions
Part-Time Faculty Full-Time Faculty All Faculty
None 211 3% 117 1% 328 2%1 to 4 5007 62% 3948 33% 8955 45%5 to 8 1853 23% 4088 34% 5941 30%
9 to 12 576 7% 1997 17% 2573 13%13 to 16 220 3% 861 7% 1081 5%17 to 20 131 2% 545 5% 676 3%21 to 30 61 1% 280 2% 341 2%
31 or more 29 0% 162 1% 191 1%Total 8088 100% 11998 100% 20086 100%
None 286 4% 205 2% 491 2%1 to 4 6241 77% 6536 55% 12777 64%5 to 8 1080 13% 3272 27% 4352 22%
9 to 12 266 3% 1088 9% 1354 7%13 to 16 93 1% 445 4% 538 3%17 to 20 43 1% 216 2% 259 1%21 to 30 32 0% 120 1% 152 1%
31 or more 17 0% 75 1% 92 0%Total 8058 100% 11957 100% 20015 100%
None 20 0% 10 0% 30 0%
About how many hours do you spend in a typical 7-day week giving other forms of written and oral feedback to students
About how many hours do you spend in a typical 7 day week preparing for class
About how many hours do you spend in a typical 7-day week grading papers
None 20 0% 10 0% 30 0%1 to 4 3550 44% 2651 22% 6201 31%5 to 8 2908 36% 4991 42% 7899 39%
9 to 12 1031 13% 2543 21% 3574 18%13 to 16 315 4% 989 8% 1304 6%17 to 20 169 2% 501 4% 670 3%21 to 30 63 1% 179 1% 242 1%
31 or more 37 0% 119 1% 156 1%Total 8093 100% 11983 100% 20076 100%
None 130 2% 116 1% 246 1%1 to 4 5671 70% 7052 59% 12723 63%5 to 8 1462 18% 3033 25% 4495 22%
9 to 12 455 6% 981 8% 1436 7%13 to 16 159 2% 354 3% 513 3%17 to 20 97 1% 194 2% 291 1%21 to 30 33 0% 86 1% 119 1%
31 or more 69 1% 154 1% 223 1%Total 8076 100% 11970 100% 20046 100%
None 1796 22% 2059 17% 3855 19%1 to 4 3854 48% 6417 54% 10271 51%5 to 8 1290 16% 2022 17% 3312 17%
9 to 12 523 6% 772 6% 1295 6%13 to 16 230 3% 342 3% 572 3%17 to 20 163 2% 180 2% 343 2%21 to 30 91 1% 73 1% 164 1%
31 or more 104 1% 79 1% 183 1%Total 8051 100% 11944 100% 19995 100%
About how many hours do you spend in a typical 7-day week preparing for class
About how many hours do you spend in a typical 7-day week reflecting and working on ways to improve my teaching
About how many hours do you spend in a typical 7-day week research and scholarly activities
FF3

Count Percent Count Percent Count Percent
2007 CCFSSE Faculty Only Frequency Distributions
Part-Time Faculty Full-Time Faculty All Faculty
None 7295 91% 9933 83% 17228 86%1 to 4 582 7% 1576 13% 2158 11%5 to 8 83 1% 244 2% 327 2%
9 to 12 26 0% 78 1% 104 1%13 to 16 18 0% 43 0% 61 0%17 to 20 5 0% 22 0% 27 0%21 to 30 5 0% 5 0% 10 0%
31 or more 9 0% 15 0% 24 0%Total 8023 100% 11916 100% 19939 100%
None 3175 39% 1440 12% 4615 23%1 to 4 4194 52% 7330 61% 11524 58%5 to 8 423 5% 2091 17% 2514 13%
9 to 12 109 1% 575 5% 684 3%13 to 16 60 1% 214 2% 274 1%17 to 20 39 0% 125 1% 164 1%21 to 30 20 0% 88 1% 108 1%
31 or more 40 0% 92 1% 132 1%Total 8060 100% 11955 100% 20015 100%
None 7139 89% 8443 71% 15582 78%
About how many hours do you spend in a typical 7-day week working with honors' projects
About how many hours do you spend in a typical 7-day week advising students
About how many hours do you spend in a typical 7 day week supervising internships or None 7139 89% 8443 71% 15582 78%1 to 4 552 7% 2003 17% 2555 13%5 to 8 162 2% 647 5% 809 4%
9 to 12 60 1% 368 3% 428 2%13 to 16 34 0% 221 2% 255 1%17 to 20 22 0% 107 1% 129 1%21 to 30 16 0% 64 1% 80 0%
31 or more 23 0% 35 0% 58 0%Total 8008 100% 11888 100% 19896 100%
None 6599 82% 5696 48% 12295 62%1 to 4 1153 14% 4823 40% 5976 30%5 to 8 157 2% 896 8% 1053 5%
9 to 12 50 1% 260 2% 310 2%13 to 16 24 0% 106 1% 130 1%17 to 20 23 0% 71 1% 94 0%21 to 30 16 0% 38 0% 54 0%
31 or more 15 0% 43 0% 58 0%Total 8037 100% 11933 100% 19970 100%
None 4063 50% 2571 22% 6634 33%1 to 4 3412 42% 7235 61% 10647 53%5 to 8 337 4% 1443 12% 1780 9%
9 to 12 74 1% 363 3% 437 2%13 to 16 46 1% 145 1% 191 1%17 to 20 44 1% 77 1% 121 1%21 to 30 32 0% 48 0% 80 0%
31 or more 48 1% 74 1% 122 1%Total 8056 100% 11956 100% 20012 100%
About how many hours do you spend in a typical 7-day week working with students on activities other than course work
About how many hours do you spend in a typical 7-day week involved in other interactions with students outside the classroom
About how many hours do you spend in a typical 7-day week supervising internships or other field experiences
FF4

Count Percent Count Percent Count Percent
2007 CCFSSE Faculty Only Frequency Distributions
Part-Time Faculty Full-Time Faculty All Faculty
None 6638 83% 6612 56% 13250 67%1 to 4 1015 13% 4093 35% 5108 26%5 to 8 201 3% 747 6% 948 5%
9 to 12 62 1% 186 2% 248 1%13 to 16 28 0% 89 1% 117 1%17 to 20 20 0% 39 0% 59 0%21 to 30 13 0% 25 0% 38 0%
31 or more 21 0% 32 0% 53 0%Total 7998 100% 11823 100% 19821 100%
None 5601 70% 3320 28% 8921 45%1 to 4 1853 23% 4475 38% 6328 32%5 to 8 231 3% 1988 17% 2219 11%
9 to 12 95 1% 935 8% 1030 5%13 to 16 40 0% 432 4% 472 2%17 to 20 50 1% 294 2% 344 2%21 to 30 32 0% 216 2% 248 1%
31 or more 112 1% 214 2% 326 2%Total 8014 100% 11874 100% 19888 100%
None 6314 79% 1305 11% 7619 38%
About how many hours do you spend in a typical 7-day week conducting service activities
About how many hours do you spend in a typical 7-day week coordination and/or administrative activities
About how many hours do you spend in a typical 7 day week participating on college None 6314 79% 1305 11% 7619 38%1 to 4 1365 17% 7697 64% 9062 45%5 to 8 218 3% 2035 17% 2253 11%
9 to 12 64 1% 529 4% 593 3%13 to 16 21 0% 193 2% 214 1%17 to 20 16 0% 121 1% 137 1%21 to 30 12 0% 43 0% 55 0%
31 or more 12 0% 37 0% 49 0%Total 8022 100% 11960 100% 19982 100%
None 6829 85% 5183 44% 12012 60%1 to 4 1027 13% 5658 48% 6685 34%5 to 8 89 1% 714 6% 803 4%
9 to 12 16 0% 190 2% 206 1%13 to 16 11 0% 70 1% 81 0%17 to 20 5 0% 39 0% 44 0%21 to 30 5 0% 22 0% 27 0%
31 or more 7 0% 31 0% 38 0%Total 7989 100% 11907 100% 19896 100%
0% 161 2% 297 2% 458 2%1 to 9% 985 12% 1592 13% 2577 13%
10 to 19% 1126 14% 1772 15% 2898 15%20 to 29% 1064 13% 1529 13% 2593 13%30 to 39% 968 12% 1450 12% 2418 12%40 to 49% 1163 14% 1640 14% 2803 14%50 to 74% 1791 22% 2596 22% 4387 22%
75 to 100% 777 10% 1039 9% 1816 9%Total 8035 100% 11915 100% 19950 100%
In your selected course section, on average, what percent of class time is spent on lecture
About how many hours do you spend in a typical 7-day week participating on college committees or task forces
About how many hours do you spend in a typical 7-day week mentoring other faculty
FF5

Count Percent Count Percent Count Percent
2007 CCFSSE Faculty Only Frequency Distributions
Part-Time Faculty Full-Time Faculty All Faculty
0 310 4% 466 4% 776 4%1 to 9% 1657 21% 2801 24% 4458 23%
10 to 19% 1930 24% 3006 26% 4936 25%20 to 29% 1485 19% 2169 18% 3654 19%30 to 39% 850 11% 1225 10% 2075 11%40 to 49% 675 9% 867 7% 1542 8%50 to 74% 714 9% 900 8% 1614 8%
75 to 100% 296 4% 343 3% 639 3%Total 7917 100% 11777 100% 19694 100%
0% 1881 24% 2885 25% 4766 25%1 to 9% 1924 25% 3175 28% 5099 27%
10 to 19% 1385 18% 2188 19% 3573 19%20 to 29% 1012 13% 1372 12% 2384 12%30 to 39% 513 7% 689 6% 1202 6%40 to 49% 417 5% 487 4% 904 5%50 to 74% 422 5% 461 4% 883 5%
75 to 100% 163 2% 191 2% 354 2%Total 7717 100% 11448 100% 19165 100%
0 4348 55% 5409 46% 9757 50%In your selected course section on average what percent of class time is spent on
In your selected course section, on average, what percent of class time is spent on teacher-led discussion
In your selected course section, on average, what percent of class time is spent on teacher-student shared responsibility (seminar, discussion, etc.)
0 4348 55% 5409 46% 9757 50%1 to 9% 1531 19% 3020 26% 4551 23%
10 to 19% 640 8% 1166 10% 1806 9%20 to 29% 354 4% 603 5% 957 5%30 to 39% 218 3% 403 3% 621 3%40 to 49% 213 3% 316 3% 529 3%50 to 74% 276 3% 434 4% 710 4%
75 to 100% 350 4% 412 4% 762 4%Total 7930 100% 11763 100% 19693 100%
0% 1885 24% 2266 19% 4151 21%1 to 9% 2365 30% 3933 33% 6298 32%
10 to 19% 1618 20% 2570 22% 4188 21%20 to 29% 921 12% 1343 11% 2264 11%30 to 39% 475 6% 682 6% 1157 6%40 to 49% 320 4% 418 4% 738 4%50 to 74% 270 3% 430 4% 700 4%
75 to 100% 94 1% 170 1% 264 1%Total 7948 100% 11812 100% 19760 100%
0 3126 39% 4669 40% 7795 40%1 to 9% 2675 34% 4312 37% 6987 35%
10 to 19% 1102 14% 1528 13% 2630 13%20 to 29% 436 6% 592 5% 1028 5%30 to 39% 233 3% 253 2% 486 2%40 to 49% 144 2% 172 1% 316 2%50 to 74% 136 2% 164 1% 300 2%
75 to 100% 63 1% 98 1% 161 1%Total 7915 100% 11788 100% 19703 100%
In your selected course section, on average, what percent of class time is spent on student computer use
In your selected course section, on average, what percent of class time is spent on small group activities
In your selected course section, on average, what percent of class time is spent on student presentations
FF6
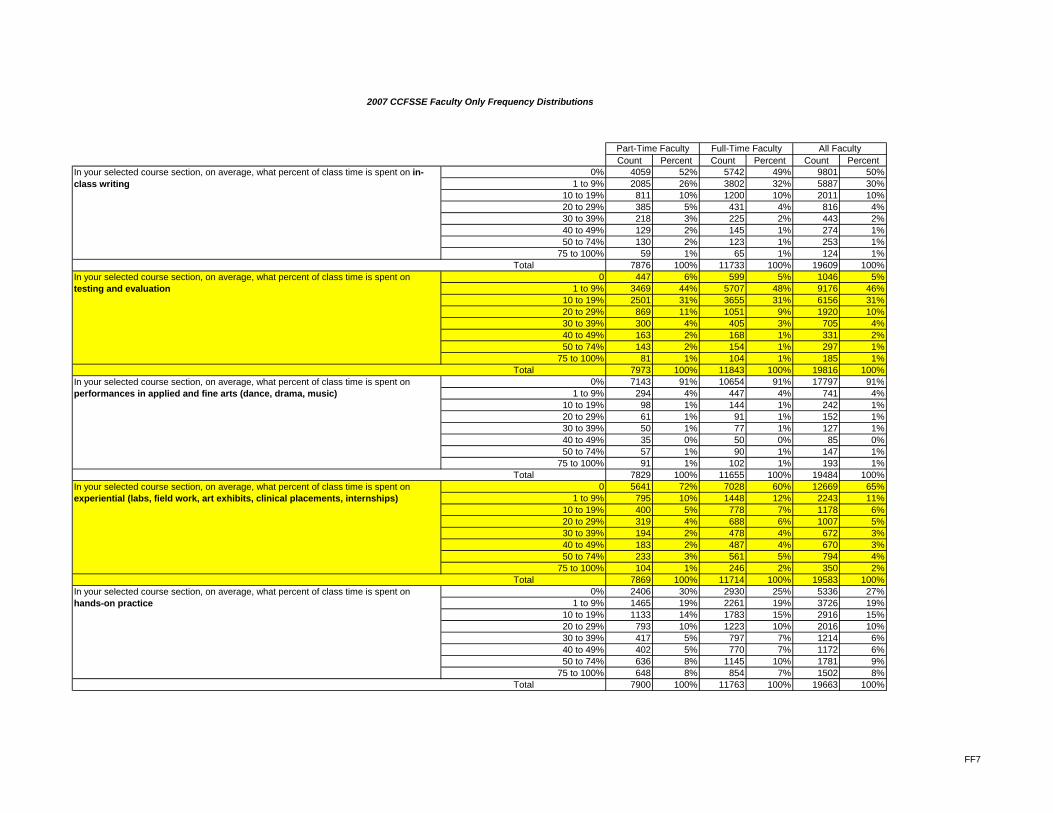
Count Percent Count Percent Count Percent
2007 CCFSSE Faculty Only Frequency Distributions
Part-Time Faculty Full-Time Faculty All Faculty
0% 4059 52% 5742 49% 9801 50%1 to 9% 2085 26% 3802 32% 5887 30%
10 to 19% 811 10% 1200 10% 2011 10%20 to 29% 385 5% 431 4% 816 4%30 to 39% 218 3% 225 2% 443 2%40 to 49% 129 2% 145 1% 274 1%50 to 74% 130 2% 123 1% 253 1%
75 to 100% 59 1% 65 1% 124 1%Total 7876 100% 11733 100% 19609 100%
0 447 6% 599 5% 1046 5%1 to 9% 3469 44% 5707 48% 9176 46%
10 to 19% 2501 31% 3655 31% 6156 31%20 to 29% 869 11% 1051 9% 1920 10%30 to 39% 300 4% 405 3% 705 4%40 to 49% 163 2% 168 1% 331 2%50 to 74% 143 2% 154 1% 297 1%
75 to 100% 81 1% 104 1% 185 1%Total 7973 100% 11843 100% 19816 100%
0% 7143 91% 10654 91% 17797 91%
In your selected course section, on average, what percent of class time is spent on testing and evaluation
In your selected course section on average what percent of class time is spent on
In your selected course section, on average, what percent of class time is spent on in-class writing
0% 7143 91% 10654 91% 17797 91%1 to 9% 294 4% 447 4% 741 4%
10 to 19% 98 1% 144 1% 242 1%20 to 29% 61 1% 91 1% 152 1%30 to 39% 50 1% 77 1% 127 1%40 to 49% 35 0% 50 0% 85 0%50 to 74% 57 1% 90 1% 147 1%
75 to 100% 91 1% 102 1% 193 1%Total 7829 100% 11655 100% 19484 100%
0 5641 72% 7028 60% 12669 65%1 to 9% 795 10% 1448 12% 2243 11%
10 to 19% 400 5% 778 7% 1178 6%20 to 29% 319 4% 688 6% 1007 5%30 to 39% 194 2% 478 4% 672 3%40 to 49% 183 2% 487 4% 670 3%50 to 74% 233 3% 561 5% 794 4%
75 to 100% 104 1% 246 2% 350 2%Total 7869 100% 11714 100% 19583 100%
0% 2406 30% 2930 25% 5336 27%1 to 9% 1465 19% 2261 19% 3726 19%
10 to 19% 1133 14% 1783 15% 2916 15%20 to 29% 793 10% 1223 10% 2016 10%30 to 39% 417 5% 797 7% 1214 6%40 to 49% 402 5% 770 7% 1172 6%50 to 74% 636 8% 1145 10% 1781 9%
75 to 100% 648 8% 854 7% 1502 8%Total 7900 100% 11763 100% 19663 100%
In your selected course section, on average, what percent of class time is spent on performances in applied and fine arts (dance, drama, music)
In your selected course section, on average, what percent of class time is spent on experiential (labs, field work, art exhibits, clinical placements, internships)
In your selected course section, on average, what percent of class time is spent on hands-on practice
FF7

Count Percent Count Percent Count Percent
2007 CCFSSE Faculty Only Frequency Distributions
Part-Time Faculty Full-Time Faculty All Faculty
Part-time faculty 8323 100% 0 0% 8323 40%Full-time faculty 0 0% 12263 100% 12263 60%
Total 8323 100% 12263 100% 20586 100%1 to 3 hours 1066 13% 190 2% 1256 6%4 to 6 hours 1669 21% 278 2% 1947 10%7 to 9 hours 1212 15% 340 3% 1552 8%
10 to 12 hours 1133 14% 547 5% 1680 8%13 to 15 hours 687 9% 1217 10% 1904 10%16 to 18 hours 651 8% 1033 9% 1684 8%19 to 21 hours 444 6% 653 5% 1097 5%22 to 24 hours 394 5% 678 6% 1072 5%25 to 27 hours 228 3% 505 4% 733 4%28 to 30 hours 198 2% 1305 11% 1503 8%
More than 30 hours 382 5% 5224 44% 5606 28%Total 8064 100% 11970 100% 20034 100%
No 7442 91% 9934 82% 17376 86%Yes 722 9% 2149 18% 2871 14%
Total 8164 100% 12083 100% 20247 100%No 7480 92% 10550 87% 18030 89%
During this term, does your institution consider you to be employed part-time or full-time
What is the total number of credit hours you are scheduled to teach during the current academic year (including summer sessions) at this college
During the current academic year, is team teaching part of your teaching role at this college
During the current academic year are linked courses part of your teaching role at this No 7480 92% 10550 87% 18030 89%Yes 684 8% 1533 13% 2217 11%
Total 8164 100% 12083 100% 20247 100%No 7629 93% 10673 88% 18302 90%
Yes 535 7% 1410 12% 1945 10%Total 8164 100% 12083 100% 20247 100%
No 7903 97% 10128 84% 18031 89%Yes 261 3% 1955 16% 2216 11%
Total 8164 100% 12083 100% 20247 100%No 7452 91% 4758 39% 12210 60%
Yes 712 9% 7325 61% 8037 40%Total 8164 100% 12083 100% 20247 100%
No 7750 95% 9436 78% 17186 85%Yes 414 5% 2647 22% 3061 15%
Total 8164 100% 12083 100% 20247 100%No 7364 90% 8083 67% 15447 76%
Yes 800 10% 4000 33% 4800 24%Total 8164 100% 12083 100% 20247 100%
No 7803 96% 10316 85% 18119 89%Yes 361 4% 1767 15% 2128 11%
Total 8164 100% 12083 100% 20247 100%No 7484 92% 9560 79% 17044 84%
Yes 680 8% 2523 21% 3203 16%Total 8164 100% 12083 100% 20247 100%
During the current academic year, are learning communities part of your teaching role at this college
During the current academic year, are capstone courses part of your teaching role at this college
During the current academic year, are linked courses part of your teaching role at this college
During the current academic year, are distance learning courses part of your teaching role at this college
During the current academic year, is service learning (community service) incorporated into your course part of your teaching role at this college
During the current academic year, is academic advising part of your teaching role at this college
During the current academic year, is clinical and other field supervision of student work part of your teaching role at this college
During the current academic year, are independent studies part of your teaching role at this college
FF8

Count Percent Count Percent Count Percent
2007 CCFSSE Faculty Only Frequency Distributions
Part-Time Faculty Full-Time Faculty All Faculty
Other 722 9% 401 3% 1123 6%Lecturer 458 6% 72 1% 530 3%
Instructor 5688 71% 4389 37% 10077 51%Assistant Professor 249 3% 1656 14% 1905 10%Associate Professor 333 4% 1845 15% 2178 11%
Professor 532 7% 3545 30% 4077 20%Total 7982 100% 11908 100% 19890 100%
No tenure system at this institution 2253 30% 3868 33% 6121 32%Not on tenure track, although this
institution has a tenure system 4949 66% 949 8% 5898 30%On tenure track but not tenured 119 2% 1918 16% 2037 11%
Tenured 201 3% 5085 43% 5286 27%Total 7522 100% 11820 100% 19342 100%
40 years or more 92 1% 124 1% 216 1%30 to 39 years 328 4% 1110 9% 1438 7%20 to 29 years 685 9% 2373 20% 3058 15%10 to 19 years 1682 21% 3916 33% 5598 28%
5 to 9 years 2103 26% 2633 22% 4736 24%1 to 4 years 2351 29% 1486 12% 3837 19%
How many years of teaching experience do you have in any college/university, not including graduate teaching assistant positions
Which of the following best describes your academic rank, title, or current position (Mark only one)
What is your current tenure status (Mark only one)
1 to 4 years 2351 29% 1486 12% 3837 19%First-year teacher 762 10% 278 2% 1040 5%
Total 8003 100% 11920 100% 19923 100%Other 158 2% 186 2% 344 2%
Associate degree 242 3% 444 4% 686 3%Bachelor's degree 1162 15% 1002 8% 2164 11%
Master's degree 5238 65% 7886 66% 13124 66%Doctoral degree (e.g., Ph.D., Ed.D.) 917 11% 2111 18% 3028 15%
First professional degree (e.g., M.D., D.D.S., J.D., D.V.M.) 288 4% 283 2% 571 3%
Total 8005 100% 11912 100% 19917 100%22 to 24 49 1% 18 0% 67 0%25 to 29 489 6% 338 3% 827 4%30 to 39 1453 18% 2037 17% 3490 18%40 to 49 1772 22% 3263 28% 5035 25%50 to 64 3544 44% 5782 49% 9326 47%
65 or more 677 8% 426 4% 1103 6%Total 7984 100% 11864 100% 19848 100%
Male 3572 45% 5343 45% 8915 45%Female 4378 55% 6481 55% 10859 55%
Total 7950 100% 11824 100% 19774 100%
What is your gender
What is the highest degree you have earned
What is your age group
FF9

Count Percent Count Percent Count Percent
2007 CCFSSE Faculty Only Frequency Distributions
Part-Time Faculty Full-Time Faculty All Faculty
United States citizen, native 7215 90% 10887 92% 18102 91%United States citizen, naturalized 553 7% 714 6% 1267 6%Permanent resident of the United
States (immigrant visa) 187 2% 216 2% 403 2%Temporary resident of the United
States (non-immigrant visa) 24 0% 42 0% 66 0%Total 7979 100% 11859 100% 19838 100%
American Indian or Native American 71 1% 102 1% 173 1%Asian, Asian American, or Pacific
Islander 274 3% 355 3% 629 3%Native Hawaiian 7 0% 10 0% 17 0%
Black or African American, Non-Hispanic 459 6% 620 5% 1079 5%
White, Non-Hispanic 6441 82% 9620 82% 16061 82%Hispanic, Latino, or Spanish 420 5% 700 6% 1120 6%
Other 217 3% 329 3% 546 3%Total 7889 100% 11736 100% 19625 100%
No 6644 82% 10804 90% 17448 87%Yes 1466 18% 1225 10% 2691 13%
What is your citizenship status
What is your racial or ethnic identification (Mark only one)
Where are you employed outside of this college: Self-employedYes 1466 18% 1225 10% 2691 13%
Total 8110 100% 12029 100% 20139 100%No 6534 81% 11249 94% 17783 88%
Yes 1576 19% 780 6% 2356 12%Total 8110 100% 12029 100% 20139 100%
No 7840 97% 11966 99% 19806 98%Yes 270 3% 63 1% 333 2%
Total 8110 100% 12029 100% 20139 100%No 6789 84% 11883 99% 18672 93%
Yes 1321 16% 146 1% 1467 7%Total 8110 100% 12029 100% 20139 100%
No 7499 92% 11576 96% 19075 95%Yes 611 8% 453 4% 1064 5%
Total 8110 100% 12029 100% 20139 100%No 6654 82% 11049 92% 17703 88%
Yes 1456 18% 980 8% 2436 12%Total 8110 100% 12029 100% 20139 100%
No 5850 72% 3388 28% 9238 46%Yes 2260 28% 8641 72% 10901 54%
Total 8110 100% 12029 100% 20139 100%
Where are you employed outside of this college: Other college(s) in teaching position
Where are you employed outside of this college: Other college(s) in non-teaching position
Where are you employed outside of this college: Work related to my teaching field at this college
Where are you employed outside of this college: Not employed elsewhere
Where are you employed outside of this college: Full-time non-academic position
Where are you employed outside of this college: Part-time non-academic position
FF10

2007 CCFSSE Codebook The data dictionary for the Community College Faculty Survey of Student Engagement (CCFSSE) begins on the next page. It provides information on the structure, contents, and layout of the CCFSSE dataset. Please note: Some items in the codebook are not included in the data file to protect the individual identities of the participating faculty members. These include items 20, 21, 22, 24, 25, 26, and 27.

CCFSSE 2007 Codebook
Note: Some items in this codebook are not included in your data file to protect the individual identities of the faculty members. (These include items 20, 21, 22,24,25,26, & 27)
Section 1: CCFSSE Items with related CCSSE items 4) How often do students in your selected course section do the following? 0=Don’t know 1=Never 2=Sometimes 3=Often 4=Very often Item # Variable Name Item Description/Variable Label 4a FCLQUEST Ask questions in class or contribute to class
discussions 4b FCLPRESEN Make a class presentation 4c FREWROPAP Prepare two or more drafts of a paper or assignment
before turning it in 4d FINTEGRAT Work on a paper that requires integrating ideas or
information from various sources 4e FCLUNPREP Come to class without completing readings or
assignments 4f FCLASSGRP Work with other students on projects during class 4g FOCCGRP Work with classmates outside of class to prepare class
assignments 4h FTUTOR Tutor or teach other students (paid or voluntary) 4i FCOMMPROJ Participate in a community-based project as a part of a
regular course 4j FINTERNET Use the internet or instant messaging to work on an
assignment 4k FEMAIL Use e-mail to communicate with you 4l FFACGRADE Discuss grades or assignments with you 4m FFACPLANS Talk about career plans with you 4n FFACIDEAS Discuss ideas from their readings or classes with you
outside of class 4o FFACFEED Receive prompt feedback (written or oral) from you
about their performance 4p FWORKHARD Work harder than they thought they could to meet your
standards or expectations 4q FFACOTH Work with you on activities other than coursework 4r FOOCIDEAS Discuss ideas from their readings or classes with
others outside of class (students, family members, co-workers, etc.)
4s FDIVRSTUD Have serious conversations with students of a different race or ethnicity other than their own
4t FDIFFSTUD Have serious conversations with students who differ from them in terms of their religious beliefs, political opinions, or personal values
4u FSKIPCLAS Skip class
1

5) During the current school year, how much does the coursework in your selected course section emphasize the following mental activities? 1=Very little 2=Some 3=Quite a bit 4=Very Much Item # Variable Name Item Description/Variable Label 5a FMEMORIZE Memorizing facts, ideas, or methods so the students
can repeat them in pretty much the same form 5b FANALYZE Analyzing the basic elements of an idea, experience, or
theory 5c FSYNTHESZ Synthesizing and organizing ideas, information, or
experiences in new ways 5d FEVALUATE Making judgments about the value or soundness of
information, arguments, or methods 5e FAPPLYING Applying theories or concepts to practical problems or
in new situations 5f FPERFORM Having students use information they have read or
heard to perform a new skill 6) In your selected course section, about how much reading and writing do your students do? 1=None 2=1 3=2 to 3 4=4 to 6 5=More than 6 Item # Variable Name Item Description/Variable Label 6a FREADASGN Number of assigned textbooks, manuals, books, or
book-length packs of course readings 6b FWRITEANY Number of written papers or reports of any length Item # Variable Name Item Description/Variable Label Response Value 7 FEXAMS Select the circle that best represents
the extent to which your examinations of student performance (e.g. Exams, portfolio) challenge students to do their best work
Responses range from 1 to 7, with scale anchors described: (1) Extremely easy (7) Extremely challenging
2

8) How important is it to you that students at this college participate in the following when appropriate? 1=Not important 2=Somewhat important 3=Very important Item # Variable Name Item Description/Variable Label 8a FINTERN Internships, field experience, co-op experience, or
clinical assignment 8b FESL English as a second language courses 8c FDEVREAD Developmental/remedial reading courses 8d FDEVWRITE Developmental/remedial writing courses 8e FDEVMATH Developmental/remedial math courses 8f FSTUDSKIL Study skills courses 8g FHONORS Honors courses 8h FORIEN College orientation program or course 8i FLRNCOMM Organized learning communities (linked courses/study
groups led by faculty or counselors) 9) How much does this college emphasize each of the following? 1=Very little 2=Some 3=Quite a bit 4=Very much Item # Variable Name Item Description/Variable Label 9a FENVSCHOL Encouraging students to spend significant amounts of
time studying 9b FENVSUPRT Providing students the support they need to help them
to succeed at this college 9c FENVDIVRS Encouraging contact among students from different
economic, social, and racial or ethnic backgrounds 9d FENVNACAD Helping students cope with their non-academic
responsibilities (work, family, etc.) 9e FENVSOCAL Providing students the support they need to thrive
socially 9f FFINSUPP Providing the financial support students need to afford
their education 9g FENVCOMP Using computers in academic work
3

10) About how many hours do you think full and part-time students at this college spend in a typical 7-day week doing each of the following? 0=None 1=1 to 5 hours 2=6 to 10 hours 3=11 to 20 hours 4=21 to 30 hours 5=More than 30 hours Item # Variable Name Item Description/Variable Label 10a FACADPR01 Preparing for class (studying, reading, writing,
rehearsing, doing homework, or other activities related to their programs)
10b FPAYWORK Working for pay 10c FCOCURR01 Participating in college-sponsored activities
(organizations, campus publications, student government, intercollegiate or intramural sports, etc.)
10d FCAREDE01 Providing care for dependents living with them (parents, children, spouse, etc.)
10e FCOMMUTE Commuting to and from class. 11) Select the circle that best represents the quality of student relationships with: Item # Variable Name Item Description/Variable Label Response Value 11a FENVSTU Other students Responses range from 1 to 7 with
scale anchors as described: (1) Unfriendly, unsupportive, sense of alienation (7) Friendly, supportive, sense of belonging
11b FENVFAC Instructors Responses range from 1 to 7 with scale anchors as described: (1) Unavailable, unhelpful, unsympathetic (7) Available, helpful, sympathetic
11c FENVADM Administrative personnel and offices
Responses range from 1 to 7 with scale anchors as described: (1) Unhelpful, inconsiderate, rigid (7) Helpful, considerate, flexible
4

12) To what extent do students' experiences in your selected course section contribute to their knowledge, skills, and personal development in the following areas? 0=None 1=Very little 2=Some 3=Quite a bit 4=Very much Item # Variable Name Item Description/Variable Label 12a FGNGENLED Acquiring a broad general education 12b FGNWORK Acquiring job or work-related knowledge and skills 12c FGNWRITE Writing clearly and effectively 12d FGNSPEAK Speaking clearly and effectively 12e FGNANALY Thinking critically and analytically 12f FGNSOLVE Solving numerical problems 12g FGNCMPTS Using computing and information technology 12h FGNOTHERS Working effectively with others 12i FGNINQ Learning effectively on their own 12j FGNSELF Understanding themselves
12k FGNDIVERS Understanding people of other racial and ethnic
backgrounds 12l FGNETHICS Developing a personal code of values and ethics 12m FGNCOMMUN Contributing to the welfare of their community 12n FCARGOAL Developing clearer career goals 12o FGAINCAR Gaining information about career opportunities 13.1) How often do you refer students to the following services? 0=Don’t know/N.A. 1=Rarely or never 2=Sometimes 3=Often Item # Variable Name Item Description/Variable Label 13a1 FUSEACAD Academic advising/planning 13b1 FUSECACOU Career counseling 13c1 FUSEJOBPL Job placement assistance 13d1 FUSETUTOR Peer or other tutoring 13e1 FUSELAB Skill labs (writing, math, etc.) 13f1 FUSECHLD Child care 13g1 FUSEFAADV Financial aid advising 13h1 FUSECOMLB Computer lab 13i1 FUSESTORG Student organizations 13j1 FUSETRCRD Transfer credit assistance 13k1 FUSEDISAB Services to students with disabilities
5

13.3) How important do you believe the services are to students at this college. 1=Not at all 2=Somewhat 3=Very Item # Variable Name Item Description/Variable Label 13a3 FIMPACAD Academic advising/planning 13b3 FIMPCACOU Career counseling 13c3 FIMPJOBPL Job placement assistance 13d3 FIMPTUTOR Peer or other tutoring 13e3 FIMPLAB Skill labs (writing, math, etc.) 13f3 FIMPCHLD Child care 13g3 FIMPFAADV Financial aid advising 13h3 FIMPCOMLB Computer lab 13i3 FIMPSTORG Student organizations 13j3 FIMPTRCRD Transfer credit assistance 13k3 FIMPDISAB Services to students with disabilities 14) How likely is it that the following issues would cause students to withdraw from class or from this college? (Please respond to each item) 1=Not likely 2=Somewhat likely 3=Likely 4=Very likely Item # Variable Name Item Description/Variable Label 14a FWRKFULL Working full-time 14b FCAREDEP Caring for dependents 14c FACADUNP Being academically unprepared 14d FLACKFIN Lacking finances 14e FTRANSFER Transferring to a 4-year college or university Section 2: CCFSSE Items without related CCSSE items Item # Variable
Name Item Description/Variable Label Response Value
1 FNUMSTU How many students are enrolled in your selected course section?
1=Fewer than 10 2=10 to 19 3=20 to 29 4=30 to 39 5=40 to 69 6=70 or more
6

7
2) Using the list provided, please enter the code that best corresponds to the general area of your selected course. Variable: FMAJOR Response Value
Description
01 Agriculture 02 Architecture & Related Programs (city/urban, community/regional planning, etc.)03 Biological Sciences/Life Sciences (biology, biochemistry, botany, zoology, etc.)04 Business Management & Administrative Services (accounting, business admin.,
marketing, management, real estate, etc.)05 Communications (advertising, journalism, television/radio, etc.)06 Computer & Information Sciences07 Conservation & Renewable Natural Resources (fishing, forestry, wildlife, etc.) 08 Construction Trades (masonry, carpentry, plumbing & pipe fitters, etc.) 09 Education 10 Engineering 11 English Language & Literature/Letters (composition, creative writing, etc.) 12 Foreign Languages & Literatures (French, Spanish, etc.)13 Health Professions & Related Sciences (nursing, physical therapy, dental, EMT,
veterinary, etc.) 14 Law & Legal Studies 15 Liberal Arts & Sciences, General Studies & Humanities16 Library Science 17 Mathematics 18 Mechanics & Repairers (A/C, heating & refrigeration, electrical/electronic
equipment, etc.) 19 Military Technologies 20 Multi/Interdisciplinary Studies (international relations, ecology, environmental
studies, etc.) 21 Parks, Recreation, Leisure & Fitness Studies22 Personal & Miscellaneous Services (gaming & sports, cosmetic, culinary, etc.)23 Physical Sciences (astronomy, chemistry, geology, physics, etc.) 24 Precision Production Trades (drafting, graphic, precious metal worker, etc.) 25 Protective Services (criminal justice & corrections, fire protection, etc.) 26 Psychology 27 Public Administration & Services (public policy, social work, etc.) 28 Science Technologies (biological technology, nuclear & industrial radiological
technology, etc.) 29 Social Sciences & History (anthropology, archeology, economics, geography,
history, political science, sociology, etc.)30 Theology Studies & Religious Vocations (philosophy, ministry, etc.) 31 Transportation & Materials Moving Workers (air, vehicle, & water workers, etc.)32 Visual & Performing Arts (art, music, theater, dance, etc.)33 Vocational Home Economics (child care/guidance worker & manager, clothing,
apparel, & textile worker, housekeeping, etc.)34 Other 35 Developmental Math 36 Developmental Reading 37 Developmental Writing 38 Other Developmental

Item # Variable Name
Item Description/Variable Label Response Value
3 FTIMES Prior to the Spring semester, how many times have you taught your selected course?
1=None 2=1 to 3 3=4 to 6 4=7 to 9 5=10 to 15 6=16 to 20 7=21 or more
13.2) How much do you incorporate the use of these services into your selected course section? 0=N.A. 1=Rarely or Never 2=Sometimes 3=Often Item # Variable Name Item Description/Variable Label 13a2 FSATACAD Academic advising/planning 13b2 FSATCACOU Career counseling 13c2 FSATJOBPL Job placement assistance 13d2 FSATTUTOR Peer or other tutoring 13e2 FSATLAB Skill labs (writing, math, etc.) 13f2 FSATCHLD Child care 13g2 FSATFAADV Financial aid advising 13h2 FSATCOMLB Computer lab 13i2 FSATSTORG Student organizations 13j2 FSATTRCRD Transfer credit assistance 13k2 FSATDISAB Services to students with disabilities 14) How likely is it that the following issues would cause students to withdraw from class or from this college? (Please respond to each item) 1=Not likely 2=Somewhat likely 3=Likely 4=Very likely Item # Variable Name Item Description/Variable Label 14f FPERSON Personal issues
8

15) About how many hours do you spend in a typical 7-day week doing each of the following? 0=None 4=13 to 16 1=1 to 4 5=17 to 20 2=5 to 8 6=21 to 30 3=9 to 12 7=31+ Item # Variable Name Item Description/Variable Label 15a FTEACH Teaching students in class 15b FGRADE Grading papers 15c FFEEDBACK Giving other forms of written and oral feedback to
students 15d FPREP Preparing for class 15e FREFLECT Reflecting and working on ways to improve my
teaching 15f FRESEARCH Research and scholarly activities 15g FWORKHON Working with honors' projects 15h FADVISE Advising students 15i FSUPERV Supervising internships or other field experiences 15j FWORKSTA Working with students on activities other than course
work (committees, organizations, student life activities, orientation, intramurals, etc.)
15k FOUTCLAS Other interactions with students outside the classroom 15l FCONDUCT Conducting service activities 15m FCOORD Coordination and/or administrative activities 15n FTASK Participating on college committees or task forces 15o FMENT Mentoring other faculty 16) In your selected course section, on average, what percent of class time is spent on the following? 0=0% 1=1 to 9% 2=10 to 19% 3=20 to 29% 4=30 to 39% 5=40 to 49% 6=50 to 74% 7=75 to 100% Item # Variable Name Item Description/Variable Label 16a FLECTURE Lecture 16b FTEACHDIS Teacher-led discussion 16c FTEACHSTU Teacher-student shared responsibility (seminar,
discussion, etc.) 16d FSTUCOM Student computer use 16e FSMGROUP Small group activities 16f FSTUPRES Student presentations 16g FCLASWRIT In-class writing 16h FTESTEVAL Testing and evaluation 16i FPERART Performances in applied and fine arts (dance, drama,
music) 16j FEXPERI Experiential (labs, field work, art exhibits, clinical
placements, internships) 16k FHANDS Hands-on practice
9

Item # Variable
Name Item Description/Variable Label Response Value
17 FENROLL During this term, does your institution consider you to be employed part-time or full-time?
1=Part-time faculty 2=Full-time faculty
Item # Variable
Name Item Description/Variable Label Response Value
18 FSECTIONS
What is the total number of credit hours you are scheduled to teach during the current academic year (including summer sessions) at this college?
1=1 to 3 hours 2=4 to 6 hours 3=7 to 9 hours 4=10 to 12 hours 5=13 to 15 hours 6=16 to 18 hours 7=19 to 21 hours 8=22 to 24 hours 9=25 to 27 hours 10=28 to 30 hours 11=More than 30 hours
19) During the current academic year, which of the following are part of your teaching role at this college? This question asks faculty to select all options that apply. To permit multiple responses, the question is represented in the codebook by nine separate items the faculty member either checks or does not check. NOTE: All items below have the following response values: 0=No response 1=Response Item # Variable Name Item Description/Variable Label 19a FTEAMTEC Team teaching 19b FLINKED Linked courses 19c FLEARNCMM Learning community 19d FCAPSTONE Capstone course (culminating a program or integrating
a series of courses) 19e FACAADV Academic advising 19f FCLINIC Clinical or other field supervision of student work 19g FDISTANC Distance learning course 19h FSERVIC Service learning (community service) incorporated into
course(s) 19i FINDSTUDY Independent study
10

Item # Variable Name
Item Description/Variable Label Response Value
20 FACADRANK
Which of the following best describes your academic rank, title, or current position?
1=Other 2=Lecturer 3=Instructor 4=Assistant Professor 5=Associate Professor 6=Professor
Item # Variable
Name Item Description/Variable Label Response Value
21 FTENURE What is your current tenure status?
1=No tenure system at this institution 2=Not on tenure track, although this institution has a tenure system 3=On tenure track but not tenured 4=Tenured
Item # Variable
Name Item Description/Variable Label Response Value
22 FYEARS
How many years of teaching experience do you have in any college/university, not including graduate teaching assistant positions?
1=40 years or more 2=30 to 39 years 3=20 to 29 years 4=10 to 19 years 5=5 to 9 years 6=1 to 4 years 7=First-year teacher
Item # Variable
Name Item Description/Variable Label Response Value
23 FDEGREE What is the highest degree you have earned?
1=Other 2=Associate degree 3=Bachelor's degree 4=Master's degree 5=Doctoral degree (e.g., Ph.D., Ed.D.) 6=First professional degree (e.g., M.D., D.D.S., J.D., D.V.M.)
Item # Variable
Name Item Description/Variable Label Response Value
24 FACAGE
What is your age group? 1=22 to 24 2=25 to 29 3=30 to 39 4=40 to 49 5=50 to 64 6=65 or more
Item # Variable
Name Item Description/Variable Label Response Value
25 FSEX
What is your gender? 1=Male 2=Female
11

Item # Variable Name
Item Description/Variable Label Response Value
26 FINTERNAT
What is your citizenship status? 1=United States citizen, native 2=United States citizen, naturalized 3=Permanent resident of the United States (immigrant visa) 4=Temporary resident of the United States (non-immigrant visa)
Item # Variable
Name Item Description/Variable Label Response Value
27 FRERACE
What is your racial or ethnic identification? (Mark only one)
1=American Indian or other Native American 2=Asian, Asian American or Pacific Islander 3=Native Hawaiian 4=Black or African American, Non-Hispanic 5=White, Non-Hispanic 6=Hispanic, Latino, Spanish 7=Other
28) Where are you employed outside of this college? This question asks faculty to select all options that apply. To permit multiple responses, the question is represented in the codebook by seven separate items the faculty member either checks or does not check. NOTE: All items below have the following response values: 0=No response 1=Response Item # Variable Name Item Description/Variable Label 28a FSELFEM Self-employed 28b FOTCOLTP Other college(s) in teaching position 28c FOTCOLNT Other college(s) in non-teaching position 28d FFTNAP Full-time non-academic position 28e FPTNAP Part-time non-academic position 28f FWORKTEA Work related to my teaching field at this college 28g FNOTEMP Not employed elsewhere
12

13
29) Using the list provided, please enter the code that best corresponds to your teaching area. Variable: FTEACAREA Response Value
Description
01 Agriculture 02 Architecture & Related Programs (city/urban, community/regional planning, etc.)03 Biological Sciences/Life Sciences (biology, biochemistry, botany, zoology, etc.)04 Business Management & Administrative Services (accounting, business admin.,
marketing, management, real estate, etc.)05 Communications (advertising, journalism, television/radio, etc.)06 Computer & Information Sciences07 Conservation & Renewable Natural Resources (fishing, forestry, wildlife, etc.) 08 Construction Trades (masonry, carpentry, plumbing & pipe fitters, etc.) 09 Education 10 Engineering 11 English Language & Literature/Letters (composition, creative writing, etc.) 12 Foreign Languages & Literatures (French, Spanish, etc.)13 Health Professions & Related Sciences (nursing, physical therapy, dental, EMT,
veterinary, etc.) 14 Law & Legal Studies 15 Liberal Arts & Sciences, General Studies & Humanities16 Library Science 17 Mathematics 18 Mechanics & Repairers (A/C, heating & refrigeration, electrical/electronic
equipment, etc.) 19 Military Technologies 20 Multi/Interdisciplinary Studies (international relations, ecology, environmental
studies, etc.) 21 Parks, Recreation, Leisure & Fitness Studies22 Personal & Miscellaneous Services (gaming & sports, cosmetic, culinary, etc.)23 Physical Sciences (astronomy, chemistry, geology, physics, etc.) 24 Precision Production Trades (drafting, graphic, precious metal worker, etc.) 25 Protective Services (criminal justice & corrections, fire protection, etc.) 26 Psychology 27 Public Administration & Services (public policy, social work, etc.) 28 Science Technologies (biological technology, nuclear & industrial radiological
technology, etc.) 29 Social Sciences & History (anthropology, archeology, economics, geography,
history, political science, sociology, etc.)30 Theology Studies & Religious Vocations (philosophy, ministry, etc.) 31 Transportation & Materials Moving Workers (air, vehicle, & water workers, etc.)32 Visual & Performing Arts (art, music, theater, dance, etc.)33 Vocational Home Economics (child care/guidance worker & manager, clothing,
apparel, & textile worker, housekeeping, etc.)34 Other 35 Developmental Math 36 Developmental Reading37 Developmental Writing38 Other Developmental

Annotated Table of Contents:Appendix
2007 CCSSE Cohort AnalphabeticallistofallinstitutionsthathaveparticipatedinCCSSEin2005,2006,
or 2007. Only a college’s most recent year of participation is reflected.
2007 CCSSE Cohort: Comparison GroupsAnalphabeticallistof2007CCSSE Cohort institutions grouped by size classification (small,
medium,large,orextra-large).
2007 Consortia AlistofallinstitutionsparticipatinginCCSSE2007consortia.Institutionsareableto
participateinmorethanoneconsortium;therefore,aninstitution’snamemayappearmorethanonce.
Table 2: Percent of Target Aseriesoftablesthatprovidedataonsurveycompletioncountsandratesfor2007CCSSECohort
institutions as well as breakouts for institutions in each size category ─ small, medium, large, and extra-large.
Table 3: Respondents to Underlying Population by College Size Atablethathighlightsdataaboutrespondentandpopulationcharacteristicsbyinstitutionsizeand
overall, similar to data presented in Table 1. The specific characteristics examined include gender, race/ethnicity,age,andenrollmentstatus.
Table 4: Underlying Populations Percentages (Gender, Race/Ethnicity, Enrollment Status)
A table displaying college-level population characteristics by institution size (i.e., small, medium, large, andextra-large).
Table 5: Underlying Populations Percentages (Age) A table displaying college-level population characteristics by institution size (i.e., small, medium, large,
andextra-large).
Table 6: Survey Completion Rates A table providing data on (1) overall survey completion rates; (2) average survey completion rates;
and (3) the percentage of sampled classes for the 2007 CCSSECohortcollegesaswellasbreakoutsfor colleges in each size category ─ small, medium, large, and extra-large.
National Advisory Board Alistofmembersof CCSSE’s National Advisory Board (NAB).
CCSSE Staff AlistofCCSSEstaffmembers.
CCSSE Brochure and sample copy of The Community College Student Report (CCSR)
Community College Surveyof Student Engagement

2007 CCSSE Cohort
2007CCSSECohort Page1of11
Community College Surveyof Student Engagement
AbrahamBaldwinAgriculturalCollege Tifton GA 2006AikenTechnicalCollege Graniteville SC 2007
AlabamaSouthernCommunityCollege Monroeville AL 2007AlexandriaTechnicalCollege Alexandria MN 2007
AlleganyCollegeofMaryland Cumberland MD 2006AlpenaCommunityCollege Alpena MI 2007
AlvinCommunityCollege Alvin TX 2007AmericanRiverCollege Sacramento CA 2007
AngelinaCollege Lufkin TX 2007AnneArundelCommunityCollege Arnold MD 2006Anoka-RamseyCommunityCollege CoonRapids MN 2006Asheville-BuncombeTechnicalCommunityCollege Asheville NC 2007AshlandCommunityandTechnicalCollege Ashland KY 2007Asnuntuck Community College Enfield CT 2006AtlantaMetropolitanCollege Atlanta GA 2006AtlantaTechnicalCollege Atlanta GA 2006AustinCommunityCollege Austin TX 2007BainbridgeCollege Bainbridge GA 2006BaltimoreCityCommunityCollege Baltimore MD 2006BartonCountyCommunityCollege GreatBend KS 2006BatonRougeCommunityCollege BatonRouge LA 2007BelmontTechnicalCollege St.Clairsville OH 2006Berkshire Community College Pittsfield MA 2007BigBendCommunityCollege MosesLake WA 2007BigSandyCommunityandTechnicalCollege Prestonsburg KY 2007BismarckStateCollege Bismarck ND 2007BlackHawkCollege Moline IL 2006BlinnCollege Brenham TX 2006BlueRidgeCommunityCollege WeyersCave VA 2006BluegrassCommunityandTechnicalCollege Lexington KY 2006BoroughofManhattanCommunityCollege NewYork NY 2007BossierParishCommunityCollege BossierCity LA 2007BowlingGreenTechnicalCollege BowlingGreen KY 2007BrazosportCollege LakeJackson TX 2007BrevardCommunityCollege Cocoa FL 2007BristolCommunityCollege FallRiver MA 2007BrookdaleCommunityCollege Lincroft NJ 2007BrookhavenCollege FarmersBranch TX 2006BrowardCommunityCollege FortLauderdale FL 2007BucksCountyCommunityCollege Newtown PA 2006BunkerHillCommunityCollege Boston MA 2007BurlingtonCountyCollege Pemberton NJ 2007ButlerCountyCommunityCollege(KS) ElDorado KS 2006
Year of most recent CCSSE
Institution City State participation

2007CCSSECohort Page2of11
Year of most recent CCSSE Institution City State participation
ButlerCountyCommunityCollege(PA) Butler PA 2006CaldwellCommunityCollegeandTechnicalInstitute Hudson NC 2007CapeCodCommunityCollege WestBarnstable MA 2007CapeFearCommunityCollege Wilmington NC 2006CapitalCommunityCollege Hartford CT 2006CaritasLaboureCollege Boston MA 2007CarolinasCollegeofHealthSciences Charlotte NC 2007CarrollCommunityCollege Westminster MD 2006CarteretCommunityCollege MoreheadCity NC 2006CascadiaCommunityCollege Bothell WA 2006CasperCollege Casper WY 2007CecilCommunityCollege NorthEast MD 2006CedarValleyCollege Lancaster TX 2006CentralArizonaCollege Coolidge AZ 2006CentralCommunityCollege GrandIsland NE 2007CentralFloridaCommunityCollege Ocala FL 2007CentralLakesCollege Brainerd MN 2006CentralMaineCommunityCollege Auburn ME 2007CentralVirginiaCommunityCollege Lynchburg VA 2006CentralWyomingCollege Riverton WY 2007CentraliaCollege Centralia WA 2006CenturyCollege WhiteBearLake MN 2007Chandler-GilbertCommunityCollege Chandler AZ 2007ChattahoocheeTechnicalCollege Marietta GA 2006ChattanoogaStateTechnicalCommunityCollege Chattanooga TN 2007ChesapeakeCollege WyeMills MD 2006ChipolaCollege Marianna FL 2007CitrusCollege Glendora CA 2006CityCollegeofSanFrancisco SanFrancisco CA 2007ClarendonCollege Clarendon TX 2006ClevelandCommunityCollege Shelby NC 2007ClevelandStateCommunityCollege Cleveland TN 2007ClovisCommunityCollege Clovis NM 2006CoastalBendCollege Beeville TX 2006CoastalCarolinaCommunityCollege Jacksonville NC 2007CoastalGeorgiaCommunityCollege Brunswick GA 2006CochiseCollege SierraVista AZ 2007CollegeofAlameda Alameda CA 2007CollegeofDuPage GlenEllyn IL 2006CollegeofLakeCounty Grayslake IL 2007CollegeofSouthernIdaho TwinFalls ID 2007CollegeofSouthernMaryland LaPlata MD 2006CollegeoftheMainland TexasCity TX 2006CollegeoftheMarshallIslands Majuro MH 2007CollegeoftheRedwoods Eureka CA 2006CollegeoftheSiskiyous Weed CA 2006ColoradoMountainCollege GlenwoodSpringsCO 2007ColumbiaStateCommunityCollege Columbia TN 2006CommunityCollegeofAlleghenyCounty Pittsburgh PA 2007CommunityCollegeofDenver Denver CO 2006CommunityCollegeofPhiladelphia Philadelphia PA 2007CommunityCollegeofRhodeIsland Warwick RI 2006CommunityCollegeofSouthernNevada LasVegas NV 2006

2007CCSSECohort Page�of11
Year of most recent CCSSE Institution City State participation
CorningCommunityCollege Corning NY 2007CumberlandCountyCollege Vineland NJ 2007CuyahogaCommunityCollege Cleveland OH 2006CyFairCollege Cypress TX 2007DabneyS.LancasterCommunityCollege CliftonForge VA 2006DanvilleAreaCommunityCollege Danville IL 2006DanvilleCommunityCollege Danville VA 2007DartonCollege Albany GA 2006DaytonaBeachCommunityCollege DaytonaBeach FL 2007DeAnzaCollege Cupertino CA 2007DelMarCollege CorpusChristi TX 2007DelawareTechnical&CommunityCollege-OwensCampus Dover DE 2007DelawareTechnical&CommunityCollege-Stanton-Wilmington Dover DE 2007DelawareTechnical&CommunityCollege-TerryCampus Dover DE 2007DelgadoCommunityCollege NewOrleans LA 2007DeltaCollege UniversityCenter MI 2007DoñaAnaCommunityCollege LasCruces NM 2007DouglasCollege Coquitlam BC 2007DurhamTechnicalCommunityCollege Durham NC 2006DyersburgStateCommunityCollege Dyersburg TN 2006EastGeorgiaCollege Swainsboro GA 2007EasternNewMexicoUniversity-Roswell Roswell NM 2006EasternShoreCommunityCollege Melfa VA 2006Eastern West Virginia Community & Technical College Moorefield WV 2006EasternWyomingCollege Torrington WY 2007Eastfield College Mesquite TX 2007EdisonCollege FortMyers FL 2007EdisonStateCommunityCollege Piqua OH 2007ElCentroCollege Dallas TX 2007ElPasoCommunityCollege ElPaso TX 2007ElizabethtownCommunityandTechnicalCollege Elizabethtown KY 2007EllsworthCommunityCollege Marshalltown IA 2007EssexCountyCollege Newark NJ 2006EstrellaMountainCommunityCollege Avondale AZ 2006EverettCommunityCollege Everett WA 2006FairmontStateCommunityandTechnicalCollege Fairmont WV 2006FloridaCommunityCollegeatJacksonville Jacksonville FL 2007FloridaKeysCommunityCollege KeyWest FL 2007FondduLacTribalandCommunityCollege Cloquet MN 2007FrankPhillipsCollege Borger TX 2007FrederickCommunityCollege Frederick MD 2006GainesvilleCollege Oakwood GA 2006GalvestonCollege Galveston TX 2006GarrettCollege McHenry MD 2006GatewayCommunityandTechnicalCollege Ft.Mitchell KY 2007GatewayCommunityCollege NewHaven CT 2006GeneseeCommunityCollege Batavia NY 2007GeorgeCWallaceStateCommunityCollege Hanceville AL 2006GeorgiaHighlandsCollege Rome GA 2006GeorgiaMilitaryCollege Milledgeville GA 2007

2007CCSSECohort Page�of11
Year of most recent CCSSE Institution City State participation
GeorgiaPerimeterCollege Decatur GA 2006GermannaCommunityCollege LocustGrove VA 2006GlendaleCommunityCollege Glendale CA 2007GloucesterCountyCollege Sewell NJ 2007GordonCollege Barnesville GA 2006GrandRapidsCommunityCollege GrandRapids MI 2007GraysHarborCollege Aberdeen WA 2006GraysonCountyCollege Denison TX 2006Greenfield Community College Greenfield MA 2007GreenvilleTechnicalCollege Greenville SC 2007GuilfordTechnicalCommunityCollege Jamestown NC 2007GulfCoastCommunityCollege PanamaCity FL 2007HagerstownCommunityCollege Hagerstown MD 2006HarfordCommunityCollege BelAir MD 2006HaroldWashingtonCollege Chicago IL 2006HarperCollege Palatine IL 2006HawaiiCommunityCollege Hilo HI 2006HawkeyeCommunityCollege Waterloo IA 2006HazardCommunityandTechnicalCollege Hazard KY 2006HeartlandCommunityCollege Normal IL 2007HendersonCommunityCollege Henderson KY 2006HesstonCollege Hesston KS 2007HibbingCommunityCollege Hibbing MN 2007HillsboroughCommunityCollege Tampa FL 2007HolyokeCommunityCollege Holyoke MA 2007HonoluluCommunityCollege Honolulu HI 2006HopkinsvilleCommunityCollege Hopkinsville KY 2007HousatonicCommunityCollege Bridgeport CT 2006HoustonCommunityCollegeSystem Houston TX 2007HowardCollege BigSpring TX 2006HowardCommunityCollege Columbia MD 2006HudsonValleyCommunityCollege Troy NY 2007HutchinsonCommunityCollege Hutchinson KS 2006IllinoisCentralCollege EastPeoria IL 2006IllinoisValleyCommunityCollege Oglesby IL 2006IndianRiverCommunityCollege FortPierce FL 2007IsothermalCommunityCollege Spindale NC 2007ItascaCommunityCollege GrandRapids MN 2007ItawambaCommunityCollege Fulton MS 2006IvyTechCommunityCollege-Anderson Muncie IN 2006IvyTechCommunityCollege-Bloomington Bloomington IN 2006IvyTechCommunityCollege-CentralIndiana Indianapolis IN 2007IvyTechCommunityCollege-Columbus Columbus IN 2006IvyTechCommunityCollege-EastChicago Gary IN 2006IvyTechCommunityCollege-Elkhart SouthBend IN 2006IvyTechCommunityCollege-Evansville Evansville IN 2006IvyTechCommunityCollege-FortWayne FortWayne IN 2006IvyTechCommunityCollege-Gary Gary IN 2006IvyTechCommunityCollege-Kokomo Kokomo IN 2006IvyTechCommunityCollege-Lafayette Lafayette IN 2006IvyTechCommunityCollege-Lawrenceburg Lawrenceburg IN 2006IvyTechCommunityCollege-Logansport Kokomo IN 2006IvyTechCommunityCollege-Madison Lawrenceburg IN 2006

2007CCSSECohort Page�of11
Year of most recent CCSSE Institution City State participation
IvyTechCommunityCollege-Marion Muncie IN 2006IvyTechCommunityCollege-MichiganCity Gary IN 2006IvyTechCommunityCollege-Muncie Muncie IN 2006IvyTechCommunityCollege-Sellersburg Sellersburg IN 2006IvyTechCommunityCollege-SouthBend SouthBend IN 2006IvyTechCommunityCollege-TerreHaute TerreHaute IN 2006IvyTechCommunityCollege-Valparaiso Gary IN 2006IvyTechCommunityCollege-Warsaw SouthBend IN 2006IvyTechCommunityCollege-Whitewater Richmond IN 2006J.SargeantReynoldsCommunityCollege Richmond VA 2006JacksonCommunityCollege Jackson MI 2006JacksonStateCommunityCollege Jackson TN 2006JamesA.RhodesStateCollege Lima OH 2007JeffersonCommunityandTechnicalCollege Louisville KY 2007JeffersonCommunityCollege Steubenville OH 2006JohnTylerCommunityCollege Chester VA 2006JohnsonCountyCommunityCollege OverlandPark KS 2007JolietJrCollege Joliet IL 2007KankakeeCommunityCollege Kankakee IL 2007KansasCityKansasCommunityCollege KansasCity KS 2007KapiolaniCommunityCollege Honolulu HI 2006KauaiCommunityCollege Lihue HI 2006KenaiPeninsulaCollege-UAA Soldotna AK 2007Kennebec Valley Community College Fairfield ME 2007KilgoreCollege Kilgore TX 2006KingsboroughCommunityCollege Brooklyn NY 2006KingwoodCollege Houston TX 2007KirkwoodCommunityCollege CedarRapids IA 2007KirtlandCommunityCollege Roscommon MI 2007KodiakCollege,UniversityofAlaskaAnchorage Kodiak AK 2007KuskokwimCampus,UniversityofAlaskaFairbanks Bethel AK 2007L.E.FletcherTechnicalCommunityCollege Houma LA 2007LaGuardiaCommunityCollege LongIslandCity NY 2007LakeCityCommunityCollege LakeCity FL 2007LakeRegionStateCollege DevilsLake ND 2007LakeSuperiorCollege Duluth MN 2007Lake-SumterCommunityCollege Leesburg FL 2007LamarInstituteofTechnology Beaumont TX 2006LamarStateCollege-Orange Orange TX 2007LaneCommunityCollege Eugene OR 200�LaneyCollege Oakland CA 2007LaramieCountyCommunityCollege Cheyenne WY 2007LeeCollege Baytown TX 2007LeechLakeTribalCollege CassLake MN 2007LeewardCommunityCollege PearlCity HI 2006LehighCarbonCommunityCollege Schnecksville PA 2006Lincoln Land Community College Springfield IL 2005Linn-BentonCommunityCollege Albany OR 2006LorainCountyCommunityCollege Elyria OH 2006LordFairfaxCommunityCollege Middletown VA 200�LouisburgCollege Louisburg NC 2007LouisianaDeltaCommunityCollege Monroe LA 2007LouisianaTechnicalCollege-Region2 BatonRouge LA 2007

2007CCSSECohort Page6of11
Year of most recent CCSSE Institution City State participation
LouisianaTechnicalCollege-Region� MorganCity LA 2007LouisianaTechnicalCollege-Region� Lafayette LA 2007LouisianaTechnicalCollege-Region6 Alexandria LA 2007LouisianaTechnicalCollege-Region7 Minden LA 2007LouisianaTechnicalCollege-Region8 WestMonroe LA 2007LouisianaTechnicalCollege-Region9 Bogalusa LA 2007LowerColumbiaCollege Longview WA 2007MacombCommunityCollege Warren MI 2007MadisonvilleCommunityCollege Madisonville KY 2007MalcolmXCollege Chicago IL 2006ManateeCommunityCollege Bradenton FL 2007ManchesterCommunityCollege Manchester CT 2006MarshallCommunityandTechnicalCollege Huntington WV 200�MarshalltownCommunityCollege Marshalltown IA 2007MartinCommunityCollege Williamston NC 2006MassachusettsBayCommunityCollege WellesleyHills MA 2007MassasoitCommunityCollege Brockton MA 2007MauiCommunityCollege Kahului HI 2006MaylandCommunityCollege SprucePine NC 2007MaysvilleCommunityandTechnicalCollege Maysville KY 2007McHenryCountyCollege CrystalLake IL 2007MercedCollege Merced CA 2007MercerCountyCommunityCollege WestWindsor NJ 200�MercyCollegeofHealthSciences DesMoines IA 2006MesabiRangeCommunityandTechnicalCollege Virginia MN 2007MetropolitanCommunityCollege Omaha NE 200�MetropolitanCommunityCollege-KansasCity KansasCity MO 2007MiamiDadeCollege Miami FL 2007MidMichiganCommunityCollege Harrison MI 2007MiddleGeorgiaCollege Cochran GA 2007MiddlesexCommunityCollege Lowell MA 2007MiddlesexCommunityCollege Middletown CT 2006MiddlesexCountyCollege Edison NJ 2006MidlandsTechnicalCollege Columbia SC 2007Mid-SouthCommunityCollege WestMemphis AR 200�MinneapolisCommunityandTechnicalCollege Minneapolis MN 2007MinotStateUniversity-Bottineau Bottineau ND 2007MiraCostaCollege Oceanside CA 2007ModestoJuniorCollege Modesto CA 2006MontanaStateUniversityBillings Billings MT 2007MontgomeryCollege Conroe TX 2007MontgomeryCollege Rockville MD 2006MontgomeryCountyCommunityCollege BlueBell PA 2007MoraineValleyCommunityCollege PalosHills IL 200�MotlowStateCommunityCollege Tullahoma TN 2007MountWachusettCommunityCollege Gardner MA 2007MountainEmpireCommunityCollege BigStoneGap VA 200�MountainViewCollege Dallas TX 200�Mt.HoodCommunityCollege Gresham OR 200�Mt.SanAntonioCollege Walnut CA 2007NashvilleStateTechnicalCommunityCollege Nashville TN 2006NaugatuckValleyCommunityCollege Waterbury CT 2006NavarroCollege Corsicana TX 2006

2007CCSSECohort Page7of11
Year of most recent CCSSE Institution City State participation
NewHampshireTechnicalInstitute Concord NH 2006NewMexicoJuniorCollege Hobbs NM 2007NewMexicoMilitaryInstitute Roswell NM 2006NewMexicoStateUniversity-Grants Grants NM 2006NewMexicoStateUniversityatAlamogordo Alamogordo NM 2006NewRiverCommunityandTechnicalCollege Beckley WV 200�NewRiverCommunityCollege Dublin VA 200�NHCommunityTechnicalCollege-Berlin Berlin NH 2006NHCommunityTechnicalCollege-Claremont Claremont NH 2006NHCommunityTechnicalCollege-Laconia Laconia NH 2006NHCommunityTechnicalCollege-Manchester Manchester NH 2006NHCommunityTechnicalCollege-Nashua Nashua NH 2006NHCommunityTechnicalCollege-Stratham Stratham NH 2006NorthArkansasCollege Harrison AR 2007NorthCentralMissouriCollege Trenton MO 2007North Central State College Mansfield OH 2006NorthDakotaStateCollegeofScience Wahpeton ND 2007NorthFloridaCommunityCollege Madison FL 2007NorthHarrisCollege Houston TX 2007NorthHennepinCommunityCollege BrooklynPark MN 2007NorthIowaAreaCommunityCollege MasonCity IA 2006NorthLakeCollege Irving TX 2006NorthShoreCommunityCollege Danvers MA 2007NorthamptonCommunityCollege Bethlehem PA 2007NortheastIowaCommunityCollege Calmar IA 2006NortheastLakeviewCollege SanAntonio TX 2007NortheastMississippiCommunityCollege Booneville MS 2007NortheastStateTechnicalCommunityCollege Blountville TN 2006NortheastTexasCommunityCollege MtPleasant TX 2007NorthernEssexCommunityCollege Haverhill MA 2007NorthernMaineCommunityCollege PresqueIsle ME 2007NorthernNewMexicoCommunityCollege Espanola NM 2006NorthernOklahomaCollege Tonkawa OK 2007NorthernVirginiaCommunityCollege Annandale VA 200�NorthWestArkansasCommunityCollege Bentonville AR 2007NorthwestCollege Powell WY 2007NorthwestIndianCollege Bellingham WA 200�NorthwestIowaCommunityCollege Sheldon IA 2007NorthwestVistaCollege SanAntonio TX 2007NorthwesternConnecticutCommunityCollege Winsted CT 2006NorwalkCommunityCollege Norwalk CT 2006NunezCommunityCollege Chalmette LA 2007Oakland Community College Bloomfield Hills MI 2005OaktonCommunityCollege DesPlaines IL 2006OceanCountyCollege TomsRiver NJ 2006Okaloosa-WaltonCollege Niceville FL 2007OklahomaCityCommunityCollege OklahomaCity OK 2007OlympicCollege Bremerton WA 2007OnondagaCommunityCollege Syracuse NY 2007OregonCoastCommunityCollege Newport OR 2006OuachitaTechnicalCollege Malvern AR 2007OwensboroCommunityandTechnicalCollege Owensboro KY 2007PalmBeachCommunityCollege LakeWorth FL 2007

2007CCSSECohort Page8of11
Year of most recent CCSSE Institution City State participation
PaloAltoCollege SanAntonio TX 2007PalomarCollege SanMarcos CA 2007PanolaCollege Carthage TX 2006ParadiseValleyCommunityCollege Phoenix AZ 2007ParisJuniorCollege Paris TX 2006ParklandCollege Champaign IL 2007PasadenaCityCollege Pasadena CA 2007Pasco-HernandoCommunityCollege NewPortRichey FL 2007PatrickHenryCommunityCollege Martinsville VA 200�PaulD.CampCommunityCollege Franklin VA 200�PellissippiStateTechnicalCommunityCollege Knoxville TN 2006PensacolaJuniorCollege Pensacola FL 2007PhoenixCollege Phoenix AZ 2006PiedmontVirginiaCommunityCollege Charlottesville VA 2007PittCommunityCollege Winterville NC 2006PolkCommunityCollege WinterHaven FL 2007PrairieStateCollege ChicagoHeights IL 2006PrinceGeorge’sCommunityCollege Largo MD 2006PrinceWilliamSoundCommunityCollege Valdez AK 2007PuebloCommunityCollege Pueblo CO 2007QueensboroughCommunityCollege Bayside NY 2007QuinebaugValleyCommunityCollege Danielson CT 2006QuinsigamondCommunityCollege Worcester MA 2007RainyRiverCommunityCollege InternationalFalls MN 2007RangerCollege Ranger TX 2006RappahannockCommunityCollege Glenns VA 200�RaritanValleyCommunityCollege Somerville NJ 200�ReadingAreaCommunityCollege Reading PA 2007RedRocksCommunityCollege Lakewood CO 200�RedlandsCommunityCollege ElReno OK 2007RendLakeCollege Ina IL 2007RichardJ.DaleyCollege Chicago IL 2007RichlandCollege Dallas TX 2006RiverParishesCommunityCollege Sorrento LA 2007RiverlandCommunityCollege Austin MN 2007RoaneStateCommunityCollege Harriman TN 2006RochesterCommunityandTechnicalCollege Rochester MN 2007Rowan-CabarrusCommunityCollege Salisbury NC 2006RoxburyCommunityCollege Roxbury MA 2007SalemCommunityCollege CarneysPoint NJ 2007SalishKootenaiCollege Pablo MT 2007SaltLakeCommunityCollege SaltLakeCity UT 2006SanAntonioCollege SanAntonio TX 2007SanDiegoMesaCollege SanDiego CA 2007SanJacintoCollege-CentralCampus Pasadena TX 2007SanJacintoCollege-NorthCampus Pasadena TX 2007SanJacintoCollege-SouthCampus Pasadena TX 2007SanJuanCollege Farmington NM 2006SantaAnaCollege SantaAna CA 2007SantaFeCommunityCollege(FL) Gainesville FL 2007SantaFeCommunityCollege(NM) SantaFe NM 2007SchoolcraftCollege Livonia MI 2007ScottsdaleCommunityCollege Scottsdale AZ 200�

2007CCSSECohort Page9of11
Year of most recent CCSSE Institution City State participation
SeminoleCommunityCollege Sanford FL 2007SheltonStateCommunityCollege Tuscaloosa AL 2007SheridanCollege Sheridan WY 2007SinclairCommunityCollege Dayton OH 2007SkagitValleyCollege MountVernon WA 2007SomersetCommunityCollege Somerset KY 2006SouthFloridaCommunityCollege AvonPark FL 2007SouthGeorgiaCollege Douglas GA 2007SouthLouisianaCommunityCollege Lafayette LA 2007SouthMountainCommunityCollege Phoenix AZ 2007SouthPiedmontCommunityCollege Polkton NC 200�SouthPugetSoundCommunityCollege Olympia WA 200�SouthSeattleCommunityCollege Seattle WA 2007SouthSuburbanCollege SouthHolland IL 2007SouthTexasCollege McAllen TX 2007SoutheastKentuckyCommunityandTechnicalCollege Cumberland KY 2006SoutheasternCommunityCollege(IA) WestBurlington IA 2007SoutheasternCommunityCollege(NC) Whiteville NC 2007SoutheasternTechnicalCollege Vidalia GA 2007SouthernMaineCommunityCollege SouthPortland ME 2006SouthernUniversityatShreveport Shreveport LA 200�SouthernWestVirginiaCommunityandTechnicalCollegeMountGay WV 200�SouthsideVirginiaCommunityCollege Alberta VA 200�SouthwestTennesseeCommunityCollege Memphis TN 2007SouthwestTexasJuniorCollege Uvalde TX 2006SouthwestVirginiaCommunityCollege Richlands VA 200�SouthwesternCommunityCollege Sylva NC 200�SouthwesternIllinoisCollege Belleville IL 200�SouthwesternIndianPolytechnicInstitute Albuquerque NM 2006SouthwesternOregonCommunityCollege CoosBay OR 2007SOWELATechnicalCommunityCollege LakeCharles LA 2007SpokaneCommunityCollege Spokane WA 200�SpoonRiverCollege Canton Il 2007Springfield Technical Community College Springfield MA 2007St.CharlesCommunityCollege St.Peters MO 2006St.JohnsRiverCommunityCollege Palatka FL 2007St.LouisCommunityCollege-Meramec St.Louis MO 2006St.LouisCommunityCollegeatForestPark St.Louis MO 2006St.LouisCommunityCollege-FlorissantValley St.Louis MO 2006St.PetersburgCollege St.Petersburg FL 2007St.Philip’sCollege SanAntonio TX 2007StarkStateCollegeofTechnology NorthCanton OH 200�SurryCommunityCollege Dobson NC 2007TacomaCommunityCollege Tacoma WA 200�TaftCollege Taft CA 2007TallahasseeCommunityCollege Tallahassee FL 2007TananaValleyCampus,UniversityofAlaskaFairbanks Fairbanks AK 2007TechnicalCollegeoftheLowcountry Beaufort SC 2007TempleCollege Temple TX 2007TexasStateTechnicalCollegeHarlingen Harlingen TX 200�TexasStateTechnicalCollegeMarshall Marshall TX 2007TexasStateTechnicalCollegeWaco Waco TX 2006TexasStateTechnicalCollegeWestTexas Sweetwater TX 2006

2007CCSSECohort Page10of11
Year of most recent CCSSE Institution City State participation
TheCommunityandTechnicalCollegeatWVUTech Montgomery WV 200�TheCommunityandTechnicalCollegeofShepherd Martinsburg WV 200�TheCommunityCollegeofBaltimoreCounty Baltimore MD 2006TheVictoriaCollege Victoria TX 2007ThomasNelsonCommunityCollege Hampton VA 2007ThreeRiversCommunityCollege Norwich CT 2006TidewaterCommunityCollege Norfolk VA 200�TomballCollege Tomball TX 2007TompkinsCortlandCommunityCollege Dryden NY 2007Tri-CountyCommunityCollege Murphy NC 200�Tri-CountyTechnicalCollege Pendleton SC 2007TrinityValleyCommunityCollege Athens TX 2007TritonCollege RiverGrove IL 2006TruckeeMeadowsCommunityCollege Reno NV 200�TrumanCollege Chicago IL 2007TunxisCommunityCollege Farmington CT 2006UniversityofAlaskaMatanuskaSusitnaCollege Palmer AK 2007UniversityofAlaskaSoutheastKetchikancampus Juneau AK 2007UniversityofArkansasCommunityCollegeatBatesville Batesville AR 2007UniversityofArkansasCommunityCollegeatHope Hope AR 200�UniversityofCincinnatiClermontCollege Batavia OH 2006UniversityofNewMexico-Gallup Gallup NM 2006UniversityofNewMexico-TaosBranch Taos NM 2006UniversityofNewMexico-ValenciaCampus LosLunas NM 2006UniversityofWisconsinColleges Madison WI 200�ValenciaCommunityCollege Orlando FL 2007VermilionCommunityCollege Ely MN 2007VernonCollege Vernon TX 2007VictorValleyCollege Victorville CA 2007VincennesUniversity Vincennes IN 2007VirginiaHighlandsCommunityCollege Abingdon VA 200�VirginiaWesternCommunityCollege Roanoke VA 200�VolunteerStateCommunityCollege Gallatin TN 2007WaltersStateCommunityCollege Morristown TN 2006WarrenCountyCommunityCollege Washington NJ 200�WashingtonStateCommunityCollege Marietta OH 2007WaycrossCollege Waycross GA 200�WayneCommunityCollege Goldsboro NC 2007WeatherfordCollege Weatherford TX 2007WenatcheeValleyCollege Wenatchee WA 2007WestHillsCommunityCollegeDistrict Coalinga CA 2007WestKentuckyCommunityandTechnicalCollege Paducah KY 2007WestVirginiaNorthernCommunityCollege Wheeling WV 200�WestVirginiaStateCommunityandTechnicalCollege Institute WV 2007WestVirginiaUniversityatParkersburg Parkersburg WV 200�WestchesterCommunityCollege Valhalla NY 200�WesternIowaTechCommunityCollege SiouxCity IA 200�WesternNebraskaCommunityCollege Scottsbluff NE 2007WesternPiedmontCommunityCollege Morganton NC 200�WesternTexasCollege Snyder TX 2006WesternWyomingCommunityCollege RockSprings WY 2007WestmorelandCountyCommunityCollege Youngwood PA 2007WhartonCountyJuniorCollege Wharton TX 2007

2007CCSSECohort Page11of11
Year of most recent CCSSE Institution City State participation
WilburWrightCollege Chicago IL 2007WillistonStateCollege Williston ND 2007WindwardCommunityCollege Kaneohe HI 2006WisconsinIndianheadTechnicalCollege ShellLake WI 200�Wor-WicCommunityCollege Salisbury MD 2006WythevilleCommunityCollege Wytheville VA 200�YorkTechnicalCollege RockHill SC 2007ZaneStateCollege Zanesville OH 200�

2007 CCSSE CohortComparison Groups
2007CCSSECohortComparisonGroups Page1of12
Community College Surveyof Student Engagement
Comparison Groups—Small Colleges
AbrahamBaldwinAgriculturalCollege Tifton GA 2005AikenTechnicalCollege Graniteville SC 2007
AlabamaSouthernCommunityCollege Monroeville AL 2007AlexandriaTechnicalCollege Alexandria MN 2007
AlleganyCollegeofMaryland Cumberland MD 2006AlpenaCommunityCollege Alpena MI 2007
AlvinCommunityCollege Alvin TX 2007AshlandCommunityandTechnicalCollege Ashland KY 2007
Asnuntuck Community College Enfield CT 2006AtlantaMetropolitanCollege Atlanta GA 2005AtlantaTechnicalCollege Atlanta GA 2006BainbridgeCollege Bainbridge GA 2005BartonCountyCommunityCollege GreatBend KS 2006BelmontTechnicalCollege St.Clairsville OH 2006Berkshire Community College Pittsfield MA 2007BigBendCommunityCollege MosesLake WA 2007BismarckStateCollege Bismarck ND 2007BlueRidgeCommunityCollege WeyersCave VA 2005BowlingGreenTechnicalCollege BowlingGreen KY 2007BrazosportCollege LakeJackson TX 2007ButlerCountyCommunityCollege(PA) Butler PA 2006CaldwellCommunityCollegeandTechnicalInstitute Hudson NC 2007CapeCodCommunityCollege WestBarnstable MA 2007CapitalCommunityCollege Hartford CT 2006CaritasLaboureCollege Boston MA 2007CarolinasCollegeofHealthSciences Charlotte NC 2007CarrollCommunityCollege Westminster MD 2006CarteretCommunityCollege MoreheadCity NC 2006CascadiaCommunityCollege Bothell WA 2006CasperCollege Casper WY 2007CecilCommunityCollege NorthEast MD 2006CedarValleyCollege Lancaster TX 2006CentralLakesCollege Brainerd MN 2006CentralMaineCommunityCollege Auburn ME 2007CentralWyomingCollege Riverton WY 2007CentraliaCollege Centralia WA 2006ChattahoocheeTechnicalCollege Marietta GA 2005ChesapeakeCollege WyeMills MD 2006ChipolaCollege Marianna FL 2007ClarendonCollege Clarendon TX 2006ClevelandCommunityCollege Shelby NC 2007ClevelandStateCommunityCollege Cleveland TN 2007ClovisCommunityCollege Clovis NM 2006
Year of most recent CCSSE
Institution City State participation

2007CCSSECohortComparisonGroups Page2of12
Year of most recent CCSSE Institution City State participation
CoastalBendCollege Beeville TX 2006CoastalCarolinaCommunityCollege Jacksonville NC 2007CoastalGeorgiaCommunityCollege Brunswick GA 2005CollegeoftheMainland TexasCity TX 2006CollegeoftheMarshallIslands Majuro MH 2007CollegeoftheSiskiyous Weed CA 2006CumberlandCountyCollege Vineland NJ 2007DabneyS.LancasterCommunityCollege CliftonForge VA 2005DanvilleAreaCommunityCollege Danville IL 2006DanvilleCommunityCollege Danville VA 2007DartonCollege Albany GA 2005DelawareTechnical&CommunityCollege-OwensCampus Dover DE 2007DelawareTechnical&CommunityCollege-TerryCampus Dover DE 2007DyersburgStateCommunityCollege Dyersburg TN 2006EastGeorgiaCollege Swainsboro GA 2007EasternNewMexicoUniversity-Roswell Roswell NM 2006EasternShoreCommunityCollege Melfa VA 2005Eastern West Virginia Community & Technical College Moorefield WV 2005EasternWyomingCollege Torrington WY 2007EdisonStateCommunityCollege Piqua OH 2007EllsworthCommunityCollege Marshalltown IA 2007FairmontStateCommunityandTechnicalCollege Fairmont WV 2005FloridaKeysCommunityCollege KeyWest FL 2007FondduLacTribalandCommunityCollege Cloquet MN 2007FrankPhillipsCollege Borger TX 2007GalvestonCollege Galveston TX 2006GarrettCollege McHenry MD 2006GatewayCommunityandTechnicalCollege Ft.Mitchell KY 2007GeorgiaHighlandsCollege Rome GA 2005GordonCollege Barnesville GA 2005GraysHarborCollege Aberdeen WA 2005GraysonCountyCollege Denison TX 2006Greenfield Community College Greenfield MA 2007HagerstownCommunityCollege Hagerstown MD 2006HawaiiCommunityCollege Hilo HI 2006HazardCommunityandTechnicalCollege Hazard KY 2006HendersonCommunityCollege Henderson KY 2006HesstonCollege Hesston KS 2007HibbingCommunityCollege Hibbing MN 2007HonoluluCommunityCollege Honolulu HI 2006HopkinsvilleCommunityCollege Hopkinsville KY 2007HowardCollege BigSpring TX 2006IllinoisValleyCommunityCollege Oglesby IL 2006IsothermalCommunityCollege Spindale NC 2007ItascaCommunityCollege GrandRapids MN 2007IvyTechCommunityCollege-Bloomington Bloomington IN 2005IvyTechCommunityCollege-Columbus Columbus IN 2005IvyTechCommunityCollege-Elkhart SouthBend IN 2005IvyTechCommunityCollege-Evansville Evansville IN 2005IvyTechCommunityCollege-Kokomo Kokomo IN 2005IvyTechCommunityCollege-Lawrenceburg Lawrenceburg IN 2005
Comparison Groups—Small Colleges (continued)

2007CCSSECohortComparisonGroups Page�of12
Year of most recent CCSSE Institution City State participation
IvyTechCommunityCollege-Logansport Kokomo IN 2005IvyTechCommunityCollege-Madison Lawrenceburg IN 2005IvyTechCommunityCollege-Sellersburg Sellersburg IN 2005IvyTechCommunityCollege-SouthBend SouthBend IN 2005IvyTechCommunityCollege-TerreHaute TerreHaute IN 2005IvyTechCommunityCollege-Warsaw SouthBend IN 2005IvyTechCommunityCollege-Whitewater Richmond IN 2005JacksonStateCommunityCollege Jackson TN 2006JamesA.RhodesStateCollege Lima OH 2007JeffersonCommunityCollege Steubenville OH 2006KankakeeCommunityCollege Kankakee IL 2007KauaiCommunityCollege Lihue HI 2006KenaiPeninsulaCollege-UAA Soldotna AK 2007Kennebec Valley Community College Fairfield ME 2007KirtlandCommunityCollege Roscommon MI 2007KodiakCollege,UniversityofAlaskaAnchorage Kodiak AK 2007KuskokwimCampus,UniversityofAlaskaFairbanks Bethel AK 2007L.E.FletcherTechnicalCommunityCollege Houma LA 2007LakeCityCommunityCollege LakeCity FL 2007LakeRegionStateCollege DevilsLake ND 2007Lake-SumterCommunityCollege Leesburg FL 2007LamarInstituteofTechnology Beaumont TX 2006LamarStateCollege-Orange Orange TX 2007LaramieCountyCommunityCollege Cheyenne WY 2007LeechLakeTribalCollege CassLake MN 2007LouisburgCollege Louisburg NC 2007LouisianaDeltaCommunityCollege Monroe LA 2007LouisianaTechnicalCollege-Region2 BatonRouge LA 2007LouisianaTechnicalCollege-Region� MorganCity LA 2007LouisianaTechnicalCollege-Region4 Lafayette LA 2007LouisianaTechnicalCollege-Region6 Alexandria LA 2007LouisianaTechnicalCollege-Region7 Minden LA 2007LouisianaTechnicalCollege-Region8 WestMonroe LA 2007LouisianaTechnicalCollege-Region9 Bogalusa LA 2007LowerColumbiaCollege Longview WA 2007MadisonvilleCommunityCollege Madisonville KY 2007MarshallCommunityandTechnicalCollege Huntington WV 2005MarshalltownCommunityCollege Marshalltown IA 2007MartinCommunityCollege Williamston NC 2006MauiCommunityCollege Kahului HI 2006MaylandCommunityCollege SprucePine NC 2007MaysvilleCommunity&TechnicalCollege Maysville KY 2007MercyCollegeofHealthSciences DesMoines IA 2006MesabiRangeCommunityandTechnicalCollege Virginia MN 2007MidMichiganCommunityCollege Harrison MI 2007Mid-SouthCommunityCollege WestMemphis AR 2005MiddleGeorgiaCollege Cochran GA 2007MiddlesexCommunityCollege Middletown CT 2006MinotStateUniversity-Bottineau Bottineau ND 2007MontanaStateUniversityBillings Billings MT 2007MotlowStateCommunityCollege Tullahoma TN 2007MountWachusettCommunityCollege Gardner MA 2007MountainEmpireCommunityCollege BigStoneGap VA 2005
Comparison Groups—Small Colleges (continued)

2007CCSSECohortComparisonGroups Page4of12
Year of most recent CCSSE Institution City State participation
NewHampshireTechnicalInstitute Concord NH 2006NewMexicoJuniorCollege Hobbs NM 2007NewMexicoMilitaryInstitute Roswell NM 2006NewMexicoStateUniversity-Grants Grants NM 2006NewMexicoStateUniversityatAlamogordo Alamogordo NM 2006NewRiverCommunityandTechnicalCollege Beckley WV 2005NewRiverCommunityCollege Dublin VA 2005NHCommunityTechnicalCollege-Berlin Berlin NH 2006NHCommunityTechnicalCollege-Claremont Claremont NH 2006NHCommunityTechnicalCollege-Laconia Laconia NH 2006NHCommunityTechnicalCollege-Manchester Manchester NH 2006NHCommunityTechnicalCollege-Nashua Nashua NH 2006NHCommunityTechnicalCollege-Stratham Stratham NH 2006NorthArkansasCollege Harrison AR 2007NorthCentralMissouriCollege Trenton MO 2007North Central State College Mansfield OH 2006NorthDakotaStateCollegeofScience Wahpeton ND 2007NorthFloridaCommunityCollege Madison FL 2007NorthIowaAreaCommunityCollege MasonCity IA 2006NortheastLakeviewCollege SanAntonio TX 2007NortheastMississippiCommunityCollege Booneville MS 2007NortheastTexasCommunityCollege MtPleasant TX 2007NorthernMaineCommunityCollege PresqueIsle ME 2007NorthernNewMexicoCommunityCollege Espanola NM 2006NorthwestCollege Powell WY 2007NorthwestIndianCollege Bellingham WA 2005NorthwestIowaCommunityCollege Sheldon IA 2007NorthwesternConnecticutCommunityCollege Winsted CT 2006NunezCommunityCollege Chalmette LA 2007OregonCoastCommunityCollege Newport OR 2006OuachitaTechnicalCollege Malvern AR 2007PanolaCollege Carthage TX 2006ParisJuniorCollege Paris TX 2006PatrickHenryCommunityCollege Martinsville VA 2005PaulD.CampCommunityCollege Franklin VA 2005PiedmontVirginiaCommunityCollege Charlottesville VA 2007PrinceWilliamSoundCommunityCollege Valdez AK 2007QuinebaugValleyCommunityCollege Danielson CT 2006RainyRiverCommunityCollege InternationalFalls MN 2007RangerCollege Ranger TX 2006RappahannockCommunityCollege Glenns VA 2005ReadingAreaCommunityCollege Reading PA 2007RedlandsCommunityCollege ElReno OK 2007RiverParishesCommunityCollege Sorrento LA 2007RiverlandCommunityCollege Austin MN 2007RoxburyCommunityCollege Roxbury MA 2007SalemCommunityCollege CarneysPoint NJ 2007SalishKootenaiCollege Pablo MT 2007SantaFeCommunityCollege(NM) SantaFe NM 2007SheridanCollege Sheridan WY 2007SouthFloridaCommunityCollege AvonPark FL 2007SouthGeorgiaCollege Douglas GA 2007SouthLouisianaCommunityCollege Lafayette LA 2007
Comparison Groups—Small Colleges (continued)

2007CCSSECohortComparisonGroups Page5of12
Year of most recent CCSSE Institution City State participation
SouthMountainCommunityCollege Phoenix AZ 2007SouthPiedmontCommunityCollege Polkton NC 2005SoutheasternCommunityCollege(IA) WestBurlington IA 2007SoutheasternCommunityCollege(NC) Whiteville NC 2007SoutheasternTechnicalCollege Vidalia GA 2007SouthernMaineCommunityCollege SouthPortland ME 2006SouthernUniversityatShreveport Shreveport LA 2005SouthernWestVirginiaCommunityandTechnicalCollege MountGay WV 2005SouthwestTexasJuniorCollege Uvalde TX 2006SouthwestVirginiaCommunityCollege Richlands VA 2005SouthwesternCommunityCollege Sylva NC 2005SouthwesternIndianPolytechnicInstitute Albuquerque NM 2006SouthwesternOregonCommunityCollege CoosBay OR 2007SOWELATechnicalCommunityCollege LakeCharles LA 2007SpoonRiverCollege Canton Il 2007SurryCommunityCollege Dobson NC 2007TananaValleyCampus,UniversityofAlaskaFairbanks Fairbanks AK 2007TechnicalCollegeoftheLowcountry Beaufort SC 2007TempleCollege Temple TX 2007TexasStateTechnicalCollegeHarlingen Harlingen TX 2005TexasStateTechnicalCollegeMarshall Marshall TX 2007TexasStateTechnicalCollegeWaco Waco TX 2006TexasStateTechnicalCollegeWestTexas Sweetwater TX 2006TheCommunityandTechnicalCollegeatWVUTech Montgomery WV 2005TheCommunityandTechnicalCollegeofShepherd Martinsburg WV 2005TheVictoriaCollege Victoria TX 2007ThreeRiversCommunityCollege Norwich CT 2006TompkinsCortlandCommunityCollege Dryden NY 2007Tri-CountyCommunityCollege Murphy NC 2005TunxisCommunityCollege Farmington CT 2006UniversityofAlaskaMatanuskaSusitnaCollege Palmer AK 2007UniversityofAlaskaSoutheastKetchikancampus Juneau AK 2007UniversityofArkansasCommunityCollegeatBatesville Batesville AR 2007UniversityofArkansasCommunityCollegeatHope Hope AR 2005UniversityofCincinnatiClermontCollege Batavia OH 2006UniversityofNewMexico-Gallup Gallup NM 2006UniversityofNewMexico-TaosBranch Taos NM 2006UniversityofNewMexico-ValenciaCampus LosLunas NM 2006VermilionCommunityCollege Ely MN 2007VernonCollege Vernon TX 2007VirginiaHighlandsCommunityCollege Abingdon VA 2005WarrenCountyCommunityCollege Washington NJ 2005WashingtonStateCommunityCollege Marietta OH 2007WaycrossCollege Waycross GA 2005WayneCommunityCollege Goldsboro NC 2007WenatcheeValleyCollege Wenatchee WA 2007WestVirginiaNorthernCommunityCollege Wheeling WV 2005WestVirginiaStateCommunityandTechnicalCollege Institute WV 2007WestVirginiaUniversityatParkersburg Parkersburg WV 2005WesternNebraskaCommunityCollege Scottsbluff NE 2007WesternPiedmontCommunityCollege Morganton NC 2005
Comparison Groups—Small Colleges (continued)

2007CCSSECohortComparisonGroups Page6of12
Year of most recent CCSSE Institution City State participation
WesternTexasCollege Snyder TX 2006WesternWyomingCommunityCollege RockSprings WY 2007WillistonStateCollege Williston ND 2007WindwardCommunityCollege Kaneohe HI 2006WisconsinIndianheadTechnicalCollege ShellLake WI 2005Wor-WicCommunityCollege Salisbury MD 2006WythevilleCommunityCollege Wytheville VA 2005YorkTechnicalCollege RockHill SC 2007ZaneStateCollege Zanesville OH 2005
Comparison Groups—Small Colleges (continued)

2007CCSSECohortComparisonGroups Page7of12
Year of most recent CCSSE Institution City State participation
AngelinaCollege Lufkin TX 2007Anoka-RamseyCommunityCollege CoonRapids MN 2006Asheville-BuncombeTechnicalCommunityCollege Asheville NC 2007BaltimoreCityCommunityCollege Baltimore MD 2006BatonRougeCommunityCollege BatonRouge LA 2007BigSandyCommunityandTechnicalCollege Prestonsburg KY 2007BlackHawkCollege Moline IL 2006BossierParishCommunityCollege BossierCity LA 2007BristolCommunityCollege FallRiver MA 2007BunkerHillCommunityCollege Boston MA 2007BurlingtonCountyCollege Pemberton NJ 2007CapeFearCommunityCollege Wilmington NC 2005CentralArizonaCollege Coolidge AZ 2006CentralCommunityCollege GrandIsland NE 2007CentralFloridaCommunityCollege Ocala FL 2007CentralVirginiaCommunityCollege Lynchburg VA 2005ChattanoogaStateTechnicalCommunityCollege Chattanooga TN 2007CochiseCollege SierraVista AZ 2007CollegeofAlameda Alameda CA 2007CollegeofSouthernIdaho TwinFalls ID 2007CollegeofSouthernMaryland LaPlata MD 2006CollegeoftheRedwoods Eureka CA 2006ColoradoMountainCollege GlenwoodSpringsCO 2007ColumbiaStateCommunityCollege Columbia TN 2006CorningCommunityCollege Corning NY 2007DelawareTechnical&CommunityCollege-Stanton-Wilmington Dover DE 2007DoñaAnaCommunityCollege LasCruces NM 2007DurhamTechnicalCommunityCollege Durham NC 2005ElCentroCollege Dallas TX 2007ElizabethtownCommunity&TechnicalCollege Elizabethtown KY 2007EstrellaMountainCommunityCollege Avondale AZ 2006EverettCommunityCollege Everett WA 2006FrederickCommunityCollege Frederick MD 2006GainesvilleCollege Oakwood GA 2005GatewayCommunityCollege NewHaven CT 2006GeneseeCommunityCollege Batavia NY 2007GeorgeCWallaceStateCommunityCollege Hanceville AL 2005GeorgiaMilitaryCollege Milledgeville GA 2007GermannaCommunityCollege LocustGrove VA 2005GloucesterCountyCollege Sewell NJ 2007GulfCoastCommunityCollege PanamaCity FL 2007HarfordCommunityCollege BelAir MD 2006HawkeyeCommunityCollege Waterloo IA 2005HeartlandCommunityCollege Normal IL 2007HolyokeCommunityCollege Holyoke MA 2007HousatonicCommunityCollege Bridgeport CT 2006HowardCommunityCollege Columbia MD 2006HutchinsonCommunityCollege Hutchinson KS 2006ItawambaCommunityCollege Fulton MS 2006IvyTechCommunityCollege-Anderson Muncie IN 2005IvyTechCommunityCollege-EastChicago Gary IN 2005
Comparison Groups—Medium Colleges

2007CCSSECohortComparisonGroups Page8of12
Year of most recent CCSSE Institution City State participation
IvyTechCommunityCollege-FortWayne FortWayne IN 2005IvyTechCommunityCollege-Gary Gary IN 2005IvyTechCommunityCollege-Lafayette Lafayette IN 2005IvyTechCommunityCollege-Marion Muncie IN 2005IvyTechCommunityCollege-MichiganCity Gary IN 2005IvyTechCommunityCollege-Muncie Muncie IN 2005IvyTechCommunityCollege-Valparaiso Gary IN 2005JacksonCommunityCollege Jackson MI 2006JohnTylerCommunityCollege Chester VA 2005KansasCityKansasCommunityCollege KansasCity KS 2007KapiolaniCommunityCollege Honolulu HI 2006KilgoreCollege Kilgore TX 2006KingwoodCollege Houston TX 2007LakeSuperiorCollege Duluth MN 2007LeeCollege Baytown TX 2007LeewardCommunityCollege PearlCity HI 2006LehighCarbonCommunityCollege Schnecksville PA 2006Lincoln Land Community College Springfield IL 2005Linn-BentonCommunityCollege Albany OR 2006LordFairfaxCommunityCollege Middletown VA 2005MalcolmXCollege Chicago IL 2006ManchesterCommunityCollege Manchester CT 2006MassachusettsBayCommunityCollege WellesleyHills MA 2007MassasoitCommunityCollege Brockton MA 2007McHenryCountyCollege CrystalLake IL 2007MinneapolisCommunityandTechnicalCollege Minneapolis MN 2007MountainViewCollege Dallas TX 2005NashvilleStateTechnicalCommunityCollege Nashville TN 2006NaugatuckValleyCommunityCollege Waterbury CT 2006NavarroCollege Corsicana TX 2006NorthHennepinCommunityCollege BrooklynPark MN 2007NorthShoreCommunityCollege Danvers MA 2007NorthamptonCommunityCollege Bethlehem PA 2007NortheastIowaCommunityCollege Calmar IA 2006NortheastStateTechnicalCommunityCollege Blountville TN 2006NorthernEssexCommunityCollege Haverhill MA 2007NorthernOklahomaCollege Tonkawa OK 2007NorthWestArkansasCommunityCollege Bentonville AR 2007NorwalkCommunityCollege Norwalk CT 2006Okaloosa-WaltonCollege Niceville FL 2007OlympicCollege Bremerton WA 2007OwensboroCommunityandTechnicalCollege Owensboro KY 2007PaloAltoCollege SanAntonio TX 2007Pasco-HernandoCommunityCollege NewPortRichey FL 2007PellissippiStateTechnicalCommunityCollege Knoxville TN 2006PittCommunityCollege Winterville NC 2006PolkCommunityCollege WinterHaven FL 2007PrairieStateCollege ChicagoHeights IL 2006PuebloCommunityCollege Pueblo CO 2007QuinsigamondCommunityCollege Worcester MA 2007RaritanValleyCommunityCollege Somerville NJ 2005RedRocksCommunityCollege Lakewood CO 2005RendLakeCollege Ina IL 2007
Comparison Groups—Medium College (continued)

2007CCSSECohortComparisonGroups Page9of12
Year of most recent CCSSE Institution City State participation
RoaneStateCommunityCollege Harriman TN 2006RochesterCommunityandTechnicalCollege Rochester MN 2007Rowan-CabarrusCommunityCollege Salisbury NC 2006SanJacintoCollege-NorthCampus Pasadena TX 2007SanJuanCollege Farmington NM 2006SheltonStateCommunityCollege Tuscaloosa AL 2007SkagitValleyCollege MountVernon WA 2007SomersetCommunityCollege Somerset KY 2006SouthPugetSoundCommunityCollege Olympia WA 2005SouthSeattleCommunityCollege Seattle WA 2007SouthSuburbanCollege SouthHolland IL 2007SoutheastKentuckyCommunity&TechnicalCollege Cumberland KY 2006SouthsideVirginiaCommunityCollege Alberta VA 2005SpokaneCommunityCollege Spokane WA 2005Springfield Technical Community College Springfield MA 2007St.CharlesCommunityCollege St.Peters MO 2006St.JohnsRiverCommunityCollege Palatka FL 2007St.LouisCommunityCollegeatForestPark St.Louis MO 2006St.LouisCommunityCollege-FlorissantValley St.Louis MO 2006StarkStateCollegeofTechnology NorthCanton OH 2005TacomaCommunityCollege Tacoma WA 2005TomballCollege Tomball TX 2007Tri-CountyTechnicalCollege Pendleton SC 2007TrinityValleyCommunityCollege Athens TX 2007VolunteerStateCommunityCollege Gallatin TN 2007WaltersStateCommunityCollege Morristown TN 2006WeatherfordCollege Weatherford TX 2007WestHillsCommunityCollegeDistrict Coalinga CA 2007WestKentuckyCommunityandTechnicalCollege Paducah KY 2007WesternIowaTechCommunityCollege SiouxCity IA 2005WestmorelandCountyCommunityCollege Youngwood PA 2007WhartonCountyJuniorCollege Wharton TX 2007
Comparison Groups—Medium Colleges (continued)

2007CCSSECohortComparisonGroups Page10of12
Year of most recent CCSSE Institution City State participation
Comparison Groups—Large Colleges
AnneArundelCommunityCollege Arnold MD 2006BlinnCollege Brenham TX 2006BluegrassCommunityandTechnicalCollege Lexington KY 2006BrevardCommunityCollege Cocoa FL 2007BrookdaleCommunityCollege Lincroft NJ 2007BrookhavenCollege FarmersBranch TX 2006BucksCountyCommunityCollege Newtown PA 2006ButlerCountyCommunityCollege(KS) ElDorado KS 2006CenturyCollege WhiteBearLake MN 2007Chandler-GilbertCommunityCollege Chandler AZ 2007CitrusCollege Glendora CA 2006CollegeofLakeCounty Grayslake IL 2007CommunityCollegeofDenver Denver CO 2005CyFairCollege Cypress TX 2007DaytonaBeachCommunityCollege DaytonaBeach FL 2007DelMarCollege CorpusChristi TX 2007DelgadoCommunityCollege NewOrleans LA 2007DeltaCollege UniversityCenter MI 2007DouglasCollege Coquitlam BC 2007Eastfield College Mesquite TX 2007EdisonCollege FortMyers FL 2007EssexCountyCollege Newark NJ 2006GrandRapidsCommunityCollege GrandRapids MI 2007GreenvilleTechnicalCollege Greenville SC 2007GuilfordTechnicalCommunityCollege Jamestown NC 2007HaroldWashingtonCollege Chicago IL 2005HudsonValleyCommunityCollege Troy NY 2007IllinoisCentralCollege EastPeoria IL 2006IndianRiverCommunityCollege FortPierce FL 2007IvyTechCommunityCollege-CentralIndiana Indianapolis IN 2007J.SargeantReynoldsCommunityCollege Richmond VA 2005JeffersonCommunityandTechnicalCollege Louisville KY 2007JolietJrCollege Joliet IL 2007KingsboroughCommunityCollege Brooklyn NY 2005LaGuardiaCommunityCollege LongIslandCity NY 2007LaneCommunityCollege Eugene OR 2005LaneyCollege Oakland CA 2007LorainCountyCommunityCollege Elyria OH 2006ManateeCommunityCollege Bradenton FL 2007MercedCollege Merced CA 2007MercerCountyCommunityCollege WestWindsor NJ 2005MetropolitanCommunityCollege Omaha NE 2005MiddlesexCommunityCollege Lowell MA 2007MiddlesexCountyCollege Edison NJ 2006MidlandsTechnicalCollege Columbia SC 2007MiraCostaCollege Oceanside CA 2007MontgomeryCollege Conroe TX 2007MontgomeryCountyCommunityCollege BlueBell PA 2007Mt.HoodCommunityCollege Gresham OR 2005NorthHarrisCollege Houston TX 2007NorthLakeCollege Irving TX 2006NorthwestVistaCollege SanAntonio TX 2007
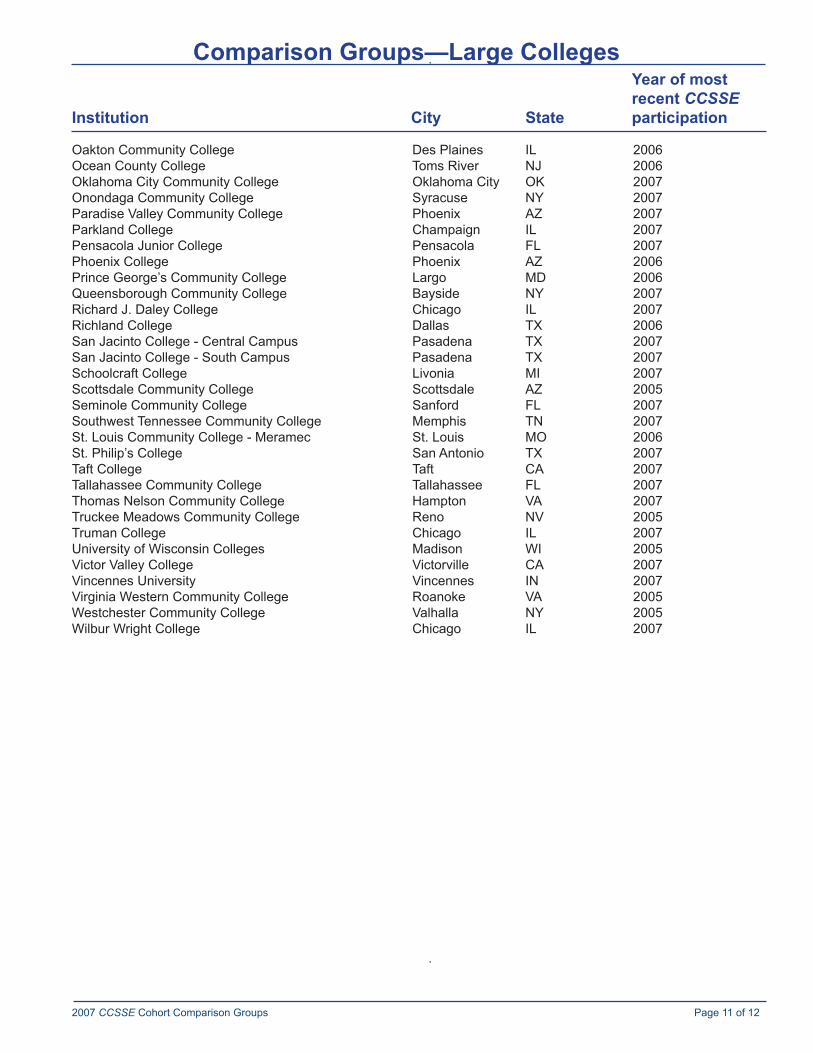
2007CCSSECohortComparisonGroups Page11of12
Year of most recent CCSSE Institution City State participation
Comparison Groups—Large Colleges
OaktonCommunityCollege DesPlaines IL 2006OceanCountyCollege TomsRiver NJ 2006OklahomaCityCommunityCollege OklahomaCity OK 2007OnondagaCommunityCollege Syracuse NY 2007ParadiseValleyCommunityCollege Phoenix AZ 2007ParklandCollege Champaign IL 2007PensacolaJuniorCollege Pensacola FL 2007PhoenixCollege Phoenix AZ 2006PrinceGeorge’sCommunityCollege Largo MD 2006QueensboroughCommunityCollege Bayside NY 2007RichardJ.DaleyCollege Chicago IL 2007RichlandCollege Dallas TX 2006SanJacintoCollege-CentralCampus Pasadena TX 2007SanJacintoCollege-SouthCampus Pasadena TX 2007SchoolcraftCollege Livonia MI 2007ScottsdaleCommunityCollege Scottsdale AZ 2005SeminoleCommunityCollege Sanford FL 2007SouthwestTennesseeCommunityCollege Memphis TN 2007St.LouisCommunityCollege-Meramec St.Louis MO 2006St.Philip’sCollege SanAntonio TX 2007TaftCollege Taft CA 2007TallahasseeCommunityCollege Tallahassee FL 2007ThomasNelsonCommunityCollege Hampton VA 2007TruckeeMeadowsCommunityCollege Reno NV 2005TrumanCollege Chicago IL 2007UniversityofWisconsinColleges Madison WI 2005VictorValleyCollege Victorville CA 2007VincennesUniversity Vincennes IN 2007VirginiaWesternCommunityCollege Roanoke VA 2005WestchesterCommunityCollege Valhalla NY 2005WilburWrightCollege Chicago IL 2007

2007CCSSECohortComparisonGroups Page12of12
Year of most recent CCSSE Institution City State participation
Comparison Groups—Extra-Large Colleges
AmericanRiverCollege Sacramento CA 2007AustinCommunityCollege Austin TX 2007BoroughofManhattanCommunityCollege NewYork NY 2007BrowardCommunityCollege FortLauderdale FL 2007CityCollegeofSanFrancisco SanFrancisco CA 2007CollegeofDuPage GlenEllyn IL 2006CommunityCollegeofAlleghenyCounty Pittsburgh PA 2007CommunityCollegeofPhiladelphia Philadelphia PA 2007CommunityCollegeofRhodeIsland Warwick RI 2005CommunityCollegeofSouthernNevada LasVegas NV 2006CuyahogaCommunityCollege Cleveland OH 2006DeAnzaCollege Cupertino CA 2007ElPasoCommunityCollege ElPaso TX 2007FloridaCommunityCollegeatJacksonville Jacksonville FL 2007GeorgiaPerimeterCollege Decatur GA 2005GlendaleCommunityCollege Glendale CA 2007HarperCollege Palatine IL 2006HillsboroughCommunityCollege Tampa FL 2007HoustonCommunityCollegeSystem Houston TX 2007JohnsonCountyCommunityCollege OverlandPark KS 2007KirkwoodCommunityCollege CedarRapids IA 2007MacombCommunityCollege Warren MI 2007MetropolitanCommunityCollege-KansasCity KansasCity MO 2007MiamiDadeCollege Miami FL 2007ModestoJuniorCollege Modesto CA 2006MontgomeryCollege Rockville MD 2006MoraineValleyCommunityCollege PalosHills IL 2005Mt.SanAntonioCollege Walnut CA 2007NorthernVirginiaCommunityCollege Annandale VA 2005Oakland Community College Bloomfield Hills MI 2005PalmBeachCommunityCollege LakeWorth FL 2007PalomarCollege SanMarcos CA 2007PasadenaCityCollege Pasadena CA 2007SaltLakeCommunityCollege SaltLakeCity UT 2006SanAntonioCollege SanAntonio TX 2007SanDiegoMesaCollege SanDiego CA 2007SantaAnaCollege SantaAna CA 2007SantaFeCommunityCollege(FL) Gainesville FL 2007SinclairCommunityCollege Dayton OH 2007SouthTexasCollege McAllen TX 2007SouthwesternIllinoisCollege Belleville IL 2005St.PetersburgCollege St.Petersburg FL 2007TheCommunityCollegeofBaltimoreCounty Baltimore MD 2006TidewaterCommunityCollege Norfolk VA 2005TritonCollege RiverGrove IL 2006ValenciaCommunityCollege Orlando FL 2007
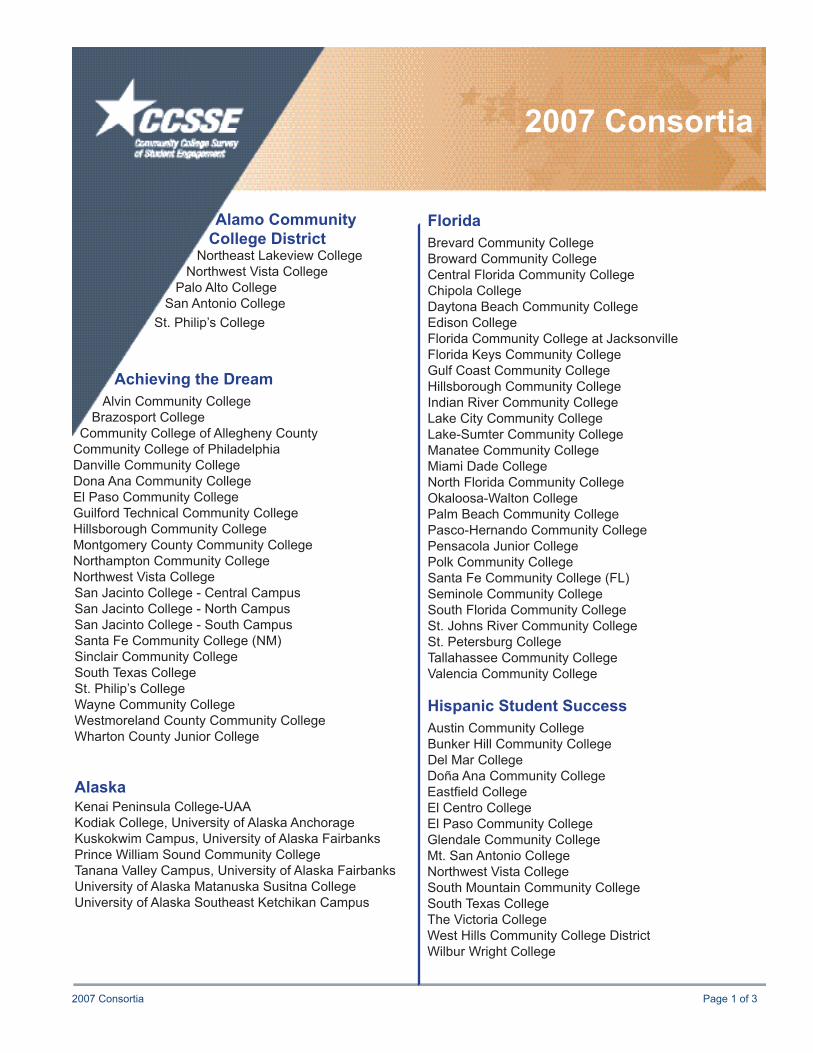
2007 Consortia
2007 Consortia Page�of3
Alamo Community College District
NortheastLakeviewCollegeNorthwestVistaCollege
PaloAltoCollegeSanAntonioCollege
St.Philip’sCollege
Achieving the DreamAlvinCommunityCollege
BrazosportCollegeCommunityCollegeofAlleghenyCounty
CommunityCollegeofPhiladelphiaDanvilleCommunityCollegeDonaAnaCommunityCollegeElPasoCommunityCollegeGuilfordTechnicalCommunityCollegeHillsboroughCommunityCollegeMontgomeryCountyCommunityCollegeNorthamptonCommunityCollegeNorthwestVistaCollegeSanJacintoCollege-CentralCampusSanJacintoCollege-NorthCampusSanJacintoCollege-SouthCampusSantaFeCommunityCollege(NM)SinclairCommunityCollegeSouthTexasCollegeSt.Philip’sCollegeWayneCommunityCollegeWestmorelandCountyCommunityCollegeWhartonCountyJuniorCollege
AlaskaKenaiPeninsulaCollege-UAAKodiakCollege,UniversityofAlaskaAnchorageKuskokwimCampus,UniversityofAlaskaFairbanksPrinceWilliamSoundCommunityCollegeTananaValleyCampus,UniversityofAlaskaFairbanksUniversityofAlaskaMatanuskaSusitnaCollegeUniversityofAlaskaSoutheastKetchikanCampus
FloridaBrevardCommunityCollegeBrowardCommunityCollegeCentralFloridaCommunityCollegeChipolaCollegeDaytonaBeachCommunityCollegeEdisonCollegeFloridaCommunityCollegeatJacksonvilleFloridaKeysCommunityCollegeGulfCoastCommunityCollegeHillsboroughCommunityCollegeIndianRiverCommunityCollegeLakeCityCommunityCollegeLake-SumterCommunityCollegeManateeCommunityCollegeMiamiDadeCollegeNorthFloridaCommunityCollegeOkaloosa-WaltonCollegePalmBeachCommunityCollegePasco-HernandoCommunityCollegePensacolaJuniorCollegePolkCommunityCollegeSantaFeCommunityCollege(FL)SeminoleCommunityCollegeSouthFloridaCommunityCollegeSt.JohnsRiverCommunityCollegeSt.PetersburgCollegeTallahasseeCommunityCollegeValenciaCommunityCollege
Hispanic Student SuccessAustinCommunityCollegeBunkerHillCommunityCollegeDelMarCollegeDoñaAnaCommunityCollegeEastfield CollegeElCentroCollegeElPasoCommunityCollegeGlendaleCommunityCollegeMt.SanAntonioCollegeNorthwestVistaCollegeSouthMountainCommunityCollegeSouthTexasCollegeTheVictoriaCollegeWestHillsCommunityCollegeDistrictWilburWrightCollege

2007Consortia Page2of3
IllinoisCollegeofLakeCountyHeartlandCommunityCollegeJolietJrCollegeMcHenryCountyCollegeParklandCollegeRendLakeCollegeSouthSuburbanCollegeSpoonRiverCollegeTrumanCollegeWilburWrightCollege
KentuckyAshlandCommunityandTechnicalCollegeBigSandyCommunityandTechnicalCollegeBowlingGreenTechnicalCollegeElizabethtownCommunityandTechnicalCollegeGatewayCommunityandTechnicalCollegeHopkinsvilleCommunityCollegeJeffersonCommunityandTechnicalCollegeMadisonvilleCommunityCollegeMaysvilleCommunityandTechnicalCollegeOwensboroCommunityandTechnicalCollegeWestKentuckyCommunityandTechnicalCollege
LouisianaBatonRougeCommunityCollegeBossierParishCommunityCollegeDelgadoCommunityCollegeL.E.FletcherTechnicalCommunityCollegeLouisianaDeltaCommunityCollegeLouisianaTechnicalCollege-Region2LouisianaTechnicalCollege-Region3LouisianaTechnicalCollege-Region4LouisianaTechnicalCollege-Region6LouisianaTechnicalCollege-Region7LouisianaTechnicalCollege-Region8LouisianaTechnicalCollege-Region9NunezCommunityCollegeRiverParishesCommunityCollegeSouthLouisianaCommunityCollegeSOWELATechnicalCommunityCollege
MassachusettsBerkshireCommunityCollegeBristolCommunityCollegeBunkerHillCommunityCollegeCapeCodCommunityCollegeGreenfield Community CollegeHolyokeCommunityCollegeMassachusettsBayCommunityCollegeMassasoitCommunityCollegeMiddlesexCommunityCollegeMountWachusettCommunityCollegeNorthShoreCommunityCollegeNorthernEssexCommunityCollegeQuinsigamondCommunityCollegeRoxburyCommunityCollegeSpringfield Technical Community College
MinnesotaAlexandriaTechnicalCollegeCenturyCollegeLakeSuperiorCollegeMinneapolisCommunityandTechnicalCollegeNorthHennepinCommunityCollegeRiverlandCommunityCollegeRochesterCommunityandTechnicalCollege
North Harris Montgomery Community College DistrictCyFairCollegeKingwoodCollegeMontgomeryCollegeNorthHarrisCollegeTomballCollege
North DakotaBismarckStateCollegeLakeRegionStateCollegeMinotStateUniversity-BottineauNorthDakotaStateCollegeofScienceWillistonStateCollege
Northeast MinnesotaFondduLacTribalandCommunityCollegeHibbingCommunityCollegeItascaCommunityCollegeMesabiRangeCommunityandTechnicalCollegeRainyRiverCommunityCollegeVermilionCommunityCollege
NorthwestBigBendCommunityCollegeDouglasCollegeLowerColumbiaCollegeOlympicCollegeSkagitValleyCollegeSouthSeattleCommunityCollegeWenatcheeValleyCollege
South CarolinaAikenTechnicalCollegeGreenvilleTechnicalCollegeMidlandsTechnicalCollegeTechnicalCollegeoftheLowcountryTri-CountyTechnicalCollegeYorkTechnicalCollege
SSPIREAmericanRiverCollegeCollegeofAlamedaDeAnzaCollegeMercedCollegeMt.SanAntonioCollegePasadenaCityCollegeSantaAnaCollegeTaftCollege

2007Consortia Page3of3
VictorValleyCollege
TennesseeChattanoogaStateTechnicalCommunityCollegeClevelandStateCommunityCollegeMotlowStateCommunityCollegeSouthwestTennesseeCommunityCollegeVolunteerStateCommunityCollege
Texas Small CollegesAngelinaCollegeElCentroCollegeFrankPhillipsCollegeLamarStateCollege-OrangeNortheastTexasCommunityCollegeTempleCollegeTexasStateTechnicalCollegeMarshallTheVictoriaCollegeTrinityValleyCommunityCollegeVernonCollege
WyomingCasperCollegeCentralWyomingCollegeEasternWyomingCollegeLaramieCountyCommunityCollegeNorthwestCollegeSheridanCollegeWesternWyomingCommunityCollege
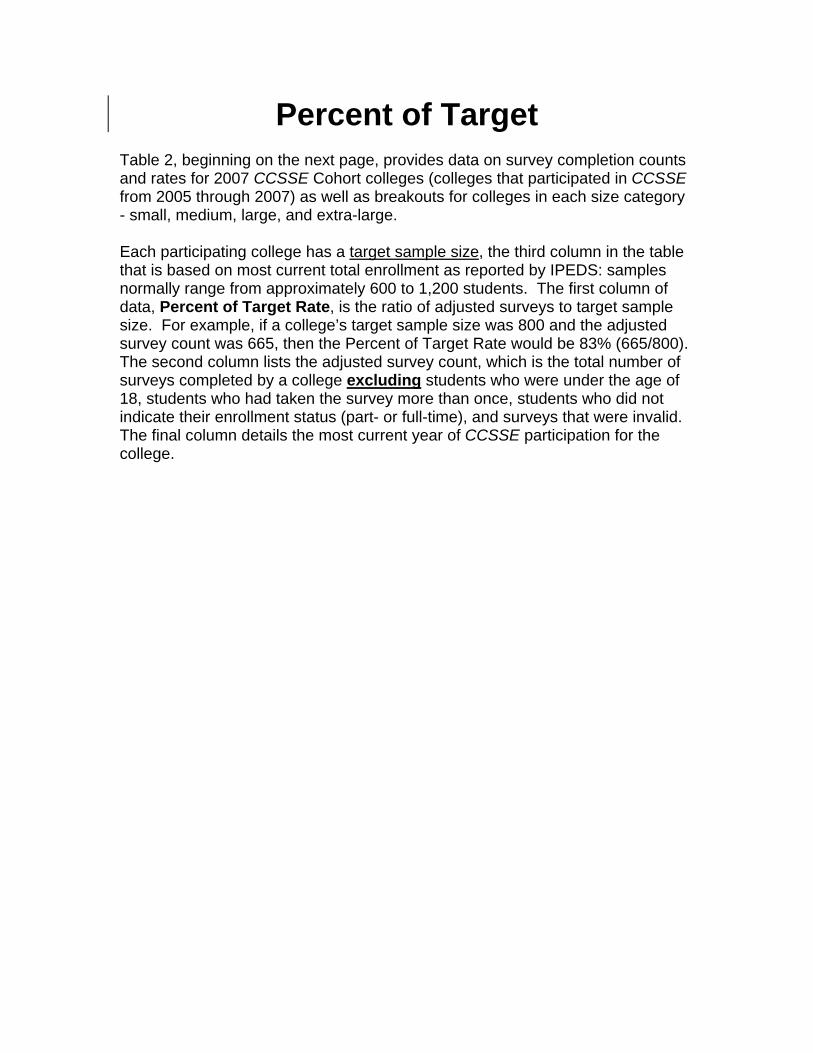
Percent of Target Table 2, beginning on the next page, provides data on survey completion counts and rates for 2007 CCSSE Cohort colleges (colleges that participated in CCSSE from 2005 through 2007) as well as breakouts for colleges in each size category - small, medium, large, and extra-large. Each participating college has a target sample size, the third column in the table that is based on most current total enrollment as reported by IPEDS: samples normally range from approximately 600 to 1,200 students. The first column of data, Percent of Target Rate, is the ratio of adjusted surveys to target sample size. For example, if a college’s target sample size was 800 and the adjusted survey count was 665, then the Percent of Target Rate would be 83% (665/800). The second column lists the adjusted survey count, which is the total number of surveys completed by a college excluding students who were under the age of 18, students who had taken the survey more than once, students who did not indicate their enrollment status (part- or full-time), and surveys that were invalid. The final column details the most current year of CCSSE participation for the college.

Table 22007 CCSSE Cohort:
Percent of Target
Table2:PercentofTarget Page1of12
Community College Surveyof Student Engagement
2007 CCSSE Cohort Colleges 79% 310,013 392,241All Small CCSSE Colleges 76% 105,787 138,941
AbrahamBaldwinAgriculturalCollege 2005 95% 568 600AikenTechnicalCollege 2007 82% 492 600
AlabamaSouthernCommunityCollege 2007 68% 278 409AlexandriaTechnicalCollege 2007 96% 575 600
AlleganyCollegeofMaryland 2006 99% 594 600AlpenaCommunityCollege 2007 62% 373 600
AlvinCommunityCollege 2007 79% 471 600AshlandCommunityandTechnicalCollege 2007 79% 472 600AsnuntuckCommunityCollege 2006 79% 475 600AtlantaMetropolitanCollege 2005 72% 431 600AtlantaTechnicalCollege 2006 80% 480 600BainbridgeCollege 2005 54% 321 600BartonCountyCommunityCollege 2006 79% 472 600BelmontTechnicalCollege 2006 73% 438 600BerkshireCommunityCollege 2007 73% 440 600BigBendCommunityCollege 2007 78% 469 600BismarckStateCollege 2007 90% 540 600BlueRidgeCommunityCollege 2005 93% 556 600BowlingGreenTechnicalCollege 2007 66% 397 600BrazosportCollege 2007 69% 416 600ButlerCountyCommunityCollege(PA) 2006 97% 580 600CaldwellCommunityCollegeandTechnicalInstitute 2007 85% 508 600CapeCodCommunityCollege 2007 101% 606 600CapitalCommunityCollege 2006 86% 514 600CaritasLaboureCollege 2007 81% 273 336CarolinasCollegeofHealthSciences 2007 87% 229 263CarrollCommunityCollege 2006 86% 518 600CarteretCommunityCollege 2006 85% 507 600CascadiaCommunityCollege 2006 82% 491 600CasperCollege 2007 74% 444 600CecilCommunityCollege 2006 78% 470 600CedarValleyCollege 2006 75% 450 600CentralLakesCollege 2006 88% 525 600CentralMaineCommunityCollege 2007 87% 521 600CentralWyomingCollege 2007 51% 305 600CentraliaCollege 2006 73% 438 600ChattahoocheeTechnicalCollege 2005 90% 537 600ChesapeakeCollege 2006 69% 415 600ChipolaCollege 2007 88% 525 600
Institution
Year of most recent CCSSE Participation
Targeted Number of Surveys
Adjusted Survey Count
Percent of Target

Table2:PercentofTarget Page2of12
Institution
Year of most recent CCSSE Participation
Percent of Target
Adjusted Survey Count
Targeted Number of Surveys
ClarendonCollege 2006 58% 218 378ClevelandCommunityCollege 2007 77% 459 600ClevelandStateCommunityCollege 2007 86% 516 600ClovisCommunityCollege 2006 94% 564 600CoastalBendCollege 2006 81% 484 600CoastalCarolinaCommunityCollege 2007 105% 627 600CoastalGeorgiaCommunityCollege 2005 79% 472 600CollegeoftheMainland 2006 74% 441 600CollegeoftheMarshallIslands 2007 81% 244 301CollegeoftheSiskiyous 2006 66% 395 600CumberlandCountyCollege 2007 82% 494 600DabneyS.LancasterCommunityCollege 2005 53% 226 424DanvilleAreaCommunityCollege 2006 85% 510 600DanvilleCommunityCollege 2007 72% 429 600DartonCollege 2005 74% 446 600DelawareTechnical&CommunityCollege-OwensCampus 2007 83% 496 600DelawareTechnical&CommunityCollege-TerryCampus 2007 76% 456 600DyersburgStateCommunityCollege 2006 80% 480 600EastGeorgiaCollege 2007 83% 356 429EasternNewMexicoUniversity-Roswell 2006 70% 420 600EasternShoreCommunityCollege 2005 82% 281 344EasternWestVirginiaCommunity&TechnicalCollege 2005 26% 104 406EasternWyomingCollege 2007 64% 267 415EdisonStateCommunityCollege 2007 84% 503 600EllsworthCommunityCollege 2007 65% 232 355FairmontStateCommunityandTechnicalCollege 2005 92% 550 600FloridaKeysCommunityCollege 2007 69% 273 396FondduLacTribalandCommunityCollege 2007 63% 227 360FrankPhillipsCollege 2007 51% 209 408GalvestonCollege 2006 66% 396 600GarrettCollege 2006 72% 219 304GatewayCommunityandTechnicalCollege 2007 73% 437 600GeorgiaHighlandsCollege 2005 92% 551 600GordonCollege 2005 91% 548 600GraysHarborCollege 2005 75% 451 600GraysonCountyCollege 2006 101% 604 600Greenfield Community College 2007 78% 469 600HagerstownCommunityCollege 2006 97% 579 600HawaiiCommunityCollege 2006 88% 525 600HazardCommunityandTechnicalCollege 2006 42% 250 600HendersonCommunityCollege 2006 76% 455 600HesstonCollege 2007 92% 244 266HibbingCommunityCollege 2007 54% 227 417HonoluluCommunityCollege 2006 69% 413 600HopkinsvilleCommunityCollege 2007 76% 456 600HowardCollege 2006 84% 505 600IllinoisValleyCommunityCollege 2006 108% 646 600IsothermalCommunityCollege 2007 75% 447 600ItascaCommunityCollege 2007 65% 261 400IvyTechCommunityCollege-Bloomington 2005 63% 376 600IvyTechCommunityCollege-Columbus 2005 80% 480 600

Table2:PercentofTarget Page3of12
Institution
Year of most recent CCSSE Participation
Percent of Target
Adjusted Survey Count
Targeted Number of Surveys
IvyTechCommunityCollege-Elkhart 2005 48% 286 600IvyTechCommunityCollege-Evansville 2005 85% 511 600IvyTechCommunityCollege-Kokomo 2005 79% 474 600IvyTechCommunityCollege-Lawrenceburg 2005 72% 434 600IvyTechCommunityCollege-Logansport 2005 72% 432 600IvyTechCommunityCollege-Madison 2005 52% 309 600IvyTechCommunityCollege-Sellersburg 2005 88% 530 600IvyTechCommunityCollege-SouthBend 2005 69% 415 600IvyTechCommunityCollege-TerreHaute 2005 66% 397 600IvyTechCommunityCollege-Warsaw 2005 38% 228 600IvyTechCommunityCollege-Whitewater 2005 63% 377 600JacksonStateCommunityCollege 2006 95% 571 600JamesA.RhodesStateCollege 2007 79% 471 600JeffersonCommunityCollege 2006 73% 439 600KankakeeCommunityCollege 2007 81% 488 600KauaiCommunityCollege 2006 63% 246 391KenaiPeninsulaCollege-UAA 2007 52% 310 600KennebecValleyCommunityCollege 2007 87% 520 600KirtlandCommunityCollege 2007 77% 461 600KodiakCollege,UniversityofAlaskaAnchorage 2007 66% 165 249KuskokwimCampus,UniversityofAlaskaFairbanks 2007 17% 42 250L.E.FletcherTechnicalCommunityCollege 2007 71% 283 397LakeCityCommunityCollege 2007 73% 436 600LakeRegionStateCollege 2007 53% 228 427Lake-SumterCommunityCollege 2007 99% 594 600LamarInstituteofTechnology 2006 93% 557 600LamarStateCollege-Orange 2007 72% 430 600LaramieCountyCommunityCollege 2007 84% 503 600LeechLakeTribalCollege 2007 34% 65 189LouisburgCollege 2007 84% 276 330LouisianaDeltaCommunityCollege 2007 60% 232 388LouisianaTechnicalCollege-Region2 2007 55% 194 352LouisianaTechnicalCollege-Region3 2007 40% 242 600LouisianaTechnicalCollege-Region4 2007 88% 526 600LouisianaTechnicalCollege-Region6 2007 78% 305 392LouisianaTechnicalCollege-Region7 2007 81% 339 420LouisianaTechnicalCollege-Region8 2007 75% 281 377LouisianaTechnicalCollege-Region9 2007 38% 134 352LowerColumbiaCollege 2007 81% 486 600MadisonvilleCommunityCollege 2007 87% 520 600MarshallCommunityandTechnicalCollege 2005 87% 520 600MarshalltownCommunityCollege 2007 61% 364 600MartinCommunityCollege 2006 77% 281 365MauiCommunityCollege 2006 88% 526 600MaylandCommunityCollege 2007 77% 331 429MaysvilleCommunity&TechnicalCollege 2007 78% 466 600MercyCollegeofHealthSciences 2006 88% 276 314MesabiRangeCommunityandTechnicalCollege 2007 69% 295 428MidMichiganCommunityCollege 2007 89% 536 600Mid-SouthCommunityCollege 2005 81% 322 396MiddleGeorgiaCollege 2007 87% 523 600MiddlesexCommunityCollege 2006 72% 432 600MinotStateUniversity-Bottineau 2007 51% 142 280

Table2:PercentofTarget Page4of12
Institution
Year of most recent CCSSE Participation
Percent of Target
Adjusted Survey Count
Targeted Number of Surveys
MontanaStateUniversityBillings 2007 61% 231 381MotlowStateCommunityCollege 2007 89% 536 600MountWachusettCommunityCollege 2007 96% 578 600MountainEmpireCommunityCollege 2005 79% 473 600NHCommunityTechnicalCollege-Berlin 2006 88% 317 362NHCommunityTechnicalCollege-Claremont 2006 85% 306 359NHCommunityTechnicalCollege-Laconia 2006 92% 360 393NHCommunityTechnicalCollege-Manchester 2006 85% 508 600NHCommunityTechnicalCollege-Nashua 2006 84% 504 600NHCommunityTechnicalCollege-Stratham 2006 85% 361 423NewHampshireTechnicalInstitute 2006 103% 620 600NewMexicoJuniorCollege 2007 73% 438 600NewMexicoMilitaryInstitute 2006 100% 250 251NewMexicoStateUniversity-Grants 2006 55% 176 321NewMexicoStateUniversityatAlamogordo 2006 75% 451 600NewRiverCommunityCollege 2005 103% 617 600NewRiverCommunityandTechnicalCollege 2005 57% 341 600NorthArkansasCollege 2007 73% 438 600NorthCentralMissouriCollege 2007 74% 308 415NorthCentralStateCollege 2006 89% 536 600NorthDakotaStateCollegeofScience 2007 100% 602 600NorthFloridaCommunityCollege 2007 71% 288 406NorthIowaAreaCommunityCollege 2006 97% 581 600NortheastLakeviewCollege 2007 94% 562 600NortheastMississippiCommunityCollege 2007 114% 686 600NortheastTexasCommunityCollege 2007 67% 399 600NorthernMaineCommunityCollege 2007 82% 299 364NorthernNewMexicoCommunityCollege 2006 73% 436 600NorthwestCollege 2007 78% 465 600NorthwestIndianCollege 2005 40% 124 311NorthwestIowaCommunityCollege 2007 76% 293 386NorthwesternConnecticutCommunityCollege 2006 75% 449 600NunezCommunityCollege 2007 76% 249 327OregonCoastCommunityCollege 2006 57% 174 307OuachitaTechnicalCollege 2007 64% 385 600PanolaCollege 2006 78% 469 600ParisJuniorCollege 2006 87% 520 600PatrickHenryCommunityCollege 2005 90% 539 600PaulD.CampCommunityCollege 2005 47% 282 600PiedmontVirginiaCommunityCollege 2007 83% 495 600PrinceWilliamSoundCommunityCollege 2007 15% 51 347QuinebaugValleyCommunityCollege 2006 77% 464 600RainyRiverCommunityCollege 2007 37% 91 244RangerCollege 2006 69% 250 362RappahannockCommunityCollege 2005 68% 407 600ReadingAreaCommunityCollege 2007 76% 456 600RedlandsCommunityCollege 2007 74% 441 600RiverParishesCommunityCollege 2007 70% 268 383RiverlandCommunityCollege 2007 55% 328 600RoxburyCommunityCollege 2007 72% 431 600SOWELATechnicalCommunityCollege 2007 46% 276 600SalemCommunityCollege 2007 85% 344 406SalishKootenaiCollege 2007 66% 259 394

Table2:PercentofTarget Page5of12
Institution
Year of most recent CCSSE Participation
Percent of Target
Adjusted Survey Count
Targeted Number of Surveys
SantaFeCommunityCollege(NM) 2007 70% 422 600SheridanCollege 2007 83% 495 600SouthFloridaCommunityCollege 2007 84% 504 600SouthGeorgiaCollege 2007 85% 510 600SouthLouisianaCommunityCollege 2007 70% 420 600SouthMountainCommunityCollege 2007 66% 397 600SouthPiedmontCommunityCollege 2005 63% 380 600SoutheasternCommunityCollege(IA) 2007 87% 521 600SoutheasternCommunityCollege(NC) 2007 68% 405 600SoutheasternTechnicalCollege 2007 91% 340 373SouthernMaineCommunityCollege 2006 112% 673 600SouthernUniversityatShreveport 2005 31% 186 600SouthernWestVirginiaCommunityandTechnicalCollege 2005 79% 472 600SouthwestTexasJuniorCollege 2006 82% 489 600SouthwestVirginiaCommunityCollege 2005 81% 483 600SouthwesternCommunityCollege 2005 71% 424 600SouthwesternIndianPolytechnicInstitute 2006 62% 210 338SouthwesternOregonCommunityCollege 2007 74% 445 600SpoonRiverCollege 2007 83% 495 600SurryCommunityCollege 2007 88% 530 600TananaValleyCampus,UniversityofAlaskaFairbanks 2007 56% 334 600TechnicalCollegeoftheLowcountry 2007 70% 418 600TempleCollege 2007 62% 372 600TexasStateTechnicalCollegeHarlingen 2005 78% 469 600TexasStateTechnicalCollegeMarshall 2007 69% 200 291TexasStateTechnicalCollegeWaco 2006 80% 477 600TexasStateTechnicalCollegeWestTexas 2006 66% 393 600TheCommunityandTechnicalCollegeatWVUTech 2005 80% 241 300TheCommunityandTechnicalCollegeofShepherd 2005 65% 277 427TheVictoriaCollege 2007 81% 487 600ThreeRiversCommunityCollege 2006 90% 539 600TompkinsCortlandCommunityCollege 2007 93% 559 600Tri-CountyCommunityCollege 2005 71% 281 396TunxisCommunityCollege 2006 87% 519 600UniversityofAlaskaMatanuskaSusitnaCollege 2007 72% 300 415UniversityofAlaskaSoutheastKetchikanCampus 2007 10% 61 600UniversityofArkansasCommunityCollegeatBatesville 2007 84% 352 420UniversityofArkansasCommunityCollegeatHope 2005 69% 274 396UniversityofCincinnatiClermontCollege 2006 72% 434 600UniversityofNewMexico-Gallup 2006 84% 506 600UniversityofNewMexico-TaosBranch 2006 70% 267 384UniversityofNewMexico-ValenciaCampus 2006 83% 365 441VermilionCommunityCollege 2007 63% 212 338VernonCollege 2007 79% 473 600VirginiaHighlandsCommunityCollege 2005 81% 485 600WarrenCountyCommunityCollege 2005 76% 301 396WashingtonStateCommunityCollege 2007 76% 457 600WaycrossCollege 2005 91% 346 379WayneCommunityCollege 2007 76% 455 600WenatcheeValleyCollege 2007 77% 464 600WestVirginiaNorthernCommunityCollege 2005 71% 424 600

Table2:PercentofTarget Page6of12
Institution
Year of most recent CCSSE Participation
Percent of Target
Adjusted Survey Count
Targeted Number of Surveys
WestVirginiaStateCommunityandTechnicalCollege 2007 73% 435 600WestVirginiaUniversityatParkersburg 2005 91% 548 600WesternNebraskaCommunityCollege 2007 76% 458 600WesternPiedmontCommunityCollege 2005 86% 518 600WesternTexasCollege 2006 46% 278 600WesternWyomingCommunityCollege 2007 80% 481 600WillistonStateCollege 2007 57% 208 368WindwardCommunityCollege 2006 67% 399 600WisconsinIndianheadTechnicalCollege 2005 68% 409 600Wor-WicCommunityCollege 2006 87% 521 600WythevilleCommunityCollege 2005 77% 459 600YorkTechnicalCollege 2007 85% 512 600ZaneStateCollege 2005 87% 523 600

Table2:PercentofTarget Page7of12
Institution
Year of most recent CCSSE Participation
Percent of Target
Adjusted Survey Count
Targeted Number of Surveys
2007 CCSSE Cohort Colleges 79% 310,013 392,241All Medium CCSSE Colleges 76% 86,636 108,800
AngelinaCollege 2007 84% 673 800Anoka-RamseyCommunityCollege 2006 85% 679 800Asheville-BuncombeTechnicalCommunityCollege 2007 89% 708 800BaltimoreCityCommunityCollege 2006 57% 452 800BatonRougeCommunityCollege 2007 74% 591 800BigSandyCommunityandTechnicalCollege 2007 54% 430 800BlackHawkCollege 2006 95% 756 800BossierParishCommunityCollege 2007 85% 676 800BristolCommunityCollege 2007 105% 842 800BunkerHillCommunityCollege 2007 26% 205 800BurlingtonCountyCollege 2007 93% 743 800CapeFearCommunityCollege 2005 93% 745 800CentralArizonaCollege 2006 61% 488 800CentralCommunityCollege 2007 56% 445 800CentralFloridaCommunityCollege 2007 78% 622 800CentralVirginiaCommunityCollege 2005 77% 617 800ChattanoogaStateTechnicalCommunityCollege 2007 70% 559 800CochiseCollege 2007 66% 525 800CollegeofAlameda 2007 57% 456 800CollegeofSouthernIdaho 2007 95% 757 800CollegeofSouthernMaryland 2006 93% 741 800CollegeoftheRedwoods 2006 67% 533 800ColoradoMountainCollege 2007 62% 492 800ColumbiaStateCommunityCollege 2006 99% 794 800CorningCommunityCollege 2007 78% 624 800DelawareTechnical&CommunityCollege-Stanton-Wilmington 2007 97% 773 800DonaAnaCommunityCollege 2007 88% 704 800DurhamTechnicalCommunityCollege 2005 85% 679 800ElCentroCollege 2007 81% 647 800ElizabethtownCommunity&TechnicalCollege 2007 84% 675 800EstrellaMountainCommunityCollege 2006 84% 672 800EverettCommunityCollege 2006 70% 558 800FrederickCommunityCollege 2006 103% 824 800GainesvilleCollege 2005 96% 766 800GatewayCommunityCollege 2006 88% 704 800GeneseeCommunityCollege 2007 91% 724 800GeorgeCWallaceStateCommunityCollege 2005 100% 797 800GeorgiaMilitaryCollege 2007 95% 758 800GermannaCommunityCollege 2005 85% 679 800GloucesterCountyCollege 2007 76% 604 800GulfCoastCommunityCollege 2007 81% 648 800HarfordCommunityCollege 2006 92% 736 800HawkeyeCommunityCollege 2005 89% 708 800HeartlandCommunityCollege 2007 62% 494 800HolyokeCommunityCollege 2007 80% 639 800HousatonicCommunityCollege 2006 86% 686 800HowardCommunityCollege 2006 84% 672 800HutchinsonCommunityCollege 2006 94% 751 800

Table2:PercentofTarget Page8of12
Institution
Year of most recent CCSSE Participation
Percent of Target
Adjusted Survey Count
Targeted Number of Surveys
ItawambaCommunityCollege 2006 99% 793 800IvyTechCommunityCollege-Anderson 2005 53% 421 800IvyTechCommunityCollege-EastChicago 2005 39% 315 800IvyTechCommunityCollege-FortWayne 2005 74% 594 800IvyTechCommunityCollege-Gary 2005 44% 351 800IvyTechCommunityCollege-Lafayette 2005 54% 433 800IvyTechCommunityCollege-Marion 2005 46% 365 800IvyTechCommunityCollege-MichiganCity 2005 38% 300 800IvyTechCommunityCollege-Muncie 2005 58% 462 800IvyTechCommunityCollege-Valparaiso 2005 57% 458 800JacksonCommunityCollege 2006 89% 712 800JohnTylerCommunityCollege 2005 88% 703 800KansasCityKansasCommunityCollege 2007 88% 706 800KapiolaniCommunityCollege 2006 80% 638 800KilgoreCollege 2006 88% 704 800KingwoodCollege 2007 88% 702 800LakeSuperiorCollege 2007 88% 702 800LeeCollege 2007 85% 679 800LeewardCommunityCollege 2006 72% 579 800LehighCarbonCommunityCollege 2006 87% 693 800LincolnLandCommunityCollege 2005 93% 740 800Linn-BentonCommunityCollege 2006 73% 585 800LordFairfaxCommunityCollege 2005 96% 770 800MalcolmXCollege 2006 82% 652 800ManchesterCommunityCollege 2006 73% 581 800MassachusettsBayCommunityCollege 2007 73% 587 800MassasoitCommunityCollege 2007 75% 602 800McHenryCountyCollege 2007 103% 827 800MinneapolisCommunityandTechnicalCollege 2007 76% 606 800MountainViewCollege 2005 62% 496 800NashvilleStateTechnicalCommunityCollege 2006 94% 753 800NaugatuckValleyCommunityCollege 2006 86% 689 800NavarroCollege 2006 95% 759 800NorthHennepinCommunityCollege 2007 90% 716 800NorthShoreCommunityCollege 2007 75% 596 800NorthWestArkansasCommunityCollege 2007 81% 645 800NorthamptonCommunityCollege 2007 93% 740 800NortheastIowaCommunityCollege 2006 85% 683 800NortheastStateTechnicalCommunityCollege 2006 88% 704 800NorthernEssexCommunityCollege 2007 68% 542 800NorthernOklahomaCollege 2007 48% 383 800NorwalkCommunityCollege 2006 87% 692 800Okaloosa-WaltonCollege 2007 81% 651 800OlympicCollege 2007 90% 720 800OwensboroCommunityandTechnicalCollege 2007 75% 602 800PaloAltoCollege 2007 80% 636 800Pasco-HernandoCommunityCollege 2007 44% 349 800PellissippiStateTechnicalCommunityCollege 2006 95% 757 800PittCommunityCollege 2006 99% 795 800PolkCommunityCollege 2007 83% 664 800PrairieStateCollege 2006 83% 661 800PuebloCommunityCollege 2007 77% 613 800QuinsigamondCommunityCollege 2007 75% 598 800

Table2:PercentofTarget Page9of12
Institution
Year of most recent CCSSE Participation
Percent of Target
Adjusted Survey Count
Targeted Number of Surveys
RaritanValleyCommunityCollege 2005 75% 602 800RedRocksCommunityCollege 2005 75% 596 800RendLakeCollege 2007 84% 668 800RoaneStateCommunityCollege 2006 81% 647 800RochesterCommunityandTechnicalCollege 2007 84% 675 800Rowan-CabarrusCommunityCollege 2006 95% 762 800SanJacintoCollege-NorthCampus 2007 66% 524 800SanJuanCollege 2006 73% 581 800SheltonStateCommunityCollege 2007 85% 676 800SkagitValleyCollege 2007 65% 520 800SomersetCommunityCollege 2006 95% 758 800SouthPugetSoundCommunityCollege 2005 88% 704 800SouthSeattleCommunityCollege 2007 63% 506 800SouthSuburbanCollege 2007 68% 546 800SoutheastKentuckyCommunity&TechnicalCollege 2006 86% 689 800SouthsideVirginiaCommunityCollege 2005 78% 620 800SpokaneCommunityCollege 2005 91% 730 800Springfield Technical Community College 2007 83% 666 800St.CharlesCommunityCollege 2006 92% 736 800St.JohnsRiverCommunityCollege 2007 90% 717 800St.LouisCommunityCollegeatForestPark 2006 65% 518 800St.LouisCommunityCollege-FlorissantValley 2006 81% 650 800StarkStateCollegeofTechnology 2005 98% 787 800TacomaCommunityCollege 2005 89% 708 800TomballCollege 2007 85% 682 800Tri-CountyTechnicalCollege 2007 79% 628 800TrinityValleyCommunityCollege 2007 76% 611 800VolunteerStateCommunityCollege 2007 90% 720 800WaltersStateCommunityCollege 2006 100% 802 800WeatherfordCollege 2007 72% 572 800WestHillsCommunityCollegeDistrict 2007 70% 562 800WestKentuckyCommunityandTechnicalCollege 2007 77% 612 800WesternIowaTechCommunityCollege 2005 79% 633 800WestmorelandCountyCommunityCollege 2007 93% 746 800WhartonCountyJuniorCollege 2007 91% 727 800

Table2:PercentofTarget Page10of12
Institution
Year of most recent CCSSE Participation
Percent of Target
Adjusted Survey Count
Targeted Number of Surveys
2007 CCSSE Cohort Colleges 79% 310,013 392,241All Large CCSSE Colleges 82% 68,500 83,000
AnneArundelCommunityCollege 2006 92% 918 1000BlinnCollege 2006 87% 866 1000BluegrassCommunityandTechnicalCollege 2006 76% 757 1000BrevardCommunityCollege 2007 102% 1024 1000BrookdaleCommunityCollege 2007 75% 751 1000BrookhavenCollege 2006 102% 1024 1000BucksCountyCommunityCollege 2006 63% 632 1000ButlerCountyCommunityCollege(KS) 2006 67% 665 1000CenturyCollege 2007 103% 1031 1000Chandler-GilbertCommunityCollege 2007 108% 1081 1000CitrusCollege 2006 83% 829 1000CollegeofLakeCounty 2007 58% 575 1000CommunityCollegeofDenver 2005 79% 785 1000CyFairCollege 2007 81% 812 1000DaytonaBeachCommunityCollege 2007 71% 707 1000DelMarCollege 2007 98% 976 1000DelgadoCommunityCollege 2007 84% 841 1000DeltaCollege 2007 101% 1005 1000DouglasCollege 2007 68% 675 1000Eastfield College 2007 78% 775 1000EdisonCollege 2007 82% 821 1000EssexCountyCollege 2006 82% 816 1000GrandRapidsCommunityCollege 2007 88% 875 1000GreenvilleTechnicalCollege 2007 91% 913 1000GuilfordTechnicalCommunityCollege 2007 87% 866 1000HaroldWashingtonCollege 2005 68% 679 1000HudsonValleyCommunityCollege 2007 72% 721 1000IllinoisCentralCollege 2006 89% 885 1000IndianRiverCommunityCollege 2007 80% 799 1000IvyTechCommunityCollege-CentralIndiana 2007 59% 592 1000J.SargeantReynoldsCommunityCollege 2005 88% 877 1000JeffersonCommunityandTechnicalCollege 2007 91% 906 1000JolietJrCollege 2007 65% 651 1000KingsboroughCommunityCollege 2005 72% 716 1000LaGuardiaCommunityCollege 2007 73% 732 1000LaneCommunityCollege 2005 85% 853 1000LaneyCollege 2007 44% 439 1000LorainCountyCommunityCollege 2006 91% 908 1000ManateeCommunityCollege 2007 98% 979 1000MercedCollege 2007 90% 897 1000MercerCountyCommunityCollege 2005 101% 1008 1000MetropolitanCommunityCollege 2005 102% 1015 1000MiddlesexCommunityCollege 2007 87% 873 1000MiddlesexCountyCollege 2006 83% 829 1000MidlandsTechnicalCollege 2007 98% 984 1000MiraCostaCollege 2007 95% 952 1000MontgomeryCollege 2007 53% 527 1000MontgomeryCountyCommunityCollege 2007 88% 880 1000Mt.HoodCommunityCollege 2005 80% 797 1000

Table2:PercentofTarget Page11of12
Institution
Year of most recent CCSSE Participation
Percent of Target
Adjusted Survey Count
Targeted Number of Surveys
NorthHarrisCollege 2007 78% 775 1000NorthLakeCollege 2006 74% 738 1000NorthwestVistaCollege 2007 85% 850 1000OaktonCommunityCollege 2006 78% 776 1000OceanCountyCollege 2006 76% 764 1000OklahomaCityCommunityCollege 2007 101% 1014 1000OnondagaCommunityCollege 2007 80% 802 1000ParadiseValleyCommunityCollege 2007 87% 868 1000ParklandCollege 2007 86% 862 1000PensacolaJuniorCollege 2007 91% 912 1000PhoenixCollege 2006 65% 653 1000PrinceGeorge’sCommunityCollege 2006 94% 939 1000QueensboroughCommunityCollege 2007 86% 857 1000RichardJ.DaleyCollege 2007 64% 644 1000RichlandCollege 2006 83% 828 1000SanJacintoCollege-CentralCampus 2007 83% 829 1000SanJacintoCollege-SouthCampus 2007 72% 723 1000SchoolcraftCollege 2007 86% 860 1000ScottsdaleCommunityCollege 2005 92% 917 1000SeminoleCommunityCollege 2007 80% 800 1000SouthwestTennesseeCommunityCollege 2007 70% 700 1000St.LouisCommunityCollege-Meramec 2006 82% 822 1000St.Philip’sCollege 2007 81% 807 1000TaftCollege 2007 42% 418 1000TallahasseeCommunityCollege 2007 89% 885 1000ThomasNelsonCommunityCollege 2007 78% 779 1000TruckeeMeadowsCommunityCollege 2005 100% 995 1000TrumanCollege 2007 91% 914 1000UniversityofWisconsinColleges 2005 95% 952 1000VictorValleyCollege 2007 53% 525 1000VincennesUniversity 2007 99% 989 1000VirginiaWesternCommunityCollege 2005 96% 955 1000WestchesterCommunityCollege 2005 97% 971 1000WilburWrightCollege 2007 86% 858 1000

Table2:PercentofTarget Page12of12
Institution
Year of most recent CCSSE Participation
Percent of Target
Adjusted Survey Count
Targeted Number of Surveys
2007 CCSSE Cohort Colleges 79% 310,013 392,241All Extra Large CCSSE Colleges 79% 49,090 61,500
AmericanRiverCollege 2007 67% 1006 1500AustinCommunityCollege 2007 62% 930 1500BoroughofManhattanCommunityCollege 2007 36% 429 1200BrowardCommunityCollege 2007 81% 1208 1500CityCollegeofSanFrancisco 2007 79% 1179 1500CollegeofDuPage 2006 84% 1265 1500CommunityCollegeofAlleghenyCounty 2007 78% 932 1200CommunityCollegeofPhiladelphia 2007 70% 845 1200CommunityCollegeofRhodeIsland 2005 74% 887 1200CommunityCollegeofSouthernNevada 2006 60% 903 1500CuyahogaCommunityCollege 2006 73% 1101 1500DeAnzaCollege 2007 91% 1097 1200ElPasoCommunityCollege 2007 77% 1152 1500FloridaCommunityCollegeatJacksonville 2007 84% 1259 1500GeorgiaPerimeterCollege 2005 94% 1124 1200GlendaleCommunityCollege 2007 93% 1119 1200HarperCollege 2006 83% 1001 1200HillsboroughCommunityCollege 2007 73% 875 1200HoustonCommunityCollegeSystem 2007 72% 1084 1500JohnsonCountyCommunityCollege 2007 71% 847 1200KirkwoodCommunityCollege 2007 80% 961 1200MacombCommunityCollege 2007 87% 1047 1200MetropolitanCommunityCollege-KansasCity 2007 73% 881 1200MiamiDadeCollege 2007 73% 1099 1500ModestoJuniorCollege 2006 75% 897 1200MontgomeryCollege 2006 63% 761 1200MoraineValleyCommunityCollege 2005 99% 1186 1200Mt.SanAntonioCollege 2007 73% 1099 1500NorthernVirginiaCommunityCollege 2005 90% 1351 1500OaklandCommunityCollege 2005 73% 1100 1500PalmBeachCommunityCollege 2007 101% 1206 1200PalomarCollege 2007 85% 1268 1500PasadenaCityCollege 2007 82% 1223 1500SaltLakeCommunityCollege 2006 75% 1124 1500SanAntonioCollege 2007 100% 1198 1200SanDiegoMesaCollege 2007 84% 1007 1200SantaAnaCollege 2007 74% 1109 1500SantaFeCommunityCollege(FL) 2007 79% 953 1200SinclairCommunityCollege 2007 77% 923 1200SouthTexasCollege 2007 85% 1024 1200SouthwesternIllinoisCollege 2005 97% 1159 1200St.PetersburgCollege 2007 98% 1470 1500TheCommunityCollegeofBaltimoreCounty 2006 75% 900 1200TidewaterCommunityCollege 2005 89% 1337 1500TritonCollege 2006 86% 1031 1200ValenciaCommunityCollege 2007 102% 1533 1500

Respondents to Underlying Population by College Size
Table 3, on the following page, highlights data about respondent and population characteristics-similar to data presented in Table 1-by institution size and overall. The specific characteristics examined include gender, race/ethnicity, age, and enrollment status. The first column details these characteristics for 2007 Small College Respondents while the second presents the population data for the same size group – 2007 CCSSE Cohort Small Colleges (small colleges that participated in CCSSE from 2005 through 2007). This pattern of data presentation, respondents in one column and population data in the next, continues for medium through extra-large colleges. The last two columns present data for 2007 CCSSE respondents and then population data for 2007 CCSSE Cohort colleges.

2007 Cohort 2007 Cohort 2007 Cohort 2007 Cohort 2007 Cohort 2007 Cohort 2007 Cohort 2007 Cohort 2007 Cohort 2007 CohortSmall College Small College Medium College Medium College Large College Large College ExLarge College ExLarge College College CollegeRespondents Population Respondents Population Respondents Population Respondents Population Respondents Population
Male 38% 40% 40% 39% 42% 42% 42% 43% 40% 41%Female 62% 60% 60% 61% 58% 58% 58% 57% 60% 59%
American Indian or other Native American 3% 2% 2% 1% 1% 1% 1% 1% 2% 1%Asian, Asian American or Pacific Islander 2% 3% 3% 4% 5% 5% 8% 9% 4% 6%Black or African American, Non-Hispanic 10% 11% 11% 13% 12% 15% 11% 14% 11% 14%White, Non-Hispanic 72% 72% 68% 67% 57% 57% 48% 47% 64% 59%Hispanic, Latino, Spanish 6% 7% 8% 9% 12% 15% 18% 21% 10% 14%Other 3% 4% 3% 5% 4% 4% 5% 5% 4% 5%International Student or Foreign National 4% 1% 5% 1% 9% 2% 10% 3% 6% 2%
18 to 19 28% 25% 29% 24% 29% 24% 27% 20% 28% 23%Student Age
Table 32007 CCSSE Cohort Respondents to the Underlying Population Comparisons by College Size
Gender
Race/Ethnicity
18 to 19 28% 25% 29% 24% 29% 24% 27% 20% 28% 23%20 to 21 22% 17% 24% 18% 26% 19% 25% 19% 24% 18%22 to 24 13% 13% 13% 14% 15% 16% 16% 16% 14% 15%25 to 29 12% 13% 12% 13% 12% 14% 13% 15% 12% 14%30 to 39 13% 16% 12% 16% 11% 14% 11% 15% 12% 15%40 to 49 8% 10% 7% 10% 5% 9% 6% 9% 7% 9%50 to 64 3% 5% 3% 4% 2% 4% 2% 4% 3% 4%65 and over <1% 1% <1% 1% <1% 1% <1% 1% <1% 1%
Full-Time 72% 43% 70% 39% 67% 36% 63% 34% 69% 37%Part-Time 28% 57% 30% 61% 33% 64% 37% 66% 31% 63%
Enrollment Status
Notes:
All population data are those reported by institutions for the most recent IPEDS enrollment report.
Respondents include only data used in the national CCSSE analysis. Some data was excluded in accordance with CCSSE data exclusion rules.

Underlying Population Percentages Tables 4 and 5, beginning on the following page, examine college-level population characteristics by institution size (i.e., small, medium, large, and extra-large). The characteristics are the same as those examined in Tables 1 and 3: gender, race/ethnicity, age, and enrollment status. This table differs from Tables 1 and 3 in that the characteristics, which had previously been rows, are now columns, and the college-level data are rows. There are a series of tables, for each size category, with population data presented for each college falling into that grouping.

Small Colleges
Male Female
American Indian or
Other Native American
Asian, Asian American or
Pacific Islander
Black or African
American, Non-Hispanic
White, Non-Hispanic
Hispanic, Latino, or Spanish
Other
International Student or
Foreign National
Full-Time Part-Time
All 2007 CCSSE Cohort Colleges 41% 59% 1% 6% 14% 59% 14% 5% 2% 37% 63%All Small Colleges 40% 60% 2% 3% 11% 72% 7% 4% 1% 43% 57%Abraham Baldwin Agricultural College 42% 58% <1% 1% 17% 79% 3% 0% 1% 65% 35%Aiken Technical College 35% 65% 1% 1% 34% 60% 2% 2% <1% 46% 54%Alabama Southern Community College 34% 66% <1% <1% 39% 60% <1% <1% 0% 67% 33%Alexandria Technical College 57% 43% 1% 1% <1% 87% 1% 11% 0% 75% 25%Allegany College of Maryland 31% 69% <1% 1% 6% 91% 1% 1% 0% 57% 43%Alpena Community College 42% 58% <1% 1% 1% 97% <1% <1% <1% 51% 49%Alvin Community College 45% 55% <1% 2% 8% 68% 21% 1% 0% 30% 70%Ashland Community and Technical College 43% 57% <1% <1% 1% 80% <1% 18% <1% 48% 52%Asnuntuck Community College 41% 59% <1% 2% 5% 88% 3% 1% <1% 35% 65%Atlanta Metropolitan College 36% 64% <1% 1% 95% 1% 1% 0% 3% 50% 50%Atlanta Technical College 40% 60% <1% 2% 88% 7% 1% 2% 0% 44% 56%Bainbridge College 30% 70% <1% 3% 51% 46% 1% 0% 0% 39% 61%B t C t C it C ll 48% 52% 1% 2% 11% 79% 6% 0% 1% 25% 75%
Table 4
Gender Race/Ethnicity Enrollment Status
Underlying Population Percentages by Gender, Race/Ethnicity, and Enrollment Status
Barton County Community College 48% 52% 1% 2% 11% 79% 6% 0% 1% 25% 75%Belmont Technical College 39% 61% <1% <1% 3% 95% <1% <1% <1% 66% 34%Berkshire Community College 37% 63% 1% 1% 3% 84% 4% 5% 2% 40% 60%Big Bend Community College 43% 57% 1% 2% 1% 71% 21% 3% <1% 66% 34%Bismarck State College 51% 49% 3% <1% 1% 94% 1% <1% 1% 64% 36%Blue Ridge Community College 42% 58% <1% 2% 4% 92% 2% 0% <1% 40% 60%Bowling Green Technical College 65% 35% <1% 1% 5% 79% 1% 14% <1% 25% 75%Brazosport College 45% 55% <1% 1% 8% 67% 24% 0% <1% 24% 76%Butler County Community College (PA) 40% 60% <1% 1% 2% 92% 1% 4% <1% 52% 48%Caldwell Community College and Technical Institute 44% 56% <1% 1% 4% 91% 1% 2% 0% 34% 66%Cape Cod Community College 36% 64% 1% 1% 6% 76% 2% 12% 1% 32% 68%Capital Community College 28% 72% <1% 4% 38% 26% 25% 6% 1% 26% 74%Caritas Laboure College 9% 91% <1% 3% 30% 52% 5% 9% 2% 10% 90%Carolinas College of Health Sciences 13% 87% <1% 1% 17% 70% 3% 9% 0% 29% 71%Carroll Community College 36% 64% <1% 2% 3% 91% 2% 2% 0% 43% 57%Carteret Community College 32% 68% <1% 1% 9% 84% 2% 4% 0% 25% 75%Cascadia Community College 51% 49% <1% 6% 1% 73% 5% 14% <1% 50% 50%Casper College 40% 60% 1% <1% 1% 95% 3% 0% 1% 46% 54%Cecil Community College 35% 65% <1% 1% 7% 87% 2% 2% <1% 36% 64%Cedar Valley College 36% 64% <1% 1% 56% 28% 12% 2% <1% 36% 64%Central Lakes College 43% 57% 1% 1% 1% 96% 1% <1% <1% 64% 36%Central Maine Community College 47% 53% 1% 1% 2% 67% 1% 28% <1% 42% 58%Central Wyoming College 35% 65% 15% 1% 0% 77% 4% 2% 1% 42% 58%Centralia College 51% 49% 2% 2% 5% 81% 4% 5% <1% 34% 66%Chattahoochee Technical College 46% 54% <1% 2% 33% 53% 4% 5% 2% 36% 64%Chesapeake College 31% 69% <1% 1% 18% 79% 1% <1% <1% 34% 66%Chipola College 40% 60% 1% 1% 19% 78% 2% <1% 0% 44% 56%
Note: All population percentages acquired from the 2005 IPEDS dataset, if available.

Small Colleges continued
Male Female
American Indian or
Other Native American
Asian, Asian American or
Pacific Islander
Black or African
American, Non-Hispanic
White, Non-Hispanic
Hispanic, Latino, or Spanish
Other
International Student or
Foreign National
Full-Time Part-Time
All 2007 CCSSE Cohort Colleges 41% 59% 1% 6% 14% 59% 14% 5% 2% 37% 63%All Small Colleges 40% 60% 2% 3% 11% 72% 7% 4% 1% 43% 57%Clarendon College 54% 46% 1% 1% 12% 69% 17% <1% <1% 37% 63%Cleveland Community College 33% 67% <1% 1% 22% 75% 1% 1% <1% 41% 59%Cleveland State Community College 39% 61% 1% 1% 5% 90% 2% 1% 1% 52% 48%Clovis Community College 35% 65% 1% 1% 5% 63% 29% 2% <1% 17% 83%Coastal Bend College 39% 61% <1% 1% 3% 31% 64% <1% 1% 41% 59%Coastal Carolina Community College 35% 65% 1% 3% 19% 67% 9% <1% 1% 50% 50%Coastal Georgia Community College 31% 69% <1% 1% 30% 66% 2% 0% <1% 33% 67%College of the Mainland 41% 59% 1% 2% 16% 59% 20% 2% <1% 35% 65%College of the Marshall Islands 53% 47% 0% 100% 0% 0% 0% 0% 0% 78% 22%College of the Siskiyous 44% 56% 4% 3% 3% 74% 8% 8% <1% 35% 65%Cumberland County College 36% 64% 2% 1% 18% 61% 17% 1% <1% 53% 47%Dabney S. Lancaster Community College 38% 62% <1% <1% 5% 93% 1% 0% 0% 28% 72%Danville Area Community College 36% 64% <1% 1% 10% 86% 3% 0% <1% 44% 56%Danville Community College 39% 61% <1% <1% 35% 63% <1% 0% <1% 35% 65%Darton College 29% 71% <1% 1% 46% 51% 1% 0% 1% 46% 54%Delaware Technical & Community College - Owens Campus 33% 67% <1% 1% 14% 75% 3% 2% 5% 41% 59%
Gender Race/Ethnicity Enrollment Status
Delaware Technical & Community College Owens Campus 33% 67% 1% 1% 14% 75% 3% 2% 5% 41% 59%Delaware Technical & Community College - Terry Campus 29% 71% <1% 2% 24% 67% 3% 2% 1% 34% 66%Dyersburg State Community College 29% 71% <1% <1% 19% 78% 2% 0% 0% 58% 42%East Georgia College 42% 58% <1% 1% 33% 65% 1% 0% <1% 74% 26%Eastern New Mexico University - Roswell 46% 54% 4% 1% 2% 48% 41% 5% <1% 37% 63%Eastern Shore Community College 30% 70% <1% 1% 37% 61% 2% 0% 0% 29% 71%Eastern West Virginia Community & Technical College 33% 67% 1% <1% 2% 97% <1% 0% 0% 8% 92%Eastern Wyoming College 33% 67% <1% <1% 1% 94% 5% 0% <1% 39% 61%Edison State Community College 36% 64% <1% 1% 2% 92% 1% 4% 0% 36% 64%Ellsworth Community College 46% 54% <1% 1% 7% 89% 2% <1% <1% 66% 34%Fairmont State Community and Technical College 44% 56% <1% 1% 6% 91% 1% 1% 0% 56% 44%Florida Keys Community College 41% 59% <1% 1% 9% 73% 13% 2% 1% 21% 79%Fond du Lac Tribal and Community College 39% 61% 15% 1% 1% 79% 1% 3% <1% 40% 60%Frank Phillips College 42% 58% <1% <1% 2% 79% 16% <1% 1% 47% 53%Galveston College 35% 65% <1% 3% 19% 52% 24% <1% 1% 38% 62%Garrett College 47% 53% <1% 0% 7% 87% 1% 1% 3% 65% 35%Gateway Community and Technical College 52% 48% <1% 1% 5% 80% 1% 12% <1% 24% 76%Georgia Highlands College 35% 65% <1% 2% 11% 84% 3% 0% 1% 54% 46%Gordon College 36% 64% <1% 1% 32% 64% 2% 0% 1% 67% 33%Grays Harbor College 45% 55% 3% 2% 3% 81% 4% 6% <1% 46% 54%Grayson County College 39% 61% 2% 1% 6% 84% 5% 0% 2% 47% 53%Greenfield Community College 37% 63% <1% 3% 2% 83% 3% 9% <1% 45% 55%Hagerstown Community College 37% 63% <1% 1% 7% 87% 2% 2% 0% 34% 66%Hawaii Community College 36% 64% 1% 67% 1% 24% 2% 3% 2% 46% 54%
Note: All population percentages acquired from the 2005 IPEDS dataset, if available.

Small Colleges continued
Male Female
American Indian or
Other Native American
Asian, Asian American or
Pacific Islander
Black or African
American, Non-Hispanic
White, Non-Hispanic
Hispanic, Latino, or Spanish
Other
International Student or
Foreign National
Full-Time Part-Time
All 2007 CCSSE Cohort Colleges 41% 59% 1% 6% 14% 59% 14% 5% 2% 37% 63%All Small Colleges 40% 60% 2% 3% 11% 72% 7% 4% 1% 43% 57%Hazard Community and Technical College 40% 60% <1% <1% 1% 89% <1% 9% 0% 47% 53%Henderson Community College 39% 61% <1% <1% 6% 77% 1% 15% <1% 33% 67%Hesston College 50% 50% 1% 1% 6% 79% 3% 1% 9% 87% 13%Hibbing Community College 47% 53% 2% 1% 5% 83% <1% 8% <1% 69% 31%Honolulu Community College 53% 47% <1% 80% 2% 13% 2% 3% 1% 37% 63%Hopkinsville Community College 30% 70% <1% 1% 21% 53% 3% 21% 0% 43% 57%Howard College 38% 62% 1% 1% 5% 61% 31% 1% <1% 38% 62%Illinois Valley Community College 44% 56% <1% 1% 3% 85% 6% 5% 0% 45% 55%Isothermal Community College 35% 65% 1% <1% 16% 80% 2% 1% 1% 46% 54%Itasca Community College 52% 48% 4% 1% 2% 86% 1% 6% 2% 73% 27%Ivy Tech Community College - Bloomington 39% 61% <1% 1% 3% 91% 1% 4% <1% 48% 52%Ivy Tech Community College - Columbus 29% 71% <1% 1% 2% 90% 1% 6% <1% 38% 63%Ivy Tech Community College - Elkhart 44% 56% <1% 1% 12% 77% 5% 5% 1% 26% 74%Ivy Tech Community College - Evansville 47% 53% <1% <1% 7% 89% 1% 2% <1% 34% 66%Ivy Tech Community College - Kokomo 36% 64% 1% <1% 3% 90% 2% 3% <1% 35% 65%Ivy Tech Community College - Lawrenceburg 28% 72% <1% 1% 1% 96% 1% 1% <1% 38% 62%
Enrollment StatusGender Race/Ethnicity
Ivy Tech Community College Lawrenceburg 28% 72% 1% 1% 1% 96% 1% 1% 1% 38% 62%Ivy Tech Community College - Logansport 36% 64% 1% <1% 3% 90% 2% 3% <1% 35% 65%Ivy Tech Community College - Madison 28% 72% <1% 1% 1% 96% 1% 1% <1% 38% 62%Ivy Tech Community College - Sellersburg 49% 51% 1% <1% 4% 90% 1% 4% <1% 29% 71%Ivy Tech Community College - South Bend 44% 56% <1% 1% 12% 77% 5% 5% 1% 26% 74%Ivy Tech Community College - Terre Haute 43% 57% 1% <1% 3% 93% <1% 3% <1% 44% 56%Ivy Tech Community College - Warsaw 44% 56% <1% 1% 12% 77% 5% 5% 1% 26% 74%Ivy Tech Community College - Whitewater 26% 74% <1% <1% 5% 92% 1% 2% <1% 33% 67%Jackson State Community College 35% 65% <1% <1% 18% 79% 1% 1% <1% 53% 47%James A. Rhodes State College 29% 71% <1% <1% 8% 88% 1% 2% 0% 52% 48%Jefferson Community College 38% 62% <1% 1% 5% 85% 1% 8% 0% 54% 46%Kankakee Community College 36% 64% <1% 1% 13% 81% 4% 0% <1% 38% 62%Kauai Community College 37% 63% 1% 67% 1% 28% 2% 1% 1% 38% 62%Kenai Peninsula College-UAA 41% 59% 7% 1% 1% 76% 2% 10% 2% 29% 71%Kennebec Valley Community College 31% 69% 1% <1% <1% 75% 1% 23% 0% 29% 71%Kirtland Community College 37% 63% 2% <1% 1% 92% 1% 4% <1% 38% 62%Kodiak College, University of Alaska Anchorage 29% 71% 11% 8% 1% 68% 4% 4% 2% 12% 88%Kuskokwim Campus, University of Alaska Fairbanks 24% 76% 69% 1% <1% 21% 2% 5% 1% 22% 78%L. E. Fletcher Technical Community College 47% 53% 5% 1% 23% 68% 2% 1% 0% 35% 65%Lake City Community College 35% 65% <1% 2% 11% 85% 2% <1% 1% 44% 56%Lake Region State College 42% 58% 4% 1% 2% 91% 1% <1% 1% 28% 72%Lake-Sumter Community College 33% 67% <1% 2% 10% 77% 9% 1% 1% 36% 64%Lamar Institute of Technology 54% 46% 1% 2% 33% 53% 8% 4% <1% 50% 50%Lamar State College - Orange 28% 72% 1% 1% 19% 76% 3% <1% 0% 43% 57%
Note: All population percentages acquired from the 2005 IPEDS dataset, if available.

Small Colleges continued
Male Female
American Indian or
Other Native American
Asian, Asian American or
Pacific Islander
Black or African
American, Non-Hispanic
White, Non-Hispanic
Hispanic, Latino, or Spanish
Other
International Student or
Foreign National
Full-Time Part-Time
All 2007 CCSSE Cohort Colleges 41% 59% 1% 6% 14% 59% 14% 5% 2% 37% 63%All Small Colleges 40% 60% 2% 3% 11% 72% 7% 4% 1% 43% 57%Laramie County Community College 39% 61% 1% 1% 2% 88% 7% 1% <1% 38% 62%Leech Lake Tribal College 40% 60% 94% 0% 0% 6% 0% 0% 0% 71% 29%Louisburg College 72% 28% 1% 1% 58% 31% 8% 0% 1% 98% 2%Louisiana Delta Community College 40% 60% 1% 1% 24% 73% 1% 1% 0% 44% 56%Louisiana Technical College - Region 2 54% 46% <1% 1% 53% 39% 2% 4% 1% 60% 40%Louisiana Technical College - Region 3 73% 27% 1% 1% 25% 71% 2% <1% 0% 34% 66%Louisiana Technical College - Region 4 48% 52% 1% 1% 36% 61% 1% <1% 0% 67% 33%Louisiana Technical College - Region 6 49% 51% 1% 1% 35% 59% 1% 3% 0% 54% 46%Louisiana Technical College - Region 7 50% 50% 2% 1% 40% 56% 1% <1% 0% 54% 46%Louisiana Technical College - Region 8 38% 62% <1% <1% 42% 56% 1% <1% 0% 55% 45%Louisiana Technical College - Region 9 63% 37% 1% 1% 24% 63% 1% 11% 0% 39% 61%Lower Columbia College 36% 64% 1% 2% 1% 81% 3% 13% <1% 57% 43%Madisonville Community College 42% 58% <1% <1% 5% 92% 1% 2% 0% 39% 61%Marshall Community and Technical College 62% 38% <1% 1% 6% 78% 1% 14% <1% 50% 50%Marshalltown Community College 37% 63% 3% 2% 3% 83% 6% 2% <1% 49% 51%Martin Community College 23% 77% <1% <1% 56% 40% <1% 3% <1% 47% 53%
Gender Race/Ethnicity Enrollment Status
Martin Community College 23% 77% 1% 1% 56% 40% 1% 3% 1% 47% 53%Maui Community College 33% 67% <1% 61% <1% 30% 2% 3% 3% 40% 60%Mayland Community College 50% 50% 1% <1% 6% 91% 1% <1% <1% 37% 63%Maysville Community & Technical College 49% 51% <1% <1% 2% 81% <1% 16% 0% 34% 66%Mercy College of Health Sciences 9% 91% <1% 2% 1% 92% 1% 4% 0% 63% 37%Mesabi Range Community and Technical College 50% 50% 1% 1% 4% 88% <1% 5% <1% 55% 45%Mid Michigan Community College 38% 62% 2% 1% 2% 91% 2% 2% <1% 46% 54%Middle Georgia College 41% 59% <1% 1% 34% 63% 1% 0% <1% 68% 32%Middlesex Community College 35% 65% <1% 3% 7% 76% 8% 4% <1% 38% 62%Mid-South Community College 35% 65% <1% 1% 46% 51% 1% 0% <1% 31% 69%Minot State University-Bottineau 39% 61% 7% 1% 2% 86% 1% <1% 3% 60% 40%Montana State University Billings 45% 55% 6% 1% 1% 83% 3% 5% <1% 63% 37%Motlow State Community College 36% 64% <1% 1% 7% 88% 1% 2% <1% 59% 41%Mount Wachusett Community College 33% 67% <1% 2% 4% 75% 8% 9% 1% 47% 53%Mountain Empire Community College 35% 65% <1% <1% 2% 98% <1% 0% <1% 39% 61%New Hampshire Technical Institute 41% 59% <1% 1% 2% 84% 1% 12% 0% 47% 53%New Mexico Junior College 41% 59% 1% 1% 5% 49% 39% 6% 0% 45% 55%New Mexico Military Institute 84% 16% 3% 9% 15% 48% 20% <1% 4% 100% 0%New Mexico State University - Grants 30% 70% 41% <1% 1% 15% 32% 11% 0% 48% 52%New Mexico State University at Alamogordo 34% 66% 4% 3% 5% 40% 26% 20% 2% 37% 63%New River Community and Technical College 33% 67% 1% <1% 8% 91% 1% 0% <1% 57% 43%New River Community College 46% 54% <1% 2% 5% 91% 1% 1% <1% 43% 57%NH Community Technical College - Berlin 43% 57% <1% <1% <1% 79% <1% 20% 0% 36% 64%NH Community Technical College - Claremont 39% 61% <1% 2% 1% 79% 3% 16% 0% 28% 72%
Note: All population percentages acquired from the 2005 IPEDS dataset, if available.

Small Colleges continued
Male Female
American Indian or
Other Native American
Asian, Asian American or
Pacific Islander
Black or African
American, Non-Hispanic
White, Non-Hispanic
Hispanic, Latino, or Spanish
Other
International Student or
Foreign National
Full-Time Part-Time
All 2007 CCSSE Cohort Colleges 41% 59% 1% 6% 14% 59% 14% 5% 2% 37% 63%All Small Colleges 40% 60% 2% 3% 11% 72% 7% 4% 1% 43% 57%NH Community Technical College - Laconia 43% 57% <1% <1% <1% 79% <1% 20% 0% 36% 64%NH Community Technical College - Manchester 44% 56% <1% 2% 1% 72% 2% 23% 0% 17% 83%NH Community Technical College - Nashua 39% 61% <1% 2% 1% 79% 3% 16% 0% 28% 72%NH Community Technical College - Stratham 44% 56% <1% 2% 1% 72% 2% 23% 0% 17% 83%North Arkansas College 38% 62% 1% 1% 1% 94% 3% 1% 0% 52% 48%North Central Missouri College 29% 71% 1% <1% 2% 96% 1% 0% <1% 52% 48%North Central State College 34% 66% <1% 1% 5% 88% 1% 5% 0% 34% 66%North Dakota State College of Science 61% 39% 2% 1% 2% 95% 1% 0% <1% 75% 25%North Florida Community College 32% 68% <1% 1% 21% 75% 2% <1% <1% 46% 54%North Iowa Area Community College 44% 56% <1% 1% 3% 92% 2% <1% 1% 54% 46%Northeast Lakeview College 37% 63% 1% 3% 10% 54% 32% 0% 1% 43% 57%Northeast Mississippi Community College 42% 58% <1% <1% 19% 79% 1% 1% <1% 85% 15%Northeast Texas Community College 39% 61% 1% 1% 9% 74% 15% 0% 2% 36% 64%Northern Maine Community College 47% 53% 4% <1% 1% 86% 1% 5% 4% 66% 34%Northern New Mexico Community College 36% 64% 6% 1% 1% 20% 72% <1% <1% 34% 66%Northwest College 37% 63% 1% 2% 1% 92% 5% <1% <1% 64% 36%
Gender Enrollment StatusRace/Ethnicity
Northwest College 37% 63% 1% 2% 1% 92% 5% 1% 1% 64% 36%Northwest Indian College 33% 67% 78% 1% 1% 16% 1% 3% 0% 50% 50%Northwest Iowa Community College 47% 53% <1% <1% <1% 92% 1% 6% <1% 48% 52%Northwestern Connecticut Community College 32% 68% <1% 2% 2% 88% 3% 5% <1% 34% 66%Nunez Community College 30% 70% 1% 2% 31% 61% 3% 2% <1% 56% 44%Oregon Coast Community College 36% 64% 4% 3% 1% 90% 3% <1% 0% 12% 88%Ouachita Technical College 49% 51% 1% 1% 12% 85% 1% 0% <1% 35% 65%Panola College 34% 66% 1% 1% 17% 77% 4% 0% 1% 49% 51%Paris Junior College 36% 64% 2% 1% 11% 81% 6% 0% <1% 45% 55%Patrick Henry Community College 34% 66% 1% <1% 22% 76% 1% 0% 0% 35% 65%Paul D. Camp Community College 34% 66% <1% 1% 37% 61% 1% 0% 0% 24% 76%Piedmont Virginia Community College 41% 59% <1% 3% 13% 82% 2% 0% <1% 26% 74%Prince William Sound Community College 43% 57% 14% 4% 1% 66% 2% 12% 1% 12% 88%Quinebaug Valley Community College 32% 68% 1% 1% 2% 82% 9% 4% <1% 38% 62%Rainy River Community College 48% 52% 2% 1% 25% 65% 1% 3% 3% 75% 25%Ranger College 53% 47% 2% <1% 16% 65% 15% 1% 1% 73% 27%Rappahannock Community College 37% 63% 1% 1% 18% 80% 1% 0% 0% 24% 76%Reading Area Community College 35% 65% 1% 2% 10% 66% 14% 6% 1% 41% 59%Redlands Community College 32% 68% 8% 2% 7% 80% 3% 0% 1% 45% 55%River Parishes Community College 34% 66% <1% 1% 26% 68% 1% 5% 0% 41% 59%Riverland Community College 48% 52% <1% 1% 2% 91% 3% <1% 2% 42% 58%Roxbury Community College 32% 68% <1% 2% 49% 5% 13% 29% 3% 41% 59%Salem Community College 36% 64% 1% <1% 19% 62% 3% 9% 5% 48% 52%Salish Kootenai College 36% 64% 81% <1% <1% 17% 1% 0% 0% 60% 40%
Note: All population percentages acquired from the 2005 IPEDS dataset, if available.

Small Colleges continued
Male Female
American Indian or
Other Native American
Asian, Asian American or
Pacific Islander
Black or African
American, Non-Hispanic
White, Non-Hispanic
Hispanic, Latino, or Spanish
Other
International Student or
Foreign National
Full-Time Part-Time
All 2007 CCSSE Cohort Colleges 41% 59% 1% 6% 14% 59% 14% 5% 2% 37% 63%All Small Colleges 40% 60% 2% 3% 11% 72% 7% 4% 1% 43% 57%Santa Fe Community College (NM) 38% 62% 3% 2% 1% 46% 38% 10% <1% 25% 75%Sheridan College 44% 56% 1% 1% 1% 95% 3% 0% <1% 37% 63%South Florida Community College 40% 60% <1% 2% 11% 67% 17% 1% 1% 33% 67%South Georgia College 36% 64% <1% 1% 25% 71% 2% 0% 1% 69% 31%South Louisiana Community College 45% 55% 1% 1% 27% 70% 1% <1% <1% 43% 57%South Mountain Community College 35% 65% 4% 2% 14% 29% 38% 11% 1% 21% 79%South Piedmont Community College 34% 66% 1% 1% 35% 59% 2% 2% 1% 34% 66%Southeastern Community College (IA) 37% 63% <1% 1% 3% 89% 3% 3% 1% 60% 40%Southeastern Community College (NC) 34% 66% 6% <1% 31% 60% 1% 1% <1% 56% 44%Southeastern Technical College 27% 73% <1% <1% 29% 68% 2% <1% 0% 46% 54%Southern Maine Community College 51% 49% 1% 1% 2% 81% 1% 12% <1% 51% 49%Southern University at Shreveport 25% 75% <1% <1% 81% 17% 1% 1% <1% 63% 37%Southern West Virginia Community and Technical College 31% 69% <1% <1% 1% 98% <1% 0% 0% 55% 45%Southwest Texas Junior College 39% 61% <1% 1% 2% 15% 80% 1% <1% 44% 56%Southwest Virginia Community College 41% 59% <1% <1% 2% 97% <1% 0% 0% 41% 59%Southwestern Community College 36% 64% 9% <1% 1% 86% 1% 2% 1% 44% 56%
Gender Race/Ethnicity Enrollment Status
Southwestern Community College 36% 64% 9% 1% 1% 86% 1% 2% 1% 44% 56%Southwestern Indian Polytechnic Institute 44% 56% 100% 0% 0% 0% 0% 0% 0% 76% 24%Southwestern Oregon Community College 42% 58% 4% 2% 2% 71% 3% 18% 1% 49% 51%SOWELA Technical Community College 61% 39% 1% 1% 21% 73% 1% 3% 0% 60% 40%Spoon River College 45% 55% 1% 1% 5% 92% 1% 0% <1% 45% 55%Surry Community College 39% 61% <1% <1% 4% 92% 2% 1% 1% 47% 53%Tanana Valley Campus, University of Alaska Fairbanks 40% 60% 12% 3% 4% 66% 3% 8% 4% 50% 50%Technical College of the Lowcountry 28% 72% <1% 1% 46% 46% 4% 2% <1% 33% 67%Temple College 34% 66% 1% 2% 14% 69% 15% <1% <1% 35% 65%Texas State Technical College Harlingen 49% 51% <1% <1% 1% 9% 89% 0% 1% 38% 62%Texas State Technical College Marshall 70% 30% 1% 1% 26% 67% 6% 0% <1% 54% 46%Texas State Technical College Waco 77% 23% <1% 1% 16% 64% 16% 0% 2% 67% 33%Texas State Technical College West Texas 54% 46% <1% 1% 8% 67% 23% 0% <1% 50% 50%The Community and Technical College at WVU Tech 52% 48% <1% 1% 6% 92% 1% 0% <1% 67% 33%The Community and Technical College of Shepherd 40% 60% 1% 1% 8% 88% 2% 1% <1% 25% 75%The Victoria College 34% 66% <1% 1% 5% 61% 32% <1% <1% 39% 61%Three Rivers Community College 38% 62% 1% 3% 7% 74% 7% 6% 1% 32% 68%Tompkins Cortland Community College 40% 60% <1% 2% 6% 87% 3% 0% 3% 68% 32%Tri-County Community College 32% 68% 2% <1% 1% 94% 1% 2% 0% 40% 60%Tunxis Community College 39% 61% <1% 3% 6% 78% 9% 3% 1% 38% 62%University of Alaska Matanuska Susitna College 32% 68% 6% 2% 2% 82% 3% 5% 1% 40% 60%University of Alaska Southeast Ketchikan campus 37% 63% 17% 4% <1% 62% 3% 11% 2% 31% 69%University of Arkansas Community College at Batesville 33% 67% 1% 1% 3% 94% 2% 0% 0% 55% 45%University of Arkansas Community College at Hope 31% 69% 1% 1% 31% 64% 2% 1% <1% 53% 47%
Note: All population percentages acquired from the 2005 IPEDS dataset, if available.

Small Colleges continued
Male Female
American Indian or
Other Native American
Asian, Asian American or
Pacific Islander
Black or African
American, Non-Hispanic
White, Non-Hispanic
Hispanic, Latino, or Spanish
Other
International Student or
Foreign National
Full-Time Part-Time
All 2007 CCSSE Cohort Colleges 41% 59% 1% 6% 14% 59% 14% 5% 2% 37% 63%All Small Colleges 40% 60% 2% 3% 11% 72% 7% 4% 1% 43% 57%University of Cincinnati Clermont College 37% 63% <1% 1% 2% 82% 1% 13% <1% 61% 39%University of New Mexico - Gallup 32% 68% 79% 1% 1% 9% 9% 1% <1% 40% 60%University of New Mexico - Taos Branch 32% 68% 6% 1% 1% 32% 54% 7% 0% 23% 77%University of New Mexico - Valencia Campus 30% 70% 4% 1% 1% 32% 58% 4% 1% 45% 55%Vermilion Community College 66% 34% 1% 1% 9% 86% 3% 0% 0% 69% 31%Vernon College 35% 65% 1% 1% 8% 76% 14% <1% <1% 36% 64%Virginia Highlands Community College 44% 56% <1% <1% 2% 97% 1% 0% <1% 41% 59%Warren County Community College 36% 64% <1% 1% 3% 68% 3% 21% 4% 38% 62%Washington State Community College 36% 64% 1% <1% 1% 94% 1% 3% <1% 59% 41%Waycross College 26% 74% <1% 1% 21% 77% 1% 0% 0% 42% 58%Wayne Community College 35% 65% 1% 2% 31% 60% 3% 3% <1% 51% 49%Wenatchee Valley College 37% 63% 3% 1% <1% 76% 15% 5% <1% 63% 37%West Virginia Northern Community College 31% 69% <1% <1% 3% 96% <1% 0% <1% 50% 50%West Virginia State Community and Technical College 36% 64% <1% 1% 17% 79% 1% 3% 0% 62% 38%West Virginia University at Parkersburg 36% 64% <1% 1% 1% 97% 1% 1% 0% 58% 42%Western Nebraska Community College 41% 59% 1% 1% 1% 72% 10% 13% 2% 38% 62%
Gender Race/Ethnicity Enrollment Status
Western Nebraska Community College 41% 59% 1% 1% 1% 72% 10% 13% 2% 38% 62%Western Piedmont Community College 36% 64% <1% 6% 8% 83% 1% 2% <1% 32% 68%Western Texas College 52% 48% <1% 1% 6% 71% 21% 0% 1% 26% 74%Western Wyoming Community College 48% 52% 1% <1% 1% 89% 7% 0% 1% 33% 67%Williston State College 27% 73% 5% <1% 1% 89% 2% 0% 3% 59% 41%Windward Community College 37% 63% 1% 69% 1% 26% 2% 1% <1% 43% 57%Wisconsin Indianhead Technical College 39% 61% 3% 1% <1% 92% 1% 4% 0% 44% 56%Wor-Wic Community College 33% 67% <1% 2% 25% 68% 2% 3% 0% 32% 68%Wytheville Community College 34% 66% <1% <1% 2% 96% 1% 0% 0% 31% 69%York Technical College 36% 64% 2% 1% 24% 71% 1% 1% <1% 49% 51%Zane State College 38% 62% 1% <1% 3% 91% <1% 5% 0% 64% 36%
Note: All population percentages acquired from the 2005 IPEDS dataset, if available.

Medium Colleges
Male Female
American Indian or
Other Native American
Asian, Asian American or
Pacific Islander
Black or African
American, Non-Hispanic
White, Non-Hispanic
Hispanic, Latino, or Spanish
Other
International Student or
Foreign National
Full-Time Part-Time
All 2007 CCSSE Cohort Colleges 41% 59% 1% 6% 14% 59% 14% 5% 2% 37% 63%All Medium Colleges 39% 61% 1% 4% 13% 67% 9% 5% 1% 39% 61%Angelina College 37% 63% <1% 1% 14% 75% 10% <1% <1% 37% 63%Anoka-Ramsey Community College 35% 65% 1% 3% 3% 83% 1% 8% <1% 42% 58%Asheville-Buncombe Technical Community College 43% 57% 1% 1% 5% 88% 2% 3% <1% 39% 61%Baltimore City Community College 27% 73% <1% 2% 81% 9% 1% 7% 0% 37% 63%Baton Rouge Community College 44% 56% 1% 2% 37% 57% 2% 1% <1% 55% 45%Big Sandy Community and Technical College 45% 55% <1% <1% 2% 82% <1% 16% 0% 40% 60%Black Hawk College 39% 61% <1% 1% 8% 81% 9% 0% 0% 46% 54%Bossier Parish Community College 35% 65% <1% 1% 27% 65% 2% 5% <1% 54% 46%Bristol Community College 37% 63% 1% 2% 5% 78% 3% 11% <1% 45% 55%Bunker Hill Community College 40% 60% 1% 14% 27% 37% 14% 3% 5% 30% 70%Burlington County College 39% 61% <1% 4% 21% 63% 6% 6% 1% 49% 51%Cape Fear Community College 45% 55% 1% 1% 14% 79% 2% 3% 0% 42% 58%Central Arizona College 40% 60% 6% 1% 5% 53% 32% 2% 1% 30% 70%Central Community College 40% 60% <1% 1% 1% 87% 7% 4% <1% 33% 67%Central Florida Community College 34% 66% 1% 2% 11% 78% 7% 1% 1% 41% 59%Central Virginia Community College 45% 55% <1% 1% 15% 82% 1% 0% <1% 21% 79%
Enrollment StatusGender Race/Ethnicity
Central Virginia Community College 45% 55% 1% 1% 15% 82% 1% 0% 1% 21% 79%Chattanooga State Technical Community College 38% 62% <1% 2% 17% 79% 2% 1% 0% 45% 55%Cochise College 40% 60% 1% 3% 5% 52% 33% 5% 1% 31% 69%College of Alameda 46% 54% <1% 37% 25% 16% 12% 8% 2% 21% 79%College of Southern Idaho 35% 65% 1% 1% <1% 83% 7% 4% 3% 42% 58%College of Southern Maryland 34% 66% 1% 3% 19% 69% 3% 5% <1% 34% 66%College of the Redwoods 42% 58% 6% 3% 2% 71% 7% 11% <1% 40% 60%Colorado Mountain College 43% 57% 1% 1% 1% 76% 10% 11% <1% 26% 74%Columbia State Community College 35% 65% <1% 1% 7% 88% 2% 1% <1% 50% 50%Corning Community College 43% 57% 1% 1% 2% 60% 1% 35% <1% 50% 50%Delaware Technical & Community College - Stanton-Wilmington 37% 63% <1% 3% 23% 62% 5% 5% 2% 37% 63%Dona Ana Community College 42% 58% 2% 1% 3% 20% 64% 10% 1% 34% 66%Durham Technical Community College 36% 64% <1% 2% 40% 42% 3% 2% 9% 26% 74%El Centro College 30% 70% <1% 4% 35% 27% 28% 3% 2% 25% 75%Elizabethtown Community & Technical College 41% 59% <1% 2% 8% 86% 2% 2% <1% 48% 52%Estrella Mountain Community College 38% 62% 1% 3% 6% 40% 31% 18% 1% 21% 79%Everett Community College 37% 63% 2% 5% 2% 60% 3% 27% 1% 46% 54%Frederick Community College 38% 62% 1% 3% 9% 81% 4% 2% 0% 38% 62%Gainesville College 46% 54% <1% 2% 4% 88% 4% 0% 2% 59% 41%Gateway Community College 37% 63% <1% 3% 25% 52% 13% 6% 1% 32% 68%Genesee Community College 35% 65% 1% <1% 3% 94% 1% <1% 2% 48% 52%George C Wallace State Community College 36% 64% 1% <1% 5% 92% 1% 1% 0% 59% 41%Georgia Military College 40% 60% <1% 1% 39% 52% 3% 3% <1% 63% 37%Germanna Community College 35% 65% 1% 3% 12% 80% 4% 0% 0% 31% 69%
Note: All population percentages acquired from the 2005 IPEDS dataset, if available.

Medium Colleges continued
Male Female
American Indian or
Other Native American
Asian, Asian American or
Pacific Islander
Black or African
American, Non-Hispanic
White, Non-Hispanic
Hispanic, Latino, or Spanish
Other
International Student or
Foreign National
Full-Time Part-Time
All 2007 CCSSE Cohort Colleges 41% 59% 1% 6% 14% 59% 14% 5% 2% 37% 63%All Medium Colleges 39% 61% 1% 4% 13% 67% 9% 5% 1% 39% 61%Gloucester County College 41% 59% <1% 2% 9% 74% 2% 11% <1% 53% 47%Gulf Coast Community College 41% 59% 1% 2% 11% 80% 3% 2% 1% 35% 65%Harford Community College 38% 62% <1% 3% 10% 81% 2% 3% <1% 40% 60%Hawkeye Community College 44% 56% <1% 1% 8% 87% 2% 2% 0% 52% 48%Heartland Community College 43% 57% <1% 2% 9% 85% 3% 0% <1% 41% 59%Holyoke Community College 35% 65% 1% 2% 6% 74% 13% 3% <1% 49% 51%Housatonic Community College 32% 68% <1% 2% 29% 41% 21% 6% 1% 33% 67%Howard Community College 41% 59% 1% 9% 20% 56% 4% 6% 6% 39% 61%Hutchinson Community College 43% 57% 1% 1% 5% 85% 5% 3% <1% 40% 60%Itawamba Community College 36% 64% <1% <1% 29% 68% 1% 2% 0% 72% 28%Ivy Tech Community College - Anderson 35% 65% <1% <1% 7% 88% 1% 3% <1% 45% 55%Ivy Tech Community College - East Chicago 34% 66% <1% 1% 29% 59% 9% 3% <1% 32% 68%Ivy Tech Community College - Fort Wayne 40% 60% <1% 1% 11% 80% 2% 4% <1% 37% 63%Ivy Tech Community College - Gary 34% 66% <1% 1% 29% 59% 9% 3% <1% 32% 68%Ivy Tech Community College - Lafayette 49% 51% <1% 1% 3% 85% 3% 8% <1% 41% 59%Ivy Tech Community College - Marion 35% 65% <1% <1% 7% 88% 1% 3% <1% 45% 55%
Enrollment StatusGender Race/Ethnicity
Ivy Tech Community College Marion 35% 65% 1% 1% 7% 88% 1% 3% 1% 45% 55%Ivy Tech Community College - Michigan City 34% 66% <1% 1% 29% 59% 9% 3% <1% 32% 68%Ivy Tech Community College - Muncie 35% 65% <1% <1% 7% 88% 1% 3% <1% 45% 55%Ivy Tech Community College - Valparaiso 34% 66% <1% 1% 29% 59% 9% 3% <1% 32% 68%Jackson Community College 36% 64% 1% 1% 5% 85% 4% 5% <1% 36% 64%John Tyler Community College 37% 63% <1% 3% 25% 69% 3% 0% <1% 25% 75%Kansas City Kansas Community College 35% 65% 1% 2% 23% 61% 6% 7% 1% 36% 64%Kapiolani Community College 42% 58% <1% 74% 1% 15% 2% 2% 7% 36% 64%Kilgore College 37% 63% <1% <1% 15% 77% 5% <1% 3% 54% 46%Kingwood College 40% 60% <1% 6% 11% 55% 19% 4% 4% 18% 82%Lake Superior College 44% 56% 2% 1% 2% 87% 1% 7% <1% 46% 54%Lee College 41% 59% <1% 1% 17% 54% 25% 1% 2% 39% 61%Leeward Community College 40% 60% 1% 77% 2% 14% 2% 4% 1% 42% 58%Lehigh Carbon Community College 38% 62% <1% 2% 5% 81% 8% 4% 1% 39% 61%Lincoln Land Community College 41% 59% <1% 1% 7% 89% 2% 0% <1% 39% 61%Linn-Benton Community College 46% 54% 2% 3% 1% 84% 3% 6% <1% 53% 47%Lord Fairfax Community College 38% 62% <1% 1% 5% 91% 2% 0% <1% 28% 72%Malcolm X College 35% 65% <1% 5% 58% 7% 29% 0% 0% 39% 61%Manchester Community College 44% 56% <1% 4% 12% 69% 10% 5% 1% 44% 56%Massachusetts Bay Community College 42% 58% <1% 4% 11% 72% 7% 4% 2% 43% 57%Massasoit Community College 43% 57% 1% 2% 16% 70% 3% 9% <1% 48% 52%McHenry County College 42% 58% <1% 2% 1% 89% 7% 0% 2% 38% 62%Minneapolis Community and Technical College 44% 56% 3% 6% 28% 51% 4% 5% 3% 42% 58%Mountain View College 41% 59% 1% 3% 29% 20% 44% 2% 1% 28% 72%
Note: All population percentages acquired from the 2005 IPEDS dataset, if available.

Medium Colleges continued
Male Female
American Indian or
Other Native American
Asian, Asian American or
Pacific Islander
Black or African
American, Non-Hispanic
White, Non-Hispanic
Hispanic, Latino, or Spanish
Other
International Student or
Foreign National
Full-Time Part-Time
All 2007 CCSSE Cohort Colleges 41% 59% 1% 6% 14% 59% 14% 5% 2% 37% 63%All Medium Colleges 39% 61% 1% 4% 13% 67% 9% 5% 1% 39% 61%Nashville State Technical Community College 42% 58% <1% 4% 27% 60% 2% 6% 0% 35% 65%Naugatuck Valley Community College 40% 60% <1% 3% 8% 70% 11% 8% <1% 39% 61%Navarro College 38% 62% 1% 1% 20% 65% 11% 0% 3% 52% 48%North Hennepin Community College 39% 61% 1% 8% 15% 68% 1% 6% 1% 37% 63%North Shore Community College 37% 63% <1% 3% 8% 70% 12% 6% <1% 42% 58%Northampton Community College 39% 61% <1% 2% 5% 78% 9% 4% 1% 44% 56%Northeast Iowa Community College 38% 62% <1% 1% 1% 90% 1% 8% <1% 38% 62%Northeast State Technical Community College 47% 53% <1% 1% 3% 89% 1% 6% 0% 54% 46%Northern Essex Community College 35% 65% <1% 2% 2% 66% 20% 9% 1% 36% 64%Northern Oklahoma College 41% 59% 8% 1% 5% 82% 4% 0% 1% 57% 43%NorthWest Arkansas Community College 40% 60% 2% 3% 1% 83% 8% 3% 0% 35% 65%Norwalk Community College 37% 63% <1% 5% 18% 48% 18% 6% 4% 33% 67%Okaloosa-Walton College 40% 60% 1% 4% 10% 77% 5% 2% <1% 36% 64%Olympic College 45% 55% 2% 7% 2% 74% 4% 10% <1% 49% 51%Owensboro Community and Technical College 47% 53% <1% <1% 3% 90% 1% 7% 0% 32% 68%Palo Alto College 36% 64% <1% 1% 2% 35% 62% <1% <1% 41% 59%
Gender Race/Ethnicity Enrollment Status
Palo Alto College 36% 64% 1% 1% 2% 35% 62% 1% 1% 41% 59%Pasco-Hernando Community College 34% 66% 1% 2% 4% 84% 8% 1% 1% 36% 64%Pellissippi State Technical Community College 46% 54% 1% 2% 7% 87% 2% 2% 1% 51% 49%Pitt Community College 40% 60% <1% 1% 32% 61% 2% 3% <1% 56% 44%Polk Community College 33% 67% <1% 2% 13% 72% 8% <1% 4% 29% 71%Prairie State College 38% 62% 1% 1% 47% 39% 10% 3% <1% 34% 66%Pueblo Community College 36% 64% 3% 1% 2% 58% 34% 2% <1% 38% 62%Quinsigamond Community College 40% 60% <1% 3% 8% 72% 9% 7% <1% 46% 54%Raritan Valley Community College 42% 58% <1% 7% 8% 63% 9% 7% 6% 41% 59%Red Rocks Community College 49% 51% 1% 2% 2% 81% 10% 2% 1% 33% 67%Rend Lake College 47% 53% <1% 1% 7% 90% 2% 0% <1% 33% 67%Roane State Community College 32% 68% <1% 1% 2% 94% 1% 1% <1% 56% 44%Rochester Community and Technical College 37% 63% <1% 4% 6% 82% 2% 5% 1% 56% 44%Rowan-Cabarrus Community College 32% 68% 1% 2% 20% 74% 3% 1% 0% 48% 52%San Jacinto College - North Campus 37% 63% <1% 3% 22% 29% 43% <1% 3% 37% 63%San Juan College 40% 60% 32% 1% 1% 52% 12% 3% <1% 51% 49%Shelton State Community College 47% 53% <1% 1% 29% 66% 1% 2% 0% 58% 42%Skagit Valley College 35% 65% 1% 5% 2% 80% 6% 4% 2% 44% 56%Somerset Community College 42% 58% <1% <1% 1% 94% <1% 4% <1% 46% 54%South Puget Sound Community College 39% 61% 1% 5% 2% 64% 4% 22% 1% 48% 52%South Seattle Community College 64% 36% 1% 12% 8% 57% 4% 14% 3% 26% 74%South Suburban College 29% 71% <1% 1% 63% 28% 7% 0% <1% 33% 67%Southeast Kentucky Community & Technical College 55% 45% <1% <1% 2% 86% <1% 12% <1% 36% 64%Southside Virginia Community College 37% 63% <1% 1% 37% 61% 1% 0% <1% 31% 69%
Note: All population percentages acquired from the 2005 IPEDS dataset, if available.

Medium Colleges continued
Male Female
American Indian or
Other Native American
Asian, Asian American or
Pacific Islander
Black or African
American, Non-Hispanic
White, Non-Hispanic
Hispanic, Latino, or Spanish
Other
International Student or
Foreign National
Full-Time Part-Time
All 2007 CCSSE Cohort Colleges 41% 59% 1% 6% 14% 59% 14% 5% 2% 37% 63%All Medium Colleges 39% 61% 1% 4% 13% 67% 9% 5% 1% 39% 61%Spokane Community College 46% 54% 2% 2% 2% 82% 3% 7% <1% 71% 29%Springfield Technical Community College 42% 58% <1% 2% 14% 60% 15% 7% 1% 46% 54%St. Charles Community College 39% 61% <1% 2% 4% 92% 2% 0% <1% 49% 51%St. Johns River Community College 37% 63% 1% 2% 9% 77% 5% 6% <1% 32% 68%St. Louis Community College at Forest Park 35% 65% <1% 3% 44% 38% 2% 10% 2% 33% 67%St. Louis Community College- Florissant Valley 34% 66% <1% 1% 48% 41% 1% 7% 1% 39% 61%Stark State College of Technology 42% 58% 1% 1% 10% 84% 1% 3% <1% 33% 67%Tacoma Community College 34% 66% 2% 7% 10% 61% 5% 13% 3% 55% 45%Tomball College 40% 60% <1% 6% 11% 55% 19% 4% 4% 18% 82%Tri-County Technical College 40% 60% <1% 1% 15% 80% 1% 1% 1% 53% 47%Trinity Valley Community College 42% 58% <1% <1% 13% 79% 7% 0% <1% 42% 58%Volunteer State Community College 37% 63% <1% 1% 9% 86% 2% 1% <1% 49% 51%Walters State Community College 37% 63% <1% 1% 4% 93% 1% 0% <1% 51% 49%Weatherford College 42% 58% 1% 1% 2% 81% 8% 6% 1% 50% 50%West Hills Community College District 39% 61% 1% 7% 7% 35% 43% 5% 1% 45% 55%West Kentucky Community and Technical College 49% 51% <1% 1% 7% 82% 1% 10% 0% 38% 62%
Gender Race/Ethnicity Enrollment Status
West Kentucky Community and Technical College 49% 51% 1% 1% 7% 82% 1% 10% 0% 38% 62%Western Iowa Tech Community College 44% 56% 2% 2% 2% 77% 6% 11% <1% 39% 61%Westmoreland County Community College 36% 64% <1% 1% 2% 89% 1% 7% 0% 43% 57%Wharton County Junior College 42% 58% <1% 4% 9% 59% 24% 1% 4% 44% 56%
Note: All population percentages acquired from the 2005 IPEDS dataset, if available.

Large Colleges
Male Female
American Indian or
Other Native American
Asian, Asian American or
Pacific Islander
Black or African
American, Non-Hispanic
White, Non-Hispanic
Hispanic, Latino, or Spanish
Other
International Student or
Foreign National
Full-Time Part-Time
All 2007 CCSSE Cohort Colleges 41% 59% 1% 6% 14% 59% 14% 5% 2% 37% 63%All Large Colleges 42% 58% 1% 5% 15% 57% 15% 4% 2% 36% 64%Anne Arundel Community College 38% 62% 1% 4% 14% 65% 3% 14% 1% 33% 67%Blinn College 48% 52% <1% 1% 8% 78% 11% 0% 1% 52% 48%Bluegrass Community and Technical College 43% 57% <1% 1% 10% 76% 2% 9% <1% 60% 40%Brevard Community College 39% 61% 1% 3% 9% 80% 7% <1% 1% 37% 63%Brookdale Community College 44% 56% <1% 4% 11% 73% 8% 3% 1% 54% 46%Brookhaven College 42% 58% 1% 12% 14% 45% 24% 3% 2% 27% 73%Bucks County Community College 42% 58% <1% 2% 3% 81% 2% 6% 6% 42% 58%Butler County Community College (KS) 40% 60% 1% 3% 9% 73% 5% 5% 3% 41% 59%Century College 42% 58% 1% 10% 8% 75% 2% 3% 1% 47% 53%Chandler-Gilbert Community College 44% 56% 2% 4% 3% 66% 15% 9% 1% 27% 73%Citrus College 44% 56% 1% 10% 6% 31% 42% 7% 4% 42% 58%College of Lake County 43% 57% <1% 6% 8% 60% 23% 0% 2% 29% 71%Community College of Denver 37% 63% 2% 6% 15% 44% 26% 2% 6% 23% 77%CyFair College 40% 60% <1% 6% 11% 55% 19% 4% 4% 18% 82%Daytona Beach Community College 37% 63% <1% 2% 12% 75% 7% 2% 1% 49% 51%Del Mar College 39% 61% <1% 2% 3% 36% 56% 4% 0% 31% 69%
Enrollment StatusGender Race/Ethnicity
Del Mar College 39% 61% 1% 2% 3% 36% 56% 4% 0% 31% 69%Delgado Community College 30% 70% 1% 2% 42% 37% 4% 11% 4% 44% 56%Delta College 44% 56% 1% 1% 7% 83% 4% 4% 1% 38% 62%Douglas College 37% 63% N/A N/A N/A N/A N/A N/A N/A 40% 60%Eastfield College 39% 61% 1% 4% 22% 47% 23% 2% <1% 28% 72%Edison College 38% 62% <1% 2% 10% 71% 13% 1% 3% 39% 61%Essex County College 37% 63% <1% 3% 50% 11% 18% 10% 8% 54% 46%Grand Rapids Community College 49% 51% 1% 2% 10% 79% 6% 2% 1% 44% 56%Greenville Technical College 39% 61% <1% 2% 22% 70% 3% 3% <1% 40% 60%Guilford Technical Community College 42% 58% <1% 2% 35% 56% 2% 2% 2% 37% 63%Harold Washington College 43% 57% 1% 13% 42% 25% 20% 0% 0% 44% 56%Hudson Valley Community College 51% 49% <1% 2% 8% 86% 3% 0% 1% 55% 45%Illinois Central College 44% 56% <1% 2% 10% 85% 2% 0% 1% 40% 60%Indian River Community College 38% 62% <1% 1% 13% 74% 9% 1% 1% 28% 72%Ivy Tech Community College - Central Indiana 42% 58% <1% 1% 22% 70% 2% 4% 1% 34% 66%J. Sargeant Reynolds Community College 39% 61% 1% 4% 31% 62% 2% 0% <1% 25% 75%Jefferson Community and Technical College 47% 53% <1% 1% 16% 60% 2% 20% <1% 33% 67%Joliet Jr College 41% 59% <1% 3% 11% 72% 14% 0% <1% 38% 62%Kingsborough Community College 41% 59% <1% 11% 30% 39% 14% 0% 7% 52% 48%LaGuardia Community College 36% 64% <1% 14% 20% 16% 35% 0% 15% 55% 45%Lane Community College 44% 56% 3% 3% 1% 77% 4% 11% 1% 49% 51%Laney College 42% 58% 1% 32% 29% 15% 12% 9% 3% 22% 78%Lorain County Community College 34% 66% 1% 1% 8% 82% 6% 2% 1% 38% 62%Manatee Community College 38% 62% <1% 2% 10% 77% 7% 2% 2% 39% 61%
Note: All population percentages acquired from the 2005 IPEDS dataset, if available.

Large Colleges
Male Female
American Indian or
Other Native American
Asian, Asian American or
Pacific Islander
Black or African
American, Non-Hispanic
White, Non-Hispanic
Hispanic, Latino, or Spanish
Other
International Student or
Foreign National
Full-Time Part-Time
All 2007 CCSSE Cohort Colleges 41% 59% 1% 6% 14% 59% 14% 5% 2% 37% 63%All Large Colleges 42% 58% 1% 5% 15% 57% 15% 4% 2% 36% 64%Merced College 38% 62% 1% 12% 6% 35% 39% 6% 1% 34% 66%Mercer County Community College 43% 57% <1% 5% 24% 48% 8% 10% 5% 38% 62%Metropolitan Community College 44% 56% 1% 3% 11% 79% 5% <1% 1% 38% 62%Middlesex Community College 40% 60% <1% 9% 5% 74% 9% 1% 1% 43% 57%Middlesex County College 45% 55% <1% 14% 9% 39% 16% 19% 3% 50% 50%Midlands Technical College 37% 63% 1% 2% 36% 55% 2% 4% <1% 44% 56%MiraCosta College 42% 58% 1% 8% 4% 56% 21% 8% 2% 32% 68%Montgomery College 40% 60% <1% 6% 11% 55% 19% 4% 4% 18% 82%Montgomery County Community College 43% 57% <1% 7% 10% 69% 3% 10% 2% 44% 56%Mt. Hood Community College 42% 58% 1% 6% 3% 79% 6% 5% <1% 38% 62%North Harris College 40% 60% <1% 6% 11% 55% 19% 4% 4% 18% 82%North Lake College 46% 54% <1% 11% 15% 42% 22% 2% 7% 32% 68%Northwest Vista College 43% 57% <1% 3% 5% 48% 43% 0% <1% 38% 62%Oakton Community College 44% 56% <1% 17% 5% 71% 7% 0% 0% 29% 71%Ocean County College 41% 59% <1% 2% 4% 82% 6% 5% <1% 48% 52%Oklahoma City Community College 43% 57% 6% 4% 9% 71% 6% 0% 4% 38% 62%
Gender Race/Ethnicity Enrollment Status
Oklahoma City Community College 43% 57% 6% 4% 9% 71% 6% 0% 4% 38% 62%Onondaga Community College 47% 53% 1% 2% 8% 68% 2% 20% <1% 56% 44%Paradise Valley Community College 40% 60% 1% 3% 2% 67% 10% 16% 1% 27% 73%Parkland College 46% 54% 1% 4% 13% 75% 3% 0% 4% 47% 53%Pensacola Junior College 39% 61% 1% 4% 13% 77% 3% <1% <1% 40% 60%Phoenix College 38% 62% 4% 2% 8% 35% 32% 18% 1% 24% 76%Prince George's Community College 35% 65% <1% 4% 78% 9% 4% 1% 4% 25% 75%Queensborough Community College 41% 59% <1% 19% 25% 25% 21% 0% 10% 49% 51%Richard J. Daley College 37% 63% <1% 1% 22% 11% 66% 0% 0% 35% 65%Richland College 45% 55% <1% 13% 19% 42% 18% 4% 5% 31% 69%San Jacinto College - Central Campus 43% 57% <1% 5% 6% 52% 34% <1% 3% 35% 65%San Jacinto College - South Campus 43% 57% <1% 9% 10% 47% 26% 1% 6% 38% 62%Schoolcraft College 43% 57% 1% 2% 8% 79% 2% 7% 1% 36% 64%Scottsdale Community College 45% 55% 4% 3% 3% 70% 10% 9% 2% 30% 70%Seminole Community College 39% 61% <1% 3% 12% 63% 13% 4% 5% 36% 64%Southwest Tennessee Community College 35% 65% 1% 1% 59% 36% 2% 1% 1% 49% 51%St. Louis Community College - Meramec 42% 58% <1% 3% 4% 81% 2% 9% 1% 46% 54%St. Philip's College 42% 58% 1% 2% 16% 33% 48% <1% <1% 43% 57%Taft College 78% 22% 1% 3% 7% 42% 43% 3% <1% 9% 91%Tallahassee Community College 44% 56% <1% 2% 33% 56% 6% 3% 1% 51% 49%Thomas Nelson Community College 41% 59% 1% 4% 31% 61% 4% 0% <1% 31% 69%Truckee Meadows Community College 44% 56% 2% 6% 3% 70% 12% 6% 1% 25% 75%Truman College 45% 55% <1% 11% 16% 21% 51% 0% 0% 18% 82%University of Wisconsin Colleges 45% 55% 1% 3% 1% 93% 2% 0% <1% 66% 34%
Note: All population percentages acquired from the 2005 IPEDS dataset, if available.

Large Colleges continued
Male Female
American Indian or
Other Native American
Asian, Asian American or
Pacific Islander
Black or African
American, Non-Hispanic
White, Non-Hispanic
Hispanic, Latino, or Spanish
Other
International Student or
Foreign National
Full-Time Part-Time
All 2007 CCSSE Cohort Colleges 41% 59% 1% 6% 14% 59% 14% 5% 2% 37% 63%All Large Colleges 42% 58% 1% 5% 15% 57% 15% 4% 2% 36% 64%Victor Valley College 39% 61% 1% 4% 13% 51% 27% 4% <1% 36% 64%Vincennes University 57% 43% <1% 1% 7% 81% 2% 8% 1% 52% 48%Virginia Western Community College 42% 58% <1% 2% 9% 88% 1% 0% <1% 24% 76%Westchester Community College 44% 56% 1% 5% 19% 52% 18% 4% 2% 47% 53%Wilbur Wright College 42% 58% 1% 7% 8% 35% 49% 0% 0% 26% 74%
Enrollment StatusGender Race/Ethnicity
Note: All population percentages acquired from the 2005 IPEDS dataset, if available.

Extra Large Colleges
Male Female
American Indian or
Other Native American
Asian, Asian American or
Pacific Islander
Black or African
American, Non-Hispanic
White, Non-Hispanic
Hispanic, Latino, or Spanish
Other
International Student or
Foreign National
Full-Time Part-Time
All 2007 CCSSE Cohort Colleges 41% 59% 1% 6% 14% 59% 14% 5% 2% 37% 63%All Extra Large Colleges 43% 57% 1% 9% 14% 47% 21% 5% 3% 34% 66%American River College 49% 51% 1% 11% 9% 51% 13% 14% <1% 27% 73%Austin Community College 43% 57% 1% 5% 7% 60% 23% 2% 2% 28% 72%Borough of Manhattan Community College 37% 63% <1% 10% 36% 13% 29% 0% 11% 58% 42%Broward Community College 38% 62% <1% 3% 27% 32% 23% 5% 9% 32% 68%City College of San Francisco 42% 58% <1% 40% 9% 23% 16% 9% 2% 20% 80%College of DuPage 45% 55% <1% 12% 6% 67% 14% 1% 0% 32% 68%Community College of Allegheny County 43% 57% 1% 1% 14% 72% 1% 11% 1% 41% 59%Community College of Philadelphia 33% 67% 1% 8% 51% 32% 6% <1% 2% 30% 70%Community College of Rhode Island 37% 63% 1% 3% 8% 65% 10% 14% <1% 36% 64%Community College of Southern Nevada 45% 55% 1% 12% 10% 48% 18% 11% <1% 24% 76%Cuyahoga Community College 36% 64% <1% 2% 30% 59% 3% 4% 2% 42% 58%De Anza College 48% 52% 1% 37% 5% 25% 14% 13% 5% 40% 60%El Paso Community College 39% 61% <1% 1% 3% 8% 85% 0% 3% 40% 60%Florida Community College at Jacksonville 37% 63% <1% 4% 23% 60% 5% 6% 2% 30% 70%Georgia Perimeter College 38% 62% <1% 9% 36% 46% 4% 0% 4% 45% 55%Glendale Community College 41% 59% <1% 15% 3% 52% 24% 3% 3% 31% 69%
Gender Race/Ethnicity Enrollment Status
Glendale Community College 41% 59% 1% 15% 3% 52% 24% 3% 3% 31% 69%Harper College 43% 57% <1% 12% 4% 60% 14% 8% 1% 41% 59%Hillsborough Community College 39% 61% <1% 4% 19% 55% 20% 1% 2% 32% 68%Houston Community College System 42% 58% <1% 12% 25% 23% 27% 3% 8% 31% 69%Johnson County Community College 46% 54% 1% 4% 5% 72% 4% 13% 1% 36% 64%Kirkwood Community College 46% 54% 1% 1% 4% 82% 2% 9% 1% 56% 44%Macomb Community College 48% 52% <1% 4% 5% 79% 1% 9% 1% 37% 63%Metropolitan Community College - Kansas City 39% 61% <1% 2% 11% 76% 3% 8% <1% 38% 62%Miami Dade College 38% 62% <1% 1% 21% 9% 64% 1% 3% 35% 65%Modesto Junior College 40% 60% 1% 9% 3% 47% 29% 11% <1% 37% 63%Montgomery College 45% 55% <1% 13% 26% 39% 13% <1% 8% 38% 62%Moraine Valley Community College 42% 58% <1% 2% 9% 76% 11% 0% 1% 42% 58%Mt. San Antonio College 45% 55% <1% 25% 6% 22% 42% 4% 1% 32% 68%Northern Virginia Community College 46% 54% 1% 14% 15% 56% 12% 0% 2% 34% 66%Oakland Community College 42% 58% 1% 3% 13% 64% 2% 8% 9% 32% 68%Palm Beach Community College 38% 62% <1% 3% 22% 54% 15% 3% 3% 31% 69%Palomar College 51% 49% 1% 9% 3% 57% 22% 6% 1% 32% 68%Pasadena City College 44% 56% 1% 30% 6% 17% 34% 10% 3% 29% 71%Salt Lake Community College 51% 49% 1% 4% 1% 79% 7% 6% 1% 34% 66%San Antonio College 40% 60% 1% 2% 4% 46% 45% 0% 1% 38% 62%San Diego Mesa College 46% 54% 1% 21% 6% 41% 17% 12% 1% 27% 73%Santa Ana College 58% 42% 1% 11% 3% 28% 43% 12% 1% 14% 86%Santa Fe Community College (FL) 46% 54% <1% 3% 13% 71% 8% 2% 3% 54% 46%Sinclair Community College 43% 57% <1% 2% 15% 73% 1% 8% 1% 39% 61%
Note: All population percentages acquired from the 2005 IPEDS dataset, if available.

Extra Large Colleges
Male Female
American Indian or
Other Native American
Asian, Asian American or
Pacific Islander
Black or African
American, Non-Hispanic
White, Non-Hispanic
Hispanic, Latino, or Spanish
Other
International Student or
Foreign National
Full-Time Part-Time
All 2007 CCSSE Cohort Colleges 41% 59% 1% 6% 14% 59% 14% 5% 2% 37% 63%All Extra Large Colleges 43% 57% 1% 9% 14% 47% 21% 5% 3% 34% 66%South Texas College 41% 59% <1% 1% <1% 3% 95% 0% <1% 38% 62%Southwestern Illinois College 43% 57% 1% 2% 18% 77% 3% 0% <1% 37% 63%St. Petersburg College 37% 63% 1% 3% 11% 76% 5% 3% 2% 32% 68%The Community College of Baltimore County 37% 63% <1% 4% 30% 57% 2% 5% 2% 36% 64%Tidewater Community College 39% 61% 1% 5% 30% 59% 4% 0% <1% 33% 67%Triton College 44% 56% <1% 4% 16% 52% 26% 1% <1% 24% 76%Valencia Community College 42% 58% <1% 5% 15% 48% 22% 7% 2% 40% 60%
Gender Race/Ethnicity Enrollment Status
Note: All population percentages acquired from the 2005 IPEDS dataset, if available.

Small Colleges
18 to 19 20 to 21 22 to 24 25 to 29 30 to 39 40 to 49 50 to 64 65+
All 2007 CCSSE Cohort Colleges 23% 18% 15% 14% 15% 9% 4% 1%All Small Colleges 25% 17% 13% 13% 16% 10% 5% 1%Abraham Baldwin Agricultural College 44% 21% 10% 8% 11% 5% 1% <1%Aiken Technical College 22% 22% 15% 14% 15% 8% 3% <1%Alabama Southern Community College 43% 21% 8% 8% 12% 5% 1% <1%Alexandria Technical College 45% 20% 11% 7% 8% 7% 3% <1%Allegany College of Maryland 33% 20% 12% 11% 12% 9% 2% <1%Alpena Community College 27% 23% 13% 11% 13% 8% 4% <1%Alvin Community College 26% 16% 15% 14% 16% 9% 3% <1%Ashland Community and Technical College 21% 18% 13% 15% 19% 10% 4% 1%Asnuntuck Community College 24% 15% 11% 10% 14% 16% 7% 1%Atlanta Metropolitan College 19% 21% 16% 18% 18% 6% 3% <1%Atlanta Technical College 10% 13% 15% 18% 22% 11% 7% 4%Bainbridge College 24% 13% 14% 14% 20% 11% 4% <1%B t C t C it C ll 24% 17% 15% 14% 16% 9% 4% 1%
Table 5Underlying Population Percentages by Age
Age
Barton County Community College 24% 17% 15% 14% 16% 9% 4% 1%Belmont Technical College 22% 18% 14% 15% 17% 10% 4% 0%Berkshire Community College 26% 17% 13% 12% 15% 12% 5% <1%Big Bend Community College 29% 15% 12% 12% 18% 9% 5% <1%Bismarck State College 28% 22% 14% 12% 12% 9% 3% <1%Blue Ridge Community College 28% 23% 15% 11% 12% 8% 4% <1%Bowling Green Technical College 15% 11% 11% 14% 22% 16% 9% 3%Brazosport College 27% 17% 15% 14% 16% 7% 2% <1%Butler County Community College (PA) 30% 18% 13% 10% 14% 10% 4% <1%Caldwell Community College and Technical Institute 21% 17% 13% 12% 19% 11% 6% 1%Cape Cod Community College 20% 19% 15% 13% 13% 12% 5% 1%Capital Community College 14% 13% 13% 16% 24% 14% 4% 1%Caritas Laboure College 5% 9% 16% 23% 29% 14% 4% 0%Carolinas College of Health Sciences 12% 15% 20% 21% 25% 6% <1% 0%Carroll Community College 35% 21% 13% 8% 12% 9% 3% <1%Carteret Community College 21% 16% 16% 14% 15% 12% 6% <1%Cascadia Community College 35% 23% 15% 9% 7% 6% 4% 1%Casper College 22% 18% 14% 12% 14% 10% 8% 1%Cecil Community College 34% 18% 11% 11% 13% 10% 3% <1%Cedar Valley College 25% 16% 15% 13% 18% 9% 4% 1%Central Lakes College 37% 18% 11% 10% 11% 9% 4% 1%Central Maine Community College 28% 18% 11% 11% 16% 11% 5% <1%Central Wyoming College 25% 14% 10% 14% 15% 12% 8% 2%Centralia College 18% 11% 10% 14% 19% 13% 10% 5%Chattahoochee Technical College 21% 20% 15% 13% 17% 11% 3% <1%Chesapeake College 30% 17% 12% 11% 15% 11% 4% <1%Chipola College 36% 20% 10% 11% 12% 7% 3% <1%
Note: All population percentages acquired from the 2005 IPEDS dataset, if available.

Small Colleges continued
18 to 19 20 to 21 22 to 24 25 to 29 30 to 39 40 to 49 50 to 64 65+
All 2007 CCSSE Cohort Colleges 23% 18% 15% 14% 15% 9% 4% 1%All Small Colleges 25% 17% 13% 13% 16% 10% 5% 1%Clarendon College 40% 16% 13% 15% 12% 3% 1% 0%Cleveland Community College 19% 12% 10% 12% 24% 15% 7% <1%Cleveland State Community College 24% 19% 12% 12% 18% 11% 3% <1%Clovis Community College 12% 12% 13% 14% 16% 15% 11% 7%Coastal Bend College 33% 16% 12% 12% 15% 9% 3% <1%Coastal Carolina Community College 20% 18% 17% 17% 17% 8% 3% <1%Coastal Georgia Community College 24% 17% 12% 14% 19% 10% 3% <1%College of the Mainland 20% 18% 19% 17% 16% 7% 3% <1%College of the Marshall Islands 20% 29% 22% 12% 12% 5% 1% 0%College of the Siskiyous 20% 12% 9% 10% 14% 14% 16% 5%Cumberland County College 27% 19% 14% 12% 14% 9% 3% 1%Dabney S. Lancaster Community College 30% 15% 10% 8% 17% 13% 6% <1%Danville Area Community College 28% 14% 11% 13% 16% 11% 6% <1%Danville Community College 25% 12% 9% 10% 17% 15% 11% <1%Darton College 23% 17% 14% 15% 17% 8% 3% 3%Delaware Technical & Community College - Owens Campus 24% 16% 13% 13% 18% 11% 5% <1%
Age
y g p % 6% 3% 3% 8% % 5% %Delaware Technical & Community College - Terry Campus 19% 13% 14% 14% 20% 14% 6% <1%Dyersburg State Community College 24% 18% 13% 14% 17% 10% 3% <1%East Georgia College 49% 24% 10% 7% 8% 3% 1% 0%Eastern New Mexico University - Roswell 15% 12% 12% 15% 20% 16% 9% 1%Eastern Shore Community College 30% 13% 10% 11% 16% 13% 7% <1%Eastern West Virginia Community & Technical College 23% 7% 7% 13% 23% 18% 9% <1%Eastern Wyoming College 31% 15% 9% 10% 13% 13% 8% 1%Edison State Community College 23% 15% 11% 13% 20% 12% 5% <1%Ellsworth Community College 45% 25% 9% 6% 6% 5% 3% <1%Fairmont State Community and Technical College 27% 17% 16% 12% 15% 9% 3% <1%Florida Keys Community College 17% 15% 12% 13% 17% 15% 10% 1%Fond du Lac Tribal and Community College 27% 16% 15% 14% 13% 11% 4% <1%Frank Phillips College 42% 18% 9% 11% 11% 6% 2% 0%Galveston College 21% 17% 15% 15% 17% 10% 4% 1%Garrett College 38% 20% 12% 9% 10% 8% 2% 1%Gateway Community and Technical College 18% 15% 13% 14% 18% 14% 8% 1%Georgia Highlands College 35% 22% 14% 10% 12% 6% 1% 0%Gordon College 47% 24% 9% 6% 8% 4% 1% <1%Grays Harbor College 18% 11% 8% 10% 17% 13% 13% 9%Grayson County College 29% 16% 13% 12% 15% 10% 4% <1%Greenfield Community College 21% 18% 15% 14% 14% 12% 5% <1%Hagerstown Community College 31% 16% 11% 11% 15% 10% 4% 1%Hawaii Community College 27% 18% 13% 13% 12% 10% 5% 1%
Note: All population percentages acquired from the 2005 IPEDS dataset, if available.

Small Colleges continued
18 to 19 20 to 21 22 to 24 25 to 29 30 to 39 40 to 49 50 to 64 65+
All 2007 CCSSE Cohort Colleges 23% 18% 15% 14% 15% 9% 4% 1%All Small Colleges 25% 17% 13% 13% 16% 10% 5% 1%Hazard Community and Technical College 24% 17% 13% 11% 18% 11% 5% 1%Henderson Community College 16% 12% 12% 12% 19% 16% 12% 1%Hesston College 61% 15% 8% 5% 6% 4% 1% 0%Hibbing Community College 31% 19% 14% 11% 12% 9% 3% 0%Honolulu Community College 25% 18% 17% 16% 14% 7% 3% <1%Hopkinsville Community College 18% 14% 13% 18% 22% 10% 3% 3%Howard College 27% 18% 14% 14% 15% 8% 2% <1%Illinois Valley Community College 29% 16% 12% 12% 14% 10% 5% 1%Isothermal Community College 21% 12% 8% 12% 22% 16% 9% <1%Itasca Community College 46% 19% 8% 7% 10% 7% 3% <1%Ivy Tech Community College - Bloomington 19% 18% 16% 15% 18% 11% 4% <1%Ivy Tech Community College - Columbus 15% 15% 13% 17% 22% 13% 5% <1%Ivy Tech Community College - Elkhart 11% 14% 15% 21% 21% 12% 6% <1%Ivy Tech Community College - Evansville 14% 17% 18% 17% 19% 10% 4% <1%Ivy Tech Community College - Kokomo 14% 14% 13% 18% 22% 13% 6% 1%Ivy Tech Community College - Lawrenceburg 19% 14% 13% 17% 19% 13% 4% <1%
Age
y ec Co u ty Co ege a e cebu g 9% % 3% % 9% 3% % %Ivy Tech Community College - Logansport 14% 14% 13% 18% 22% 13% 6% 1%Ivy Tech Community College - Madison 19% 14% 13% 17% 19% 13% 4% <1%Ivy Tech Community College - Sellersburg 12% 15% 17% 20% 22% 10% 3% <1%Ivy Tech Community College - South Bend 11% 14% 15% 21% 21% 12% 6% <1%Ivy Tech Community College - Terre Haute 19% 16% 15% 17% 20% 10% 3% <1%Ivy Tech Community College - Warsaw 11% 14% 15% 21% 21% 12% 6% <1%Ivy Tech Community College - Whitewater 15% 11% 14% 17% 27% 11% 5% <1%Jackson State Community College 25% 20% 15% 13% 16% 9% 3% <1%James A. Rhodes State College 20% 18% 15% 17% 19% 9% 2% <1%Jefferson Community College 23% 20% 14% 13% 16% 10% 5% <1%Kankakee Community College 25% 16% 12% 12% 16% 11% 7% 1%Kauai Community College 30% 18% 12% 11% 12% 8% 8% 1%Kenai Peninsula College-UAA 14% 11% 11% 12% 17% 16% 16% 3%Kennebec Valley Community College 12% 14% 12% 15% 21% 18% 9% <1%Kirtland Community College 23% 15% 12% 14% 17% 14% 4% <1%Kodiak College, University of Alaska Anchorage 10% 8% 7% 12% 19% 19% 21% 4%Kuskokwim Campus, University of Alaska Fairbanks 11% 13% 11% 17% 17% 19% 12% 1%L. E. Fletcher Technical Community College 20% 22% 16% 14% 14% 10% 4% 0%Lake City Community College 29% 20% 15% 12% 14% 7% 3% <1%Lake Region State College 30% 18% 15% 11% 13% 10% 4% <1%Lake-Sumter Community College 33% 20% 11% 10% 14% 9% 3% <1%Lamar Institute of Technology 23% 19% 18% 16% 15% 7% 2% <1%Lamar State College - Orange 26% 17% 16% 14% 17% 9% 3% <1%
Note: All population percentages acquired from the 2005 IPEDS dataset, if available.

Small Colleges continued
18 to 19 20 to 21 22 to 24 25 to 29 30 to 39 40 to 49 50 to 64 65+
All 2007 CCSSE Cohort Colleges 23% 18% 15% 14% 15% 9% 4% 1%All Small Colleges 25% 17% 13% 13% 16% 10% 5% 1%Laramie County Community College 26% 17% 15% 13% 14% 9% 5% 1%Leech Lake Tribal College 2% 8% 12% 17% 32% 22% 4% 2%Louisburg College 75% 22% 3% <1% <1% 0% 0% 0%Louisiana Delta Community College 14% 22% 24% 14% 13% 9% 3% <1%Louisiana Technical College - Region 2 14% 14% 11% 25% 20% 11% 5% <1%Louisiana Technical College - Region 3 18% 18% 11% 22% 18% 9% 4% <1%Louisiana Technical College - Region 4 26% 23% 13% 18% 12% 5% 2% <1%Louisiana Technical College - Region 6 18% 14% 12% 24% 18% 9% 4% <1%Louisiana Technical College - Region 7 18% 14% 11% 23% 20% 9% 4% <1%Louisiana Technical College - Region 8 17% 14% 12% 25% 19% 8% 4% <1%Louisiana Technical College - Region 9 24% 16% 14% 21% 13% 8% 3% <1%Lower Columbia College 26% 11% 10% 13% 17% 9% 8% 6%Madisonville Community College 21% 15% 12% 15% 19% 12% 6% <1%Marshall Community and Technical College 17% 14% 11% 12% 25% 16% 7% 0%Marshalltown Community College 35% 20% 11% 12% 12% 7% 3% <1%Martin Community College 17% 14% 9% 16% 20% 15% 8% <1%
Age
Martin Community College 17% 14% 9% 16% 20% 15% 8% 1%Maui Community College 25% 18% 14% 13% 15% 10% 6% <1%Mayland Community College 20% 14% 10% 14% 21% 13% 7% <1%Maysville Community & Technical College 21% 10% 10% 14% 22% 14% 8% 1%Mercy College of Health Sciences 12% 25% 19% 23% 12% 6% 3% 0%Mesabi Range Community and Technical College 37% 16% 12% 13% 12% 6% 3% <1%Mid Michigan Community College 26% 24% 17% 11% 11% 7% 2% <1%Middle Georgia College 45% 21% 9% 9% 11% 4% 1% <1%Middlesex Community College 25% 17% 13% 13% 15% 11% 5% 1%Mid-South Community College 22% 14% 13% 13% 19% 13% 5% 1%Minot State University-Bottineau 28% 21% 12% 12% 12% 9% 6% 0%Montana State University Billings 27% 19% 14% 15% 14% 9% 3% <1%Motlow State Community College 36% 20% 12% 11% 13% 7% 2% <1%Mount Wachusett Community College 23% 19% 14% 12% 16% 12% 5% <1%Mountain Empire Community College 28% 14% 10% 12% 16% 11% 8% 1%New Hampshire Technical Institute 32% 19% 11% 11% 13% 10% 3% 0%New Mexico Junior College 34% 17% 12% 12% 14% 7% 4% <1%New Mexico Military Institute 76% 22% 2% 0% 0% 0% 0% 0%New Mexico State University - Grants 17% 10% 13% 16% 21% 15% 8% 1%New Mexico State University at Alamogordo 18% 12% 15% 16% 19% 13% 6% 2%New River Community and Technical College 20% 16% 13% 17% 19% 11% 4% <1%New River Community College 22% 21% 17% 11% 16% 8% 4% <1%NH Community Technical College - Berlin 24% 16% 9% 10% 18% 14% 8% 1%NH Community Technical College - Claremont 23% 17% 11% 12% 18% 14% 5% 0%
Note: All population percentages acquired from the 2005 IPEDS dataset, if available.

Small Colleges continued
18 to 19 20 to 21 22 to 24 25 to 29 30 to 39 40 to 49 50 to 64 65+
All 2007 CCSSE Cohort Colleges 23% 18% 15% 14% 15% 9% 4% 1%All Small Colleges 25% 17% 13% 13% 16% 10% 5% 1%NH Community Technical College - Laconia 24% 16% 9% 10% 18% 14% 8% 1%NH Community Technical College - Manchester 26% 18% 13% 11% 15% 12% 4% <1%NH Community Technical College - Nashua 23% 17% 11% 12% 18% 14% 5% 0%NH Community Technical College - Stratham 26% 18% 13% 11% 15% 12% 4% <1%North Arkansas College 30% 14% 9% 12% 17% 12% 5% 1%North Central Missouri College 37% 14% 7% 13% 15% 11% 3% <1%North Central State College 17% 17% 15% 17% 18% 11% 4% <1%North Dakota State College of Science 40% 27% 11% 7% 6% 6% 3% <1%North Florida Community College 35% 17% 10% 9% 12% 10% 6% 1%North Iowa Area Community College 39% 22% 10% 8% 8% 7% 4% 2%Northeast Lakeview College 21% 20% 17% 17% 14% 8% 2% <1%Northeast Mississippi Community College 51% 18% 10% 7% 8% 5% 1% <1%Northeast Texas Community College 31% 22% 12% 10% 14% 7% 4% 1%Northern Maine Community College 17% 21% 15% 12% 19% 12% 3% <1%Northern New Mexico Community College 14% 9% 10% 12% 20% 17% 15% 3%Northwest College 28% 26% 13% 9% 10% 8% 6% 1%
Age
Northwest College 28% 26% 13% 9% 10% 8% 6% 1%Northwest Indian College 8% 11% 9% 13% 25% 16% 14% 3%Northwest Iowa Community College 42% 22% 12% 8% 9% 5% 2% <1%Northwestern Connecticut Community College 24% 16% 12% 10% 12% 11% 7% 8%Nunez Community College 14% 15% 17% 17% 20% 10% 6% 1%Oregon Coast Community College 17% 13% 13% 12% 17% 15% 11% 2%Ouachita Technical College 26% 16% 11% 14% 20% 10% 2% <1%Panola College 21% 28% 16% 12% 14% 7% 2% <1%Paris Junior College 35% 17% 12% 10% 14% 9% 3% <1%Patrick Henry Community College 22% 10% 10% 12% 19% 16% 9% 1%Paul D. Camp Community College 23% 15% 12% 12% 17% 13% 6% 1%Piedmont Virginia Community College 25% 17% 14% 13% 14% 10% 6% 1%Prince William Sound Community College 10% 5% 7% 9% 23% 20% 25% 2%Quinebaug Valley Community College 25% 18% 13% 11% 14% 13% 6% 1%Rainy River Community College 42% 16% 7% 6% 8% 6% 4% 10%Ranger College 57% 21% 5% 7% 6% 3% 2% <1%Rappahannock Community College 32% 15% 10% 10% 15% 12% 5% 1%Reading Area Community College 22% 16% 14% 14% 18% 12% 3% <1%Redlands Community College 25% 18% 12% 13% 16% 12% 4% 1%River Parishes Community College 34% 20% 14% 11% 11% 7% 3% 0%Riverland Community College 25% 14% 11% 12% 16% 13% 8% 2%Roxbury Community College 10% 13% 15% 19% 24% 14% 3% 2%Salem Community College 23% 17% 12% 14% 17% 12% 5% <1%Salish Kootenai College 12% 16% 16% 17% 19% 11% 8% 1%
Note: All population percentages acquired from the 2005 IPEDS dataset, if available.

Small Colleges continued
18 to 19 20 to 21 22 to 24 25 to 29 30 to 39 40 to 49 50 to 64 65+
All 2007 CCSSE Cohort Colleges 23% 18% 15% 14% 15% 9% 4% 1%All Small Colleges 25% 17% 13% 13% 16% 10% 5% 1%Santa Fe Community College (NM) 12% 10% 10% 14% 19% 16% 15% 4%Sheridan College 28% 18% 11% 12% 12% 10% 7% 2%South Florida Community College 37% 20% 11% 9% 12% 8% 4% <1%South Georgia College 44% 22% 10% 8% 10% 5% 1% 0%South Louisiana Community College 29% 21% 17% 12% 11% 8% 3% <1%South Mountain Community College 19% 12% 11% 12% 18% 15% 11% 2%South Piedmont Community College 16% 10% 11% 14% 24% 17% 7% <1%Southeastern Community College (IA) 28% 21% 12% 12% 14% 9% 4% <1%Southeastern Community College (NC) 26% 16% 13% 14% 16% 9% 4% 1%Southeastern Technical College 15% 15% 16% 17% 20% 13% 4% <1%Southern Maine Community College 23% 23% 15% 14% 13% 9% 4% <1%Southern University at Shreveport 15% 16% 16% 18% 19% 11% 5% <1%Southern West Virginia Community and Technical College 28% 21% 13% 12% 15% 7% 3% <1%Southwest Texas Junior College 28% 19% 14% 15% 15% 6% 2% <1%Southwest Virginia Community College 22% 12% 11% 11% 19% 12% 9% 2%Southwestern Community College 22% 16% 13% 15% 18% 11% 5% <1%
Age
Southwestern Community College 22% 16% 13% 15% 18% 11% 5% 1%Southwestern Indian Polytechnic Institute 18% 18% 18% 16% 14% 10% 5% 0%Southwestern Oregon Community College 33% 13% 10% 13% 13% 11% 6% 1%SOWELA Technical Community College 20% 23% 19% 14% 14% 7% 3% <1%Spoon River College 29% 19% 13% 12% 14% 9% 4% <1%Surry Community College 32% 15% 10% 11% 16% 11% 4% 1%Tanana Valley Campus, University of Alaska Fairbanks 20% 16% 15% 15% 15% 11% 8% 1%Technical College of the Lowcountry 15% 15% 16% 18% 20% 11% 4% 1%Temple College 30% 17% 14% 13% 14% 9% 3% <1%Texas State Technical College Harlingen 28% 19% 16% 14% 14% 5% 3% <1%Texas State Technical College Marshall 24% 23% 16% 17% 12% 7% 2% 0%Texas State Technical College Waco 32% 23% 16% 13% 10% 4% 2% <1%Texas State Technical College West Texas 27% 15% 14% 15% 14% 10% 4% <1%The Community and Technical College at WVU Tech 19% 21% 17% 14% 17% 8% 3% 0%The Community and Technical College of Shepherd 10% 8% 8% 10% 22% 24% 18% 1%The Victoria College 29% 17% 16% 14% 14% 7% 2% <1%Three Rivers Community College 24% 15% 13% 15% 17% 12% 4% <1%Tompkins Cortland Community College 30% 22% 12% 12% 12% 8% 3% <1%Tri-County Community College 23% 14% 11% 15% 16% 13% 8% 1%Tunxis Community College 24% 18% 15% 14% 15% 10% 4% 1%University of Alaska Matanuska Susitna College 17% 15% 12% 12% 18% 14% 10% 1%University of Alaska Southeast Ketchikan campus 12% 10% 12% 15% 21% 17% 12% 1%University of Arkansas Community College at Batesville 21% 14% 13% 16% 21% 11% 4% 0%University of Arkansas Community College at Hope 27% 14% 14% 14% 16% 11% 4% 0%
Note: All population percentages acquired from the 2005 IPEDS dataset, if available.

Small Colleges continued
18 to 19 20 to 21 22 to 24 25 to 29 30 to 39 40 to 49 50 to 64 65+
All 2007 CCSSE Cohort Colleges 23% 18% 15% 14% 15% 9% 4% 1%All Small Colleges 25% 17% 13% 13% 16% 10% 5% 1%University of Cincinnati Clermont College 26% 20% 15% 14% 14% 8% 3% <1%University of New Mexico - Gallup 20% 14% 11% 14% 19% 14% 8% 1%University of New Mexico - Taos Branch 14% 9% 8% 13% 17% 18% 19% 2%University of New Mexico - Valencia Campus 22% 17% 13% 13% 14% 13% 7% 1%Vermilion Community College 53% 23% 10% 4% 5% 3% 2% 1%Vernon College 16% 22% 16% 16% 19% 8% 3% <1%Virginia Highlands Community College 28% 17% 12% 12% 16% 9% 5% <1%Warren County Community College 29% 17% 12% 11% 15% 12% 4% <1%Washington State Community College 25% 16% 13% 15% 16% 10% 4% 1%Waycross College 31% 17% 10% 13% 21% 7% 1% <1%Wayne Community College 24% 17% 13% 14% 17% 10% 4% <1%Wenatchee Valley College 27% 15% 13% 12% 15% 11% 6% 2%West Virginia Northern Community College 18% 14% 13% 16% 21% 12% 5% 1%West Virginia State Community and Technical College 17% 17% 16% 15% 19% 10% 5% <1%West Virginia University at Parkersburg 21% 17% 15% 16% 17% 10% 4% <1%Western Nebraska Community College 27% 13% 12% 13% 13% 13% 9% 1%
Age
Western Nebraska Community College 27% 13% 12% 13% 13% 13% 9% 1%Western Piedmont Community College 18% 13% 12% 15% 22% 14% 6% <1%Western Texas College 29% 14% 15% 13% 16% 9% 3% <1%Western Wyoming Community College 22% 14% 11% 13% 15% 14% 8% 2%Williston State College 28% 18% 13% 12% 15% 10% 3% 0%Windward Community College 30% 21% 15% 11% 11% 7% 5% 1%Wisconsin Indianhead Technical College 22% 14% 12% 13% 18% 15% 6% 1%Wor-Wic Community College 25% 16% 15% 14% 16% 10% 4% <1%Wytheville Community College 25% 14% 9% 11% 18% 13% 9% 1%York Technical College 27% 18% 13% 12% 17% 9% 3% <1%Zane State College 20% 21% 15% 15% 17% 9% 3% <1%
Note: All population percentages acquired from the 2005 IPEDS dataset, if available.

Medium Colleges
18 to 19 20 to 21 22 to 24 25 to 29 30 to 39 40 to 49 50 to 64 65+
All 2007 CCSSE Cohort Colleges 23% 18% 15% 14% 15% 9% 4% 1%All Medium Colleges 24% 18% 14% 13% 16% 10% 4% 1%Angelina College 22% 25% 17% 14% 14% 7% 3% <1%Anoka-Ramsey Community College 36% 19% 12% 11% 12% 7% 2% <1%Asheville-Buncombe Technical Community College 20% 15% 13% 16% 18% 11% 6% <1%Baltimore City Community College 16% 12% 13% 17% 20% 14% 6% 2%Baton Rouge Community College 31% 23% 18% 12% 11% 4% 1% <1%Big Sandy Community and Technical College 26% 17% 12% 12% 17% 10% 5% 1%Black Hawk College 28% 16% 12% 14% 15% 10% 4% <1%Bossier Parish Community College 25% 20% 15% 15% 15% 7% 3% <1%Bristol Community College 29% 19% 13% 12% 15% 9% 3% <1%Bunker Hill Community College 14% 16% 19% 18% 20% 10% 3% <1%Burlington County College 29% 21% 13% 11% 12% 10% 4% <1%Cape Fear Community College 26% 22% 16% 13% 11% 7% 3% <1%Central Arizona College 18% 10% 10% 12% 20% 16% 10% 3%Central Community College 24% 16% 11% 12% 16% 13% 8% 1%Central Florida Community College 28% 20% 14% 12% 14% 10% 4% <1%Central Virginia Community College 24% 14% 12% 11% 17% 13% 7% 1%
Age
Ce t a g a Co u ty Co ege % % % % % 3% % %Chattanooga State Technical Community College 19% 17% 15% 15% 17% 10% 5% 1%Cochise College 22% 14% 12% 15% 16% 13% 8% 2%College of Alameda 18% 17% 16% 15% 16% 9% 7% 1%College of Southern Idaho 21% 16% 11% 12% 13% 10% 9% 9%College of Southern Maryland 32% 19% 12% 10% 14% 11% 3% <1%College of the Redwoods 21% 16% 14% 15% 13% 11% 8% 1%Colorado Mountain College 20% 13% 11% 13% 15% 13% 11% 2%Columbia State Community College 26% 20% 15% 13% 15% 8% 3% <1%Corning Community College 35% 18% 11% 10% 13% 9% 3% <1%Delaware Technical & Community College - Stanton-Wilmington 22% 18% 15% 14% 16% 11% 4% <1%Dona Ana Community College 29% 18% 14% 13% 13% 8% 4% <1%Durham Technical Community College 10% 11% 14% 18% 26% 15% 6% <1%El Centro College 18% 14% 15% 17% 21% 11% 4% <1%Elizabethtown Community & Technical College 22% 17% 12% 13% 18% 13% 5% <1%Estrella Mountain Community College 25% 13% 12% 13% 18% 11% 6% 1%Everett Community College 28% 16% 12% 12% 17% 10% 5% <1%Frederick Community College 24% 13% 11% 13% 19% 14% 5% 1%Gainesville College 42% 27% 13% 7% 6% 3% 1% <1%Gateway Community College 20% 15% 14% 15% 18% 12% 5% 1%Genesee Community College 36% 18% 11% 9% 13% 9% 3% <1%George C Wallace State Community College 28% 20% 11% 13% 15% 8% 3% 1%Georgia Military College 26% 21% 14% 13% 15% 8% 2% <1%Germanna Community College 32% 18% 13% 11% 14% 9% 2% <1%
Note: All population percentages acquired from the 2005 IPEDS dataset, if available.
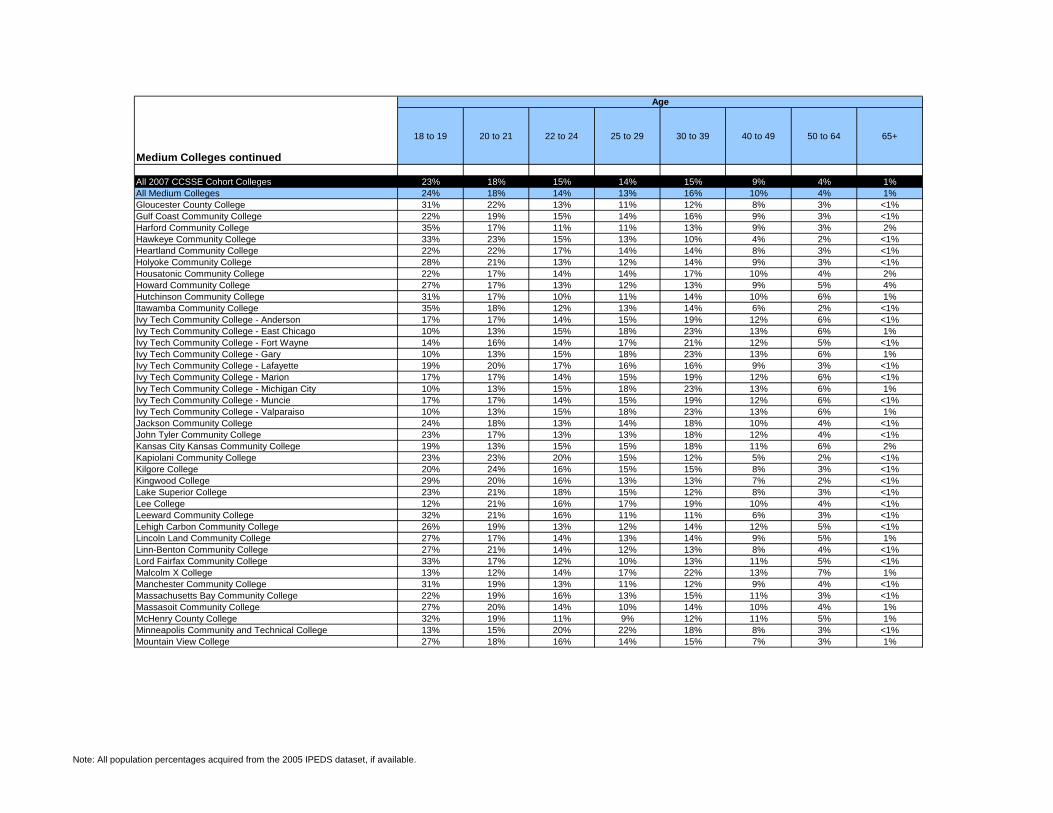
Medium Colleges continued
18 to 19 20 to 21 22 to 24 25 to 29 30 to 39 40 to 49 50 to 64 65+
All 2007 CCSSE Cohort Colleges 23% 18% 15% 14% 15% 9% 4% 1%All Medium Colleges 24% 18% 14% 13% 16% 10% 4% 1%Gloucester County College 31% 22% 13% 11% 12% 8% 3% <1%Gulf Coast Community College 22% 19% 15% 14% 16% 9% 3% <1%Harford Community College 35% 17% 11% 11% 13% 9% 3% 2%Hawkeye Community College 33% 23% 15% 13% 10% 4% 2% <1%Heartland Community College 22% 22% 17% 14% 14% 8% 3% <1%Holyoke Community College 28% 21% 13% 12% 14% 9% 3% <1%Housatonic Community College 22% 17% 14% 14% 17% 10% 4% 2%Howard Community College 27% 17% 13% 12% 13% 9% 5% 4%Hutchinson Community College 31% 17% 10% 11% 14% 10% 6% 1%Itawamba Community College 35% 18% 12% 13% 14% 6% 2% <1%Ivy Tech Community College - Anderson 17% 17% 14% 15% 19% 12% 6% <1%Ivy Tech Community College - East Chicago 10% 13% 15% 18% 23% 13% 6% 1%Ivy Tech Community College - Fort Wayne 14% 16% 14% 17% 21% 12% 5% <1%Ivy Tech Community College - Gary 10% 13% 15% 18% 23% 13% 6% 1%Ivy Tech Community College - Lafayette 19% 20% 17% 16% 16% 9% 3% <1%Ivy Tech Community College - Marion 17% 17% 14% 15% 19% 12% 6% <1%
Age
y ec Co u ty Co ege a o % % % 5% 9% % 6% %Ivy Tech Community College - Michigan City 10% 13% 15% 18% 23% 13% 6% 1%Ivy Tech Community College - Muncie 17% 17% 14% 15% 19% 12% 6% <1%Ivy Tech Community College - Valparaiso 10% 13% 15% 18% 23% 13% 6% 1%Jackson Community College 24% 18% 13% 14% 18% 10% 4% <1%John Tyler Community College 23% 17% 13% 13% 18% 12% 4% <1%Kansas City Kansas Community College 19% 13% 15% 15% 18% 11% 6% 2%Kapiolani Community College 23% 23% 20% 15% 12% 5% 2% <1%Kilgore College 20% 24% 16% 15% 15% 8% 3% <1%Kingwood College 29% 20% 16% 13% 13% 7% 2% <1%Lake Superior College 23% 21% 18% 15% 12% 8% 3% <1%Lee College 12% 21% 16% 17% 19% 10% 4% <1%Leeward Community College 32% 21% 16% 11% 11% 6% 3% <1%Lehigh Carbon Community College 26% 19% 13% 12% 14% 12% 5% <1%Lincoln Land Community College 27% 17% 14% 13% 14% 9% 5% 1%Linn-Benton Community College 27% 21% 14% 12% 13% 8% 4% <1%Lord Fairfax Community College 33% 17% 12% 10% 13% 11% 5% <1%Malcolm X College 13% 12% 14% 17% 22% 13% 7% 1%Manchester Community College 31% 19% 13% 11% 12% 9% 4% <1%Massachusetts Bay Community College 22% 19% 16% 13% 15% 11% 3% <1%Massasoit Community College 27% 20% 14% 10% 14% 10% 4% 1%McHenry County College 32% 19% 11% 9% 12% 11% 5% 1%Minneapolis Community and Technical College 13% 15% 20% 22% 18% 8% 3% <1%Mountain View College 27% 18% 16% 14% 15% 7% 3% 1%
Note: All population percentages acquired from the 2005 IPEDS dataset, if available.

Medium Colleges continued
18 to 19 20 to 21 22 to 24 25 to 29 30 to 39 40 to 49 50 to 64 65+
All 2007 CCSSE Cohort Colleges 23% 18% 15% 14% 15% 9% 4% 1%All Medium Colleges 24% 18% 14% 13% 16% 10% 4% 1%Nashville State Technical Community College 7% 15% 18% 20% 22% 12% 6% <1%Naugatuck Valley Community College 26% 18% 14% 12% 15% 10% 4% 1%Navarro College 37% 17% 12% 11% 13% 7% 2% <1%North Hennepin Community College 23% 17% 16% 15% 18% 8% 3% <1%North Shore Community College 24% 18% 14% 13% 15% 11% 5% 1%Northampton Community College 28% 18% 12% 12% 15% 11% 4% <1%Northeast Iowa Community College 36% 18% 12% 11% 11% 9% 3% <1%Northeast State Technical Community College 23% 19% 13% 12% 20% 10% 3% <1%Northern Essex Community College 18% 19% 15% 13% 16% 13% 5% <1%Northern Oklahoma College 31% 22% 15% 11% 11% 6% 2% <1%NorthWest Arkansas Community College 25% 20% 17% 15% 14% 6% 2% <1%Norwalk Community College 20% 16% 14% 13% 15% 11% 6% 5%Okaloosa-Walton College 22% 20% 17% 15% 13% 10% 3% <1%Olympic College 22% 14% 14% 15% 17% 13% 5% <1%Owensboro Community and Technical College 24% 16% 12% 12% 17% 12% 6% 1%Palo Alto College 25% 20% 17% 14% 15% 7% 2% <1%
Age
Palo Alto College 25% 20% 17% 14% 15% 7% 2% 1%Pasco-Hernando Community College 27% 18% 13% 12% 16% 9% 3% <1%Pellissippi State Technical Community College 23% 22% 19% 14% 13% 7% 2% <1%Pitt Community College 26% 19% 15% 13% 14% 9% 4% <1%Polk Community College 27% 20% 13% 13% 14% 9% 4% <1%Prairie State College 21% 16% 13% 14% 17% 12% 7% 1%Pueblo Community College 16% 13% 13% 18% 21% 13% 6% <1%Quinsigamond Community College 27% 20% 14% 12% 15% 10% 2% <1%Raritan Valley Community College 24% 21% 15% 11% 12% 10% 5% <1%Red Rocks Community College 20% 15% 14% 13% 18% 13% 7% 1%Rend Lake College 27% 11% 8% 12% 15% 11% 11% 4%Roane State Community College 25% 18% 13% 14% 17% 9% 3% <1%Rochester Community and Technical College 31% 19% 15% 13% 13% 8% 2% <1%Rowan-Cabarrus Community College 23% 15% 12% 12% 18% 13% 7% <1%San Jacinto College - North Campus 12% 27% 21% 16% 14% 7% 3% 0%San Juan College 17% 15% 15% 15% 18% 13% 6% 1%Shelton State Community College 29% 25% 15% 11% 12% 6% 2% <1%Skagit Valley College 21% 14% 11% 12% 15% 10% 9% 8%Somerset Community College 23% 15% 13% 14% 18% 12% 6% 1%South Puget Sound Community College 25% 17% 13% 13% 17% 10% 4% <1%South Seattle Community College 9% 9% 11% 16% 25% 18% 10% 1%South Suburban College 18% 14% 12% 14% 20% 14% 8% 1%Southeast Kentucky Community & Technical College 23% 15% 10% 11% 15% 14% 11% 2%Southside Virginia Community College 21% 13% 12% 11% 18% 15% 10% 1%
Note: All population percentages acquired from the 2005 IPEDS dataset, if available.

Medium Colleges continued
18 to 19 20 to 21 22 to 24 25 to 29 30 to 39 40 to 49 50 to 64 65+
All 2007 CCSSE Cohort Colleges 23% 18% 15% 14% 15% 9% 4% 1%All Medium Colleges 24% 18% 14% 13% 16% 10% 4% 1%Spokane Community College 18% 15% 16% 18% 18% 10% 5% <1%Springfield Technical Community College 20% 18% 15% 14% 18% 11% 4% 1%St. Charles Community College 35% 21% 13% 9% 11% 8% 2% <1%St. Johns River Community College 30% 20% 13% 11% 14% 9% 3% <1%St. Louis Community College at Forest Park 14% 16% 17% 18% 19% 10% 5% <1%St. Louis Community College- Florissant Valley 20% 20% 15% 14% 16% 10% 4% <1%Stark State College of Technology 13% 18% 16% 17% 19% 12% 5% <1%Tacoma Community College 22% 16% 14% 15% 17% 11% 4% <1%Tomball College 29% 20% 16% 13% 13% 7% 2% <1%Tri-County Technical College 30% 20% 13% 12% 14% 7% 3% <1%Trinity Valley Community College 25% 17% 11% 13% 19% 10% 3% <1%Volunteer State Community College 26% 19% 15% 13% 16% 8% 3% <1%Walters State Community College 30% 17% 11% 12% 19% 8% 3% 1%Weatherford College 40% 19% 10% 9% 12% 7% 2% <1%West Hills Community College District 27% 18% 15% 14% 15% 7% 3% 2%West Kentucky Community and Technical College 21% 13% 10% 12% 18% 14% 10% 2%
Age
West Kentucky Community and Technical College 21% 13% 10% 12% 18% 14% 10% 2%Western Iowa Tech Community College 28% 16% 13% 14% 16% 9% 3% <1%Westmoreland County Community College 21% 20% 14% 12% 15% 12% 6% <1%Wharton County Junior College 35% 25% 15% 10% 8% 5% 2% <1%
Note: All population percentages acquired from the 2005 IPEDS dataset, if available.

Large Colleges
18 to 19 20 to 21 22 to 24 25 to 29 30 to 39 40 to 49 50 to 64 65+
All 2007 CCSSE Cohort Colleges 23% 18% 15% 14% 15% 9% 4% 1%All Large Colleges 24% 19% 16% 14% 14% 9% 4% 1%Anne Arundel Community College 29% 18% 13% 11% 13% 9% 5% 2%Blinn College 41% 29% 15% 7% 5% 2% 1% <1%Bluegrass Community and Technical College 22% 25% 18% 14% 12% 6% 2% <1%Brevard Community College 27% 20% 14% 11% 13% 10% 4% <1%Brookdale Community College 32% 22% 13% 9% 10% 8% 4% 2%Brookhaven College 18% 17% 18% 18% 15% 7% 3% 4%Bucks County Community College 29% 21% 14% 10% 11% 10% 4% <1%Butler County Community College (KS) 29% 18% 14% 13% 14% 9% 4% <1%Century College 29% 21% 16% 13% 12% 7% 2% <1%Chandler-Gilbert Community College 31% 18% 14% 11% 14% 8% 4% 1%Citrus College 32% 22% 16% 11% 10% 6% 3% 1%College of Lake County 21% 16% 13% 13% 17% 13% 6% 1%Community College of Denver 22% 16% 16% 18% 16% 9% 3% <1%CyFair College 29% 20% 16% 13% 13% 7% 2% <1%Daytona Beach Community College 23% 19% 14% 13% 15% 10% 5% <1%Del Mar College 20% 20% 17% 17% 16% 8% 3% <1%
Age
e a Co ege 0% 0% % % 6% 8% 3% %Delgado Community College 14% 18% 19% 18% 19% 9% 3% <1%Delta College 29% 21% 15% 12% 13% 8% 3% <1%Douglas College 22% 27% 22% 13% 10% 3% 2% <1%Eastfield College 23% 18% 16% 14% 16% 9% 3% <1%Edison College 27% 20% 14% 12% 14% 9% 3% <1%Essex County College 21% 18% 15% 15% 17% 10% 4% <1%Grand Rapids Community College 25% 25% 18% 12% 11% 6% 2% <1%Greenville Technical College 21% 14% 13% 16% 20% 11% 5% <1%Guilford Technical Community College 21% 18% 16% 15% 17% 9% 3% <1%Harold Washington College 16% 17% 18% 16% 16% 10% 6% 1%Hudson Valley Community College 34% 21% 14% 11% 10% 7% 3% <1%Illinois Central College 26% 18% 12% 14% 15% 10% 5% 1%Indian River Community College 23% 16% 12% 11% 15% 13% 9% 2%Ivy Tech Community College - Central Indiana 15% 15% 16% 19% 21% 10% 3% <1%J. Sargeant Reynolds Community College 20% 16% 15% 15% 17% 11% 5% <1%Jefferson Community and Technical College 21% 17% 16% 15% 18% 10% 4% 1%Joliet Jr College 28% 17% 11% 11% 16% 11% 5% 1%Kingsborough Community College 26% 23% 18% 11% 10% 5% 3% 4%LaGuardia Community College 20% 20% 20% 18% 14% 6% 2% <1%Lane Community College 20% 19% 16% 15% 14% 9% 6% <1%Laney College 12% 13% 15% 17% 20% 12% 8% 2%Lorain County Community College 20% 18% 15% 15% 18% 10% 3% <1%Manatee Community College 25% 20% 15% 13% 13% 9% 4% <1%
Note: All population percentages acquired from the 2005 IPEDS dataset, if available.

Large Colleges continued
18 to 19 20 to 21 22 to 24 25 to 29 30 to 39 40 to 49 50 to 64 65+
All 2007 CCSSE Cohort Colleges 23% 18% 15% 14% 15% 9% 4% 1%All Large Colleges 24% 19% 16% 14% 14% 9% 4% 1%Merced College 27% 22% 14% 11% 12% 9% 5% <1%Mercer County Community College 23% 19% 16% 13% 14% 10% 4% 1%Metropolitan Community College 18% 17% 17% 16% 16% 11% 5% <1%Middlesex Community College 28% 21% 14% 11% 13% 9% 3% <1%Middlesex County College 28% 24% 17% 12% 11% 7% 2% <1%Midlands Technical College 24% 18% 16% 15% 15% 8% 3% <1%MiraCosta College 24% 18% 16% 13% 12% 9% 6% 1%Montgomery College 29% 20% 16% 13% 13% 7% 2% <1%Montgomery County Community College 26% 20% 15% 12% 13% 9% 4% 1%Mt. Hood Community College 30% 15% 14% 14% 14% 8% 4% <1%North Harris College 29% 20% 16% 13% 13% 7% 2% <1%North Lake College 20% 18% 18% 17% 16% 7% 3% 1%Northwest Vista College 28% 25% 18% 13% 11% 5% 1% <1%Oakton Community College 21% 17% 15% 13% 12% 12% 8% 2%Ocean County College 33% 24% 13% 9% 10% 7% 2% <1%Oklahoma City Community College 18% 21% 20% 17% 14% 7% 2% <1%
Age
Oklahoma City Community College 18% 21% 20% 17% 14% 7% 2% 1%Onondaga Community College 28% 21% 15% 11% 12% 8% 3% <1%Paradise Valley Community College 24% 16% 14% 12% 14% 12% 8% 1%Parkland College 27% 22% 14% 13% 13% 7% 4% 1%Pensacola Junior College 27% 19% 14% 14% 14% 8% 3% <1%Phoenix College 17% 14% 14% 16% 18% 12% 8% 2%Prince George's Community College 20% 16% 14% 14% 18% 12% 5% 2%Queensborough Community College 29% 23% 17% 12% 11% 6% 2% 1%Richard J. Daley College 14% 15% 15% 19% 23% 10% 4% <1%Richland College 21% 18% 17% 15% 15% 7% 3% 4%San Jacinto College - Central Campus 11% 27% 22% 17% 14% 6% 2% <1%San Jacinto College - South Campus 11% 27% 22% 17% 14% 6% 2% <1%Schoolcraft College 28% 19% 15% 12% 13% 9% 4% <1%Scottsdale Community College 22% 19% 16% 13% 12% 9% 7% 2%Seminole Community College 21% 21% 17% 14% 15% 9% 4% <1%Southwest Tennessee Community College 18% 18% 16% 16% 19% 9% 4% <1%St. Louis Community College - Meramec 26% 25% 15% 11% 10% 8% 5% <1%St. Philip's College 16% 16% 16% 18% 20% 10% 4% <1%Taft College 10% 9% 12% 16% 24% 18% 10% 1%Tallahassee Community College 29% 28% 17% 11% 9% 4% 2% <1%Thomas Nelson Community College 20% 18% 16% 15% 16% 11% 4% <1%Truckee Meadows Community College 19% 20% 18% 14% 14% 9% 5% 2%Truman College 8% 11% 15% 21% 25% 12% 7% 3%University of Wisconsin Colleges 47% 21% 11% 8% 7% 4% 1% <1%
Note: All population percentages acquired from the 2005 IPEDS dataset, if available.

Large Colleges
18 to 19 20 to 21 22 to 24 25 to 29 30 to 39 40 to 49 50 to 64 65+
All 2007 CCSSE Cohort Colleges 23% 18% 15% 14% 15% 9% 4% 1%All Large Colleges 24% 19% 16% 14% 14% 9% 4% 1%Victor Valley College 25% 17% 14% 12% 15% 11% 5% 1%Vincennes University 35% 21% 12% 11% 12% 7% 2% <1%Virginia Western Community College 22% 14% 12% 12% 19% 12% 8% <1%Westchester Community College 24% 21% 15% 12% 12% 9% 6% 2%Wilbur Wright College 17% 17% 16% 16% 17% 10% 6% 1%
Age
Note: All population percentages acquired from the 2005 IPEDS dataset, if available.

Extra Large Colleges
18 to 19 20 to 21 22 to 24 25 to 29 30 to 39 40 to 49 50 to 64 65+
All 2007 CCSSE Cohort Colleges 23% 18% 15% 14% 15% 9% 4% 1%All Extra Large Colleges 20% 19% 16% 15% 15% 9% 4% 1%American River College 16% 14% 15% 15% 19% 13% 7% 1%Austin Community College 21% 20% 18% 17% 15% 7% 3% <1%Borough of Manhattan Community College 19% 20% 21% 18% 14% 6% 2% <1%Broward Community College 22% 21% 18% 14% 15% 8% 2% <1%City College of San Francisco 10% 11% 12% 15% 20% 13% 11% 8%College of DuPage 24% 17% 12% 12% 14% 11% 7% 3%Community College of Allegheny County 19% 19% 15% 14% 16% 11% 5% 1%Community College of Philadelphia 9% 19% 18% 18% 19% 11% 5% 1%Community College of Rhode Island 24% 18% 14% 13% 16% 11% 4% <1%Community College of Southern Nevada 9% 17% 18% 18% 20% 11% 5% 1%Cuyahoga Community College 17% 15% 15% 15% 19% 12% 5% <1%De Anza College 25% 19% 16% 13% 13% 8% 4% 2%El Paso Community College 22% 21% 17% 14% 15% 8% 3% <1%Florida Community College at Jacksonville 19% 19% 16% 16% 17% 9% 4% <1%Georgia Perimeter College 23% 23% 18% 15% 14% 5% 1% <1%Glendale Community College 23% 18% 14% 12% 15% 11% 6% 2%
Age
G e da e Co u ty Co ege 3% 8% % % 5% % 6% %Harper College 27% 19% 14% 12% 14% 10% 4% <1%Hillsborough Community College 24% 21% 18% 15% 14% 7% 2% <1%Houston Community College System 8% 19% 22% 20% 18% 9% 3% <1%Johnson County Community College 25% 18% 16% 14% 12% 8% 5% 1%Kirkwood Community College 33% 23% 14% 12% 10% 6% 2% <1%Macomb Community College 28% 21% 15% 11% 13% 8% 3% <1%Metropolitan Community College - Kansas City 24% 21% 14% 14% 15% 9% 4% 1%Miami Dade College 20% 21% 17% 14% 16% 9% 3% <1%Modesto Junior College 29% 19% 15% 11% 12% 9% 4% 1%Montgomery College 24% 20% 16% 13% 13% 7% 4% 2%Moraine Valley Community College 29% 20% 14% 11% 12% 10% 4% <1%Mt. San Antonio College 25% 20% 16% 12% 11% 7% 5% 2%Northern Virginia Community College 20% 18% 16% 15% 16% 10% 5% <1%Oakland Community College 21% 20% 16% 14% 15% 9% 4% 1%Palm Beach Community College 24% 24% 18% 12% 12% 7% 3% <1%Palomar College 25% 19% 16% 12% 11% 9% 6% 2%Pasadena City College 26% 20% 17% 12% 13% 7% 4% 1%Salt Lake Community College 18% 18% 24% 19% 12% 6% 2% <1%San Antonio College 19% 20% 18% 17% 15% 7% 3% <1%San Diego Mesa College 22% 21% 20% 16% 11% 6% 3% <1%Santa Ana College 13% 11% 12% 14% 22% 17% 9% 2%Santa Fe Community College (FL) 29% 26% 18% 12% 9% 5% 2% <1%Sinclair Community College 18% 17% 16% 15% 18% 11% 5% <1%
Note: All population percentages acquired from the 2005 IPEDS dataset, if available.

Extra Large Colleges
18 to 19 20 to 21 22 to 24 25 to 29 30 to 39 40 to 49 50 to 64 65+
All 2007 CCSSE Cohort Colleges 23% 18% 15% 14% 15% 9% 4% 1%All Extra Large Colleges 20% 19% 16% 15% 15% 9% 4% 1%South Texas College 25% 20% 18% 15% 15% 5% 1% <1%Southwestern Illinois College 22% 17% 14% 14% 15% 11% 5% 1%St. Petersburg College 17% 17% 16% 16% 18% 11% 4% 1%The Community College of Baltimore County 24% 16% 14% 14% 16% 9% 4% 3%Tidewater Community College 19% 16% 16% 16% 18% 11% 4% <1%Triton College 14% 16% 15% 18% 19% 11% 6% 1%Valencia Community College 27% 25% 18% 13% 10% 5% 2% <1%
Age
Note: All population percentages acquired from the 2005 IPEDS dataset, if available.

Survey Completion Rates Table 6, beginning on the next page, provides data on 1) overall survey completion rates, 2) within class completion rates, and 3) the percent of sampled classes for 2007 CCSSE Cohort colleges (colleges that participated in CCSSE from 2005 through 2007) as well as breakouts for colleges in each size category - small, medium, large, and extra-large. Overall survey completion rates consist of surveys completed divided by the number of total surveys mailed. Within class completion rates are surveys completed divided by the number of students enrolled in the class, and the percent of sampled classes includes participating classes divided by the total number of classes in the sample.

Within PercentOverall Class of Sampled
Completion Completion ClassesRate Rate Surveyed
All 2007 CCSSE Colleges 51% 59% 87%All Small CCSSE Colleges 50% 57% 87%Abraham Baldwin Agricultural College 63% 66% 98%Aiken Technical College 55% 61% 94%Alabama Southern Community College 46% 49% 91%Alexandria Technical College 64% 71% 91%Allegany College of Maryland 65% 71% 98%Alpena Community College 39% 58% 68%Alvin Community College 48% 51% 97%Ashland Community and Technical College 51% 53% 100%Asnuntuck Community College 49% 53% 96%Atlanta Metropolitan College 49% 53% 93%Atlanta Technical College 53% 57% 92%Bainbridge College 36% 53% 67%Barton County Community College 57% 65% 95%Belmont Technical College 53% 57% 89%Berkshire Community College 46% 64% 80%Big Bend Community College 49% 56% 89%Bi k St t C ll 55% 65% 81%
Table 62007 CCSSE Colleges: Completion Rates
Bismarck State College 55% 65% 81%Blue Ridge Community College 61% 62% 100%Bowling Green Technical College 46% 57% 82%Brazosport College 49% 55% 96%Butler County Community College (PA) 62% 65% 96%Caldwell Community College and Technical Institute 54% 57% 95%Cape Cod Community College 65% 66% 98%Capital Community College 56% 57% 100%Caritas Laboure College 48% 57% 82%Carolinas College of Health Sciences 48% 57% 84%Carroll Community College 60% 64% 96%Carteret Community College 57% 62% 92%Cascadia Community College 53% 55% 95%Casper College 53% 63% 89%Cecil Community College 51% 53% 97%Cedar Valley College 52% 58% 92%Central Lakes College 60% 74% 87%Central Maine Community College 59% 66% 95%Central Wyoming College 38% 50% 83%Centralia College 46% 55% 80%Chattahoochee Technical College 58% 62% 100%Chesapeake College 46% 54% 87%Chipola College 52% 66% 88%Clarendon College 42% 44% 92%Cleveland Community College 45% 49% 91%

Within PercentOverall Class of Sampled
Completion Completion ClassesRate Rate Surveyed
All 2007 CCSSE Colleges 51% 59% 87%All Small CCSSE Colleges 50% 57% 87%Cleveland State Community College 53% 57% 98%Clovis Community College 56% 61% 92%Coastal Bend College 50% 55% 97%Coastal Carolina Community College 69% 70% 100%Coastal Georgia Community College 46% 53% 87%College of the Mainland 46% 52% 92%College of the Marshall Islands 64% 65% 100%College of the Siskiyous 43% 51% 80%Cumberland County College 53% 61% 87%Dabney S. Lancaster Community College 36% 66% 47%Danville Area Community College 51% 64% 79%Danville Community College 46% 61% 83%Darton College 51% 56% 91%Delaware Technical & Community College - Owens Campus 59% 65% 95%Delaware Technical & Community College - Terry Campus 50% 53% 90%Dyersburg State Community College 52% 56% 92%East Georgia College 51% 52% 100%Eastern New Mexico University - Roswell 50% 59% 90%Eastern Shore Community College 51% 54% 89%Eastern West Virginia Community & Technical College 26% 26% 100%Eastern Wyoming College 41% 52% 75%Edison State Community College 53% 57% 96%Ellsworth Community College 43% 53% 78%Fairmont State Community and Technical College 61% 63% 95%Florida Keys Community College 45% 54% 85%Fond du Lac Tribal and Community College 39% 53% 67%Frank Phillips College 36% 58% 62%Galveston College 39% 42% 94%Garrett College 45% 57% 86%Gateway Community and Technical College 51% 57% 95%Georgia Highlands College 58% 61% 95%Gordon College 57% 59% 97%Grays Harbor College 61% 64% 98%Grayson County College 58% 57% 100%Greenfield Community College 49% 54% 91%Hagerstown Community College 60% 61% 93%Hawaii Community College 54% 65% 86%Hazard Community and Technical College 28% 56% 54%Henderson Community College 50% 52% 97%Hesston College 50% 58% 83%Hibbing Community College 41% 70% 56%

Within PercentOverall Class of Sampled
Completion Completion ClassesRate Rate Surveyed
All 2007 CCSSE Colleges 51% 59% 87%All Small CCSSE Colleges 50% 57% 87%Honolulu Community College 46% 65% 78%Hopkinsville Community College 53% 56% 96%Howard College 45% 59% 92%Illinois Valley Community College 68% 71% 100%Isothermal Community College 49% 54% 97%Itasca Community College 41% 54% 75%Ivy Tech Community College - Bloomington 42% 54% 85%Ivy Tech Community College - Columbus 49% 59% 80%Ivy Tech Community College - Elkhart 32% 41% 78%Ivy Tech Community College - Evansville 53% 59% 91%Ivy Tech Community College - Kokomo 55% 60% 96%Ivy Tech Community College - Lawrenceburg 58% 60% 97%Ivy Tech Community College - Logansport 47% 51% 97%Ivy Tech Community College - Madison 34% 42% 81%Ivy Tech Community College - Sellersburg 59% 59% 98%Ivy Tech Community College - South Bend 43% 51% 87%Ivy Tech Community College - Terre Haute 42% 49% 89%Ivy Tech Community College - Warsaw 27% 45% 63%Ivy Tech Community College - Whitewater 44% 57% 82%Jackson State Community College 62% 64% 98%James A. Rhodes State College 53% 70% 79%Jefferson Community College 50% 54% 96%Kankakee Community College 54% 60% 91%Kauai Community College 43% 58% 76%Kenai Peninsula College-UAA 33% 48% 66%Kennebec Valley Community College 55% 62% 88%Kirtland Community College 48% 50% 93%Kodiak College, University of Alaska Anchorage 44% 53% 92%Kuskokwim Campus, University of Alaska Fairbanks 28% 60% 43%L. E. Fletcher Technical Community College 45% 47% 95%Lake City Community College 59% 59% 94%Lake Region State College 33% 52% 53%Lake-Sumter Community College 62% 65% 96%Lamar Institute of Technology 55% 59% 94%Lamar State College - Orange 48% 51% 94%Laramie County Community College 53% 55% 100%Leech Lake Tribal College 22% 47% 52%Louisburg College 58% 61% 100%Louisiana Delta Community College 40% 50% 85%Louisiana Technical College - Region 2 38% 58% 67%Louisiana Technical College - Region 3 39% 55% 76%

Within PercentOverall Class of Sampled
Completion Completion ClassesRate Rate Surveyed
All 2007 CCSSE Colleges 51% 59% 87%All Small CCSSE Colleges 50% 57% 87%Louisiana Technical College - Region 4 53% 69% 95%Louisiana Technical College - Region 6 50% 55% 92%Louisiana Technical College - Region 7 56% 65% 88%Louisiana Technical College - Region 8 47% 54% 94%Louisiana Technical College - Region 9 24% 65% 38%Lower Columbia College 50% 64% 81%Madisonville Community College 49% 57% 86%Marshall Community and Technical College 58% 58% 98%Marshalltown Community College 39% 48% 81%Martin Community College 48% 51% 98%Maui Community College 56% 59% 100%Mayland Community College 51% 63% 82%Maysville Community & Technical College 48% 48% 97%Mercy College of Health Sciences 53% 68% 76%Mesabi Range Community and Technical College 42% 52% 89%Mid Michigan Community College 51% 56% 98%Mid-South Community College 54% 56% 97%Middle Georgia College 55% 58% 98%Middlesex Community College 54% 62% 90%Minot State University-Bottineau 45% 69% 79%Montana State University Billings 40% 62% 66%Motlow State Community College 62% 64% 93%Mount Wachusett Community College 65% 73% 93%Mountain Empire Community College 48% 53% 95%NH Community Technical College - Berlin 46% 55% 74%NH Community Technical College - Claremont 55% 58% 92%NH Community Technical College - Laconia 55% 58% 96%NH Community Technical College - Manchester 50% 61% 82%NH Community Technical College - Nashua 51% 55% 95%NH Community Technical College - Stratham 59% 75% 84%New Hampshire Technical Institute 66% 70% 93%New Mexico Junior College 48% 49% 92%New Mexico Military Institute 56% 57% 100%New Mexico State University - Grants 36% 47% 74%New Mexico State University at Alamogordo 47% 53% 85%New River Community College 63% 64% 98%New River Community and Technical College 41% 62% 70%North Arkansas College 44% 60% 71%North Central Missouri College 46% 59% 72%North Central State College 58% 61% 93%North Dakota State College of Science 66% 85% 87%

Within PercentOverall Class of Sampled
Completion Completion ClassesRate Rate Surveyed
All 2007 CCSSE Colleges 51% 59% 87%All Small CCSSE Colleges 50% 57% 87%North Florida Community College 48% 54% 89%North Iowa Area Community College 63% 66% 93%Northeast Lakeview College 55% 55% 100%Northeast Mississippi Community College 76% 75% 100%Northeast Texas Community College 44% 51% 82%Northern Maine Community College 48% 54% 91%Northern New Mexico Community College 45% 51% 92%Northwest College 50% 58% 93%Northwest Indian College 25% 46% 63%Northwest Iowa Community College 43% 71% 69%Northwestern Connecticut Community College 47% 57% 81%Nunez Community College 49% 53% 92%Oregon Coast Community College 34% 46% 83%Ouachita Technical College 43% 49% 84%Panola College 45% 56% 89%Paris Junior College 53% 62% 75%Patrick Henry Community College 55% 60% 85%Paul D. Camp Community College 30% 46% 57%Piedmont Virginia Community College 55% 57% 98%Prince William Sound Community College 16% 45% 40%Quinebaug Valley Community College 50% 50% 100%Rainy River Community College 24% 36% 65%Ranger College 44% 51% 87%Rappahannock Community College 42% 58% 78%Reading Area Community College 48% 57% 85%Redlands Community College 43% 48% 93%River Parishes Community College 49% 49% 97%Riverland Community College 34% 57% 65%Roxbury Community College 47% 64% 83%SOWELA Technical Community College 31% 42% 78%Salem Community College 50% 51% 97%Salish Kootenai College 44% 67% 89%Santa Fe Community College (NM) 44% 54% 88%Sheridan College 49% 57% 83%South Florida Community College 56% 64% 92%South Georgia College 56% 60% 95%South Louisiana Community College 45% 49% 98%South Mountain Community College 49% 59% 77%South Piedmont Community College 42% 53% 82%Southeastern Community College (IA) 58% 69% 82%Southeastern Community College (NC) 50% 56% 85%

Within PercentOverall Class of Sampled
Completion Completion ClassesRate Rate Surveyed
All 2007 CCSSE Colleges 51% 59% 87%All Small CCSSE Colleges 50% 57% 87%Southeastern Technical College 58% 68% 86%Southern Maine Community College 68% 70% 100%Southern University at Shreveport 24% 44% 57%Southern West Virginia Community and Technical College 49% 54% 95%Southwest Texas Junior College 56% 58% 96%Southwest Virginia Community College 52% 61% 94%Southwestern Community College 46% 53% 86%Southwestern Indian Polytechnic Institute 35% 39% 97%Southwestern Oregon Community College 54% 57% 95%Spoon River College 56% 61% 90%Surry Community College 58% 63% 91%Tanana Valley Campus, University of Alaska Fairbanks 33% 55% 61%Technical College of the Lowcountry 44% 54% 85%Temple College 45% 54% 85%Texas State Technical College Harlingen 51% 52% 100%Texas State Technical College Marshall 47% 57% 86%Texas State Technical College Waco 52% 57% 96%Texas State Technical College West Texas 46% 54% 82%The Community and Technical College at WVU Tech 52% 66% 84%The Community and Technical College of Shepherd 41% 42% 95%The Victoria College 49% 52% 96%Three Rivers Community College 57% 68% 82%Tompkins Cortland Community College 57% 60% 96%Tri-County Community College 54% 63% 85%Tunxis Community College 58% 60% 98%University of Alaska Matanuska Susitna College 48% 55% 84%University of Alaska Southeast Ketchikan Campus 34% 50% 64%University of Arkansas Community College at Batesville 54% 57% 98%University of Arkansas Community College at Hope 47% 53% 88%University of Cincinnati Clermont College 45% 54% 78%University of New Mexico - Gallup 53% 62% 89%University of New Mexico - Taos Branch 45% 48% 93%University of New Mexico - Valencia Campus 48% 52% 92%Vermilion Community College 43% 63% 96%Vernon College 51% 63% 92%Virginia Highlands Community College 51% 54% 95%Warren County Community College 49% 53% 93%Washington State Community College 54% 57% 95%Waycross College 55% 55% 96%Wayne Community College 51% 55% 89%Wenatchee Valley College 45% 54% 84%

Within PercentOverall Class of Sampled
Completion Completion ClassesRate Rate Surveyed
All 2007 CCSSE Colleges 51% 59% 87%All Small CCSSE Colleges 50% 57% 87%West Virginia Northern Community College 49% 53% 94%West Virginia State Community and Technical College 51% 60% 94%West Virginia University at Parkersburg 59% 63% 96%Western Nebraska Community College 57% 64% 91%Western Piedmont Community College 57% 59% 95%Western Texas College 31% 46% 68%Western Wyoming Community College 51% 56% 97%Williston State College 40% 58% 67%Windward Community College 43% 59% 75%Wisconsin Indianhead Technical College 45% 61% 81%Wor-Wic Community College 57% 58% 100%Wytheville Community College 47% 56% 88%York Technical College 60% 61% 100%Zane State College 52% 53% 98%
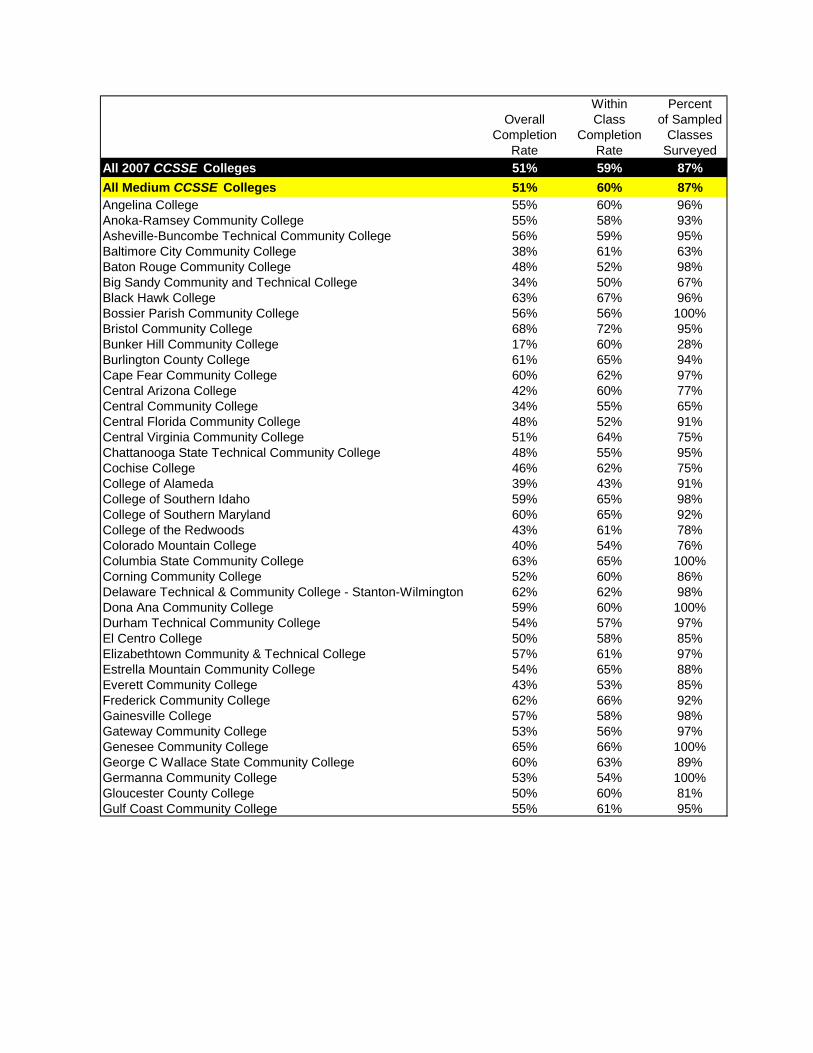
Within PercentOverall Class of Sampled
Completion Completion ClassesRate Rate Surveyed
All 2007 CCSSE Colleges 51% 59% 87%All Medium CCSSE Colleges 51% 60% 87%Angelina College 55% 60% 96%Anoka-Ramsey Community College 55% 58% 93%Asheville-Buncombe Technical Community College 56% 59% 95%Baltimore City Community College 38% 61% 63%Baton Rouge Community College 48% 52% 98%Big Sandy Community and Technical College 34% 50% 67%Black Hawk College 63% 67% 96%Bossier Parish Community College 56% 56% 100%Bristol Community College 68% 72% 95%Bunker Hill Community College 17% 60% 28%Burlington County College 61% 65% 94%Cape Fear Community College 60% 62% 97%Central Arizona College 42% 60% 77%Central Community College 34% 55% 65%Central Florida Community College 48% 52% 91%Central Virginia Community College 51% 64% 75%Chattanooga State Technical Community College 48% 55% 95%Cochise College 46% 62% 75%College of Alameda 39% 43% 91%College of Southern Idaho 59% 65% 98%College of Southern Maryland 60% 65% 92%College of the Redwoods 43% 61% 78%Colorado Mountain College 40% 54% 76%Columbia State Community College 63% 65% 100%Corning Community College 52% 60% 86%Delaware Technical & Community College - Stanton-Wilmington 62% 62% 98%Dona Ana Community College 59% 60% 100%Durham Technical Community College 54% 57% 97%El Centro College 50% 58% 85%Elizabethtown Community & Technical College 57% 61% 97%Estrella Mountain Community College 54% 65% 88%Everett Community College 43% 53% 85%Frederick Community College 62% 66% 92%Gainesville College 57% 58% 98%Gateway Community College 53% 56% 97%Genesee Community College 65% 66% 100%George C Wallace State Community College 60% 63% 89%Germanna Community College 53% 54% 100%Gloucester County College 50% 60% 81%Gulf Coast Community College 55% 61% 95%

Within PercentOverall Class of Sampled
Completion Completion ClassesRate Rate Surveyed
All 2007 CCSSE Colleges 51% 59% 87%All Medium CCSSE Colleges 51% 60% 87%Harford Community College 59% 62% 95%Hawkeye Community College 53% 59% 89%Heartland Community College 40% 55% 75%Holyoke Community College 50% 61% 81%Housatonic Community College 56% 56% 98%Howard Community College 53% 59% 89%Hutchinson Community College 60% 59% 96%Itawamba Community College 69% 72% 100%Ivy Tech Community College - Anderson 37% 47% 81%Ivy Tech Community College - East Chicago 32% 53% 68%Ivy Tech Community College - Fort Wayne 54% 62% 91%Ivy Tech Community College - Gary 32% 51% 70%Ivy Tech Community College - Lafayette 35% 59% 63%Ivy Tech Community College - Marion 30% 47% 66%Ivy Tech Community College - Michigan City 28% 38% 77%Ivy Tech Community College - Muncie 37% 54% 68%Ivy Tech Community College - Valparaiso 37% 50% 83%Jackson Community College 57% 69% 88%John Tyler Community College 52% 61% 95%Kansas City Kansas Community College 57% 60% 94%Kapiolani Community College 48% 58% 85%Kilgore College 56% 68% 89%Kingwood College 56% 59% 98%Lake Superior College 55% 61% 88%Lee College 58% 62% 95%Leeward Community College 47% 58% 80%Lehigh Carbon Community College 53% 64% 83%Lincoln Land Community College 56% 60% 86%Linn-Benton Community College 46% 57% 82%Lord Fairfax Community College 58% 58% 96%Malcolm X College 58% 60% 98%Manchester Community College 49% 56% 87%Massachusetts Bay Community College 47% 53% 85%Massasoit Community College 53% 59% 91%McHenry County College 66% 71% 97%Minneapolis Community and Technical College 54% 61% 84%Mountain View College 37% 57% 66%Nashville State Technical Community College 59% 63% 99%Naugatuck Valley Community College 56% 62% 92%Navarro College 58% 66% 99%North Hennepin Community College 57% 60% 98%

Within PercentOverall Class of Sampled
Completion Completion ClassesRate Rate Surveyed
All 2007 CCSSE Colleges 51% 59% 87%All Medium CCSSE Colleges 51% 60% 87%North Shore Community College 48% 57% 85%NorthWest Arkansas Community College 53% 67% 94%Northampton Community College 60% 67% 90%Northeast Iowa Community College 53% 58% 93%Northeast State Technical Community College 61% 63% 98%Northern Essex Community College 44% 60% 73%Northern Oklahoma College 30% 63% 53%Norwalk Community College 54% 62% 87%Okaloosa-Walton College 56% 62% 92%Olympic College 56% 64% 90%Owensboro Community and Technical College 54% 60% 90%Palo Alto College 48% 57% 82%Pasco-Hernando Community College 26% 51% 54%Pellissippi State Technical Community College 60% 63% 95%Pitt Community College 60% 64% 95%Polk Community College 53% 51% 100%Prairie State College 52% 59% 92%Pueblo Community College 45% 50% 85%Quinsigamond Community College 48% 59% 81%Raritan Valley Community College 53% 57% 91%Red Rocks Community College 45% 68% 68%Rend Lake College 58% 65% 91%Roane State Community College 58% 58% 100%Rochester Community and Technical College 48% 65% 76%Rowan-Cabarrus Community College 57% 60% 99%San Jacinto College - North Campus 43% 50% 87%San Juan College 45% 52% 86%Shelton State Community College 58% 62% 94%Skagit Valley College 42% 59% 70%Somerset Community College 59% 63% 97%South Puget Sound Community College 59% 63% 94%South Seattle Community College 39% 59% 59%South Suburban College 41% 58% 74%Southeast Kentucky Community & Technical College 58% 60% 93%Southside Virginia Community College 49% 56% 83%Spokane Community College 60% 75% 83%Springfield Technical Community College 58% 63% 96%St. Charles Community College 62% 63% 98%St. Johns River Community College 57% 64% 88%St. Louis Community College at Forest Park 44% 62% 71%St. Louis Community College- Florissant Valley 54% 66% 84%

Within PercentOverall Class of Sampled
Completion Completion ClassesRate Rate Surveyed
All 2007 CCSSE Colleges 51% 59% 87%All Medium CCSSE Colleges 51% 60% 87%Stark State College of Technology 62% 66% 96%Tacoma Community College 52% 57% 96%Tomball College 55% 55% 98%Tri-County Technical College 51% 59% 91%Trinity Valley Community College 52% 54% 100%Volunteer State Community College 60% 63% 98%Walters State Community College 62% 64% 97%Weatherford College 48% 48% 97%West Hills Community College District 43% 58% 87%West Kentucky Community and Technical College 49% 52% 93%Western Iowa Tech Community College 47% 50% 97%Westmoreland County Community College 59% 69% 100%Wharton County Junior College 58% 67% 86%

Within PercentOverall Class of Sampled
Completion Completion ClassesRate Rate Surveyed
All 2007 CCSSE Colleges 51% 59% 87%All Large CCSSE Colleges 53% 61% 88%Anne Arundel Community College 54% 58% 96%Blinn College 55% 56% 98%Bluegrass Community and Technical College 50% 56% 88%Brevard Community College 67% 69% 99%Brookdale Community College 48% 57% 82%Brookhaven College 66% 72% 94%Bucks County Community College 41% 63% 65%Butler County Community College (KS) 48% 65% 70%Century College 66% 67% 98%Chandler-Gilbert Community College 65% 66% 100%Citrus College 58% 63% 91%College of Lake County 37% 64% 62%Community College of Denver 51% 54% 94%CyFair College 55% 65% 85%Daytona Beach Community College 48% 55% 88%Del Mar College 57% 59% 93%Delgado Community College 57% 62% 96%Delta College 68% 76% 92%Douglas College 45% 76% 60%Eastfield College 49% 53% 96%Edison College 55% 60% 92%Essex County College 52% 54% 100%Grand Rapids Community College 57% 63% 91%Greenville Technical College 56% 57% 100%Guilford Technical Community College 58% 61% 96%Harold Washington College 46% 51% 93%Hudson Valley Community College 49% 61% 78%Illinois Central College 54% 66% 85%Indian River Community College 47% 55% 91%Ivy Tech Community College - Central Indiana 43% 47% 97%J. Sargeant Reynolds Community College 55% 57% 96%Jefferson Community and Technical College 55% 60% 97%Joliet Jr College 41% 62% 64%Kingsborough Community College 47% 72% 69%LaGuardia Community College 49% 59% 83%Lane Community College 49% 62% 81%Laney College 27% 56% 52%Lorain County Community College 59% 65% 94%Manatee Community College 65% 70% 94%Merced College 57% 60% 95%Mercer County Community College 60% 64% 99%

Within PercentOverall Class of Sampled
Completion Completion ClassesRate Rate Surveyed
All 2007 CCSSE Colleges 51% 59% 87%All Large CCSSE Colleges 53% 61% 88%Metropolitan Community College 71% 74% 96%Middlesex Community College 57% 66% 89%Middlesex County College 54% 60% 93%Midlands Technical College 65% 66% 100%MiraCosta College 61% 73% 88%Montgomery College 34% 52% 70%Montgomery County Community College 56% 62% 90%Mt. Hood Community College 52% 72% 73%North Harris College 46% 63% 80%North Lake College 51% 60% 91%Northwest Vista College 56% 61% 90%Oakton Community College 51% 63% 85%Ocean County College 51% 64% 79%Oklahoma City Community College 66% 69% 93%Onondaga Community College 49% 59% 85%Paradise Valley Community College 60% 64% 91%Parkland College 53% 68% 77%Pensacola Junior College 56% 65% 91%Phoenix College 43% 51% 88%Prince George's Community College 60% 62% 99%Queensborough Community College 53% 64% 87%Richard J. Daley College 42% 44% 99%Richland College 59% 59% 100%San Jacinto College - Central Campus 52% 55% 94%San Jacinto College - South Campus 48% 56% 88%Schoolcraft College 57% 61% 93%Scottsdale Community College 55% 61% 89%Seminole Community College 49% 57% 84%Southwest Tennessee Community College 43% 52% 84%St. Louis Community College - Meramec 52% 64% 80%St. Philip's College 54% 59% 94%Taft College 30% 45% 70%Tallahassee Community College 52% 53% 100%Thomas Nelson Community College 50% 59% 85%Truckee Meadows Community College 62% 66% 99%Truman College 58% 62% 94%University of Wisconsin Colleges 60% 67% 90%Victor Valley College 31% 41% 77%Vincennes University 67% 73% 95%Virginia Western Community College 60% 62% 97%Westchester Community College 64% 71% 91%Wilbur Wright College 55% 57% 98%
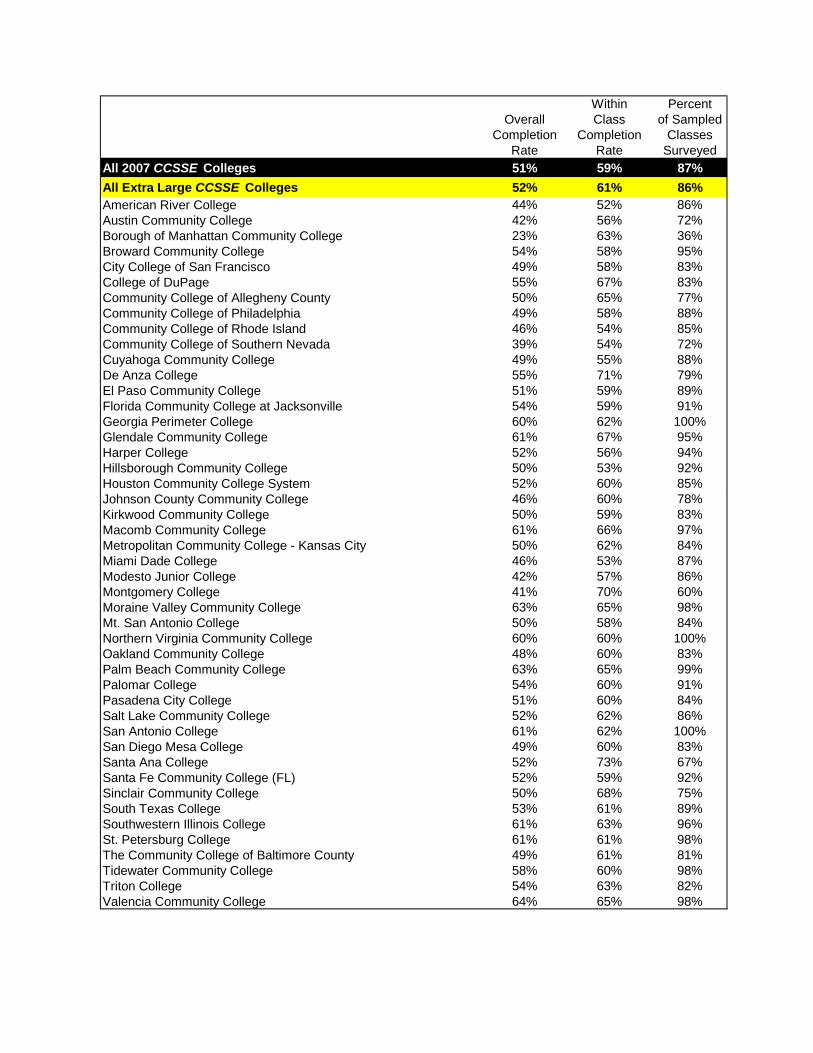
Within PercentOverall Class of Sampled
Completion Completion ClassesRate Rate Surveyed
All 2007 CCSSE Colleges 51% 59% 87%All Extra Large CCSSE Colleges 52% 61% 86%American River College 44% 52% 86%Austin Community College 42% 56% 72%Borough of Manhattan Community College 23% 63% 36%Broward Community College 54% 58% 95%City College of San Francisco 49% 58% 83%College of DuPage 55% 67% 83%Community College of Allegheny County 50% 65% 77%Community College of Philadelphia 49% 58% 88%Community College of Rhode Island 46% 54% 85%Community College of Southern Nevada 39% 54% 72%Cuyahoga Community College 49% 55% 88%De Anza College 55% 71% 79%El Paso Community College 51% 59% 89%Florida Community College at Jacksonville 54% 59% 91%Georgia Perimeter College 60% 62% 100%Glendale Community College 61% 67% 95%Harper College 52% 56% 94%Hillsborough Community College 50% 53% 92%Houston Community College System 52% 60% 85%Johnson County Community College 46% 60% 78%Kirkwood Community College 50% 59% 83%Macomb Community College 61% 66% 97%Metropolitan Community College - Kansas City 50% 62% 84%Miami Dade College 46% 53% 87%Modesto Junior College 42% 57% 86%Montgomery College 41% 70% 60%Moraine Valley Community College 63% 65% 98%Mt. San Antonio College 50% 58% 84%Northern Virginia Community College 60% 60% 100%Oakland Community College 48% 60% 83%Palm Beach Community College 63% 65% 99%Palomar College 54% 60% 91%Pasadena City College 51% 60% 84%Salt Lake Community College 52% 62% 86%San Antonio College 61% 62% 100%San Diego Mesa College 49% 60% 83%Santa Ana College 52% 73% 67%Santa Fe Community College (FL) 52% 59% 92%Sinclair Community College 50% 68% 75%South Texas College 53% 61% 89%Southwestern Illinois College 61% 63% 96%St. Petersburg College 61% 61% 98%The Community College of Baltimore County 49% 61% 81%Tidewater Community College 58% 60% 98%Triton College 54% 63% 82%Valencia Community College 64% 65% 98%

Community College Surveyof Student Engagement
Peter Ewell, ChairVice President
National Center for Higher Education Management Systems
(NCHEMS)
David ArmstrongPresident
Broward Community College
George BoggsPresident and CEO
American Association of Community Colleges
Walter G. Bumphus Chairman, Department of Educational AdministrationThe University of Texas at Austin
Jacqueline ClaunchPresident Northwest Vista College
Susan ConnerExecutive Vice President and COOThe Lumina Foundation
Larry EbbersProfessor, Educational Leadership & Policy StudiesIowa State University
George GraingerGrant OfficerHouston Endowment Incorporated
Zelema HarrisPresident EmeritusParkland College
George KuhChancellor’s Professor and DirectorNational Survey of Student EngagementIndiana University
William LawPresidentTallahassee Community College
Homero Lopez Retired PresidentEstrella Mountain Community College
Byron N. McClenneyProgram DirectorAchieving the DreamThe University of Texas at Austin
Alexander McCormickSenior ScholarThe Carnegie Foundation for the Advancement of Teaching
Christine Johnson McPhailProfessor and Graduate CoordinatorMorgan State University
Mark MillironDirector, NISODCommunity College Leadership ProgramThe University of Texas at Austin
Michael NettlesExecutive DirectorCenter for Policy Studies and ResearchEducational Testing Service
Michael PoindexterVice President of Student ServicesSacramento City College
John E. RouecheDirectorCommunity College Leadership ProgramThe University of Texas at Austin
Gerardo de los SantosPresidentLeague for Innovation in the Community College
Vincent TintoDistinguished ProfessorSyracuse University
Anne StantonProgram DirectorThe James Irvine Foundation
National Advisory Board
CCSSE Staff Community College Survey of Student Engagement
Kay McClenney, Director (512) 471-6807 [email protected]
C. Nathan Marti, Senior Research (512) 232-6456 [email protected]
Jeff Crumpley, Senior Research Associate (512) 232-6455 [email protected]
Christine McLean, College Relations (512) 232-6452 [email protected]
Courtney Adkins, Survey Operations Coordinator (512) 475-6142 [email protected]
Arleen Arnsparger, Project Manager, MetLife (512) 471-6687 [email protected] Initiative on Student Success
Angela Oriano-Darnall, Project Coordinator, Survey (512) 475-6526 [email protected] Entering Student Engagement Chris Cosart, Research Associate (512) 232-9622 [email protected] Erika Glaser, Research Associate (512) 232-6453 [email protected]
Rowland Cadena, College Liaison (512) 232-6454 [email protected]
Tammy Reichelt, College Liaison (512) 471-6907 [email protected] Sarah Supulski, Senior Administrative Associate (512) 471-3130 [email protected] Judy Row, Senior Administrative Associate (512) 471-6687 [email protected]
Sara Gray, Administrative Assistant (512) 232-6458 [email protected] Adrienne Sneed, Senior Office Assistant (512) 471-6420 [email protected] Joe Calliham, Office Assistant (512) 471-6420 [email protected]
Lindsey Lucius, Office Assistant (512) 471-6420 [email protected]. edu