Embed Size (px)
Citation preview

RONDO AVENUE LAND BRIDGE
Rondo Avenue Land Bridge Feasibility Study
Final Report
Prepared for: ReConnectRondo, Inc. Saint Paul, Minnesota
July 2020

Feasibility Study Final Report
Prepared for: ReConnectRondo, Inc.
In Partnership with: Minnesota Department of Transportation
and
City of Saint Paul, Minnesota
Prepared by:
and

Feasibility Study |July 2020 |
ES-1 | P a g e
EXECUTIVE SUMMARY
This Feasibility Study has been developed for ReConnectRondo, Inc. to evaluate the potential land bridge above Interstate I-94 (I-94), adjacent to Victoria Street, in the historic Rondo neighborhood of Saint Paul, Minnesota. In the 1930s, Rondo Avenue was at the heart of Saint Paul, Minnesota's largest African American neighborhood. The 1960s brought the construction of I-94, which severed this once tight-knit neighborhood in half, displacing thousands and essentially erasing a neighborhood identity. Since the 1980s, advocacy efforts have sought solutions that provide social unification and restoration of the neighborhood’s assets. As a means to address the detrimental impacts of I-94 to the Rondo community, the idea of a land bridge to reconnect the neighborhood became the focus of discussion. In response, numerous studies have been conducted on the visioning and conception of a Rondo land bridge (RLB). In 2016, the ReConnectRondo community development organization (herein referred to as ‘RCR’) was founded with a mission to “build a land bridge upon the spirit of Rondo in order to maximize opportunities for business and wealth creation, jobs, economic and social development, health, wellness and environmental justice, cultural and historic enrichment and affordable housing without gentrification.” In 2018, RCR, in cooperation with the Minnesota Department of Transportation (MnDOT) and the City of Saint Paul, decided to investigate the potential of a RLB. The intent of the investigation, the Rondo Land Bridge Feasibility Study (herein referred to as ‘Feasibility Study’), is to further advance the concept of a land bridge through the next step of the project development process and provide decision makers with the information necessary to make feasible and reasonable decisions. An initial review of the fundamental themes of the land bridge, in coordination with a SWOT analysis, fostered development of the following goals for this Feasibility Study. These goals are intended to be consistent with RCR’s in trying to accomplish the implementation of a land bridge:

Feasibility Study |July 2020 |
ES-2 | P a g e
• Neighborhood Reconnection – Physically, reconnect the neighborhood on both sides of I-94 in ways that serve as a catalyst for wider community-wide initiatives; alternatively, socially, create a cultural connection that promotes community leadership.
• Affordable Housing – Provide mechanisms to minimize barriers, and provide financial incentives, to promote the production and preservation of a diverse, safe, healthy, and affordable housing stock for residents to build wealth.
• Equitable Development – Create a framework for inclusive economic opportunity for an equitable community, as a result of collaboration and sustainable wealth-building.
• Public Health/Green Space – Improve public health disparities by providing access to green space and outdoor opportunities.
• Community Leadership – Strategize to keep this project a “community led” initiative and work closely with state, regional and city officials to implement regulatory and policy solutions, as appropriate, to maximize community involvement and to minimize involuntary displacements and moderate gentrification.
As a result of researching other land bridge projects and public engagement efforts, numerous concepts have been developed for the RLB. These concepts are primarily centered on Victoria Street, as it represents the approximate center of the Rondo area and has been the focal point of past efforts. However, the location of the land bridge could shift to other locations within the broader Rondo area. The concepts are detailed in various documents completed by public and private entities. Consistent among the various documents were seven (7) basic concepts, with varying amenities and design differences. An evaluation process was developed to screen the 7 concepts down to a smaller number for detailed evaluation. This process provided a rational framework to screen the concepts and eliminate those with discernable complications or unlikely reparable conditions. Based on an understanding of the project and the potential impacts through the review of previous studies, windshield surveys, and public engagement efforts, the process started with a review of the community, environmental, and transportation existing conditions within the study area, and a preliminary economic and market analysis of the Rondo neighborhood. Once aware of what existed within the study area, the project team then performed an initial screening, based on the project goals, to determine which concepts would be further reviewed. As a result of the initial screening, three (3) concepts - Concepts 1, 2/3, and 5 - were recommended to be evaluated in further detail as part of the last step in the evaluation process, which was referred to as the feasibility analysis. As part of this analysis, multiple engineering, environmental, and economic criteria were established by the project team to evaluate the three remaining concepts. The goal of this analysis was to identify financially feasible concepts that reasonably satisfied engineering and economic criteria while minimizing environmental impacts. A review of the feasibility of the concepts was then conducted, based on results of the feasibility analysis. For purposes of this Feasibility Study, feasibility is defined as the achievability of a concept’s implementation without consequential technical or civic impedance through the lens of each criterion. The following provides a graphical and narrative comparative summary of this analysis:

Feasibility Study |July 2020 |
ES-3 | P a g e
Table ES-1: Comparison of Concepts against Evaluation Criteria
Criteria
Concepts 1: Street/Bridge Expansion
(Short) 2/3: Simple Lid with
Development Potential (Medium)
5: Lid with 1-2 Story Buildings (Long)
Feasibility Study Goals Meets 3/5 Meets 4/5 Meets 5/5 Evaluation Criteria Impacts
Engineering/Traffic Low Medium High Network/Modal Connectivity Low Medium High
Environment/Health Low Medium High Economic Opportunities Low High Medium
Cost $ $$ $$$ Feasibility Feasible Likely Feasible Potentially Feasible
Notes: Low: Evaluated as having the least amount of impact for the criterion. Medium: Evaluated as neither the least nor most amount of impact for the criterion. High: Evaluated as having the most amount of impact for the criterion. $ - $$$: Representative of total probable construction costs, plus total O&M costs, with ‘$’ suggesting the lowest amount of costs and ‘$$$’ the highest amount of costs. Concept 1: Feasible – Concept 1 is feasible, because it meets the overall project goals to reconnect the Rondo neighborhood and to provide suitable development opportunities; it’s the least costly in both initial capital costs and long term operations and maintenance cost; it very likely is the fastest to implement; and it provides the least impact to the environment/health of the community. Under Concept 1, the engineering and traffic impacts - while high relative to regional infrastructure projects - is lowest in terms of cost and complexity. It is likely construction could be completed in one phase, coordination and conflicts with stakeholders is the lowest among the three concepts, and resulting contingencies are proportionally lower; thus, Concept 1 is feasible from a technical perspective. The prospect of reconnecting local streets across I-94 is low in Concept 1. Additionally, from a technical perspective, it is unlikely any Concept 1 design would result in additional connectivity beyond a minimal additional quantity of pedestrian and bicycle access points. The relative detrimental impact on the health and environment in Concept 1 is low due to its limited footprint, also resulting in low accessibility to beneficial green infrastructure, park space, and other environmental and health amenities. The economic opportunities available in Concept 1 exhibit relatively limited capacity for commercial and residential use. However, the market analysis suggests the amount of capacity is anticipated to be below the demand, resulting in a high utilization and efficient economic use of the developed areas. Therefore, Concept 1 is feasible from a social perspective, albeit with minimum relative additional benefit. Concept 2/3: Feasible – Concept 2/3 is feasible, because it meets most of the overall project goals; it provides greater potential for economic opportunities; it provides more flexibility in development and park use on the land bridge; it provides the greatest opportunity for expansion in the future, while limiting the capital expenditures up front; and while it has some impact on the environment, it provides greater benefit to health concerns with more green space and reduced air quality. The engineering and traffic impacts in Concept 2/3 are moderate in cost relative to the other concepts, at a cost approximately one-third of Concept 5, and three times that of Concept 1. It is likely that construction could be completed in one to two phases, and that coordination and conflicts with stakeholders and relative contingencies are potentially high. The prospect of reconnecting local streets across I-94 is moderate in Concepts 2/3. One to two roadways may be reconnected in addition to several

Feasibility Study |July 2020 |
ES-4 | P a g e
pedestrian and bicycle accesses; providing a relative moderate benefit. Therefore, from a technical perspective, Concept 2/3 is feasible, albeit with increased complexity. The relative detrimental impact on the health and environment in Concept 2/3 is moderate due to its relative footprint, also resulting in sizeable accessibility to beneficial green infrastructure, park space, and other environmental and health amenities. The economic opportunities available in Concepts 2/3 exhibit a relatively moderate amount of capacity for commercial and residential use. The capacity provided is anticipated to meet the demand, resulting in an appropriate utilization and efficient economic use of the developed areas. As such, from a social perspective, Concept 2/3 is feasible. Concept 5: Feasible – Concept 5 is feasible, because it meets all of the overall project goals; it provides the largest reconnection of the Rondo neighborhood; it provides the greatest capacity for benefit for the neighborhood and city as a whole, in terms of residential and commercial development; it results in the greatest number of jobs created, both temporary construction jobs and permanent jobs; it provides the largest total market value of the development at full build out and the largest tax potential (both property and income taxes); and it provides the greatest potential for new gathering spaces, cultural and historic interpretive opportunities and green space. Concept 5 includes long-term or phased build-outs associated with high costs, complex coordination, and the greatest amount of potential or risk. This concept would require additional studies, in particular, regarding interaction with major utilities, to better determine its feasibility. The prospect of reconnecting local streets across I-94 is highest in Concept 5. This indicates that Concept 5 is feasible from a technical perspective, albeit with significant complexity. The relative detrimental impact on the health and environment in Concept 5 is relatively high due to its large footprint, also resulting in high accessibility to beneficial green infrastructure, park space, and other environmental and health amenities. Additional studies regarding the detrimental environmental impacts, as well as specification of green infrastructure and utility hubs to be included in the design of the land bridge, are required to more effectively assess Concept 5. The economic opportunities available in Concept 5 exhibit a high amount of capacity for commercial and residential use. However, the market analysis indicates this amount of capacity currently exceeds the demand for commercial space. Due to the lower demand, a long built-out timeframe would be anticipated, which may result in delays in residential and affordable housing build-out timeframes as well. Therefore, Concept 5 is feasible from a social perspective, albeit with unknown implications to be assessed through additional studies and design. This Feasibility Study is the first step in a longer process to design and build a land bridge in the Rondo neighborhood. To assure the RLB can move to what is determined to be the most appropriate and immediate next step, from a design/engineering and planning perspective – Phase I studies – a series of activities are necessary. These activities (i.e. next steps) are suggested to include: Design/Engineering Activities
• Determine/Define Ownership/Maintenance of the Land Bridge • Commence Other Studies • Life Cycle Cost Aspects of a Land Bridge • Preliminary and Final Design • Construction

Feasibility Study |July 2020 |
ES-5 | P a g e
• Opening and Operation
Planning Activities • Establish Milestones with Key Stakeholders (Public Engagement) • Develop/Adopt an RCR Land Bridge Community Preferred Concept/Master Plan • Incorporate Rondo Land Bridge into relevant Planning Documents • Health Impact Assessment (HIA) • Sustainability Study • Healthy Communities Initiative Steps • Gentrification Study • Establish Rondo as its own District Council
Pre-Construction/Management Activities
• Proposal Submission • Review and Approval • Legal Contracts • Regulatory Requirements • Maintenance and Operational Plans • Land Bridge Management Plan

Feasibility Study |July 2020 |
ES-6 | P a g e
Page intentionally left blank.

Feasibility Study |July 2020 |
i | P a g e
Table of Contents 1.0 INTRODUCTION ..........................................................................................................................1
1.1 Background ................................................................................................................................... 2 1.2 Project Description ........................................................................................................................ 2 1.3 Study Area for the Feasibility Study .............................................................................................. 2 1.4 Data Inventory .............................................................................................................................. 3 1.5 Peer Review .................................................................................................................................. 3
2.0 EXISTING CONDITIONS ..................................................................................................................5 2.1 Land Use and Community Profile ................................................................................................. 6 2.2 Demographic Profile ................................................................................................................... 12 2.3 Environmental Overview ............................................................................................................ 24 2.4 Transportation Overview ............................................................................................................ 32 2.5 Travel Characteristics .................................................................................................................. 36
3.0 PRELIMINARY MARKET & ECONOMIC ANALYSIS ............................................................................... 39 4.0 GOALS, ISSUES, AND OPPORTUNITIES ............................................................................................. 43
4.1 Themes ........................................................................................................................................ 44 4.2 SWOT Analysis ............................................................................................................................. 44 4.3 Goals ........................................................................................................................................... 45
5.0 CONCEPTS AND INITIAL SCREENING ................................................................................................ 47 5.1 Concepts...................................................................................................................................... 48 5.2 Initial Screening ........................................................................................................................... 49 5.3 Evaluation Criteria ....................................................................................................................... 54
6.0 FEASIBILITY ANALYSIS ................................................................................................................. 57 6.1 Engineering and Cost Analysis .................................................................................................... 58 6.2 Network/Modal Connectivity ..................................................................................................... 61 6.3 Environment/Health ................................................................................................................... 62 6.4 Economic Opportunities ............................................................................................................. 63 6.5 Feasibility Assessment ................................................................................................................ 65
7.0 NEXT STEPS ............................................................................................................................. 71 7.1 Recommendation and Implementation Strategies ..................................................................... 72 7.2 Potential Challenges and Opportunities ..................................................................................... 75 7.3 Possible Funding Sources ............................................................................................................ 75

Feasibility Study |July 2020 |
ii | P a g e
List of Tables Table 2-1: Recently-Completed and Planned Development Projects Adjacent to the Study Area .............. 8 Table 2-2: Zoning Districts within the Study Area......................................................................................... 9 Table 2-3: Community Facilities within the Study Area .............................................................................. 10 Table 2-4: Population and Age .................................................................................................................... 15 Table 2-5: Race ............................................................................................................................................ 17 Table 2-6: Educational Attainment ............................................................................................................. 17 Table 2-7: Income ....................................................................................................................................... 19 Table 2-8: Housing ...................................................................................................................................... 21 Table 2-9: Employment ............................................................................................................................... 23 Table 2-10: Federally Threatened and Endangered Species in Ramsey County, Minnesota ..................... 25 Table 2-11: Minority Communities ............................................................................................................. 28 Table 2-12: Low-Income Communities ....................................................................................................... 30 Table 2-13: Roadway Characteristics within the Study Area ...................................................................... 32 Table 2-14: I-94 Structures within the Study Area ...................................................................................... 33 Table 2-15: Traffic Conditions for Collector and Arterial Roads within the Study Area ............................. 33 Table 2-16: I-94 Traffic Volumes for Ramps within the Study Area ............................................................ 33 Table 2-17: Crash History for I-94 Interchanges within the Study Area ..................................................... 34 Table 2-18: Bicycle Facilities ....................................................................................................................... 36 Table 5-1: Summary of Initial Screening of Concepts against Feasibility Study Goals ............................... 54 Table 5-2: Initial Proposed Evaluation Criteria ........................................................................................... 54 Table 6-1: Utilities within Project Area ....................................................................................................... 60 Table 6-2: Prototype Capacity Analysis ....................................................................................................... 65 Table 6-3: Economic Impacts Summary ...................................................................................................... 65 Table 6-4: Comparison of Concepts against Evaluation Criteria ................................................................. 66 Table 6-5: Feasibility Analysis Evaluation Criteria Matrix ........................................................................... 69 Table 7-1: Non-Traditional Funding Sources .............................................................................................. 77

Feasibility Study |July 2020 |
iii | P a g e
List of Figures Figure 1-1: Study Area ................................................................................................................................... 3 Figure 2-1: Land Use within the Study Area ................................................................................................. 7 Figure 2-2: Community Facilities................................................................................................................. 11 Figure 2-3: Study Area Census Tracts and Block Groups ............................................................................ 13 Figure 2-4: Age Distribution of Population within the Study Area ............................................................. 14 Figure 2-5: Ethnicity Distribution of the Study Area ................................................................................... 16 Figure 2-6: Educational Attainment for Population 25 and Older .............................................................. 16 Figure 2-7: Annual Household Income ........................................................................................................ 18 Figure 2-8: Poverty Level (based off income in the past 12 months) ......................................................... 18 Figure 2-9: Occupancy Status of Housing Units .......................................................................................... 20 Figure 2-10: Distribution of Renter and Owner Occupied Housing Units ................................................... 20 Figure 2-11: Employment Status ................................................................................................................. 22 Figure 2-12: Distribution of Employment by Category within the Study Area ........................................... 22 Figure 2-13: Potentially Contaminated Concerns within the Study Area ................................................... 26 Figure 2-14: Minority Block Groups per Environmental Justice Analysis ................................................... 29 Figure 2-15: Low-Income Block Groups per Environmental Justice Analysis ............................................. 31 Figure 2-16: Bus Routes within the Study Area .......................................................................................... 35 Figure 2-17: Distribution of Travel Means to Work .................................................................................... 36 Figure 2-18: Distribution of Travel Time to Work ....................................................................................... 37 Figure 5-1: Concept 1 Schematic ................................................................................................................ 52 Figure 5-2: Concept 2/3 Schematic ............................................................................................................. 53 Figure 5-3: Concept 5 Schematic ................................................................................................................ 53
List of Appendices Appendix A: Figures (11x17) Appendix B: Data Inventory Appendix C: Land Bridge Projects Peer Review Appendix D: City of Saint Paul Zoning Maps Appendix E: Cultural Resources Appendix F: Potentially Contaminated Concerns Appendix G: Rondo Land Bridge Elements Matrix Appendix H: Engineering Cost Estimates

Feasibility Study |July 2020 |
iv | P a g e
Page intentionally left blank.

Feasibility Study |July 2020 |
1 | P a g e
1.0 INTRODUCTION

Feasibility Study |July 2020 |
2 | P a g e
1.1 Background In the 1930s, Rondo Avenue was at the heart of Saint Paul, Minnesota's largest African American neighborhood. The 1960s brought the construction of Interstate 94 (I-94), which severed this once tight-knit neighborhood in half, displacing thousands and essentially erasing a neighborhood identity. However, those that remained continued to maintain a strong local identity. In the 1980s, neighborhood leaders began to reclaim this past thriving neighborhood, as a means to address the detrimental impacts of I-94 to the Rondo community. Early efforts consisted of Rondo Days1 and other public outreach events. The fundamental goal of these events was to trigger a renaissance of sorts and create a blank canvas which others – artists, organizations, and all sort of dreamers could draw upon without having to go back to square one. In 2016, neighborhood leaders fostered the establishment of ReConnectRondo (RCR); a community development organization established to maximize opportunities for business, economic, and social development in the Rondo neighborhood. One of RCR’s early efforts included meeting with leadership of the Friendly Streets Initiative (FSI) to encourage Rondo residents to engage in transportation issues involving their community. From these meetings, the idea to reconnect the Rondo neighborhood with a land bridge originated. RCR’s mission is the realization of a Rondo Land Bridge (RLB) to reconnect communities proximate to I-94 in the Rondo neighborhood of Saint Paul. RCR’s goal is to persuasively shape policy for the RLB to create opportunities that uplift the public health, economic, housing and social conditions of the Rondo communities. RCR’s motto, that the RLB “is more than a bridge” signifies RCR intends the RLB to be a space where: the community can come together to engage in activities that lead to a shared vision; collaboration and partnerships to solve the issues and problems that confront the residents of Rondo are possible; and, to maintain the strong local identity that neighborhood leaders have worked tirelessly for years to accomplish.
1.2 Project Description Since the establishment of RCR and the idea of a land bridge, studies from numerous organizations have been conducted on the visioning and conception of a RLB. RCR, in cooperation with the Minnesota Department of Transportation (MnDOT) and the City of Saint Paul, are now investigating the potential for a land bridge across I-94 to reconnect the Rondo neighborhood. The intent of this document, the Rondo Land Bridge Feasibility Study (herein referred to as ‘Feasibility Study’), is to further advance the concept of a land bridge through the next step of the project development process, and provide decision makers with the information necessary to make feasible and reasonable decisions.
1.3 Study Area for the Feasibility Study For purposes of this study, a specifically defined study area representing the Rondo neighborhood was established. The study area is bounded by University Avenue to the north, Western Avenue to the east, Selby Avenue to the south, and Hamline Avenue to the west. The study area includes portions of the following neighborhoods: Rondo, Frogtown, Cathedral Hill, Summit-University, and Lexington-Hamline North. The study area is shifted west of the Urban Land Institute (ULI) Advisory Services Panel Report2 (herein referred to as ‘ULI Report’) study area, the last report completed to discuss the RLB, to encompass an equitable assessment of the transportation aspects of the proposed land bridge location. The ULI
1 An annual festival held the third Saturday in July in Saint Paul, Minnesota that commemorates the Rondo Neighborhood. 2 ULI Advisory Services Panel Report, Saint Paul Minnesota, The Rondo Community Land Bridge, March 18-23, 2018. This report summarized the findings and recommendations of a multidisciplinary Technical Advisory Panel regarding the community, economic, and future possibilities of several prospective areas for land bridge projects.

Feasibility Study |July 2020 |
3 | P a g e
Report study area included University Avenue to the north, Rice Street to the east, Selby Avenue to the south, and Lexington Parkway to the west. The ULI Report also noted the potential land bridge limits, at a minimum, should extend approximately 300 feet west of North Chatsworth Street and then east to 150 feet east of Grotto Street North. Figure 1-1 depicts the study area for this Feasibility Study and the ULI Report study area, as well as the RLB proposed location parameters.
Figure 1-1: Study Area
1.4 Data Inventory This Feasibility Study, when possible, utilized available data presented in previously completed reports. An inventory of collected data sources was created and includes the following: Rethinking I-943 (August 2018), the ULI Report4 (March 2018), and the RCR engagement efforts. Appendix B depicts a complete list of data inventoried, to date, by the project team.
1.5 Peer Review Appendix C details a review of “cap”, “lid”, or “land bridge” projects in other states, with particular emphasis on those projects that created a connection. These projects provided guidance and ‘lessons learned’ in the development of this Feasibility Study. The peer review was delineated between completed projects and projects under development.
3 http://www.dot.state.mn.us/I-94minneapolis-stpaul/, accessed August 2018. 4 ULI Advisory Services Panel Report, Saint Paul Minnesota, The Rondo Community Land Bridge, March 18-23, 2018.

Feasibility Study |July 2020 |
4 | P a g e
Page intentionally left blank.
Feasibility Study |July 2020 |
5 | P a g e
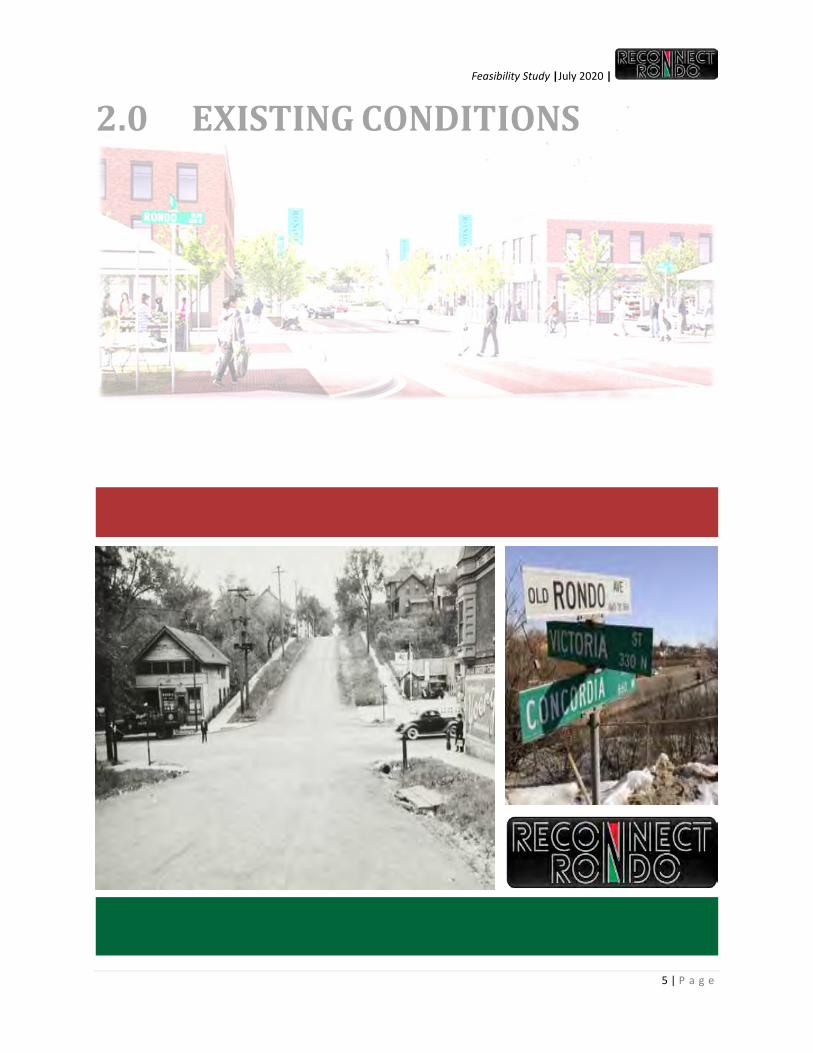
2.0 EXISTING CONDITIONS

Feasibility Study |July 2020 |
6 | P a g e
To analyze the feasibility of the RLB, an evaluation process was developed. This process provided a rational framework to screen concepts and eliminate those concepts with discernable complications or unlikely reparable conditions. Based on an understanding of the project and the potential impacts through the review of previous studies, windshield surveys, and public engagement efforts, the process started with a review of the community, environmental, and transportation existing conditions within the study area.
2.1 Land Use and Community Profile Figure 2-1 depicts land use in the study area in 2016, per MetCouncil’s MetroGIS DataFinder service.5 The study area is defined primarily by residential uses, which includes single-family and multi-family residences. Retail, institutional, and recreational uses are predominant in the western portion of the study area (west of Lexington Parkway). The primary retail and commercial corridors in the study area include University Avenue and Selby Avenue.
2.1.1 Development Upon reviewing the Ramsey County Assessor’s Office, 2018 Edition – Ramsey County Development Projects, there are no recently-completed or planned development projects located within the study area.6 As depicted in Table 2-1, there are six projects located adjacent to the study area. The most prominent project is Allianz Stadium, located west of the study area on the southeast corner of Snelling Avenue and University Avenue, a new soccer stadium currently under construction on a 35-acre site.
5 MetCouncil MetroGIS DataFinder, https://www.metrogis.org/get-data/data-finder.aspx, accessed September 2018. 6 Ramsey County Assessor’s Office, 2018 Edition – Ramsey County Development Projects, https://www.ramseycounty.us/sites/default/files/2018%20RC%20Development%20Projects%20NEW.PDF, accessed September 2018.

Feasibility Study |July 2020 |
7 | P a g e
Figure 2-1: Land Use within the Study Area

Feasibility Study |July 2020 |
8 | P a g e
Table 2-1: Recently-Completed and Planned Development Projects Adjacent to the Study Area
Name Location Use Sponsoring Entity Description
Recently Completed
The BROWNstone 839-849 W. University Ave.
Mixed-Use Model Cities of Saint Paul
Four-story building; 35 apartment units and 20,400 sq. ft. of commercial space. Features a reading room dedicated to history of the Pullman railroad workers.
Western U Plaza 370 W. University Ave.
Mixed-Use N/A Redeveloped the historic Old Home Dairy Building to 68 apartments. Constructed a two-story, 16,000 sq. ft. building with commercial space and apartments.
Planned Central Exchange 773-785 W.
University Ave.
Residential Model Cities of Saint Paul
Affordable Housing
Sears “Capitol View” 425 Rice Street
N/A Seritage Growth Properties
The entity is marketing to lease or redevelop this site.
Allianz Field SE Quadrant of Snelling and University
Commercial Private Will house the Minnesota United Soccer team, providing 19,400 seats.
Saxon-Ford Dealership Site
253-255 W. University Ave.
N/A N/A Site marketed by City of Saint Paul and Local Initiatives Support Coalition. Hmong American Partnership and JB Realty Company have submitted a proposal, which is under review.
N/A – Not Available Source: Ramsey County Assessor’s Office, 2018 Edition – Ramsey County Development Projects
2.1.2 Zoning Generally, the study area is primarily zoned low-density residential, with areas of medium density zoning and traditional neighborhood zoning along the eastern and western borders, respectively.7 Table 2-2 identifies the zoning districts within the study area. Zoning in the study area is depicted in the City of Saint Paul zoning maps (Panels 14 and 15) in Appendix D.
7 City of Saint Paul, Minnesota, Zoning Panel Maps, Panels 14 and 15. https://www.stpaul.gov/departments/planning-economic-development/maps-and-data/maps, accessed August 2018.

Feasibility Study |July 2020 |
9 | P a g e
Table 2-2: Zoning Districts within the Study Area District Use/Zone Type Lot Size Minimum (Area: Square Feet)
R4 One-family 5,000 RT1 Two-family 3,000 RT2 Townhouse 2,500 RM1 Multiple-family 2,000 RM2 Multiple-family 1,500 RM3 Multiple-family 800 T2 Traditional Neighborhood 3,500 (family dwelling)/2,000 (family/townhouse) T3 Traditional Neighborhood 3,500 (family dwelling)/2,000 (family/townhouse) T4 Traditional Neighborhood N/A OS Office-service N/A B1 Local Business District N/A B2 Community Business district N/A B3 General Business district N/A VP Vehicular Parking 4,000
N/A – Not Applicable Source: City of Saint Paul, Minnesota, Zoning Code, Chapter 66.8
2.1.3 Community Facilities Community facilities are distributed throughout the study area. The study area consists of eight (8) schools (includes Concordia University – Saint Paul), two (2) medical facilities, one (1) library, 20 religious facilities, and six (6) recreational facilities (i.e. parks, recreation buildings/fields, community garden). In addition to the extensive pedestrian network within the study area, which includes street sidewalks and four pedestrian bridges over I-94, the designated bikeways (i.e. bike lane or bike boulevard) within the study area include Western Avenue, Griggs Street, and Marshall Avenue (starting at Lexington Avenue and west to the western boundary of the study area).9 Table 2-3 lists the community facilities located within the study area, and Figure 2-2 graphically depicts the location of these facilities.
8 City of Saint Paul Zoning Code, https://library.municode.com/mn/st._paul/codes/code_of_ordinances?nodeId=PTIILECO_TITVIIIZOCO_CH66ZOCOONDIUSDEDIST, accessed August 2018. 9 City of Saint Paul, Bike Map, December 8, 2017, https://www.stpaul.gov/sites/default/files/Media%20Root/Public%20Works/2017%2012%20Saint%20Paul%20Bike%20Map.pdf, accessed August 2018.

Feasibility Study |July 2020 |
10 | P a g e
Table 2-3: Community Facilities within the Study Area Map No. Name Address Amenities
S1 Gordon Parks High School/ALC Evening High 1212 University Avenue Saint Paul Public Schools (SPPS); Grades 11-12
S2 High School for the Recording Arts 1166 University Avenue Public Charter School; Grades 9-12 S3 St. Peter Claver Catholic School 1060 Central Avenue W. Private; Grades K-8 S4 Hubbs Lifelong Learning Center 1030 University Avenue SPPS Adult Basic Education S5 Maxfield Elementary 380 Victoria Street N. SPPS; Grades PreK-5 S6 Rondo Education Center 560 Concordia Avenue SPPS; PreK S6 Capitol Hill Gifted & Talented Magnet 560 Concordia Avenue SPPS; Grades 1-8 S6 Benjamin E. Mays International Magnet 560 Concordia Avenue SPPS; Grades PreK to 5 S7 Central Senior High School 275 Lexington Parkway N. SPPS; Grades 9-12 S8 Concordia University Saint Paul 275 Syndicate Street N. Private; Post Secondary M1 HealthPartners Midway Clinic Saint Paul 451 Dunlap Street M2 Central Medical Clinic 393 Dunlap Street LL34 L1 Rondo Community Library 461 North Dale Street Saint Paul Public Library RF1 Hmong Peace Assembly of God 1088 University Avenue W. RF2 St. Peter Claver Church 375 Oxford Street N. RF3 Emmanuel Karen Baptist Church 400 Oxford Street N. RF4 New Birth Missionary Baptist 983 Central Avenue W. RF5 Pilgrim Baptist Church 732 Central Avenue W. RF6 St. Albans Church of God 678 Aurora Avenue RF7 St. James AME Church 624 Central Avenue W. RF8 Oromo American Twhid Islamic Community of
Saint Paul 430 Dale Street N.
RF9 Camphor Memorial United Methodist Church 585 Fuller Avenue RF10 Minnesota Dawah Institute 478 University Avenue W. RF11 Mt. Olivet Baptist Church 451 Central Avenue W. RF12 Dayton Avenue Presbyterian Church 217 North Mackubin Street RF13 Lutheran Church of the Redeemer 285 Dale Street N. RF14 Morning Star Missionary Church 739 Selby Avenue RF15 Gospel Temple Church of God 247 Grotto Street N. RF16 New Jerusalem Baptist Church 315 North Fisk Street RF17 First Trinity Church of God 981 Marshall Avenue RF18 Saint Paul Apostolic Church and Hmong UPCI 207 Lexington Parkway N. RF19 Peace Tabernacle AG 1162 Marshall Avenue RF20 The WHEREhouse Church 1259 Carroll Avenue RC1 Central Village Park 457 Central Avenue W. Active; City of Saint Paul;
trail/walking path RC2 Martin Luther King Recreation Center 271 Mackubin Street Active; City of Saint Paul RC3 Carty Park 705 Iglehart Avenue Active; City of Saint Paul RC4 Victoria Community Garden 318 North Victoria Street Urban Farm and Garden Alliance RC5 Oxford Community Center/Jimmy Lee
Recreation Center 270 Lexington Parkway N. Active; City of Saint Paul
RC6 Dunning Recreation Center 1221 Marshall Avenue Active; City of Saint Paul; trail/walking path
S# - School, MF# – Medical Facility, L# - Library, RF# – Religious Facility, RC# – Recreation Facility Sources: Google Maps, www.google.com/maps, accessed August 2018.
Ramsey County Interactive Property Map, https://www.ramseycounty.us/residents/property/maps-surveys/interactive-map-gis, accessed August 2018. Rethinking I-94, MnDOT, http://www.dot.state.mn.us/I-94minneapolis-stpaul/, accessed August 2018. Saint Paul Parks and Recreation, http://parkfinder.stpaul.gov/mobile#page-map, accessed August 2018.

Feasibility Study |July 2020 |
11 | P a g e
Figure 2-2: Community Facilities
Feasibility Study |July 2020 |
12 | P a g e
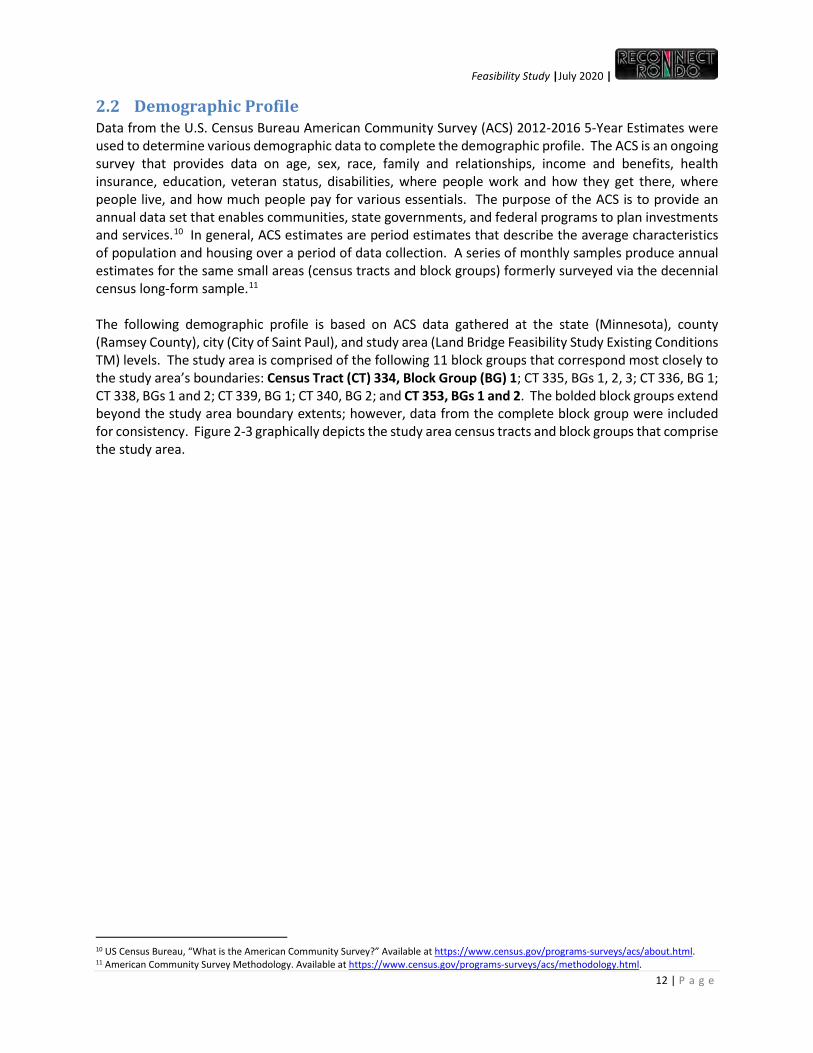
2.2 Demographic Profile Data from the U.S. Census Bureau American Community Survey (ACS) 2012-2016 5-Year Estimates were used to determine various demographic data to complete the demographic profile. The ACS is an ongoing survey that provides data on age, sex, race, family and relationships, income and benefits, health insurance, education, veteran status, disabilities, where people work and how they get there, where people live, and how much people pay for various essentials. The purpose of the ACS is to provide an annual data set that enables communities, state governments, and federal programs to plan investments and services.10 In general, ACS estimates are period estimates that describe the average characteristics of population and housing over a period of data collection. A series of monthly samples produce annual estimates for the same small areas (census tracts and block groups) formerly surveyed via the decennial census long-form sample.11 The following demographic profile is based on ACS data gathered at the state (Minnesota), county (Ramsey County), city (City of Saint Paul), and study area (Land Bridge Feasibility Study Existing Conditions TM) levels. The study area is comprised of the following 11 block groups that correspond most closely to the study area’s boundaries: Census Tract (CT) 334, Block Group (BG) 1; CT 335, BGs 1, 2, 3; CT 336, BG 1; CT 338, BGs 1 and 2; CT 339, BG 1; CT 340, BG 2; and CT 353, BGs 1 and 2. The bolded block groups extend beyond the study area boundary extents; however, data from the complete block group were included for consistency. Figure 2-3 graphically depicts the study area census tracts and block groups that comprise the study area.
10 US Census Bureau, “What is the American Community Survey?” Available at https://www.census.gov/programs-surveys/acs/about.html. 11 American Community Survey Methodology. Available at https://www.census.gov/programs-surveys/acs/methodology.html.

Feasibility Study |July 2020 |
13 | P a g e
Figure 2-3: Study Area Census Tracts and Block Groups
Feasibility Study |July 2020 |
14 | P a g e
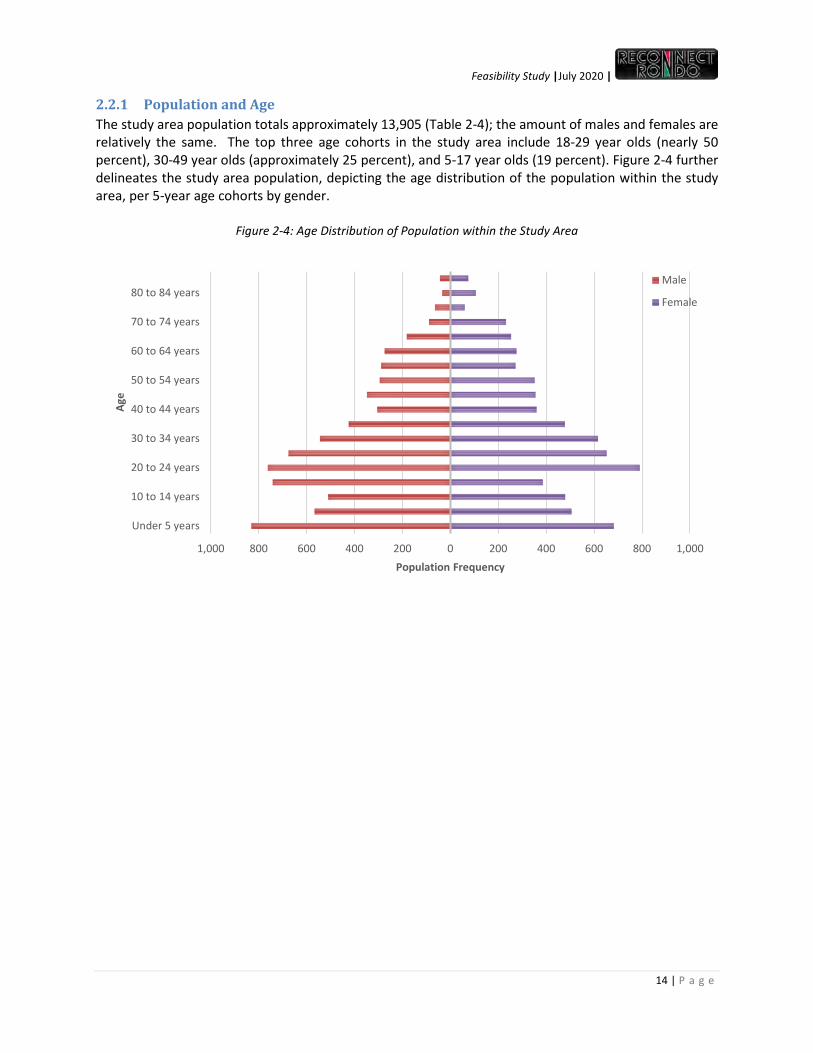
2.2.1 Population and Age The study area population totals approximately 13,905 (Table 2-4); the amount of males and females are relatively the same. The top three age cohorts in the study area include 18-29 year olds (nearly 50 percent), 30-49 year olds (approximately 25 percent), and 5-17 year olds (19 percent). Figure 2-4 further delineates the study area population, depicting the age distribution of the population within the study area, per 5-year age cohorts by gender.
Figure 2-4: Age Distribution of Population within the Study Area
1,000 800 600 400 200 0 200 400 600 800 1,000
Under 5 years
10 to 14 years
20 to 24 years
30 to 34 years
40 to 44 years
50 to 54 years
60 to 64 years
70 to 74 years
80 to 84 years
Population Frequency
Age
Male
Female

Feasibility Study |July 2020 |
15 | P a g e
Table 2-4: Population and Age

Feasibility Study |July 2020 |
16 | P a g e
2.2.2 Race As depicted in Figure 2-5 and Table 2-5, the study area is a racially diverse community. The Black or African American population is the largest ethnic group within the study area, representing approximately 40 percent of the population. Whites represent approximately 41 percent of the population. The remaining 19 percent of the population is distributed between four ethnicities, with the largest percentage of this population identifying themselves as Asian (approximately 11 percent).
Figure 2-5: Ethnicity Distribution of the Study Area
2.2.3 Educational Attainment Figure 2-6 and Table 2-6 show the level of educational attainment for the study area. In the study area, approximately 19 percent of the population have obtained a high school diploma (or equivalent). About 30 percent have completed undergraduate work or an associate’s degree, and nearly 27 percent have a master’s or professional degree. Approximately 15 percent of adult residents have not completed a high school education, which is higher in comparison to the City of Saint Paul, Ramsey County, and the State of Minnesota. It should be noted, the inclusion of Concordia University in the far western portion of the study area may skew the data in this category; student residence halls create a large concentration of the educated population in CT 334, BG 1.
Figure 2-6: Educational Attainment for Population 25 and Older
41%
40%1%
11%
2%
5%
19%
White alone
Black or African American alone
American Indian and Alaska Native alone
Asian alone
Native Hawaiian and Other Pacific Islander alone
Some other race alone
Two or more races
0%5%
10%15%20%25%
PERC
ENT
OF
POPU
LATI
ON
25
YEA
RS A
ND
OVE
R
EDUCATIONAL ATTAINMENT
Study Area City of Saint Paul
Ramsey County State of Minnesota

Feasibility Study |July 2020 |
17 | P a g e
Table 2-5: Race
Table 2-6: Educational Attainment

Feasibility Study |July 2020 |
18 | P a g e
2.2.4 Income As illustrated in Figure 2-7 and Table 2-7, a substantial number of households (approximately 40 percent) in the study area earn less than $25,000 per year, which is a much larger percentage when compared to the City of Saint Paul (approximately 25 percent). By contrast, in the study area, approximately 26 percent of households earn more than $75,000 per year, which is less when compared to the City of Saint Paul (approximately 33 percent).
Figure 2-7: Annual Household Income
Within the study area, approximately 27 percent of families had an income in the past 12 months below the poverty level (Figure 2-8 and Table 2-7). This is in comparison to the City of Saint Paul, Ramsey County, and State of Minnesota, which have approximately 16 percent, 11 percent, and 7 percent of families below the poverty level, respectively.
Figure 2-8: Poverty Level (based off income in the past 12 months)
0%
5%
10%
15%
20%
25%
PERC
ENT
OF
HOU
SEHO
LDS
ANNUAL HOUSEHOLD INCOME
Study Area City of Saint Paul Ramsey County State of Minnesota
707 10,099 13,314 95,736
1,916 51,806 107,949 1,285,024
0%
20%
40%
60%
80%
100%
Study Area City of Saint Paul Ramsey County State of Minnesota
PERC
ENT
OF
FAM
ILIE
S
GEOGRAPHIC AREA
Income in the past 12 months below poverty level Income in the past 12 months at or above poverty level

Feasibility Study |July 2020 |
19 | P a g e
Table 2-7: Income

Feasibility Study |July 2020 |
20 | P a g e
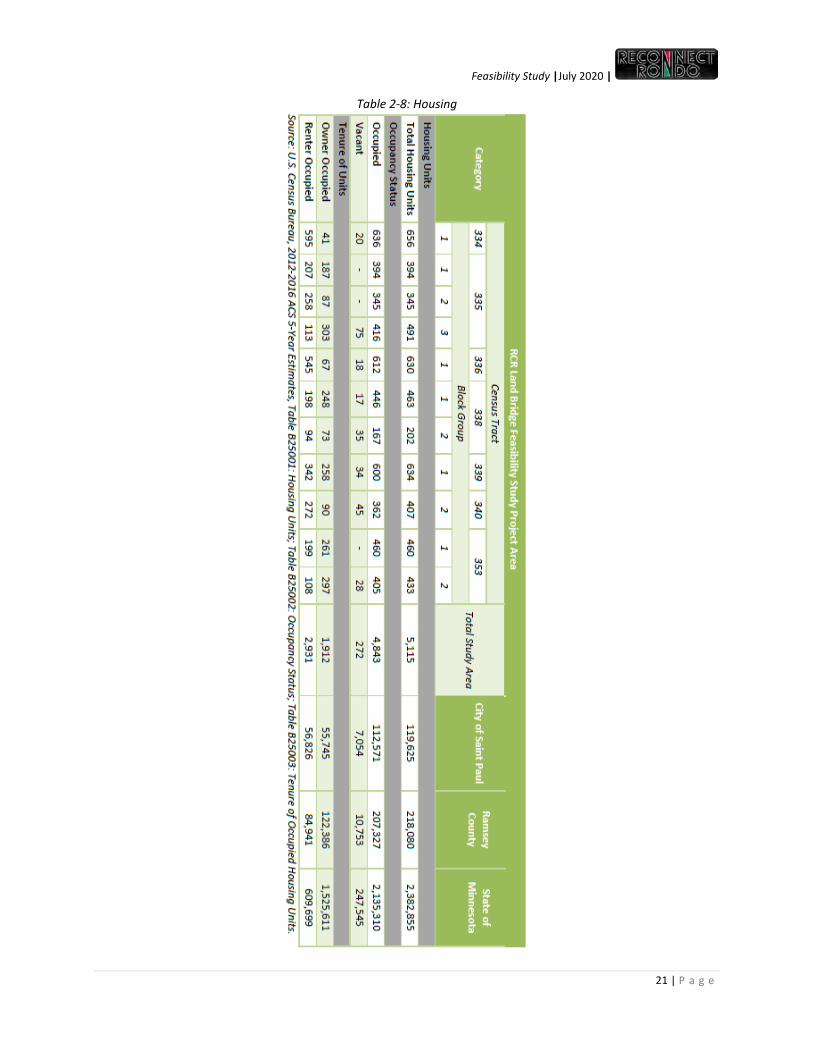
2.2.5 Housing The study area includes approximately 5,115 housing units. For comparison, as shown in Figure 2-9 (and Table 2-8), the vacancy rate for residential units in the study area and the City of Saint Paul are relatively the same, with a one percent difference.
Figure 2-9: Occupancy Status of Housing Units
Housing in the study area is predominantly renter-occupied (Figure 2-10). Nearly 61 percent of the housing units were renter-occupied and approximately 40 percent were owner-occupied. The rate of renter occupancy (approximately 61 percent) in the study area is higher than each of the comparative geographic areas: City of Saint Paul (approximately 50 percent), Ramsey County (41 percent), and the State of Minnesota (29 percent).
Figure 2-10: Distribution of Renter and Owner Occupied Housing Units
4,843 112,571 207,327 2,135,310
272 7,054 10,753 247,545
0%10%20%30%40%50%60%70%80%90%
100%
Study Area City of Saint Paul Ramsey County State of Minnesota
PERC
ENT
OF
HOU
SIN
G U
NIT
S
GEOGRAPHIC AREA
Occupied Vacant
1,91255,745
122,3861,525,611
2,93156,826
84,941609,699
0%10%20%30%40%50%60%70%80%90%
100%
Study Area City of Saint Paul Ramsey County State of MinnesotaPERC
ENT
OF
OCC
UPI
ED H
OU
SIN
G U
NIT
S
GEOGRAPHIC AREA
Owner Occupied Renter Occupied
Feasibility Study |July 2020 |
21 | P a g e
Table 2-8: Housing

Feasibility Study |July 2020 |
22 | P a g e
2.2.6 Employment Within the study area, approximately 7,236 (71 percent) of working adults (16 years and older) are in the labor force, while 2,930 adults (approximately 29 percent) are considered not in the labor force (Figure 2-11 and Table 2-9). Of the labor force, nearly 11 percent are unemployed. The study area unemployment rate is slightly greater when compared to the City of Saint Paul (8 percent), Ramsey County (7 percent), and the State of Minnesota (5 percent). Figure 2-12 shows the distribution of employment by category for the study area. Residents of the study area are primarily employed in management, business, and financial (22 percent); sales and office (22 percent); and education, legal, community service, arts, and media (17 percent). It should be noted, the inclusion of Concordia University in the far western portion of the study area may skew the data in this category; student residence halls create a large concentration of the employment population in CT 334, BG1.
Figure 2-11: Employment Status
Figure 2-12: Distribution of Employment by Category within the Study Area
6,476 149,403 270,977 2,864,441
760 12,720 18,753 145,853
2,930 67,419 130,658 1,299,114
0%
10%
20%
30%
40%
50%
60%
70%
80%
90%
100%
Study Area City of Saint Paul Ramsey County State of Minnesota
PERC
ENT
OF
POPU
LATI
ON
16
YEAR
S AN
D O
VER
GEOGRAPHIC AREA
Employed Unemployed Armed Forces Not In Labor Force
11%
8%
17%
3%22%
22%
5%
12%
16%
Management, business, and financial
Computer, engineering, and science
Education, legal, community service, arts, andmediaHealthcare practitiioners and technical
Service
Sales and Office
Natural Resources, construction, and maintenance

Feasibility Study |July 2020 |
23 | P a g e
Table 2-9: Employment

Feasibility Study |July 2020 |
24 | P a g e
2.3 Environmental Overview The following identifies environmental subjects of relevance in the study area likely to require consideration during this, and future stages, of project development of the Rondo Land Bridge. The review of resources is based on literature, archival, known database, map research and limited field reconnaissance.
2.3.1 Cultural Resources12 Per coordination with MnDOT’s Cultural Resources Unit,13 the study area contains one historic district, Woodland Park Historic District, designated in 1978 on the National Register of Historic Places (NRHP). Additionally, the study area includes 90 known NRHP designated (eligible for, or listed on the NRHP) historic properties, located intermittently throughout the study area. Appendix E includes a graphic and tabular depiction of these properties. As the project advances in the project development process, additional identification and evaluation of other properties will be necessary. MnDOT’s Cultural Resources Unit also noted known archaeological sites are present within the study area. None of these sites are within the actual proposed land bridge location; therefore, any work associated with the proposed land bridge would not affect these sites. Furthermore, since the project occurs in areas of previously disturbed soils, there is a low probability of intact, significant archaeological resources within the study area; however, a full archaeological assessment would be necessary if the project advances in the project development process.
2.3.2 Aquatic Resources14, 15 GIS databases with the Minnesota Department of Natural Resources and the US Fish and Wildlife Service (USFWS) were reviewed to determine the presence of aquatic resources within the study area. No water features (i.e. rivers, streams, lakes, ponds) were identified within the study area; however, this does not include ditches or other drainage features. Additionally, no hydric soils, and subsequently, no wetlands are located within the study area.
2.3.3 Threatened and Endangered Species16, 17 A review of the USFWS federally-listed endangered, proposed, and candidate species database identified one (1) threatened and four (4) endangered species for Ramsey County, Minnesota (see Table 2-10).
12 City of Saint Paul, Minnesota, Historic Districts and Individual Sites, https://www.stpaul.gov/departments/planning-economic-development/heritage-preservation/historic-districts-and-individual, accessed August 2018. 13 Email coordination with Jacob Foss, MnDOT Cultural Resources Unit, September 18, 2018. 14 Minnesota Geospatial Commons, MNDNR Hydrography, https://gisdata.mn.gov/dataset/water-dnr-hydrography, accessed August 2018. 15 USFWS National Wetlands Inventory, Wetlands Mapper, https://www.fws.gov/wetlands/data/mapper.html, accessed August 2018 16 USFWS Endangered Species in Minnesota, https://www.fws.gov/midwest/endangered/lists/minnesot-cty.html, accessed August 2018 17 Minnesota DNR/USFWS Townships Containing Documented Northern Long-Eared Bat (NLEB) Maternity Roost Trees and/or Hibernacula Entrances in Minnesota, April 1, 2018, http://files.dnr.state.mn.us/eco/ereview/minnesota_nleb_township_list_and_map.pdf, accessed August 2018.

Feasibility Study |July 2020 |
25 | P a g e
Table 2-10: Federally Threatened and Endangered Species in Ramsey County, Minnesota Name Scientific Name Status Habitat Northern long-eared bat Myotis septentrionalis Threatened Hibernates in caves and mines – swarming in
surrounding wooded areas in autumn. Roosts and forages in upland forests during spring and summer.
Higgins eye pearlymussel Lampsilis higginsii Endangered Mississippi River Snuffbox Epioblasma triquetra Endangered Mississippi River Winged mapleleaf Quadrula fragosa Endangered St. Croix River Rusty patched bumble bee Bombus affinis Endangered Grasslands with flower plants from April through
October, underground and abandoned rodent cavities or clumps of grasses above ground as nesting sites, and undisturbed soil for hibernating queens to overwinter.
Source: USFWS Endangered Species, revised January 10, 2018. The Minnesota Department of Natural Resources (DNR), in coordination with the USFWS, have identified several townships within the State of Minnesota that contain Northern long-eared bat (NLEB) maternity roost trees and/or hibernacula entrances. Two of these townships are in Ramsey County, both of which are within the southern half of the study area (Township 28 North, Range 22 West and Range 23 West). Both townships were denoted to contain NLEB hibernacula. The USFWS have also identified areas within the state where the Rusty patched bumble bee may be present. Per the USFWS Rusty patched bumble bee map,18 the study area is a combination of high potential zones (likely present) and low potential zones (not likely present). During future stages in project development, detailed field surveys may be required to determine the presence or absence of protected species and habitat in the study area.
2.3.4 Potentially Contaminated Concerns Land use in the study area is predominantly residential, interspersed with commercial and institutional uses. The Minnesota Pollution Control Agency’s (MPCA) What’s In My Neighborhood database provides information for potentially contaminated sites, and environmental permits and registrations. A review of the database returned 170 sites (Appendix F includes a list of these sites) within the study area, and suggested no presence of agricultural chemicals.19 Figure 2-13 graphically depicts the contaminated concerns within the study area. Further review of the MPCA’s website determined no State Superfund sites are located within the study area.20 Construction activities in or near any sites that appear to have the potential to be a hazardous concern would require further investigations to determine the risk and extent of any contamination, and may require special procedures and permits.
18 USFWS, Rusty Patched Bumble Bee Map, https://www.fws.gov/midwest/endangered/insects/rpbb/rpbbmap.html, accessed August 2018. 19 Minnesota Department of Agriculture, What’s in My Neighborhood?, https://app.gisdata.mn.gov/mda-agchem/, accessed August 2018. 20 Minnesota Pollution Control Agency, State Superfund site summaries, https://www.pca.state.mn.us/waste/state-superfund-site-summaries

Feasibility Study |July 2020 |
26 | P a g e
Figure 2-13: Potentially Contaminated Concerns within the Study Area

Feasibility Study |July 2020 |
27 | P a g e
2.3.5 Air Quality Per the Clean Air Act of 1970, the six criteria pollutants of concern include carbon monoxide, lead, nitrogen dioxide, ozone, particulate matter, and sulfur dioxide. The State of Minnesota currently is in attainment for all criteria pollutants; therefore, it meets or beats all the federal standards for criteria air pollutants.21 MnDOT’s Rethinking I-94 report discusses potential air quality concerns regarding freeway lids (i.e. tunnels). In summary, air quality impacts regarding short tunnel projects do not pose an air quality concern; whereby, longer tunnels that use mechanical ventilation may pose an air quality concern. A detailed air quality analysis will be required, as the project development process progresses.
2.3.6 Noise Highway noise is a concern in the study area due to the proximity of I-94 to residences. If the project is an FHWA undertaking, it would likely meet the criteria as a Type 1 project and undergo a Noise Impact Analysis. If the project is a state funded project, no noise analysis is required unless it crosses mandatory Environmental Quality Board (EQB) thresholds. Ultimately, the determination of a Noise Impact Analysis and its applicability will be determined further in the project development process.
2.3.7 Environmental Justice The U.S. Department of Transportation (USDOT), FHWA, and the U.S. Council on Environmental Quality (CEQ) provide guidance to determine the presence or absence of environmental justice communities in areas where federal actions are being studied. The guidance defines minority and low-income communities (collectively, environmental justice communities) as follows:
2.3.7.1 Minority Communities Minority Communities include Black, Hispanic or Latino, Asian American, American Indian and Alaskan Native, and Native Hawaiian or Other Pacific Islander persons.22 Per CEQ and USDOT guidance, minority populations are identified where either: 1) minority population of the affected area exceeds 50 percent; or 2) minority population percentage of the affected area is meaningfully greater than the minority population percentage in the general population or other appropriate unit of geographic analysis. For this TM, the City of Saint Paul was used as the primary statistical reference area. Per Table 2-11, minorities represent approximately 47 percent of Saint Paul’s population and approximately 60 percent of the study area (i.e. affected area). Therefore, the study area exceeds both thresholds previously outlined to define an environmental justice minority community.
21 Rethinking I-94, MnDOT, Appendix T4, page 15, August 2018. 22 USDOT Order 5610.2.

Feasibility Study |July 2020 |
28 | P a g e
Figure 2-14 depicts the percentage of minority populations in the study area by census block group.23
Table 2-11: Minority Communities
Geographic Area Total Population
Non-Minority Population
Minority Population
Percent Minority1, 2
Minnesota 5,450,868 4,432,384 1,018,484 18.7 Ramsey County 531,528 339,924 191,604 36.0 City of Saint Paul 297,160 158,684 138,476 46.6 Study Area 13,905 5,542 8,363 60.1
CT 334, BG 1 1,458 485 973 66.7 CT 335, BG 1 1,401 256 1,145 81.7 CT 335, BG 2 825 173 652 79.0 CT 335, BG 3 1,711 320 1,391 81.3 CT 336, BG 1 1,639 80 1,559 95.1 CT 338, BG 1 1,751 698 1,053 60.1 CT 338, BG 2 504 317 187 37.1 CT 339, BG 1 1,628 651 977 60.0 CT 340, BG 2 772 580 192 24.9 CT 353, BG 1 1,132 867 265 23.4 CT 353, BG 2 1,084 1,015 69 6.4
1 Percentages in bold were identified as minority populations – greater than 50 percent. 2 Margin of error +/- 4.0 percent. Source: U.S. Census Bureau, 2012-2016 ACS 5-Year Estimates, Table B03002: Hispanic or Latino Origin by Race.
23 To maintain consistent thresholds throughout the study area, thresholds of 25, 50, and 75 were used to visually differentiate among high- and low-percentage minority block groups, with consideration of natural breaks in the data and of values presented in Table 2-11.

Feasibility Study |July 2020 |
29 | P a g e
Figure 2-14: Minority Block Groups per Environmental Justice Analysis

Feasibility Study |July 2020 |
30 | P a g e
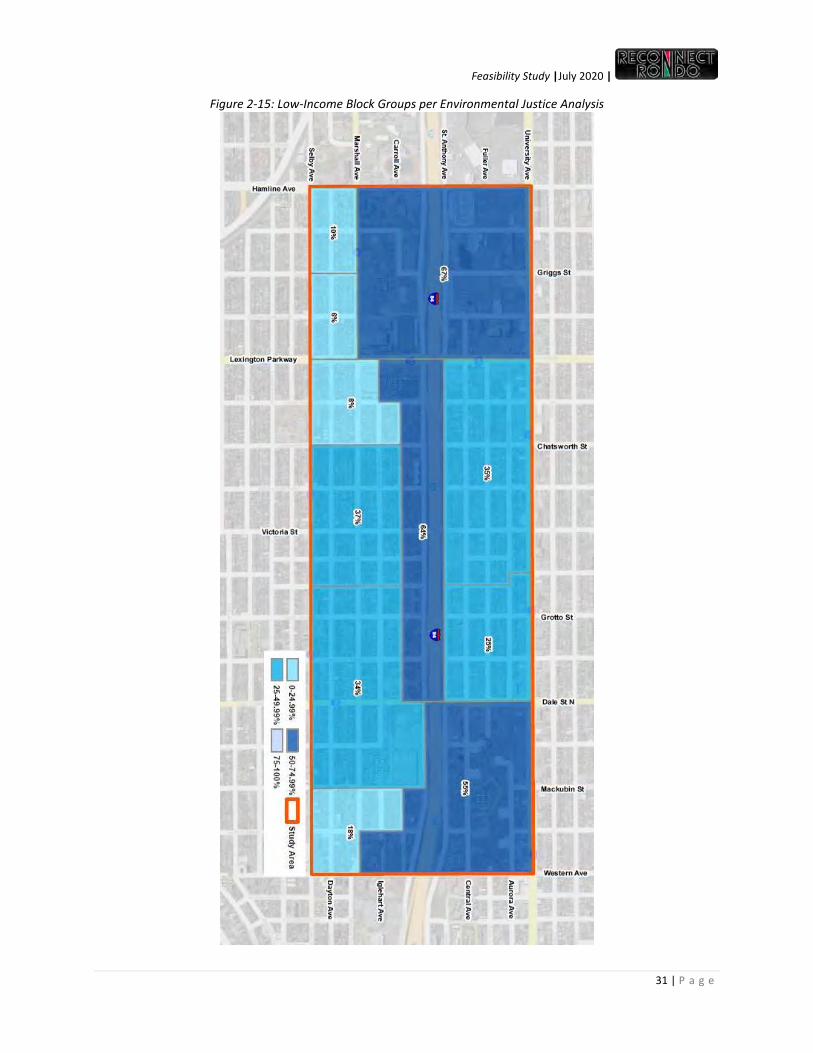
2.3.7.2 Low-Income Communities Low-Income communities include the population whose household income is at or below the Department of Health and Human Services poverty guidelines.24 The percent of individuals below poverty level in each census block group, was used to identify low-income communities. To determine whether a block group is a low-income community, the percentage of its population below the poverty level was compared to the average for Saint Paul, as a whole. Therefore, since the study area has a percentage of population below the poverty level of approximately 34 percent, greater than 22 percent, the Saint Paul average, the area is considered an environmental justice low-income community. Table 2-12 depicts the percentage of low-income individuals (that is, those with household income below the federally established poverty level) for each geographic level analyzed. Figure 2-15 depicts the percentage of low-income populations in the study area by census block group.25
Table 2-12: Low-Income Communities
Geographic Area Population for Poverty Determination1
Above Poverty Below Poverty Percent Below Poverty2, 3
Minnesota 5,327,019 4,749,823 577,196 10.8 Ramsey County 517,710 435,458 82,252 15.9 City of Saint Paul 289,516 227,111 62,405 21.6 Study Area 13,151 8,657 4,494 34.2
CT 334, BG 1 1,002 330 672 67.1 CT 335, BG 1 1,401 1,049 352 25.1 CT 335, BG 2 775 281 494 63.7 CT 335, BG 3 1,665 1,077 588 35.3 CT 336, BG 1 1,629 734 895 54.9 CT 338, BG 1 1,720 1,090 630 36.6 CT 338, BG 2 504 463 41 8.1 CT 339, BG 1 1,579 1,047 532 33.7 CT 340, BG 2 660 541 119 18.0 CT 353, BG 1 1,132 1,068 64 5.7 CT 353, BG 2 1,084 977 107 9.9
1 For whom poverty status is determined. 2 Percentages in bold were identified as low-income populations. 3 Margin of error +/- 4.0 percent. Source: U.S. Census Bureau, 2012-2016 ACS 5-Year Estimates, Table C17002: Ratio of Income to Poverty Level in the Past 12 Months.
24 USDOT Order 6640.23. 25 To maintain consistent thresholds throughout the study area, thresholds of 10, 25, and 50 were used in order to visually differentiate among high- and low-percentage low-income block groups, with consideration of natural breaks in the data and of values presented in Table 2-12.
Feasibility Study |July 2020 |
31 | P a g e
Figure 2-15: Low-Income Block Groups per Environmental Justice Analysis

Feasibility Study |July 2020 |
32 | P a g e
As depicted in Figure 2-14 and Figure 2-15, seven (7) of 11 block groups in the study area are defined as minority communities, and the same seven (7) block groups are considered low-income communities; thus, the study area is defined as an environmental justice community, per the USDOT and CEQ guidance described above.
2.4 Transportation Overview
2.4.1 Roadway Characteristics The roadway layout within the study area follows a traditional grid system with longer blocks from east-to-west and shorter blocks from north-to-south. Due to the grid network, horizontal curvature in the area is limited. The most significant route within the study area is I-94, which runs east-west, and includes diamond interchanges at Lexington Parkway and Dale Street, and a westbound exit to Hamline Avenue. Frontage road access to the highway is provided via St. Anthony Avenue and Concordia Avenue. Most roads within the study area are urban two-lane undivided roadways with statutory speed limits of 30 miles per hour (MPH). Exceptions are detailed in Table 2-13.
Table 2-13: Roadway Characteristics within the Study Area Road Lanes Division Speed Limit Interstate 94 8 Concrete Barrier 55 MPH St. Anthony Avenue 2 (One-Way) N/A (Frontage Road) 30 MPH Concordia Avenue 2 (One-Way) N/A (Frontage Road) 30 MPH University Avenue 4 Light rail infrastructure 30 MPH Hamline Avenue 4 Undivided 30 MPH Lexington Parkway 4 Curb and Grass 30 MPH Dale Street 4 Curb (North of I-94); Undivided (South of I-94) 30 MPH
Source: Google Earth The most common traffic control devices at intersections are minor-leg stop, all-way stop, and signal control. Signalized intersections occur along University Avenue, Dale Street, Lexington Parkway, and Hamline Avenue. Transit signal priority for the light rail is implemented at all the signalized intersections along University Avenue, which includes an emergency vehicle use signal at Albans Street. Jurisdiction of right-of-way for roads in the study area varies. Ownership of the right-of-way is relevant to the future authority of these areas and will be determined later in project development.
2.4.2 Structure Inventory Throughout the study area, I-94 is depressed with varying sideslope dimensions and a small presence of retaining wall. The majority of the interstate right-of-way is bound with chain link fence, and no soundwall structures are present. As I-94 is fully access controlled; structures traversing the highway are limited to the existing nine (9) overpasses, four (4) pedestrian bridges, and four (4) overhead span sign structures (Table 2-14). All four pedestrian bridges currently meet ADA compliance, have a good overall structure rating, and were built between 2009 and 2016.26 26 Rethinking I-94, Appendix T1: Asset Conditions, Map and Program Schedule, page 7, August 2018.

Feasibility Study |July 2020 |
33 | P a g e
Table 2-14: I-94 Structures within the Study Area
Location Function Accommodates Vehicular Traffic
Accommodates Pedestrian and/or Bicycle Traffic
Hamline Avenue Overpass Bridge X X Griggs Street Pedestrian Overpass - X Lexington Parkway Interchange Bridge X X Chatsworth Street Pedestrian Overpass - X Victoria Street Overpass Bridge X X Grotto Street Pedestrian Overpass - X Dale Street Interchange Bridge X X Macubin Street Pedestrian Overpass - X Western Avenue Overpass Bridge X X
Source: Google Earth
2.4.3 Traffic Conditions The majority of roadway miles within the study area are residential local roads maintained by the City of Saint Paul. The functional classifications and average daily traffic (ADT) for roads beyond a local functional classification are listed in Table 2-15.
Table 2-15: Traffic Conditions for Collector and Arterial Roads within the Study Area Street Functional Classification ADT I-94 Principal Arterial 159,000 Concordia Avenue Major Collector 4,025 Dale Street Minor Arterial 17,620 Hamline Avenue Major Collector 16,500 Lexington Parkway Minor Arterial 26,525 Marshall Avenue Minor Arterial 3,950 St. Anthony Avenue Major Collector 3,125 Selby Avenue Major Collector 5,010 University Avenue Minor Arterial 15,275 Victoria Street Major Collector 4,370 Western Avenue Major Collector 5,100
Sources: MnDOT ftp site: ftp2.dot.state.mn.us/pub/outbound/TDA/Traffic%20Monitoring/Products/2017_Public_Files_AADT/, MetCouncil and NCompass Technologies, Functional Class Roads, April 12, 2018. In addition to the arterials and collectors, the interchanges along I-94 produce ingress and egress traffic to the study area. The traffic volumes (weighted ADT) corresponding to these ramps are listed in Table 2-16.
Table 2-16: I-94 Traffic Volumes for Ramps within the Study Area Road Direction Enter I-94 Exit I-94
Dale Street Eastbound 8,250 8,650 Westbound 9,200 9,500
Lexington Parkway Eastbound 10,400 10,100 Westbound 10,550 8,800
Hamline Avenue Westbound [Only] - 7,350 Source: Rethinking I-94, Appendix T5: Existing Traffic Volume Data Summary, pages 6-7. Rethinking I-9427 provides an overview of the crash history along I-94 in the study area. A broader section of I-94 between TH 280 and Marion Street is a 4.2-mile stretch that extends beyond the study area in both directions. Its crash rate is 0.70 crashes per million vehicle miles traveled (MVMT) and its fatality rate is
27 Rethinking I-94, Appendix T10: Crash Data Summary, August 2018.

Feasibility Study |July 2020 |
34 | P a g e
0.26 fatalities per hundred million vehicle miles traveled (HMVMT). The crash history for the three interchanges within the study area are listed in Table 2-17.
Table 2-17: Crash History for I-94 Interchanges within the Study Area
Interchange Crash Severity (2011-2015)1 Crash Cost Crash Rate K A B C PDO Total
Dale Street 0 1 19 100 313 433 $2,896,000 1.35 Lexington Parkway 1 3 22 99 472 597 $3,679,000 1.67 Hamline Avenue 0 0 9 38 133 180 $1,139,000 0.56
1 K=Killed, A=Incapacitating Injury, B=Non-Incapacitating Injury, C=Possible Injury, PDO=Property Damage Only Source: Rethinking I-94, Appendix T10: Crash Data Summary. The Institute of Transportation Engineers recommends a geographic size and time horizon for traffic impact studies based on the expected peak hour trip generation.28 Consequently, it is recommended and will likely be warranted that a traffic impact study be conducted should the Rondo Land Bridge or equivalent project progress in development.
2.4.4 Access and Circulation The transportation infrastructure in the study area accommodates multiple modes of transportation, including driving, transit, walking, and bicycling.
2.4.5 Driving The majority of the roadway network is bi-directional and provides through access. The primary trip generation are attributed to residences and commercial activity, which are accommodated with a range of off-street and on-street parking options. Off-Street Parking - A combination of alleys and driveways provides off-street parking for the majority of housing units. Restricted access surface parking lots provide off-street parking for schools, apartment buildings, and most service and commercial entities. On-Street Parking - Most streets allow for on-street parking with occasional restrictions, and no residential permit zones exist within the study area. There is limited or no parking present on Hamline Avenue, University Avenue, Lexington Parkway, and Dale Street. Metered parking is intermittently present along University Avenue.
2.4.6 Transit Both light rail transit and bus transit service is provided by Metro Transit within the study area. Light Rail - Metro Transit’s Green Line runs along University Avenue and provides direct access to several major nodes including downtown Saint Paul, the University of Minnesota campus, and downtown Minneapolis. Five stations are present within the study area, including at: Hamline Avenue, Lexington Parkway, Victoria Street, Dale Street, and Western Avenue.29 The Green Line primarily operates at a frequency of 15 minutes or better during daytime service hours on weekdays and Saturdays. Bus - Four primary bus transit routes, as depicted in Figure 2-16, are served in the study area, including: Route 16, University Avenue; Route 21, Hamline Avenue, Selby Avenue; Route 65, Dale Street; and, Route
28 Institute of Transportation Engineers (ITE), Transportation Impact Analyses for Site Development, September 2010. 29 MetroTransit, https://www.metrotransit.org/metro-green-line, accessed September 2018.

Feasibility Study |July 2020 |
35 | P a g e
83, Lexington Avenue.30 These routes primarily operate at frequencies between 15 and 60 minutes during normal service hours. Additional express routes run through the area but serve limited local access. Route 16 provides service concurrent to the Green Line with more frequent stops.
Figure 2-16: Bus Routes within the Study Area
2.4.7 Walking The pedestrian network within the study area is extensive, and includes the following: Walkways - Sidewalk and walkway coverage is continuous throughout the study area with few to no gaps in coverage along all public roads. The majority of sidewalks within the study area have an effective width of 4 to 6 feet. Curb ramps - Curb ramps are provided at all four quadrants among most intersections. Traffic Calming - Curb extensions are occasionally present at intersections along Lexington Parkway, Marshall Avenue, and Selby Avenue. Crossings - Minnesota law specifies that drivers must stop for crossing pedestrians at marked crosswalks and at all unsignalized intersections.31 Within the study area, crosswalk pavement markings are provided at most signalized intersections. Unsignalized intersection crossings range from no markings, pavement markings only, and a combination of signs and markings. The pavement markings used to indicate a crosswalk vary throughout the study area.
2.4.8 Bicycling Bicycle facilitates in the study area provide full north-south coverage along Griggs Street and Western Avenue, and lack full coverage of any east-west routes. A combination of on-street bicycle lanes and shared lanes are the predominant type of bicycle infrastructure present within the study area (Table 2-18).
30 MetroTransit, https://www.metrotransit.org/imap/map.aspx, accessed September 2018. 31 Minnesota Statutes, https://www.revisor.mn.gov/statutes/2008/cite/169.21, accessed September 2018.

Feasibility Study |July 2020 |
36 | P a g e
Table 2-18: Bicycle Facilities Road Bikeway Type Coverage within Study Area Marshall Avenue On-Street Bike Lane Partial Griggs Street Bike Boulevard Full Western Avenue On-Street Bike lane; Sharrows Full
Source: Saint Paul Bicycle Plan, last updated July 19, 2017.
2.5 Travel Characteristics The following details the commuting characteristics, based on the U.S. Census Bureau, 2012-2016 ACS 5-Year Estimates, for the 11 block groups within the study area. Comparison data is provided for the City of Saint Paul, Ramsey County, and the State of Minnesota.
2.5.1 Travel Means to Work As illustrated in Figure 2-17, the most frequent travel means to work in the study area are driving alone (67 percent), public transportation (11 percent), and carpooling (9 percent). These values are similar to the citywide, countywide, and statewide distributions, with the primary differences being a lower proportion of driving alone and a higher proportion of public transportation within the study area.
Figure 2-17: Distribution of Travel Means to Work32
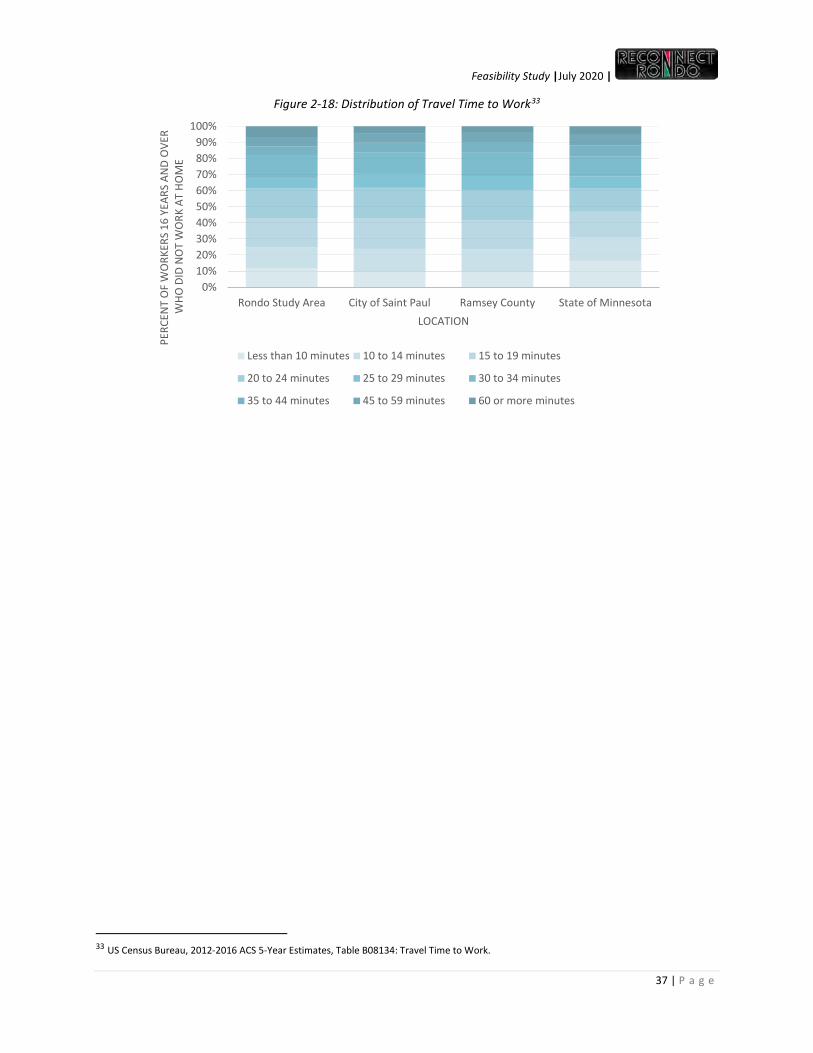
2.5.2 Travel Time to Work The median travel time to work falls within the 20 to 24 minutes range, which is consistent with citywide, countywide, and statewide trends (Figure 2-18). Of the varying travel means to work, public transportation has the longest median travel time at 60 or more minutes.
32 US Census Bureau, 2012-2016 ACS 5-Year Estimates, Table B08301: Travel Means to Work.
0%
20%
40%
60%
80%
100%
RondoStudy Area
City of SaintPaul
RamseyCounty
State ofMinnesota
PERC
ENT
OF
WO
RKER
S 16
YEA
RS A
ND
OVE
R
LOCATION
Other means
Worked at home
Bicycle
Walked
Public transportation (excludingtaxicab)Car, truck, or van: Carpooled
Car, truck, or van: Drove alone
Feasibility Study |July 2020 |
37 | P a g e
Figure 2-18: Distribution of Travel Time to Work33
33 US Census Bureau, 2012-2016 ACS 5-Year Estimates, Table B08134: Travel Time to Work.
0%10%20%30%40%50%60%70%80%90%
100%
Rondo Study Area City of Saint Paul Ramsey County State of Minnesota
PERC
ENT
OF
WO
RKER
S 16
YEA
RS A
ND
OVE
RW
HO D
ID N
OT
WO
RK A
T HO
ME
LOCATION
Less than 10 minutes 10 to 14 minutes 15 to 19 minutes
20 to 24 minutes 25 to 29 minutes 30 to 34 minutes
35 to 44 minutes 45 to 59 minutes 60 or more minutes

Feasibility Study |July 2020 |
38 | P a g e
Page intentionally left blank.

Feasibility Study |July 2020 |
39 | P a g e
3.0 PRELIMINARY MARKET & ECONOMIC ANALYSIS

Feasibility Study |July 2020 |
40 | P a g e
To provide a foundation for the future market and economic decisions that will be made by RCR and their agency partners, RKG Associates, Inc. prepared an economic analysis as part of the evaluation process. The purpose of the economic analysis was to analyze the Rondo neighborhood’s real estate market to determine possible catalytic projects or activities that could be associated with the RLB. The following summarizes the market analysis findings: Commercial – The site for the proposed RLB over I-94, as developed in the preliminary planning stage, is not supportive of significant new commercial development in the near term.
• The neighborhood has an excess of retail activity for its population and spending potential, with most of it located along University Avenue and to a lesser extent on Selby Street.
• The site’s location, 3-4 blocks away from the Green Line Light Rail that runs along University Avenue, puts it at a competitive disadvantage to businesses on or closer to the line.
• New transit-oriented mixed-use development and redevelopment along University Avenue (and to a lesser degree on Selby Street) is indicative of the strength of the current economy and regional market.
Residential – The housing market in the study area is relatively strong, with rising prices and low inventory.
• Single-family homes and condominiums in the neighborhood are selling quickly and at historically high prices, and older homes are being renovated for resale or by new owners.
• Based on demographic trends, it appears many older, long-time residents are selling to younger but still middle-age buyers, suggesting an opportunity for new development that meets the needs of this older generation, such as a continuing care community, downsized housing units, or similar concepts.
• The neighborhood is currently mostly rental occupied (60 percent) but home ownership is rising as rental units are converted to for-sale units. This suggests the need for more rental product in the market.
• The overall income and wealth levels in the neighborhood suggest a need for affordable housing, including a mix of subsidized low income units up to and including “workforce” housing, which may or may not need extensive subsidies.
• Rising household incomes support these ownership trends, as more and more households can support the costs necessary to purchase homes. What is not known (since current Census data lags current market), is whether these higher income households are existing residents “moving up” or newcomers attracted by the relatively attractive pricing and good locational amenities offered by the Rondo neighborhood.
• Affordable housing for the neighborhood’s senior population, including the potential for assisted living, might be coupled with programs that assist younger families to remain in the area. Commercial uses could also be combined with programs focused toward start-up businesses and retail/service incubator concepts, to help neighborhood residents stay and build wealth in the Rondo neighborhood.
Employment – The site is located between two major employment centers (downtown Saint Paul and University of Minnesota/downtown Minneapolis), each of which have relatively high office vacancy rates and new development potential.
• The transit-oriented development along University Avenue is providing additional supply to the office market, thus reducing demand for locations without these attributes.

Feasibility Study |July 2020 |
41 | P a g e
Institutional – The neighborhood is characterized by a relatively large concentration of private secondary educational institutions.
• While this is a positive attribute, by providing a degree of cultural potential as well as student housing demand, national and state enrollment trends do not support expansion of this sector.
• Other institutional users such as hospitals or government agencies, tend to locate on or near major transportation hubs, so it would be an exception to presume one might find this location attractive.
• However, locally serving government or social service users might be attracted to the site, if economically feasible.
In summary, the RLB site is likely to support a mix of housing types and price ranges. Market rate housing, defined as affordable to households earning $75,000 or more, appears to be in relatively strong demand and the ability to create new supply by providing new land and development opportunities, is likely to be well received by the market. This market rate development may, in turn, support additional affordable housing production. Commercial development will be limited to neighborhood-serving retail and services. Any large scale office or institutional use would be dependent on non-foreseeable circumstances.

Feasibility Study |July 2020 |
42 | P a g e
Page intentionally left blank.

Feasibility Study |July 2020 |
43 | P a g e
4.0 GOALS, ISSUES, AND OPPORTUNITIES

Feasibility Study |July 2020 |
44 | P a g e
Recognizing what exists within the study area and its community and historical context, the project team developed the Feasibility Study goals. This section describes the goals for the Feasibility Study, developed through a review of the project’s themes and subsequent strengths, weaknesses, opportunities, and threats (SWOT) analysis.
4.1 Themes Based on a review of available documents completed to date for the idea of a RLB, the following is a list of ‘themes’ RCR is trying to accomplish with its implementation:
• Neighborhood and School Connectivity • Affordable Housing • Equitable Economic Development • Job Creation and Growth • Localized Economy • Wealth Creation
• Improved Quality of Life • Access to Physical Activity • Access to Green Space • Programming for Youth and Elderly • Gentrification Concerns
4.2 SWOT Analysis The following provides a summary of strengths, weaknesses, opportunities, and threats associated with the potential development of the RLB within the study area associated with this Feasibility Study. Strengths and weaknesses refer to the existing conditions of the study area, which are either helpful or harmful to achieving the goals of the project. Strengths are favorable conditions to be built upon, whereas weaknesses are unfavorable conditions to be considered in the design and planning processes. Opportunities and threats refer to potential future conditions of the study area. Opportunities are potential improvements and favorable conditions the project will seek to achieve. Threats are the potential barriers that may impede the realization of project goals. Opportunities will be prioritized and optimized; whereas, threats will be countered or minimized. This analysis is most effectively utilized as a guide to understanding already known conditions within the study area and adjacent areas. It is not intended to provide full details of each issue, but rather provide a brief synopsis of the strengths to build upon, weaknesses to be dealt with, opportunities to be capitalized on, and threats to be either minimized or treated in future planning efforts. Strengths
• Historically Established Neighborhood • Existing recognized arts and cultural community (i.e. Selby Avenue Jazz Fest, Penumbra Theatre). • Rondo Community Land Trust • On-going work by community leaders and groups provides a foundation for required analyses. • Victoria Street lacks on/off ramps, avoiding conflicts with freeway functions.
Weaknesses
• Project lacks a Master Plan – a long-term planning document that provides a conceptual layout to guide future growth and development and includes analysis, recommendations, and proposals for an area’s population, economy, housing, transportation, community facilities, and land use.
• Project lacks a comprehensive market analysis and financial analysis to examine the feasibility before a development program is finalized.
• Developing outside of Victoria Street runs the risk of conflicting with freeway functions. • Project area lacks a district council since it is a historic neighborhood, currently split between two
councils.
Feasibility Study |July 2020 |
45 | P a g e
Opportunities
• Healing a neighborhood identity by creating wealth for current and displaced residents. • Redevelop vacant properties. • Removal/redevelop blighted properties. • Create open space for passive recreation and social interaction, which the area currently lacks. • Promotion of the existing arts and cultural district, while capitalizing on the potential wealth-
building opportunity for the district and the neighborhood. Threats
• Gentrification concerns similar to other developed areas of St. Paul. • Environmental impacts - hazardous waste, threatened and endangered species (e.g. Rusty
patched bumble bee). • Lack of scale of traffic changes prevents certainty on a number of impacts. • Lack of private funding to pay for features not covered by public funding. • Resident perception of improvements, since previous improvements perceived to have negative
impacts.
4.3 Goals The themes, in consideration of the SWOT analysis, fostered development of the following goals for this Feasibility Study:
• Neighborhood Reconnection – Physically, reconnect the neighborhood on both sides of I-94 in ways that serve as a catalyst for wider community-wide initiatives; alternatively, socially, create a cultural connection that promotes community leadership.
• Affordable Housing – Provide mechanisms to minimize barriers, and provide financial incentives, to promote the production and preservation of a diverse, safe, healthy, and affordable housing stock for residents to build wealth.
• Equitable Development – Create a framework for inclusive economic opportunity for an equitable community, as a result of collaboration and sustainable wealth-building.
• Public Health/Green Space – Improve public health disparities by providing access to green space and outdoor opportunities.
• Community Leadership – Strategize to keep this project a “community led” initiative and work closely with state, regional and city officials to implement regulatory and policy solutions, as appropriate, to maximize community involvement and to minimize involuntary displacements and moderate gentrification.

Feasibility Study |July 2020 |
46 | P a g e
Page intentionally left blank.

Feasibility Study |July 2020 |
47 | P a g e
5.0 CONCEPTS AND INITIAL SCREENING

Feasibility Study |July 2020 |
48 | P a g e
Now aware of what exists within the study area and having developed goals, the project team performed an initial screening to determine which concepts would be further reviewed; however, first, the concepts needed to be synthesized per their various elements. This section details the synthesized concepts and the initial screening results, and the forthcoming evaluation criteria for the next step in the evaluation process. Because this project is in an early phase of project development, collaboration between the project team and project leaders will be ongoing as the project moves forward. As such, the screening and evaluation methodologies will be revisited and may be refined, and other concepts may be included, as appropriate.
5.1 Concepts Based on a review of available documents and engagement efforts completed to date, there are seven (7) fundamental concepts presented for the RLB. These concepts are detailed further in the Rondo Land Bridge Elements Matrix (Appendix G), and described briefly as follows: Concept 1: Street/Bridge Expansions (Short) - Concept 1 consists of an overpass bridge expansion providing a combination of green space and recreation, commercial or residential facilities. This concept provides the most simplistic concept with respect to size and complexity. The approximate size of this expansion would be between 300 to 500 linear feet in length and 1 to 3 acres in area. The ratio of open space to developed area is flexible in this scenario, in which the capacity may be up to 5034 housing units, and could facilitate a minimum of 20 percent open space coverage. The types of housing, work spaces, commercial activity, and recreational amenities may vary in scope and size. Concept 2: Simple Lid with Development Potential (Medium) - Concept 2 consists of a freeway lid with bridge structural elements to provide a combination of green space and one-to-two story development for recreation, commercial, or residential facilities. This concept spans from Victoria Street to Avon Street, resulting in an approximate size of between 700 to 1,000 linear feet in length and 5 to 7 acres in area. This concept reflects a medium footprint concept, the smallest of the freeway lid concepts, with respect to size and complexity. This concept allows for a flexible ratio of open space to developed area, in which the capacity may be up to 150 housing units, and could facilitate a minimum of 20 percent open space coverage. The types of housing, work spaces, commercial activity, and recreational amenities would likely include a mixture of development two stories or less in size. Concept 3: Simple Lid with Development Potential (Medium) - Similar to Concept 2, Concept 3 consists of a freeway lid with bridge structural elements to provide a combination of green space and one-to-two story development for recreation, commercial, or residential facilities. This concept spans from Milton Street to Fisk Street, resulting in an approximate size of between 900 to 1,200 linear feet in length and 7 to 9 acres in area. This concept reflects a medium footprint concept with respect to size and complexity. This concept intends for a flexible ratio of open space to developed area, in which the capacity may be up to 200 housing units, and could facilitate a minimum of 20 percent open space coverage. The types of housing, work spaces, commercial activity, and recreational amenities may include a mixture of development two stories or less in size. Concept 4: Simple Freeway Lid (Long) - Concept 4 consists of an expanded freeway lid that provides primarily green space and recreational amenities. The concept spans from Chatsworth Street to Grotto Street, resulting an approximate size of between 2,600 to 3,200 linear feet in length and 15 to 22 acres in
34 Housing units represent an average size of 850 square feet.

Feasibility Study |July 2020 |
49 | P a g e
area. This concept reflects a large footprint concept with respect to size and complexity. As this concept intends for a higher proportion of green space, the capacity may be up to 350 housing units, and could facilitate approximately 70 percent open space coverage. The types of housing, work spaces, and commercial activity are those limited in scope and size, whereas the recreational amenities would likely include those of greater complexity. Concept 5: Lid with 1-2 Story Buildings (Long) - Concept 5 consists of an expanded freeway lid with structural elements that support development of one-to-two story development for recreational, commercial, and residential purposes. The concept spans from Chatsworth Street to Grotto Street, resulting an approximate size of between 2,600 to 3,200 linear feet in length and 15 to 22 acres in area. This concept reflects a large footprint concept with respect to size and complexity. As this concept intends for a relatively equal proportion of open space to developed area, the capacity may be up to 600 housing units, and could facilitate approximately 50 percent open space coverage. The size and types of housing, work spaces, commercial activity, and recreational amenities would likely include a mixture of development two stories or less in size. Concept 6: Developed Freeway Lid with Multistory Buildings (Long) - Concept 6 consists of an expanded freeway lid with structural elements that support development of multistory buildings for recreational, commercial, and residential purposes. The concept spans from Chatsworth Street to Grotto Street, resulting an approximate size of between 2,600 to 3,200 linear feet in length and 15 to 22 acres in area. This concept provides the largest and most elaborate concept with respect to size and complexity. As this concept intends for a majority of developed area, the capacity may be up to 1,200 housing units, and could facilitate approximately 30 percent open space coverage. The size and types of housing, work spaces, commercial activity, and recreational amenities may predominantly include those that are multifaceted in scope and multistory in size. Concept 7: Embankment Expansion - Concept 7 consists of the expansion of the embankments through structural modification that may provide a combination of green space, recreation, commercial or residential facilities. The approximate size of this expansion would be between 2,000 and 2,600 linear feet in length and 4 to 8 acres in area. This concept provides an alternative to the freeway lid structure and is moderate in size and complexity. The ratio of open space to developed area in flexible in this scenario, in which the capacity may be up to 200 housing units, and could facilitate a minimum of 20 percent open space coverage. The types of housing, work spaces, commercial activity, and recreational amenities are those limited in footprint but may be more complex in scope.
5.2 Initial Screening The initial screening provides a rational framework to screen the concepts and eliminate those with discernable complications or unlikely reparable conditions. To clearly distinguish which concepts would meet the goals of the project, each concept was screened based on the goals outlined in Section 4.3. Each concept was screened on a recommend/eliminate basis. If the concept met at least three goals, it was recommended for further analysis. If it did not meet three goals, it was eliminated from further analysis. This screening is not intended to be a comprehensive quantitative analysis, but instead a qualitative evaluation to remove concepts that do not meet a majority of the goals of the project. Therefore, because a concept is determined for elimination in this analysis, does not suggest it cannot be analyzed in a future study – no concept has been completely eliminated. The evaluation framework and process for screening concepts for the Feasibility Study is based on the

Feasibility Study |July 2020 |
50 | P a g e
current understanding of the needs within the study area and throughout the region, as well as the needs expressed by participants during public engagement events. The overarching objective of this process is to screen the concepts to identify those most responsive to the project’s needs, and subsequently to identify the evaluation criteria to be used to analyze the concepts recommended for further analysis. The following summarizes the results of the initial screening for each concept: Concept 1: Street/Bridge Expansions (Short) - RECOMMEND Neighborhood Reconnection - Creates moderately improved connectivity between the northern and
southern portions of Rondo and provides development opportunities for some housing, supporting retail, and commercial uses.
× Affordable Housing - With a maximum of 50 housing units, this concept provides limited opportunity for additional housing, which may be limited to market rate, unsubsidized housing.
Equitable Development - To encourage better development, this concept could act as a catalyst to combine redevelopment of Victoria Street with the efforts being done on University Avenue and Selby Avenue, both to the north and south. This could result in somewhat higher density and mixed uses to be developed over time, thus improving the connectivity between these two predominantly commercial corridors.
× Public Health/Green Space - This concept allows for limited acreage to be used as green space. The mitigating effects on noise and air pollution from the freeway are not applicable with this concept.
Community Leadership - This concept provides opportunities to implement community betterment initiatives, despite the limitations of these opportunities due to this concept’s small area for development. Because of this, the opportunities would need to be thoroughly articulated and vetted prior to implementation, rather than using the space for retail development.
Concept 2/3: Simple Lid with Development Potential (Medium) - RECOMMEND Since Concept 2 and Concept 3 are fundamentally the same, with variances in the size of development, these concepts have been combined and reviewed as a ‘hybrid’ concept. Neighborhood Reconnection - As with Concept 1, this concept improves connectivity north and south
and will be essential to help establish the lid as a development node or focus point. × Affordable Housing - With a maximum of 150 housing units, this concept provides limited opportunity
for additional housing, which may be limited to predominantly market rate, unsubsidized housing. Equitable Development - Locating this concept at Victoria Street, would allow for connections to the
Rondo Memorial at Fisk Street and achieve the social and economic goals for Rondo. Public Health/Green Space - These concepts call for a longer lid allowing for more development, as
well as open space for activities. The amount of vertical development could be phased with open space uses, building over time as market demands dictate.
Community Leadership - This concept provides opportunities to implement community betterment initiatives. Since these opportunities would be limited due to this concept’s somewhat limited area for development, the opportunities would need to be thoroughly articulated prior to implementation.
Concept 4: Simple Freeway Lid (Long) - ELIMINATE Neighborhood Reconnection - This concept creates new open space over I-94 to connect the northern
and southern portions of the Rondo neighborhood. × Affordable Housing - The focus of open space within this concept results in a relatively low housing
density with respect to the size of this concept’s footprint, which in turn provides limited options for subsidized or affordable housing.

Feasibility Study |July 2020 |
51 | P a g e
× Equitable Development - While this concept physically connects, it does not provide for an economic connection, including the ability to deal with housing and economic development needs of Rondo.
Public Health/Green Space - This concept provides a substantial amount of new open green space. While parks, open space and even community gardens would benefit surrounding properties and neighborhood residents, these benefits would primarily be confined to the warmer seasons only.
× Community Leadership - The low presence of development within this concept provides limited opportunities to implement a series of community betterment initiatives.
Concept 5: Lid with 1-2 Story Buildings (Long) - RECOMMEND Neighborhood Reconnection - This concept would provide strong linkages between north and south
Rondo, provided various street and other transportation improvements are made. Affordable Housing - The market analysis indicates there is currently moderate demand for housing
in the regional market. This concept could provide a combination of market rate and subsidized housing.
Equitable Development - This development configuration would allow for both significant open space (programmed or not) along with housing, supporting commercial and institutional uses as the market can support, which would develop over time. With this much available development, in-fill development between I-94 and University and Selby Avenues would likely not be fostered.
Public Health/Green Space - The balance of green space and development, alongside the environmental benefits of a covered freeway, provide activity, environmental, and all-season benefits to the public.
Community Leadership - Sufficient development options with this concept provide opportunities to implement community led initiatives.
Concept 6: Developed Freeway Lid with Multistory Buildings (Long) - ELIMINATE Neighborhood Reconnection - This concept would provide strong linkages between north and south
Rondo, provided various street and other transportation improvements are implemented. × Affordable Housing - The market analysis indicates that while there is moderate demand in the
regional market for housing, the amount suggested in this concept would result in a long build-out timeframe.
× Equitable Development - The market analysis indicates, currently or within the foreseeable future, there is no demand in the regional market for the amount of commercial space suggested in this concept, resulting in a long build-out timeframe.
× Public Health/Green Space - This concept creates the largest amount of development space, consisting of multi-story buildings intermixed with green space. Parking requirements would need to be met either on the lid itself or elsewhere in the neighborhood, thus impacting existing land uses.
Community Leadership - The variety of development options with this concept provides ample opportunities to implement a series of community-led and -involved initiatives.
Concept 7: Embankment Expansion - ELIMINATE × Neighborhood Reconnection - As this concept only builds within the existing I-94 ROW, north and
south reconnections are not made. × Affordable Housing - With a maximum of 200 housing units, this concept provides limited opportunity
for additional housing, which may be limited to predominantly market rate, unsubsidized housing. × Equitable Development - This concept provides the potential for multi-story buildings and a variety
of housing, retail, office and institutional uses. However, this concept could actually exacerbate development patterns, with the south side “connected” more to Selby Street and the north side

Feasibility Study |July 2020 |
52 | P a g e
“connected” more to University Avenue. Similar to Concept 6, the level of market support necessary for this amount of potential space is not anticipated.
× Public Health/Green Space - This concept allows for almost no acreage to be used as green space. The mitigating effects on noise and air pollution from the freeway are not applicable with this concept.
× Community Leadership - Due to this concept’s limited area for development, less opportunities are available to implement community betterment initiatives.
In summary, Concepts 1 (Figure 5-1), 2/3 (Concept 2, Concept 3, or a hybrid of the two concepts – Figure 5-2), and 5 (Figure 5-3) were recommended for further evaluation in the quantitative feasibility analysis, and Concepts 4, 6, and 7 were eliminated from further analysis.
Figure 5-1: Concept 1 Schematic

Feasibility Study |July 2020 |
53 | P a g e
Figure 5-2: Concept 2/3 Schematic
Figure 5-3: Concept 5 Schematic

Feasibility Study |July 2020 |
54 | P a g e
Table 5-1: Summary of Initial Screening of Concepts against Feasibility Study Goals
Concepts Goals
Recommend/ Eliminate Neighborhood
Reconnection Affordable Housing
Equitable Development
Public Health/ Green Space
Community Leadership
1: Street/Bridge Expansions (Short) X X Recommend
2/3: Simple Lid with Development Potential (Medium)
X Recommend
4: Simple Freeway Lid (Long) X X X Eliminate
5: Lid with 1-2 Story Buildings (Long) Recommend
6: Developed Freeway Lid w/Multistory Buildings (Long)
X X X Eliminate
7: Embankment Expansion X X X X X Eliminate
5.3 Evaluation Criteria The evaluation framework is based on the successive, iterative aforementioned evaluation of the concepts - first, was the qualitative screening, specifically pertaining to the project goals, and next a quantitative feasibility analysis. The following details the evaluation criteria developed for the Feasibility Study, as well as the supporting factors and proposed measures for each. As previously described, the project goals were used in the initial screening, and the other factors will be used in the subsequent feasibility analysis. The supporting factors will most likely change as the analysis progresses, in order to better differentiate between the concepts.
Table 5-2: Initial Proposed Evaluation Criteria Evaluation Criteria/Factor Proposed Measure Project Goals
• Neighborhood Reconnection - Reconnect the neighborhood on both sides of I-94 Yes/No • Affordable Housing - Provide opportunities for diverse, safe & affordable housing Yes/No • Suitable Development - Create inclusive economic opportunities Yes/No • Public Health/Green Space - Provide access to green space/outdoor opportunities Yes/No • Community Leadership - Keep this project a “community led” initiative Yes/No
Engineering/Traffic • Preliminary Opinion of Probable Project Construction Costs Cost ($) • Preliminary Opinion of Operations & Maintenance Costs Annual Cost ($) • Potential Public Utility Impacts Utilities • Potential Traffic Safety Impacts Intersections • Potential Impacts to I-94 Right-of-Way Square Feet of ROW Used
Network/Modal Connectivity • Local Road Re-connections # of Re-Connections • Pedestrian Connectivity # of New Connections • Bicycle Connectivity # of New Connections • Transit Connectivity # of Routes Modified
Environment/Health • Air Quality/Noise Impact Potential -- • Historic/Cultural Properties Impact Potential Historic Properties • Low Income/People of Color Impact Potential % EJ • Potential for New Gathering Spaces #/Area

Feasibility Study |July 2020 |
55 | P a g e
Evaluation Criteria/Factor Proposed Measure • Potential for New Cultural/Historic Interpretive Opportunities #/Area • Potential for Green Space/Green Infrastructure #/Area
Economic Opportunities • Consistency with Local Plans/Policies Yes/No • Amount of New Developable Property Acres • Potential for Housing/Residential Development #/Square Feet • Potential Revenue from Housing/Residential Development # Annual • Potential for Retail/Commercial Development #/Square Feet • Potential Revenue from Retail/Commercial Development # Annual • Potential for Job Creation/Enhancement #/Square Feet • Accessibility to Area Jobs/Businesses Minutes

Feasibility Study |July 2020 |
56 | P a g e
Page intentionally left blank.

Feasibility Study |July 2020 |
57 | P a g e
6.0 FEASIBILITY ANALYSIS

Feasibility Study |July 2020 |
58 | P a g e
With three concepts – 1, 2/3, and 5 – passing the initial screening, which was the evaluation of the goals, the project team next performed the feasibility analysis. This feasibility analysis was prepared in the traditional sense, such that it is intended to identify the need for further evaluation of the concepts, because the design strategy and footprint are uncertain at this time. This section details the development and further analysis of the evaluation criteria applied to the three concepts, which is then summarized in Table 6-5. In review of the evaluation outlined in this section, the project team was mindful of the opportunities to add value to the overall project, as outlined in Section 4.0.
6.1 Engineering and Cost Analysis An explanation and evaluation of the fundamental engineering and traffic criteria analyzed as part of the feasibility analysis are detailed in the following sections, with estimates detailed in Appendix H.
6.1.1 Probable Construction Costs The construction costs are the non-recurring direct and indirect costs associated with the labor, material, equipment, and other factors of the final design and construction process. The probable construction costs for the RLB are presented in five key areas: Bridges, Lighting, Buildings, Utilities, and Park Amenities. In addition to these key areas, a contingency of 30 percent and a design fee of 15 percent have been added to the construction cost subtotal, to account for additional costs associated with such items as final design changes and escalation costs for construction materials. The uncertainty of the main span bridge type at this early conceptual phase, created the need for a range of costs for each concept. Roadway & “Park” Bridges – The estimated construction costs for the structures that comprise the footprint of the land bridge, include the combined costs of the superstructure, substructure, and retaining wall for each of the three concepts. These costs were estimated by using MnDOT average bid prices for awarded contracts. 35 Each concept was assessed with differing materials and span configurations. Assumptions included a minimum vertical clearance of 16.6 feet, that building substructures are independent and will not bear on the bridge beams, the roadway and park portions of the structure are separated by a longitudinal joint, and the presence of a 4-foot topsoil with a cast-in-place concrete deck. Tunnel Features – The concepts result in the traffic along I-94 passing through a tunnel structure; therefore, subject to the design requirements of roadway tunnels, such as fire suppression and heating, ventilation, and air conditioning (HVAC) systems. The estimated cost of these systems were produced via aggregated research conducted by the Colorado Department of Transportation (CODOT)36 into equivalent tunnels nationwide. Lighting – The cost for lighting installation includes that within the I-94 tunnel, along with the crossing surface streets, and miscellaneous uses on the land bridge. These costs were estimated by using MnDOT average bid prices for awarded contracts.35 Buildings – The building development cost ranges assume an approximate unit cost of $150 per square foot of building area, and a varying building area based on the land bridge length for each concept. The values used in these cost estimates were determined using CoreLogic© Marshall & Swift Valuation Service37, and does not include specialty building types or tenant improvements.
35 http://www.dot.state.mn.us/bidlet/average-bid-price.html 36 https://www.codot.gov/projects/i-70mountaincorridor/final-peis/final-peis-file-download.html 37 A complete and authoritative appraisal guide for developing replacement costs and depreciated values of commercial structures, which references more than 30,000 component costs, over 300 building occupancies, and includes costs for “green” features. https://www.corelogic.com/products/marshall-swift-valuation-service.aspx

Feasibility Study |July 2020 |
59 | P a g e
Utility Replacement/Enhancements – The costs to replace and enhance utility distribution systems to the adjacent neighborhoods, and to new development on the land bridge, were estimated as an approximate 12 percent subset of the total cost of building development. Park Amenities – The costs associated with park amenities include the landscaping costs, such as trees, and other installed features, including benches and trash cans. These costs were estimated by using MnDOT average bid prices for awarded contracts.35
6.1.2 Operations and Maintenance Costs The operation and maintenance (O&M) costs are the recurring direct and indirect costs associated with upkeep, utilities, inspections, administration, salaries, monitoring, etc. The estimates provided herein omit scheduled major repair and rehabilitation work. The annual O&M costs for the RLB are presented in four fundamental aspects: Bridge(s) (for Surface Roads), Tunnel, Park(s), and Buildings: Bridge(s) – The cost to operate and maintain the bridge(s) that carry surface roadways over I-94 was referenced from MnDOT’s 2018 Major Projects Report.38 The O&M costs include cleaning and maintaining the bridge road surface and drainage, snow and ice removal, minor surface patching and crack sealing. These estimates exclude additional staff and inspection costs. The costs are based on MnDOT’s total expenditures in bridge maintenance (reactive and preventative maintenance), normalized by the bridge deck or roadway surface area, which demonstrate an annual cost of $0.21 per square foot of bridge deck. Tunnel - The cost to operate and maintain the tunnel systems required under the land bridge was referenced from the Tunnel Operations, Maintenance, Inspection and Evaluation (TOMIE) Manual from the Federal Highway Administration39, as well as costs from several existing tunnel systems. These costs include cleaning and maintaining the piers, land bridge underside, and drainage; routine inspections and recertification of the structural components, supervisory control and data acquisition (SCADA), lighting, ventilation, fire protection/safety, and communication systems; utility costs; and maintenance of the systems. Not included in the costs are snow and ice removal along I-94, emergency response and incident management, systems monitoring, personnel, and equipment. The calculated approximate annual cost is $313,614 per lane mile of interstate under the land bridge. Park(s) – The cost to operate and maintain the park was referenced from National Recreation and Park Association (NPRA) Agency Performance Review40 data. These costs include lawn maintenance, landscape beds and decorative plant maintenance, trash/recycling maintenance, snow and ice removal, pathway/sidewalk lighting maintenance and electricity. The national average for annual operating expenditures of parks is $6,750 per acre, and was used in this analysis. This cost is subject to significant fluctuation, should the park be absorbed into an existing local park system or if the maintenance is contracted out to a local vendor. Buildings – The cost to operate and maintain the buildings along the land bridge is estimated by aggregation of reported operating costs from a range of sources for residential41 and commercial42,43 uses. A portion of these costs will be passed along to the tenants while others will remain with the owner. 38 http://www.dot.state.mn.us/govrel/reports/2018/2018_major_highway.pdf 39 https://www.fhwa.dot.gov/bridge/inspection/tunnel/tomie/hif15005.pdf 40 https://www.nrpa.org/publications-research/research-papers/agency-performance-review/ 41 https://www.naahq.org/news-publications/units/september-2018/article/survey-operating-income-expenses-rental-apartment 42 https://www.boma.org/BOMA/Research-Resources/3-BOMA-Spaces/Newsroom/PR91818.aspx 43 https://www.cbre.com/research-and-reports

Feasibility Study |July 2020 |
60 | P a g e
These costs include utilities, cleaning and maintenance of public/shared use spaces, building repairs, and inspections. These costs are subject to variances dependent on the size and configuration of the build out. Estimates herein include an average of $7.50 per square foot for residential space and $6 per square foot for commercial space.
6.1.3 Public Utility Impacts A range of private and public utilities are located adjacent to, or within, the right-of-way of I-94 in the project area (refer to Table 6-1). These utilities include municipal water distribution, sanitary sewers, storm sewers, optical fiber, and electricity; the majority of which run parallel to I-94 and are located underneath the roadway or embankments on either side of the freeway. The exact location, including alignment and depth, of these utilities may significantly affect the complexity of any construction along I-94, including that associated with the RLB. Initial coordination with each utility owner was done during this study, further coordination with each utility owner will be required in the next stages of the project development process.
Table 6-1: Utilities within Project Area Type Owner Size Location Notes Major Utilities Sewer-Sanitary MetCouncil
Environmental Services
13’ 9.5” Sanitary Interceptor Tunnel
North ROW edge of I-94/St. Anthony Street; 170-175’ below St. Anthony
Includes an 11’ access shaft at Chatsworth Street/St. Anthony Street MetCouncil has a proposal to add an
additional tunnel. Sewer-Stormwater
City of Saint Paul-Rondo
8’ Stormwater Tunnel
South ROW edge of I-94/Concordia; 100-150’ below Concordia
Includes drop shaft to the start of the tunnel in the northwest corner of Chatsworth Street/Concordia Avenue. Second drop shaft is located in the
northeast corner of Chatsworth Communications-Fiber
Connect Minnesota/ CenturyLink/ AT&T
Level 3 Intercity Network Connection
I-94 North embankment Depth and size TBD during next steps of project.
Other Local Utilities Sewer - Sanitary City of Saint Paul 9” to 30” Along and under local
city streets Used to collect from existing buildings.
Sewer-Stormwater
City of Saint Paul St. Albans 7’ 6” Tunnel
Crosses I-94 west of Grotto and ties into Saint Paul-Rondo Tunnel near St. Albans/Concordia Avenue
After tie in, combined tunnel is 9’.
MnDOT 12” to 72” Under I-94, Concordia Avenue, St. Anthony Street
Interconnected system conveying surface water to one of the previously noted drop shafts above.
City of Saint Paul 12” to 36” Along and under local city streets
Interconnected system conveying surface water to one of the previously noted drop shafts above.
City of Saint Paul 72” Arch Pipe Along Fisk Street, south of I-94
Connects to Fisk drop shaft.
Water
City of Saint Paul Regional Water Services
4” to 12” 8’ under local city streets
City of Saint Paul Regional Water Services
16” Along Victoria Street, then crosses under I-94 (at approximately 7’)

Feasibility Study |July 2020 |
61 | P a g e
Type Owner Size Location Notes
Communications-Fiber
MnDOT Traffic Management Systems
<3” I-94 South Embankment Connects traffic management cameras/sensors to MnDOT Regional Transportation Management Center.
Varies <3” Local service lines above/below ground connecting to buildings.
Electricity Xcel Energy Primary 1
Phase Line Above/below ground connecting to buildings.
MnDOT Lighting <3” North/south I-94 ROW Source: Survey CAD files and communication with various owners.
6.1.4 Other This category is a catchall for the remaining engineering factors evaluated as part of the feasibility analysis. These factors were determined relative to the complexity of the various concepts, but not necessary for detailed evaluation at this time, due to the number of unknown variables at this phase in the project development process; therefore, the evaluation of each of these factors is considered a high-level review. Traffic Safety Impacts – Impacts to traffic safety among the concepts are primarily dependent on factors to be determined in the design process of the land bridge, such as the geometric configurations, traffic control devices, and changes in traffic patterns along and adjacent to the land bridge. As a surrogate factor, the number of intersections likely to be affected are included in order to provide an approximate scale of potential impact. The traffic safety impact to through traffic along I-94 is unlikely to be significantly affected by any of the present land bridge concepts. Impacts to I-94 ROW (Right-Of-Way) – Impacts to the existing I-94/MnDOT right-of-way are incurred in each of the three concepts. The affected amount of right-of-way directly correlates with the length of the land bridge. All concepts assume the right-of-way impact is predominantly associated with the grade-separated nature of the land bridge, with some implication on the existing embankment slopes.
6.2 Network/Modal Connectivity Impacts to the surface transportation network were assessed to gauge the potential for multimodal network connectivity. At this stage, there are limited design details among the concepts to identify the specific network configurations. The four modes of transportation reviewed as part of this criterion included: Local Road Re-Connections – Motorized vehicles presently traverse I-94 at half-mile intervals along Lexington Parkway, Victoria Street, and Dale Street. Based on the farthest termini of each concept, the existing local road network that may be reconnected is limited to Chatsworth Street, Milton Street, Fisk Street, Avon Street, and Grotto Street. Pedestrian Connectivity – Pedestrians presently traverse I-94 at quarter-mile intervals along Lexington Parkway, Chatsworth Street, Victoria Street, Grotto Street, and Dale Street. The potential for pedestrian connections at a high density is approximately one every 400 feet. Bicycle Connectivity – Cyclists presently traverse I-94 in shared use areas with vehicles or pedestrians at quarter-mile intervals along Lexington Parkway, Chatsworth Street, Victoria Street, Grotto Street, and Dale Street. Limited or no bicycle-specific infrastructure is presently available. Bicycle connectivity may occur in concurrence to local road reconnections, as well as parallel to a portion of pedestrian reconnections.

Feasibility Study |July 2020 |
62 | P a g e
Transit Connectivity – Transit routes may be added or upgraded along Victoria Street. Concepts that provide local road reconnections also have the potential to facilitate additional transit connectivity along those roadways. Existing east-west transit routes along I-94 may incorporate a stop at Victoria Street. Enhanced connections to the Green Line on University Avenue may also be added.
6.3 Environment/Health The following discusses the environmental/health-related factors evaluated in the feasibility analysis and the potential impacts the concepts could have on each. Furthermore, as the Rondo community has historically experienced detrimental outcomes associated with the neglect of community cohesion in the construction of I-94, a focal point of the RLB is the opportunity for, and improvement of, community cohesion as the direct result of the project. Each of the present land bridge concepts encompass the physical reconnection, as well as the framework for community and commercial engagement of the Rondo neighborhood. The seven factors reviewed as part of the environmental/health criterion, which includes the spaces intended to promote community cohesion, are detailed as follows: Air Quality Potential – Air quality impacts of freeway lids using mechanical ventilation are anticipated to pose potential air quality concerns. The threshold to implement a ventilated system in a roadway tunnel is 300 feet. Since each concept is anticipated to include a tunnel totaling more than 300 feet, mechanical ventilation will be necessary to address air quality concerns. Additionally, a range of air scrubbing systems, intended to improve the air quality in the surrounding Rondo neighborhood, may be incorporated into the preferred design; however, without such systems incorporated into the design, net changes in air quality from existing conditions are likely to be worse than existing conditions. An emphasis on non-motorized and transit-oriented development in the preferred design may mitigate air quality impacts through reduction of motor vehicle trips along Victoria Street and adjacent roadways. A detailed air quality analysis will be required, as the project development process progresses. Historic/Cultural Properties Impact Potential - The study area contains designated and potential historic and archaeological sites. None of these sites are anticipated to interact directly with the land bridge or its construction, but should be re-evaluated against the preferred design and construction planning. A full cultural resources and archaeological assessment would be necessary in the project development process. Low Income/People of Color Impact Potential - The study area includes seven block groups meeting the definition of an environmental justice community. None of the present land bridge concepts involve potential residential relocations. However, if future concepts or designs include the potential for residential relocations, additional analysis should be taken to avoid and mitigate impacts to these environmental justice communities. Further analysis would also need to be completed to review impacts from potential relocations due to gentrification and housing cost increases, and the converse, wealth and job creation increases. Potential for New Gathering Spaces – Community-oriented gathering space elements include sociability, activity, access, and comfort. Area estimates assume a maximum subset of approximately one-half of the combined open space and built space of the concept, and a minimum of approximately one-tenth of this space. Potential for New Cultural/Historic Interpretive Opportunities - The physical spaces that encompass, or are dedicated to, cultural and historic uses may physically coincide with other recreational or institutional services. Area estimates assume a maximum subset of approximately two-thirds of the combined open

Feasibility Study |July 2020 |
63 | P a g e
space and built space of the concept, and a minimum of approximately one-tenth of this space. Potential for Green Space – The areas that may include a range of uses such as landscaping, parks, and gardens are anticipated to coincide with recreational uses. While it is possible for green space to exist inside and on top of developed areas, for purposes of this Feasibility Study it is assumed the maximum amount of green space is limited to the amount of open space within each concept. Area estimates assume a maximum subset of approximately two-thirds of the open space of the concept, and a minimum of approximately one-eighth of this space. Potential for Green Infrastructure – Inclusion of sustainable infrastructure may include a range of features, such as a utility hub or net zero operations. Some space may be singularly dedicated to green infrastructure, while some may coincide with area for other purposes, such as the permeable pavement for roadways, solar panels on building rooftops, or rain gardens within parks. Area estimates assume a maximum subset of approximately one-half of open space and one-sixth of developed space, and a minimum of approximately one-tenth of this space.
6.4 Economic Opportunities In an effort to rationalize the possible development on and around the proposed RLB, a Prototype Capacity Analysis was performed to evaluate the factors for economic opportunities. As part of the analysis, for each of the concepts, a prototypical development scheme is suggested as a basis for estimating the social and economic impacts. The prototypical development schemes contain a mix of residential, commercial and institutional (non-profit) uses. This mixed-use approach is preferred by developers as a means of sharing market and financial risks over multiple product types, and tend to reinforce each other under the urban planning concept of “live-work-play”. The schemes also share a relatively large proportion of open space, in the form of outdoor plazas, parks and pedestrian-oriented ways. These “outdoor” uses, with limited vertical development, will take up approximately two-thirds of the overall RLB area, with the remaining area occupied by new vertical development. These schemes do not suggest or recommend any specific uses, design or programmatic oversight, rather they are meant to illustrate what could potentially be developed and the relative economic impacts associated with each. Assumptions for the prototypical development schemes include:
• Each concept to be permitted by zoning and other entitlements which may not currently be in place.
• All engineering and environmental obstacles have been removed. • Per the engineering aspects of the feasibility analysis (Section 6.1), building substructures are
independent and will not bear on the bridge beams. Furthermore, multi-story buildings will be constructed on a flattened embankment, through structural retaining of the present embankment.
• The estimated cost premiums and physical limitations of placing large buildings on top of a bridge structure are considered limiting factors.
• The scale and massing of the RLB development is assumed to be in keeping with that of the overall neighborhood, which varies widely between University Avenue (to the north) and Selby Avenue (to the south).
• A Floor Area Ratio (FAR) of 0.75, along with an average building height of two stories. The FAR includes the RLB itself, so the massing of the buildings on the edges will result in higher FARs on a parcel by parcel basis, including larger structures with multiple stories. While this scale of built
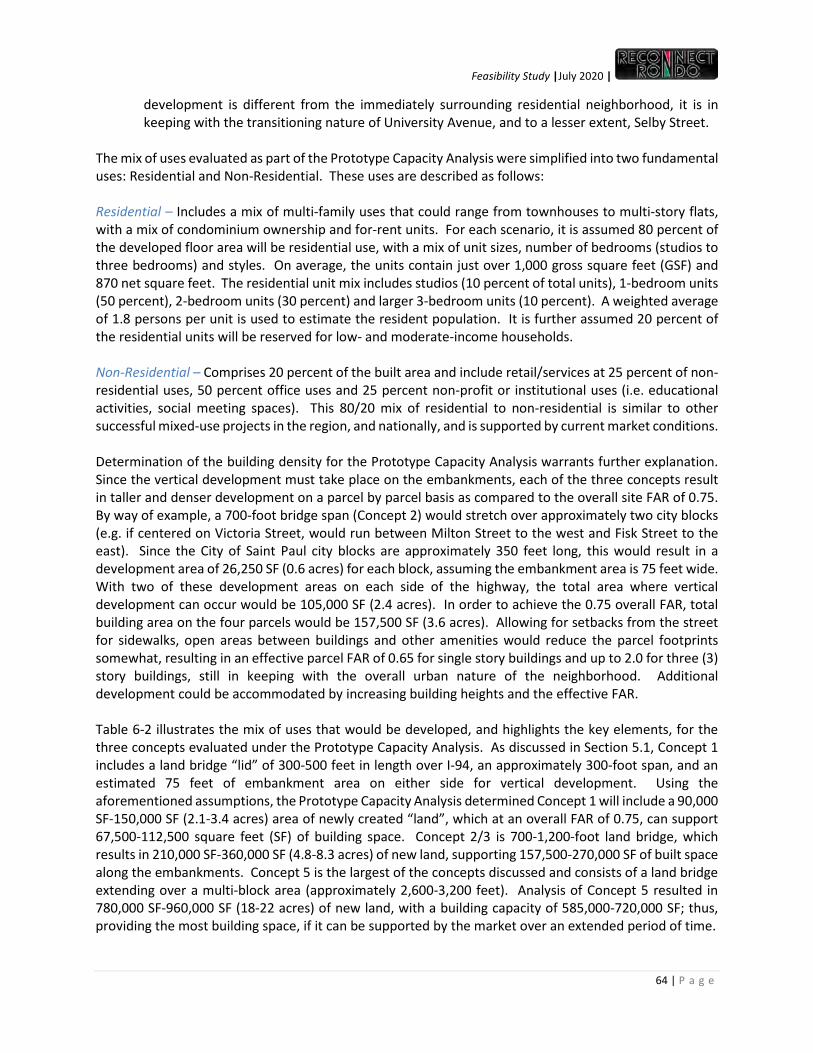
Feasibility Study |July 2020 |
64 | P a g e
development is different from the immediately surrounding residential neighborhood, it is in keeping with the transitioning nature of University Avenue, and to a lesser extent, Selby Street.
The mix of uses evaluated as part of the Prototype Capacity Analysis were simplified into two fundamental uses: Residential and Non-Residential. These uses are described as follows: Residential – Includes a mix of multi-family uses that could range from townhouses to multi-story flats, with a mix of condominium ownership and for-rent units. For each scenario, it is assumed 80 percent of the developed floor area will be residential use, with a mix of unit sizes, number of bedrooms (studios to three bedrooms) and styles. On average, the units contain just over 1,000 gross square feet (GSF) and 870 net square feet. The residential unit mix includes studios (10 percent of total units), 1-bedroom units (50 percent), 2-bedroom units (30 percent) and larger 3-bedroom units (10 percent). A weighted average of 1.8 persons per unit is used to estimate the resident population. It is further assumed 20 percent of the residential units will be reserved for low- and moderate-income households. Non-Residential – Comprises 20 percent of the built area and include retail/services at 25 percent of non-residential uses, 50 percent office uses and 25 percent non-profit or institutional uses (i.e. educational activities, social meeting spaces). This 80/20 mix of residential to non-residential is similar to other successful mixed-use projects in the region, and nationally, and is supported by current market conditions. Determination of the building density for the Prototype Capacity Analysis warrants further explanation. Since the vertical development must take place on the embankments, each of the three concepts result in taller and denser development on a parcel by parcel basis as compared to the overall site FAR of 0.75. By way of example, a 700-foot bridge span (Concept 2) would stretch over approximately two city blocks (e.g. if centered on Victoria Street, would run between Milton Street to the west and Fisk Street to the east). Since the City of Saint Paul city blocks are approximately 350 feet long, this would result in a development area of 26,250 SF (0.6 acres) for each block, assuming the embankment area is 75 feet wide. With two of these development areas on each side of the highway, the total area where vertical development can occur would be 105,000 SF (2.4 acres). In order to achieve the 0.75 overall FAR, total building area on the four parcels would be 157,500 SF (3.6 acres). Allowing for setbacks from the street for sidewalks, open areas between buildings and other amenities would reduce the parcel footprints somewhat, resulting in an effective parcel FAR of 0.65 for single story buildings and up to 2.0 for three (3) story buildings, still in keeping with the overall urban nature of the neighborhood. Additional development could be accommodated by increasing building heights and the effective FAR. Table 6-2 illustrates the mix of uses that would be developed, and highlights the key elements, for the three concepts evaluated under the Prototype Capacity Analysis. As discussed in Section 5.1, Concept 1 includes a land bridge “lid” of 300-500 feet in length over I-94, an approximately 300-foot span, and an estimated 75 feet of embankment area on either side for vertical development. Using the aforementioned assumptions, the Prototype Capacity Analysis determined Concept 1 will include a 90,000 SF-150,000 SF (2.1-3.4 acres) area of newly created “land”, which at an overall FAR of 0.75, can support 67,500-112,500 square feet (SF) of building space. Concept 2/3 is 700-1,200-foot land bridge, which results in 210,000 SF-360,000 SF (4.8-8.3 acres) of new land, supporting 157,500-270,000 SF of built space along the embankments. Concept 5 is the largest of the concepts discussed and consists of a land bridge extending over a multi-block area (approximately 2,600-3,200 feet). Analysis of Concept 5 resulted in 780,000 SF-960,000 SF (18-22 acres) of new land, with a building capacity of 585,000-720,000 SF; thus, providing the most building space, if it can be supported by the market over an extended period of time.

Feasibility Study |July 2020 |
65 | P a g e
Table 6-2: Prototype Capacity Analysis Concept 1 Concept 2/3 Concept 5 Land Bridge Length (LF) 300-500 700-1,200 2,600-3,200
Area (SF) 90,000-150,000 210,000-360,000 780,000-960,000
Building Area (SF) 67,500-112,500 157,500-270,000 585,000-720,000
Open Space (SF/(Acres)) 56,250-93,750/ (1.3-2.2)
130,680-226,510/ (3.0-5.2)
487,870-601,130/ (11.2-13.8)
Residential Uses 54,000-90,000 GSF 54-90 units,
with 11-18 affordable
126,000-216,000 GSF 126-216 units,
with 25-43 affordable
468,000-576,000 GSF 468-576 units,
with 94-115 affordable Population (Persons) 96-160 224-384 883-1,025
Non-Residential Uses Retail: (SF) Office: (SF)
Non-Profit/Institutional: (SF)
3,375-5,625 6,750-11,250 3,375-5,625
7,875-13,500 15,750-27,000 7,875-13,500
29,250-36,000 58,500-72,000 29,250-36,000
Employment (Jobs) 39-64 90-154 334-411
Development Costs-Buildings (Million $) 10-17 24-41 89-108
Total Market Value at Full Build (Million $) 17-28 39-67 144-178
Each of the three concepts, based on the aforementioned Prototypical Development Analysis, will result in the generation of housing, jobs, incomes and taxes. These key socioeconomic factors have been estimated using industry standard factors and recent city and state wage and tax data. Table 6-3 summarizes these impacts. These are direct impacts only and do not include indirect or induced impacts that might occur throughout the greater City of Saint Paul economy.
Table 6-3: Economic Impacts Summary Concept 1 Concepts 2/3 Concept 5
New Residents 96-160 224-384 833-1,025 New Jobs 40-67 93-160 347-427 Retail/Services 10-17 23-40 87-107 Office 20-33 47-80 173-213 Non-Profit 10-17 23-40 87-107
Total Annual Wages (Millions $) 2.7-4.5 6.3-10.9 23.5-29.0 Construction Jobs1 45-74 104-179 387-476
Total construction wages (Millions $) 3.5-5.9 8.3-14.2 30.7-37.8 Market Value (Millions $) 16.6-27.8 38.9-66.7 144.4-177.9 Property Taxes (Millions)2 0.4-0.6 0.8-1.4 3.1-3.8 Income Taxes (Millions)3 $0.4-$0.7 $0.9-$4.2 $3.4-$4.2 Notes:
1Temporary construction jobs during the development period 2Estimated taxes to all jurisdictions
3Includes state and local portions
6.5 Feasibility Assessment A review of the feasibility of the concepts was then conducted, based on results of the feasibility analysis. The objective of this aspect of the Feasibility Study was to determine the overall feasibility of each concept. Table 6-4 provides a comparative summary of the concept evaluation data presented in the preceding sections. In terms of this study, feasibility is defined as the achievability of a concept’s implementation without consequential technical or civic impedance through each criterion.

Feasibility Study |July 2020 |
66 | P a g e
Table 6-4: Comparison of Concepts against Evaluation Criteria
Criteria
Concepts 1: Street/Bridge Expansion
(Short) 2/3: Simple Lid with
Development Potential (Medium)
5: Lid with 1-2 Story Buildings (Long)
Feasibility Study Goals Meets 3/5 Meets 4/5 Meets 5/5 Evaluation Criteria Impacts
Engineering/Traffic Low Medium High Network/Modal Connectivity Low Medium High
Environment/Health Low Medium High Economic Opportunities Low High Medium
Cost $ $$ $$$ Feasibility Feasible Likely Feasible Potentially Feasible
Notes: Low: Evaluated as having the least amount of impact for the criterion. Medium: Evaluated as neither the least nor most amount of impact for the criterion. High: Evaluated as having the most amount of impact for the criterion. $ - $$$: Representative of total probable construction costs, plus total O&M costs, with ‘$’ suggesting the lowest amount of costs and ‘$$$’ the highest amount of costs. Concept 1: Feasible – Concept 1 is feasible, because it meets the overall project goals to reconnect the Rondo neighborhood and to provide suitable development opportunities; it’s the least costly in both initial capital costs and long term operations and maintenance cost; it very likely is the fastest to implement; and it provides the least impact to the environment/health of the community. Under Concept 1, the engineering and traffic impacts - while high relative to regional infrastructure projects - is lowest in terms of cost and complexity. It is likely construction could be completed in one phase, coordination and conflicts with stakeholders is the lowest among the three concepts, and resulting contingencies are proportionally lower; thus, Concept 1 is feasible from a technical perspective. The prospect of reconnecting local streets across I-94 is low in Concept 1. Additionally, from a technical perspective, it is unlikely any Concept 1 design would result in additional connectivity beyond a minimal additional quantity of pedestrian and bicycle access points. The relative detrimental impact on the health and environment in Concept 1 is low due to its limited footprint, also resulting in low accessibility to beneficial green infrastructure, park space, and other environmental and health amenities. The economic opportunities available in Concept 1 exhibit relatively limited capacity for commercial and residential use. However, the market analysis suggests the amount of capacity is anticipated to be below the demand, resulting in a high utilization and efficient economic use of the developed areas. Therefore, Concept 1 is feasible from a social perspective, albeit with minimum relative additional benefit. Concept 2/3: Feasible – Concept 2/3 is feasible, because it meets most of the overall project goals; it provides greater potential for economic opportunities; it provides more flexibility in development and park use on the land bridge; it provides the greatest opportunity for expansion in the future, while limiting the capital expenditures up front; and while it has some impact on the environment, it provides greater benefit to health concerns with more green space and reduced air quality. The engineering and traffic impacts in Concept 2/3 are moderate in cost relative to the other concepts, at a cost approximately one-third of Concept 5, and three times that of Concept 1. It is likely that construction could be completed in one to two phases, and that coordination and conflicts with stakeholders and relative contingencies are potentially high. The prospect of reconnecting local streets across I-94 is moderate in Concepts 2/3. One to two roadways may be reconnected in addition to several

Feasibility Study |July 2020 |
67 | P a g e
pedestrian and bicycle accesses; providing a relative moderate benefit. Therefore, from a technical perspective, Concept 2/3 is feasible, albeit with increased complexity. The relative detrimental impact on the health and environment in Concept 2/3 is moderate due to its relative footprint, also resulting in sizeable accessibility to beneficial green infrastructure, park space, and other environmental and health amenities. The economic opportunities available in Concepts 2/3 exhibit a relatively moderate amount of capacity for commercial and residential use. The capacity provided is anticipated to meet the demand, resulting in an appropriate utilization and efficient economic use of the developed areas. As such, from a social perspective, Concept 2/3 is feasible. Concept 5: Feasible – Concept 5 is feasible, because it meets all of the overall project goals; it provides the largest reconnection of the Rondo neighborhood; it provides the greatest capacity for benefit for the neighborhood and city as a whole, in terms of residential and commercial development; it results in the greatest number of jobs created, both temporary construction jobs and permanent jobs; it provides the largest total market value of the development at full build out and the largest tax potential (both property and income taxes); and it provides the greatest potential for new gathering spaces, cultural and historic interpretive opportunities and green space. Concept 5 includes long-term or phased build-outs associated with high costs, complex coordination, and the greatest amount of potential or risk. This concept would require additional studies, in particular, regarding interaction with major utilities, to better determine its feasibility. The prospect of reconnecting local streets across I-94 is highest in Concept 5. This indicates that Concept 5 is feasible from a technical perspective, albeit with significant complexity. The relative detrimental impact on the health and environment in Concept 5 is relatively high due to its large footprint, also resulting in high accessibility to beneficial green infrastructure, park space, and other environmental and health amenities. Additional studies regarding the detrimental environmental impacts, as well as specification of green infrastructure and utility hubs to be included in the design of the land bridge, are required to more effectively assess Concept 5. The economic opportunities available in Concept 5 exhibit a high amount of capacity for commercial and residential use. However, the market analysis indicates this amount of capacity currently exceeds the demand for commercial space. Due to the lower demand, a long built-out timeframe would be anticipated, which may result in delays in residential and affordable housing build-out timeframes as well. Therefore, Concept 5 is feasible from a social perspective, albeit with unknown implications to be assessed through additional studies and design.

Feasibility Study |July 2020 |
68 | P a g e
Page intentionally left blank.
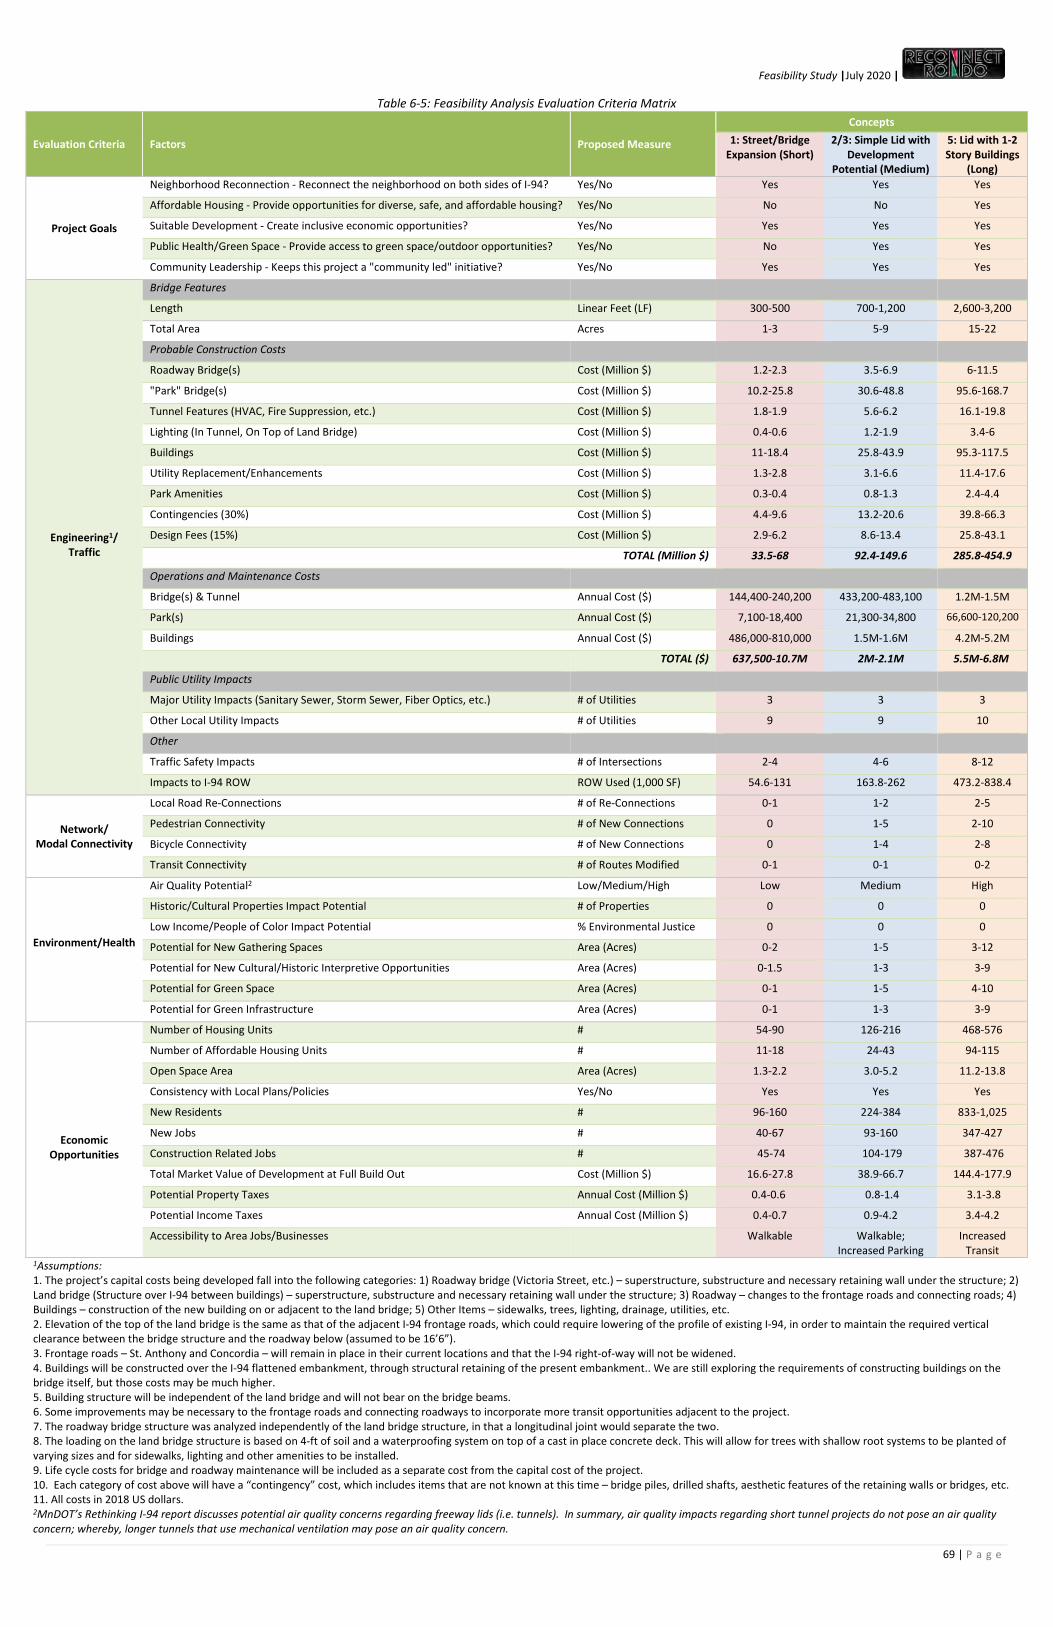
Feasibility Study |July 2020 |
69 | P a g e
Table 6-5: Feasibility Analysis Evaluation Criteria Matrix
Evaluation Criteria Factors Proposed Measure
Concepts 1: Street/Bridge
Expansion (Short) 2/3: Simple Lid with
Development Potential (Medium)
5: Lid with 1-2 Story Buildings
(Long)
Project Goals
Neighborhood Reconnection - Reconnect the neighborhood on both sides of I-94? Yes/No Yes Yes Yes
Affordable Housing - Provide opportunities for diverse, safe, and affordable housing? Yes/No No No Yes
Suitable Development - Create inclusive economic opportunities? Yes/No Yes Yes Yes
Public Health/Green Space - Provide access to green space/outdoor opportunities? Yes/No No Yes Yes
Community Leadership - Keeps this project a "community led" initiative? Yes/No Yes Yes Yes
Engineering1/
Traffic
Bridge Features
Length Linear Feet (LF) 300-500 700-1,200 2,600-3,200
Total Area Acres 1-3 5-9 15-22
Probable Construction Costs
Roadway Bridge(s) Cost (Million $) 1.2-2.3 3.5-6.9 6-11.5
"Park" Bridge(s) Cost (Million $) 10.2-25.8 30.6-48.8 95.6-168.7
Tunnel Features (HVAC, Fire Suppression, etc.) Cost (Million $) 1.8-1.9 5.6-6.2 16.1-19.8
Lighting (In Tunnel, On Top of Land Bridge) Cost (Million $) 0.4-0.6 1.2-1.9 3.4-6
Buildings Cost (Million $) 11-18.4 25.8-43.9 95.3-117.5
Utility Replacement/Enhancements Cost (Million $) 1.3-2.8 3.1-6.6 11.4-17.6
Park Amenities Cost (Million $) 0.3-0.4 0.8-1.3 2.4-4.4
Contingencies (30%) Cost (Million $) 4.4-9.6 13.2-20.6 39.8-66.3
Design Fees (15%) Cost (Million $) 2.9-6.2 8.6-13.4 25.8-43.1
TOTAL (Million $) 33.5-68 92.4-149.6 285.8-454.9
Operations and Maintenance Costs
Bridge(s) & Tunnel Annual Cost ($) 144,400-240,200 433,200-483,100 1.2M-1.5M
Park(s) Annual Cost ($) 7,100-18,400 21,300-34,800 66,600-120,200
Buildings Annual Cost ($) 486,000-810,000 1.5M-1.6M 4.2M-5.2M
TOTAL ($) 637,500-10.7M 2M-2.1M 5.5M-6.8M
Public Utility Impacts
Major Utility Impacts (Sanitary Sewer, Storm Sewer, Fiber Optics, etc.) # of Utilities 3 3 3
Other Local Utility Impacts # of Utilities 9 9 10
Other
Traffic Safety Impacts # of Intersections 2-4 4-6 8-12
Impacts to I-94 ROW ROW Used (1,000 SF) 54.6-131 163.8-262 473.2-838.4
Network/ Modal Connectivity
Local Road Re-Connections # of Re-Connections 0-1 1-2 2-5
Pedestrian Connectivity # of New Connections 0 1-5 2-10
Bicycle Connectivity # of New Connections 0 1-4 2-8
Transit Connectivity # of Routes Modified 0-1 0-1 0-2
Environment/Health
Air Quality Potential2 Low/Medium/High Low Medium High
Historic/Cultural Properties Impact Potential # of Properties 0 0 0
Low Income/People of Color Impact Potential % Environmental Justice 0 0 0
Potential for New Gathering Spaces Area (Acres) 0-2 1-5 3-12
Potential for New Cultural/Historic Interpretive Opportunities Area (Acres) 0-1.5 1-3 3-9
Potential for Green Space Area (Acres) 0-1 1-5 4-10
Potential for Green Infrastructure Area (Acres) 0-1 1-3 3-9
Economic
Opportunities
Number of Housing Units # 54-90 126-216 468-576
Number of Affordable Housing Units # 11-18 24-43 94-115
Open Space Area Area (Acres) 1.3-2.2 3.0-5.2 11.2-13.8
Consistency with Local Plans/Policies Yes/No Yes Yes Yes
New Residents # 96-160 224-384 833-1,025
New Jobs # 40-67 93-160 347-427
Construction Related Jobs # 45-74 104-179 387-476
Total Market Value of Development at Full Build Out Cost (Million $) 16.6-27.8 38.9-66.7 144.4-177.9
Potential Property Taxes Annual Cost (Million $) 0.4-0.6 0.8-1.4 3.1-3.8
Potential Income Taxes Annual Cost (Million $) 0.4-0.7 0.9-4.2 3.4-4.2
Accessibility to Area Jobs/Businesses
Walkable Walkable; Increased Parking
Increased Transit
1Assumptions: 1. The project’s capital costs being developed fall into the following categories: 1) Roadway bridge (Victoria Street, etc.) – superstructure, substructure and necessary retaining wall under the structure; 2) Land bridge (Structure over I-94 between buildings) – superstructure, substructure and necessary retaining wall under the structure; 3) Roadway – changes to the frontage roads and connecting roads; 4) Buildings – construction of the new building on or adjacent to the land bridge; 5) Other Items – sidewalks, trees, lighting, drainage, utilities, etc. 2. Elevation of the top of the land bridge is the same as that of the adjacent I-94 frontage roads, which could require lowering of the profile of existing I-94, in order to maintain the required vertical clearance between the bridge structure and the roadway below (assumed to be 16’6”). 3. Frontage roads – St. Anthony and Concordia – will remain in place in their current locations and that the I-94 right-of-way will not be widened. 4. Buildings will be constructed over the I-94 flattened embankment, through structural retaining of the present embankment.. We are still exploring the requirements of constructing buildings on the bridge itself, but those costs may be much higher. 5. Building structure will be independent of the land bridge and will not bear on the bridge beams. 6. Some improvements may be necessary to the frontage roads and connecting roadways to incorporate more transit opportunities adjacent to the project. 7. The roadway bridge structure was analyzed independently of the land bridge structure, in that a longitudinal joint would separate the two. 8. The loading on the land bridge structure is based on 4-ft of soil and a waterproofing system on top of a cast in place concrete deck. This will allow for trees with shallow root systems to be planted of varying sizes and for sidewalks, lighting and other amenities to be installed. 9. Life cycle costs for bridge and roadway maintenance will be included as a separate cost from the capital cost of the project. 10. Each category of cost above will have a “contingency” cost, which includes items that are not known at this time – bridge piles, drilled shafts, aesthetic features of the retaining walls or bridges, etc. 11. All costs in 2018 US dollars. 2MnDOT’s Rethinking I-94 report discusses potential air quality concerns regarding freeway lids (i.e. tunnels). In summary, air quality impacts regarding short tunnel projects do not pose an air quality concern; whereby, longer tunnels that use mechanical ventilation may pose an air quality concern.

Feasibility Study |July 2020 |
70 | P a g e
Page intentionally left blank.

Feasibility Study |July 2020 |
71 | P a g e
7.0 NEXT STEPS

Feasibility Study |July 2020 |
72 | P a g e
This Feasibility Study is the first step in a longer process to design and build a land bridge in the Rondo neighborhood. The following will ensure the RLB can move to what is determined to be the most appropriate and immediate next stage – Phase I studies – from a design/engineering and planning perspective. This section outlines the likely activities necessary to successfully implement the Phase I studies and the potential challenges and opportunities to implementing these. This section concludes with recommendations specific to advancing the project to the next phase.
7.1 Recommendation and Implementation Strategies
7.1.1 Recommendation Based on the feasibility analysis, the overarching recommendation for the RLB, from a design/engineering and planning perspective, is to follow a phased approach for implementation. Various aspects of the land bridge may be developed in a phased manner over time, as funding becomes available for specific elements. This might include starting with Concept 1 and replicating it elsewhere along the I-94 corridor, or allowing for the initial concept to scale up as market demand and funding sources improve.
7.1.2 Implementation Strategies The following does not represent an all-inclusive list of activities, but rather, a toolkit of relevant activities that should occur at a future time when the study team would proceed with additional engineering and planning activities. These activities would be useful contributions to formal Phase I design, as well as engineering and environmental studies standard for every roadway construction project. The activities are not presented in any order of priority. Design/Engineering Activities –
• Determine/Define Ownership/Maintenance of the Land Bridge – Further discussion is necessary to identify which agency(ies) will take ownership of the bridge and maintain the structure in a proactive manner.
• Commence Other Studies – Conduct more detailed analyses of the noise and air quality impacts
of existing and proposed conditions. Conduct a more detailed traffic impact study. Complete the appropriate NEPA44-related document.
• Life Cycle Cost Aspects of a Land Bridge – “Life Cycle Cost Aspects (LCC-Aspects) have become an important task for private tunnel owners, as well as government agencies. Well-founded knowledge about the life cycle serves to optimize investment costs during the early stages of designing a system. In addition, it is helpful in organizing the periodical maintenance of the technical equipment” 45 . Each individual component of the land bridge has a different life expectancy. The structures that comprise the land bridge are designed to demonstrate a service life of approximately 100 years, with some planned major rehabilitations. Other components with varying life cycles include the parks, lighting, tunnel systems, and buildings. Of particular significance, are the tunnel systems’ and lighting, which have an 11-year life, ventilation an 18-year life, and fire protection 15 years. The replacement and rehabilitation of these components will have a significant impact on overall costs and future performance of the land bridge.
44 If federal transportation dollars are not used to design/construct the RCR land bridge, a NEPA document would not be necessary. 45 The World Road Association (PIARC), https://tunnels.piarc.org/en, accessed July 18, 2019.

Feasibility Study |July 2020 |
73 | P a g e
• Preliminary and Final Design – The preliminary design would include a major emphasis upon the civil, mechanical, and architectural design of the land bridge. The design of all the mechanical processes (such as water systems) will also be completed during this time, to ensure they are integrated properly into the structures. Architectural concepts are also developed, and structural systems identified, at this time. Costs and scheduling are compared with the original financial objectives and constraints to ensure the project remains financially feasible. If not, the design concept has to be altered, as necessary. The final design includes the detailed architectural and engineering drawings of all physical components of the project.
• Construction – This is considered the last stage of the design process. A major part of the planning process associated with the construction of this project is how to construct the land bridge with minimal disruption to the busy I-94 thoroughfare.
• Opening and Operation – The ownership of the day-to-day operations and routine maintenance of the RLB may involve the delegation of particular aspects to different stakeholders. The general oversight, parks and public spaces, private development, surface utilities, and other facets of the land bridge may warrant different public and private entity collaboration. For instance, a legal trust entity may provide oversight and coordination with all functions of the land bridge, MnDOT may monitor the tunnel system, the City of Saint Paul’s Parks & Recreation department may oversee the natural resources and recreation, and a range of private entities may facilitate the commercial and residential development.
Planning Activities –
• Establish Milestones with Key Stakeholders (Public Engagement) – It is critical to begin, or continue, discussions with government officials, State and Federal legislative representatives, transportation providers, and the public to include the RLB in the Transportation Improvement Plan (TIP) with other high-priority regional transportation projects.
• Develop/Adopt an RCR Land Bridge Community Preferred Concept/Master Plan – In order for the information presented in this Feasibility Study to be meaningful and truly serve as a guide for future project development, a Preferred Concept Plan must be developed and subsequently adopted by local government as a long-term goal for the area, consistent with City of Saint Paul’s and Ramsey County’s Comprehensive Plans. This action establishes a common understanding of the vision for the area, and an administrative foundation for enforceable development decisions. It also serves to convey a consistent planning basis from which to make applications for grants and other sources of funding.
• Incorporate Rondo Land Bridge into relevant Planning Documents – For purposes of public funding opportunities and integration with local and regional planning efforts, it is important the RLB project be compatible with, and integrated into the goals and plans within, both the regional MetCouncil long-range plan and the local Saint Paul comprehensive plan.
• Health Impact Assessment (HIA) – An HIA will identify potential health impacts of the future project. HIAs are more flexible than other types of impact assessments, and can ensure the planning of the project maximizes community benefits and minimizes adverse effects. To be an effective study, the HIA should be conducted early in the project development process.

Feasibility Study |July 2020 |
74 | P a g e
• Sustainability Study – The three principles of sustainability revolve around achieving a well-balanced use of economic, social, and environmental resources, allowing for proper use of funding while attaining all potential project needs. It is important to recognize the critical need to plan and prioritize resources more efficiently in order to maintain and operate a robust, economically beneficial project. A sustainability study will open a dialogue about where the project stakeholders can engage on elements of a sustainable project.
• Healthy Communities Initiative Steps –This program assists communities implementing programs to reduce the prevalence of health risks associated with physical inactivity and poor nutrition. By forming unique partnerships (i.e. traditional and non-traditional), communities are able to enhance their sustainability and overall appeal. Implementation of this program in the Rondo neighborhood has the potential to provide a catalyst for neighborhood and community development, and help lead the community to sustainable changes in the built environment (i.e. the RLB).
• Gentrification Study – As a strategic response to gentrification and displacement, the RCR can make a commitment to better understand and minimize the effects of gentrification. A gentrification study would serve as the basis for understanding and developing a policy strategy to address gentrification. It would provide strategic guidance for the RCR to better understand gentrification and its effect, and to identify best practices for addressing gentrification and displacement that may be appropriate for the Rondo neighborhood. Potential strategies to create and preserve affordable housing, to be analyzed further in the study, include: Strategic use of city-owned land (i.e. ground leases, community land trusts); strategic use of other city resources (i.e. housing subsidies, property tax benefits); and, harnessing the market (i.e. inclusionary zoning, linkage fees). Regardless of the strategies analyzed, each strategic option must relate to the goal of Community Leadership.
• Establish Rondo as its own District Council – An annually elected volunteer neighborhood board that provides advisory recommendations to officials on development issues, identifies neighborhood needs, initiates community programs, and recruit and nurture neighborhood leaders and volunteers. Financially, once its own District, Rondo would help spend federal funds through Community Development Block Grants for the neighborhood.
Pre-Construction/Management Activities –
• Plan Submission, Review and Approval – Submittal of a plan package on a large project is a complicated and involved process. Furthermore, the review process of the package is a lengthy, multi-step process, with multiple federal, state, and local agencies playing a review role, as various layers of permits and approvals may be required. The efficient submittal, review, and approval of the plan package is essential to eventually constructing the land bridge.
• Legal Contracts – The legal sufficiency of all contracts executed to perform further project
development activities is essential to the successful and efficient construction of the land bridge. An entity should be designated with sole responsibility for determining that all contracts meet legal requirements.
• Regulatory Requirements – States and communities enforce regulatory requirements that determine where and how the land bridge may be sited, designed, and constructed. These

Feasibility Study |July 2020 |
75 | P a g e
requirements include those associated with programs established by federal and state statutes, and locally adopted ordinances and laws. Regulatory requirements for a land bridge may include items such as air rights, lighting, and HVAC.
• Maintenance and Operations Manual/Plan – This manual/plan will detail the structural components/features that will require operation, maintenance, repair, and/or rehabilitation during the life of the project. This may include: operation and maintenance budget; structure operations; and, responsibilities for maintenance and rehabilitation.
• Bridge Management Plan – An effective bridge management plan is critical to the success of the land bridge. Elements of the bridge management plan will include: future assessment of the bridge; preservation (i.e. preventative maintenance, prioritize and plan projects); and, improvements (i.e. be advantageous of funding sources).
7.2 Potential Challenges and Opportunities While moving forward in the project development process with the aforementioned activities, potential challenges and opportunities exist to which planning and mitigation may be warranted. These include the following:
• Rethinking I-94 project development by MnDOT • Major Utility Conflicts (Sanitary and Storm Sewer Tunnels and Fiber Optics) • Long Range Plan/Comprehensive Plan Inclusion • Potential Market Conditions • Project Funding • Stakeholder/Public Acceptance and Involvement • New/Unexplored Concepts • Groundwater Elevations and Precipitation Limitations • Legal/Regulatory Land Use Issues • Keep Wealth in the Community • Competing Development Projects
7.3 Possible Funding Sources Funding the next steps, from master planning through construction and management of the RLB, may be achieved through a combination of public or private funding sources, or philanthropic efforts. The following sources, which may or may not be attainable, were identified; but, are not meant to be an exhaustive list of likely possibilities.
7.3.1 Public Funding is available publically through local, state, or federal programs (i.e. MnDOT, MN DNR, US Department of Housing and Urban Development), which includes, specific to the RLB, transportation related improvements (i.e. safety and pedestrian improvements). Utilizing funds from local, state, or federal programs, requires coordination with MnDOT, MetCouncil, City of Saint Paul, Ramsey County, and other potential participating agencies. The following delineates potential funding sources. The applicable category of the funding source is italicized and leads the discussion of the source, with the website for the source of funding concluding the discussion.

Feasibility Study |July 2020 |
76 | P a g e
Local • Economic Development, Tax-Increment Financing (TIF) – Tax increment financing is a locally
controlled public financing mechanism through which the increased property tax value a project creates is captured overtime (for up to 25 years) to pay for up-front public costs associated with the project. (https://www.house.leg.state.mn.us/hrd/issinfo/tifmain.aspx?src=21)
• Economic Development, Sales Tax Revitalization (STAR) – Established in 1994 by the Saint Paul City Council, the STAR Program is divided into two categories (Neighborhood STAR program and Cultural STAR program) for distributing a certain portion of sales tax proceeds. The Neighborhood STAR Program awards loans and grants for capital improvement projects in Saint Paul Neighborhoods, and is funded with 50 percent of the City's half- cent sales tax proceeds. The Cultural STAR Program was created to promote economic growth in Saint Paul by strengthening the arts and cultural sector and by supporting Downtown as a vital cultural center. (https://www.stpaul.gov/departments/planning-economic-development/economic-development/star-programs)
• Transportation, Livable Communities Demonstration Account (LCDA) Grant - The LCDA, managed by MetCouncil, funds innovative development projects that efficiently link housing, jobs, services and transit in an effort to create inspiring and lasting Livable Communities. (https://metrocouncil.org/Communities/Services/Livable-Communities-Grants/Livable-Communities-Demonstration-Account-(LCDA).aspx?source=child)
State • Transportation, Transportation Alternatives Program – The Transportation Alternatives is a
competitive grant opportunity for local communities and regional agencies to fund projects for pedestrian and bicycle facilities, historic preservation, Safe Routes to School and more. The Transportation Alternatives solicitation for the seven-county Twin Cities metropolitan area (Anoka, Carver, Dakota, Hennepin, Ramsey, Scott, Washington counties) is conducted by MetCouncil and its Transportation Advisory Board. (http://www.dot.state.mn.us/ta/index.html)
• Transportation and Economic Development, Transportation Economic Development Infrastructure (TEDI) Program – TEDI is the Minnesota Department of Employment and Economic Development’s (DEED) competitive grant program available to communities for road and public infrastructure projects that create jobs and support economic development. (https://mn.gov/deed/government/financial-assistance/business-funding/tedi/)
• Transportation, Transportation Economic Development (TED) Program – TED is MnDOT’s grant program that provides competitive grants to construction projects on state highways that provide measurable economic benefits. (http://www.dot.state.mn.us/funding/ted/)
Federal
• Housing, Community Development Block Grant (CDBG) and Home Investment Partnerships Program (HOME) – Ramsey County is an entitlement community that receives an annual distribution of CDBG and HOME funds from the Department of Housing and Urban Development. Ramsey County awards these funds to housing projects located in Ramsey County in accordance with the guidelines of the CDBG and HOME programs. (https://www.ramseycounty.us/businesses/property-development/property-development-programs/neighborhood-revitalization-infrastructure)
• Transportation, Better Utilizing Investments to Leverage Development (BUILD) Program - Provides a unique opportunity for the Department of Transportation to invest in road, rail, transit and port projects that promise to achieve national objectives. Previously known as Transportation
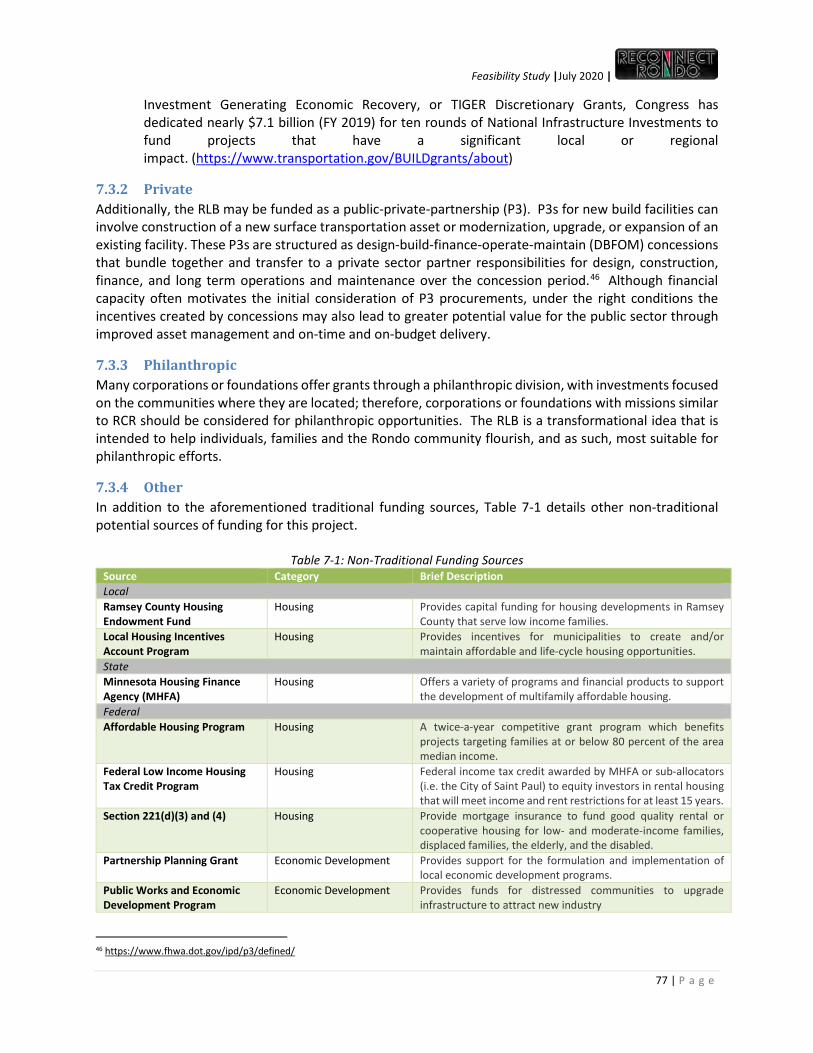
Feasibility Study |July 2020 |
77 | P a g e
Investment Generating Economic Recovery, or TIGER Discretionary Grants, Congress has dedicated nearly $7.1 billion (FY 2019) for ten rounds of National Infrastructure Investments to fund projects that have a significant local or regional impact. (https://www.transportation.gov/BUILDgrants/about)
7.3.2 Private Additionally, the RLB may be funded as a public-private-partnership (P3). P3s for new build facilities can involve construction of a new surface transportation asset or modernization, upgrade, or expansion of an existing facility. These P3s are structured as design-build-finance-operate-maintain (DBFOM) concessions that bundle together and transfer to a private sector partner responsibilities for design, construction, finance, and long term operations and maintenance over the concession period.46 Although financial capacity often motivates the initial consideration of P3 procurements, under the right conditions the incentives created by concessions may also lead to greater potential value for the public sector through improved asset management and on-time and on-budget delivery.
7.3.3 Philanthropic Many corporations or foundations offer grants through a philanthropic division, with investments focused on the communities where they are located; therefore, corporations or foundations with missions similar to RCR should be considered for philanthropic opportunities. The RLB is a transformational idea that is intended to help individuals, families and the Rondo community flourish, and as such, most suitable for philanthropic efforts.
7.3.4 Other In addition to the aforementioned traditional funding sources, Table 7-1 details other non-traditional potential sources of funding for this project.
Table 7-1: Non-Traditional Funding Sources Source Category Brief Description Local Ramsey County Housing Endowment Fund
Housing Provides capital funding for housing developments in Ramsey County that serve low income families.
Local Housing Incentives Account Program
Housing Provides incentives for municipalities to create and/or maintain affordable and life-cycle housing opportunities.
State Minnesota Housing Finance Agency (MHFA)
Housing Offers a variety of programs and financial products to support the development of multifamily affordable housing.
Federal Affordable Housing Program Housing A twice-a-year competitive grant program which benefits
projects targeting families at or below 80 percent of the area median income.
Federal Low Income Housing Tax Credit Program
Housing Federal income tax credit awarded by MHFA or sub-allocators (i.e. the City of Saint Paul) to equity investors in rental housing that will meet income and rent restrictions for at least 15 years.
Section 221(d)(3) and (4) Housing Provide mortgage insurance to fund good quality rental or cooperative housing for low- and moderate-income families, displaced families, the elderly, and the disabled.
Partnership Planning Grant Economic Development Provides support for the formulation and implementation of local economic development programs.
Public Works and Economic Development Program
Economic Development Provides funds for distressed communities to upgrade infrastructure to attract new industry
46 https://www.fhwa.dot.gov/ipd/p3/defined/
Feasibility Study |July 2020 |
78 | P a g e
Source Category Brief Description Local Technical Assistance Program
Economic Development Provides grants for feasibility studies.
Private Mezzanine Loans (Lend Lease Real Estate Investment Trust)
Economic Development Tailored to meet the needs of borrowers seeking financing for stabilized, value-added, and development opportunities.
American Communities Fund (Fannie Mae)
Community Development Equity and debt investments to for- or non-profit sponsors for rental housing, homeownership, mixed-use, commercial, retail, and other facilities that support residential communities.
Culvert Foundation Community Development Provides loan capital to community development organizations and other community development financial institutions. Projects must contribute to growing the local economy, expanding opportunity, or promoting work-related activities, homeownership, and non-traditional business owners.
Source: Mixed-use Development in the Twin Cities: Issues and Best Practices, Attachment C, October 2003, by Mike LaFave and JoAnna Hicks of the Local Initiatives Support Corporation - Neighborhood Development Center.

Feasibility Study |July 2020 |
Appendix A:
Figures (11x17)

Feasibility Study |July 2020 |
Page intentionally left blank.

Dal
e St
N
Vict
oria
St
Lexi
ngto
n Pa
rkw
ay
Ham
line
Ave
Wes
tern
Ave
§̈¦94
Selby Ave
Marshall Ave
Carroll Ave
University Ave
§̈¦94
Fuller Ave
St. Anthony Ave
Aurora Ave
Central Ave
Iglehart Ave
Dayton Ave
Mac
kubi
n St
Gro
tto S
t
Cha
tsw
orth
St
Grig
gs S
t
Mar
ion
Stre
et
Marshall Ave
John
Irela
nd B
lvd
Ric
e St
Legend
ReConnectRondo Land BridgeFeasibility Study
March 2018 ULI Panel Report Study Area
Land Bridge Focus Area (per ULI Panel Report, March 2018)
Study Area-RCR Land Bridge Feasibility Study Ë0 0.1 0.2 0.3 0.4
Miles Study Area

Dal
e St
N
Vict
oria
St
Lexi
ngto
n Pa
rkw
ay
Ham
line
Ave
Wes
tern
Ave
§̈¦94
Selby Ave
Marshall Ave
Carroll Ave
University Ave
§̈¦94
Fuller Ave
St. Anthony Ave
Aurora Ave
Central Ave
Iglehart Ave
Dayton Ave
Mac
kubi
n St
Gro
tto S
t
Cha
tsw
orth
St
Grig
gs S
t
Legend
ReConnectRondo Land BridgeFeasibility Study
Study Area
Single Family Detached
Single Family Attached
Multifamily
Retail and Other Commercial
Office
Mixed Use Residential
Mixed Use Industrial
Mixed Use Commercial and Other
Industrial and Utility
Institutional
Park, Recreational or Preserve
Major Highway
Railway
Agricultural
Undeveloped
Ë0 0.05 0.1 0.15 0.2 0.25
MilesLand Use

Dal
e St
N
Vict
oria
St
Lexi
ngto
n Pa
rkw
ay
Ham
line
Ave
Wes
tern
Ave
§̈¦94
Selby Ave
Marshall Ave
Carroll Ave
University Ave
§̈¦94
Fuller Ave
St. Anthony Ave
Aurora Ave
Central Ave
Iglehart Ave
Dayton Ave
Mac
kubi
n St
Gro
tto S
t
Cha
tsw
orth
St
Grig
gs S
t
R4
R6R5
R3R2
R1
L1
M1M2
S1
S2
S4
S3 S5
S6
S7
S8
RF8
RF3
RF2
RF9
RF7
RF6
RF5
RF4
RF1
RF17 RF15
RF10
RF20
RF19
RF18
RF16
RF13
RF14
RF12
RF11
Legend
Docum
ent Path: C:\U
sers\knr\Desktop\R
ondo Maps\C
omm
unity Facilities.mxd
Date S
aved: 9/13/2018 12:48:22 PM
ReConnectRondo Land BridgeFeasibility Study
Æc Library
"' Medical Facility
Recreation
î Religious Facility
5 School
Study AreaË
0 0.05 0.1 0.15 0.2 0.25Miles
Community Facilities

Dal
e St
N
Vict
oria
St
Lexi
ngto
n Pa
rkw
ay
Ham
line
Ave
Wes
tern
Ave
§̈¦94
Selby Ave
Marshall Ave
Carroll Ave
University Ave
§̈¦94
Fuller Ave
St. Anthony Ave
Aurora Ave
Central Ave
Iglehart Ave
Dayton Ave
Mac
kubi
n St
Gro
tto S
t
Cha
tsw
orth
St
Grig
gs S
t
CT 334, BG 1
CT 353, BG 2 CT 353, BG 1
CT 335, BG 3
CT 335, BG 2
CT 338, BG 2CT 338, BG 1
CT 335, BG 1
CT 339, BG 1
CT 336, BG 1
CT 340, BG 2
Legend
ReConnectRondo Land BridgeFeasibility Study
Census Tract 334
Census Tract 335
Census Tract 336
Census Tract 338
Census Tract 339
Census Tract 340
Census Tract 353
Block Group Boundaries
Study Area Ë0 0.05 0.1 0.15 0.2 0.25
Miles
Block Groups and Census Tracts

Dal
e St
N
Vict
oria
St
Lexi
ngto
n Pa
rkw
ay
Ham
line
Ave
Wes
tern
Ave
§̈¦94
Selby Ave
Marshall Ave
Carroll Ave
University Ave
§̈¦94
Fuller Ave
St. Anthony Ave
Aurora Ave
Central Ave
Iglehart Ave
Dayton Ave
Mac
kubi
n St
Gro
tto S
t
Cha
tsw
orth
St
Grig
gs S
t
LegendReConnectRondo Land Bridge
Feasibility Study" Air Quality
" Environmental Review
" Feedlots
" Hazardous Waste
Investigation and Cleanup
!. Multiple Programs
# SSTS
Solid Waste
! Stormwater
# Tanks
# Water Quality
Study Area Ë0 0.05 0.1 0.15 0.2 0.25
Miles
Potentially Contaminated
Concerns

Dal
e St
N
Vict
oria
St
Lexi
ngto
n Pa
rkw
ay
Ham
line
Ave
Wes
tern
Ave
§̈¦94
Selby Ave
Marshall Ave
Carroll Ave
University Ave
§̈¦94
Fuller Ave
St. Anthony Ave
Aurora Ave
Central Ave
Iglehart Ave
Dayton Ave
Mac
kubi
n St
Gro
tto S
t
Cha
tsw
orth
St
Grig
gs S
t
LegendReConnectRondo Land Bridge
Feasibility Study0-24.99%
25-49.99%
50-74.99%
75-100%
Study Area Ë0 0.05 0.1 0.15 0.2 0.25
Miles
Minority Populations
67%
6% 23%
37%
81%
79%
60%
82%
60%
95%
25%

Dal
e St
N
Vict
oria
St
Lexi
ngto
n Pa
rkw
ay
Ham
line
Ave
Wes
tern
Ave
§̈¦94
Selby Ave
Marshall Ave
Carroll Ave
University Ave
§̈¦94
Fuller Ave
St. Anthony Ave
Aurora Ave
Central Ave
Iglehart Ave
Dayton Ave
Mac
kubi
n St
Gro
tto S
t
Cha
tsw
orth
St
Grig
gs S
t
LegendReConnectRondo Land Bridge
Feasibility Study0-24.99%
25-49.99%
50-74.99%
75-100%
Study Area Ë0 0.05 0.1 0.15 0.2 0.25
MilesLow-IncomePopulations
67%
10% 6%
8%
35%
64%
37%
25%
34%
55%
18%

Feasibility Study |July 2020 |
Page intentionally left blank.

Feasibility Study |July 2020 |
Appendix B:
Data Inventory

Feasibility Study |July 2020 |
Page intentionally left blank.

Feasibility Study |July 2020 |
Document File Title/Description Authoring Entity Content Type Planning Public Engagement Socioeconomic/ Environmental Engineering Land Bridge Projects
2014 Analysis of Impediments to Fair Housing Choice: Twin Cities Region HousingLink Report
X X
Thrive MSP 2040 MetCouncil Plan X
X
City of Saint Paul 2015-2019 Consolidated Plan; 2015 Action Plan City of Saint Paul Plan X X X
Summit-University (District 8) Plan; Area Plan Summary; Addendum to the Comprehensive Plan for the City of Saint Paul
City of Saint Paul Plan (Addendum) X
WORKING DRAFT: Ramsey County 2040 Comprehensive Plan Update Ramsey County Plan X
X
January 2018 Community Survey Results ReConnectRondo Summary (Data)
X
Peace X Design: Building the Cosmopolitan Canopy and Fostering Dialogue Cities ReConnectRondo Summary (Workshop) X X
2015 System Statement for Ramsey County MetCouncil Report X
What is RCR's "Community Development Approach"? ReConnectRondo Summary (Marketing)
X
Rondo Land Bridge - Zoning Overview and Recommendations ReConnectRondo Report
X
Historic Rondo map overlay with I-94 ReConnectRondo Visual (Map) X
X
Twin Cities African American Financial Capabilities AAFCOP Report
X
City
of S
aint
Pau
l Co
mpr
ehen
sive
Plan
Housing
City of Saint Paul Plan
X
X
Historic Preservation X
Implementation X
Introduction X
Land Use
Parks and Recreation X
Transportation X
Water Resources Management X
Heal
thy
Com
mun
ities
In
itiat
ive
Repo
rt
Appendix A: References in the Report
Urban Land Institute Minnesota
Report (Appendix)
Appendix B: Influences and Economics of Urban Planning
X Appendix C: Lid Case Studies
X
Appendix D: Health and Economic Value X
X Appendix E: Lid Projects X
X
Appendix F: Prototypical Lid Diagrams
X Executive Summary: ULI MN MnDOT TAP Findings Report (Executive Summary)
Healthy Communities Initiative: A ULI Minnesota Technical Assistance Panel for the Minnesota Department of Transportation Report X
X
Rondo - Saint Paul, MN (March 18-23, 2018) Urban Land Institute Advisory Services Program Presentation X
X
X ReConnectRondo Briefing Book Urban Land Institute Advisory Services Program Briefing Book
X
X
Victoria Street Bridge Workshop Summary Saint Paul Riverfront Corporation Workshop Summary
X
Excerpts: Twin Cities African American Financial Capabilities AAFCOP Report Excerpts
X
ReConnectRondo Briefing Book Urban Land Institute Advisory Services Program Briefing Book X
X
Lexington, Hamline and Griggs Better Bridges Saint Paul Riverfront Corporation Bridge Recommendations X ?
Central Corridor Friendly Streets Initiative: Report on Phase 1 Friendly Streets Initiative Report
X
Friendly Streets Initiative collaboration with Desnoyer Park Improvement Association: REPORT Friendly Streets Initiative Report
X
Fairview Avenue Report Friendly Streets Initiative Report
X
Raymond Station Area aka "Missing Link" Report Friendly Streets Initiative Report
X
Parking Study of Pelham Boulevard Report Friendly Streets Initiative Report
Friendly Streets Initiative collaboration with Saint Anthony Park Community Council Friendly Streets Initiative Report
X
Victoria Street Bridge Report Friendly Streets Initiative Report
X
Lexington, Hamline and Griggs Better Bridges Friendly Streets Initiative Report
X
Snelling Green Space Preliminary Report for the Snelling Common Space Workshop Friendly Streets Initiative Report
X
Friendly Streets Initiative collaboration with Union Park District Council Friendly Streets Initiative Report
X
Victoria Street Bridge Report Friendly Streets Initiative Report
X
A ULI Advisory Services Panel Report: The Rondo Community Land Bridge Urban Land Institute Report
X
Reth
inki
ng I-
94 Rethinking I-94: Community Summary
Minnesota Department of Transportation
Presentation
X X
What is Rethinking I-94? One-Pager
Rethinking I-94: Phase 1 Executive Summary Report (Executive Summary)
X Rethinking I-94: Phase 1 Report Report X X X X X e1: Corridor Summary Graphic Report (Appendix)
X
e2: Desk Research
X

Feasibility Study |July 2020 |
Document File Title/Description Authoring Entity Content Type Planning Public Engagement Socioeconomic/ Environmental Engineering Land Bridge Projects
e3: Baseline Survey Results
X
e4: Community Culture and History Overviews
X
e5: Market Segmentation Survey Common Themes
X X
e6: Visioning Workshops Report
X
e7: Interactive Map Overview
X
e8: Zone Profiles
X
e9: Engagement, Methods, Guiding Commitments, and Livability Framework
X
e10: Community Comments Database
X
e11: Public Engagement Toolkit
X
e12: Public Engagement Toolkit Training Guide
X
t1: Asset Conditions, Map and Program Schedule
X
t2: Geometric and Traffic Conditions Summary X
X
t3: Vertical Constraints Analysis
X
t4: Air Quality Overview
X
t5: Existing Traffic Volume Data Summary X
X
t6: Assessing the Effects of Automated Vehicles on I-94
t7: Travel Time Reliability Summary
X
t8: Origin-Destination Data Summary X
t9: Urban Freight Study X
X X
t10: Crash Data Summary
X
t11: Freeway Connections Study X
X
t12: Non-motorized Crossings Analysis X
X X
t13: Parallel Pedestrian and Bicycle Facility Opportunities X
t14: Spot Mobility Improvements Study X
X
t15: MnPASS Concepts Study X
X
t16: MnPASS Connections CORSIM Analysis X
X
t17: Bus on Shoulder Reliability Analysis
X
t18: MnPASS Downtown Connections Study X
X
t19: Downtown Connections Modeling Results X
X
t20: Evaluation Framework Tool X
X
Capstone Report entitled "A Component of the Health Impact Assessment on the Rondo Land Bridge" UMN Students Report
X
Recommendations regarding Physical Activity, Green Space, and Local Economy UMN Students Summary
X
Part one of Health Impact Assessment Training presentation by MDH MDH Presentation
X
Part two of Health Impact Assessment Training presentation by MDH MDH Presentation
X
Part three of Health Impact Assessment Training presentation by MDH MDH Presentation
X
Rondo Community Health Impact Assessment Training Sign-In N/A Sign-In Sheet
X
Rondo Land Bridge HIA Discussion Minutes Meeting Minutes
X
HIA Project Team, Steering Committee and Technical Committee Roles and Responsibilities Role Summary
X
ReConnectRondo Health Impact Assessment (HIA) Timeline - Mark-up Timeline
X
ReConnectRondo - Rondo Land Bridge Project Health Impact Assessment Work Plan Timeline
X
HIA Work Plan Timeline
X
Meeting Minutes - HIA Committee Meeting 8/2/17 Meeting Minutes
X
Health Equity Conversation Meeting Notes
X
MnDOT Power Map and Policy Framing and Potential Leverage Points Visual (Flow Table)
X
Rondo Land Bridge HIA Planning Team Contact List Contact List
X
Pre-HIA Evaluation survey Questionnaire
X
Pre-HIA Evaluation survey results Questionnaire Results
X
Victoria Street Bridge Better Bridges Workshop Summaries with Recommendations Summary
X
Goals of Rondo HIA Goal List
X
ReConnectRondo Engagement Activities lists List
X
RCR Engagement Location Map Visual (Map)
X
General Land Use Map Visual (Map)
X
Sam's HIA Data Presentation Notes - September 5, 2017 Notes
X
HIA Data Presentation Summary Sheet with Figures Summary
X

Feasibility Study |July 2020 |
Document File Title/Description Authoring Entity Content Type Planning Public Engagement Socioeconomic/ Environmental Engineering Land Bridge Projects
HIA Steering and Technical Advisory Second Committee Meeting Minutes Meeting Minutes
X
Stakeholder Interview Summary Data (interview results)
X
Table Lead Questions for 2nd HIA Committee Meeting Discussion Guidance
X
Photos from the HIA 3rd Meeting Photos
X
2nd HIA Steering Committee Meeting Data Presentation Presentation
X
Public Health HIA Steering and Technical Advisory Second Committee Meeting Agenda Agenda
X
Stakeholder Interview Summary Data (interview results)
X
Scoping/Discuss factors that influence health Discussion Guidance
X
November 16, 2017 HIA Meeting Presentation Presentation
X
Presentation on a Recap of the 4th HIA Meeting Presentation
X
Presentation on Project Pathways Presentation
X

Feasibility Study |July 2020 |
Page intentionally left blank.

Feasibility Study |July 2020 |
Appendix C:
Land Bridge Projects Peer Review

Feasibility Study |July 2020 |
Page intentionally left blank.

Feasibility Study |July 2020 |
Name Location Date of Completion
Size- Mile (acre)
Total Cost ($)/ Total Cost in 2018 Dollars ($)
Source of Funding Owner/ Maintenance Project Description Project Highlights Issues and Lessons Learned
Completed Projects Freeway Park1,2,3,4,10
Seattle, Washington
1976 0.1 (5.2)
23 Million/107.1 Million
FHWA State DOT City of Seattle County Approved Forward Thrust Park Bonds CBDC funds Municipal and interstate highway funds Metro HUD Open Space Interagency Outdoor Recreation American Legion Private Developers
Seattle Parks and Recreation Department/ Seattle Parks and Recreation Department
A park over Interstate 5, containing a maze of unique architectural forms, fountains, plazas, and pathways. The park’s landscape was renovated in 2010.
First project in the US that convinced city, state, and federal agencies, and private developers to convert freeway airspace to usable space. Re-established pedestrian access. Adjacent parking garage benefited financially
from park visitors. Valued addition for residents, shoppers,
office workers, and visitors. Adjacent buildings saw increased property
tax revenues, since park added value to living in the area.
Maintenance and upkeep of facility are crucial, since over time the landscaping grew and resulted in dark, difficult to navigate, spaces.
Aubrey Davis Park1,5,8
Mercer Island, Washington
1985 2.8 (80.0)
300 Million/TBD Unknown WSDOT and City of Mercer Island/ City of Mercer Island
A park over Interstate 90 containing football and soccer fields, three baseball diamonds, two outdoor basketball courts, four tennis courts (double as skateboard arenas), sheltered picnic area, children’s play equipment, bicycle trails, pedestrian trails, and public restrooms. Currently, the park is undergoing a master planning process.
Reconnected communities, while decreasing noise and air pollution. Created an impressive visual aesthetic –
views of the Cascades, the Olympics, and downtown Bellevue and Seattle.
The age of the facility is causing problems. Asphalt pathways are cracking, soils are depleted, and portions of the trail are being used in ways not fully anticipated in the original design. Improvements require funding that is currently not available. Complicated ownership, maintenance,
and lease situation with WSDOT. Klyde Warren Park1,2,3,6,11
Dallas, Texas
2012 0.2 (5.2)
110 Million/125.2 Million
City of Dallas (bonds) TxDOT Private Donations Stimulus Funds
City of Dallas/ Woodall Rodgers Park Foundation
A park and commercial space over the recessed Woodall Rodgers Freeway, featuring a full service restaurant, a walk-up food kiosk, restrooms, game tables, game carts, butterfly gardens, botanical garden, children’s park, performance pavilion, dog park, and lawn spaces. The park provides daily free programming for the public.
Over $1 billion in new developments since its opening. Led to a 61 percent increase in streetcar
ridership. Reconnected districts and improved
accessibility. Included air quality and stormwater drainage
improvements.
Costs to build and maintain, more than anticipated. Multiple funding entities resulted in a
need to balance competing interests. Changes to national and state regulations
during construction presented unforeseen obstacles.
Margaret T. Hance Park1,2,3,7
Phoenix, Arizona
1990 0.5 (32.0)
105 Million/188.1 Million
FHWA State and additional discretionary funds City of Phoenix
City of Phoenix/ City of Phoenix
A park over Interstate 10, featuring a Japanese Friendship Garden, an Irish Cultural Center, two libraries, the Phoenix Center for the Arts, picnic areas, a playground, restrooms, walking paths, and a lighted sand volleyball court. The historic Winship House also stands on the park grounds. The park is conducting a revitalization project, and recently released park design concepts in May 2018.
Catalyst for commercial and residential revitalization in surrounding area. Immense public support for the park deck
enabled the freeway to be built through the heart of the City.
Encountered engineering and design issues, regarding ramps, lighting, water leakage through deck, tree selection, and weight limitations.
I-670 Cap at Union Station1,2,9,12
Columbus, Ohio
2004 0.04 (1.1)
9.4 Million/9.9 Million
Ohio DOT City of Columbus Continental Real Estate Companies
Continental Real Estate Companies/ Continental Real Estate Companies
Retail development lining High Street, over I-670. The project provides 25,500 square feet of retail development. The buildings are built to be reminiscent of the historic Columbus Union Depot.
Helped heal a 40-year scar created from the construction of I-670. Consists of three separate bridges. Provides 25,496 square feet of leasable
space. Retail developer signed a memorandum of
understanding with the City of Columbus, stating if the city could gain clear title to air rights, and obtain permission from ODOT and FHWA to build the Cap platforms, the company would enter into a lease agreement for the platforms and construct the retail buildings.
When I-670 was originally constructed, the state only acquired ground rights. It was costly and time consuming to locate and obtain permission from the owners for the 13 parcels below the Cap. Design limitations on buildings due to I-
670 (no windows on rear facades, no access to roof or rear of buildings, and no lighted advertisements or signs visible from the highway). Utility connections were challenging. Struggled to find the right mix of
commercial businesses that would succeed on the Cap. Lacks adequate adjacent parking.

Feasibility Study |July 2020 |
1Urban Land Institute, Healthy Communities Initiative: I-94 and I-35W at Washington Avenue Lid Study Report, Appendix C – Lid Case Studies, https://minnesota.uli.org/advisory-services/technical-assistance-panel-tap/mndot-technical-assistance-panel-healthy-communities-initiative/. 2Urban Land Institute, Advisory Services Panel Report, Saint Paul, Minnesota: The Rondo Community Land Bridge, March 18-23, 2018. 3Lid 5 Organization, Case Studies, https://lidi5.org/case-studies/ 4Freeway Park Association website, http://freewayparkassociation.org/ 5City of Mercer Island, Washington website, https://www.mercergov.org/Page.asp?NavID=613 6Klyde Warren Park website, https://www.klydewarrenpark.org/ 7Margaret T. Hance Park website, https://www.phoenix.gov/parks/parks/alphabetical/h-parks/hance 8Mercer Island Reporter article, http://www.mi-reporter.com/news/mercer-islands-aubrey-davis-park-master-planning-process-begins/ 9FHWA Project Profile, https://www.fhwa.dot.gov/ipd/project_profiles/oh_cap_union_station.aspx 10Project for Public Spaces website, https://www.pps.org/projects/freewaypark 11USDOT, Ladders of Opportunity, Case Study, https://www.cnu.org/sites/default/files/Spokane%20Case%20Study%204%20-%20Dallas.pdf 12The Columbus Dispatch article, http://www.dispatch.com/content/stories/business/2007/10/11/cap_business.ART_ART_10-11-07_C10_GQ85BEK.html
Name Location Status Estimated Size Estimated Cost Project Description Anticipated Project Highlights Projects Under Development Grandview Green1 Edina,
Minnesota Proposed 13 acres $6.7 Million to $70-$90 Million (depends on extent) Concept to explore how a lid over Highway 100 could
connect neighborhoods, enhance bicycle and pedestrian routes, increase sustainability practices, and improve the economic productivity of the land around Highway 100 in a way that provides new community benefits. The project has the potential to create 13 acres of new buildable land. Parking and transportation space would be hidden below the green space.
Edina’s property tax revenue from the Grandview District is projected to increase from approximately $2-$100 Million.
Lid I-52,8 Seattle, Washington
Proposed 10 acres $250 Million Project to provide more public infrastructure, such as parks and open space, affordable housing, schools, or community centers, to address predicted population growth.
Repair the disconnect created as a result of I-5.
Oak Cliff Park Deck over I-353,4,11 Dallas, Texas Construction 5.5 acres TBD (estimated around $135 million) Phase I intended to include a lawn event space, performance stage, dog park, board game area, and a snack shack or restaurant. Phase II consists of a skate and recreation area. Proposed project location is adjacent to the Dallas Zoo.
Estimated to spur more than $166 million in development. Part of the $666 million TxDOT Southern Gateway highway expansion
project.
Hollywood Central Park Lid over US 101 Freeway2,9 Hollywood, California
Proposed 44 acres $1 Billion Creates a public park for all ages, featuring grass fields, athletic courts, and children’s play areas in the heart of Hollywood. It would reunite diverse communities and dense neighborhoods that were separated by the freeway.
Create a park in one of the most park-poor neighborhoods in LA; currently, area has just 0.005 acres of open space per resident.
The Stitch over I-752,5 Atlanta, Georgia
Proposed 14 acres $300 Million Aims to create urban greenspace and new development sites on and adjacent to the project area. Concept includes an urban plaza connecting amenities (i.e. residential, institutional, and retail) to a re-imagined light rail station. Proposed as a 3-acre urban green space, with water features, a restaurant and café, a pavilion space, an art walk, and a civic heroes memorial.
Generate significant opportunity to foster transit-orientated development at a light rail station. Project could result in $1.1-$3.1 billion in value creation and generate
$21-$58 million in revenue. Project could increase city’s bonding capacity by $308-$847 billion by
increasing the value of existing properties. Project anticipated to be the catalyst for the redevelopment of
underutilized properties in the adjacent areas. 11th Street Bridge6,7 Washington
D.C. Pre-Construction
1200 feet long $50-$55 Million Project aims to be Washington DC’s first ever elevated public park, located over the Anacostia River, constructed on the piers of an existing bridge. The proposed park calls for a public plaza, amphitheater, environmental education center, and other amenities.
Would connect an economically disadvantaged neighborhood with an economically privileged neighborhood. Due to concerns the project will force low and moderate income
residents out of the area, project organizers have enlisted community members and housing experts to determine how to prepare low-income and mostly minority residents for a possible economic turnaround.
Note: Information in this table may change, due to the on-going development of the projects. 1City of Edina, Grandview Green website, https://www.edinamn.gov/1386/Grandview-Green 2Lid 5 website, https://lidi5.org/ 3Dallas News Article, https://www.dallasnews.com/news/oak-cliff/2017/06/28/oak-cliff-deck-park-gets-unanimous-ok-dallas-city-council 4Dallas Observer Article, https://www.dallasobserver.com/news/take-a-first-look-at-the-new-southern-dallas-deck-park-8740072 5Central Atlanta Progress, Atlanta Downtown Improvement District, https://www.atlantadowntown.com/initiatives/the-stitch 611th Street Bridge Park website, https://www.bridgepark.org/ 7The Washington Post article, https://www.washingtonpost.com/news/digger/wp/2017/09/25/big-philanthropists-flock-to-d-c-s-bridge-park-project-to-battle-gentrification/?noredirect=on&utm_term=.93d52fed81ba 8Seattle Magazine article, https://www.seattlemag.com/news-and-features/what-would-seattle-look-if-i-5-was-covered 9Urbanize.LA article, https://urbanize.la/post/hollywood-central-park-seeks-15-million-complete-eir 10Hollywood Central Park website, https://hollywoodcentralpark.org/home 11Dallas News article, https://www.dallasnews.com/news/transportation/2017/04/26/people-around-proposed-oak-cliff-deck-part-supportive-worried-cost

Feasibility Study |July 2020 |
Appendix D:
City of Saint Paul Zoning Maps

Feasibility Study |July 2020 |
Page intentionally left blank.

Feasibility Study |July 2020 |

Feasibility Study |July 2020 |
Feasibility Study |July 2020 |
Appendix E:
Cultural Resources

Feasibility Study |July 2020 |
Property Name Address Property Type Adolph Kalman House/John W. Miller House 611 Dayton Ave. W residence
Anton C. Bettingen House 569 Marshall Ave. W residence
apartment 273 Dayton Ave. W apartment
apartment 180-184 Kent St. N apartment
apartments 283 -285 Dayton Ave. W apartments
apartments 590 Dayton Ave. W apartment
apartments 467 Selby Ave. W. apartment
Augustus J. Goodrich House 259 Dayton Ave. W residence
Blair Flats 165 Western Ave. N. apartment
Captain J.W. Jacobs House 492 Marshall Ave. W residence
Cathedral of Saint Paul Summit Ave. church
Cathedral of Saint Paul Rectory 239 Selby Ave. W. property
Catholic Bulletin & Catholic Cemeteries Building 244 Dayton Ave. W property
Chadwick House 528 Dayton Ave. W residence
Charles F. F. Abbott House 451 Selby Ave. W. residence
commercial building 367-371 Selby Ave. W. commercial building
commercial building 452-454 Selby Ave. W. commercial building
commercial building 495-499 Selby Ave. W. commercial building
commercial building 504 Selby Ave. W. commercial building
commercial building 515-525 Selby Ave. W. commercial building
commercial building 526-530 Selby Ave. W. commercial building
commercial building 606-608 Selby Ave. W. commercial building
D.W. Lawler House 546 Marshall Ave. W residence
Dakotah Building 366-374 Selby Ave. W. commercial building
Dayton Avenue Rowhouse 568-574 Dayton Ave. W rowhouse
double house 218-220 Mackubin St. N double house
double residence 551-553 Selby Ave. W. multiple dwelling
double residence 555 Selby Ave. W. multiple dwelling
double residence 579-581 Selby Ave. W. multiple dwelling
double residence 225-227 Western Ave. N. multiple dwelling
Dr. Edward Walther House 443 Dayton Ave. W residence
duplex 512-514 Marshall Ave. W duplex
Engine House #5 498 Selby Ave. W. fire station
Fred T. Schroth House 580 Marshall Ave. W residence
George E. Snell House 548 Dayton Ave. W residence
H.M. Hart House 250 Dayton Ave. W residence
Henry S. Johnson House 601 Dayton Ave. W residence
Hewson S. Semple House 556 Selby Ave. W. residence
Hill Market 176-182 Western Ave. N. commercial building
Horst Building 224-226 Western Ave. N. commercial building

Feasibility Study |July 2020 |
Property Name Address Property Type house 315 Dayton Ave. W residence
house 485 Dayton Ave. W house
house 487 Dayton Ave. W residence
house 490 Dayton Ave. W residence
house 518 Dayton Ave. W residence
house 549 Dayton Ave. W residence
house 614 Dayton Ave. W residence
house 530 Marshall Ave. W residence
house 566 Marshall Ave. W residence
house 584 Marshall Ave. W residence
J.W. Bishop House 442 Dayton Ave. W residence
John Carlson House 469 Dayton Ave. W residence
John Johnson House 483 Selby Ave. W. residence
John M. Carlson House 475 Dayton Ave. W residence
John Ruse House 569-571 Selby Ave. W. multiple dwelling
John Stein House 565 Marshall Ave. W residence
Joseph McCardy House 197 Kent St. N residence
Judson Wade Bishop House 193 Mackubin St. N residence
Kretz/Tighe House 314 Dayton Ave. W residence
L.J. Gates House 450-452 Dayton Ave. W residence
L.J. Gates House 573 Marshall Ave. W residence
Lasher/Newel House 251 Dayton Ave. W residence
Luckert House 480 Iglehart Ave. W residence
Merrick E. Vinton House 309-311 Dayton Ave. W apartment
monument ca. 621 Selby Ave. W. monument
office building 401 Selby Ave. W. office building
Philip Abbott House 496-498 Dayton Ave. W residence
Philip Reilly House 565 Dayton Ave. W residence
Pilgrim Baptist Church 732 Central Ave. W church
residence 411 Selby Ave. W. residence
residence 441 Selby Ave. W. residence
residence 449 Selby Ave. W. residence
residence 549 Selby Ave. W. residence
residence 565 Selby Ave. W. residence
residence 570 Selby Ave. W. residence
residence 580 Selby Ave. W. residence
residence 594 Selby Ave. W. residence
residence 217 St. Albans St. N. residence
School Patrol Flagpole ca. 201 Summit Ave. W. property
Shepard House 341 Dayton Ave. W residence

Feasibility Study |July 2020 |
Property Name Address Property Type St. Joseph's Academy 355 Marshall Ave. W school
Saint Paul Curling Club 470 Selby Ave. W. sports facility
store & apartments 191 Western Ave. N. commercial building
Thacker Apartments 294-296 Dayton Ave. W apartment
The Elmwood 235-237 Arundel St. N apartment
The St. George 258-264 Selby Ave. W. multiple dwelling
Thomas Fitzpatrick House 265 Dayton Ave. W house
Virginia St. Church 170 Virginia St. N. (also 338 Selby Ave. W.) church
Welch. S.S., house 785 Dayton Ave. W residence
William R. Marshall House 496 Marshall Ave. W residence
Source: MnDOT Office of Environmental Stewardship, Cultural Resources Unit, September 18, 2018.

Feasibility Study |July 2020 |

Feasibility Study |July 2020 |

Feasibility Study |July 2020 |
Appendix F:
Potentially Contaminated Concerns

Feasibility Study |July 2020 |
Site Name Address Activity Big River Studio Inc. 1222 University Ave W Hazardous Waste, Very small quantity
generator Rayven Inc. 431 Griggs St N Multiple Activities
Latuff Bros 880 University Ave W Multiple Activities
ISD 625 - 1210 University Avenue 1210 University Ave W Multiple Activities
ABRA Auto Body & Glass, LP 1190 University Ave W Multiple Activities
Heppner's Auto Body - St Paul 400 Syndicate St N Multiple Activities
Moudry Apothecary Shop 393 N Dunlap St Ste 110 Hazardous Waste
Concordia College - St Paul 275 N Syndicate St Hazardous Waste, Very small quantity generator
Gils Paint & Body 928 University Ave W Hazardous Waste, Very small quantity generator
Glasgow Automotive Service 740 University Ave W Hazardous Waste, Very small quantity generator
Waynewood & Associates 393 N Dunlap St Ste 310 Hazardous Waste, Very small quantity generator
University Auto Sales & Service 900 University Ave W Multiple Activities
A-Auto Mall 923 University Ave Hazardous Waste, Very small quantity generator
Midas Muffler Shops 520 University Ave Multiple Activities
Fresh Paint Inc. - Selby Ave 477 Selby Ave Hazardous Waste
White House Custom Color 1185 Selby Ave Hazardous Waste
ISD 625 - Maxfield 380 N Victoria St Multiple Activities
SuperAmerica 4421 970 University Ave W Multiple Activities
ISD 625 St Paul Public Schools 275 N Lexington Pkwy Multiple Activities
Thong Auto Repair Inc. 904 University Ave W Hazardous Waste, Very small quantity generator
Burns Amoco - University 1111 University Ave W Hazardous Waste, Very small quantity generator
Cathedral Hill Chiropractic 400 Selby Ave Multiple Activities
HealthPartners Physicians Clinic 451 Dunlap St N Hazardous Waste, Very small quantity generator
Burns Amoco - Lexington 374 N Lexington Pkwy Hazardous Waste
Les Auto Service 468 University Ave W Multiple Activities
B & A Body Shop 1041 Aurora Ave Hazardous Waste
Hitching Post Inc 945 University Ave W Hazardous Waste, Very small quantity generator
Johnson William H II 393 N Dunlap St Ste 303 Hazardous Waste, Minimal quantity generator
A-1 Cycle Shop 946 W University Ave Hazardous Waste
ISD 625 - Colburne St 360 Colburne St Hazardous Waste
Central Pediatrics - Dunlap St 393 N Dunlap St Ste 300 Hazardous Waste
Jwb & Son Uni Dale Cleaners 584 University Ave W Hazardous Waste
Kawasaki Of Saint Paul 490 University Ave W Hazardous Waste
Keys Well Drilling 413 Lexington Pkwy N Hazardous Waste
St Paul Public Housing Central 554 Central Ave W Hazardous Waste
Ashma Auto Repairs 814 University Ave W Hazardous Waste, Very small quantity generator

Feasibility Study |July 2020 |
Site Name Address Activity Payless Tires 698 University Ave W Hazardous Waste, Very small quantity
generator St Paul City Church 1088 University Ave Hazardous Waste
Model Cities Health Center 409 N Dunlap St Multiple Activities
SPRWS Distribution Division Old Site 289 Hamline Ave N Hazardous Waste
Target Store T2229 1300 University Ave W Multiple Activities
College of Visual Arts 173 Western Ave N Site B Hazardous Waste
Dermatology Consultants - St Paul 393 N Dunlap St Ste 720 Hazardous Waste
Dayton Avenue Presbyterian Church 217 Mackubin St Hazardous Waste, Very small quantity generator
Target Corp 400 Hamline Ave N Multiple Activities
Larscheid Daniel J DDS 958 University Ave W Hazardous Waste
Desnick Brothers Drug 415 Lexington Pkwy N Hazardous Waste
Northern Star Council BSA 393 Marshall Ave Hazardous Waste
Residence - Aurora Ave 649 Aurora Ave Hazardous Waste
Midwest Ear Nose & Throat Specialists I 393 N Dunlap St Ste 600 Hazardous Waste
Lexington Commons Apartments 375 N Lexington Pkwy Multiple Activities
Recombinetics R&D 1246 University Ave W Ste 301 Hazardous Waste, Small quantity generator
Saint Peter Claver Catholic Church 375 Oxford St N Multiple Activities
Nanocopoeia Inc. 1246 University Ave W Ste 463 Multiple Activities
Affordable Tire - University Avenue 1309 University Ave W Hazardous Waste
Waynewood & Associates PA 393 N Dunlap St Ste 650 Hazardous Waste
Suntava LLC 1246 University Ave Ste 333 Hazardous Waste, Very small quantity generator
O'Reilly Automotive 1799 448 N Lexington Pkwy Hazardous Waste, Very small quantity generator
Grand Health Chiropractic & Wellness Center 1025 Selby Ave Ste 101 Hazardous Waste
Munich Auto 1266 Donohue Ave Hazardous Waste
Clear Lakes Dental 393 Dunlap St N Hazardous Waste, Very small quantity generator
VitreoRetinal Surgery 393 Dunlap St N Ste 231 Hazardous Waste, Very small quantity generator
SuperAmerica 4020 399 Lexington Pkwy N Multiple Activities
Central Midway 393 Dunlap St N Multiple Activities
Bethel Care Center - Mission Health Care LLC 420 Marshall Ave Hazardous Waste, Very small quantity generator
Community Action Partnership Ramsey County
450 Syndicate St Hazardous Waste, Very small quantity generator
1161 Selby LLC 1161 Selby Ave Hazardous Waste
Amherst H Wilder Foundation 451 Lexington Pkwy N Hazardous Waste, Very small quantity generator
AGAPE Health Start Clinic 1037 University Ave W Hazardous Waste, Very small quantity generator
Gordon Parks Health Start Clinic 1212 University Ave Hazardous Waste, Very small quantity generator
Robert Vasser 1000 Concordia Ave Hazardous Waste
Catholic Charities of Saint Paul and Minneapolis
1276 University Ave Hazardous Waste, Very small quantity generator

Feasibility Study |July 2020 |
Site Name Address Activity Long Cheng Plaza LLC 402 University Ave Hazardous Waste
Ramsey County Former Valvoline Rapid Oil Change
Hazardous Waste
Children's Dental Services- Ruth Benner Head Start
586 Fuller Ave Hazardous Waste, Treatment storage disposal facility
New Alternative Learning Center 1212 University Ave Construction Stormwater
Control Data World Distribution Center 304 N Dale St Multiple Activities
Selby Dale Cooperative 631 Selby Ave Petroleum Remediation, Leak Site
Innovalight 1246 University Ave W Ste 468 Hazardous Waste
Wilkins Lincoln Mercury & Toyota 1020 University Ave W Hazardous Waste
Randolph Heights Elementary School 348 S Hamline Ave Underground Tanks
Keys Well Drilling Co 413 Lexington Pkwy N Multiple Activities
Morningstar Star Redevelopment 739 Selby Avenue Construction Stormwater
Lexington BP 374 Lexington Ave N Multiple Activities
Unidale Corridor See location description Site Assessment
WIlder Foundation - 650 Marshall Address Unknown Construction Stormwater
Carty Heights 412 Dunlap St Construction Stormwater
Sams Secondhand Store 935 University Ave W Hazardous Waste, Minimal quantity generator
Jamestown Apartments 586 West Central Ave Brownfields, Voluntary Investigation and Cleanup
CommonBond Communities 385 Lexington Pkwy Construction Stormwater
Central Corridor Lt Rail Transit Civil E Address Unknown Construction Stormwater
Morning Star Church 739 Selby Ave Multiple Activities
Former Tires Plus Location 600 University Ave W Hazardous Waste
Keys Parcel 1156 Fuller Ave Petroleum Remediation, Leak Site
Jimmy Lee Rec Ctr/Oxford Pool (Phase 1) 270 Lexington Parkway North Multiple Activities
Capitol City Auto Electric 690 University Ave W Hazardous Waste
St Paul Mach & Design Inc 1046 University Ave W Hazardous Waste
City Of Saint Paul NW Corner of Dale St & Dayton Ave
Petroleum Remediation, Leak Site
3M Aerospace Plant 1210 University Ave W Multiple Activities
400 Griggs Street North 400 Griggs St N Brownfields, Voluntary Investigation and Cleanup
Former Midway Car Dealer 1333 University Ave W Underground Tanks
Dale & Fuller Soil Gas 430 Dale St N Multiple Activities
Wilder Center Community Assistance Prog 650 Marshall Ave Multiple Activities
Wilder Foundation - CSW See location description Construction Stormwater
Selby Commons 909 Selby Ave Multiple Activities
Donohue Avenue Property 1263 Donohue Avenue Brownfields, Voluntary Investigation and Cleanup
Unidale Mall #3 544 University Ave W Brownfields, Voluntary Investigation and Cleanup
Capitol Carbide 1000 University Ave W Fl 2 Hazardous Waste
David Keyes Property 412 Dayton Ave Emergency Management
Minnoco Tobasi Stop 809 Selby Ave Multiple Activities

Feasibility Study |July 2020 |
Site Name Address Activity Genuine Parts Company 460 Lexington Pkwy N Hazardous Waste, Very small quantity
generator 633 Dayton Property 633 Dayton Ave Brownfields, Petroleum Brownfield
St Philips Gardens Inc. 754 Concordia Ave Hazardous Waste, Very small quantity generator
Rapid Oil Change 619 Saint Anthony St Multiple Activities
Capital Gears Inc. Hamline & Concordia Petroleum Remediation, Leak Site
Amoco Ss #5016 1111 University Ave W Multiple Activities
Vacant Lot Western & Marshall Petroleum Remediation, Leak Site
Liberty Plaza Limited Partnership 431 Marshall Hazardous Waste
ZLB Plasma Services - St Paul 1054 University Ave W Hazardous Waste, Very small quantity generator
Retrofit Recycling Inc 1222 University Ave W Hazardous Waste
Midwest Surgi Center 393 N Dunlap Ste 746 Hazardous Waste, Very small quantity generator
Skyline Tower 1247 Saint Anthony Blvd Multiple Activities
Superamerica #4421 970 University Ave Underground Tanks
Former Gas Station 458 through 476 N Lexington Pkwy
Petroleum Remediation, Leak Site
Browns Office Machines Inc. 1051 Selby Ave Hazardous Waste, Very small quantity generator
Apsara One Hour Photo 448 University Ave W Hazardous Waste
St. Albans Park 631 Selby Ave Multiple Activities
Unidale Mall 544 - 612 University Ave Multiple Activities
Dale and Dayton 202 N Dale St Brownfields, Voluntary Investigation and Cleanup
Western Ave. Address Unknown Construction Stormwater
Ronald Hubb Life Long Literacy 1040 University Ave Underground Tanks
Mark Chiropractic 411 Lexington Pkwy N Hazardous Waste
University Strip Mall See location description Brownfields, Voluntary Investigation and Cleanup
Don Rinaldi (caretaker) 436 Dayton Underground Tanks
Central Hi-rise (m-1-5) 554 W Central Ave Multiple Activities
University and Hamline Midway Site 1309 and 1333 University Ave Multiple Activities
Saint Paul Electroplating Co 1048 Aurora Ave Multiple Activities
GT Parts Co - University Ave 1000 University Ave SE Hazardous Waste
Jamestown Homes 600 Central Ave. West Construction Stormwater
Macdonald Montessori 175 Western Ave S Hazardous Waste, Minimal quantity generator
Tcf Parcel B 417 Lexington Pkwy N Petroleum Remediation, Leak Site
Courier Graphics - St Paul 962 University Ave W Hazardous Waste
St Paul Police Dept- W Dist Office - CSW 389 N Hamline Ave Construction Stormwater
Expo Graphics Inc. 308 Dale St N Hazardous Waste
Holiday Stationstore #341 1345 Marshall Ave Multiple Activities
Saint Paul Escort Inc. 857 Selby Ave Multiple Activities
American Auto Radiator 680 University Ave W Hazardous Waste, Very small quantity generator
NSP Gas Holder See location description CERCLIS Site

Feasibility Study |July 2020 |
Site Name Address Activity Economy Muffler 924 University Ave W Hazardous Waste, Very small quantity
generator Bureau Of Criminal Apprehension 1246 University Ave Underground Tanks
Oxford Community Center Synthetic Turf Address Unknown Construction Stormwater
Whitaker Buick 494 N Griggs St Petroleum Remediation, Leak Site
University Dale Aurora Properties 626 University Ave W Brownfields, Petroleum Brownfield
Tv Times 1010 University Ave W Hazardous Waste
Jeremiah Campus Community 950 Concordia Ave Construction Stormwater
Redeemers Arms 313 Dale St N Multiple Activities
Target Midway See location description Construction Stormwater
Jeremiah Program Project 956 Concordia Ave Brownfields, Voluntary Investigation and Cleanup
Concordia College 275 N Syndicate St Multiple Activities
Quan Family Dentistry 422 University Ave W Hazardous Waste, Very small quantity generator
Twin City Used Appliances 654 University Ave W Hazardous Waste
Selby Grotto Apartments 755 Selby Ave Brownfields, Voluntary Investigation and Cleanup
Valvoline Rapid Oil Change Inc. 619 Saint Anthony Ave Hazardous Waste, Very small quantity generator
Midway Oil Co 400 N Dale St Multiple Activities
Wilkins Lincoln Mercury Inc. 1020 University Ave Underground Tanks
Abra Auto Body 1190 University Ave Multiple Activities
Hill Elementary School 998 Selby Ave Underground Tanks
Keys Parcel 413 Lexington Pkwy N Brownfields, Voluntary Investigation and Cleanup
Mai Village 380 to 392 University Ave Multiple Activities
Sinclair & Valentine Consolidated 431 Griggs St N CERCLIS Site
Source: Minnesota Pollution Control Agency, What’s In My Neighborhood. https://www.pca.state.mn.us/data/whats-my-neighborhood.

Feasibility Study |July 2020 |
Appendix G:
Rondo Land Bridge Elements Matrix

Feasibility Study |July 2020 |
Page intentionally left blank.


Feasibility Study |July 2020 |
Appendix H:
Engineering Cost Estimates

Feasibility Study |July 2020 |
Page intentionally left blank.
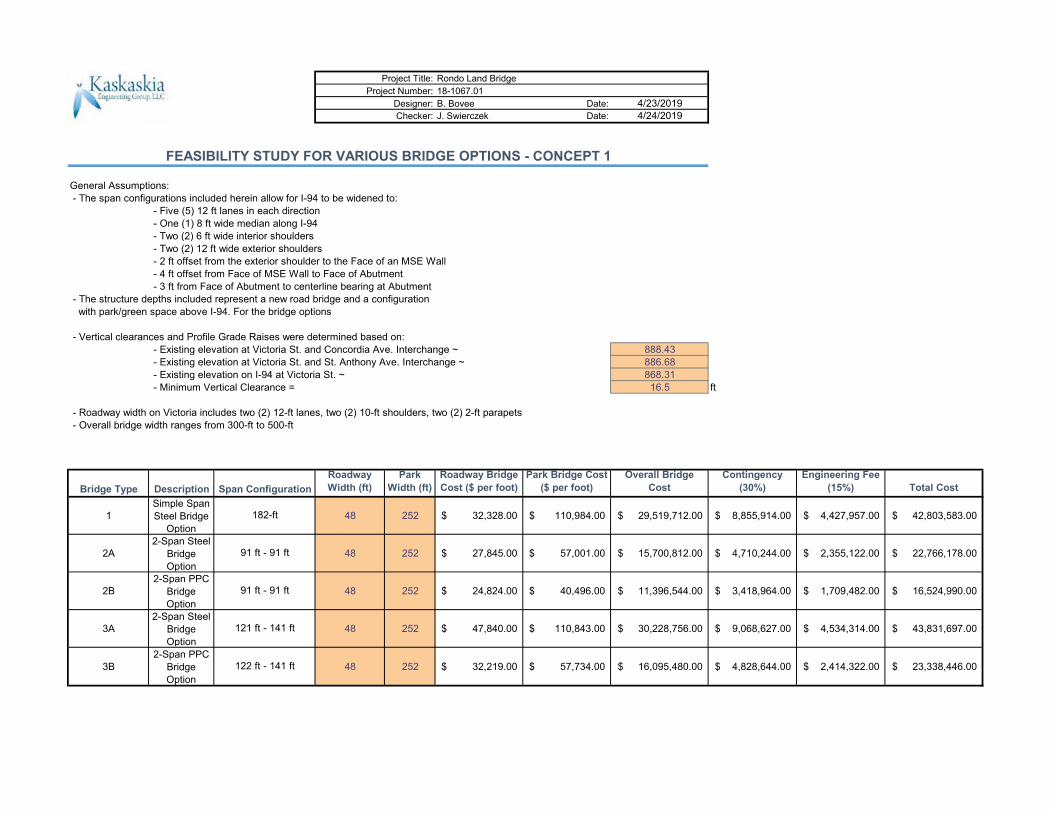
Rondo Land Bridge18-1067.01B. Bovee Date: 4/23/2019J. Swierczek Date: 4/24/2019
General Assumptions: - The span configurations included herein allow for I-94 to be widened to:
- Five (5) 12 ft lanes in each direction - One (1) 8 ft wide median along I-94 - Two (2) 6 ft wide interior shoulders - Two (2) 12 ft wide exterior shoulders - 2 ft offset from the exterior shoulder to the Face of an MSE Wall - 4 ft offset from Face of MSE Wall to Face of Abutment - 3 ft from Face of Abutment to centerline bearing at Abutment
- The structure depths included represent a new road bridge and a configuration with park/green space above I-94. For the bridge options
- Vertical clearances and Profile Grade Raises were determined based on: - Existing elevation at Victoria St. and Concordia Ave. Interchange ~ 888.43 - Existing elevation at Victoria St. and St. Anthony Ave. Interchange ~ 886.68 - Existing elevation on I-94 at Victoria St. ~ 868.31 - Minimum Vertical Clearance = 16.5 ft
- Roadway width on Victoria includes two (2) 12-ft lanes, two (2) 10-ft shoulders, two (2) 2-ft parapets - Overall bridge width ranges from 300-ft to 500-ft
Bridge Type DescriptionRoadway Width (ft)
Park Width (ft)
Roadway Bridge Cost ($ per foot)
Park Bridge Cost ($ per foot)
Overall Bridge Cost
Contingency (30%)
Engineering Fee (15%) Total Cost
1Simple Span Steel Bridge
Option48 252 32,328.00$ 110,984.00$ 29,519,712.00$ 8,855,914.00$ 4,427,957.00$ 42,803,583.00$
2A2-Span Steel
Bridge Option
48 252 27,845.00$ 57,001.00$ 15,700,812.00$ 4,710,244.00$ 2,355,122.00$ 22,766,178.00$
2B2-Span PPC
Bridge Option
48 252 24,824.00$ 40,496.00$ 11,396,544.00$ 3,418,964.00$ 1,709,482.00$ 16,524,990.00$
3A2-Span Steel
Bridge Option
48 252 47,840.00$ 110,843.00$ 30,228,756.00$ 9,068,627.00$ 4,534,314.00$ 43,831,697.00$
3B2-Span PPC
Bridge Option
48 252 32,219.00$ 57,734.00$ 16,095,480.00$ 4,828,644.00$ 2,414,322.00$ 23,338,446.00$
Project Title:Project Number:
Designer:Checker:
FEASIBILITY STUDY FOR VARIOUS BRIDGE OPTIONS - CONCEPT 1
Span Configuration
182-ft
91 ft - 91 ft
91 ft - 91 ft
121 ft - 141 ft
122 ft - 141 ft

Rondo Land Bridge18-1067.01B. Bovee Date: 4/23/2019J. Swierczek Date: 4/24/2019
Project Title:Project Number:
Designer:Checker:
FEASIBILITY STUDY FOR VARIOUS BRIDGE OPTIONS - CONCEPT 1
Bridge Type DescriptionRoadway Width (ft)
Park Width (ft)
Roadway Bridge Cost ($ per foot)
Park Bridge Cost ($ per foot)
Overall Bridge Cost
Contingency (30%)
Engineering Fee (15%) Total Cost
1Simple Span Steel Bridge
Option48 452 32,328.00$ 110,984.00$ 51,716,512.00$ 15,514,954.00$ 7,757,477.00$ 74,988,943.00$
2A2-Span Steel
Bridge Option
48 452 27,845.00$ 57,001.00$ 27,101,012.00$ 8,130,304.00$ 4,065,152.00$ 39,296,468.00$
2B2-Span PPC
Bridge Option
48 452 24,824.00$ 40,496.00$ 19,495,744.00$ 5,848,724.00$ 2,924,362.00$ 28,268,830.00$
3A2-Span Steel
Bridge Option
48 452 47,840.00$ 110,843.00$ 52,397,356.00$ 15,719,207.00$ 7,859,604.00$ 75,976,167.00$
3B2-Span PPC
Bridge Option
48 452 32,219.00$ 57,734.00$ 27,642,280.00$ 8,292,684.00$ 4,146,342.00$ 40,081,306.00$ 122 ft - 141 ft
Span Configuration
182-ft
91 ft - 91 ft
91 ft - 91 ft
121 ft - 141 ft

Rondo Land Bridge18-1067.01B. Bovee Date: 4/23/2019J. Swierczek Date: 4/24/2019
General Assumptions: - The span configurations included herein allow for I-94 to be widened to:
- Five (5) 12 ft lanes in each direction - One (1) 8 ft wide median along I-94 - Two (2) 6 ft wide interior shoulders - Two (2) 12 ft wide exterior shoulders - 2 ft offset from the exterior shoulder to the Face of an MSE Wall - 4 ft offset from Face of MSE Wall to Face of Abutment - 3 ft from Face of Abutment to centerline bearing at Abutment
- The structure depths included represent a new road bridge and a configuration with park/green space above I-94. For the bridge options
- Vertical clearances and Profile Grade Raises were determined based on: - Existing elevation at Victoria St. and Concordia Ave. Interchange ~ 888.43 - Existing elevation at Victoria St. and St. Anthony Ave. Interchange ~ 886.68 - Existing elevation on I-94 at Victoria St. ~ 868.31 - Minimum Vertical Clearance = 16.5 ft
- Roadway width uncludes 3 roadway structures with two (2) 12-ft lanes, two (2) 10-ft shoulders, two (2) 2-ft parapets each - Overall bridge width ranges from 900-ft to 1000-ft
Bridge Type DescriptionRoadway Width (ft)
Park Width (ft)
Roadway Bridge Cost ($ per foot)
Park Bridge Cost ($ per foot)
Overall Bridge Cost
Contingency (30%)
Engineering Fee (15%) Total Cost
1Simple Span Steel Bridge
Option144 756 32,328.00$ 110,984.00$ 88,559,136.00$ 26,567,741.00$ 13,283,871.00$ 128,410,748.00$
2A2-Span Steel
Bridge Option
144 756 27,845.00$ 57,001.00$ 47,102,436.00$ 14,130,731.00$ 7,065,366.00$ 68,298,533.00$
2B2-Span PPC
Bridge Option
144 756 24,824.00$ 40,496.00$ 34,189,632.00$ 10,256,890.00$ 5,128,445.00$ 49,574,967.00$
3A2-Span Steel
Bridge Option
144 756 47,840.00$ 110,843.00$ 90,686,268.00$ 27,205,881.00$ 13,602,941.00$ 131,495,090.00$
3B2-Span PPC
Bridge Option
144 756 32,219.00$ 57,734.00$ 48,286,440.00$ 14,485,932.00$ 7,242,966.00$ 70,015,338.00$
Project Title:Project Number:
Designer:Checker:
FEASIBILITY STUDY FOR VARIOUS BRIDGE OPTIONS - CONCEPT 2/3
Span Configuration
182-ft
91 ft - 91 ft
91 ft - 91 ft
121 ft - 141 ft
122 ft - 141 ft

Rondo Land Bridge18-1067.01B. Bovee Date: 4/23/2019J. Swierczek Date: 4/24/2019
Project Title:Project Number:
Designer:Checker:
Bridge Type DescriptionRoadway Width (ft)
Park Width (ft)
Roadway Bridge Cost ($ per foot)
Park Bridge Cost ($ per foot)
Overall Bridge Cost
Contingency (30%)
Engineering Fee (15%) Total Cost
1Simple Span Steel Bridge
Option144 856 32,328.00$ 110,984.00$ 99,657,536.00$ 29,897,261.00$ 14,948,631.00$ 144,503,428.00$
2A2-Span Steel
Bridge Option
144 856 27,845.00$ 57,001.00$ 52,802,536.00$ 15,840,761.00$ 7,920,381.00$ 76,563,678.00$
2B2-Span PPC
Bridge Option
144 856 24,824.00$ 40,496.00$ 38,239,232.00$ 11,471,770.00$ 5,735,885.00$ 55,446,887.00$
3A2-Span Steel
Bridge Option
144 856 47,840.00$ 110,843.00$ 101,770,568.00$ 30,531,171.00$ 15,265,586.00$ 147,567,325.00$
3B2-Span PPC
Bridge Option
144 856 32,219.00$ 57,734.00$ 54,059,840.00$ 16,217,952.00$ 8,108,976.00$ 78,386,768.00$
Span Configuration
182-ft
91 ft - 91 ft
91 ft - 91 ft
121 ft - 141 ft
122 ft - 141 ft
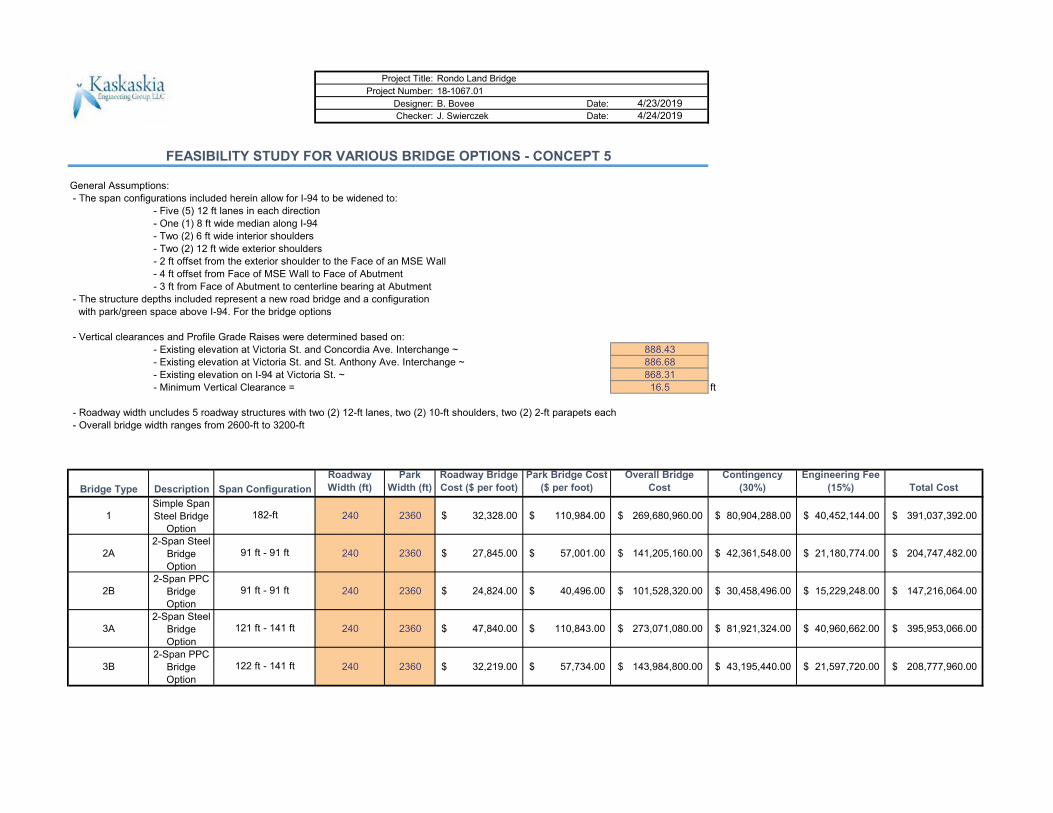
Rondo Land Bridge18-1067.01B. Bovee Date: 4/23/2019J. Swierczek Date: 4/24/2019
General Assumptions: - The span configurations included herein allow for I-94 to be widened to:
- Five (5) 12 ft lanes in each direction - One (1) 8 ft wide median along I-94 - Two (2) 6 ft wide interior shoulders - Two (2) 12 ft wide exterior shoulders - 2 ft offset from the exterior shoulder to the Face of an MSE Wall - 4 ft offset from Face of MSE Wall to Face of Abutment - 3 ft from Face of Abutment to centerline bearing at Abutment
- The structure depths included represent a new road bridge and a configuration with park/green space above I-94. For the bridge options
- Vertical clearances and Profile Grade Raises were determined based on: - Existing elevation at Victoria St. and Concordia Ave. Interchange ~ 888.43 - Existing elevation at Victoria St. and St. Anthony Ave. Interchange ~ 886.68 - Existing elevation on I-94 at Victoria St. ~ 868.31 - Minimum Vertical Clearance = 16.5 ft
- Roadway width uncludes 5 roadway structures with two (2) 12-ft lanes, two (2) 10-ft shoulders, two (2) 2-ft parapets each - Overall bridge width ranges from 2600-ft to 3200-ft
Bridge Type DescriptionRoadway Width (ft)
Park Width (ft)
Roadway Bridge Cost ($ per foot)
Park Bridge Cost ($ per foot)
Overall Bridge Cost
Contingency (30%)
Engineering Fee (15%) Total Cost
1Simple Span Steel Bridge
Option240 2360 32,328.00$ 110,984.00$ 269,680,960.00$ 80,904,288.00$ 40,452,144.00$ 391,037,392.00$
2A2-Span Steel
Bridge Option
240 2360 27,845.00$ 57,001.00$ 141,205,160.00$ 42,361,548.00$ 21,180,774.00$ 204,747,482.00$
2B2-Span PPC
Bridge Option
240 2360 24,824.00$ 40,496.00$ 101,528,320.00$ 30,458,496.00$ 15,229,248.00$ 147,216,064.00$
3A2-Span Steel
Bridge Option
240 2360 47,840.00$ 110,843.00$ 273,071,080.00$ 81,921,324.00$ 40,960,662.00$ 395,953,066.00$
3B2-Span PPC
Bridge Option
240 2360 32,219.00$ 57,734.00$ 143,984,800.00$ 43,195,440.00$ 21,597,720.00$ 208,777,960.00$
Project Title:Project Number:
Designer:Checker:
FEASIBILITY STUDY FOR VARIOUS BRIDGE OPTIONS - CONCEPT 5
Span Configuration
182-ft
91 ft - 91 ft
91 ft - 91 ft
121 ft - 141 ft
122 ft - 141 ft

Rondo Land Bridge18-1067.01B. Bovee Date: 4/23/2019J. Swierczek Date: 4/24/2019
Project Title:Project Number:
Designer:Checker:
Bridge Type DescriptionRoadway Width (ft)
Park Width (ft)
Roadway Bridge Cost ($ per foot)
Park Bridge Cost ($ per foot)
Overall Bridge Cost
Contingency (30%)
Engineering Fee (15%) Total Cost
1Simple Span Steel Bridge
Option240 2960 32,328.00$ 110,984.00$ 336,271,360.00$ 100,881,408.00$ 50,440,704.00$ 487,593,472.00$
2A2-Span Steel
Bridge Option
240 2960 27,845.00$ 57,001.00$ 175,405,760.00$ 52,621,728.00$ 26,310,864.00$ 254,338,352.00$
2B2-Span PPC
Bridge Option
240 2960 24,824.00$ 40,496.00$ 125,825,920.00$ 37,747,776.00$ 18,873,888.00$ 182,447,584.00$
3A2-Span Steel
Bridge Option
240 2960 47,840.00$ 110,843.00$ 339,576,880.00$ 101,873,064.00$ 50,936,532.00$ 492,386,476.00$
3B2-Span PPC
Bridge Option
240 2960 32,219.00$ 57,734.00$ 178,625,200.00$ 53,587,560.00$ 26,793,780.00$ 259,006,540.00$
Span Configuration
182-ft
91 ft - 91 ft
91 ft - 91 ft
121 ft - 141 ft
122 ft - 141 ft

Rondo Land Bridge18-1067.01B. Bovee Date: 4/23/2019J. Swierczek Date: 4/24/2019
General Assumptions: - The span configurations included herein allow for I-94 to be widened to:
- Five (5) 12 ft lanes in each direction - One (1) 8 ft wide median along I-94 - Two (2) 6 ft wide interior shoulders - Two (2) 12 ft wide exterior shoulders - 2 ft offset from the exterior shoulder to the Face of an MSE Wall - 4 ft offset from Face of MSE Wall to Face of Abutment - 3 ft from Face of Abutment to centerline bearing at Abutment
- The structure depths included represent a new road bridge and a configuration with park/green space above I-94. For the bridge options
- Vertical clearances and Profile Grade Raises were determined based on: - Existing elevation at Victoria St. and Concordia Ave. Interchange ~ 888.43 - Existing elevation at Victoria St. and St. Anthony Ave. Interchange ~ 886.68 - Existing elevation on I-94 at Victoria St. ~ 868.31 - Minimum Vertical Clearance = 16.5 ft
Span Length = 182 ft
Based on this span length, the most economically feasible structure type would be a slab on steel girder bridge
Preliminary structure depth as determined from Table 2.5.2.6.3-1 of the 2017 8th Edition of AASHTO
Depth of simple span steel girder = 0.040L = 7.28 ft
Profile grade raise required at Concordia Ave = 3.66 ftProfile grade raise required at St. Anthony Ave = 5.41 ft
Based on ADA requirements, the profile grade increase would effect a length of roadway adjacent to I-94based on the minimum 5% longitudinal slope allowed.
Min. length of Concordia Ave effected by grade raise = 73.2 ft in each directionMin. length of St. Anthony Ave effected by grade raise = 108.2 ft in each direction
Steel Girder Design Assumptions: - For the roadway option, the beams will be spaced at 8.75 ft - Concrete deck thickness = 10 in - A crashworthy barrier curb will be applied along the edges of the roadway. - A 50 PSF wearing surface will be applied. - Design per AASHTO HL-93 design truck
Quantity Unit Price Cost per girderStructural Steel (lbs/girder line) 70000 2.75 192,500.00$
Reinforcement Bars (Epoxy coated) (lbs) 14745 2 29,490.74$ Concrete Slab 3YHPC-S (CY/ girder line) 49 650 31,948.30$
Sum = 253,939.04$ Superstructure Cost per Foot of roadway bridge width = 29,022.00$
Project Title:Project Number:
Designer:Checker:
FEASIBILITY STUDY FOR VARIOUS BRIDGE OPTIONS
Roadway Bridge Portion:
Bridge Type 1: Single Span Structure

Rondo Land Bridge18-1067.01B. Bovee Date: 4/23/2019J. Swierczek Date: 4/24/2019
Project Title:Project Number:
Designer:Checker:
Steel Girder Design Assumptions: - For the park option, the beams will be spaced at 3 ft - Concrete deck thickness = 10 in - 4 feet of soil are placed over the deck for trees (480 psf) - Design with a 15.75 ton box truck (11.5 k front axle, 20 k rear axle at 15-ft spacing) - uniform live load = 250 psf
Quantity Unit Price Cost per girderStructural Steel (lbs/girder line) 107600 2.75 295,900.00$
Reinforcement Bars (Epoxy coated) (lbs) 5055.6 2 10,111.11$ Concrete Slab 3YHPC-S (CY/ girder line) 16.9 650 10,953.70$
Soil (CY/girder) 80.9 75 6,066.67$ Sum = 323,031.48$
Superstructure Cost per foot of park bridge width = 107,678.00$
Assumed Width = 6 ftAssumed Height = 4 ft from top of footing to bearing
Concrete Quantity = 2.7 SY per foot of bridge widthReinforcment Quantity = 400 lbs per foot of bridge width
Quantity Unit PriceCost per ft of
bridgeReinforcement Bars (Epoxy coated) (lbs) 400 2 266.67$
Concrete Slab 3B52 (SY/ft of bridge) 2.7 750 666.67$ Pier Cost per Foot of Bridge Width = 1,866.67$
Height of MSE Wall along Concordia Ave = 17.5 ftHeight of MSE Wall along St. Anthony Ave = 17.5 ft
Unit Width of Bridge = 1 ftArea per length of bridge = 3.9 SY per foot of bridge width
Quantity Unit PriceCost per ft of
bridgeMSE Wall = 3.9 370 1,439.00$
Park Bridge Portion:
MSE Wall along I-94
Abutment Cost

Rondo Land Bridge18-1067.01B. Bovee Date: 4/23/2019J. Swierczek Date: 4/24/2019
Project Title:Project Number:
Designer:Checker:
Span 1 Length = 91 ftSpan 2 Length = 91 ft
Preliminary structure depth as determined from Table 2.5.2.6.3-1 of the 2017 8th Edition of AASHTO
Depth of steel girder = 0.040L = 3.64 ft
Profile grade raise required at Concordia Ave = 0.02 ftProfile grade raise required at St. Anthony Ave = 1.77 ft
Based on ADA requirements, the profile grade increase would effect a length of roadway adjacent to I-94based on the minimum 5% longitudinal slope allowed.
Min. length of Concordia Ave effected by grade raise = 0.4 ft in each directionMin. length of St. Anthony Ave effected by grade raise = 35.4 ft in each direction
Steel Girder Design Assumptions: - For the roadway option, the beams will be spaced at 8.75 ft - Concrete deck thickness = 10 in - A crashworthy barrier curb will be applied along the edges of the roadway. - A 50 PSF wearing surface will be applied. - Design per AASHTO HL-93 design truck
Quantity Unit Price Cost per girderStructural Steel (lbs/girder line) 42000 2.75 115,500.00$
Reinforcement Bars (Epoxy coated) (lbs) 14745 2 29,490.74$ Concrete Slab 3YHPC-S (CY/ girder line) 49.2 650 31,948.30$
Sum = 176,939.04$ Superstructure Cost per foot of roadway bridge width = 20,222.00$
Steel Girder Design Assumptions: - For the park option, the beams will be spaced at 3 ft - Concrete deck thickness = 10 in - 4 feet of soil are placed over the deck for trees (480 psf) - Design with a 15.75 ton box truck (11.5 k front axle, 20 k rear axle at 15-ft spacing) - uniform live load = 250 psf
Quantity Unit Price Cost per girderStructural Steel (lbs/girder line) 44000.0 2.75 121,000.00$
Reinforcement Bars (Epoxy coated) (lbs) 5055.6 2 10,111.11$ Concrete Slab 3YHPC-S (CY/ girder line) 16.9 650 10,953.70$
Soil (CY/girder) 80.9 75 6,066.67$ Sum = 148,131.48$
Superstructure Cost per foot of park bridge width = 49,378.00$
Roadway Bridge Portion:
Park Bridge Portion:
Bridge Type 2A: Two Span Short Steel Bridge Option
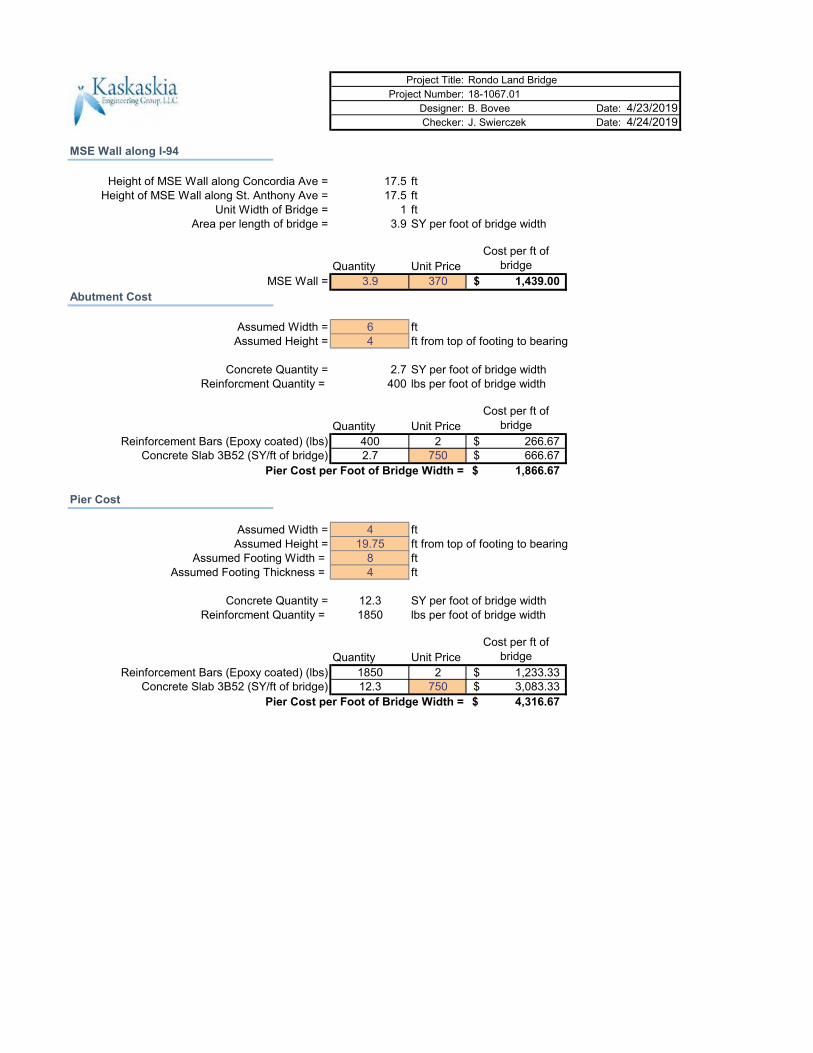
Rondo Land Bridge18-1067.01B. Bovee Date: 4/23/2019J. Swierczek Date: 4/24/2019
Project Title:Project Number:
Designer:Checker:
Height of MSE Wall along Concordia Ave = 17.5 ftHeight of MSE Wall along St. Anthony Ave = 17.5 ft
Unit Width of Bridge = 1 ftArea per length of bridge = 3.9 SY per foot of bridge width
Quantity Unit PriceCost per ft of
bridgeMSE Wall = 3.9 370 1,439.00$
Assumed Width = 6 ftAssumed Height = 4 ft from top of footing to bearing
Concrete Quantity = 2.7 SY per foot of bridge widthReinforcment Quantity = 400 lbs per foot of bridge width
Quantity Unit PriceCost per ft of
bridgeReinforcement Bars (Epoxy coated) (lbs) 400 2 266.67$
Concrete Slab 3B52 (SY/ft of bridge) 2.7 750 666.67$ Pier Cost per Foot of Bridge Width = 1,866.67$
Assumed Width = 4 ftAssumed Height = 19.75 ft from top of footing to bearing
Assumed Footing Width = 8 ftAssumed Footing Thickness = 4 ft
Concrete Quantity = 12.3 SY per foot of bridge widthReinforcment Quantity = 1850 lbs per foot of bridge width
Quantity Unit PriceCost per ft of
bridgeReinforcement Bars (Epoxy coated) (lbs) 1850 2 1,233.33$
Concrete Slab 3B52 (SY/ft of bridge) 12.3 750 3,083.33$ Pier Cost per Foot of Bridge Width = 4,316.67$
Abutment Cost
MSE Wall along I-94
Pier Cost

Rondo Land Bridge18-1067.01B. Bovee Date: 4/23/2019J. Swierczek Date: 4/24/2019
Project Title:Project Number:
Designer:Checker:
Span 1 Length = 91 ftSpan 2 Length = 91 ft
Based on this span length, the most economically feasible structure type would be a slab on steel girder bridge
Preliminary structure depth as determined from Table 2.5.2.6.3-1 of the 2017 8th Edition of AASHTO
Depth of precast girder + deck = 4.17 ft
Profile grade raise required at Concordia Ave = 0.55 ftProfile grade raise required at St. Anthony Ave = 2.30 ft
Based on ADA requirements, the profile grade increase would effect a length of roadway adjacent to I-94based on the minimum 5% longitudinal slope allowed.
Min. length of Concordia Ave effected by grade raise = 10.93 ft in each directionMin. length of St. Anthony Ave effected by grade raise = 45.93 ft in each direction
Steel Girder Design Assumptions: - For the roadway option, the beams will be spaced at 7 - Concrete deck thickness = 10 in - A crashworthy barrier curb will be applied along the edges of the roadway. - A 50 PSF wearing surface will be applied. - Design per AASHTO HL-93 design truck
Quantity Unit Price Cost per girderPrestressed Concrete Beam MN54 182 350 63,700.00$
Reinforcement Bars (Epoxy coated) (lbs) 11796.3 2 23,592.59$ Concrete Slab 3YHPC-S (CY/ girder line) 39.3 650 25,558.64$
Sum = 112,851.23$ Superstructure Cost per foot of roadway bridge width = 16,122.00$
Steel Girder Design Assumptions: - For the park option, the beams will be spaced at 3 - Concrete deck thickness = 10 in - 4 feet of soil are placed over the deck for trees (480 psf) - Design with a 15.75 ton box truck (11.5 k front axle, 20 k rear axle at 15-ft spacing) - uniform live load = 250 psf
Quantity Unit Price Cost per girderPrestressed Concrete Beam MN54 182 375 68,250.00$
Reinforcement Bars (Epoxy coated) (lbs) 5055.6 2 10,111.11$ Concrete Slab 3YHPC-S (CY/ girder line) 16.85 650 10,953.70$
Soil (CY/girder) 80.89 75 6,066.67$ Sum = 95,381.48$
Superstructure Cost per foot of park bridge width = 31,794.00$
Roadway Bridge Portion:
Park Bridge Portion:
Bridge Type 2A: Two Span Short PPC Bridge Option

Rondo Land Bridge18-1067.01B. Bovee Date: 4/23/2019J. Swierczek Date: 4/24/2019
Project Title:Project Number:
Designer:Checker:
Height of MSE Wall along Concordia Ave = 17.5 ftHeight of MSE Wall along St. Anthony Ave = 17.5 ft
Unit Width of Bridge = 1 ftArea per length of bridge = 3.9 SY per foot of bridge width
Quantity Unit PriceCost per ft of
bridgeMSE Wall = 3.9 370 1,439.00$
Assumed Width = 6 ftAssumed Height = 4 ft from top of footing to bearing
Concrete Quantity = 2.7 SY per foot of bridge widthReinforcment Quantity = 400 lbs per foot of bridge width
Quantity Unit PriceCost per ft of
bridgeReinforcement Bars (Epoxy coated) (lbs) 400 2 266.67$
Concrete Slab 3B52 (SY/ft of bridge) 2.7 750 666.67$ Pier Cost per Foot of Bridge Width = 1,866.67$
Assumed Width = 5 ftAssumed Height = 19.75 ft from top of footing to bearing
Assumed Footing Width = 10 ftAssumed Footing Thickness = 4 ft
Concrete Quantity = 15.4 SY per foot of bridge widthReinforcment Quantity = 2312.5 lbs per foot of bridge width
Quantity Unit PriceCost per ft of
bridgeReinforcement Bars (Epoxy coated) (lbs) 2312.5 2 1,541.67$
Concrete Slab 3B52 (SY/ft of bridge) 15.4 750 3,854.17$ Pier Cost per Foot of Bridge Width = 5,395.83$
MSE Wall along I-94
Pier Cost
Abutment Cost

Rondo Land Bridge18-1067.01B. Bovee Date: 4/23/2019J. Swierczek Date: 4/24/2019
Project Title:Project Number:
Designer:Checker:
Span 1 Length = 121 ftSpan 2 Length = 141 ft
Preliminary structure depth as determined from Table 2.5.2.6.3-1 of the 2017 8th Edition of AASHTO
Depth of steel girder = 0.040L = 5.64 ft
Profile grade raise required at Concordia Ave = 2.02 ftProfile grade raise required at St. Anthony Ave = 3.77 ft
Based on ADA requirements, the profile grade increase would effect a length of roadway adjacent to I-94based on the minimum 5% longitudinal slope allowed.
Min. length of Concordia Ave effected by grade raise = 40.4 ft in each directionMin. length of St. Anthony Ave effected by grade raise = 75.4 ft in each direction
Steel Girder Design Assumptions: - For the roadway option, the beams will be spaced at 8.75 - Concrete deck thickness = 10 in - A crashworthy barrier curb will be applied along the edges of the roadway. - A 50 PSF wearing surface will be applied. - Design per AASHTO HL-93 design truck
Quantity Unit Price Cost per girderStructural Steel (lbs/girder line) 95800 2.75 263,450.00$
Reinforcement Bars (Epoxy coated) (lbs) 21227 2 42,453.70$ Concrete Slab 3YHPC-S (CY/ girder line) 70.8 650 45,991.51$
Sum = 351,895.22$ Superstructure Cost per foot of roadway bridge width = 40,217.00$
Steel Girder Design Assumptions: - For the park option, the beams will be spaced at 3 - Concrete deck thickness = 10 in - 4 feet of soil are placed over the deck for trees (480 psf) - Design with a 15.75 ton box truck (11.5 k front axle, 20 k rear axle at 15-ft spacing) - uniform live load = 250 psf
Quantity Unit Price Cost per girderStructural Steel (lbs/girder line) 98400.0 2.75 270,600.00$
Reinforcement Bars (Epoxy coated) (lbs) 7277.8 2 14,555.56$ Concrete Slab 3YHPC-S (CY/ girder line) 24.3 650 15,768.52$
Soil (CY/girder) 116.4 75 8,733.33$ Sum = 309,657.41$
Superstructure Cost per foot of park bridge width = 103,220.00$
Bridge Type 3A: Two Span Long Steel Bridge Option
Roadway Bridge Portion:
Park Bridge Portion:

Rondo Land Bridge18-1067.01B. Bovee Date: 4/23/2019J. Swierczek Date: 4/24/2019
Project Title:Project Number:
Designer:Checker:
Height of MSE Wall along Concordia Ave = 17.5 ftHeight of MSE Wall along St. Anthony Ave = 17.5 ft
Unit Width of Bridge = 1 ftArea per length of bridge = 3.9 SY per foot of bridge width
Quantity Unit PriceCost per ft of
bridgeMSE Wall = 3.9 370 1,439.00$
Assumed Width = 6 ftAssumed Height = 4 ft from top of footing to bearing
Concrete Quantity = 2.7 SY per foot of bridge widthReinforcment Quantity = 400 lbs per foot of bridge width
Quantity Unit PriceCost per ft of
bridgeReinforcement Bars (Epoxy coated) (lbs) 400 2 266.67$
Concrete Slab 3B52 (SY/ft of bridge) 2.7 750 666.67$ Pier Cost per Foot of Bridge Width = 1,866.67$
Assumed Width = 4 ftAssumed Height = 19.75 ft from top of footing to bearing
Assumed Footing Width = 8 ftAssumed Footing Thickness = 4 ft
Concrete Quantity = 12.3 SY per foot of bridge widthReinforcment Quantity = 1850 lbs per foot of bridge width
Quantity Unit PriceCost per ft of
bridgeReinforcement Bars (Epoxy coated) (lbs) 1850 2 1,233.33$
Concrete Slab 3B52 (SY/ft of bridge) 12.3 750 3,083.33$ Pier Cost per Foot of Bridge Width = 4,316.67$
MSE Wall along I-94
Pier Cost
Abutment Cost

Rondo Land Bridge18-1067.01B. Bovee Date: 4/23/2019J. Swierczek Date: 4/24/2019
Project Title:Project Number:
Designer:Checker:
Span 1 Length = 121 ftSpan 2 Length = 141 ft
Based on this span length, the most economically feasible structure type would be a slab on steel girder bridge
Preliminary structure depth as determined from Table 2.5.2.6.3-1 of the 2017 8th Edition of AASHTO
Depth of precast girder + deck = 6.42 ft
Profile grade raise required at Concordia Ave = 2.80 ftProfile grade raise required at St. Anthony Ave = 4.55 ft
Based on ADA requirements, the profile grade increase would effect a length of roadway adjacent to I-94based on the minimum 5% longitudinal slope allowed.
Min. length of Concordia Ave effected by grade raise = 55.93 ft in each directionMin. length of St. Anthony Ave effected by grade raise = 90.93 ft in each direction
Steel Girder Design Assumptions: - For the roadway option, the beams will be spaced at 8.5 - Concrete deck thickness = 10 in - A crashworthy barrier curb will be applied along the edges of the roadway. - A 50 PSF wearing surface will be applied. - Design per AASHTO HL-93 design truck
Quantity Unit Price Cost per girderPrestressed Concrete Beam MN63 262 400 104,800.00$
Reinforcement Bars (Epoxy coated) (lbs) 20620.4 2 41,240.74$ Concrete Slab 3YHPC-S (CY/ girder line) 68.7 650 44,677.47$
Sum = 190,718.21$ Superstructure Cost per foot of roadway bridge width = 22,438.00$
Steel Girder Design Assumptions: - For the park option, the beams will be spaced at 3 - Concrete deck thickness = 10 in - 4 feet of soil are placed over the deck for trees (480 psf) - Design with a 15.75 ton box truck (11.5 k front axle, 20 k rear axle at 15-ft spacing) - uniform live load = 250 psf
Quantity Unit Price Cost per girderPrestressed Concrete Beam MN63 262 400 104,800.00$
Reinforcement Bars (Epoxy coated) (lbs) 7277.8 2 14,555.56$ Concrete Slab 3YHPC-S (CY/ girder line) 24.26 650 15,768.52$
Soil (CY/girder) 116.44 75 8,733.33$ Sum = 143,857.41$
Superstructure Cost per foot of park bridge width = 47,953.00$
Bridge Type 3B: Two Span Long PPC Bridge Option
Roadway Bridge Portion:
Park Bridge Portion:

Rondo Land Bridge18-1067.01B. Bovee Date: 4/23/2019J. Swierczek Date: 4/24/2019
Project Title:Project Number:
Designer:Checker:
Height of MSE Wall along Concordia Ave = 17.5 ftHeight of MSE Wall along St. Anthony Ave = 17.5 ft
Unit Width of Bridge = 1 ftArea per length of bridge = 3.9 SY per foot of bridge width
Quantity Unit PriceCost per ft of
bridgeMSE Wall = 3.9 370 1,439.00$
Assumed Width = 6 ftAssumed Height = 4 ft from top of footing to bearing
Concrete Quantity = 2.7 SY per foot of bridge widthReinforcment Quantity = 400 lbs per foot of bridge width
Quantity Unit PriceCost per ft of
bridgeReinforcement Bars (Epoxy coated) (lbs) 400 2 266.67$
Concrete Slab 3B52 (SY/ft of bridge) 2.7 750 666.67$ Pier Cost per Foot of Bridge Width = 1,866.67$
Assumed Width = 6 ftAssumed Height = 19.75 ft from top of footing to bearing
Assumed Footing Width = 12 ftAssumed Footing Thickness = 4 ft
Concrete Quantity = 18.5 SY per foot of bridge widthReinforcment Quantity = 2775 lbs per foot of bridge width
Quantity Unit PriceCost per ft of
bridgeReinforcement Bars (Epoxy coated) (lbs) 2775 2 1,850.00$
Concrete Slab 3B52 (SY/ft of bridge) 18.5 750 4,625.00$ Pier Cost per Foot of Bridge Width = 6,475.00$
MSE Wall along I-94
Pier Cost
Abutment Cost