Embed Size (px)
Citation preview

Ro
yal
Co
lleg
e o
f P
aed
iatr
ics
and
Ch
ild
Hea
lth
An Introduction to the new UK-WHO Growth Charts
© 2009 Royal College of Paediatrics and Child Health www.growthcharts.rcpch.ac.uk © 2009 Royal College of Paediatrics and Child Health www.growthcharts.rcpch.ac.uk
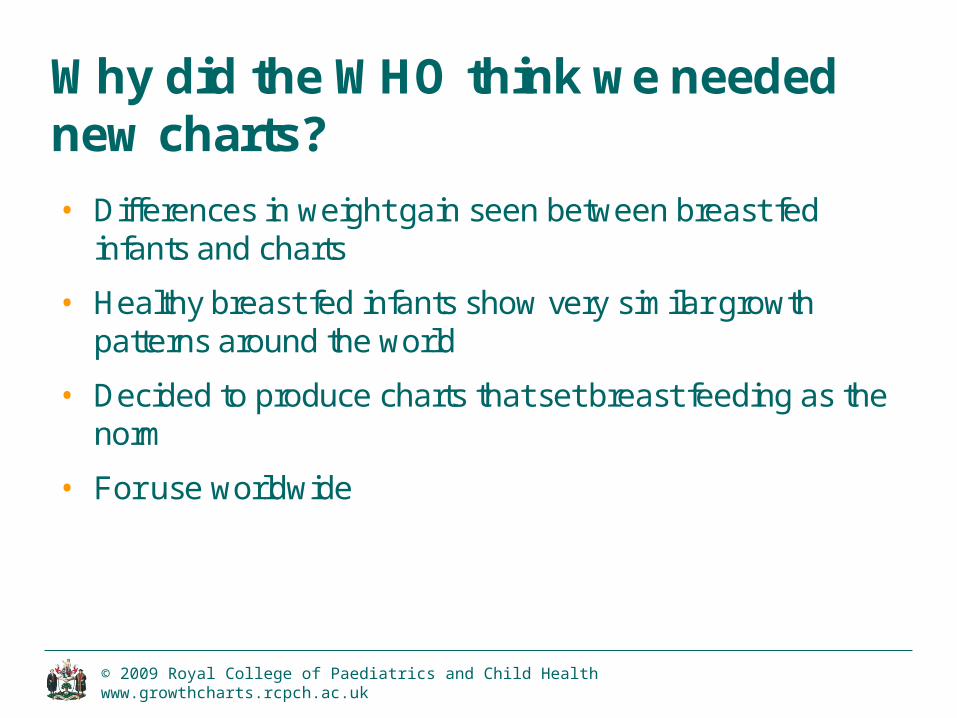
Why did the WHO think we needed new charts?
• Differences in weight gain seen between breast fed infants and charts
• Healthy breast fed infants show very similar growth patterns around the world
• Decided to produce charts that set breast feeding as the norm
• For use worldwide
© 2009 Royal College of Paediatrics and Child Health www.growthcharts.rcpch.ac.uk © 2009 Royal College of Paediatrics and Child Health www.growthcharts.rcpch.ac.uk
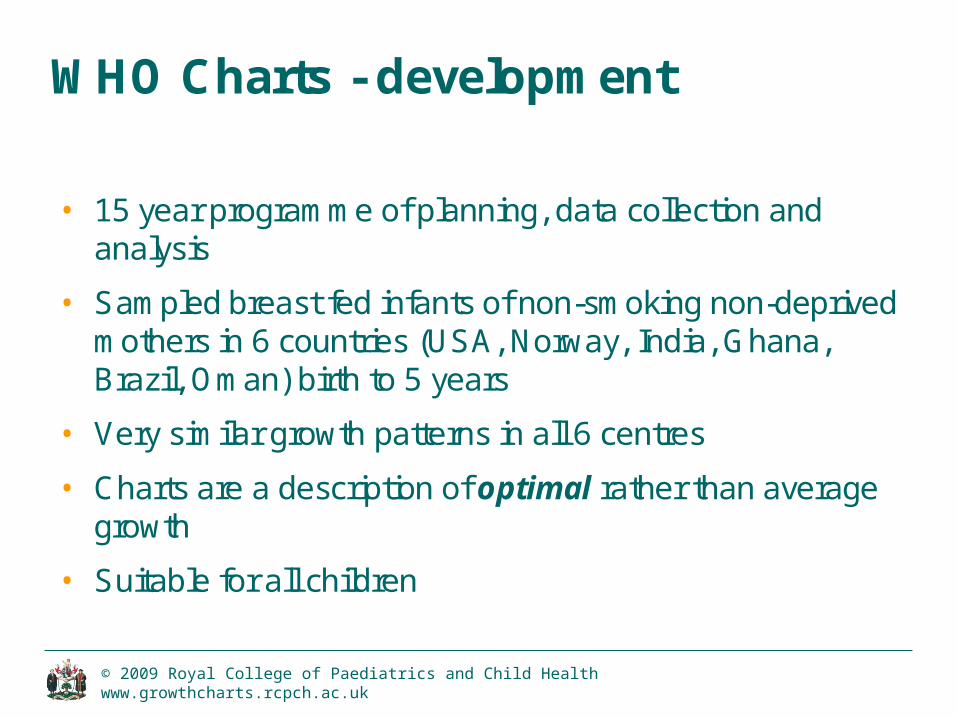
WHO Charts - development
• 15 year programme of planning, data collection and analysis
• Sampled breast fed infants of non-smoking non-deprived mothers in 6 countries (USA, Norway, India, Ghana, Brazil, Oman) birth to 5 years
• Very similar growth patterns in all 6 centres
• Charts are a description of optimal rather than average growth
• Suitable for all children
© 2009 Royal College of Paediatrics and Child Health www.growthcharts.rcpch.ac.uk © 2009 Royal College of Paediatrics and Child Health www.growthcharts.rcpch.ac.uk
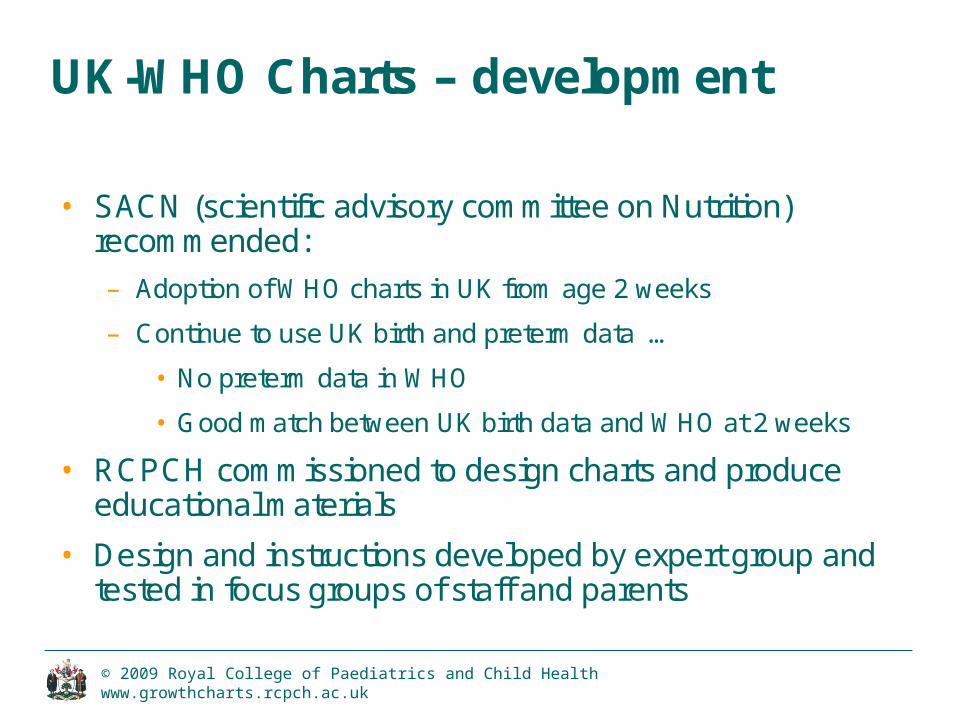
UK-WHO Charts – development
• SACN (scientific advisory committee on Nutrition) recommended:
– Adoption of WHO charts in UK from age 2 weeks
– Continue to use UK birth and preterm data …
• No preterm data in WHO
• Good match between UK birth data and WHO at 2 weeks
• RCPCH commissioned to design charts and produce educational materials
• Design and instructions developed by expert group and tested in focus groups of staff and parents
© 2009 Royal College of Paediatrics and Child Health www.growthcharts.rcpch.ac.uk © 2009 Royal College of Paediatrics and Child Health www.growthcharts.rcpch.ac.uk
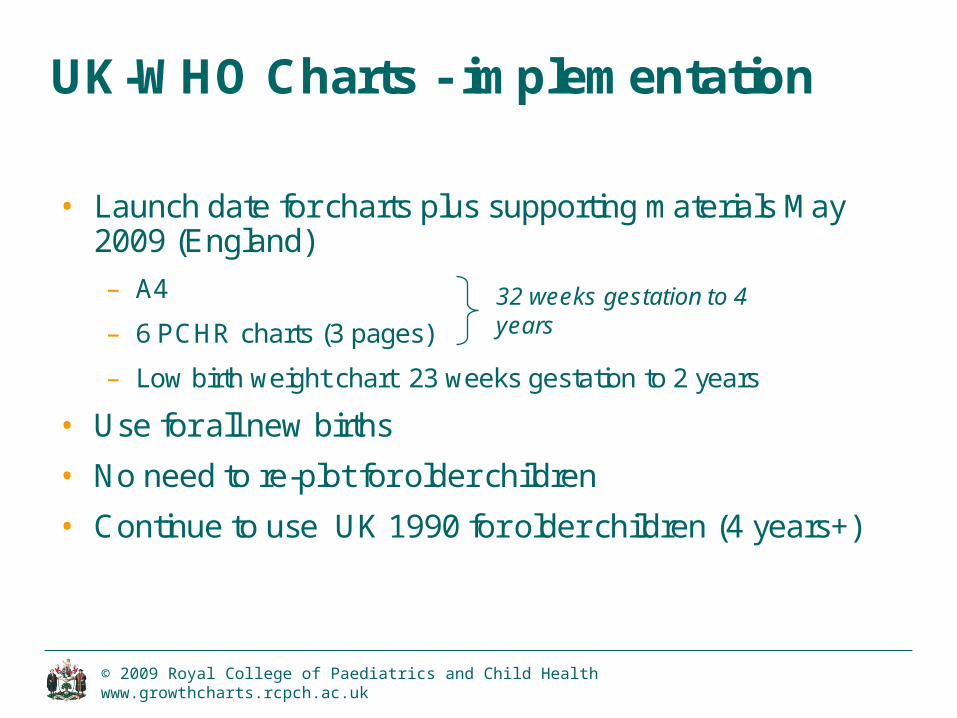
UK-WHO Charts - implementation
• Launch date for charts plus supporting materials May 2009 (England)
– A4
– 6 PCHR charts (3 pages)
– Low birth weight chart 23 weeks gestation to 2 years
• Use for all new births
• No need to re-plot for older children
• Continue to use UK 1990 for older children (4 years+)
32 weeks gestation to 4 years
© 2009 Royal College of Paediatrics and Child Health www.growthcharts.rcpch.ac.uk © 2009 Royal College of Paediatrics and Child Health www.growthcharts.rcpch.ac.uk
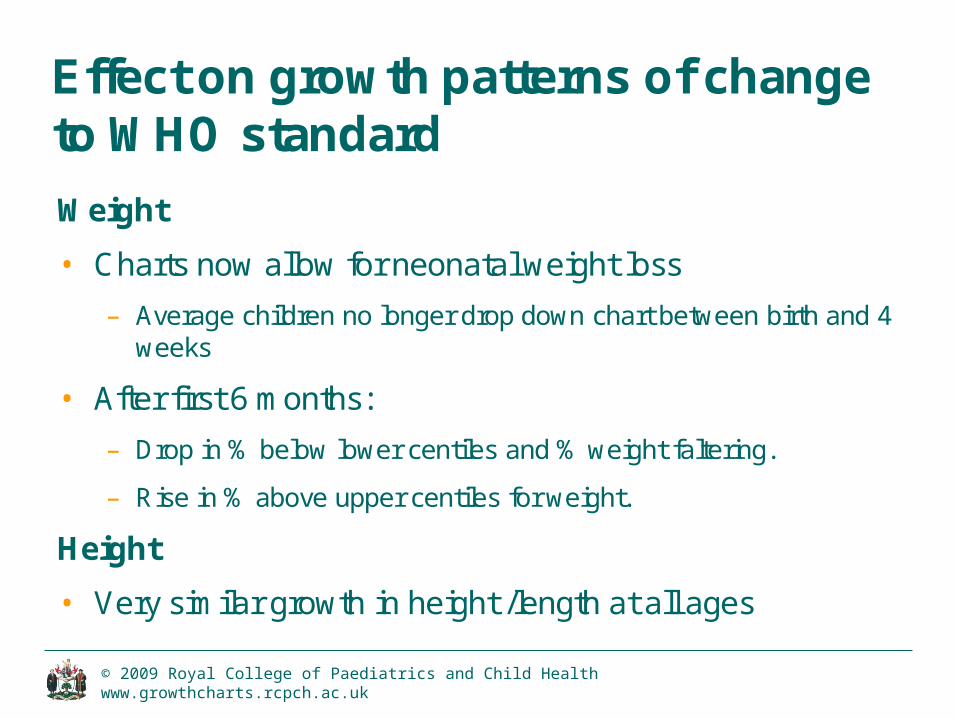
Effect on growth patterns of change to WHO standard
Weight
• Charts now allow for neonatal weight loss
– Average children no longer drop down chart between birth and 4 weeks
• After first 6 months:
– Drop in % below lower centiles and % weight faltering.
– Rise in % above upper centiles for weight.
Height
• Very similar growth in height /length at all ages
© 2009 Royal College of Paediatrics and Child Health www.growthcharts.rcpch.ac.uk © 2009 Royal College of Paediatrics and Child Health www.growthcharts.rcpch.ac.uk
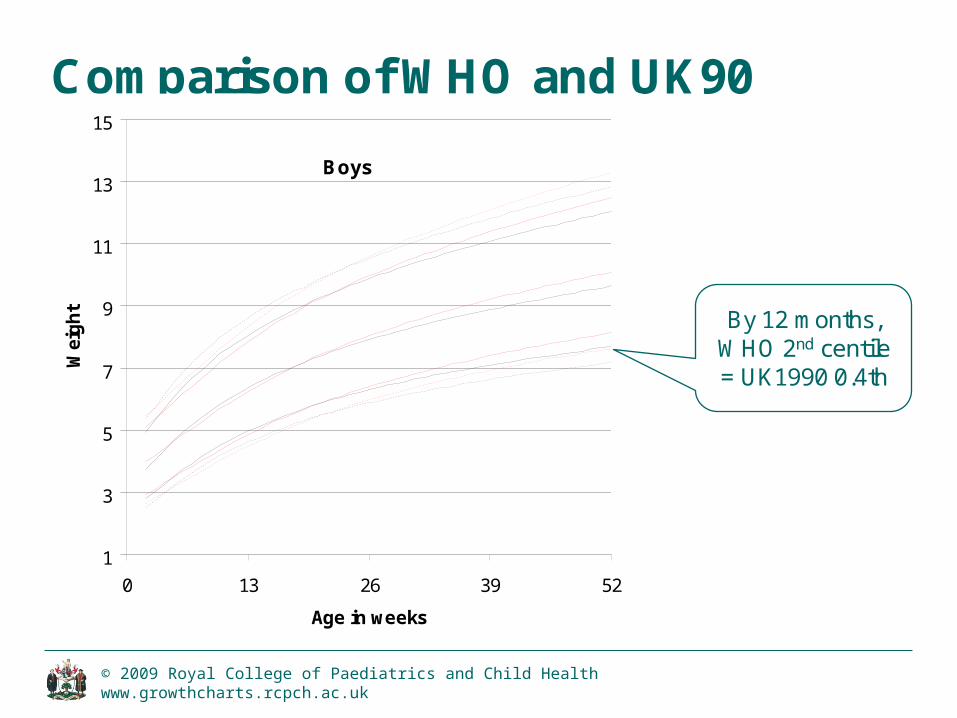
Comparison of WHO and UK90
Boys
1
3
5
7
9
11
13
15
0 13 26 39 52
Age in weeks
Wei
gh
t
WHO blackUK 1990 red
By 12 months, WHO 2nd centile = UK1990 0.4th
© 2009 Royal College of Paediatrics and Child Health www.growthcharts.rcpch.ac.uk © 2009 Royal College of Paediatrics and Child Health www.growthcharts.rcpch.ac.uk
How will the new charts be different?
• Separate preterm section
• Head circumference extended to 2 years
• Length /height discontinuity
• Evidence based instructions
• No 4-18 section (yet)
© 2009 Royal College of Paediatrics and Child Health www.growthcharts.rcpch.ac.uk © 2009 Royal College of Paediatrics and Child Health www.growthcharts.rcpch.ac.uk
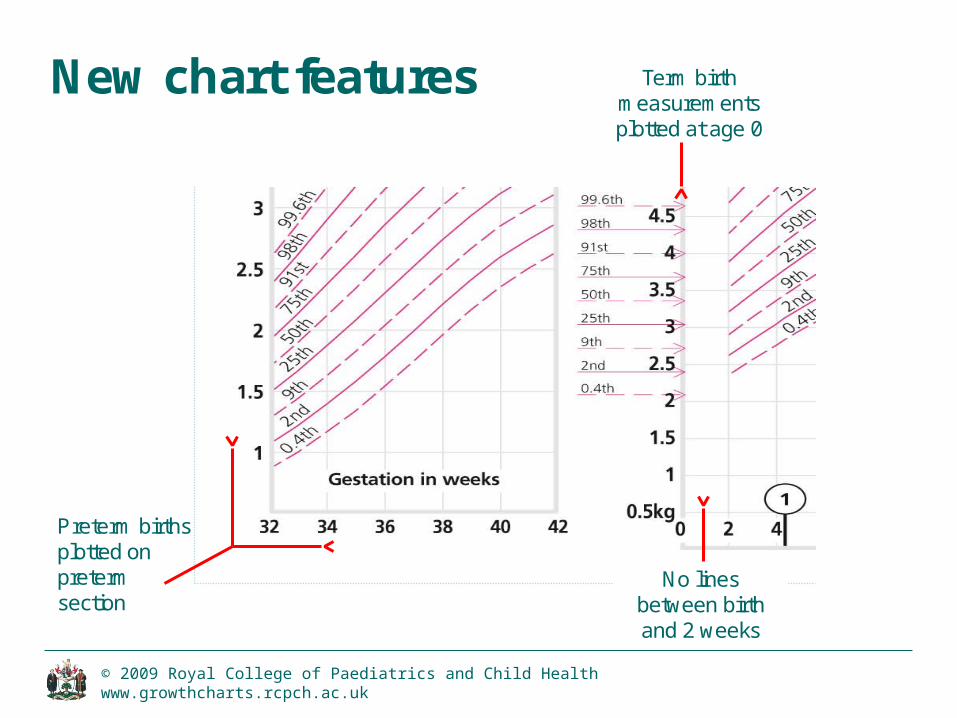
New chart features
No lines between birth and 2 weeks
Term birth measurements plotted at age 0
Preterm births plotted on preterm section
© 2009 Royal College of Paediatrics and Child Health www.growthcharts.rcpch.ac.uk © 2009 Royal College of Paediatrics and Child Health www.growthcharts.rcpch.ac.uk
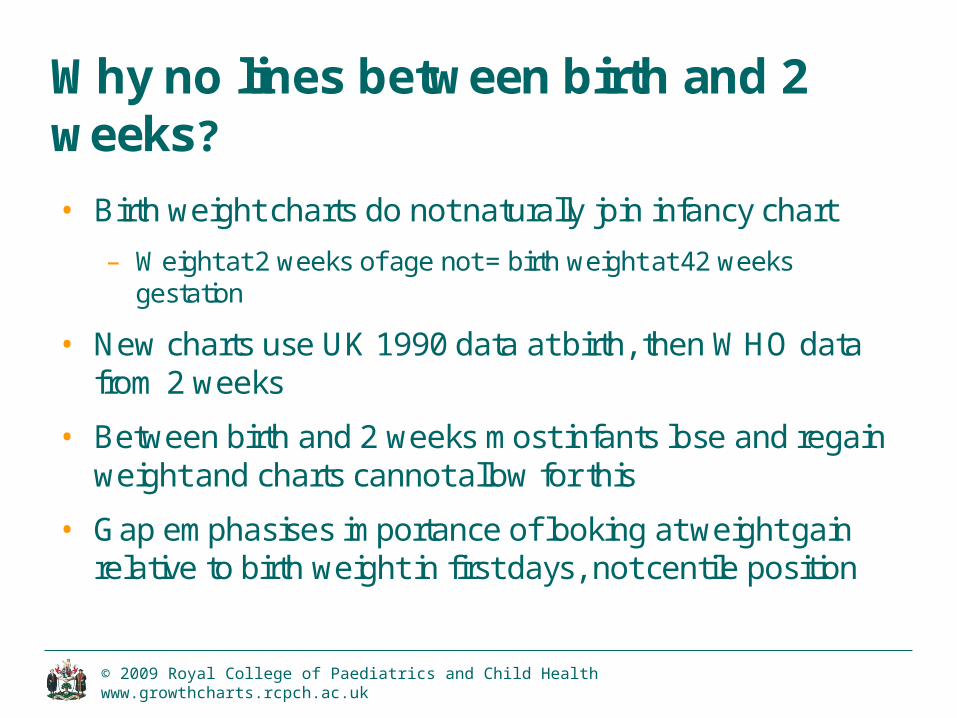
Why no lines between birth and 2 weeks?
• Birth weight charts do not naturally join infancy chart
– Weight at 2 weeks of age not = birth weight at 42 weeks gestation
• New charts use UK 1990 data at birth, then WHO data from 2 weeks
• Between birth and 2 weeks most infants lose and regain weight and charts cannot allow for this
• Gap emphasises importance of looking at weight gain relative to birth weight in first days, not centile position
© 2009 Royal College of Paediatrics and Child Health www.growthcharts.rcpch.ac.uk © 2009 Royal College of Paediatrics and Child Health www.growthcharts.rcpch.ac.uk
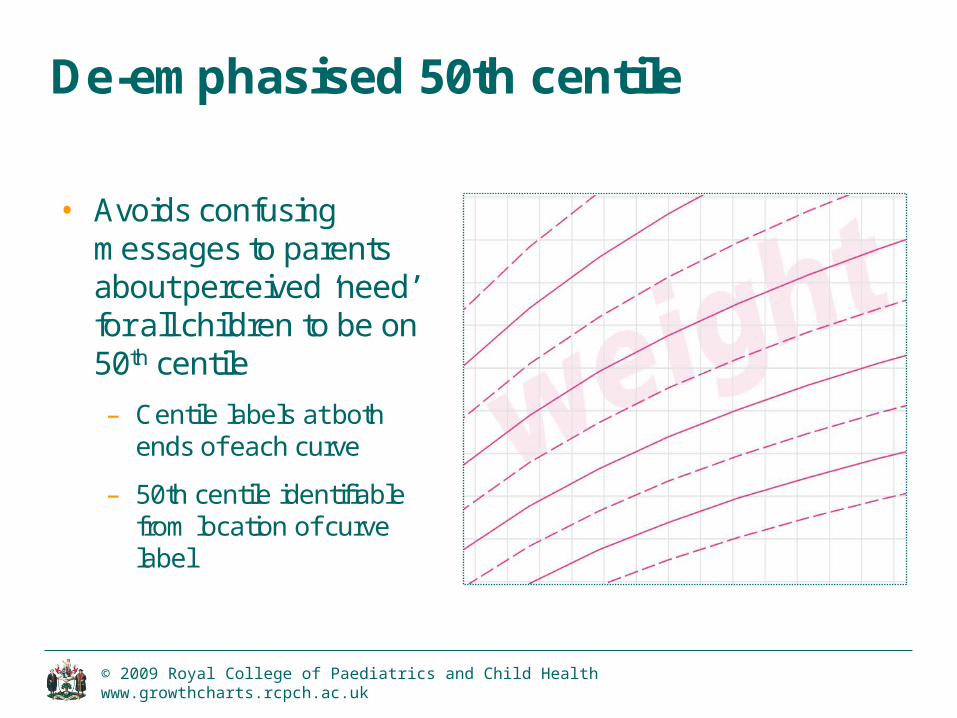
De-emphasised 50th centile
• Avoids confusing messages to parents about perceived ‘need’ for all children to be on 50th centile
– Centile labels at both ends of each curve
– 50th centile identifiable from location of curve label
© 2009 Royal College of Paediatrics and Child Health www.growthcharts.rcpch.ac.uk © 2009 Royal College of Paediatrics and Child Health www.growthcharts.rcpch.ac.uk
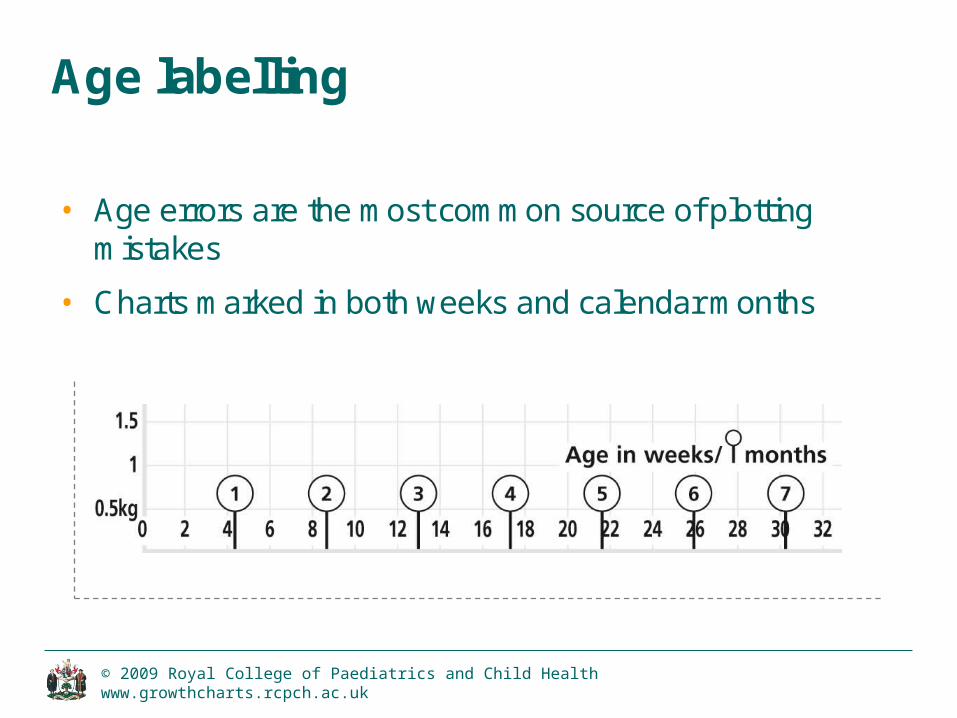
Age labelling
• Age errors are the most common source of plotting mistakes
• Charts marked in both weeks and calendar months
© 2009 Royal College of Paediatrics and Child Health www.growthcharts.rcpch.ac.uk © 2009 Royal College of Paediatrics and Child Health www.growthcharts.rcpch.ac.uk
Length - height discontinuity
• Centile lines shift down slightly at age 2
• New charts show length up to age 2 years and height from age 2 onwards
• Due to spinal compression, when a child is measured standing they are slightly shorter than when lying down
• Important not to let length to height transition cause worries for parents
• What matters is whether the child continues to follow their new centile position after the transition

© 2009 Royal College of Paediatrics and Child Health www.growthcharts.rcpch.ac.uk © 2009 Royal College of Paediatrics and Child Health www.growthcharts.rcpch.ac.uk
Personal child health record charts
• Fewer pages in total
• Fold-out measurement recording page: allows plotting while in view
• Information aimed at parents developed via focus groups

© 2009 Royal College of Paediatrics and Child Health www.growthcharts.rcpch.ac.uk © 2009 Royal College of Paediatrics and Child Health www.growthcharts.rcpch.ac.uk
A4 Instructions and interpretation aids (and HV instruction leaflet)• Draws on available research evidence
• Clear guidance on measuring and plotting
• Role of length and height measures
• Measurement frequency
• Defines range of normality and need for further assessment, but not what action to be taken
© 2009 Royal College of Paediatrics and Child Health www.growthcharts.rcpch.ac.uk
UK-WHO Charts Summary
• Launched in England from May 2009 for all new births • To be used in Scotland for all babies born on or after 1 January
2010 • New UK-WHO Charts are a description of optimal rather than
average growth so weight gain patterns will appear different• New charts show premature birth weight and infancy growth
separately; all infants from 37 weeks gestation should be plotted at term (age 0)
• De-emphasised 50th centile, but identifiable from location of curve label
• A4 charts include detailed instructions; PCHR has information aimed at Parents
© 2009 Royal College of Paediatrics and Child Health www.growthcharts.rcpch.ac.uk
Measuring and plotting
Summary: Measurement
• Weighing:– Use only class III electronic scales– Weigh babies naked, children over two in vest and pants,
without shoes
• Head circumference– Use narrow, paper or plastic tape round widest part of the
head
• Length (up to age 2) – Proper equipment essential (length board or mat)– Measurers should be trained– Shoes and nappy removed
• Height (after age 2)– Rigid rule with T piece, or stadiometer– Shoes removed

© 2009 Royal College of Paediatrics and Child Health www.growthcharts.rcpch.ac.uk
Measuring and plotting
Summary: Plotting and Centiles
• Record measurement and date in ink• Plot in pencil• Age errors are commonest source of plotting mistakes• Centiles describes the percentage expected to be
below that line • A child is
– on a centile if within ¼ space of line, – between the two centiles if not
• A centile space is the distance between two centile lines
© 2009 Royal College of Paediatrics and Child Health www.growthcharts.rcpch.ac.uk © 2009 Royal College of Paediatrics and Child Health wwwgrowthcharts.rcpch.ac.uk
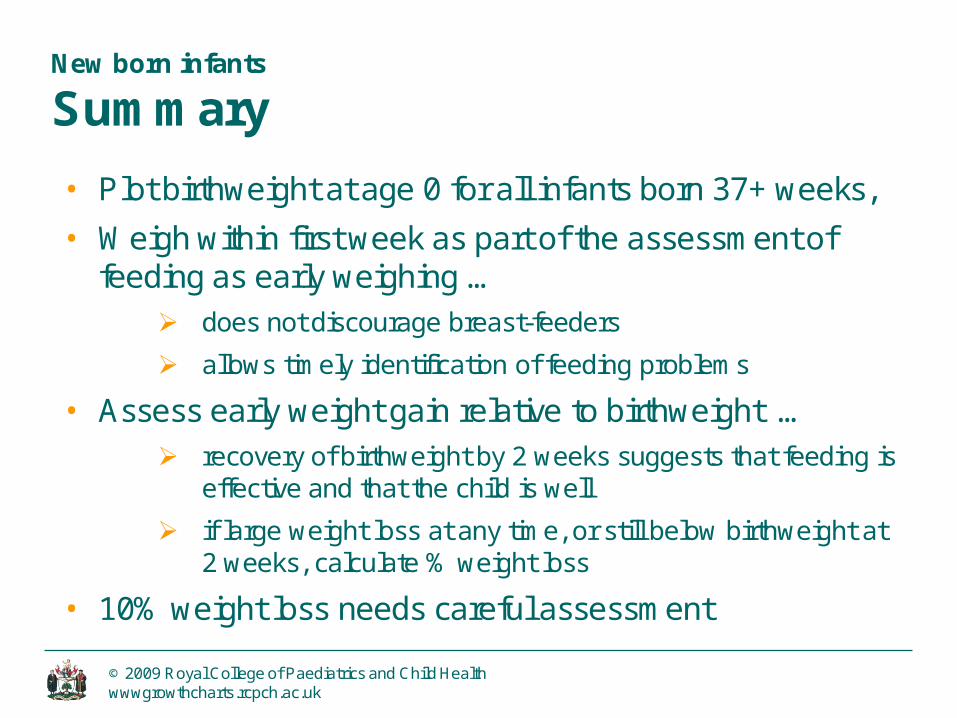
New born infants
Summary
• Plot birthweight at age 0 for all infants born 37+ weeks,
• Weigh within first week as part of the assessment of feeding as early weighing …
does not discourage breast-feeders
allows timely identification of feeding problems
• Assess early weight gain relative to birthweight … recovery of birthweight by 2 weeks suggests that feeding is
effective and that the child is well
if large weight loss at any time, or still below birthweight at 2 weeks, calculate % weight loss
• 10% weight loss needs careful assessment
© 2009 Royal College of Paediatrics and Child Health www.growthcharts.rcpch.ac.uk © 2009 Royal College of Paediatrics and Child Health wwwgrowthcharts.rcpch.ac.uk
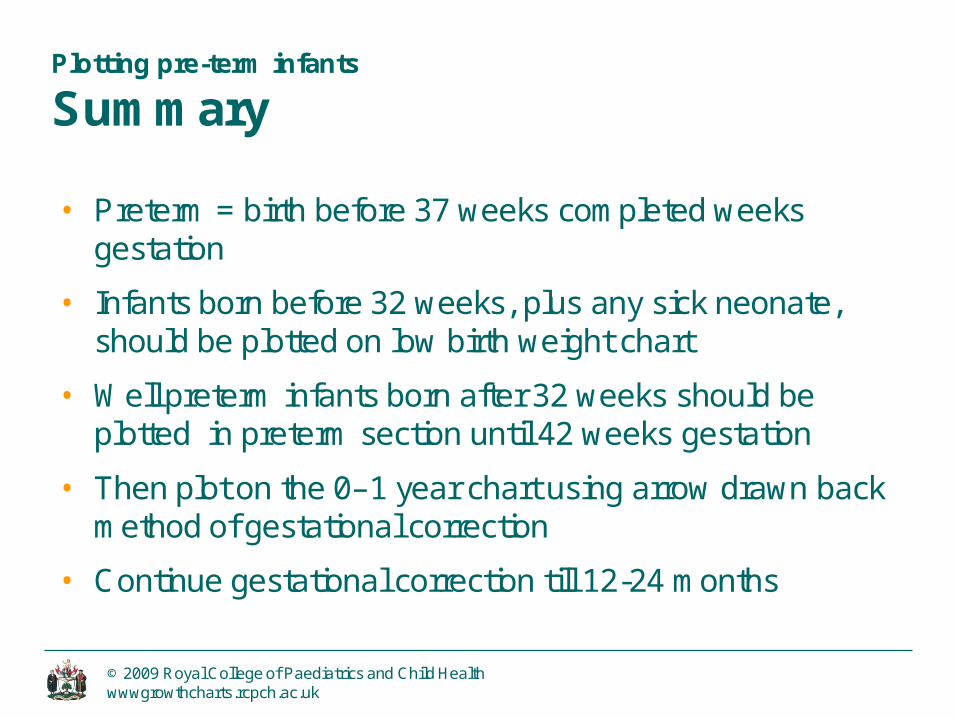
Plotting pre-term infants
Summary
• Preterm = birth before 37 weeks completed weeks gestation
• Infants born before 32 weeks, plus any sick neonate, should be plotted on low birth weight chart
• Well preterm infants born after 32 weeks should be plotted in preterm section until 42 weeks gestation
• Then plot on the 0–1 year chart using arrow drawn back method of gestational correction
• Continue gestational correction till 12-24 months
© 2009 Royal College of Paediatrics and Child Health www.growthcharts.rcpch.ac.uk © 2009 Royal College of Paediatrics and Child Health wwwgrowthcharts.rcpch.ac.uk
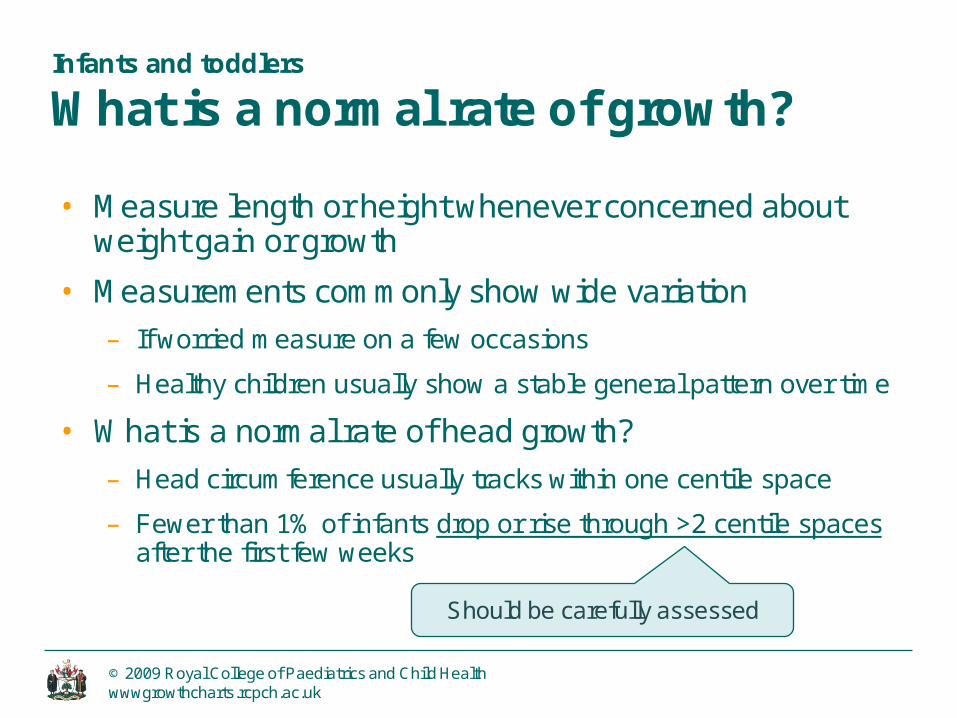
Infants and toddlers
What is a normal rate of growth?
• Measure length or height whenever concerned about weight gain or growth
• Measurements commonly show wide variation
– If worried measure on a few occasions
– Healthy children usually show a stable general pattern over time
• What is a normal rate of head growth?
– Head circumference usually tracks within one centile space
– Fewer than 1% of infants drop or rise through >2 centile spaces after the first few weeks
Should be carefully assessed
© 2009 Royal College of Paediatrics and Child Health www.growthcharts.rcpch.ac.uk © 2009 Royal College of Paediatrics and Child Health wwwgrowthcharts.rcpch.ac.uk
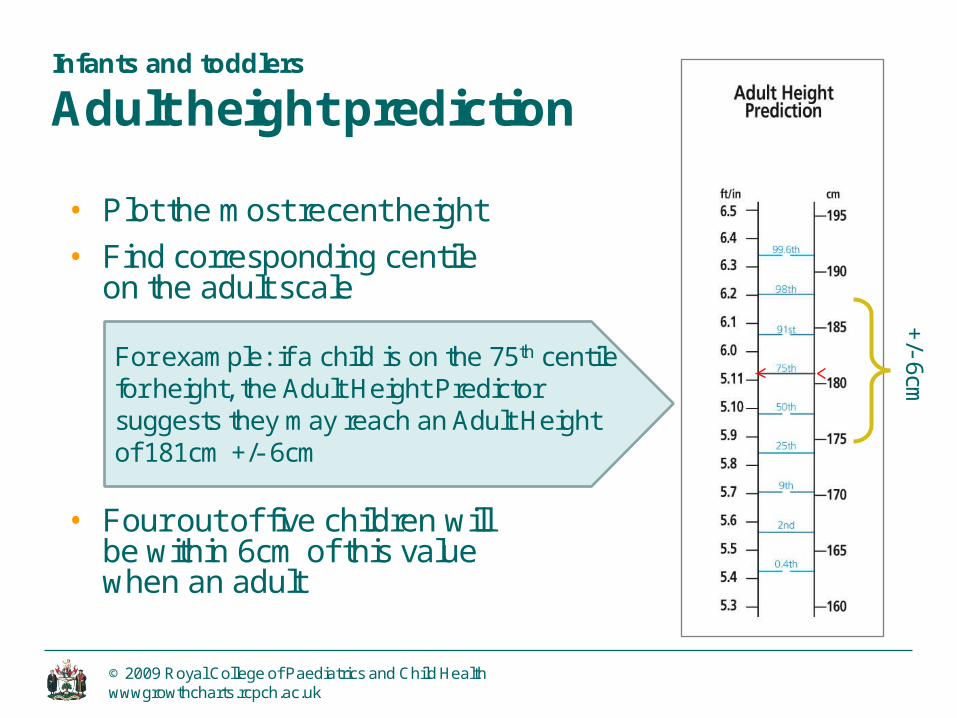
Infants and toddlers
Adult height prediction
• Plot the most recent height
• Find corresponding centile on the adult scale
• Four out of five children will be within 6cm of this value when an adult
For example: if a child is on the 75th centile for height, the Adult Height Predictor suggests they may reach an Adult Height of 181cm +/- 6cm
+/-
6cm
© 2009 Royal College of Paediatrics and Child Health www.growthcharts.rcpch.ac.uk © 2009 Royal College of Paediatrics and Child Health wwwgrowthcharts.rcpch.ac.uk
Infants and toddlers
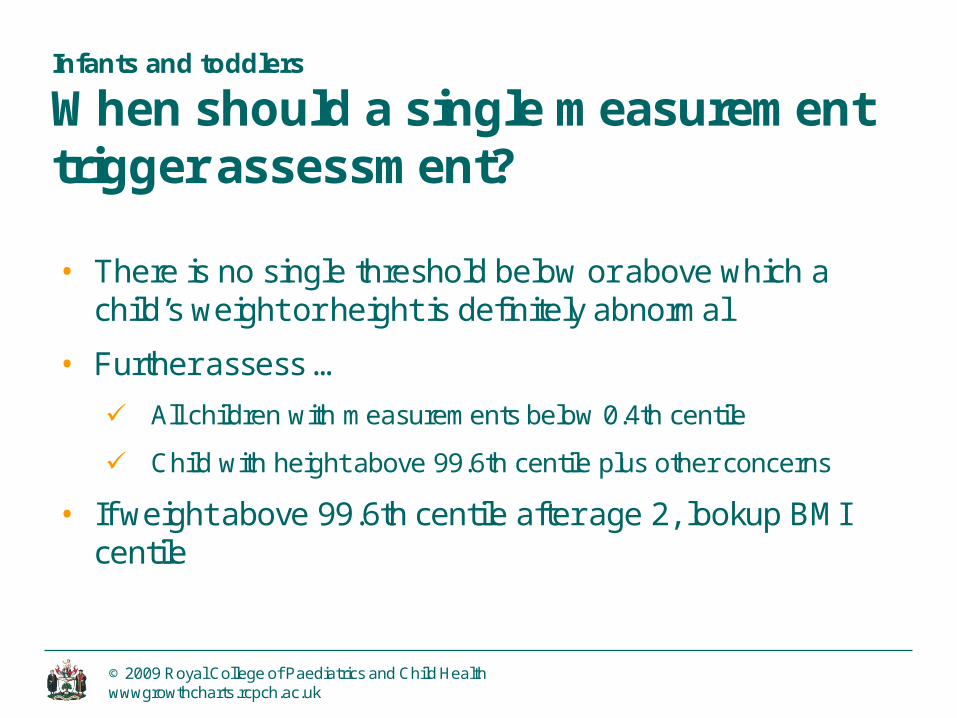
When should a single measurement trigger assessment?
• There is no single threshold below or above which a child’s weight or height is definitely abnormal
• Further assess …
All children with measurements below 0.4th centile
Child with height above 99.6th centile plus other concerns
• If weight above 99.6th centile after age 2, lookup BMI centile
© 2009 Royal College of Paediatrics and Child Health www.growthcharts.rcpch.ac.uk © 2009 Royal College of Paediatrics and Child Health wwwgrowthcharts.rcpch.ac.uk
Infants and toddlers
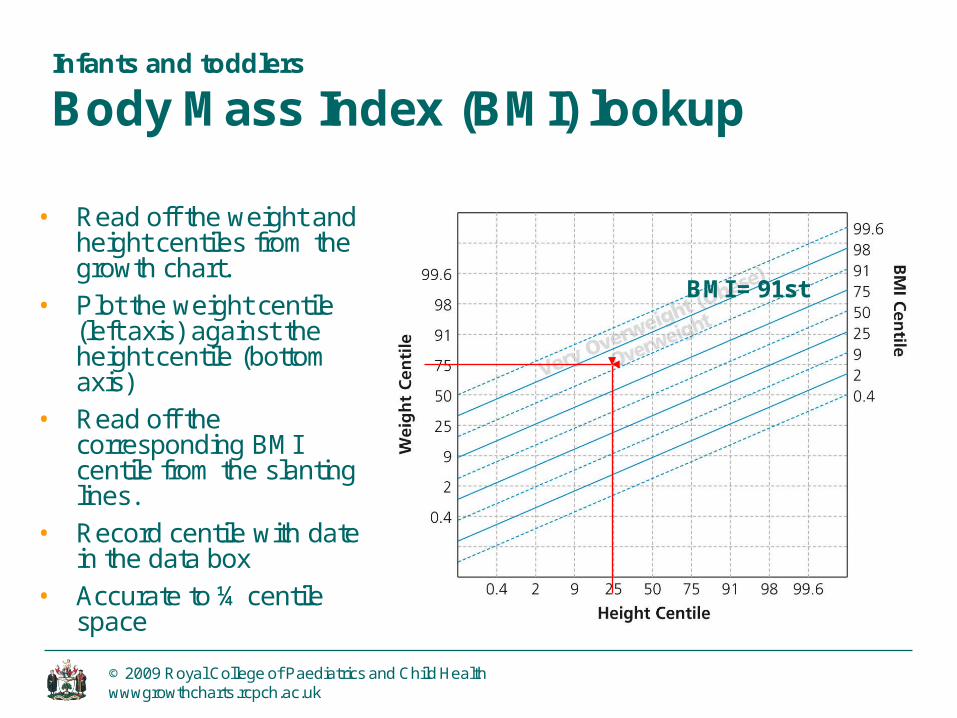
Body Mass Index (BMI) lookup
BMI = 91st
• Read off the weight and height centiles from the growth chart.
• Plot the weight centile (left axis) against the height centile (bottom axis)
• Read off the corresponding BMI centile from the slanting lines.
• Record centile with date in the data box
• Accurate to ¼ centile space
© 2009 Royal College of Paediatrics and Child Health www.growthcharts.rcpch.ac.uk © 2009 Royal College of Paediatrics and Child Health www.growthcharts.rcpch.ac.uk
Reference list
• De Onis M, Garza C, Victora CG, Onyango AW, Frongillo EA, Martines J. 2004. The WHO Multicentre Growth Reference Study: planning, study design, and methodology. Food Nutr Bull 25(1):S15-S26.
• Department of Health. Application of the WHO Growth Standards in the UK. Department of health . 2007. Department of Health. http://www.sacn.gov.uk/
• WHO multicentre growth reference study group. 2006. Assessment of differences in linear growth among populations in the WHO Multicentre Growth Reference Study. Acta Paediatr Suppl 450:56-65.
• Wright C, Lakshman R, Emmett P, Ong KK. 2008. Implications of adopting the WHO 2006 Child Growth Standard in the UK: two prospective cohort studies. Arch Dis Child 93(7):566-9.
• Wright CM, Parkinson KN. 2004. Postnatal weight loss in term infants: what is normal and do growth charts allow for it? Arch Dis Child Fetal Neonatal Ed 89 (3): F254-F257.


![1 An Introduction to the new UK-WHO Growth Charts Access to training materials of the Royal College of Paediatrics and Child Health [RCCPCH] is gratefully](https://img.pdfslide.net/doc/110x75/56649c765503460f9492a6eb/1-an-introduction-to-the-new-uk-who-growth-charts-access-to-training-materials.jpg)