Embed Size (px)
Citation preview

RTD COFFEE IN INDIA
Euromonitor International
May 2015
R T D C O F F E E I N I N D I A P a s s p o r t I
© E u r o m o n i t o r I n t e r n a t i o n a l
LIST OF CONTENTS AND TABLES
Rtd Coffee in India - Category analysis ........................................................................................ 1 Headlines ..................................................................................................................................... 1 Trends .......................................................................................................................................... 1
Soft Drinks in India - Industry Overview ....................................................................................... 2 Executive Summary ..................................................................................................................... 2
Soft Drinks Register Healthy Growth ........................................................................................ 2 Modern Retail Outlets Continue To Become One-stop-shops for Soft Drinks .......................... 2 Competition Becomes More Aggressive Due To New Entrants ................................................ 2 Off-trade Sales of Soft Drinks Continue To Attract Consumer Attention ................................... 2 Soft Drinks Likely To Record Further Growth ........................................................................... 2
Key Trends and Developments .................................................................................................... 3
Soft Drinks Start To Occupy More Shelf Space ........................................................................ 3 Manufacturers Focusing on Making Packs More Attractive and Convenient for On-the-go
Consumption ............................................................................................................................. 3 Soft Drinks Likely To Record Further Growth in Sales .............................................................. 3
Territory Key Trends and Developments ...................................................................................... 4
East and Northeast India .......................................................................................................... 4 North India ................................................................................................................................ 5 South India ............................................................................................................................... 6 West India ................................................................................................................................. 6
Rural Vs Urban Key Trends and Developments ........................................................................... 7
Trends ...................................................................................................................................... 7 Competitive Landscape ............................................................................................................ 8 Prospects .................................................................................................................................. 8
Market Data .................................................................................................................................. 8
Table 1 Off-trade vs On-trade Sales of Soft Drinks (as sold) by Channel:
Volume 2009-2014 ....................................................................................... 8 Table 2 Off-trade vs On-trade Sales of Soft Drinks (as sold) by Channel: %
Volume Growth 2009-2014 .......................................................................... 9 Table 3 Off-trade vs On-trade Sales of Soft Drinks (as sold) by Category:
Volume 2014 ................................................................................................ 9 Table 4 Off-trade vs On-trade Sales of Soft Drinks (as sold) by Category: %
Volume 2014 ................................................................................................ 9 Table 5 Off-trade vs On-trade Sales of Soft Drinks by Category: Value 2014 ......... 10 Table 6 Off-trade vs On-trade Sales of Soft Drinks by Category: % Value 2014..... 10 Table 7 Off-trade Sales of Soft Drinks (as sold) by Category: Volume 2009-
2014 ........................................................................................................... 10 Table 8 Off-trade Sales of Soft Drinks (as sold) by Category: % Volume
Growth 2009-2014 ..................................................................................... 11 Table 9 Off-trade Sales of Soft Drinks by Category: Value 2009-2014 ................... 11 Table 10 Off-trade Sales of Soft Drinks by Category: % Value Growth 2009-
2014 ........................................................................................................... 11 Table 11 Total Sales of Soft Drinks by Fountain On-trade: Volume 2009-2014 ........ 11 Table 12 Total Sales of Soft Drinks by Fountain On-trade: % Volume Growth
2009-2014 .................................................................................................. 12 Table 13 Off-trade Sales of Soft Drinks (as sold) by Region: Volume 2009-2014 ..... 12

R T D C O F F E E I N I N D I A P a s s p o r t I I
© E u r o m o n i t o r I n t e r n a t i o n a l
Table 14 Off-trade Sales of Soft Drinks (as sold) by Region: % Volume Growth
2009-2014 .................................................................................................. 12 Table 15 Off-trade Sales of Soft Drinks (as sold) by Region: Value 2009-2014 ........ 12 Table 16 Off-trade Sales of Soft Drinks (as sold) by Region: % Value Growth
2009-2014 .................................................................................................. 13 Table 17 Off-trade Sales of Soft Drinks (as sold) by Rural vs Urban: % Volume
2014 ........................................................................................................... 13 Table 18 On-trade Sales of Soft Drinks (as sold) by Region: Volume 2009-2014 ..... 13 Table 19 On-trade Sales of Soft Drinks (as sold) by Region: % Volume Growth
2009-2014 .................................................................................................. 13 Table 20 NBO Company Shares of Total Soft Drinks (RTD): % Volume 2010-
2014 ........................................................................................................... 14 Table 21 LBN Brand Shares of Total Soft Drinks (RTD): % Volume 2011-2014 ....... 14 Table 22 NBO Company Shares of On-trade Soft Drinks (RTD): % Volume
2010-2014 .................................................................................................. 15 Table 23 LBN Brand Shares of On-trade Soft Drinks (RTD): % Volume 2011-
2014 ........................................................................................................... 16 Table 24 NBO Company Shares of Off-trade Soft Drinks (as sold): % Volume
2010-2014 .................................................................................................. 16 Table 25 LBN Brand Shares of Off-trade Soft Drinks (as sold): % Volume 2011-
2014 ........................................................................................................... 17 Table 26 NBO Company Shares of Off-trade Soft Drinks (RTD): % Volume
2010-2014 .................................................................................................. 18 Table 27 LBN Brand Shares of Off-trade Soft Drinks (RTD): % Volume 2011-
2014 ........................................................................................................... 18 Table 28 NBO Company Shares of Off-trade Soft Drinks: % Value 2010-2014 ........ 19 Table 29 LBN Brand Shares of Off-trade Soft Drinks: % Value 2011-2014 .............. 20 Table 30 Distribution of Off-trade Soft Drinks (as sold) by Format and Category:
% Volume 2014 .......................................................................................... 21 Table 31 Forecast Off-trade vs On-trade Sales of Soft Drinks (as sold) by
Channel: Volume 2014-2019 ..................................................................... 22 Table 32 Forecast Off-trade vs On-trade Sales of Soft Drinks (as sold) by
Channel: % Volume Growth 2014-2019 ..................................................... 22 Table 33 Forecast Off-trade vs On-trade Sales of Soft Drinks by Channel:
Value 2014-2019 ........................................................................................ 22 Table 34 Forecast Off-trade vs On-trade Sales of Soft Drinks by Channel: %
Value Growth 2014-2019 ........................................................................... 23 Table 35 Forecast Off-trade Sales of Soft Drinks (as sold) by Category: Volume
2014-2019 .................................................................................................. 23 Table 36 Forecast Off-trade Sales of Soft Drinks (as sold) by Category: %
Volume Growth 2014-2019 ........................................................................ 23 Table 37 Forecast Off-trade Sales of Soft Drinks by Category: Value 2014-
2019 ........................................................................................................... 23 Table 38 Forecast Off-trade Sales of Soft Drinks by Category: % Value Growth
2014-2019 .................................................................................................. 24 Table 39 Forecast Total Sales of Soft Drinks by Fountain On-trade: Volume
2014-2019 .................................................................................................. 24 Table 40 Forecast Total Sales of Soft Drinks by Fountain On-trade: % Volume
Growth 2014-2019 ..................................................................................... 24
R T D C O F F E E I N I N D I A P a s s p o r t I I I
© E u r o m o n i t o r I n t e r n a t i o n a l
Table 41 Forecast Off-trade Sales of Soft Drinks (as sold) by Region: Volume
2014-2019 .................................................................................................. 25 Table 42 Forecast Off-trade Sales of Soft Drinks (as sold) by Region: %
Volume Growth 2014-2019 ........................................................................ 25 Table 43 Forecast Off-trade Sales of Soft Drinks (as sold) by Region: Value
2014-2019 .................................................................................................. 25 Table 44 Forecast Off-trade Sales of Soft Drinks (as sold) by Region: % Value
Growth 2014-2019 ..................................................................................... 25 Table 45 Forecast On-trade Sales of Soft Drinks (as sold) by Region: Volume
2014-2019 .................................................................................................. 26 Table 46 Forecast On-trade Sales of Soft Drinks (as sold) by Region: %
Volume Growth 2014-2019 ........................................................................ 26
Appendix .................................................................................................................................... 26
Fountain Sales in India ........................................................................................................... 26 Sources ...................................................................................................................................... 27
Summary 1 Research Sources ...................................................................................... 27

R T D C O F F E E I N I N D I A P a s s p o r t 1
© E u r o m o n i t o r I n t e r n a t i o n a l
RTD COFFEE IN INDIA - CATEGORY ANALYSIS
HEADLINES
RTD coffee continued to have negligible sales in India during 2014, with only a handful of
brands present in the off-trade channel.
TRENDS
Only a limited number of on-trade outlets such as chained coffee shops, fast food outlets and
full-service restaurants offered branded RTD coffee in 2014.
Nestlé introduced RTD coffee under the Nescafé Ice Café brand in 2013, although the brand
was able to attract only very few consumers. The company made the product available only in
a limited number of retail stores and in a few cities including Bangalore. However, the product
was priced at INR35 for 180ml, which made it expensive compared with other soft drinks and,
for this reason, it did not appeal consumers.
Urban consumers continue to visit chained coffee shops such as Café Coffee Day, Barista
and Costa Coffee to satisfy their demand for iced cold coffee.
RTD coffee is not expected to become popular in India during the forecast period as
powdered concentrate formats of iced/cold coffee are likely to be preferred due to their more
affordable prices.
It is possible that RTD coffee will eventually become well-known among young consumers,
who might come to appreciate RTD coffee as an everyday beverage.

R T D C O F F E E I N I N D I A P a s s p o r t 2
© E u r o m o n i t o r I n t e r n a t i o n a l
SOFT DRINKS IN INDIA - INDUSTRY OVERVIEW
EXECUTIVE SUMMARY
Soft Drinks Register Healthy Growth
Changing lifestyle and spending habits coupled with increased disposable incomes supported
growth in soft drinks in 2014. Consumers also started to move towards health and wellness
products that are perceived as healthier. Categories including juice and bottled water received a
further boost, while sports drinks and RTD tea continued to struggle due to their low consumer
bases.
Modern Retail Outlets Continue To Become One-stop-shops for Soft Drinks
While traditional retailers remained the leading retail distribution channel for soft drinks in
2014, modern grocery retailers became the most popular one-stop-shopping destinations for
bulk purchases of soft drinks. Modern retailer channels including hypermarkets and
supermarkets became increasingly popular for the sale of larger pack sizes, which are usually
purchased during monthly grocery shopping expeditions. Attractive discounts and the wider
assortment of products on offer with greater accessibility are likely to remain the driving factors
drawing India’s urban consumers towards modern retail channels for purchasing soft drinks.
Competition Becomes More Aggressive Due To New Entrants
With several new brand launches and the expansion of comparatively new players such as
Hector Beverages and Silver Ice Beverages, the competition in soft drinks became even more
intense during 2014. However, the launch of new products helped to maintain consumer interest
and presented stronger competition to the existing players.
Off-trade Sales of Soft Drinks Continue To Attract Consumer Attention
India’s leading manufacturers continued to introduce new flavours and products to attract
consumers during 2014. For instance, Parle Bisleri introduced Urzza, which is positioned as an
energy drink but does not contain caffeine, which helped it to attract consumer attention. These
new launches helped manufacturers to expand their soft drinks portfolios and also benefited
overall sales of soft drinks due to sustained consumer attention throughout the year. Most of the
companies present in the industry promoted their new product launches through television
commercials and in-store promotions.
Soft Drinks Likely To Record Further Growth
Soft drinks is likely to record further growth in off-trade volume terms over the forecast period.
The majority of volume and value growth is likely to come from bottled water and juice, which
are being embraced by consumers in urban and rural areas alike. Increased marketing efforts
and communications from soft drink manufacturers are expected to continue playing an
important role in terms of pushing sales figures in most soft drinks categories. Moreover,
growing demand for products promoted by reference to health and wellness benefits is likely to
push soft drinks manufacturers to develop their portfolios further during the forecast period.
R T D C O F F E E I N I N D I A P a s s p o r t 3
© E u r o m o n i t o r I n t e r n a t i o n a l
KEY TRENDS AND DEVELOPMENTS
Soft Drinks Start To Occupy More Shelf Space
With urban consumers becoming more willing to spend money on experimenting with new
beverages, retailers started to give more shelf space to soft drinks over the review period. In
addition, demand for soft drinks also continued to increase, mainly due to the growing interest of
consumers. The increased expenditure on soft drinks was clearly evident in Euromonitor
International’s countries and consumers data, which confirmed that the total consumer
expenditure on mineral water, soft drinks and juice increased by 18% in 2014. In order to take
full advantage of this trend, manufacturers expanded their portfolios, mainly by adding new
flavours and also by introducing products on the health and wellness platform. For instance,
Parle Bisleri Ltd introduced Urzza in energy drinks in 2014, a beverage with added vitamins and
minerals which is advertised as a liquid charger.
Outlook
The trend of dedicating more shelf space in retail stores to soft drinks is likely to continue
building over the forecast period as well. Such a trend is likely to be more prominent in modern
retail outlets such as Star Bazaar and Big Bazaar, where consumers are able to see and feel
recently launched products. In addition, manufacturers are likely to introduce new flavours for
their existing products and sell them in different pack sizes in order to cater to various consumer
needs whilst maintaining affordability. The trend of rising consumer interest in soft drinks is also
likely to be prominent in consumer foodservice outlets, including cafés/bars over the forecast
period.
Manufacturers Focusing on Making Packs More Attractive and Convenient for On-the-go Consumption
Soft drinks manufacturers have started to focus on single-serve packs and making packaging
more convenient for consumers. For instance, Parle Argo recently introduced its popular brands
Frooti and Appy in gable top cartons packaging so that consumers can choose to open and
close the pack multiple times and drink it slowly. In addition, new entrants such as Britvic’s
Robinsons Fruit Shoot were sold in coloured bottles, with each colour representing a specific
flavour. The availability of soft drinks in smaller and convenient packs is likely to promote trial
purchases of new products such as Bisleri’s Urzza, which were not previously available.
Outlook
With rising on-the-go consumption of soft drinks, the trend of single-serve packs and attractive
packaging is likely to continue building during the forecast period. By focusing on packaging and
making it more attractive, manufacturers are also likely to attempt to reach out to specific sets of
consumers, including children. In addition, single-serve packs which are usually priced lower will
continue to promote trial purchases of recently launched products.
Soft Drinks Likely To Record Further Growth in Sales
Soft drinks is expected to experience strong growth in both volume and value terms over the
forecast period, with good performances anticipated through both off-trade and on-trade
channels. With the consumer base increasing and with disposable income levels on the rise,
almost all soft drinks categories in the country registered positive growth in 2014 and this is
expected to continue developing over the forecast period. Because of growing demand, major
R T D C O F F E E I N I N D I A P a s s p o r t 4
© E u r o m o n i t o r I n t e r n a t i o n a l
competition between brands will continue to be seen in juices, concentrates and bottled water,
with companies focusing more on differentiating their products from others. As health and
wellness becomes a growing concern among Indian consumers, the best opportunities in soft
drinks will be for innovative products that are able to combine new types of flavours with at least
the perception that they are healthier.
Outlook
Positive consumer responses together with the aggressive marketing campaigns of key
companies are set to help boost sales of soft drinks in India during the forecast period. A more
liberal approach to purchasing soft drinks and higher numbers of visits to on-trade outlets are
expected to be strengthen demand for soft drinks. There is growth potential in numerous
categories including juice, energy drinks, RTD tea and bottled water. The combination of the
wide assortment of various brands on offer in retail outlets and strong promotional activities are
expected to tempt consumers to sample certain products. A number of factors are expected to
support dynamic growth in soft drinks during the forecast period. Rising disposable income
levels and the rising aspirations of Indian consumers are expected to result in higher
expenditure on soft drinks during the forecast period. Growth is also likely to be boosted by
ongoing growth in the retail sector and increased exposure to western culture during the
forecast period.
TERRITORY KEY TRENDS AND DEVELOPMENTS
East and Northeast India
Trends
Soft drinks off-trade value sales grew by 21% to reach INR34.7 billion in 2014. East and
Northeast India recorded the lowest level of per capita consumption within soft drinks in India
in 2014. The region is often given less priority by leading soft drinks players due to the difficult
terrain, which makes transportation difficult. In addition, the consumers in the region have
lower average disposable incomes compared to the rest of India and therefore prefer
affordable brands.
The off-trade volume growth of 18% recorded in 2014 was comparable to the on-trade volume
growth recorded in soft drinks in West India. Of all products, bottled water was the fastest
growing category in 2014. Many parts of the region are not well equipped to provide hygienic
drinking water for the population, thus elevating the need for bottled water.
Competitive Landscape
Leading manufacturers including Coca-Cola India Pvt Ltd continued to enjoy popularity in
East and Northeastern states of India. However, manufactures do not generally organise
promotional campaigns in many Northeastern starts, including Arunachal Pradesh and
Manipur, due to the negligible contribution that the states make to overall sales. Marketing
campaigns remained limited to recognised urban centres such as Kolkata, Patna and
Guwahati.
Bottled water and carbonates also remained among the largest soft drinks categories in 2014.
As such, Pepsi (PepsiCo), Thums Up (Coca-Cola) and Bisleri (Parle Bisleri) remained the
most visible carbonates brands in terms of off-trade volume sales in 2013. In juice, Maaza
(Coca-Cola), Slice (PepsiCo) and Frooti (Parle Agro) all vied for the leading positions.
R T D C O F F E E I N I N D I A P a s s p o r t 5
© E u r o m o n i t o r I n t e r n a t i o n a l
Prospects
Soft drinks off-trade value sales are expected to grow at a CAGR of 12% in constant 2014
prices over the forecast period to reach INR60.5 billion by 2019. This growth is likely to be
due mainly by bottled water, carbonated and juice.
Given the limited availability of potable drinking water in many parts of the region, bottled
water is expected to continue making inroads into the more remote reaches of the region.
Consumers are also expected to shift gradually away from carbonates towards juice over the
forecast period.
Owing to the difficult terrain and remoteness of many parts of East and Northeast India, the
area is not expected to generate high revenues for national soft drinks manufacturers. This
gives a distinct advantage to the numerous regional players, some of which would like to
expand and reinforce their positions.
North India
Trends
North India is the second largest regional market for soft drinks in India, accounting for 33% of
total volume sales in 2014, trailing West India. North India, especially Delhi and the NCR
region, experience extremely hot summers, which supports strong sales of soft drinks.
However, informal sales are strong, with a broad presence of juice shops which sell
fruit/vegetable juice, freshly squeezed in front of the consumer.
Soft drinks are available across all channels including modern supermarkets and
hypermarkets and traditional grocery shops. Various promotional schemes such as ‘buy one
get one free’ and discounts on the retail selling price act as lucrative attractions for consumers
in modern retail outlets, which are developing rapidly in large towns and cities. By way of
contrast, in small towns and cities, traditional grocery shops are the major points of sale for
soft drinks. Small kiosks are also a major source of sales of soft drinks such as carbonates,
bottled water and Asian speciality drinks.
Competitive Landscape
Soft drinks In North India remained dominated by international companies in 2014, while the
presence of regional players remained limited. Carbonates remained dominated by two
national players, Coca-Cola and PepsiCo, while juice was dominated by Dabur India Ltd and
PepsiCo in 2014.
Soft drinks recorded intense competition in 2014, with several new product launches by the
leading manufacturers. In order to sustain current levels of competition, manufacturers such
as Dabur India Ltd continue to focus on marketing and promotional activities. Manufacturers
have also needed to be consistently creative, devising clever marketing campaigns to
promote their products and attract consumers.
Rooh Afza from Hamdard (Wakf) Laboratories is one of the best-selling liquid concentrates in
North India, with strong penetration and high acceptance across all demographics, especially
in off-trade channels. The brand enjoys strong loyalty and is available at competitive prices.
Prospects
Soft drinks off-trade value sales are expected to increase at a CAGR of 14% in constant 2014
terms over the forecast period to reach INR241.6 billion by 2019. In addition, on-trade volume
sales of bottled water and energy drinks are expected to continue recording high double-digit
CAGRs over the forecast period. The popularisation of on-trade concepts such as bars, pubs
and fine dining in the region are likely to be key drivers of this growth.
R T D C O F F E E I N I N D I A P a s s p o r t 6
© E u r o m o n i t o r I n t e r n a t i o n a l
In order to gain the attention and interest of consumers, it is expected that the leading players
in soft drinks will be involved in a flurry of new product launches, promotions and strategies
during the forecast period in a bid to strengthen their respective positions. More branding and
rebranding are expected to be introduced by national players over the forecast period
Home-prepared juice drinks such as lemonade and sharbat are still very popular among North
Indians as they are considered to be the most effective refreshers during the periods of hot,
dry wind that are prevalent in the region during the summer. They are also more economical
than fruit/vegetable juice and this has the potential to restrict the switch to soft drinks of price-
conscious consumers.
South India
Trends
Soft drinks off-trade value sales increased by 25% in current terms in 2014, rising to INR78.6
billion. With rising consumer affluence and with companies aggressively targeting young
consumers, soft drinks, especially bottled water and juice, delivered healthy double-digit total
volume growth in 2013. For hygiene reasons, many consumers are switching to bottled water
brands for their drinking water needs.
During 2014, growing health consciousness among India’s young population continued to
benefit sales of non-carbonated soft drinks such as bottled water, juice and energy drinks.
Juice and bottled water, in particular, are increasingly accounting for sales that otherwise
would have been taken by carbonates.
Competitive Landscape
International players including Coca-Cola and PepsiCo dominated soft drinks in South India in
2013. Thums Up and Coca-Cola, both offered by Coca-Cola, and Pepsi by PepsiCo are the
most visible carbonates brands in modern retail outlets. The growing pub culture in major
cities such as Chennai and Bangalore have led to an increase in sales of lemonade/lime and
energy drinks, which are often used as mixers with alcoholic drinks.
Although most other categories include the usual national leaders, local players are significant
within concentrates. Mali’s Squash by Mali’s Fruit Products and Manama by Manama Farms
& Foods are two brands with established equity in the region, competing strongly with
Hindustan Unilever’s Kissan and Pioma Industries Ltd’s Rasna Utsav in 2014.
Prospects
Soft drinks off-trade value sales are expected to grow even further over the forecast period to
reach INR152.1 billion by 2019. Among all soft drinks categories, bottled water is likely to be
the biggest contributor to volume sales during the forecast period.
South India is a buzzing centre of IT professionals, as Bangalore and Hyderabad are the hubs
for the IT industry in India. Due to the heightened brand consciousness and higher disposable
incomes among the young professionals working in these industries, this region presents a
huge opportunity for national soft drinks players to test the acceptance of new premium
products over the forecast period.
West India

R T D C O F F E E I N I N D I A P a s s p o r t 7
© E u r o m o n i t o r I n t e r n a t i o n a l
Trends
Soft drinks off-trade value sales in West India grew by 23% in current terms during 2014 to
reach INR104.4 billion. Soft drinks per capita consumption in West India was the highest
among all regions of India, over 10 litres per person higher than the national average in 2014.
This indicates that West India is the most affluent region in terms of disposable incomes
available to consumers.
Off-trade volume growth of 17% was slower than the on-trade volume growth of 22%
recorded in soft drinks in 2014. Given the relatively high degree of urbanisation in the region,
supermarkets and hypermarkets represent a strong retail channel for premium soft drinks.
This is also reflected in the fact that West India remained the leading region in terms of on-
trade volume sales of soft drinks in 2014.
Competitive Landscape
In the western regions of India, companies such as Pepsi, Coca Cola, Bisleri, Dabur, Tunip
Agro, Rasna and Tang remained popular in 2014. West India remained a priority for major
national players due to its significant contribution to their overall revenues and therefore all
national brands could be easily found in the west of the country.
Most of the new soft drinks in India are introduced in West India at premium prices as
consumers have proved more willing to try new products. West India continued to be the test
market for most of the products during 2014 as well.
In carbonates and juices, the opportunities for regional players remained limited as the
leading companies maintained the leading positions. However, in concentrates and bottled
water, there are several local players present. Some prominent local regional players are
Mapro, Mala in liquid concentrates and Manikchand in bottled water.
Prospects
Products offering health and wellness benefits, especially fortified products, are expected to
perform consistently strongly over the forecast period, as consumers are expected to gain a
better understanding of the respective benefits that can be drawn from various soft drinks
categories. As a result, soft drinks value sales are likely to grow further over the forecast
period to reach INR203.5 billion by 2019.
There are no potential threats to growth in soft drinks in West India over the forecast period.
Political imbalance could emerge as a slight threat for the soft drinks industry, although this
could be balanced by some intervention from the government, which is relatively industry-
friendly. Nevertheless, these threats are mainly present in Maharashtra, whereas Gujarat is
faring reasonably well, with more than enough support from the regional government.
RURAL VS URBAN KEY TRENDS AND DEVELOPMENTS
Trends
India’s urban consumers remain open to innovative and new products and they are more
advanced in terms of awareness, health consciousness and quality consciousness. As rural
consumers start to move towards innovative products, sales of regular soft drinks such as
carbonates recorded slower growth in 2014, while products with a healthy tag such as bottled
water and juices are becoming more popular.
R T D C O F F E E I N I N D I A P a s s p o r t 8
© E u r o m o n i t o r I n t e r n a t i o n a l
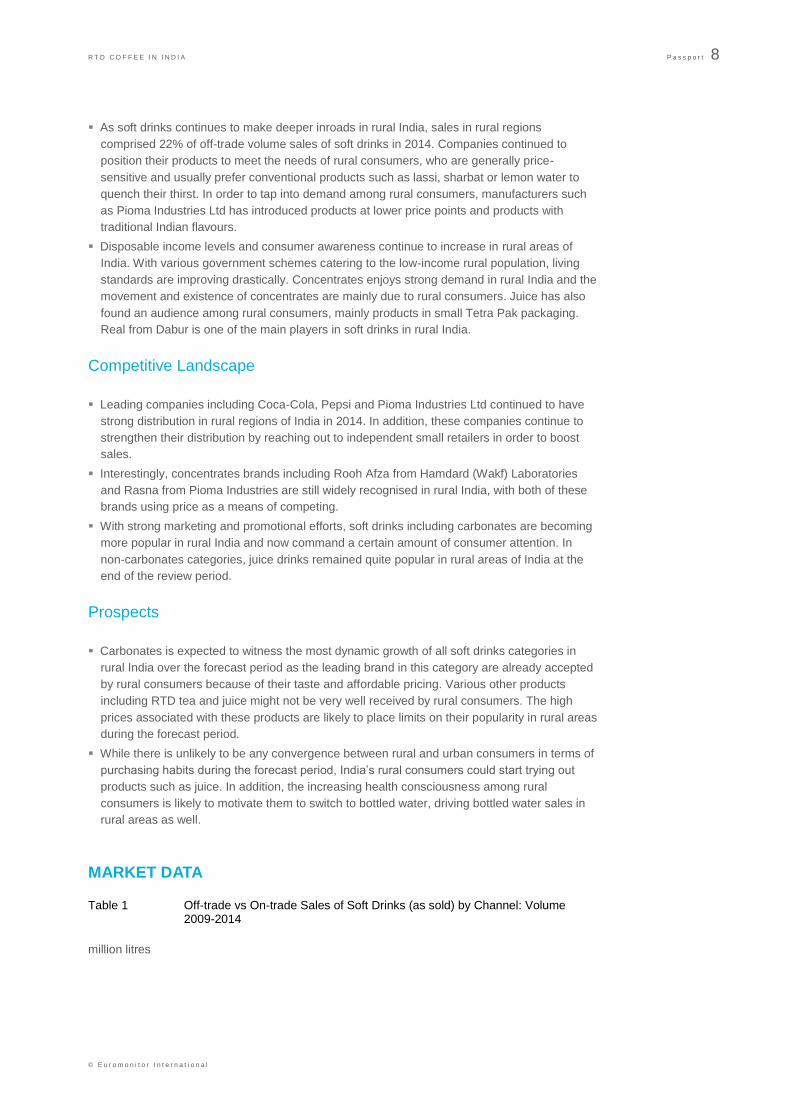
As soft drinks continues to make deeper inroads in rural India, sales in rural regions
comprised 22% of off-trade volume sales of soft drinks in 2014. Companies continued to
position their products to meet the needs of rural consumers, who are generally price-
sensitive and usually prefer conventional products such as lassi, sharbat or lemon water to
quench their thirst. In order to tap into demand among rural consumers, manufacturers such
as Pioma Industries Ltd has introduced products at lower price points and products with
traditional Indian flavours.
Disposable income levels and consumer awareness continue to increase in rural areas of
India. With various government schemes catering to the low-income rural population, living
standards are improving drastically. Concentrates enjoys strong demand in rural India and the
movement and existence of concentrates are mainly due to rural consumers. Juice has also
found an audience among rural consumers, mainly products in small Tetra Pak packaging.
Real from Dabur is one of the main players in soft drinks in rural India.
Competitive Landscape
Leading companies including Coca-Cola, Pepsi and Pioma Industries Ltd continued to have
strong distribution in rural regions of India in 2014. In addition, these companies continue to
strengthen their distribution by reaching out to independent small retailers in order to boost
sales.
Interestingly, concentrates brands including Rooh Afza from Hamdard (Wakf) Laboratories
and Rasna from Pioma Industries are still widely recognised in rural India, with both of these
brands using price as a means of competing.
With strong marketing and promotional efforts, soft drinks including carbonates are becoming
more popular in rural India and now command a certain amount of consumer attention. In
non-carbonates categories, juice drinks remained quite popular in rural areas of India at the
end of the review period.
Prospects
Carbonates is expected to witness the most dynamic growth of all soft drinks categories in
rural India over the forecast period as the leading brand in this category are already accepted
by rural consumers because of their taste and affordable pricing. Various other products
including RTD tea and juice might not be very well received by rural consumers. The high
prices associated with these products are likely to place limits on their popularity in rural areas
during the forecast period.
While there is unlikely to be any convergence between rural and urban consumers in terms of
purchasing habits during the forecast period, India’s rural consumers could start trying out
products such as juice. In addition, the increasing health consciousness among rural
consumers is likely to motivate them to switch to bottled water, driving bottled water sales in
rural areas as well.
MARKET DATA
Table 1 Off-trade vs On-trade Sales of Soft Drinks (as sold) by Channel: Volume 2009-2014
million litres
R T D C O F F E E I N I N D I A P a s s p o r t 9
© E u r o m o n i t o r I n t e r n a t i o n a l
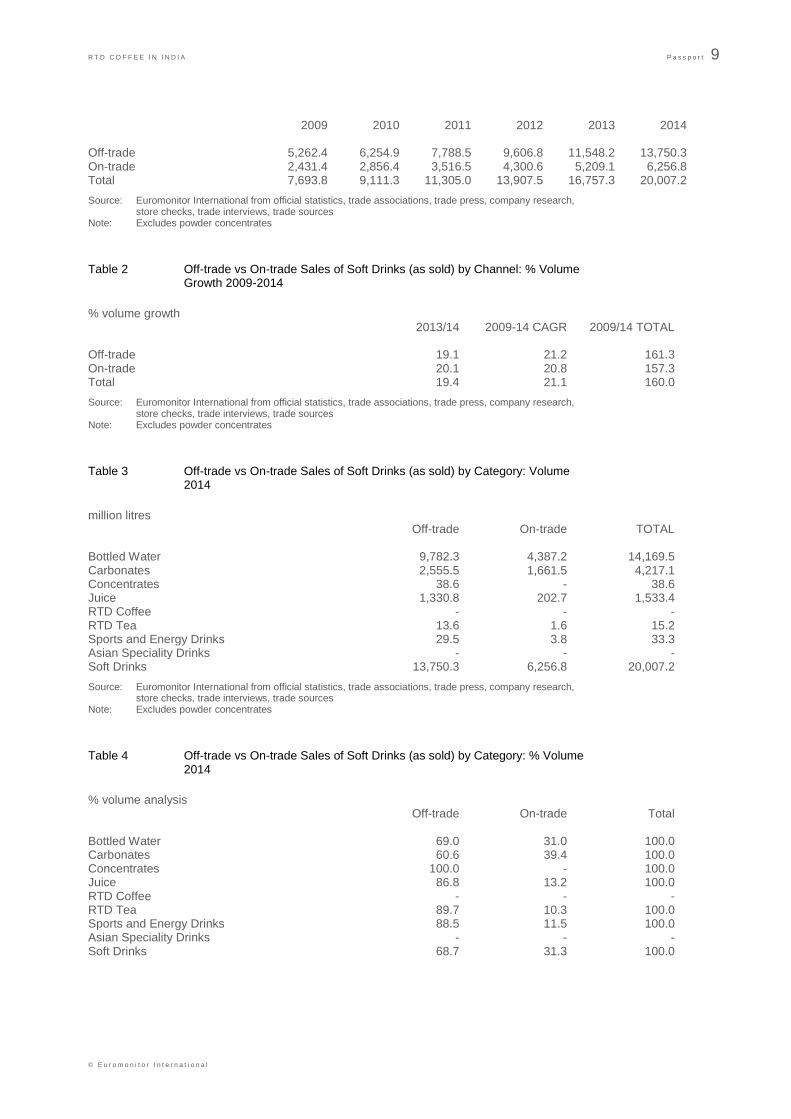
2009 2010 2011 2012 2013 2014 Off-trade 5,262.4 6,254.9 7,788.5 9,606.8 11,548.2 13,750.3 On-trade 2,431.4 2,856.4 3,516.5 4,300.6 5,209.1 6,256.8 Total 7,693.8 9,111.3 11,305.0 13,907.5 16,757.3 20,007.2
Source: Euromonitor International from official statistics, trade associations, trade press, company research, store checks, trade interviews, trade sources
Note: Excludes powder concentrates
Table 2 Off-trade vs On-trade Sales of Soft Drinks (as sold) by Channel: % Volume Growth 2009-2014
% volume growth 2013/14 2009-14 CAGR 2009/14 TOTAL Off-trade 19.1 21.2 161.3 On-trade 20.1 20.8 157.3 Total 19.4 21.1 160.0
Source: Euromonitor International from official statistics, trade associations, trade press, company research, store checks, trade interviews, trade sources
Note: Excludes powder concentrates
Table 3 Off-trade vs On-trade Sales of Soft Drinks (as sold) by Category: Volume 2014
million litres Off-trade On-trade TOTAL Bottled Water 9,782.3 4,387.2 14,169.5 Carbonates 2,555.5 1,661.5 4,217.1 Concentrates 38.6 - 38.6 Juice 1,330.8 202.7 1,533.4 RTD Coffee - - - RTD Tea 13.6 1.6 15.2 Sports and Energy Drinks 29.5 3.8 33.3 Asian Speciality Drinks - - - Soft Drinks 13,750.3 6,256.8 20,007.2
Source: Euromonitor International from official statistics, trade associations, trade press, company research, store checks, trade interviews, trade sources
Note: Excludes powder concentrates
Table 4 Off-trade vs On-trade Sales of Soft Drinks (as sold) by Category: % Volume 2014
% volume analysis Off-trade On-trade Total Bottled Water 69.0 31.0 100.0 Carbonates 60.6 39.4 100.0 Concentrates 100.0 - 100.0 Juice 86.8 13.2 100.0 RTD Coffee - - - RTD Tea 89.7 10.3 100.0 Sports and Energy Drinks 88.5 11.5 100.0 Asian Speciality Drinks - - - Soft Drinks 68.7 31.3 100.0
R T D C O F F E E I N I N D I A P a s s p o r t 10
© E u r o m o n i t o r I n t e r n a t i o n a l
Source: Euromonitor International from official statistics, trade associations, trade press, company research, store checks, trade interviews, trade sources
Note: Excludes powder concentrates
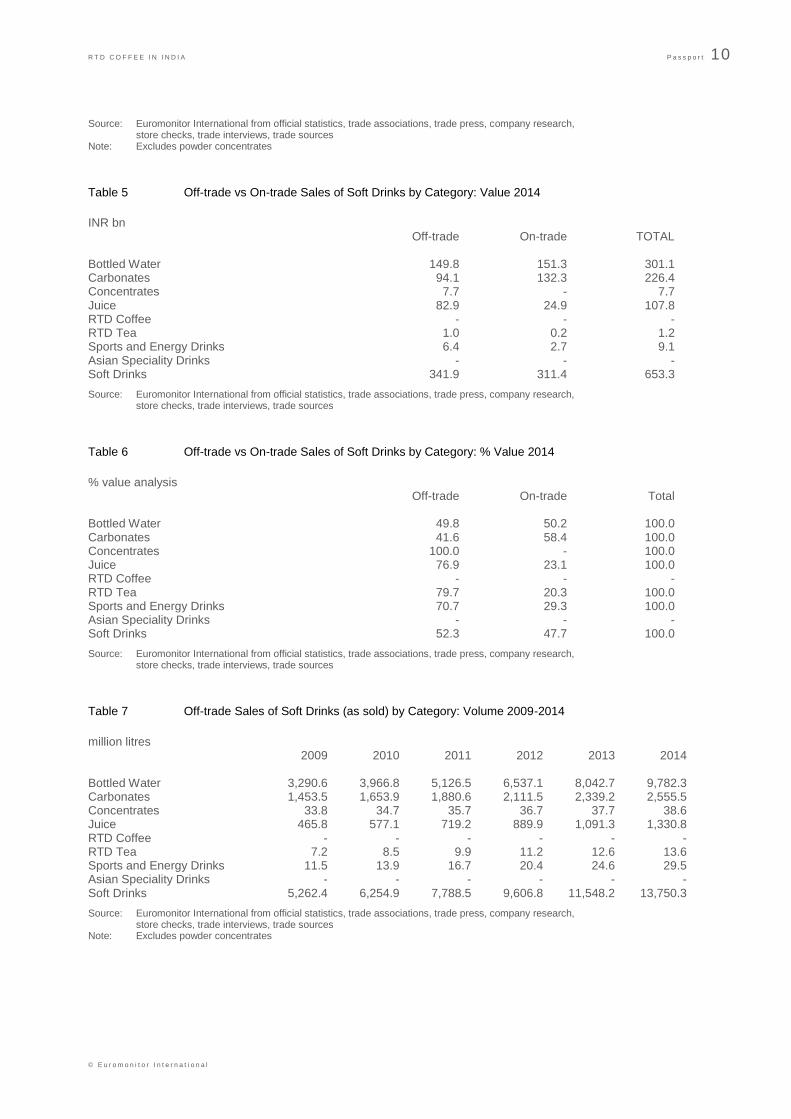
Table 5 Off-trade vs On-trade Sales of Soft Drinks by Category: Value 2014
INR bn Off-trade On-trade TOTAL Bottled Water 149.8 151.3 301.1 Carbonates 94.1 132.3 226.4 Concentrates 7.7 - 7.7 Juice 82.9 24.9 107.8 RTD Coffee - - - RTD Tea 1.0 0.2 1.2 Sports and Energy Drinks 6.4 2.7 9.1 Asian Speciality Drinks - - - Soft Drinks 341.9 311.4 653.3
Source: Euromonitor International from official statistics, trade associations, trade press, company research, store checks, trade interviews, trade sources
Table 6 Off-trade vs On-trade Sales of Soft Drinks by Category: % Value 2014
% value analysis Off-trade On-trade Total Bottled Water 49.8 50.2 100.0 Carbonates 41.6 58.4 100.0 Concentrates 100.0 - 100.0 Juice 76.9 23.1 100.0 RTD Coffee - - - RTD Tea 79.7 20.3 100.0 Sports and Energy Drinks 70.7 29.3 100.0 Asian Speciality Drinks - - - Soft Drinks 52.3 47.7 100.0
Source: Euromonitor International from official statistics, trade associations, trade press, company research, store checks, trade interviews, trade sources
Table 7 Off-trade Sales of Soft Drinks (as sold) by Category: Volume 2009-2014
million litres 2009 2010 2011 2012 2013 2014 Bottled Water 3,290.6 3,966.8 5,126.5 6,537.1 8,042.7 9,782.3 Carbonates 1,453.5 1,653.9 1,880.6 2,111.5 2,339.2 2,555.5 Concentrates 33.8 34.7 35.7 36.7 37.7 38.6 Juice 465.8 577.1 719.2 889.9 1,091.3 1,330.8 RTD Coffee - - - - - - RTD Tea 7.2 8.5 9.9 11.2 12.6 13.6 Sports and Energy Drinks 11.5 13.9 16.7 20.4 24.6 29.5 Asian Speciality Drinks - - - - - - Soft Drinks 5,262.4 6,254.9 7,788.5 9,606.8 11,548.2 13,750.3
Source: Euromonitor International from official statistics, trade associations, trade press, company research, store checks, trade interviews, trade sources
Note: Excludes powder concentrates
R T D C O F F E E I N I N D I A P a s s p o r t 11
© E u r o m o n i t o r I n t e r n a t i o n a l
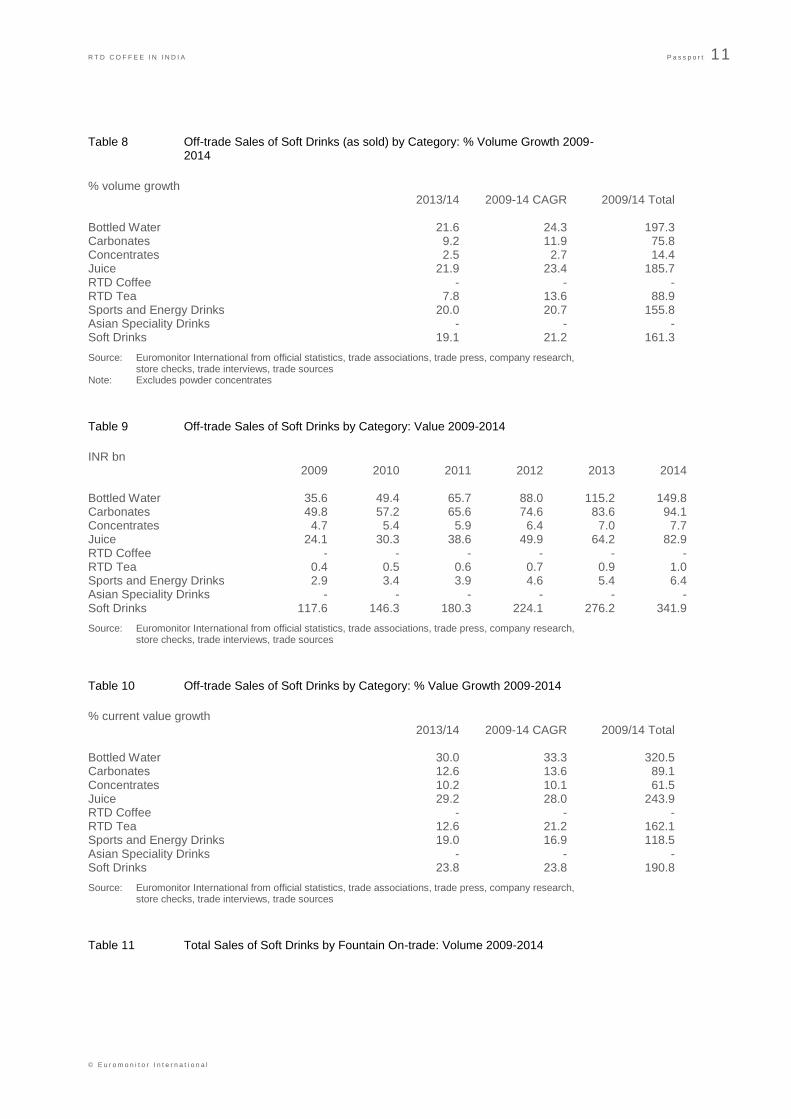
Table 8 Off-trade Sales of Soft Drinks (as sold) by Category: % Volume Growth 2009-2014
% volume growth 2013/14 2009-14 CAGR 2009/14 Total Bottled Water 21.6 24.3 197.3 Carbonates 9.2 11.9 75.8 Concentrates 2.5 2.7 14.4 Juice 21.9 23.4 185.7 RTD Coffee - - - RTD Tea 7.8 13.6 88.9 Sports and Energy Drinks 20.0 20.7 155.8 Asian Speciality Drinks - - - Soft Drinks 19.1 21.2 161.3
Source: Euromonitor International from official statistics, trade associations, trade press, company research, store checks, trade interviews, trade sources
Note: Excludes powder concentrates
Table 9 Off-trade Sales of Soft Drinks by Category: Value 2009-2014
INR bn 2009 2010 2011 2012 2013 2014 Bottled Water 35.6 49.4 65.7 88.0 115.2 149.8 Carbonates 49.8 57.2 65.6 74.6 83.6 94.1 Concentrates 4.7 5.4 5.9 6.4 7.0 7.7 Juice 24.1 30.3 38.6 49.9 64.2 82.9 RTD Coffee - - - - - - RTD Tea 0.4 0.5 0.6 0.7 0.9 1.0 Sports and Energy Drinks 2.9 3.4 3.9 4.6 5.4 6.4 Asian Speciality Drinks - - - - - - Soft Drinks 117.6 146.3 180.3 224.1 276.2 341.9
Source: Euromonitor International from official statistics, trade associations, trade press, company research, store checks, trade interviews, trade sources
Table 10 Off-trade Sales of Soft Drinks by Category: % Value Growth 2009-2014
% current value growth 2013/14 2009-14 CAGR 2009/14 Total Bottled Water 30.0 33.3 320.5 Carbonates 12.6 13.6 89.1 Concentrates 10.2 10.1 61.5 Juice 29.2 28.0 243.9 RTD Coffee - - - RTD Tea 12.6 21.2 162.1 Sports and Energy Drinks 19.0 16.9 118.5 Asian Speciality Drinks - - - Soft Drinks 23.8 23.8 190.8
Source: Euromonitor International from official statistics, trade associations, trade press, company research, store checks, trade interviews, trade sources
Table 11 Total Sales of Soft Drinks by Fountain On-trade: Volume 2009-2014

R T D C O F F E E I N I N D I A P a s s p o r t 12
© E u r o m o n i t o r I n t e r n a t i o n a l
million litres 2009 2010 2011 2012 2013 2014 Total Fountain On-trade - - - - - -
Source: Euromonitor International from official statistics, trade associations, trade press, company research, store checks, trade interviews, trade sources
Table 12 Total Sales of Soft Drinks by Fountain On-trade: % Volume Growth 2009-2014
% fountain volume growth 2013/14 2009-14 CAGR 2009/14 TOTAL Total Fountain On-trade - - -
Source: Euromonitor International from official statistics, trade associations, trade press, company research, store checks, trade interviews, trade sources
Table 13 Off-trade Sales of Soft Drinks (as sold) by Region: Volume 2009-2014
million litres 2009 2010 2011 2012 2013 2014 East and Northeast India 535.2 626.8 760.5 913.2 1,085.4 1,274.9 North India 1,810.1 2,159.3 2,692.8 3,335.8 4,041.9 4,861.3 South India 1,268.6 1,503.6 1,871.4 2,304.2 2,787.3 3,348.4 West India 1,648.4 1,965.2 2,463.8 3,053.6 3,633.5 4,265.7 India 5,262.4 6,254.9 7,788.5 9,606.8 11,548.2 13,750.3
Source: Euromonitor International from official statistics, trade associations, trade press, company research, store checks, trade interviews, trade sources
Note: Excludes powder concentrates
Table 14 Off-trade Sales of Soft Drinks (as sold) by Region: % Volume Growth 2009-2014
% volume growth 2013/14 2009-14 CAGR 2009/14 Total East and Northeast India 17.5 19.0 138.2 North India 20.3 21.8 168.6 South India 20.1 21.4 163.9 West India 17.4 20.9 158.8 India 19.1 21.2 161.3
Source: Euromonitor International from official statistics, trade associations, trade press, company research, store checks, trade interviews, trade sources
Note: Excludes powder concentrates
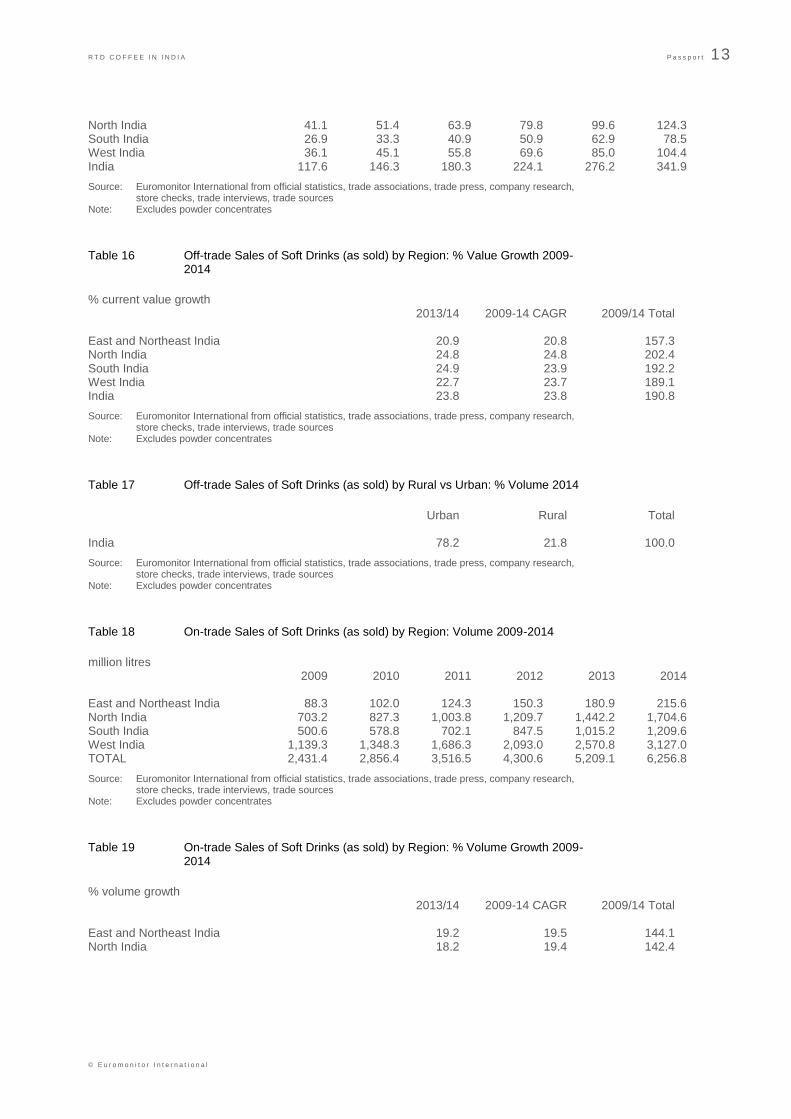
Table 15 Off-trade Sales of Soft Drinks (as sold) by Region: Value 2009-2014
INR bn 2009 2010 2011 2012 2013 2014 East and Northeast India 13.5 16.5 19.8 23.8 28.7 34.7
R T D C O F F E E I N I N D I A P a s s p o r t 13
© E u r o m o n i t o r I n t e r n a t i o n a l
North India 41.1 51.4 63.9 79.8 99.6 124.3 South India 26.9 33.3 40.9 50.9 62.9 78.5 West India 36.1 45.1 55.8 69.6 85.0 104.4 India 117.6 146.3 180.3 224.1 276.2 341.9
Source: Euromonitor International from official statistics, trade associations, trade press, company research, store checks, trade interviews, trade sources
Note: Excludes powder concentrates
Table 16 Off-trade Sales of Soft Drinks (as sold) by Region: % Value Growth 2009-2014
% current value growth 2013/14 2009-14 CAGR 2009/14 Total East and Northeast India 20.9 20.8 157.3 North India 24.8 24.8 202.4 South India 24.9 23.9 192.2 West India 22.7 23.7 189.1 India 23.8 23.8 190.8
Source: Euromonitor International from official statistics, trade associations, trade press, company research, store checks, trade interviews, trade sources
Note: Excludes powder concentrates
Table 17 Off-trade Sales of Soft Drinks (as sold) by Rural vs Urban: % Volume 2014
Urban Rural Total India 78.2 21.8 100.0
Source: Euromonitor International from official statistics, trade associations, trade press, company research, store checks, trade interviews, trade sources
Note: Excludes powder concentrates
Table 18 On-trade Sales of Soft Drinks (as sold) by Region: Volume 2009-2014
million litres 2009 2010 2011 2012 2013 2014 East and Northeast India 88.3 102.0 124.3 150.3 180.9 215.6 North India 703.2 827.3 1,003.8 1,209.7 1,442.2 1,704.6 South India 500.6 578.8 702.1 847.5 1,015.2 1,209.6 West India 1,139.3 1,348.3 1,686.3 2,093.0 2,570.8 3,127.0 TOTAL 2,431.4 2,856.4 3,516.5 4,300.6 5,209.1 6,256.8
Source: Euromonitor International from official statistics, trade associations, trade press, company research, store checks, trade interviews, trade sources
Note: Excludes powder concentrates
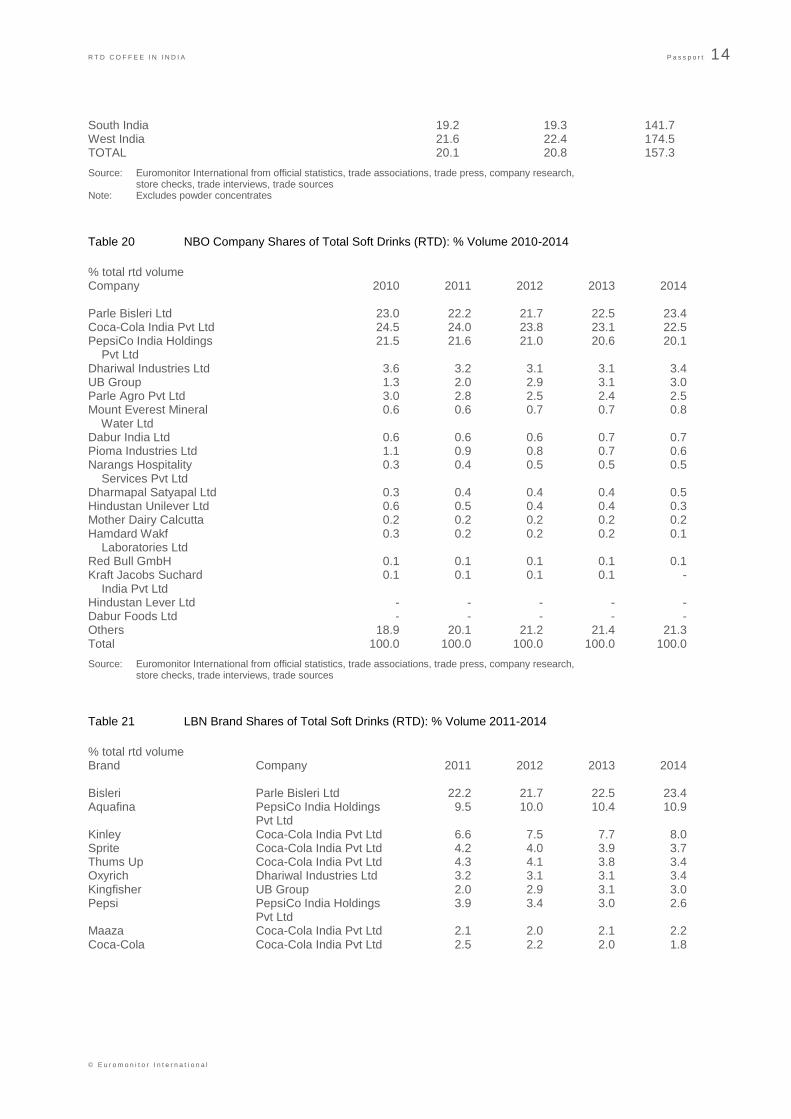
Table 19 On-trade Sales of Soft Drinks (as sold) by Region: % Volume Growth 2009-2014
% volume growth 2013/14 2009-14 CAGR 2009/14 Total East and Northeast India 19.2 19.5 144.1 North India 18.2 19.4 142.4
R T D C O F F E E I N I N D I A P a s s p o r t 14
© E u r o m o n i t o r I n t e r n a t i o n a l
South India 19.2 19.3 141.7 West India 21.6 22.4 174.5 TOTAL 20.1 20.8 157.3
Source: Euromonitor International from official statistics, trade associations, trade press, company research, store checks, trade interviews, trade sources
Note: Excludes powder concentrates
Table 20 NBO Company Shares of Total Soft Drinks (RTD): % Volume 2010-2014
% total rtd volume Company 2010 2011 2012 2013 2014 Parle Bisleri Ltd 23.0 22.2 21.7 22.5 23.4 Coca-Cola India Pvt Ltd 24.5 24.0 23.8 23.1 22.5 PepsiCo India Holdings 21.5 21.6 21.0 20.6 20.1 Pvt Ltd Dhariwal Industries Ltd 3.6 3.2 3.1 3.1 3.4 UB Group 1.3 2.0 2.9 3.1 3.0 Parle Agro Pvt Ltd 3.0 2.8 2.5 2.4 2.5 Mount Everest Mineral 0.6 0.6 0.7 0.7 0.8 Water Ltd Dabur India Ltd 0.6 0.6 0.6 0.7 0.7 Pioma Industries Ltd 1.1 0.9 0.8 0.7 0.6 Narangs Hospitality 0.3 0.4 0.5 0.5 0.5 Services Pvt Ltd Dharmapal Satyapal Ltd 0.3 0.4 0.4 0.4 0.5 Hindustan Unilever Ltd 0.6 0.5 0.4 0.4 0.3 Mother Dairy Calcutta 0.2 0.2 0.2 0.2 0.2 Hamdard Wakf 0.3 0.2 0.2 0.2 0.1 Laboratories Ltd Red Bull GmbH 0.1 0.1 0.1 0.1 0.1 Kraft Jacobs Suchard 0.1 0.1 0.1 0.1 - India Pvt Ltd Hindustan Lever Ltd - - - - - Dabur Foods Ltd - - - - - Others 18.9 20.1 21.2 21.4 21.3 Total 100.0 100.0 100.0 100.0 100.0
Source: Euromonitor International from official statistics, trade associations, trade press, company research, store checks, trade interviews, trade sources
Table 21 LBN Brand Shares of Total Soft Drinks (RTD): % Volume 2011-2014
% total rtd volume Brand Company 2011 2012 2013 2014 Bisleri Parle Bisleri Ltd 22.2 21.7 22.5 23.4 Aquafina PepsiCo India Holdings 9.5 10.0 10.4 10.9 Pvt Ltd Kinley Coca-Cola India Pvt Ltd 6.6 7.5 7.7 8.0 Sprite Coca-Cola India Pvt Ltd 4.2 4.0 3.9 3.7 Thums Up Coca-Cola India Pvt Ltd 4.3 4.1 3.8 3.4 Oxyrich Dhariwal Industries Ltd 3.2 3.1 3.1 3.4 Kingfisher UB Group 2.0 2.9 3.1 3.0 Pepsi PepsiCo India Holdings 3.9 3.4 3.0 2.6 Pvt Ltd Maaza Coca-Cola India Pvt Ltd 2.1 2.0 2.1 2.2 Coca-Cola Coca-Cola India Pvt Ltd 2.5 2.2 2.0 1.8

R T D C O F F E E I N I N D I A P a s s p o r t 15
© E u r o m o n i t o r I n t e r n a t i o n a l
Limca Coca-Cola India Pvt Ltd 2.1 2.0 1.8 1.7 Slice PepsiCo India Holdings 1.3 1.4 1.5 1.7 Pvt Ltd Fanta Coca-Cola India Pvt Ltd 2.0 1.7 1.5 1.3 7-Up PepsiCo India Holdings 1.6 1.5 1.4 1.3 Pvt Ltd Mirinda PepsiCo India Holdings 2.2 1.9 1.6 1.3 Pvt Ltd Frooti Parle Agro Pvt Ltd 1.5 1.4 1.2 1.2 Mountain Dew PepsiCo India Holdings 1.4 1.4 1.3 1.2 Pvt Ltd Bailley Parle Agro Pvt Ltd 1.0 0.9 1.0 1.1 Himalayan Mount Everest Mineral 0.6 0.7 0.7 0.8 Water Ltd Réal Dabur India Ltd 0.6 0.6 0.7 0.7 Rasna Pioma Industries Ltd 0.9 0.8 0.7 0.6 Qua Narangs Hospitality 0.4 0.5 0.5 0.5 Services Pvt Ltd Evervess PepsiCo India Holdings 0.8 0.7 0.6 0.5 Pvt Ltd Tropicana PepsiCo India Holdings 0.5 0.4 0.5 0.5 Pvt Ltd Catch Natural Dharmapal Satyapal Ltd 0.4 0.4 0.4 0.5 Mineral Water Minute Maid Coca-Cola India Pvt Ltd 0.3 0.2 0.2 0.3 Kissan Hindustan Unilever Ltd 0.4 0.3 0.3 0.2 Duke's PepsiCo India Holdings 0.4 0.3 0.3 0.2 Pvt Ltd Appy Parle Agro Pvt Ltd 0.3 0.2 0.2 0.2 Mother Dairy Mother Dairy Calcutta 0.2 0.2 0.2 0.2 Others 20.8 21.8 21.9 21.7 Total 100.0 100.0 100.0 100.0
Source: Euromonitor International from official statistics, trade associations, trade press, company research, store checks, trade interviews, trade sources
Table 22 NBO Company Shares of On-trade Soft Drinks (RTD): % Volume 2010-2014
% on-trade rtd volume Company 2010 2011 2012 2013 2014 PepsiCo India Holdings 24.9 23.6 22.7 21.9 21.1 Pvt Ltd Parle Bisleri Ltd 20.7 20.0 19.9 20.9 21.0 Coca-Cola India Pvt Ltd 24.9 23.1 21.7 20.2 18.8 UB Group 1.1 1.8 2.7 2.9 3.0 Mount Everest Mineral 1.7 1.8 2.0 2.2 2.3 Water Ltd Narangs Hospitality 0.8 1.3 1.5 1.6 1.7 Services Pvt Ltd Parle Agro Pvt Ltd 2.1 1.9 1.7 1.6 1.6 Dharmapal Satyapal Ltd 0.9 1.1 1.3 1.3 1.4 Dhariwal Industries Ltd 0.9 0.9 0.8 0.9 0.9 Danone, Groupe 0.3 0.3 0.3 0.3 0.3 Dabur India Ltd 0.2 0.2 0.2 0.2 0.2 Dabur Foods Ltd - - - - - Others 21.6 23.9 25.4 26.1 27.7 Total 100.0 100.0 100.0 100.0 100.0
Source: Euromonitor International from official statistics, trade associations, trade press, company research, store checks, trade interviews, trade sources

R T D C O F F E E I N I N D I A P a s s p o r t 16
© E u r o m o n i t o r I n t e r n a t i o n a l
Table 23 LBN Brand Shares of On-trade Soft Drinks (RTD): % Volume 2011-2014
% on-trade rtd volume Brand Company 2011 2012 2013 2014 Bisleri Parle Bisleri Ltd 20.0 19.9 20.9 21.0 Aquafina PepsiCo India Holdings 9.1 9.8 10.5 11.2 Pvt Ltd Thums Up Coca-Cola India Pvt Ltd 5.0 4.8 4.4 4.0 Sprite Coca-Cola India Pvt Ltd 4.7 4.5 4.2 3.9 Kinley Coca-Cola India Pvt Ltd 3.6 3.6 3.7 3.6 Pepsi PepsiCo India Holdings 4.4 3.8 3.4 3.0 Pvt Ltd Kingfisher UB Group 1.8 2.7 2.9 3.0 Himalayan Mount Everest Mineral 1.8 2.0 2.2 2.3 Water Ltd Coca-Cola Coca-Cola India Pvt Ltd 3.2 2.8 2.5 2.2 Limca Coca-Cola India Pvt Ltd 2.5 2.4 2.1 1.9 Fanta Coca-Cola India Pvt Ltd 2.7 2.3 2.1 1.8 Qua Narangs Hospitality 1.3 1.5 1.6 1.7 Services Pvt Ltd Mirinda PepsiCo India Holdings 3.2 2.7 2.4 1.7 Pvt Ltd 7-Up PepsiCo India Holdings 2.0 1.8 1.6 1.5 Pvt Ltd Catch Natural Dharmapal Satyapal Ltd 1.1 1.3 1.3 1.4 Mineral Water Mountain Dew PepsiCo India Holdings 1.8 1.8 1.5 1.4 Pvt Ltd Maaza Coca-Cola India Pvt Ltd 1.3 1.3 1.3 1.3 Slice PepsiCo India Holdings 1.1 1.1 1.1 1.1 Pvt Ltd Bailley Parle Agro Pvt Ltd 1.2 1.0 1.0 1.1 Oxyrich Dhariwal Industries Ltd 0.9 0.8 0.9 0.9 Evervess PepsiCo India Holdings 1.1 1.0 0.8 0.7 Pvt Ltd Frooti Parle Agro Pvt Ltd 0.5 0.5 0.5 0.4 Duke's PepsiCo India Holdings 0.7 0.6 0.5 0.4 Pvt Ltd Evian Danone, Groupe 0.3 0.3 0.3 0.3 Réal Dabur India Ltd 0.2 0.2 0.2 0.2 Appy Parle Agro Pvt Ltd 0.1 0.1 0.1 0.1 Tropicana PepsiCo India Holdings 0.1 0.1 0.1 0.1 Pvt Ltd Réal Dabur Foods Ltd - - - - Others 23.9 25.4 26.1 27.7 Total 100.0 100.0 100.0 100.0
Source: Euromonitor International from official statistics, trade associations, trade press, company research, store checks, trade interviews, trade sources
Table 24 NBO Company Shares of Off-trade Soft Drinks (as sold): % Volume 2010-2014
% off-trade volume Company 2010 2011 2012 2013 2014
R T D C O F F E E I N I N D I A P a s s p o r t 17
© E u r o m o n i t o r I n t e r n a t i o n a l
Parle Bisleri Ltd 24.7 23.8 22.9 23.6 24.8 Coca-Cola India Pvt Ltd 25.1 24.9 25.2 24.8 24.5 PepsiCo India Holdings 20.6 21.2 20.6 20.4 20.0 Pvt Ltd Dhariwal Industries Ltd 5.0 4.4 4.1 4.1 4.6 UB Group 1.4 2.1 3.1 3.2 3.1 Parle Agro Pvt Ltd 3.5 3.3 3.0 2.8 2.9 Dabur India Ltd 0.8 0.8 0.9 0.9 1.0 Mother Dairy Calcutta 0.3 0.3 0.2 0.2 0.2 Hindustan Unilever Ltd 0.3 0.3 0.2 0.2 0.2 Mount Everest Mineral 0.1 0.1 0.1 0.1 0.1 Water Ltd Tunip Agro Pvt Ltd 0.1 0.1 0.1 0.1 0.1 Red Bull GmbH 0.1 0.1 0.1 0.1 0.1 Hamdard Wakf 0.1 0.1 0.1 0.1 0.1 Laboratories Ltd Pioma Industries Ltd 0.1 0.1 0.1 0.1 0.1 Dharmapal Satyapal Ltd 0.1 0.0 0.0 0.0 0.0 Tata Global Beverages Ltd 0.1 0.0 - - - Hindustan Lever Ltd - - - - - Dabur Foods Ltd - - - - - Others 17.7 18.6 19.4 19.3 18.3 Total 100.0 100.0 100.0 100.0 100.0
Source: Euromonitor International from official statistics, trade associations, trade press, company research, store checks, trade interviews, trade sources
Note: Excludes powder concentrates
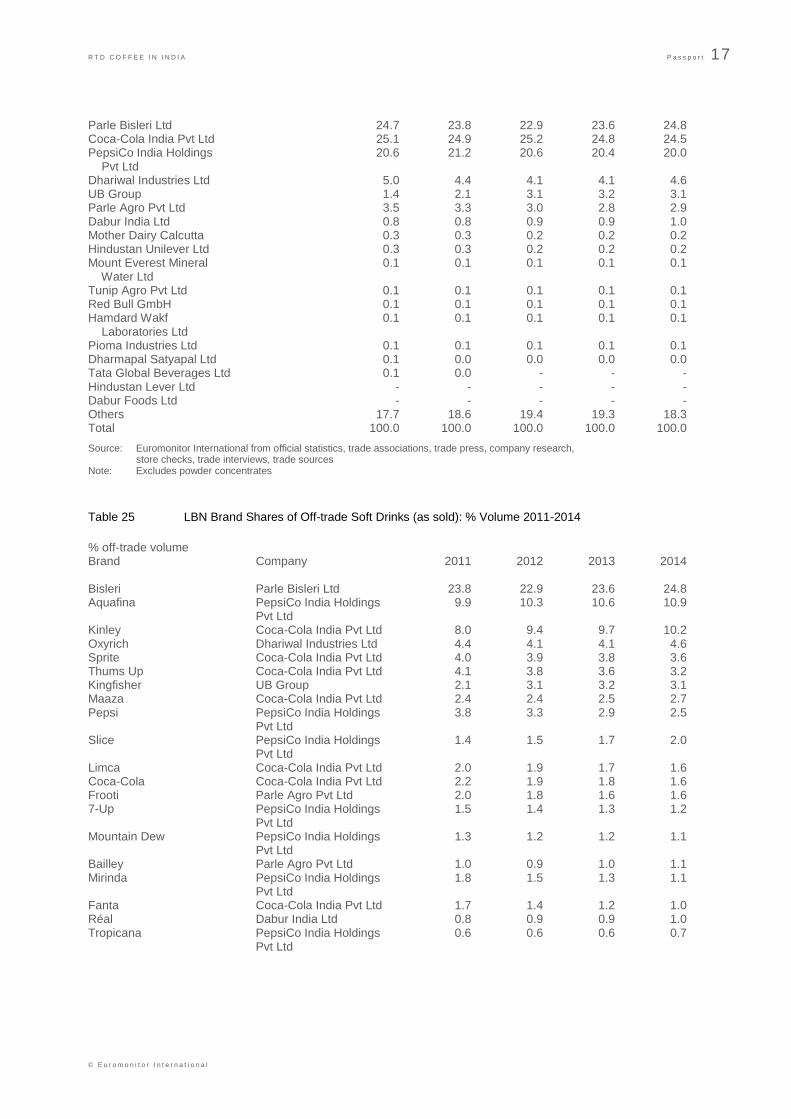
Table 25 LBN Brand Shares of Off-trade Soft Drinks (as sold): % Volume 2011-2014
% off-trade volume Brand Company 2011 2012 2013 2014 Bisleri Parle Bisleri Ltd 23.8 22.9 23.6 24.8 Aquafina PepsiCo India Holdings 9.9 10.3 10.6 10.9 Pvt Ltd Kinley Coca-Cola India Pvt Ltd 8.0 9.4 9.7 10.2 Oxyrich Dhariwal Industries Ltd 4.4 4.1 4.1 4.6 Sprite Coca-Cola India Pvt Ltd 4.0 3.9 3.8 3.6 Thums Up Coca-Cola India Pvt Ltd 4.1 3.8 3.6 3.2 Kingfisher UB Group 2.1 3.1 3.2 3.1 Maaza Coca-Cola India Pvt Ltd 2.4 2.4 2.5 2.7 Pepsi PepsiCo India Holdings 3.8 3.3 2.9 2.5 Pvt Ltd Slice PepsiCo India Holdings 1.4 1.5 1.7 2.0 Pvt Ltd Limca Coca-Cola India Pvt Ltd 2.0 1.9 1.7 1.6 Coca-Cola Coca-Cola India Pvt Ltd 2.2 1.9 1.8 1.6 Frooti Parle Agro Pvt Ltd 2.0 1.8 1.6 1.6 7-Up PepsiCo India Holdings 1.5 1.4 1.3 1.2 Pvt Ltd Mountain Dew PepsiCo India Holdings 1.3 1.2 1.2 1.1 Pvt Ltd Bailley Parle Agro Pvt Ltd 1.0 0.9 1.0 1.1 Mirinda PepsiCo India Holdings 1.8 1.5 1.3 1.1 Pvt Ltd Fanta Coca-Cola India Pvt Ltd 1.7 1.4 1.2 1.0 Réal Dabur India Ltd 0.8 0.9 0.9 1.0 Tropicana PepsiCo India Holdings 0.6 0.6 0.6 0.7 Pvt Ltd

R T D C O F F E E I N I N D I A P a s s p o r t 18
© E u r o m o n i t o r I n t e r n a t i o n a l
Evervess PepsiCo India Holdings 0.6 0.5 0.5 0.4 Pvt Ltd Minute Maid Coca-Cola India Pvt Ltd 0.4 0.3 0.4 0.4 Mother Dairy Mother Dairy Calcutta 0.3 0.2 0.2 0.2 Appy Parle Agro Pvt Ltd 0.3 0.3 0.2 0.2 Duke's PepsiCo India Holdings 0.2 0.2 0.2 0.1 Pvt Ltd Gatorade PepsiCo India Holdings 0.1 0.1 0.1 0.1 Pvt Ltd Himalayan Mount Everest Mineral 0.1 0.1 0.1 0.1 Water Ltd Kissan Hindustan Unilever Ltd 0.1 0.1 0.1 0.1 Onjus Tunip Agro Pvt Ltd 0.1 0.1 0.1 0.1 Red Bull Red Bull GmbH 0.1 0.1 0.1 0.1 Others 19.1 19.8 19.7 18.6 Total 100.0 100.0 100.0 100.0
Source: Euromonitor International from official statistics, trade associations, trade press, company research, store checks, trade interviews, trade sources
Note: Excludes powder concentrates
Table 26 NBO Company Shares of Off-trade Soft Drinks (RTD): % Volume 2010-2014
% off-trade volume Company 2010 2011 2012 2013 2014 Parle Bisleri Ltd 24.1 23.2 22.5 23.2 24.5 Coca-Cola India Pvt Ltd 24.4 24.3 24.7 24.4 24.1 PepsiCo India Holdings 20.0 20.7 20.2 20.0 19.7 Pvt Ltd Dhariwal Industries Ltd 4.8 4.3 4.0 4.0 4.5 UB Group 1.4 2.0 3.0 3.1 3.0 Parle Agro Pvt Ltd 3.4 3.2 2.9 2.8 2.9 Dabur India Ltd 0.7 0.8 0.8 0.9 0.9 Pioma Industries Ltd 1.6 1.4 1.1 1.0 0.9 Hindustan Unilever Ltd 0.8 0.7 0.6 0.5 0.4 Mother Dairy Calcutta 0.3 0.3 0.2 0.2 0.2 Hamdard Wakf 0.4 0.3 0.3 0.2 0.2 Laboratories Ltd Mondelez India Foods Ltd - - - - 0.1 Mount Everest Mineral 0.1 0.1 0.1 0.1 0.1 Water Ltd Tunip Agro Pvt Ltd 0.1 0.1 0.1 0.1 0.1 Red Bull GmbH 0.1 0.1 0.1 0.1 0.1 Dharmapal Satyapal Ltd 0.1 0.0 0.0 0.0 0.0 Kraft Jacobs Suchard 0.1 0.2 0.1 0.1 - India Pvt Ltd Tata Global Beverages Ltd 0.1 0.0 - - - Hindustan Lever Ltd - - - - - Dabur Foods Ltd - - - - - Others 17.6 18.3 19.2 19.1 18.1 Total 100.0 100.0 100.0 100.0 100.0
Source: Euromonitor International from official statistics, trade associations, trade press, company research, store checks, trade interviews, trade sources
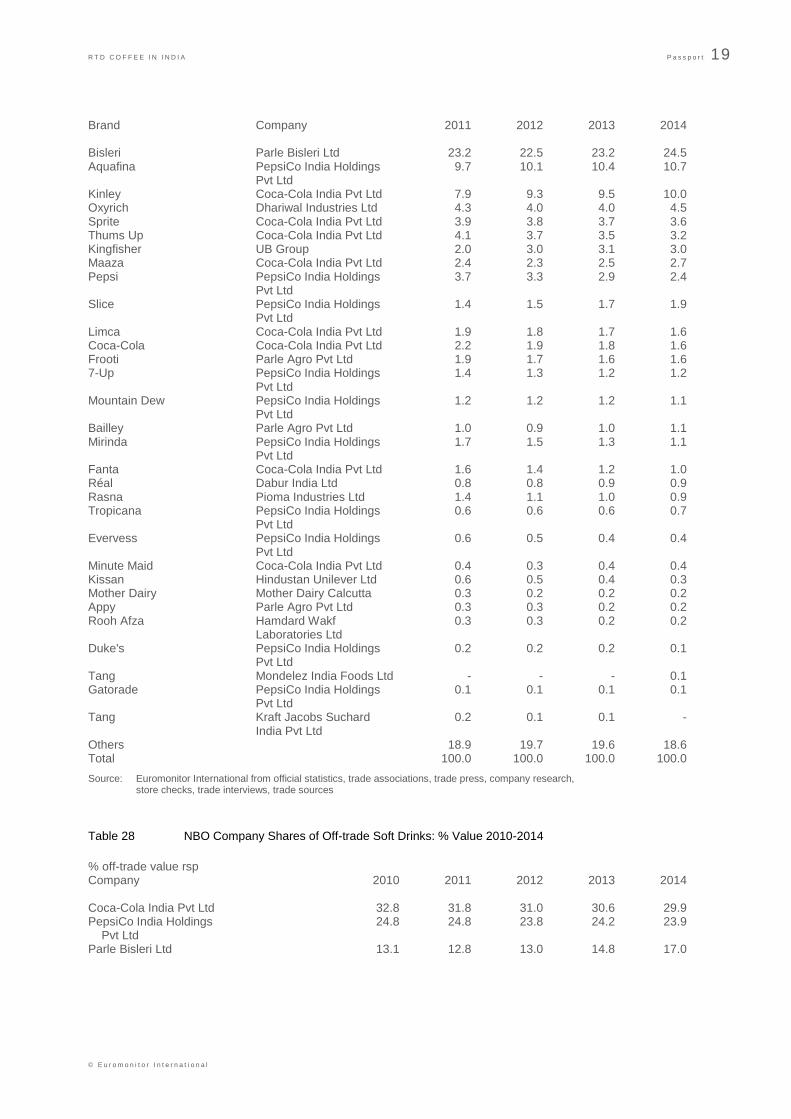
Table 27 LBN Brand Shares of Off-trade Soft Drinks (RTD): % Volume 2011-2014
% off-trade volume
R T D C O F F E E I N I N D I A P a s s p o r t 19
© E u r o m o n i t o r I n t e r n a t i o n a l
Brand Company 2011 2012 2013 2014 Bisleri Parle Bisleri Ltd 23.2 22.5 23.2 24.5 Aquafina PepsiCo India Holdings 9.7 10.1 10.4 10.7 Pvt Ltd Kinley Coca-Cola India Pvt Ltd 7.9 9.3 9.5 10.0 Oxyrich Dhariwal Industries Ltd 4.3 4.0 4.0 4.5 Sprite Coca-Cola India Pvt Ltd 3.9 3.8 3.7 3.6 Thums Up Coca-Cola India Pvt Ltd 4.1 3.7 3.5 3.2 Kingfisher UB Group 2.0 3.0 3.1 3.0 Maaza Coca-Cola India Pvt Ltd 2.4 2.3 2.5 2.7 Pepsi PepsiCo India Holdings 3.7 3.3 2.9 2.4 Pvt Ltd Slice PepsiCo India Holdings 1.4 1.5 1.7 1.9 Pvt Ltd Limca Coca-Cola India Pvt Ltd 1.9 1.8 1.7 1.6 Coca-Cola Coca-Cola India Pvt Ltd 2.2 1.9 1.8 1.6 Frooti Parle Agro Pvt Ltd 1.9 1.7 1.6 1.6 7-Up PepsiCo India Holdings 1.4 1.3 1.2 1.2 Pvt Ltd Mountain Dew PepsiCo India Holdings 1.2 1.2 1.2 1.1 Pvt Ltd Bailley Parle Agro Pvt Ltd 1.0 0.9 1.0 1.1 Mirinda PepsiCo India Holdings 1.7 1.5 1.3 1.1 Pvt Ltd Fanta Coca-Cola India Pvt Ltd 1.6 1.4 1.2 1.0 Réal Dabur India Ltd 0.8 0.8 0.9 0.9 Rasna Pioma Industries Ltd 1.4 1.1 1.0 0.9 Tropicana PepsiCo India Holdings 0.6 0.6 0.6 0.7 Pvt Ltd Evervess PepsiCo India Holdings 0.6 0.5 0.4 0.4 Pvt Ltd Minute Maid Coca-Cola India Pvt Ltd 0.4 0.3 0.4 0.4 Kissan Hindustan Unilever Ltd 0.6 0.5 0.4 0.3 Mother Dairy Mother Dairy Calcutta 0.3 0.2 0.2 0.2 Appy Parle Agro Pvt Ltd 0.3 0.3 0.2 0.2 Rooh Afza Hamdard Wakf 0.3 0.3 0.2 0.2 Laboratories Ltd Duke's PepsiCo India Holdings 0.2 0.2 0.2 0.1 Pvt Ltd Tang Mondelez India Foods Ltd - - - 0.1 Gatorade PepsiCo India Holdings 0.1 0.1 0.1 0.1 Pvt Ltd Tang Kraft Jacobs Suchard 0.2 0.1 0.1 - India Pvt Ltd Others 18.9 19.7 19.6 18.6 Total 100.0 100.0 100.0 100.0
Source: Euromonitor International from official statistics, trade associations, trade press, company research, store checks, trade interviews, trade sources
Table 28 NBO Company Shares of Off-trade Soft Drinks: % Value 2010-2014
% off-trade value rsp Company 2010 2011 2012 2013 2014 Coca-Cola India Pvt Ltd 32.8 31.8 31.0 30.6 29.9 PepsiCo India Holdings 24.8 24.8 23.8 24.2 23.9 Pvt Ltd Parle Bisleri Ltd 13.1 12.8 13.0 14.8 17.0
R T D C O F F E E I N I N D I A P a s s p o r t 20
© E u r o m o n i t o r I n t e r n a t i o n a l
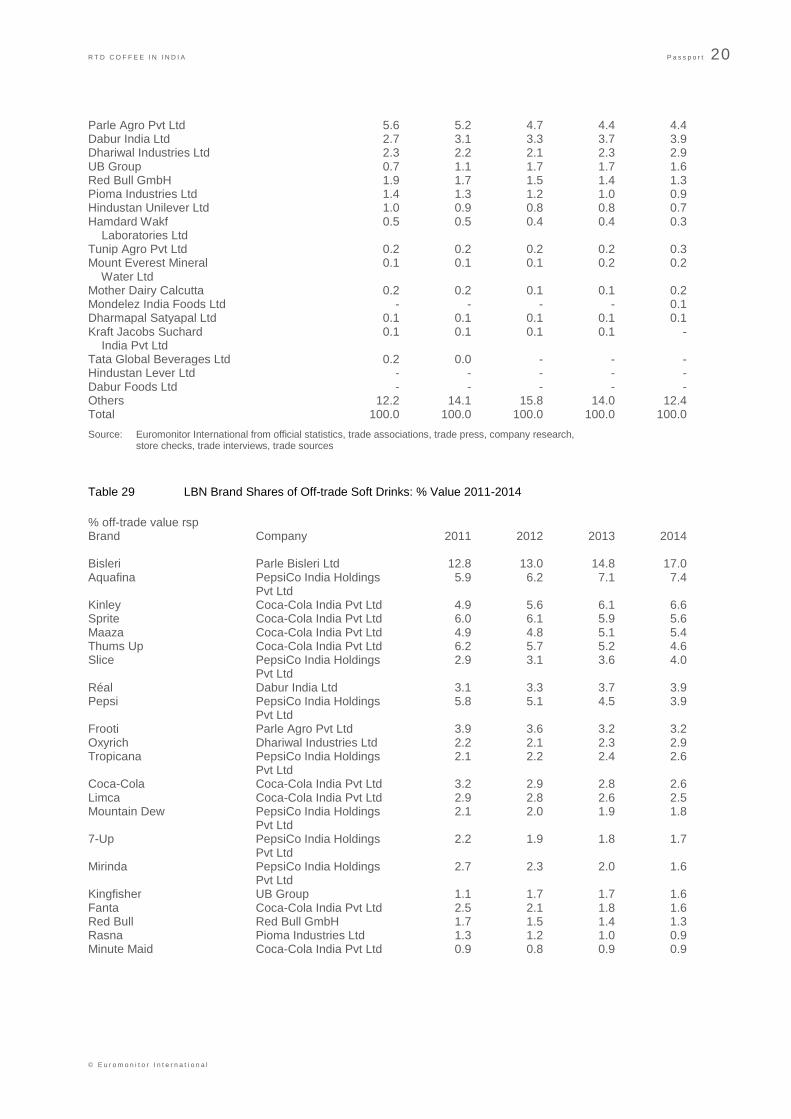
Parle Agro Pvt Ltd 5.6 5.2 4.7 4.4 4.4 Dabur India Ltd 2.7 3.1 3.3 3.7 3.9 Dhariwal Industries Ltd 2.3 2.2 2.1 2.3 2.9 UB Group 0.7 1.1 1.7 1.7 1.6 Red Bull GmbH 1.9 1.7 1.5 1.4 1.3 Pioma Industries Ltd 1.4 1.3 1.2 1.0 0.9 Hindustan Unilever Ltd 1.0 0.9 0.8 0.8 0.7 Hamdard Wakf 0.5 0.5 0.4 0.4 0.3 Laboratories Ltd Tunip Agro Pvt Ltd 0.2 0.2 0.2 0.2 0.3 Mount Everest Mineral 0.1 0.1 0.1 0.2 0.2 Water Ltd Mother Dairy Calcutta 0.2 0.2 0.1 0.1 0.2 Mondelez India Foods Ltd - - - - 0.1 Dharmapal Satyapal Ltd 0.1 0.1 0.1 0.1 0.1 Kraft Jacobs Suchard 0.1 0.1 0.1 0.1 - India Pvt Ltd Tata Global Beverages Ltd 0.2 0.0 - - - Hindustan Lever Ltd - - - - - Dabur Foods Ltd - - - - - Others 12.2 14.1 15.8 14.0 12.4 Total 100.0 100.0 100.0 100.0 100.0
Source: Euromonitor International from official statistics, trade associations, trade press, company research, store checks, trade interviews, trade sources
Table 29 LBN Brand Shares of Off-trade Soft Drinks: % Value 2011-2014
% off-trade value rsp Brand Company 2011 2012 2013 2014 Bisleri Parle Bisleri Ltd 12.8 13.0 14.8 17.0 Aquafina PepsiCo India Holdings 5.9 6.2 7.1 7.4 Pvt Ltd Kinley Coca-Cola India Pvt Ltd 4.9 5.6 6.1 6.6 Sprite Coca-Cola India Pvt Ltd 6.0 6.1 5.9 5.6 Maaza Coca-Cola India Pvt Ltd 4.9 4.8 5.1 5.4 Thums Up Coca-Cola India Pvt Ltd 6.2 5.7 5.2 4.6 Slice PepsiCo India Holdings 2.9 3.1 3.6 4.0 Pvt Ltd Réal Dabur India Ltd 3.1 3.3 3.7 3.9 Pepsi PepsiCo India Holdings 5.8 5.1 4.5 3.9 Pvt Ltd Frooti Parle Agro Pvt Ltd 3.9 3.6 3.2 3.2 Oxyrich Dhariwal Industries Ltd 2.2 2.1 2.3 2.9 Tropicana PepsiCo India Holdings 2.1 2.2 2.4 2.6 Pvt Ltd Coca-Cola Coca-Cola India Pvt Ltd 3.2 2.9 2.8 2.6 Limca Coca-Cola India Pvt Ltd 2.9 2.8 2.6 2.5 Mountain Dew PepsiCo India Holdings 2.1 2.0 1.9 1.8 Pvt Ltd 7-Up PepsiCo India Holdings 2.2 1.9 1.8 1.7 Pvt Ltd Mirinda PepsiCo India Holdings 2.7 2.3 2.0 1.6 Pvt Ltd Kingfisher UB Group 1.1 1.7 1.7 1.6 Fanta Coca-Cola India Pvt Ltd 2.5 2.1 1.8 1.6 Red Bull Red Bull GmbH 1.7 1.5 1.4 1.3 Rasna Pioma Industries Ltd 1.3 1.2 1.0 0.9 Minute Maid Coca-Cola India Pvt Ltd 0.9 0.8 0.9 0.9

R T D C O F F E E I N I N D I A P a s s p o r t 21
© E u r o m o n i t o r I n t e r n a t i o n a l
Bailley Parle Agro Pvt Ltd 0.5 0.5 0.6 0.7 Appy Parle Agro Pvt Ltd 0.7 0.6 0.6 0.5 Kissan Hindustan Unilever Ltd 0.7 0.6 0.5 0.4 Evervess PepsiCo India Holdings 0.6 0.5 0.4 0.3 Pvt Ltd Rooh Afza Hamdard Wakf 0.5 0.4 0.4 0.3 Laboratories Ltd Gatorade PepsiCo India Holdings 0.2 0.2 0.3 0.3 Pvt Ltd Onjus Tunip Agro Pvt Ltd 0.2 0.2 0.2 0.3 Lipton Ice Tea Lemon Hindustan Unilever Ltd 0.2 0.2 0.2 0.2 Others 15.2 16.8 15.0 13.3 Total 100.0 100.0 100.0 100.0
Source: Euromonitor International from official statistics, trade associations, trade press, company research, store checks, trade interviews, trade sources
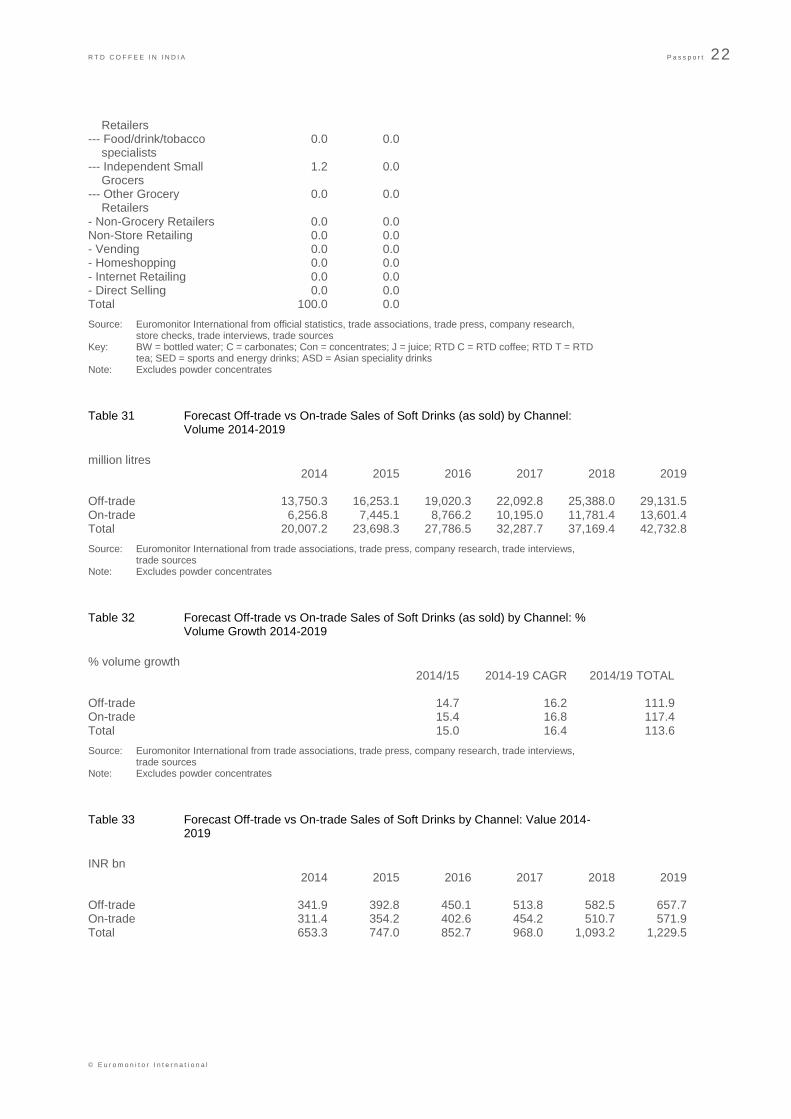
Table 30 Distribution of Off-trade Soft Drinks (as sold) by Format and Category: % Volume 2014
% off-trade BW C Con F/VJ RTD C RTD T Store-Based Retailing 79.0 100.0 100.0 100.0 0.0 100.0 - Grocery Retailers 79.0 100.0 100.0 100.0 0.0 100.0 -- Modern Grocery 12.1 11.8 18.1 29.8 0.0 95.7 Retailers --- Convenience Stores 0.0 1.5 0.8 2.3 0.0 0.3 --- Discounters 0.0 0.0 0.0 0.0 0.0 0.0 --- Forecourt Retailers 0.1 0.2 0.0 0.2 0.0 0.3 --- Hypermarkets 7.0 5.7 9.9 16.5 0.0 55.0 --- Supermarkets 5.0 4.4 7.4 10.8 0.0 40.0 -- Traditional Grocery 66.9 88.2 81.9 70.3 0.0 4.3 Retailers --- Food/drink/tobacco 0.0 0.0 0.0 0.0 0.0 0.0 specialists --- Independent Small 62.5 81.5 78.8 66.0 0.0 4.3 Grocers --- Other Grocery 4.4 6.7 3.1 4.3 0.0 0.0 Retailers - Non-Grocery Retailers 0.0 0.0 0.0 0.0 0.0 0.0 Non-Store Retailing 21.0 0.0 0.0 0.0 0.0 0.0 - Vending 0.0 0.0 0.0 0.0 0.0 0.0 - Homeshopping 0.0 0.0 0.0 0.0 0.0 0.0 - Internet Retailing 0.0 0.0 0.0 0.0 0.0 0.0 - Direct Selling 21.0 0.0 0.0 0.0 0.0 0.0 Total 100.0 100.0 100.0 100.0 0.0 100.0 SED ASD Store-Based Retailing 100.0 0.0 - Grocery Retailers 100.0 0.0 -- Modern Grocery 98.8 0.0 Retailers --- Convenience Stores 0.5 0.0 --- Discounters 0.0 0.0 --- Forecourt Retailers 0.3 0.0 --- Hypermarkets 55.0 0.0 --- Supermarkets 43.0 0.0 -- Traditional Grocery 1.2 0.0
R T D C O F F E E I N I N D I A P a s s p o r t 22
© E u r o m o n i t o r I n t e r n a t i o n a l
Retailers --- Food/drink/tobacco 0.0 0.0 specialists --- Independent Small 1.2 0.0 Grocers --- Other Grocery 0.0 0.0 Retailers - Non-Grocery Retailers 0.0 0.0 Non-Store Retailing 0.0 0.0 - Vending 0.0 0.0 - Homeshopping 0.0 0.0 - Internet Retailing 0.0 0.0 - Direct Selling 0.0 0.0 Total 100.0 0.0
Source: Euromonitor International from official statistics, trade associations, trade press, company research, store checks, trade interviews, trade sources
Key: BW = bottled water; C = carbonates; Con = concentrates; J = juice; RTD C = RTD coffee; RTD T = RTD tea; SED = sports and energy drinks; ASD = Asian speciality drinks
Note: Excludes powder concentrates
Table 31 Forecast Off-trade vs On-trade Sales of Soft Drinks (as sold) by Channel: Volume 2014-2019
million litres 2014 2015 2016 2017 2018 2019 Off-trade 13,750.3 16,253.1 19,020.3 22,092.8 25,388.0 29,131.5 On-trade 6,256.8 7,445.1 8,766.2 10,195.0 11,781.4 13,601.4 Total 20,007.2 23,698.3 27,786.5 32,287.7 37,169.4 42,732.8
Source: Euromonitor International from trade associations, trade press, company research, trade interviews, trade sources
Note: Excludes powder concentrates
Table 32 Forecast Off-trade vs On-trade Sales of Soft Drinks (as sold) by Channel: % Volume Growth 2014-2019
% volume growth 2014/15 2014-19 CAGR 2014/19 TOTAL Off-trade 14.7 16.2 111.9 On-trade 15.4 16.8 117.4 Total 15.0 16.4 113.6
Source: Euromonitor International from trade associations, trade press, company research, trade interviews, trade sources
Note: Excludes powder concentrates
Table 33 Forecast Off-trade vs On-trade Sales of Soft Drinks by Channel: Value 2014-2019
INR bn 2014 2015 2016 2017 2018 2019 Off-trade 341.9 392.8 450.1 513.8 582.5 657.7 On-trade 311.4 354.2 402.6 454.2 510.7 571.9 Total 653.3 747.0 852.7 968.0 1,093.2 1,229.5
R T D C O F F E E I N I N D I A P a s s p o r t 23
© E u r o m o n i t o r I n t e r n a t i o n a l
Source: Euromonitor International from trade associations, trade press, company research, trade interviews, trade sources
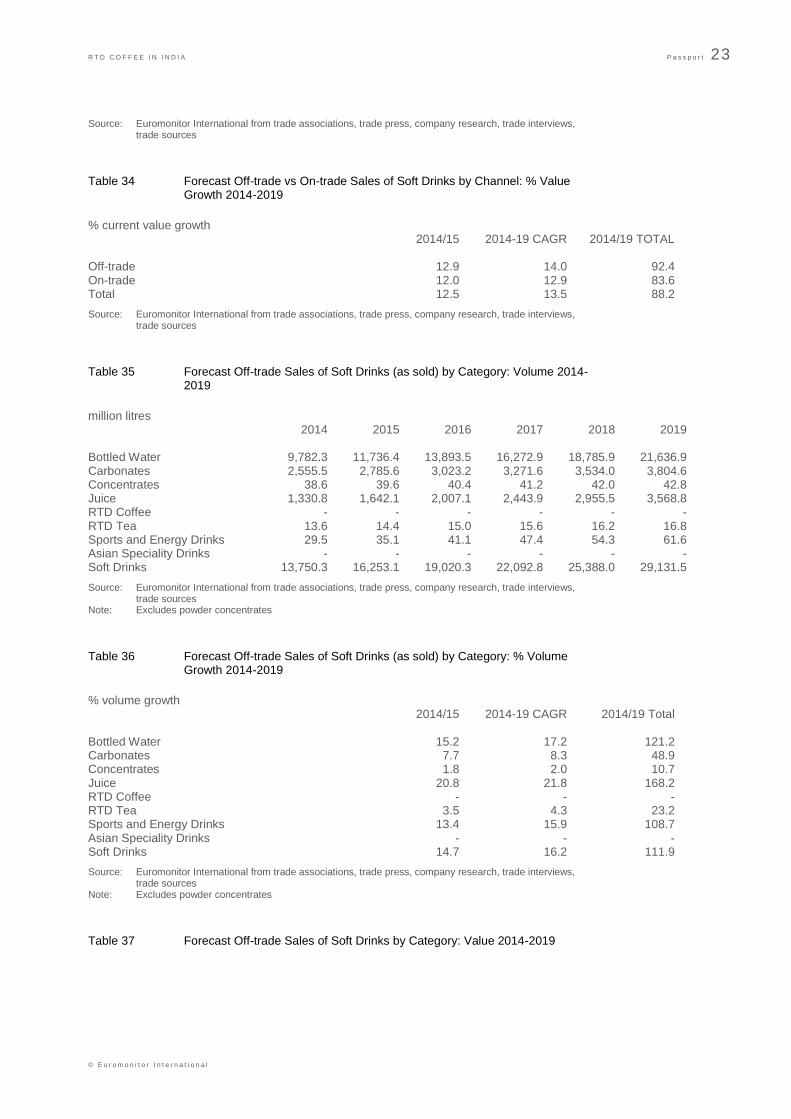
Table 34 Forecast Off-trade vs On-trade Sales of Soft Drinks by Channel: % Value Growth 2014-2019
% current value growth 2014/15 2014-19 CAGR 2014/19 TOTAL Off-trade 12.9 14.0 92.4 On-trade 12.0 12.9 83.6 Total 12.5 13.5 88.2
Source: Euromonitor International from trade associations, trade press, company research, trade interviews, trade sources
Table 35 Forecast Off-trade Sales of Soft Drinks (as sold) by Category: Volume 2014-2019
million litres 2014 2015 2016 2017 2018 2019 Bottled Water 9,782.3 11,736.4 13,893.5 16,272.9 18,785.9 21,636.9 Carbonates 2,555.5 2,785.6 3,023.2 3,271.6 3,534.0 3,804.6 Concentrates 38.6 39.6 40.4 41.2 42.0 42.8 Juice 1,330.8 1,642.1 2,007.1 2,443.9 2,955.5 3,568.8 RTD Coffee - - - - - - RTD Tea 13.6 14.4 15.0 15.6 16.2 16.8 Sports and Energy Drinks 29.5 35.1 41.1 47.4 54.3 61.6 Asian Speciality Drinks - - - - - - Soft Drinks 13,750.3 16,253.1 19,020.3 22,092.8 25,388.0 29,131.5
Source: Euromonitor International from trade associations, trade press, company research, trade interviews, trade sources
Note: Excludes powder concentrates
Table 36 Forecast Off-trade Sales of Soft Drinks (as sold) by Category: % Volume Growth 2014-2019
% volume growth 2014/15 2014-19 CAGR 2014/19 Total Bottled Water 15.2 17.2 121.2 Carbonates 7.7 8.3 48.9 Concentrates 1.8 2.0 10.7 Juice 20.8 21.8 168.2 RTD Coffee - - - RTD Tea 3.5 4.3 23.2 Sports and Energy Drinks 13.4 15.9 108.7 Asian Speciality Drinks - - - Soft Drinks 14.7 16.2 111.9
Source: Euromonitor International from trade associations, trade press, company research, trade interviews, trade sources
Note: Excludes powder concentrates
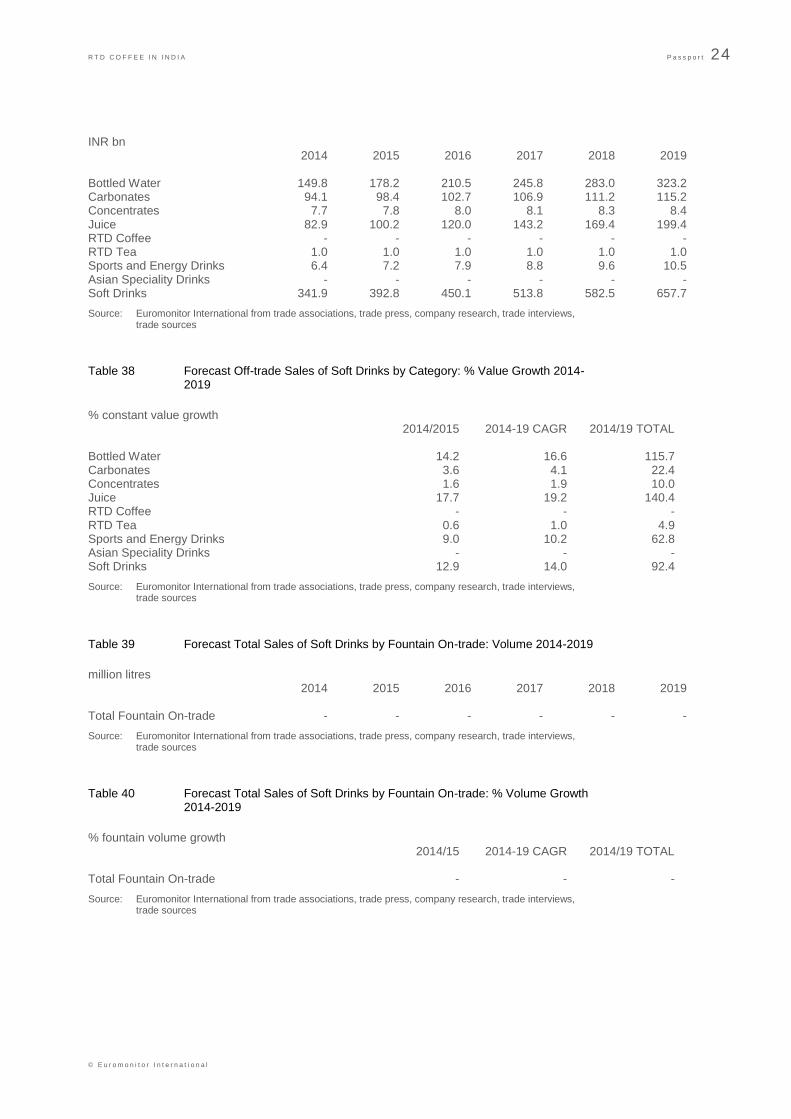
Table 37 Forecast Off-trade Sales of Soft Drinks by Category: Value 2014-2019
R T D C O F F E E I N I N D I A P a s s p o r t 24
© E u r o m o n i t o r I n t e r n a t i o n a l
INR bn 2014 2015 2016 2017 2018 2019 Bottled Water 149.8 178.2 210.5 245.8 283.0 323.2 Carbonates 94.1 98.4 102.7 106.9 111.2 115.2 Concentrates 7.7 7.8 8.0 8.1 8.3 8.4 Juice 82.9 100.2 120.0 143.2 169.4 199.4 RTD Coffee - - - - - - RTD Tea 1.0 1.0 1.0 1.0 1.0 1.0 Sports and Energy Drinks 6.4 7.2 7.9 8.8 9.6 10.5 Asian Speciality Drinks - - - - - - Soft Drinks 341.9 392.8 450.1 513.8 582.5 657.7
Source: Euromonitor International from trade associations, trade press, company research, trade interviews, trade sources
Table 38 Forecast Off-trade Sales of Soft Drinks by Category: % Value Growth 2014-2019
% constant value growth 2014/2015 2014-19 CAGR 2014/19 TOTAL Bottled Water 14.2 16.6 115.7 Carbonates 3.6 4.1 22.4 Concentrates 1.6 1.9 10.0 Juice 17.7 19.2 140.4 RTD Coffee - - - RTD Tea 0.6 1.0 4.9 Sports and Energy Drinks 9.0 10.2 62.8 Asian Speciality Drinks - - - Soft Drinks 12.9 14.0 92.4
Source: Euromonitor International from trade associations, trade press, company research, trade interviews, trade sources
Table 39 Forecast Total Sales of Soft Drinks by Fountain On-trade: Volume 2014-2019
million litres 2014 2015 2016 2017 2018 2019 Total Fountain On-trade - - - - - -
Source: Euromonitor International from trade associations, trade press, company research, trade interviews, trade sources
Table 40 Forecast Total Sales of Soft Drinks by Fountain On-trade: % Volume Growth 2014-2019
% fountain volume growth 2014/15 2014-19 CAGR 2014/19 TOTAL Total Fountain On-trade - - -
Source: Euromonitor International from trade associations, trade press, company research, trade interviews, trade sources

R T D C O F F E E I N I N D I A P a s s p o r t 25
© E u r o m o n i t o r I n t e r n a t i o n a l
Table 41 Forecast Off-trade Sales of Soft Drinks (as sold) by Region: Volume 2014-2019
million litres 2014 2015 2016 2017 2018 2019 East and Northeast India 1,274.9 1,486.6 1,723.9 1,989.7 2,288.1 2,627.2 North India 4,861.3 5,783.2 6,794.9 7,931.8 9,187.5 10,596.4 South India 3,348.4 3,985.1 4,684.3 5,435.9 6,189.7 7,058.3 West India 4,265.7 4,998.2 5,817.2 6,735.4 7,722.7 8,849.6 India 13,750.3 16,253.1 19,020.3 22,092.8 25,388.0 29,131.5
Source: Euromonitor International from trade associations, trade press, company research, trade interviews, trade sources
Note: Excludes powder concentrates
Table 42 Forecast Off-trade Sales of Soft Drinks (as sold) by Region: % Volume Growth 2014-2019
% volume growth 2014/2015 2014-19 CAGR 2014/19 TOTAL East and Northeast India 14.8 15.6 106.1 North India 15.3 16.9 118.0 South India 14.0 16.1 110.8 West India 14.6 15.7 107.5 India 14.7 16.2 111.9
Source: Euromonitor International from trade associations, trade press, company research, trade interviews, trade sources
Note: Excludes powder concentrates
Table 43 Forecast Off-trade Sales of Soft Drinks (as sold) by Region: Value 2014-2019
INR bn 2014 2015 2016 2017 2018 2019 East and Northeast India 34.7 38.9 43.7 48.8 54.4 60.5 North India 124.3 143.2 164.2 187.9 213.7 241.6 South India 78.5 90.9 104.9 119.8 135.3 152.1 West India 104.4 119.8 137.4 157.3 179.1 203.5 India 341.9 392.8 450.1 513.8 582.5 657.7
Source: Euromonitor International from trade associations, trade press, company research, trade interviews, trade sources
Note: Excludes powder concentrates
Table 44 Forecast Off-trade Sales of Soft Drinks (as sold) by Region: % Value Growth 2014-2019
% constant value growth 2014/2015 2014-19 CAGR 2014/19 TOTAL East and Northeast India 11.1 11.8 74.4 North India 13.1 14.2 94.4 South India 12.5 14.1 93.6 West India 13.6 14.3 94.9 India 12.9 14.0 92.4
R T D C O F F E E I N I N D I A P a s s p o r t 26
© E u r o m o n i t o r I n t e r n a t i o n a l
Source: Euromonitor International from trade associations, trade press, company research, trade interviews, trade sources
Note: Excludes powder concentrates
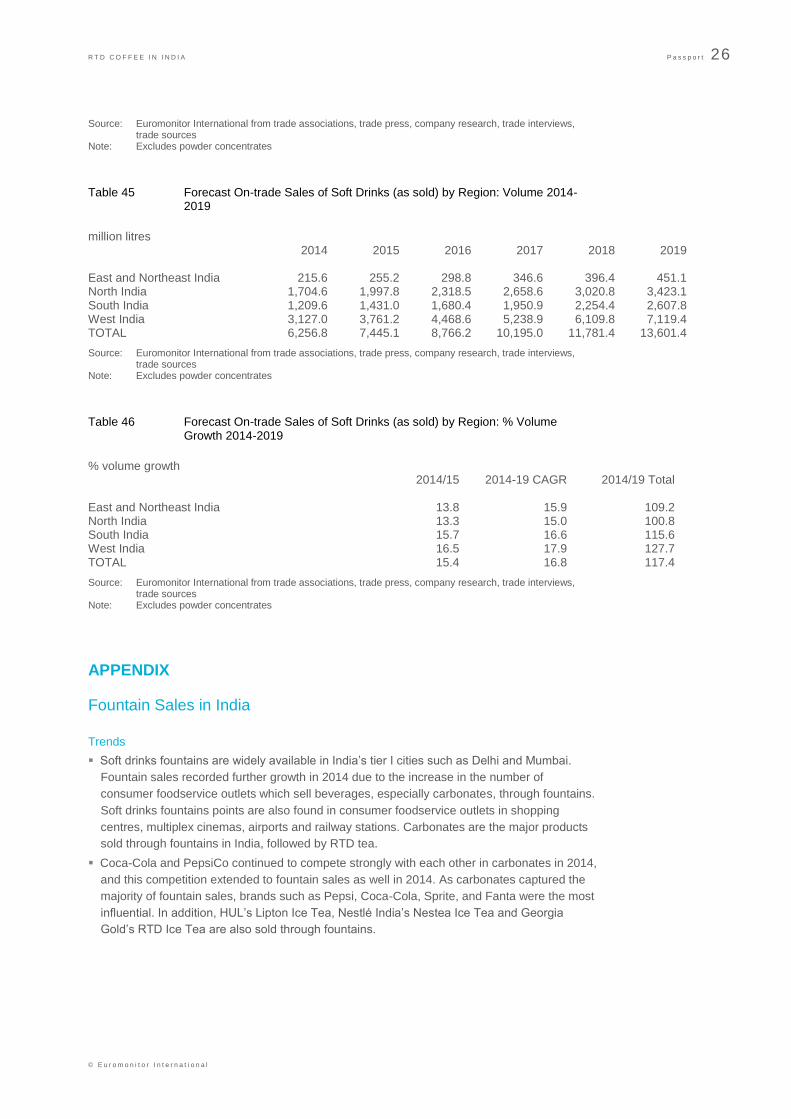
Table 45 Forecast On-trade Sales of Soft Drinks (as sold) by Region: Volume 2014-2019
million litres 2014 2015 2016 2017 2018 2019 East and Northeast India 215.6 255.2 298.8 346.6 396.4 451.1 North India 1,704.6 1,997.8 2,318.5 2,658.6 3,020.8 3,423.1 South India 1,209.6 1,431.0 1,680.4 1,950.9 2,254.4 2,607.8 West India 3,127.0 3,761.2 4,468.6 5,238.9 6,109.8 7,119.4 TOTAL 6,256.8 7,445.1 8,766.2 10,195.0 11,781.4 13,601.4
Source: Euromonitor International from trade associations, trade press, company research, trade interviews, trade sources
Note: Excludes powder concentrates
Table 46 Forecast On-trade Sales of Soft Drinks (as sold) by Region: % Volume Growth 2014-2019
% volume growth 2014/15 2014-19 CAGR 2014/19 Total East and Northeast India 13.8 15.9 109.2 North India 13.3 15.0 100.8 South India 15.7 16.6 115.6 West India 16.5 17.9 127.7 TOTAL 15.4 16.8 117.4
Source: Euromonitor International from trade associations, trade press, company research, trade interviews, trade sources
Note: Excludes powder concentrates
APPENDIX
Fountain Sales in India
Trends
Soft drinks fountains are widely available in India’s tier I cities such as Delhi and Mumbai.
Fountain sales recorded further growth in 2014 due to the increase in the number of
consumer foodservice outlets which sell beverages, especially carbonates, through fountains.
Soft drinks fountains points are also found in consumer foodservice outlets in shopping
centres, multiplex cinemas, airports and railway stations. Carbonates are the major products
sold through fountains in India, followed by RTD tea.
Coca-Cola and PepsiCo continued to compete strongly with each other in carbonates in 2014,
and this competition extended to fountain sales as well in 2014. As carbonates captured the
majority of fountain sales, brands such as Pepsi, Coca-Cola, Sprite, and Fanta were the most
influential. In addition, HUL’s Lipton Ice Tea, Nestlé India’s Nestea Ice Tea and Georgia
Gold’s RTD Ice Tea are also sold through fountains.

R T D C O F F E E I N I N D I A P a s s p o r t 27
© E u r o m o n i t o r I n t e r n a t i o n a l
Fountain sales through convenience stores remained negligible at the end of the review
period and foodservice channels remained the major contributors to fountain sales in 2014.
Within foodservice sales, leisure chains such as multiplex cinemas and chained fast food
outlets such as McDonald’s contributed the majority of sales in 2014.
Over the forecast period, fountain sales of soft drinks are expected to grow in direct
correlation with the increase in the number of consumer foodservice outlets and growing
demand for carbonates. It is thus expected that carbonates and RTD tea will remain the most
popular categories for fountain sales as fountain sales are yet to be introduced in other soft
drinks categories. Fountain sales of soft drinks are expected to increase in volume at a CAGR
of 4% over the forecast period.
SOURCES Sources used during the research included the following:
Summary 1 Research Sources
Official Sources Agricultural & Processed Food Products Export Development Authority (APEDA)
Agriculture & Agri-Food Canada
Federation of Indian Chambers of Commerce & Industry
Ministry of Food Processing Industries
Ministry of Food Processing Industry
United States Department of Agriculture (USDA) Foreign Agricultural Service (FAS)
Trade Associations Asia Bottled Water Association
Association of Bottled Water
Coffee Board of India
Confederation of Indian Food Trade & Industry
Confederation of Indian Industry (CII)
Federation of Indian Chambers & Commerce of Industry
India Coffee Depot
India Tea Promoters Bureau
Indian Soft Drinks Manufacturers Association
Indian Tea Association
International Bottled Water Association
International Council of Bottled Water Associations (ICBWA)
International Federation of Fruit Juice Producers
Kho-Cha Darjeeling Tea Bureau
MOFPI
PHD Chamber of Commerce & Industry

R T D C O F F E E I N I N D I A P a s s p o r t 28
© E u r o m o n i t o r I n t e r n a t i o n a l
Tea board of India
The Associated Chambers Of Commerce & Industry Of India
UNESDA & CISDA
Trade Press 2point6billion.com
Beverage Digest
Beverage Net
Beverage World
BeverAsia
Business India
Business Standard
Business Today
Business World
Capital Market
Catalyst (Business Standard supplement)
Commodity India
Domain-b
Economic Times, The
Equity Master
Express Hotelier & Caterer
Financial Express, The
Food & Beverage News
Food Industry India
Foodandbeverages.in
Foodbev.com
Free Press Journal
Hindu Business Line, The
Hindu, The
Hindustan Times
India Brand Equity Foundation
India Buzz info
India Earnings
India Infoline
India Retailing
India Times
India Today
Indian Express
Indian Industry Tracker
IndianTelevision.com
R T D C O F F E E I N I N D I A P a s s p o r t 29
© E u r o m o n i t o r I n t e r n a t i o n a l
Live Mint
Mag India
Money Control
NDTV
Outlook Money
Retail Asia
Reuters India
Soft Drinks International
The Financial Express
The Hindu
This week Bangalore
Times Food Processing Journal
Times of India
Tribune, The
Source: Euromonitor International


