Embed Size (px)
Citation preview
RUGBY WORLD CUP 2015 STATISTICAL REPORT WORLD RUGBYTM GAME ANALYSIS
RUGBY WORLD CUP 2015 STATISTICAL REPORT WORLD RUGBYTM GAME ANALYSIS
2 RWC 2015 STATISTICAL REPORT – WORLD RUGBY GAME ANALYSIS 2 Filename/Filepath
RESULTS AND STANDINGS
POOL A
P = Played W = Won D = Draw L = Lost PF = Points for PA = Points against PD = Points difference TF = Tries for
TA = Tries against PTS = Points
P W D L PF PA PD TF TA BP PTS
AUSTRALIA 4 4 0 0 141 35 +106 17 2 1 17
WALES 4 3 0 1 111 62 +49 11 2 1 13
ENGLAND 4 2 0 2 133 75 +58 16 5 3 11
FIJI 4 1 0 3 84 101 -17 10 11 1 5
URUGUAY 4 0 0 4 30 226 -196 2 36 0 0
ENGLAND 35-11 FIJI
WALES 54-9 URUGUAY
AUSTRALIA 28-13 FIJI
ENGLAND 25-28 WALES
AUSTRALIA 65-3 URUGUAY
WALES 23-13 FIJI
ENGLAND 13-33 AUSTRALIA
FIJI 47-15 URUGUAY
AUSTRALIA 15-6 WALES
ENGLAND 60-3 URUGUAY
RUGBY WORLD CUP 2015 STATISTICAL REPORT WORLD RUGBYTM GAME ANALYSIS
RWC 2015 STATISTICAL REPORT – WORLD RUGBYTM GAME ANALYSIS 3
POOL B
P = Played W = Won D = Draw L = Lost PF = Points for PA = Points against PD = Points difference TF = Tries for
TA = Tries against PTS = Points
P W D L PF PA PD TF TA BP PTS
SOUTH AFRICA 4 3 0 1 176 56 +120 23 4 4 16
SCOTLAND 4 3 0 1 136 93 +43 14 9 2 14
JAPAN 4 3 0 1 98 100 -2 9 12 0 12
SAMOA 4 1 0 3 69 124 -55 7 13 2 6
USA 4 0 0 4 50 156 -106 5 20 0 0
SOUTH AFRICA 32-34 JAPAN
SAMOA 25-16 USA
SCOTLAND 45-10 JAPAN
SOUTH AFRICA 46-6 SAMOA
SCOTLAND 39-16 USA
SAMOA 5-26 JAPAN
SOUTH AFRICA 34-16 SCOTLAND
SOUTH AFRICA 64-0 USA
SAMOA 33-36 SCOTLAND
USA 18-28 JAPAN
RUGBY WORLD CUP 2015 STATISTICAL REPORT WORLD RUGBYTM GAME ANALYSIS
4 RWC 2015 STATISTICAL REPORT – WORLD RUGBY GAME ANALYSIS 4 Filename/Filepath
POOL C
P = Played W = Won D = Draw L = Lost PF = Points for PA = Points against PD = Points difference TF = Tries for
TA = Tries against PTS = Points
P W D L PF PA PD TF TA BP PTS
NEW ZEALAND 4 4 0 0 174 49 +125 25 3 3 19
ARGENTINA 4 3 0 1 179 70 +109 22 7 3 15
GEORGIA 4 2 0 2 53 123 -70 5 16 0 8
TONGA 4 1 0 3 70 130 -60 8 17 2 6
NAMIBIA 4 0 0 4 70 174 -104 8 25 1 1
TONGA 10-17 GEORGIA
NEW ZEALAND 26-16 ARGENTINA
NEW ZEALAND 58-14 NAMIBIA
ARGENTINA 54-9 GEORGIA
TONGA 35-21 NAMIBIA
NEW ZEALAND 43-10 GEORGIA
ARGENTINA 45-16 TONGA
NAMIBIA 16-17 GEORGIA
NEW ZEALAND 47-9 TONGA
ARGENTINA 64-19 NAMIBIA
RUGBY WORLD CUP 2015 STATISTICAL REPORT WORLD RUGBYTM GAME ANALYSIS
RWC 2015 STATISTICAL REPORT – WORLD RUGBYTM GAME ANALYSIS 5
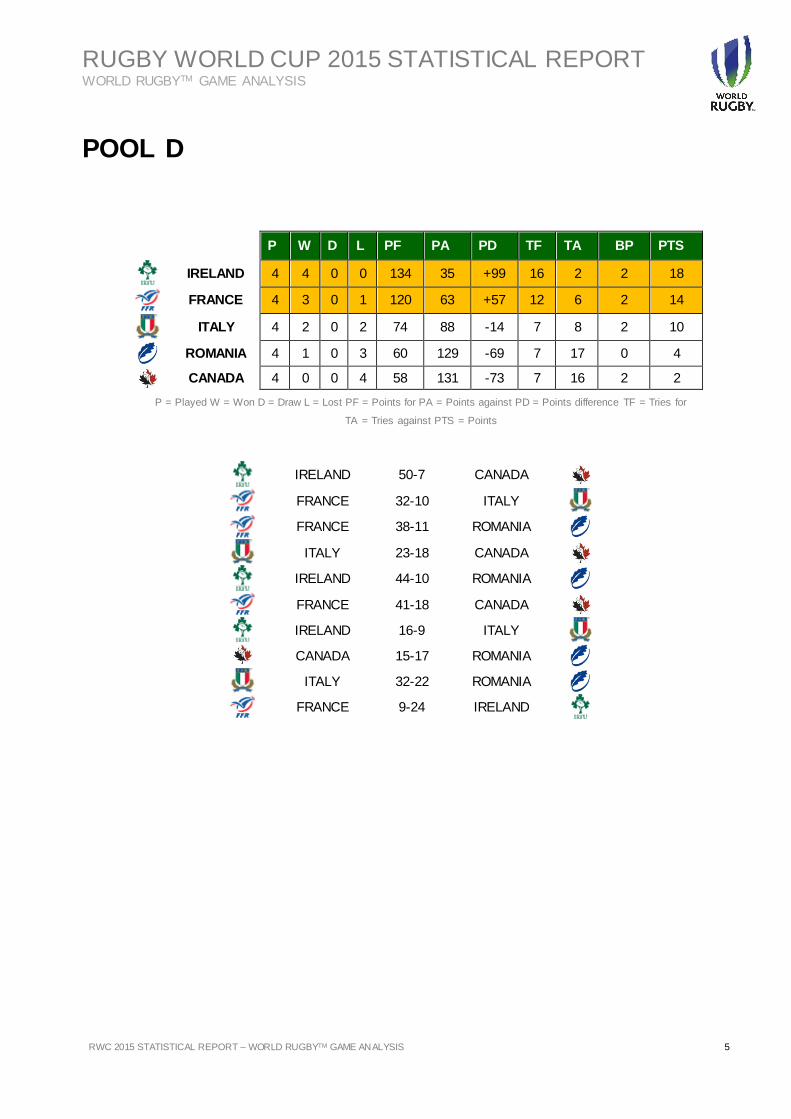
POOL D
P = Played W = Won D = Draw L = Lost PF = Points for PA = Points against PD = Points difference TF = Tries for
TA = Tries against PTS = Points
P W D L PF PA PD TF TA BP PTS
IRELAND 4 4 0 0 134 35 +99 16 2 2 18
FRANCE 4 3 0 1 120 63 +57 12 6 2 14
ITALY 4 2 0 2 74 88 -14 7 8 2 10
ROMANIA 4 1 0 3 60 129 -69 7 17 0 4
CANADA 4 0 0 4 58 131 -73 7 16 2 2
IRELAND 50-7 CANADA
FRANCE 32-10 ITALY
FRANCE 38-11 ROMANIA
ITALY 23-18 CANADA
IRELAND 44-10 ROMANIA
FRANCE 41-18 CANADA
IRELAND 16-9 ITALY
CANADA 15-17 ROMANIA
ITALY 32-22 ROMANIA
FRANCE 9-24 IRELAND
RUGBY WORLD CUP 2015 STATISTICAL REPORT WORLD RUGBYTM GAME ANALYSIS
6 RWC 2015 STATISTICAL REPORT – WORLD RUGBY GAME ANALYSIS 6 Filename/Filepath
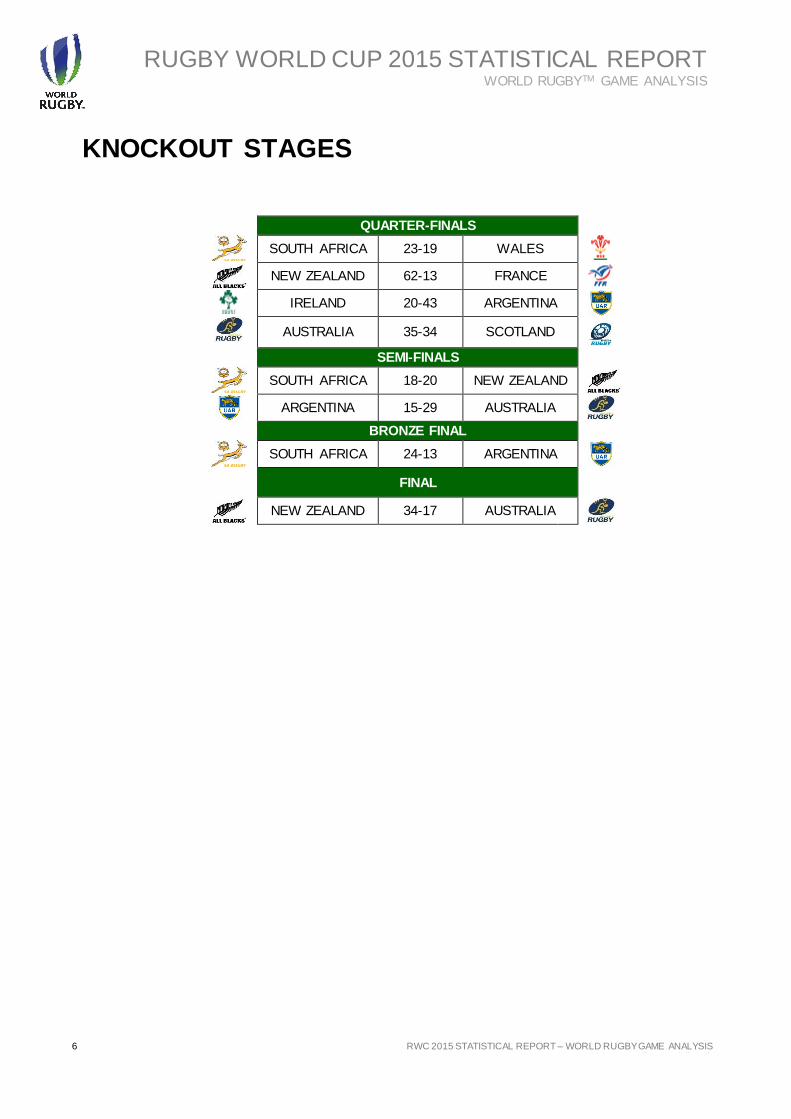
KNOCKOUT STAGES
QUARTER-FINALS
SOUTH AFRICA 23-19 WALES
NEW ZEALAND 62-13 FRANCE
IRELAND 20-43 ARGENTINA
AUSTRALIA 35-34 SCOTLAND
SEMI-FINALS
SOUTH AFRICA 18-20 NEW ZEALAND
ARGENTINA 15-29 AUSTRALIA
BRONZE FINAL
SOUTH AFRICA 24-13 ARGENTINA
FINAL
NEW ZEALAND 34-17 AUSTRALIA
RUGBY WORLD CUP 2015 STATISTICAL REPORT WORLD RUGBYTM GAME ANALYSIS
RWC 2015 STATISTICAL REPORT – WORLD RUGBYTM GAME ANALYSIS 7
COMMENTARY
It has been noted in past Rugby World Cup commentaries that all tournaments are remembered for a range of reasons including spectacular tries, exciting contests and memorable team performances
with RWC 2015 having such events in abundance. The overall high quality and positivity of rugby on show at RWC 2015 was noticeable for all to see from start to finish. RWC 2015 culminated with a spectacular final and may well have produced a tournament with a wider and more long-lasting significance. This significance emerged in two areas:
1. The domination of the southern hemisphere tier one teams 2. The improvement in performance of tier two teams
The Rugby World Cup 2015 final produced an absorbing and thrilling game, one that was exceptional in the context of previous RWC finals. Excluding 1987, the subsequent six finals produced a total of just seven tries and 37 penalty goals, which is a ratio of one try to five penalty goals. Six of the 12 finalists failed to score a single try and only one of the remaining six teams managed to score more
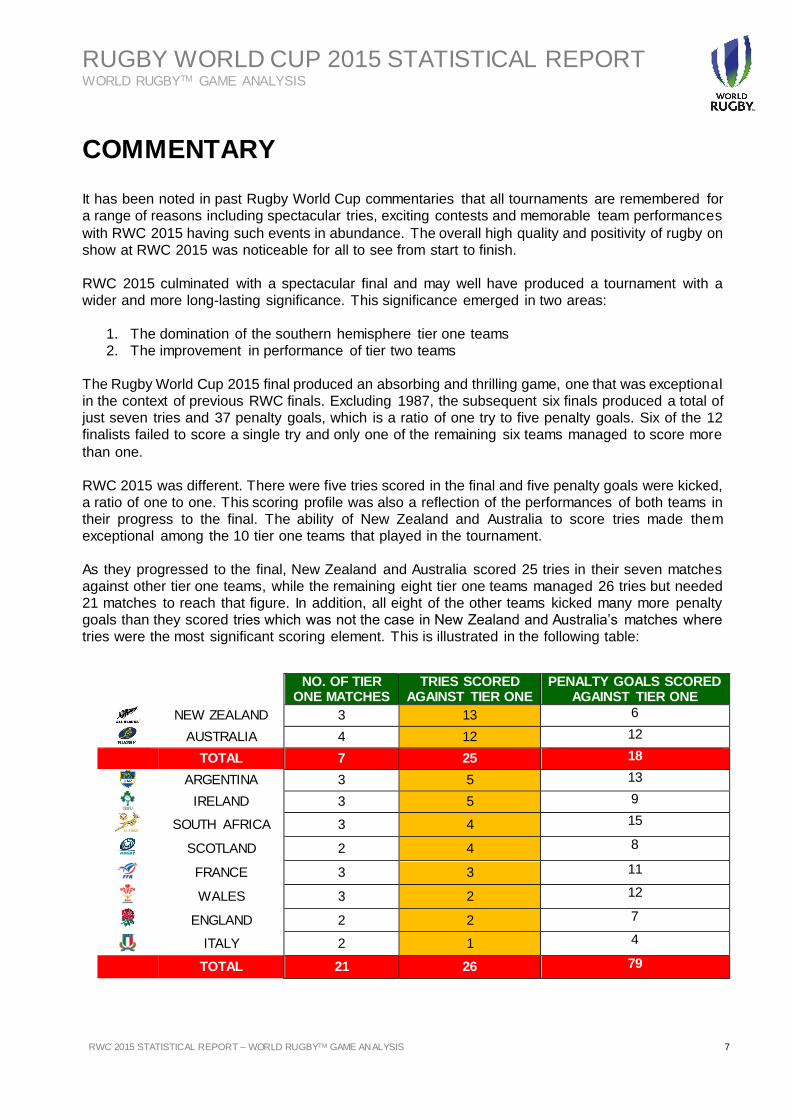
than one. RWC 2015 was different. There were five tries scored in the final and five penalty goals were kicked, a ratio of one to one. This scoring profile was also a reflection of the performances of both teams in their progress to the final. The ability of New Zealand and Australia to score tries made them exceptional among the 10 tier one teams that played in the tournament. As they progressed to the final, New Zealand and Australia scored 25 tries in their seven matches against other tier one teams, while the remaining eight tier one teams managed 26 tries but needed 21 matches to reach that figure. In addition, all eight of the other teams kicked many more penalty goals than they scored tries which was not the case in New Zealand and Australia’s matches where tries were the most significant scoring element. This is illustrated in the following table:
NO. OF TIER ONE MATCHES
TRIES SCORED AGAINST TIER ONE
PENALTY GOALS SCORED AGAINST TIER ONE
NEW ZEALAND 3 13 6
AUSTRALIA 4 12 12
TOTAL 7 25 18
ARGENTINA 3 5 13
IRELAND 3 5 9
SOUTH AFRICA 3 4 15
SCOTLAND 2 4 8
FRANCE 3 3 11
WALES 3 2 12
ENGLAND 2 2 7
ITALY 2 1 4
TOTAL 21 26 79
RUGBY WORLD CUP 2015 STATISTICAL REPORT WORLD RUGBYTM GAME ANALYSIS
8 RWC 2015 STATISTICAL REPORT – WORLD RUGBY GAME ANALYSIS 8 Filename/Filepath
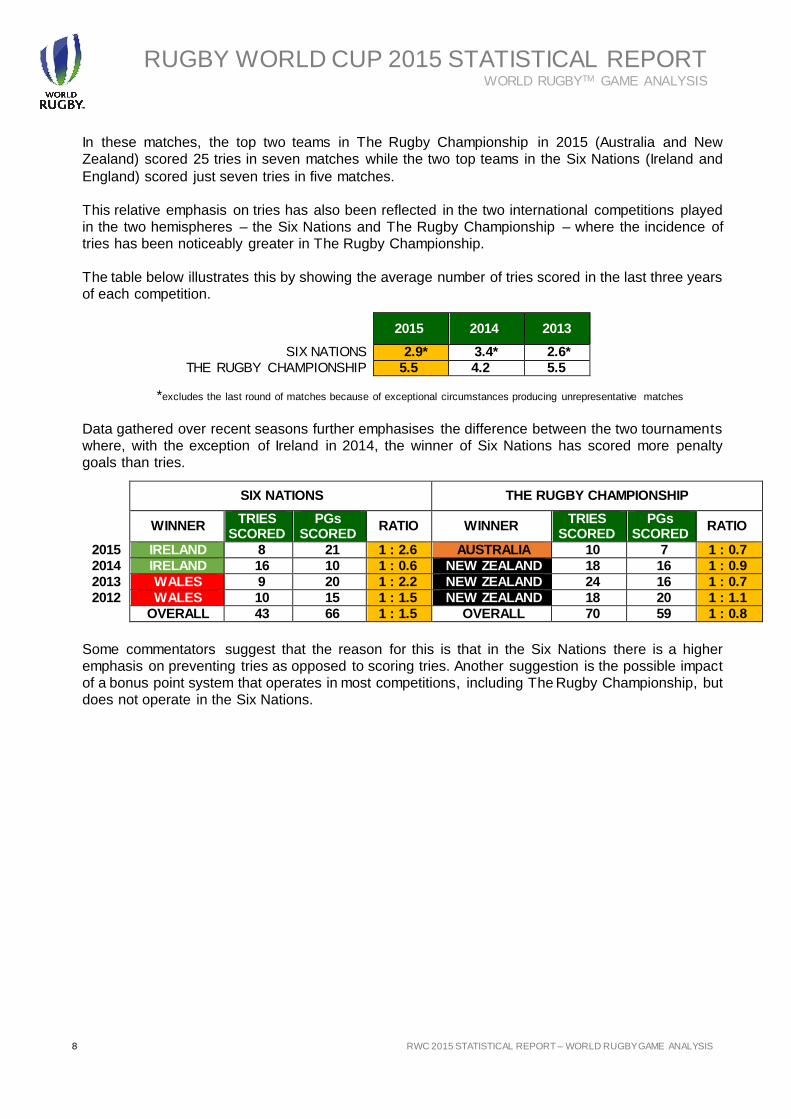
In these matches, the top two teams in The Rugby Championship in 2015 (Australia and New Zealand) scored 25 tries in seven matches while the two top teams in the Six Nations (Ireland and
England) scored just seven tries in five matches. This relative emphasis on tries has also been reflected in the two international competitions played in the two hemispheres – the Six Nations and The Rugby Championship – where the incidence of tries has been noticeably greater in The Rugby Championship. The table below illustrates this by showing the average number of tries scored in the last three years of each competition.
*excludes the last round of matches because of exceptional circumstances producing unrepresentative matches
Data gathered over recent seasons further emphasises the difference between the two tournaments where, with the exception of Ireland in 2014, the winner of Six Nations has scored more penalty goals than tries.
Some commentators suggest that the reason for this is that in the Six Nations there is a higher emphasis on preventing tries as opposed to scoring tries. Another suggestion is the possible impact of a bonus point system that operates in most competitions, including The Rugby Championship, but does not operate in the Six Nations.
AVERAGE NO OF TRIES PER GAME
2015 2014 2013
SIX NATIONS 2.9* 3.4* 2.6*
THE RUGBY CHAMPIONSHIP 5.5 4.2 5.5
SIX NATIONS THE RUGBY CHAMPIONSHIP
WINNER TRIES
SCORED PGs
SCORED RATIO WINNER
TRIES SCORED
PGs SCORED
RATIO
2015 IRELAND 8 21 1 : 2.6 AUSTRALIA 10 7 1 : 0.7
2014 IRELAND 16 10 1 : 0.6 NEW ZEALAND 18 16 1 : 0.9
2013 WALES 9 20 1 : 2.2 NEW ZEALAND 24 16 1 : 0.7
2012 WALES 10 15 1 : 1.5 NEW ZEALAND 18 20 1 : 1.1
OVERALL 43 66 1 : 1.5 OVERALL 70 59 1 : 0.8
RUGBY WORLD CUP 2015 STATISTICAL REPORT WORLD RUGBYTM GAME ANALYSIS
RWC 2015 STATISTICAL REPORT – WORLD RUGBYTM GAME ANALYSIS 9
NEW ZEALAND Champions New Zealand won all seven matches scoring more tries than their opponents in every match, whilst winning four of these matches by 30 points or more. They produced the following performance highlights:
In total, New Zealand scored 39 tries, 11 penalty goals and 2 drop goals, with 67% of their
points coming from tries
New Zealand’s average points scored and conceded was similar in the pool and knockout stage
They scored an average of 44 points in the pool stage and an average of 39 points in the knockout stages
They conceded an average of 12 points in the pool stage and an average of 16 points in the
knockout stage
New Zealand also scored and conceded tries at similar rates in the pool and knockout stage
They scored a try every 171 seconds in the pool stage and every 233 seconds in the knockout stage
They conceded a try every 1131 seconds in the pool stage and every 1032 seconds in the knockout stage
New Zealand attempted 12 penalty goals and only missed one,
They also attempted three drop goals during the knock out stage, successfully kicking two
New Zealand were most likely to produce a passing movement of three or more passes, in fact they had the highest proportion of passes made by the backs, they collectively passed nearly as many as their scrum half
New Zealand forwards also passed more frequent than the average, making a pass every 2.7 possessions
New Zealand also did not lose the ball too often, their ruck retention rate was not exceeded
by any other team
At set piece, New Zealand had a high lineout retention rate, losing one in 22 throw ins while winning one in four on opposition throw ins
New Zealand had a high scrum retention rate, losing only one out of 38 put ins
New Zealand’s scrum was least likely to be reset and one of the least likely to end in a penalty or free kick, this contributed to New Zealand scoring the highest proportion of tries from scrum possession
RUGBY WORLD CUP 2015 STATISTICAL REPORT WORLD RUGBYTM GAME ANALYSIS
10 RWC 2015 STATISTICAL REPORT – WORLD RUGBY GAME ANALYSIS 10 Filename/Filepath
NORTHERN AND SOUTHERN HEMISPHERE
TEAMS For the first time in the Rugby World Cup history, no northern hemisphere team reached the semi-finals of the competition, a fact that has produced considerable debate. One of the explanations of this may be found in examining the build-up to RWC 2015, where in November 2014, 14 matches were played between northern hemisphere and southern hemisphere teams.
An analysis of these matches showed clear differences in approach in many areas of the game between the two groups. Such differences included the following:
Southern hemisphere teams were more effective at scoring tries
Southern hemisphere teams scored 50 per cent more tries than penalty goals while northern
hemisphere teams scored 50 per cent more penalty goals than tries
Of the tries scored from open play, 75 per cent were scored by the four southern hemisphere teams
Of tries starting from inside the scoring teams own half, 75 per cent were scored by the four southern hemisphere teams
The rate of passing and rucking by the finalists – New Zealand and Australia – was greater
than any of the other teams
The southern hemisphere teams kicked less
One in four of southern hemisphere teams’ scrums ended in penalties while the ratio in northern hemisphere teams’ scrums was nearer one in two
What characterised these matches and which was replicated in RWC 2015 was the ability of the southern hemisphere teams to score and accumulate tries through a combination of strategy, vision and skills while still maintaining a committed and effective defence. It also confirmed the fact that in the vast majority of games, it is tries that win matches. In RWC 2011 and RWC 2015 the winning team scored the most tries in 80 per cent of matches. In only three of the 96 matches did the team scoring the fewest tries win. Of the 329 matches played since the inception of Rugby World Cup in 1987, more than 80 per cent were won by the team scoring the most tries and only 14 (or four per cent) were won by the team scoring the fewest tries but kicking the most penalty goals. No final has been won by a team scoring the fewest tries despite the fact that in the six RWC finals before 2015, penalty goals outnumbered tries by a factor of five to
one.
RUGBY WORLD CUP 2015 STATISTICAL REPORT WORLD RUGBYTM GAME ANALYSIS
RWC 2015 STATISTICAL REPORT – WORLD RUGBYTM GAME ANALYSIS 11
PERFORMANCE OF TIER TWO TEAMS While there have been some close matches between tier one and tier two teams in previous Rugby
World Cups, this year’s tournament showed that the difference is narrowing.
The average scoring margin in tier one v tier two matches has become closer in each of the
last four Rugby World Cups
Thirty per cent more tries were scored by tier two teams against tier one teams than in RWC
2011
Two per cent fewer tries were conceded
For more than half the tier two teams, their average losing margin against tier one teams in
2015 was lower than in any of the previous four Rugby World Cups
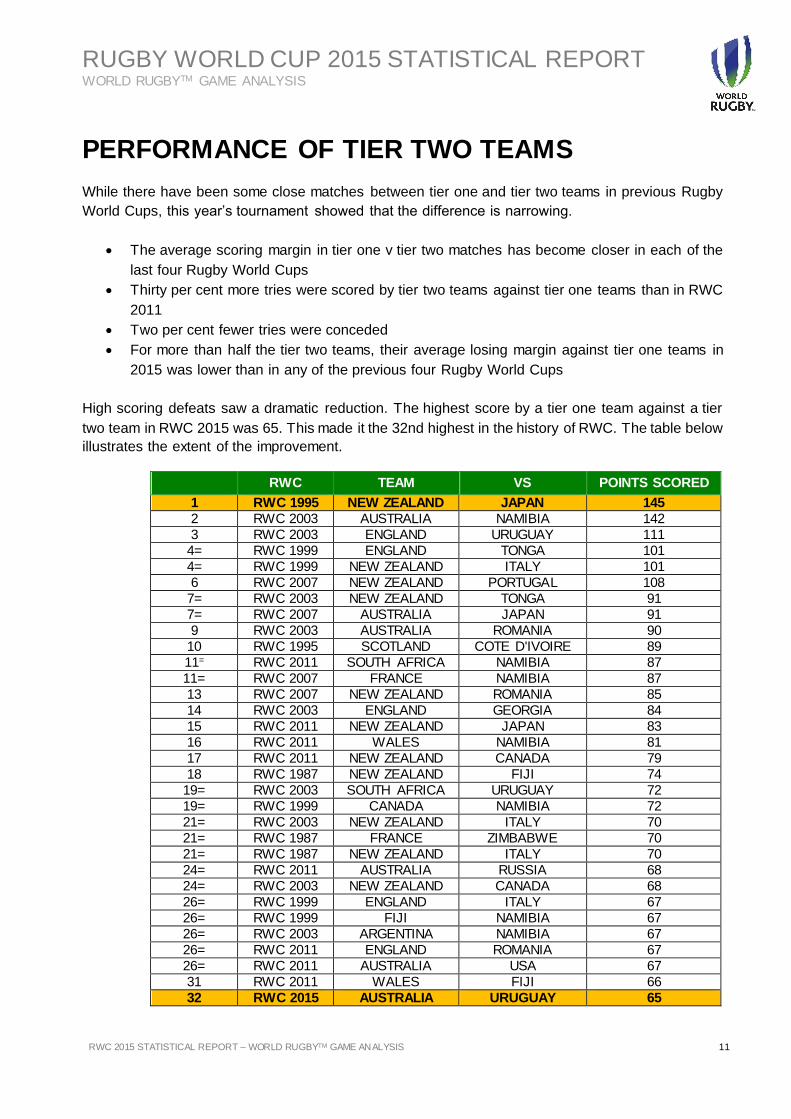
High scoring defeats saw a dramatic reduction. The highest score by a tier one team against a tier
two team in RWC 2015 was 65. This made it the 32nd highest in the history of RWC. The table below
illustrates the extent of the improvement.
RWC TEAM VS POINTS SCORED
1 RWC 1995 NEW ZEALAND JAPAN 145
2 RWC 2003 AUSTRALIA NAMIBIA 142
3 RWC 2003 ENGLAND URUGUAY 111
4= RWC 1999 ENGLAND TONGA 101
4= RWC 1999 NEW ZEALAND ITALY 101
6 RWC 2007 NEW ZEALAND PORTUGAL 108
7= RWC 2003 NEW ZEALAND TONGA 91
7= RWC 2007 AUSTRALIA JAPAN 91
9 RWC 2003 AUSTRALIA ROMANIA 90
10 RWC 1995 SCOTLAND COTE D'IVOIRE 89
11= RWC 2011 SOUTH AFRICA NAMIBIA 87
11= RWC 2007 FRANCE NAMIBIA 87
13 RWC 2007 NEW ZEALAND ROMANIA 85
14 RWC 2003 ENGLAND GEORGIA 84
15 RWC 2011 NEW ZEALAND JAPAN 83
16 RWC 2011 WALES NAMIBIA 81
17 RWC 2011 NEW ZEALAND CANADA 79
18 RWC 1987 NEW ZEALAND FIJI 74
19= RWC 2003 SOUTH AFRICA URUGUAY 72
19= RWC 1999 CANADA NAMIBIA 72
21= RWC 2003 NEW ZEALAND ITALY 70
21= RWC 1987 FRANCE ZIMBABWE 70
21= RWC 1987 NEW ZEALAND ITALY 70
24= RWC 2011 AUSTRALIA RUSSIA 68
24= RWC 2003 NEW ZEALAND CANADA 68
26= RWC 1999 ENGLAND ITALY 67
26= RWC 1999 FIJI NAMIBIA 67
26= RWC 2003 ARGENTINA NAMIBIA 67
26= RWC 2011 ENGLAND ROMANIA 67
26= RWC 2011 AUSTRALIA USA 67
31 RWC 2011 WALES FIJI 66
32 RWC 2015 AUSTRALIA URUGUAY 65
RUGBY WORLD CUP 2015 STATISTICAL REPORT WORLD RUGBYTM GAME ANALYSIS
12 RWC 2015 STATISTICAL REPORT – WORLD RUGBY GAME ANALYSIS 12 Filename/Filepath
The most significant effect on the progress of tier two teams may, however, be the long-term impact of South Africa’s defeat by Japan. The future may judge it one of the seminal matches in the progress
of world rugby. This was a game where a team ranked 13th beat a team ranked third and a previous RWC winner. Both played their strongest teams, both teams had similar preparations and there were no distracting factors such as yellow cards, red cards or any other debateable incidents. Preparation was not the same, however, for Japan’s second match of the tournament. They played against a fresh tier one team, Scotland, just four days after their match against South Africa. After 48 minutes, Scotland led by only 12-10 but in the last 32 minutes of the match Scotland scored a further 33 points. Certain other tier two teams did not perform as well as was expected but others enhanced RWC 2015 with their improved performances.
Fiji had a difficult draw and competed well in a pool that contained three tier one teams with world rankings of second, fourth and fifth, making it the most challenging pool in RWC history.
Georgia were a competitive team and were in a pool that contained two of the semi-finalists and were successful against both tier two opponents, including a team ranked five places higher.
Romania’s pool contained three tier one teams for the third consecutive time, and although
all three matches were lost, more tries were scored and fewer were conceded with margins moving down from 42 to 36 to 24.
Uruguay’s performance at RWC 2015 was noteworthy. From conceding an average of 92 points at RWC 2003 (their last tournament), they managed to almost halve their margin in defeat despite their squad being 90 per cent amateur and being in the most demanding pool ever.
Namibia’s results at RWC 2015 also improved. Margins were closer, more tries were scored
and fewer conceded with their matches against tier two opponents being far more competitive.
Tier two teams were also increasingly competitive in several areas of the game. Tonga had more possession than their opponents in all four matches, Japan and USA were the only teams that had a 100 per cent success on their own scrums, Fiji were the most successful team in winning opponents’ scrums, Namibia’s four tries from turnovers were exceeded by only two other teams, while they also had the second most successful kick at goal rate.
RUGBY WORLD CUP 2015 STATISTICAL REPORT WORLD RUGBYTM GAME ANALYSIS
RWC 2015 STATISTICAL REPORT – WORLD RUGBYTM GAME ANALYSIS 13
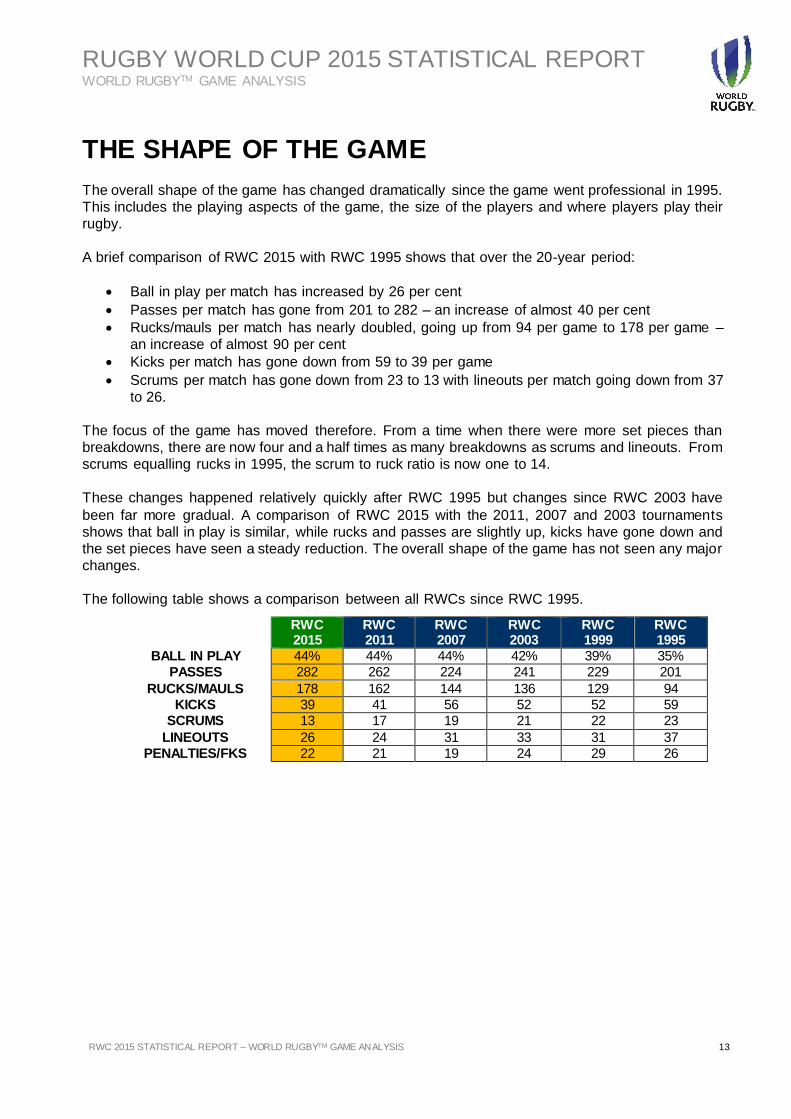
THE SHAPE OF THE GAME The overall shape of the game has changed dramatically since the game went professional in 1995. This includes the playing aspects of the game, the size of the players and where players play their rugby. A brief comparison of RWC 2015 with RWC 1995 shows that over the 20-year period:
Ball in play per match has increased by 26 per cent
Passes per match has gone from 201 to 282 – an increase of almost 40 per cent
Rucks/mauls per match has nearly doubled, going up from 94 per game to 178 per game – an increase of almost 90 per cent
Kicks per match has gone down from 59 to 39 per game
Scrums per match has gone down from 23 to 13 with lineouts per match going down from 37 to 26.
The focus of the game has moved therefore. From a time when there were more set pieces than breakdowns, there are now four and a half times as many breakdowns as scrums and lineouts. From scrums equalling rucks in 1995, the scrum to ruck ratio is now one to 14.
These changes happened relatively quickly after RWC 1995 but changes since RWC 2003 have
been far more gradual. A comparison of RWC 2015 with the 2011, 2007 and 2003 tournaments shows that ball in play is similar, while rucks and passes are slightly up, kicks have gone down and the set pieces have seen a steady reduction. The overall shape of the game has not seen any major changes. The following table shows a comparison between all RWCs since RWC 1995.
RWC 2015
RWC 2011
RWC 2007
RWC 2003
RWC 1999
RWC 1995
BALL IN PLAY 44% 44% 44% 42% 39% 35%
PASSES 282 262 224 241 229 201
RUCKS/MAULS 178 162 144 136 129 94
KICKS 39 41 56 52 52 59
SCRUMS 13 17 19 21 22 23
LINEOUTS 26 24 31 33 31 37
PENALTIES/FKS 22 21 19 24 29 26
RUGBY WORLD CUP 2015 STATISTICAL REPORT WORLD RUGBYTM GAME ANALYSIS
14 RWC 2015 STATISTICAL REPORT – WORLD RUGBY GAME ANALYSIS 14 Filename/Filepath
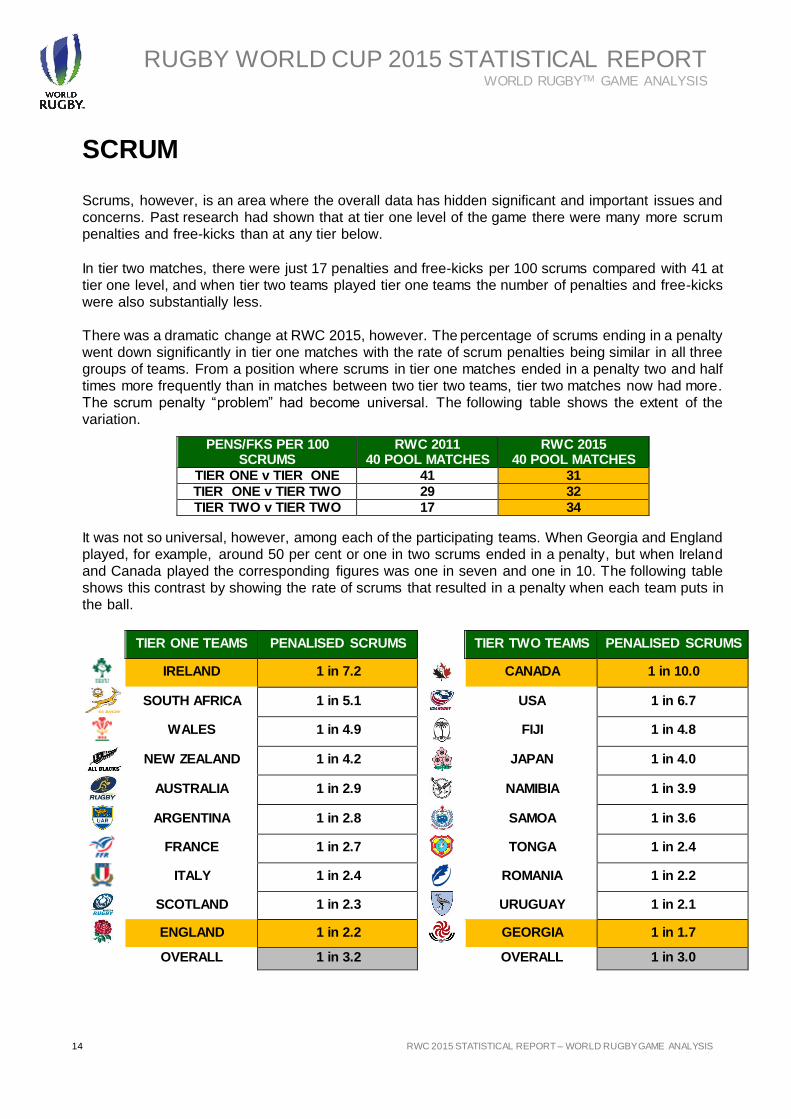
SCRUM Scrums, however, is an area where the overall data has hidden significant and important issues and concerns. Past research had shown that at tier one level of the game there were many more scrum penalties and free-kicks than at any tier below.
In tier two matches, there were just 17 penalties and free-kicks per 100 scrums compared with 41 at tier one level, and when tier two teams played tier one teams the number of penalties and free-kicks were also substantially less. There was a dramatic change at RWC 2015, however. The percentage of scrums ending in a penalty went down significantly in tier one matches with the rate of scrum penalties being similar in all three groups of teams. From a position where scrums in tier one matches ended in a penalty two and half times more frequently than in matches between two tier two teams, tier two matches now had more. The scrum penalty “problem” had become universal. The following table shows the extent of the variation.
It was not so universal, however, among each of the participating teams. When Georgia and England played, for example, around 50 per cent or one in two scrums ended in a penalty, but when Ireland and Canada played the corresponding figures was one in seven and one in 10. The following table shows this contrast by showing the rate of scrums that resulted in a penalty when each team puts in the ball.
PENS/FKS PER 100 SCRUMS
RWC 2011 40 POOL MATCHES
RWC 2015 40 POOL MATCHES
TIER ONE v TIER ONE 41 31
TIER ONE v TIER TWO 29 32
TIER TWO v TIER TWO 17 34
TIER ONE TEAMS PENALISED SCRUMS TIER TWO TEAMS PENALISED SCRUMS
IRELAND 1 in 7.2 CANADA 1 in 10.0
SOUTH AFRICA 1 in 5.1 USA 1 in 6.7
WALES 1 in 4.9
FIJI 1 in 4.8
NEW ZEALAND 1 in 4.2
JAPAN 1 in 4.0
AUSTRALIA 1 in 2.9
NAMIBIA 1 in 3.9
ARGENTINA 1 in 2.8
SAMOA 1 in 3.6
FRANCE 1 in 2.7
TONGA 1 in 2.4
ITALY 1 in 2.4
ROMANIA 1 in 2.2
SCOTLAND 1 in 2.3
URUGUAY 1 in 2.1
ENGLAND 1 in 2.2
GEORGIA 1 in 1.7
OVERALL 1 in 3.2 OVERALL 1 in 3.0
RUGBY WORLD CUP 2015 STATISTICAL REPORT WORLD RUGBYTM GAME ANALYSIS
RWC 2015 STATISTICAL REPORT – WORLD RUGBYTM GAME ANALYSIS 15
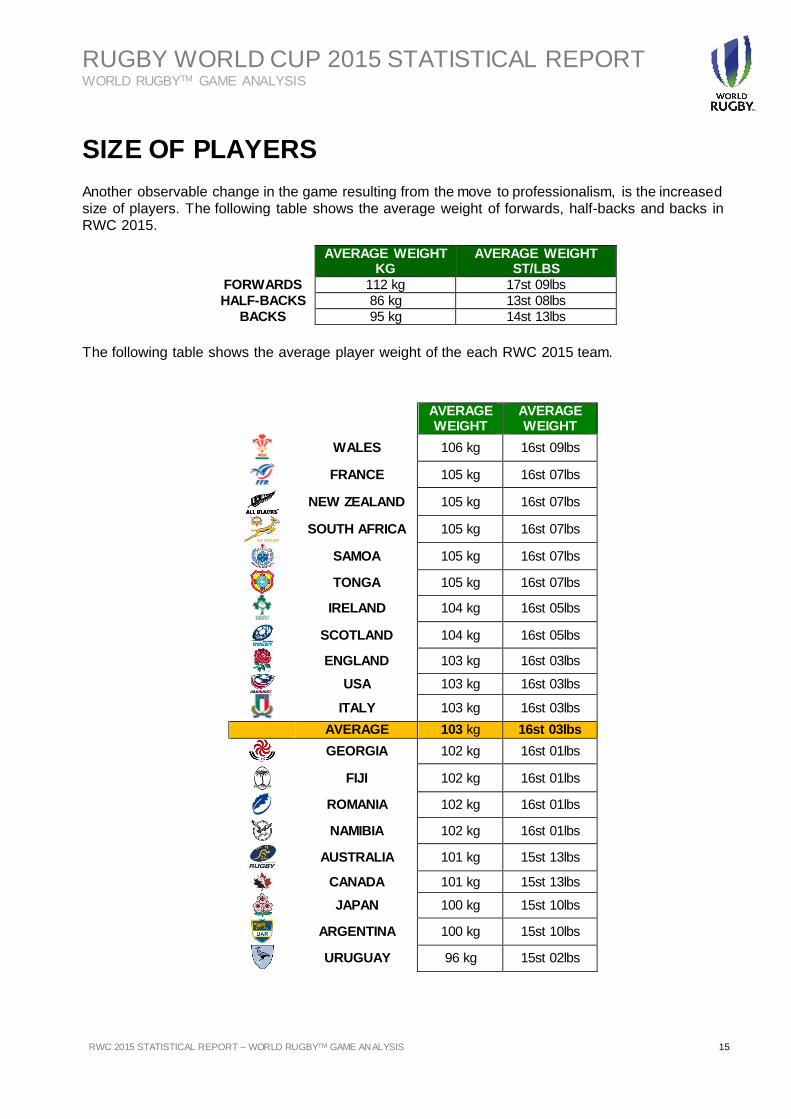
SIZE OF PLAYERS
Another observable change in the game resulting from the move to professionalism, is the increased size of players. The following table shows the average weight of forwards, half-backs and backs in RWC 2015.
The following table shows the average player weight of the each RWC 2015 team.
AVERAGE WEIGHT
KG AVERAGE WEIGHT
ST/LBS
FORWARDS 112 kg 17st 09lbs
HALF-BACKS 86 kg 13st 08lbs
BACKS 95 kg 14st 13lbs
AVERAGE WEIGHT
AVERAGE WEIGHT
WALES 106 kg 16st 09lbs
FRANCE 105 kg 16st 07lbs
NEW ZEALAND 105 kg 16st 07lbs
SOUTH AFRICA 105 kg 16st 07lbs
SAMOA 105 kg 16st 07lbs
TONGA 105 kg 16st 07lbs
IRELAND 104 kg 16st 05lbs
SCOTLAND 104 kg 16st 05lbs
ENGLAND 103 kg 16st 03lbs
USA 103 kg 16st 03lbs
ITALY 103 kg 16st 03lbs
AVERAGE 103 kg 16st 03lbs
GEORGIA 102 kg 16st 01lbs
FIJI 102 kg 16st 01lbs
ROMANIA 102 kg 16st 01lbs
NAMIBIA 102 kg 16st 01lbs
AUSTRALIA 101 kg 15st 13lbs
CANADA 101 kg 15st 13lbs
JAPAN 100 kg 15st 10lbs
ARGENTINA 100 kg 15st 10lbs
URUGUAY 96 kg 15st 02lbs
RUGBY WORLD CUP 2015 STATISTICAL REPORT WORLD RUGBYTM GAME ANALYSIS
16 RWC 2015 STATISTICAL REPORT – WORLD RUGBY GAME ANALYSIS 16 Filename/Filepath
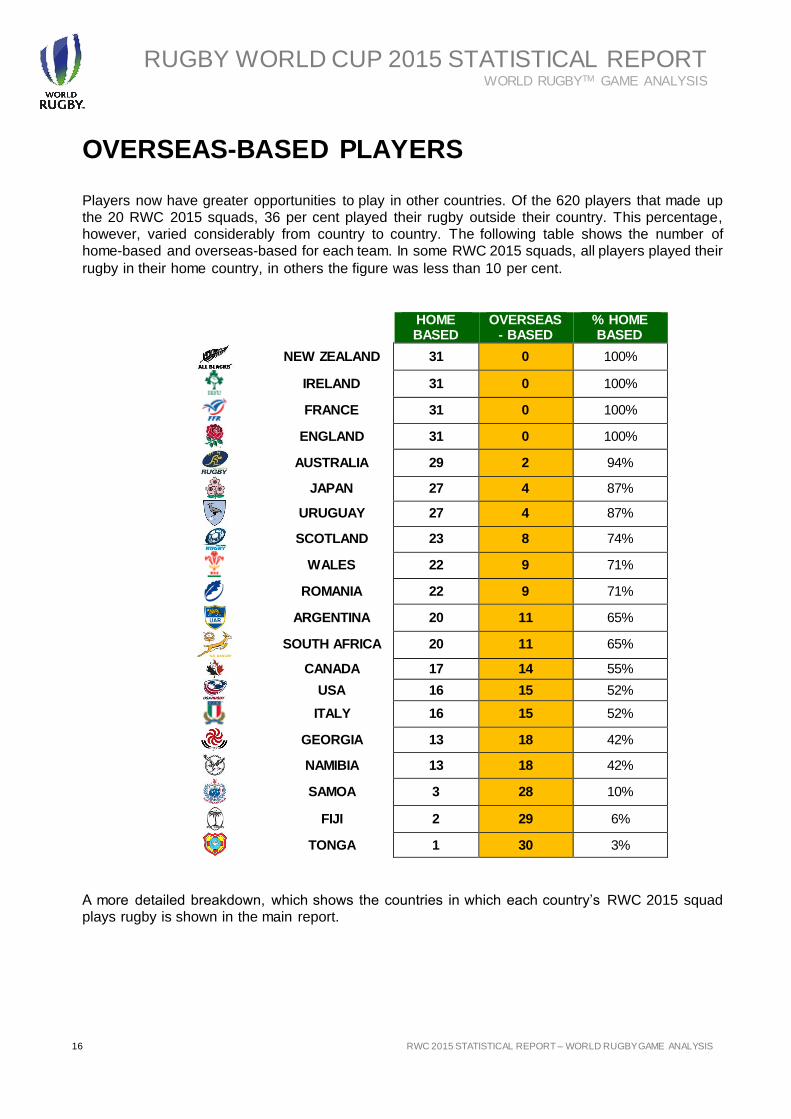
OVERSEAS-BASED PLAYERS
Players now have greater opportunities to play in other countries. Of the 620 players that made up the 20 RWC 2015 squads, 36 per cent played their rugby outside their country. This percentage, however, varied considerably from country to country. The following table shows the number of home-based and overseas-based for each team. In some RWC 2015 squads, all players played their
rugby in their home country, in others the figure was less than 10 per cent.
A more detailed breakdown, which shows the countries in which each country’s RWC 2015 squad plays rugby is shown in the main report.
HOME BASED
OVERSEAS- BASED
% HOME BASED
NEW ZEALAND 31 0 100%
IRELAND 31 0 100%
FRANCE 31 0 100%
ENGLAND 31 0 100%
AUSTRALIA 29 2 94%
JAPAN 27 4 87%
URUGUAY 27 4 87%
SCOTLAND 23 8 74%
WALES 22 9 71%
ROMANIA 22 9 71%
ARGENTINA 20 11 65%
SOUTH AFRICA 20 11 65%
CANADA 17 14 55%
USA 16 15 52%
ITALY 16 15 52%
GEORGIA 13 18 42%
NAMIBIA 13 18 42%
SAMOA 3 28 10%
FIJI 2 29 6%
TONGA 1 30 3%
RUGBY WORLD CUP 2015 STATISTICAL REPORT WORLD RUGBYTM GAME ANALYSIS
RWC 2015 STATISTICAL REPORT – WORLD RUGBYTM GAME ANALYSIS 17
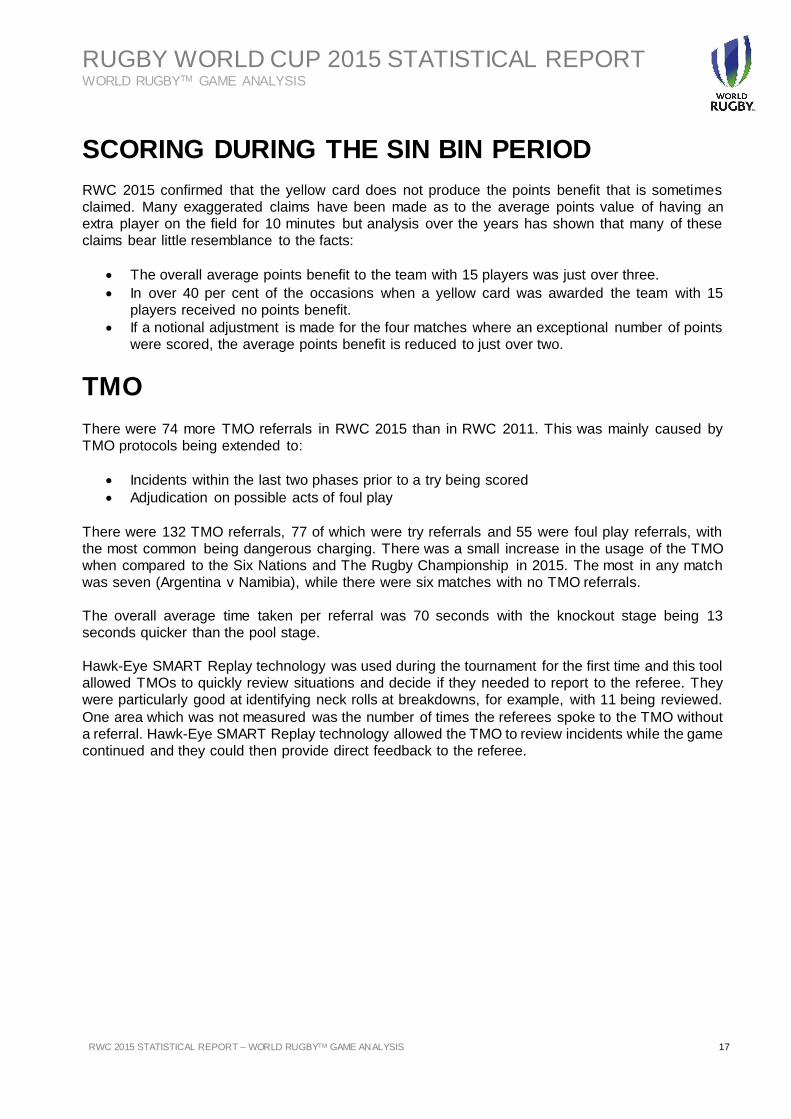
SCORING DURING THE SIN BIN PERIOD RWC 2015 confirmed that the yellow card does not produce the points benefit that is sometimes claimed. Many exaggerated claims have been made as to the average points value of having an extra player on the field for 10 minutes but analysis over the years has shown that many of these claims bear little resemblance to the facts:
The overall average points benefit to the team with 15 players was just over three.
In over 40 per cent of the occasions when a yellow card was awarded the team with 15 players received no points benefit.
If a notional adjustment is made for the four matches where an exceptional number of points were scored, the average points benefit is reduced to just over two.
TMO
There were 74 more TMO referrals in RWC 2015 than in RWC 2011. This was mainly caused by TMO protocols being extended to:
Incidents within the last two phases prior to a try being scored
Adjudication on possible acts of foul play
There were 132 TMO referrals, 77 of which were try referrals and 55 were foul play referrals, with the most common being dangerous charging. There was a small increase in the usage of the TMO when compared to the Six Nations and The Rugby Championship in 2015. The most in any match was seven (Argentina v Namibia), while there were six matches with no TMO referrals. The overall average time taken per referral was 70 seconds with the knockout stage being 13 seconds quicker than the pool stage. Hawk-Eye SMART Replay technology was used during the tournament for the first time and this tool allowed TMOs to quickly review situations and decide if they needed to report to the referee. They were particularly good at identifying neck rolls at breakdowns, for example, with 11 being reviewed.
One area which was not measured was the number of times the referees spoke to the TMO without a referral. Hawk-Eye SMART Replay technology allowed the TMO to review incidents while the game continued and they could then provide direct feedback to the referee.
RUGBY WORLD CUP 2015 STATISTICAL REPORT WORLD RUGBYTM GAME ANALYSIS
18 RWC 2015 STATISTICAL REPORT – WORLD RUGBY GAME ANALYSIS 18 Filename/Filepath
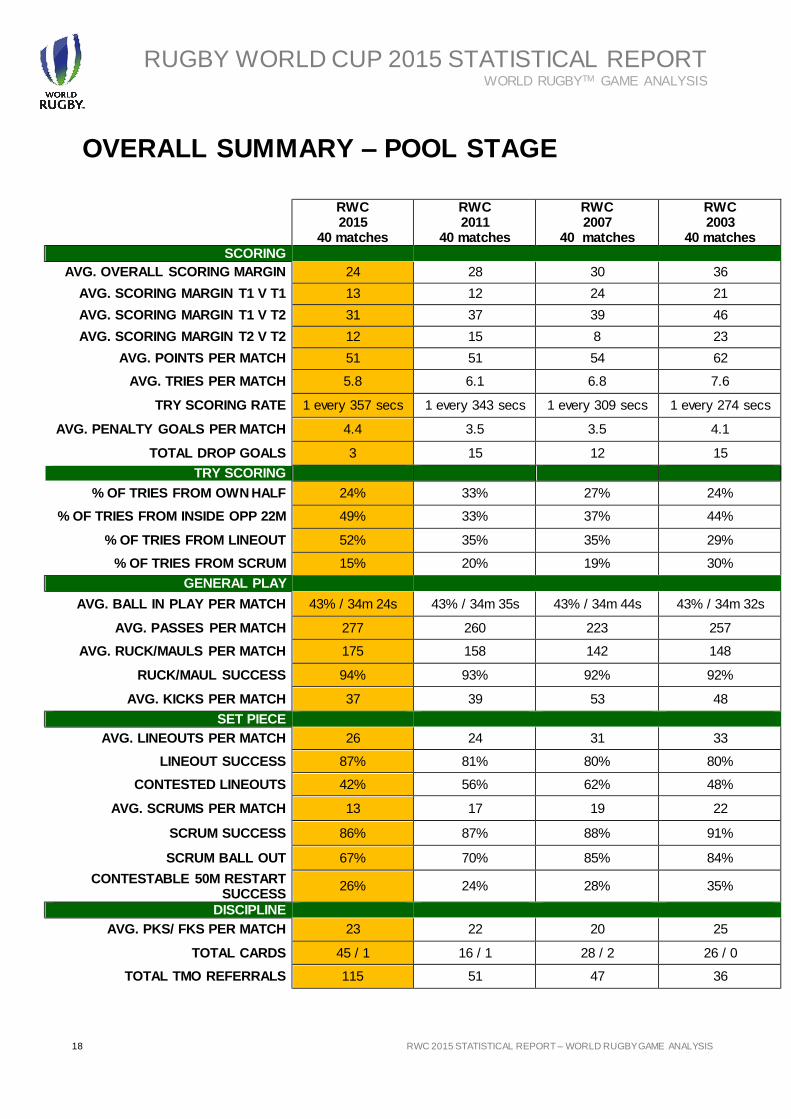
OVERALL SUMMARY – POOL STAGE
RWC 2015
40 matches
RWC 2011
40 matches
RWC 2007
40 matches
RWC 2003
40 matches
SCORING
AVG. OVERALL SCORING MARGIN 24 28 30 36
AVG. SCORING MARGIN T1 V T1 13 12 24 21
AVG. SCORING MARGIN T1 V T2 31 37 39 46
AVG. SCORING MARGIN T2 V T2 12 15 8 23
AVG. POINTS PER MATCH 51 51 54 62
AVG. TRIES PER MATCH 5.8 6.1 6.8 7.6
TRY SCORING RATE 1 every 357 secs 1 every 343 secs 1 every 309 secs 1 every 274 secs
AVG. PENALTY GOALS PER MATCH 4.4 3.5 3.5 4.1
TOTAL DROP GOALS 3 15 12 15
TRY SCORING
% OF TRIES FROM OWN HALF 24% 33% 27% 24%
% OF TRIES FROM INSIDE OPP 22M 49% 33% 37% 44%
% OF TRIES FROM LINEOUT 52% 35% 35% 29%
% OF TRIES FROM SCRUM 15% 20% 19% 30%
GENERAL PLAY
AVG. BALL IN PLAY PER MATCH 43% / 34m 24s 43% / 34m 35s 43% / 34m 44s 43% / 34m 32s
AVG. PASSES PER MATCH 277 260 223 257
AVG. RUCK/MAULS PER MATCH 175 158 142 148
RUCK/MAUL SUCCESS 94% 93% 92% 92%
AVG. KICKS PER MATCH 37 39 53 48
SET PIECE
AVG. LINEOUTS PER MATCH 26 24 31 33
LINEOUT SUCCESS 87% 81% 80% 80%
CONTESTED LINEOUTS 42% 56% 62% 48%
AVG. SCRUMS PER MATCH 13 17 19 22
SCRUM SUCCESS 86% 87% 88% 91%
SCRUM BALL OUT 67% 70% 85% 84%
CONTESTABLE 50M RESTART SUCCESS
26% 24% 28% 35%
DISCIPLINE
AVG. PKS/ FKS PER MATCH 23 22 20 25
TOTAL CARDS 45 / 1 16 / 1 28 / 2 26 / 0
TOTAL TMO REFERRALS 115 51 47 36
RUGBY WORLD CUP 2015 STATISTICAL REPORT WORLD RUGBYTM GAME ANALYSIS
RWC 2015 STATISTICAL REPORT – WORLD RUGBYTM GAME ANALYSIS 19
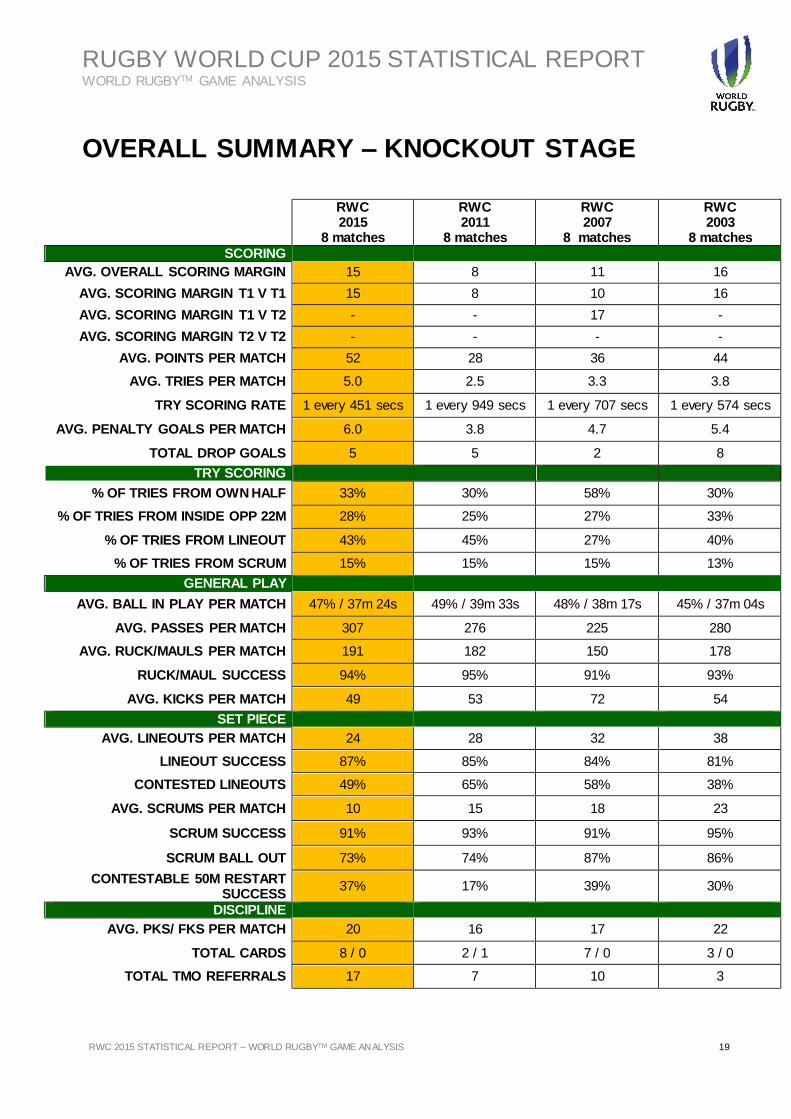
OVERALL SUMMARY – KNOCKOUT STAGE
RWC 2015
8 matches
RWC 2011
8 matches
RWC 2007
8 matches
RWC 2003
8 matches
SCORING
AVG. OVERALL SCORING MARGIN 15 8 11 16
AVG. SCORING MARGIN T1 V T1 15 8 10 16
AVG. SCORING MARGIN T1 V T2 - - 17 -
AVG. SCORING MARGIN T2 V T2 - - - -
AVG. POINTS PER MATCH 52 28 36 44
AVG. TRIES PER MATCH 5.0 2.5 3.3 3.8
TRY SCORING RATE 1 every 451 secs 1 every 949 secs 1 every 707 secs 1 every 574 secs
AVG. PENALTY GOALS PER MATCH 6.0 3.8 4.7 5.4
TOTAL DROP GOALS 5 5 2 8
TRY SCORING
% OF TRIES FROM OWN HALF 33% 30% 58% 30%
% OF TRIES FROM INSIDE OPP 22M 28% 25% 27% 33%
% OF TRIES FROM LINEOUT 43% 45% 27% 40%
% OF TRIES FROM SCRUM 15% 15% 15% 13%
GENERAL PLAY
AVG. BALL IN PLAY PER MATCH 47% / 37m 24s 49% / 39m 33s 48% / 38m 17s 45% / 37m 04s
AVG. PASSES PER MATCH 307 276 225 280
AVG. RUCK/MAULS PER MATCH 191 182 150 178
RUCK/MAUL SUCCESS 94% 95% 91% 93%
AVG. KICKS PER MATCH 49 53 72 54
SET PIECE
AVG. LINEOUTS PER MATCH 24 28 32 38
LINEOUT SUCCESS 87% 85% 84% 81%
CONTESTED LINEOUTS 49% 65% 58% 38%
AVG. SCRUMS PER MATCH 10 15 18 23
SCRUM SUCCESS 91% 93% 91% 95%
SCRUM BALL OUT 73% 74% 87% 86%
CONTESTABLE 50M RESTART SUCCESS
37% 17% 39% 30%
DISCIPLINE
AVG. PKS/ FKS PER MATCH 20 16 17 22
TOTAL CARDS 8 / 0 2 / 1 7 / 0 3 / 0
TOTAL TMO REFERRALS 17 7 10 3
RUGBY WORLD CUP 2015 STATISTICAL REPORT WORLD RUGBYTM GAME ANALYSIS
20 RWC 2015 STATISTICAL REPORT – WORLD RUGBY GAME ANALYSIS 20 Filename/Filepath
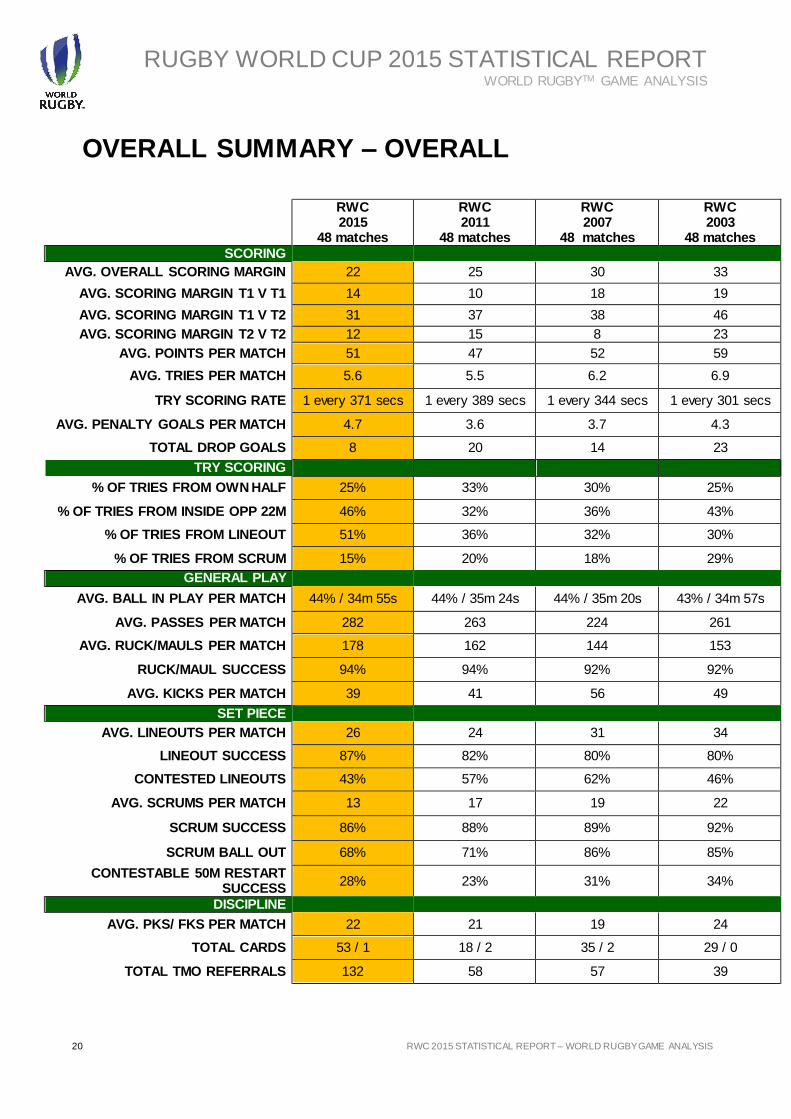
OVERALL SUMMARY – OVERALL
RWC 2015
48 matches
RWC 2011
48 matches
RWC 2007
48 matches
RWC 2003
48 matches
SCORING
AVG. OVERALL SCORING MARGIN 22 25 30 33
AVG. SCORING MARGIN T1 V T1 14 10 18 19
AVG. SCORING MARGIN T1 V T2 31 37 38 46
AVG. SCORING MARGIN T2 V T2 12 15 8 23
AVG. POINTS PER MATCH 51 47 52 59
AVG. TRIES PER MATCH 5.6 5.5 6.2 6.9
TRY SCORING RATE 1 every 371 secs 1 every 389 secs 1 every 344 secs 1 every 301 secs
AVG. PENALTY GOALS PER MATCH 4.7 3.6 3.7 4.3
TOTAL DROP GOALS 8 20 14 23
TRY SCORING
% OF TRIES FROM OWN HALF 25% 33% 30% 25%
% OF TRIES FROM INSIDE OPP 22M 46% 32% 36% 43%
% OF TRIES FROM LINEOUT 51% 36% 32% 30%
% OF TRIES FROM SCRUM 15% 20% 18% 29%
GENERAL PLAY
AVG. BALL IN PLAY PER MATCH 44% / 34m 55s 44% / 35m 24s 44% / 35m 20s 43% / 34m 57s
AVG. PASSES PER MATCH 282 263 224 261
AVG. RUCK/MAULS PER MATCH 178 162 144 153
RUCK/MAUL SUCCESS 94% 94% 92% 92%
AVG. KICKS PER MATCH 39 41 56 49
SET PIECE
AVG. LINEOUTS PER MATCH 26 24 31 34
LINEOUT SUCCESS 87% 82% 80% 80%
CONTESTED LINEOUTS 43% 57% 62% 46%
AVG. SCRUMS PER MATCH 13 17 19 22
SCRUM SUCCESS 86% 88% 89% 92%
SCRUM BALL OUT 68% 71% 86% 85%
CONTESTABLE 50M RESTART SUCCESS
28% 23% 31% 34%
DISCIPLINE
AVG. PKS/ FKS PER MATCH 22 21 19 24
TOTAL CARDS 53 / 1 18 / 2 35 / 2 29 / 0
TOTAL TMO REFERRALS 132 58 57 39
RUGBY WORLD CUP 2015 STATISTICAL REPORT WORLD RUGBYTM GAME ANALYSIS
RWC 2015 STATISTICAL REPORT – WORLD RUGBYTM GAME ANALYSIS 21
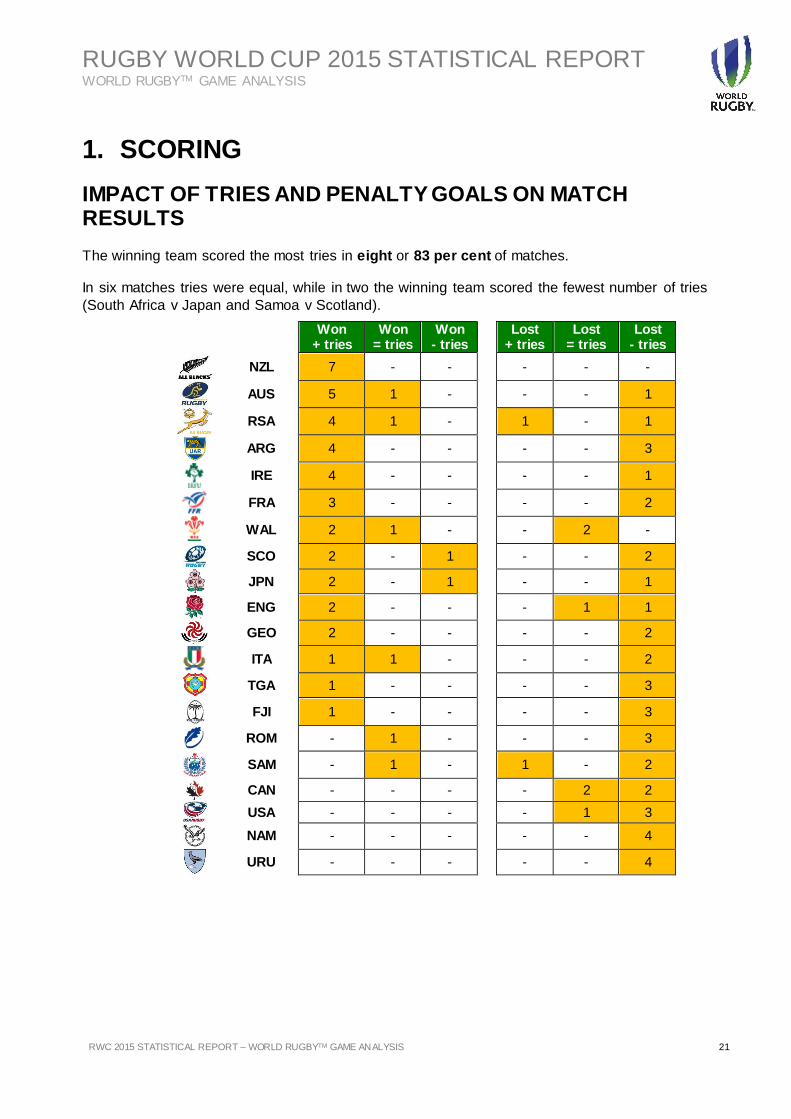
1. SCORING
IMPACT OF TRIES AND PENALTY GOALS ON MATCH RESULTS
The winning team scored the most tries in eight or 83 per cent of matches.
In six matches tries were equal, while in two the winning team scored the fewest number of tries
(South Africa v Japan and Samoa v Scotland).
Won + tries
Won = tries
Won - tries
Lost
+ tries Lost
= tries Lost
- tries
NZL 7 - - - - -
AUS 5 1 - - - 1
RSA 4 1 - 1 - 1
ARG 4 - - - - 3
IRE 4 - - - - 1
FRA 3 - - - - 2
WAL 2 1 - - 2 -
SCO 2 - 1 - - 2
JPN 2 - 1 - - 1
ENG 2 - - - 1 1
GEO 2 - - - - 2
ITA 1 1 - - - 2
TGA 1 - - - - 3
FJI 1 - - - - 3
ROM - 1 - - - 3
SAM - 1 - 1 - 2
CAN - - - - 2 2
USA - - - - 1 3
NAM - - - - - 4
URU - - - - - 4
RUGBY WORLD CUP 2015 STATISTICAL REPORT WORLD RUGBYTM GAME ANALYSIS
22 RWC 2015 STATISTICAL REPORT – WORLD RUGBY GAME ANALYSIS 22 Filename/Filepath
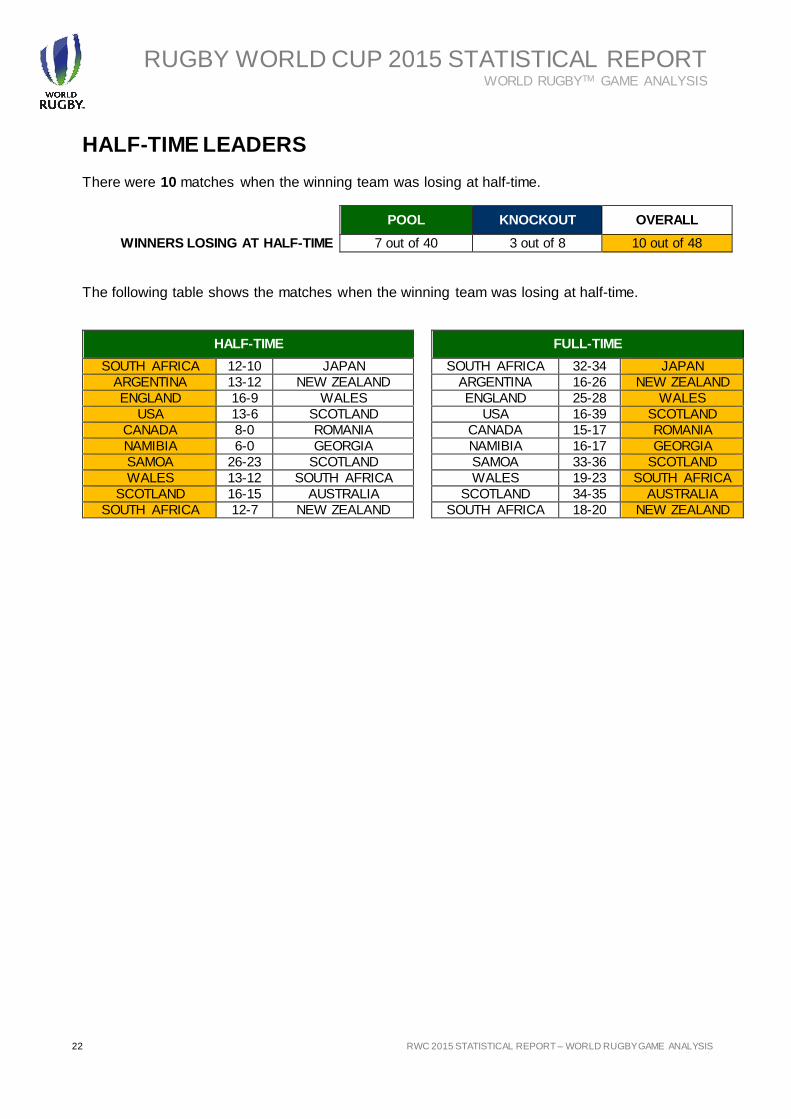
HALF-TIME LEADERS
There were 10 matches when the winning team was losing at half-time.
The following table shows the matches when the winning team was losing at half-time.
POOL KNOCKOUT OVERALL
WINNERS LOSING AT HALF-TIME 7 out of 40 3 out of 8 10 out of 48
HALF-TIME FULL-TIME
SOUTH AFRICA 12-10 JAPAN SOUTH AFRICA 32-34 JAPAN
ARGENTINA 13-12 NEW ZEALAND ARGENTINA 16-26 NEW ZEALAND
ENGLAND 16-9 WALES ENGLAND 25-28 WALES
USA 13-6 SCOTLAND USA 16-39 SCOTLAND
CANADA 8-0 ROMANIA CANADA 15-17 ROMANIA
NAMIBIA 6-0 GEORGIA NAMIBIA 16-17 GEORGIA
SAMOA 26-23 SCOTLAND SAMOA 33-36 SCOTLAND
WALES 13-12 SOUTH AFRICA WALES 19-23 SOUTH AFRICA
SCOTLAND 16-15 AUSTRALIA SCOTLAND 34-35 AUSTRALIA
SOUTH AFRICA 12-7 NEW ZEALAND SOUTH AFRICA 18-20 NEW ZEALAND
RUGBY WORLD CUP 2015 STATISTICAL REPORT WORLD RUGBYTM GAME ANALYSIS
RWC 2015 STATISTICAL REPORT – WORLD RUGBYTM GAME ANALYSIS 23
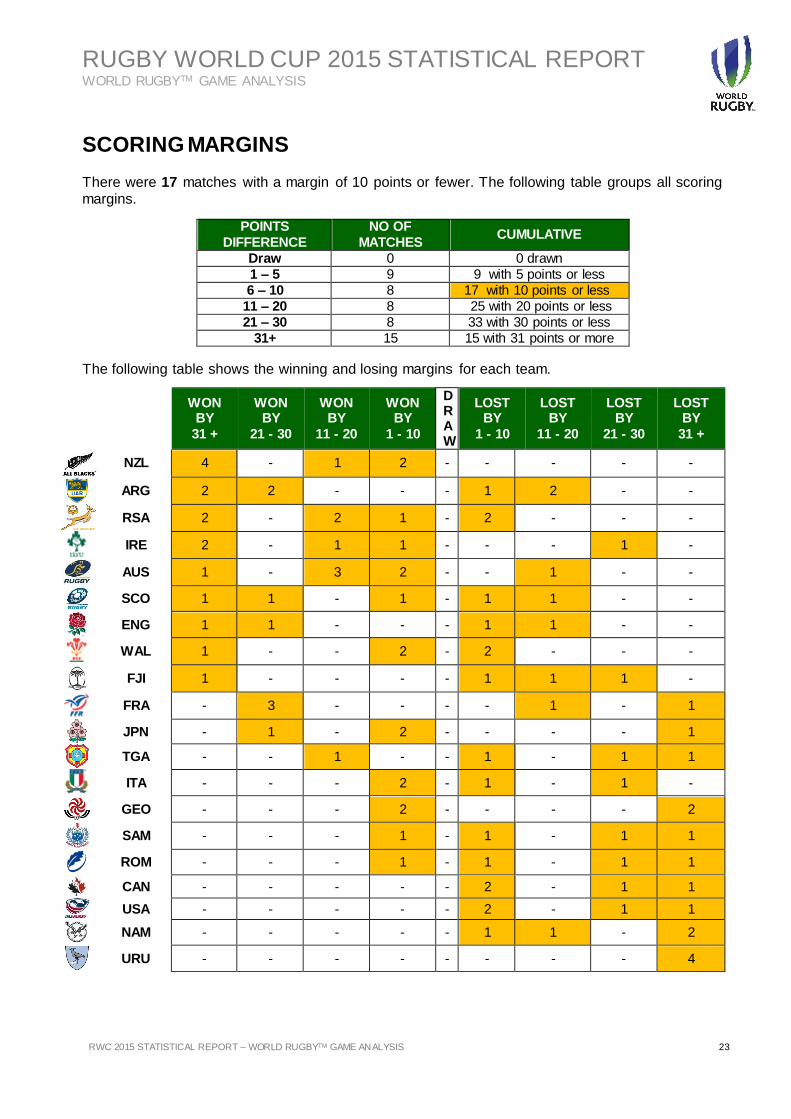
SCORING MARGINS
There were 17 matches with a margin of 10 points or fewer. The following table groups all scoring margins.
The following table shows the winning and losing margins for each team.
POINTS
DIFFERENCE
NO OF
MATCHES CUMULATIVE
Draw 0 0 drawn
1 – 5 9 9 with 5 points or less
6 – 10 8 17 with 10 points or less
11 – 20 8 25 with 20 points or less
21 – 30 8 33 with 30 points or less
31+ 15 15 with 31 points or more
WON
BY
31 +
WON BY
21 - 30
WON BY
11 - 20
WON BY
1 - 10
DRAW
LOST BY
1 - 10
LOST BY
11 - 20
LOST BY
21 - 30
LOST BY
31 +
NZL 4 - 1 2 - - - - -
ARG 2 2 - - - 1 2 - -
RSA 2 - 2 1 - 2 - - -
IRE 2 - 1 1 - - - 1 -
AUS 1 - 3 2 - - 1 - -
SCO 1 1 - 1 - 1 1 - -
ENG 1 1 - - - 1 1 - -
WAL 1 - - 2 - 2 - - -
FJI 1 - - - - 1 1 1 -
FRA - 3 - - - - 1 - 1
JPN - 1 - 2 - - - - 1
TGA - - 1 - - 1 - 1 1
ITA - - - 2 - 1 - 1 -
GEO - - - 2 - - - - 2
SAM - - - 1 - 1 - 1 1
ROM - - - 1 - 1 - 1 1
CAN - - - - - 2 - 1 1
USA - - - - - 2 - 1 1
NAM - - - - - 1 1 - 2
URU - - - - - - - - 4
RUGBY WORLD CUP 2015 STATISTICAL REPORT WORLD RUGBYTM GAME ANALYSIS
24 RWC 2015 STATISTICAL REPORT – WORLD RUGBY GAME ANALYSIS 24 Filename/Filepath
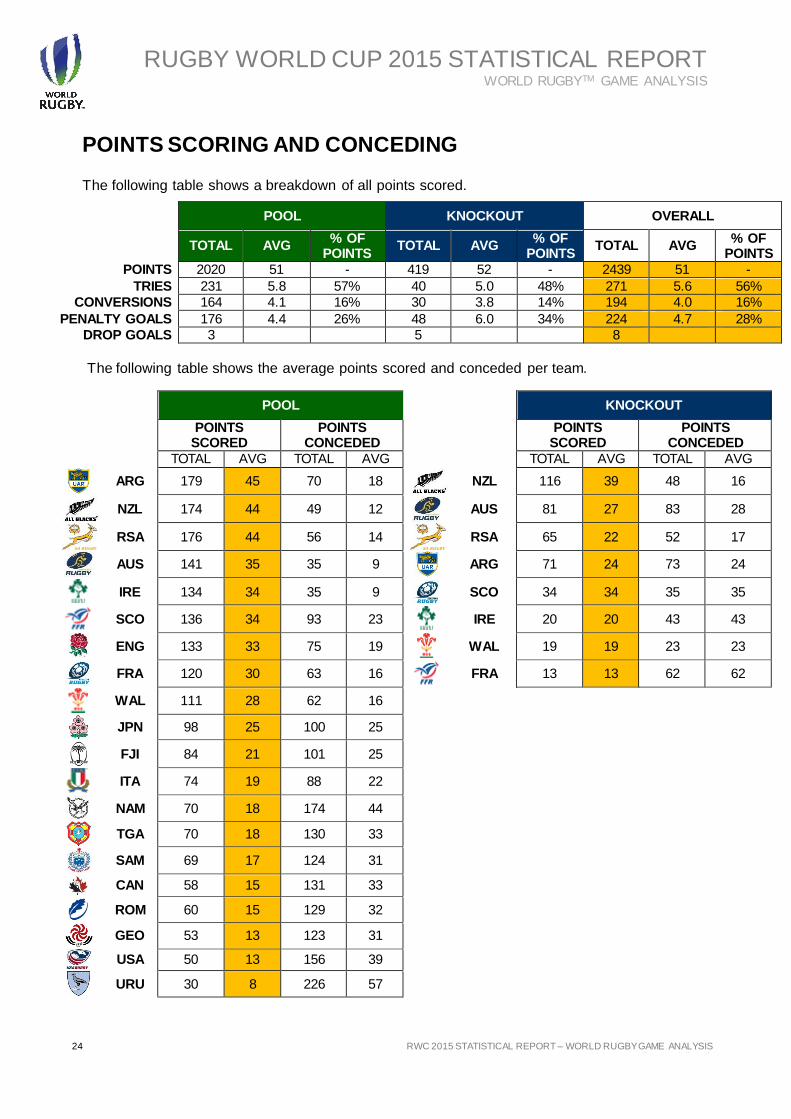
POINTS SCORING AND CONCEDING The following table shows a breakdown of all points scored.
The following table shows the average points scored and conceded per team.
POOL KNOCKOUT OVERALL
TOTAL AVG
% OF POINTS
TOTAL AVG % OF
POINTS TOTAL AVG
% OF POINTS
POINTS 2020 51 - 419 52 - 2439 51 -
TRIES 231 5.8 57% 40 5.0 48% 271 5.6 56%
CONVERSIONS 164 4.1 16% 30 3.8 14% 194 4.0 16%
PENALTY GOALS 176 4.4 26% 48 6.0 34% 224 4.7 28%
DROP GOALS 3 5 8
POOL
KNOCKOUT
POINTS SCORED
POINTS CONCEDED
POINTS SCORED
POINTS CONCEDED
TOTAL AVG TOTAL AVG TOTAL AVG TOTAL AVG
ARG 179 45 70 18
NZL 116 39 48 16
NZL 174 44 49 12
AUS 81 27 83 28
RSA 176 44 56 14
RSA 65 22 52 17
AUS 141 35 35 9
ARG 71 24 73 24
IRE 134 34 35 9
SCO 34 34 35 35
SCO 136 34 93 23
IRE 20 20 43 43
ENG 133 33 75 19
WAL 19 19 23 23
FRA 120 30 63 16
FRA 13 13 62 62
WAL 111 28 62 16
JPN 98 25 100 25
FJI 84 21 101 25
ITA 74 19 88 22
NAM 70 18 174 44
TGA 70 18 130 33
SAM 69 17 124 31
CAN 58 15 131 33
ROM 60 15 129 32
GEO 53 13 123 31
USA 50 13 156 39
URU 30 8 226 57
RUGBY WORLD CUP 2015 STATISTICAL REPORT WORLD RUGBYTM GAME ANALYSIS
RWC 2015 STATISTICAL REPORT – WORLD RUGBYTM GAME ANALYSIS 25
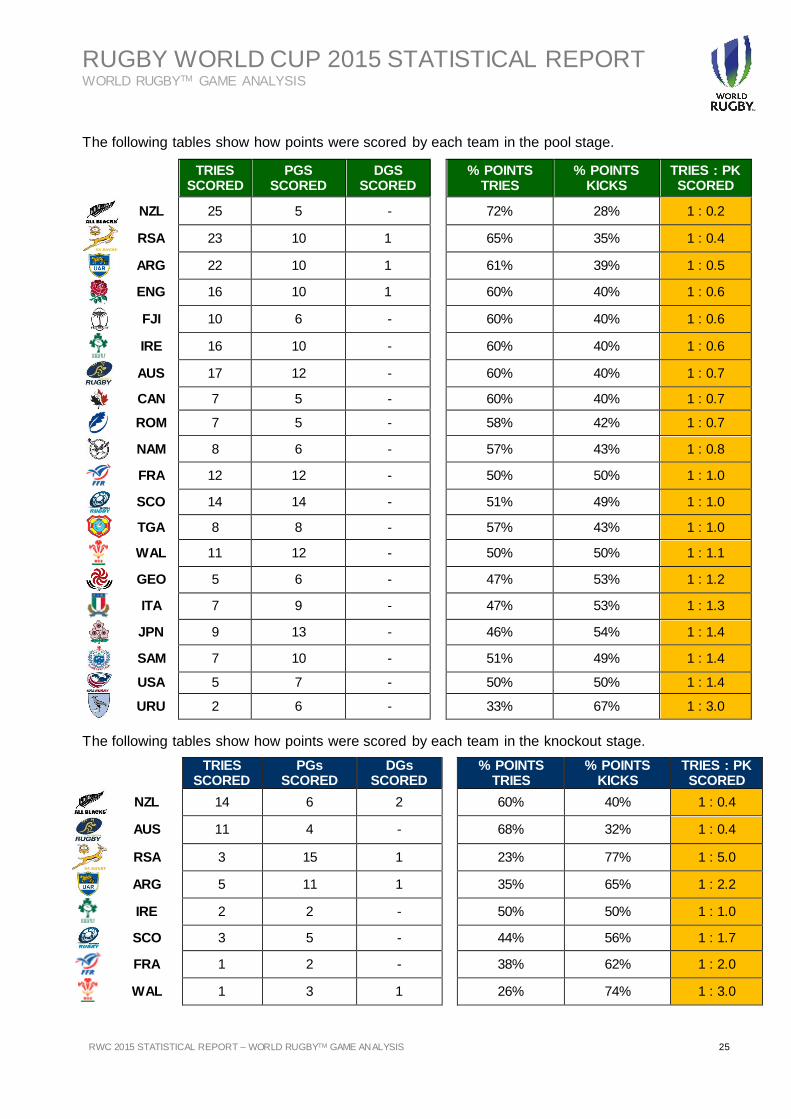
The following tables show how points were scored by each team in the pool stage.
The following tables show how points were scored by each team in the knockout stage.
TRIES SCORED
PGS SCORED
DGS SCORED
% POINTS TRIES
% POINTS KICKS
TRIES : PK SCORED
NZL 25 5 - 72% 28% 1 : 0.2
RSA 23 10 1 65% 35% 1 : 0.4
ARG 22 10 1 61% 39% 1 : 0.5
ENG 16 10 1 60% 40% 1 : 0.6
FJI 10 6 - 60% 40% 1 : 0.6
IRE 16 10 - 60% 40% 1 : 0.6
AUS 17 12 - 60% 40% 1 : 0.7
CAN 7 5 - 60% 40% 1 : 0.7
ROM 7 5 - 58% 42% 1 : 0.7
NAM 8 6 - 57% 43% 1 : 0.8
FRA 12 12 - 50% 50% 1 : 1.0
SCO 14 14 - 51% 49% 1 : 1.0
TGA 8 8 - 57% 43% 1 : 1.0
WAL 11 12 - 50% 50% 1 : 1.1
GEO 5 6 - 47% 53% 1 : 1.2
ITA 7 9 - 47% 53% 1 : 1.3
JPN 9 13 - 46% 54% 1 : 1.4
SAM 7 10 - 51% 49% 1 : 1.4
USA 5 7 - 50% 50% 1 : 1.4
URU 2 6 - 33% 67% 1 : 3.0
TRIES
SCORED PGs
SCORED DGs
SCORED % POINTS
TRIES % POINTS
KICKS TRIES : PK SCORED
NZL 14 6 2 60% 40% 1 : 0.4
AUS 11 4 - 68% 32% 1 : 0.4
RSA 3 15 1 23% 77% 1 : 5.0
ARG 5 11 1 35% 65% 1 : 2.2
IRE 2 2 - 50% 50% 1 : 1.0
SCO 3 5 - 44% 56% 1 : 1.7
FRA 1 2 - 38% 62% 1 : 2.0
WAL 1 3 1 26% 74% 1 : 3.0
RUGBY WORLD CUP 2015 STATISTICAL REPORT WORLD RUGBYTM GAME ANALYSIS
26 RWC 2015 STATISTICAL REPORT – WORLD RUGBY GAME ANALYSIS 26 Filename/Filepath
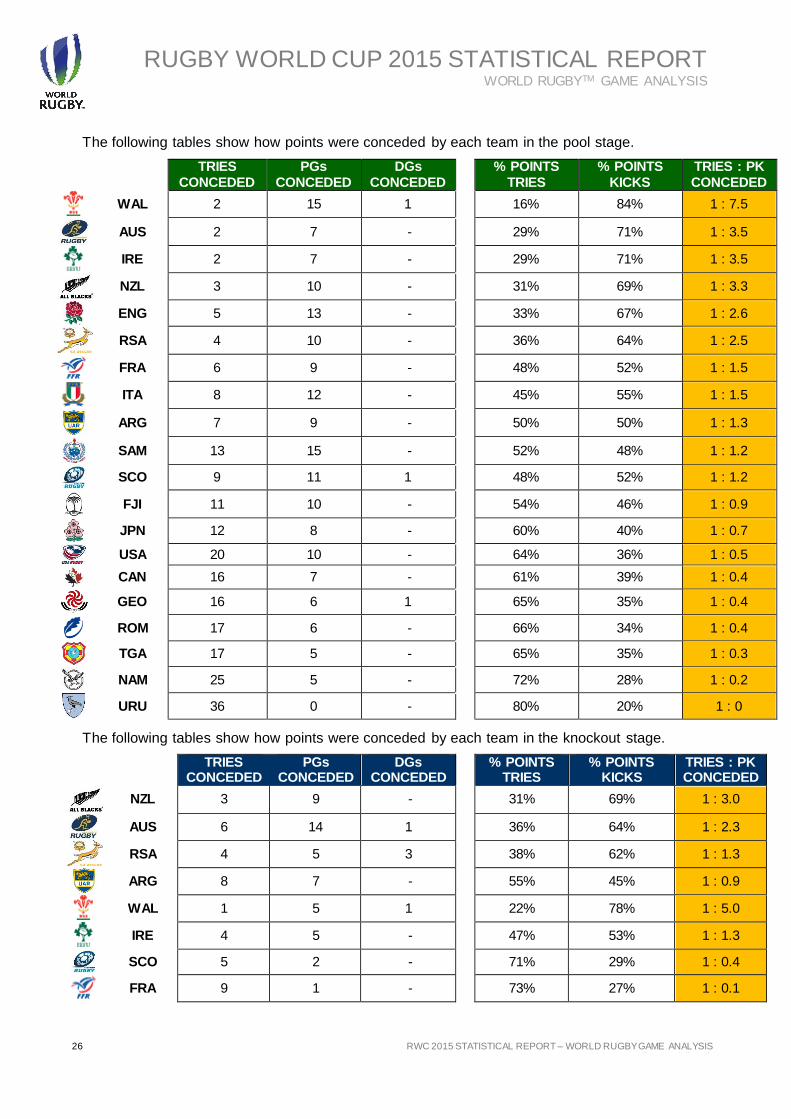
The following tables show how points were conceded by each team in the pool stage.
The following tables show how points were conceded by each team in the knockout stage.
TRIES
CONCEDED
PGs
CONCEDED
DGs
CONCEDED
% POINTS
TRIES
% POINTS
KICKS
TRIES : PK
CONCEDED
WAL 2 15 1 16% 84% 1 : 7.5
AUS 2 7 - 29% 71% 1 : 3.5
IRE 2 7 - 29% 71% 1 : 3.5
NZL 3 10 - 31% 69% 1 : 3.3
ENG 5 13 - 33% 67% 1 : 2.6
RSA 4 10 - 36% 64% 1 : 2.5
FRA 6 9 - 48% 52% 1 : 1.5
ITA 8 12 - 45% 55% 1 : 1.5
ARG 7 9 - 50% 50% 1 : 1.3
SAM 13 15 - 52% 48% 1 : 1.2
SCO 9 11 1 48% 52% 1 : 1.2
FJI 11 10 - 54% 46% 1 : 0.9
JPN 12 8 - 60% 40% 1 : 0.7
USA 20 10 - 64% 36% 1 : 0.5
CAN 16 7 - 61% 39% 1 : 0.4
GEO 16 6 1 65% 35% 1 : 0.4
ROM 17 6 - 66% 34% 1 : 0.4
TGA 17 5 - 65% 35% 1 : 0.3
NAM 25 5 - 72% 28% 1 : 0.2
URU 36 0 - 80% 20% 1 : 0
TRIES
CONCEDED PGs
CONCEDED DGs
CONCEDED % POINTS
TRIES % POINTS
KICKS TRIES : PK CONCEDED
NZL 3 9 - 31% 69% 1 : 3.0
AUS 6 14 1 36% 64% 1 : 2.3
RSA 4 5 3 38% 62% 1 : 1.3
ARG 8 7 - 55% 45% 1 : 0.9
WAL 1 5 1 22% 78% 1 : 5.0
IRE 4 5 - 47% 53% 1 : 1.3
SCO 5 2 - 71% 29% 1 : 0.4
FRA 9 1 - 73% 27% 1 : 0.1
RUGBY WORLD CUP 2015 STATISTICAL REPORT WORLD RUGBYTM GAME ANALYSIS
RWC 2015 STATISTICAL REPORT – WORLD RUGBYTM GAME ANALYSIS 27
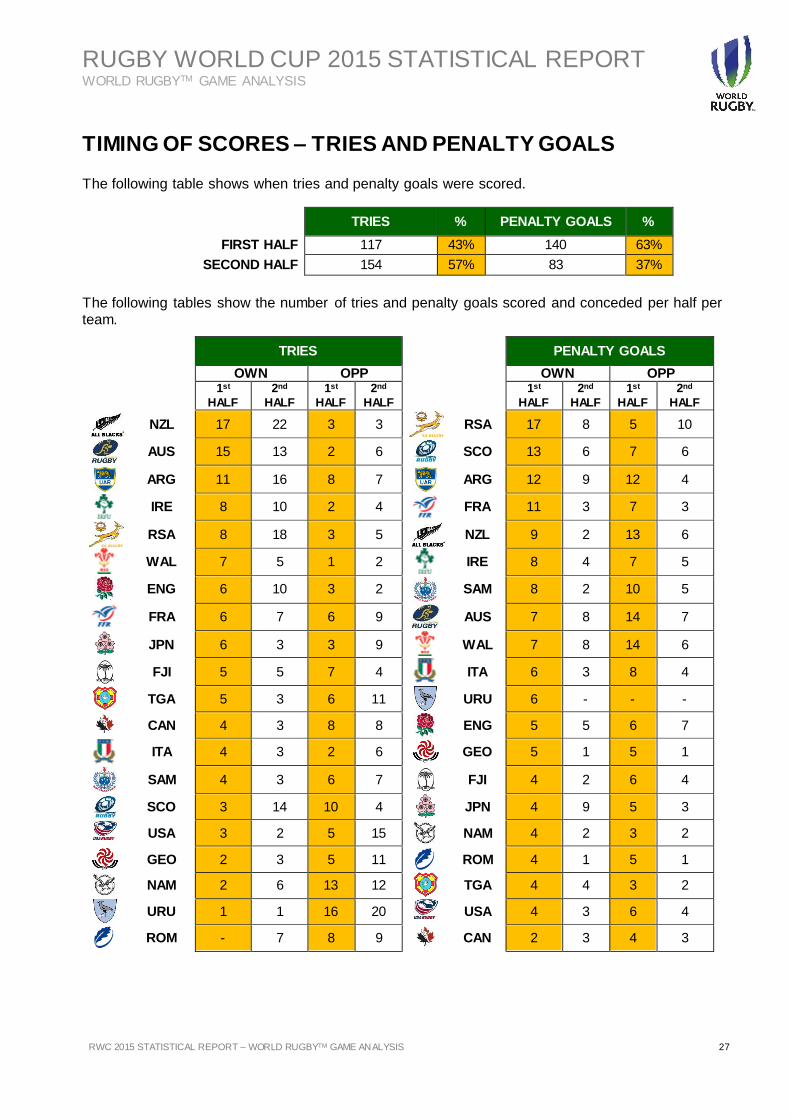
TIMING OF SCORES – TRIES AND PENALTY GOALS
The following table shows when tries and penalty goals were scored.
The following tables show the number of tries and penalty goals scored and conceded per half per team.
TRIES % PENALTY GOALS %
FIRST HALF 117 43% 140 63%
SECOND HALF 154 57% 83 37%
TRIES
PENALTY GOALS
OWN OPP OWN OPP
1st
HALF
2nd
HALF
1st
HALF
2nd
HALF
1st
HALF
2nd
HALF
1st
HALF
2nd
HALF
NZL 17 22 3 3
RSA 17 8 5 10
AUS 15 13 2 6
SCO 13 6 7 6
ARG 11 16 8 7
ARG 12 9 12 4
IRE 8 10 2 4
FRA 11 3 7 3
RSA 8 18 3 5
NZL 9 2 13 6
WAL 7 5 1 2
IRE 8 4 7 5
ENG 6 10 3 2
SAM 8 2 10 5
FRA 6 7 6 9
AUS 7 8 14 7
JPN 6 3 3 9
WAL 7 8 14 6
FJI 5 5 7 4
ITA 6 3 8 4
TGA 5 3 6 11
URU 6 - - -
CAN 4 3 8 8
ENG 5 5 6 7
ITA 4 3 2 6
GEO 5 1 5 1
SAM 4 3 6 7
FJI 4 2 6 4
SCO 3 14 10 4
JPN 4 9 5 3
USA 3 2 5 15
NAM 4 2 3 2
GEO 2 3 5 11
ROM 4 1 5 1
NAM 2 6 13 12
TGA 4 4 3 2
URU 1 1 16 20 USA 4 3 6 4
ROM - 7 8 9 CAN 2 3 4 3
RUGBY WORLD CUP 2015 STATISTICAL REPORT WORLD RUGBYTM GAME ANALYSIS
28 RWC 2015 STATISTICAL REPORT – WORLD RUGBY GAME ANALYSIS 28 Filename/Filepath
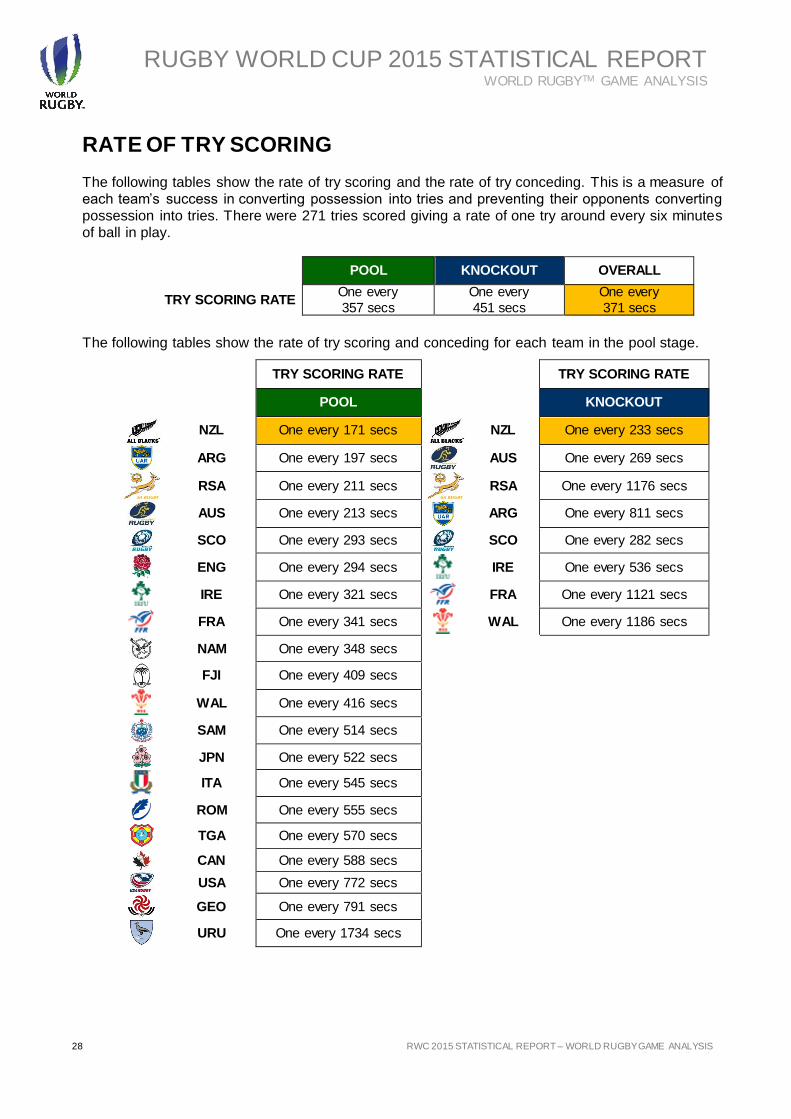
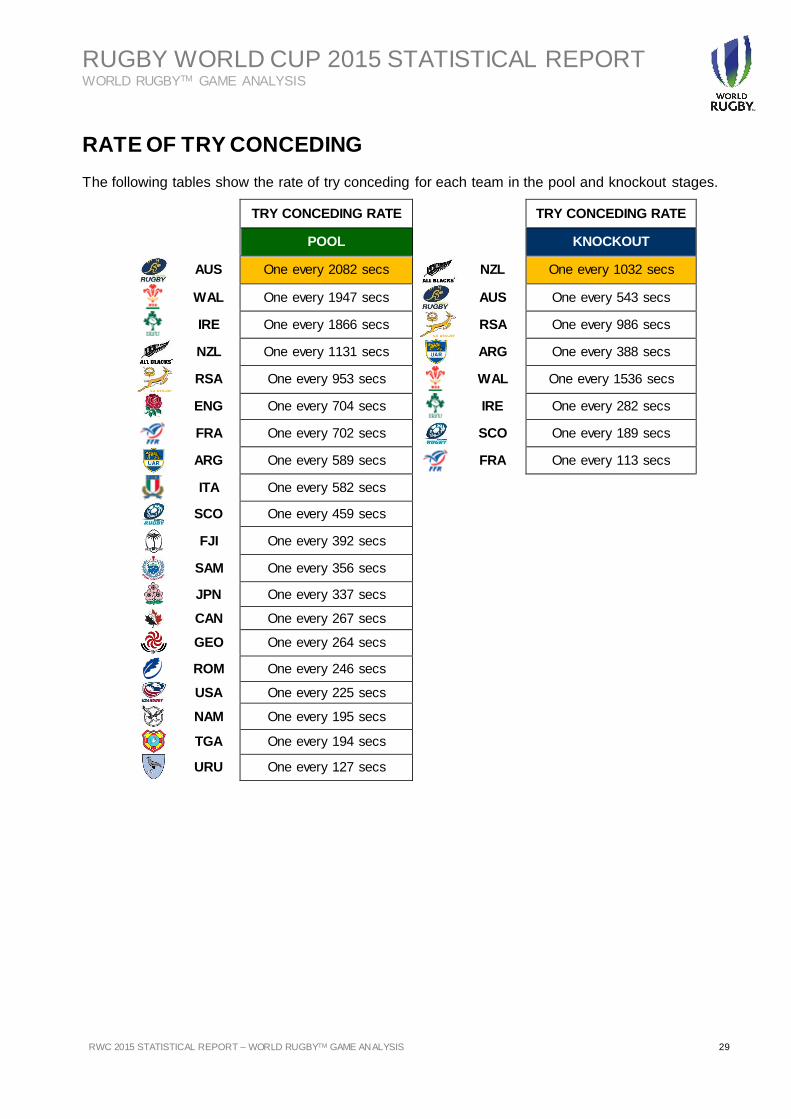
RATE OF TRY SCORING
The following tables show the rate of try scoring and the rate of try conceding. This is a measure of each team’s success in converting possession into tries and preventing their opponents converting possession into tries. There were 271 tries scored giving a rate of one try around every six minutes of ball in play.
The following tables show the rate of try scoring and conceding for each team in the pool stage.
POOL KNOCKOUT OVERALL
TRY SCORING RATE One every
357 secs
One every
451 secs
One every
371 secs
TRY SCORING RATE
TRY SCORING RATE
POOL
KNOCKOUT
NZL One every 171 secs
NZL One every 233 secs
ARG One every 197 secs
AUS One every 269 secs
RSA One every 211 secs
RSA One every 1176 secs
AUS One every 213 secs
ARG One every 811 secs
SCO One every 293 secs
SCO One every 282 secs
ENG One every 294 secs
IRE One every 536 secs
IRE One every 321 secs
FRA One every 1121 secs
FRA One every 341 secs
WAL One every 1186 secs
NAM One every 348 secs
FJI One every 409 secs
WAL One every 416 secs
SAM One every 514 secs
JPN One every 522 secs
ITA One every 545 secs
ROM One every 555 secs
TGA One every 570 secs
CAN One every 588 secs
USA One every 772 secs
GEO One every 791 secs
URU One every 1734 secs
RUGBY WORLD CUP 2015 STATISTICAL REPORT WORLD RUGBYTM GAME ANALYSIS
RWC 2015 STATISTICAL REPORT – WORLD RUGBYTM GAME ANALYSIS 29
RATE OF TRY CONCEDING
The following tables show the rate of try conceding for each team in the pool and knockout stages.
TRY CONCEDING RATE
TRY CONCEDING RATE
POOL
KNOCKOUT
AUS One every 2082 secs
NZL One every 1032 secs
WAL One every 1947 secs
AUS One every 543 secs
IRE One every 1866 secs
RSA One every 986 secs
NZL One every 1131 secs
ARG One every 388 secs
RSA One every 953 secs
WAL One every 1536 secs
ENG One every 704 secs
IRE One every 282 secs
FRA One every 702 secs
SCO One every 189 secs
ARG One every 589 secs
FRA One every 113 secs
ITA One every 582 secs
SCO One every 459 secs
FJI One every 392 secs
SAM One every 356 secs
JPN One every 337 secs
CAN One every 267 secs
GEO One every 264 secs
ROM One every 246 secs
USA One every 225 secs
NAM One every 195 secs
TGA One every 194 secs
URU One every 127 secs
RUGBY WORLD CUP 2015 STATISTICAL REPORT WORLD RUGBYTM GAME ANALYSIS
30 RWC 2015 STATISTICAL REPORT – WORLD RUGBY GAME ANALYSIS 30 Filename/Filepath
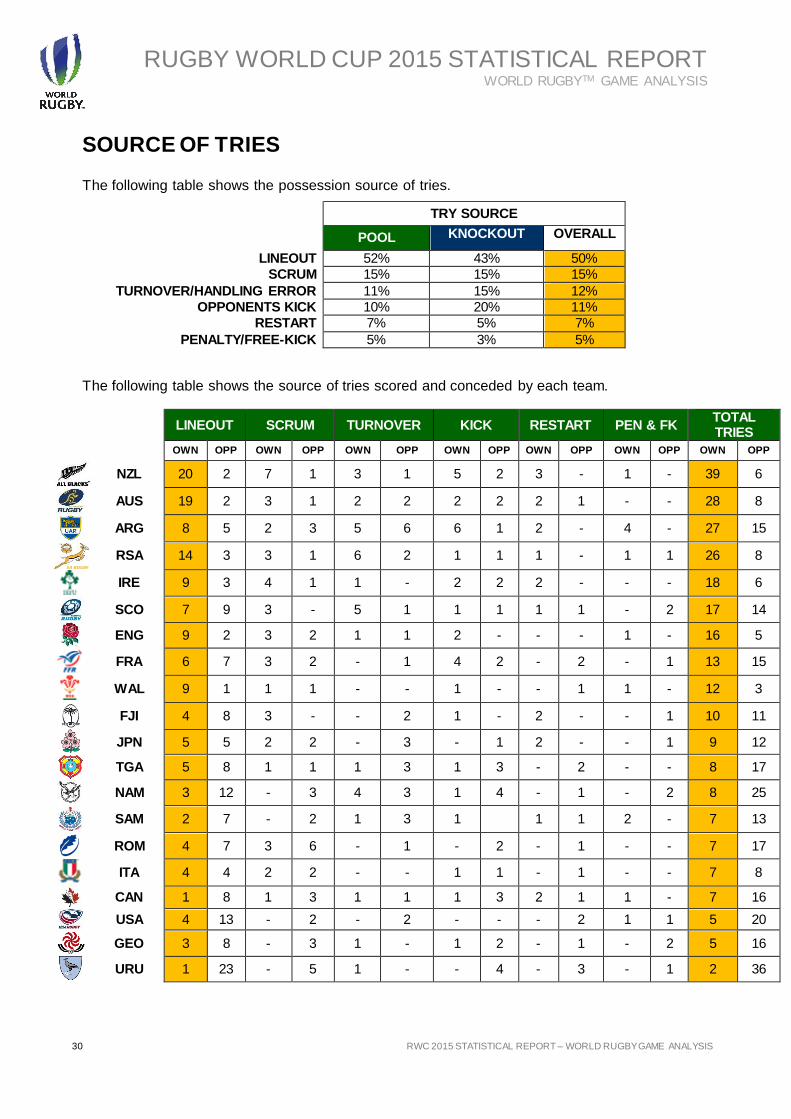
SOURCE OF TRIES The following table shows the possession source of tries.
The following table shows the source of tries scored and conceded by each team.
TRY SOURCE
POOL KNOCKOUT OVERALL
LINEOUT 52% 43% 50%
SCRUM 15% 15% 15%
TURNOVER/HANDLING ERROR 11% 15% 12%
OPPONENTS KICK 10% 20% 11%
RESTART 7% 5% 7%
PENALTY/FREE-KICK 5% 3% 5%
LINEOUT SCRUM TURNOVER KICK RESTART PEN & FK TOTAL TRIES
OWN OPP OWN OPP OWN OPP OWN OPP OWN OPP OWN OPP OWN OPP
NZL 20 2 7 1 3 1 5 2 3 - 1 - 39 6
AUS 19 2 3 1 2 2 2 2 2 1 - - 28 8
ARG 8 5 2 3 5 6 6 1 2 - 4 - 27 15
RSA 14 3 3 1 6 2 1 1 1 - 1 1 26 8
IRE 9 3 4 1 1 - 2 2 2 - - - 18 6
SCO 7 9 3 - 5 1 1 1 1 1 - 2 17 14
ENG 9 2 3 2 1 1 2 - - - 1 - 16 5
FRA 6 7 3 2 - 1 4 2 - 2 - 1 13 15
WAL 9 1 1 1 - - 1 - - 1 1 - 12 3
FJI 4 8 3 - - 2 1 - 2 - - 1 10 11
JPN 5 5 2 2 - 3 - 1 2 - - 1 9 12
TGA 5 8 1 1 1 3 1 3 - 2 - - 8 17
NAM 3 12 - 3 4 3 1 4 - 1 - 2 8 25
SAM 2 7 - 2 1 3 1 1 1 2 - 7 13
ROM 4 7 3 6 - 1 - 2 - 1 - - 7 17
ITA 4 4 2 2 - - 1 1 - 1 - - 7 8
CAN 1 8 1 3 1 1 1 3 2 1 1 - 7 16
USA 4 13 - 2 - 2 - - - 2 1 1 5 20
GEO 3 8 - 3 1 - 1 2 - 1 - 2 5 16
URU 1 23 - 5 1 - - 4 - 3 - 1 2 36
RUGBY WORLD CUP 2015 STATISTICAL REPORT WORLD RUGBYTM GAME ANALYSIS
RWC 2015 STATISTICAL REPORT – WORLD RUGBYTM GAME ANALYSIS 31
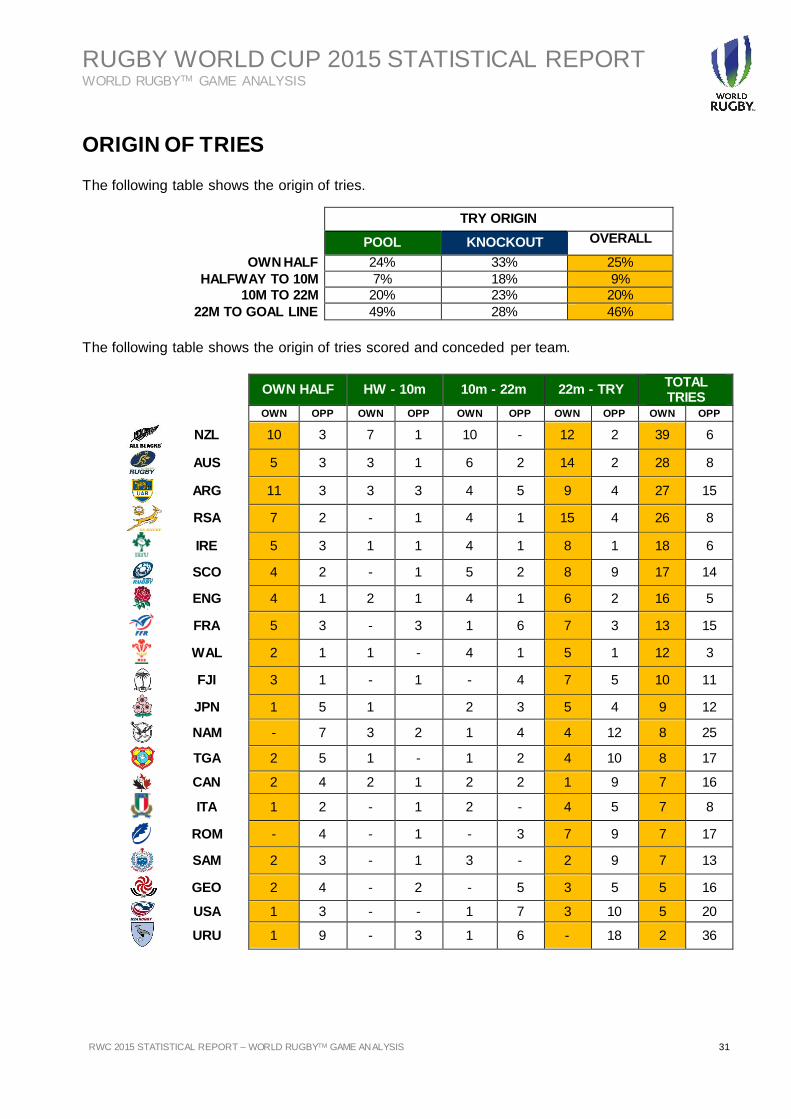
ORIGIN OF TRIES The following table shows the origin of tries.
The following table shows the origin of tries scored and conceded per team.
TRY ORIGIN
POOL KNOCKOUT OVERALL
OWN HALF 24% 33% 25%
HALFWAY TO 10M 7% 18% 9%
10M TO 22M 20% 23% 20%
22M TO GOAL LINE 49% 28% 46%
OWN HALF HW - 10m 10m - 22m 22m - TRY TOTAL TRIES
OWN OPP OWN OPP OWN OPP OWN OPP OWN OPP
NZL 10 3 7 1 10 - 12 2 39 6
AUS 5 3 3 1 6 2 14 2 28 8
ARG 11 3 3 3 4 5 9 4 27 15
RSA 7 2 - 1 4 1 15 4 26 8
IRE 5 3 1 1 4 1 8 1 18 6
SCO 4 2 - 1 5 2 8 9 17 14
ENG 4 1 2 1 4 1 6 2 16 5
FRA 5 3 - 3 1 6 7 3 13 15
WAL 2 1 1 - 4 1 5 1 12 3
FJI 3 1 - 1 - 4 7 5 10 11
JPN 1 5 1 2 3 5 4 9 12
NAM - 7 3 2 1 4 4 12 8 25
TGA 2 5 1 - 1 2 4 10 8 17
CAN 2 4 2 1 2 2 1 9 7 16
ITA 1 2 - 1 2 - 4 5 7 8
ROM - 4 - 1 - 3 7 9 7 17
SAM 2 3 - 1 3 - 2 9 7 13
GEO 2 4 - 2 - 5 3 5 5 16
USA 1 3 - - 1 7 3 10 5 20
URU 1 9 - 3 1 6 - 18 2 36
RUGBY WORLD CUP 2015 STATISTICAL REPORT WORLD RUGBYTM GAME ANALYSIS
32 RWC 2015 STATISTICAL REPORT – WORLD RUGBY GAME ANALYSIS 32 Filename/Filepath
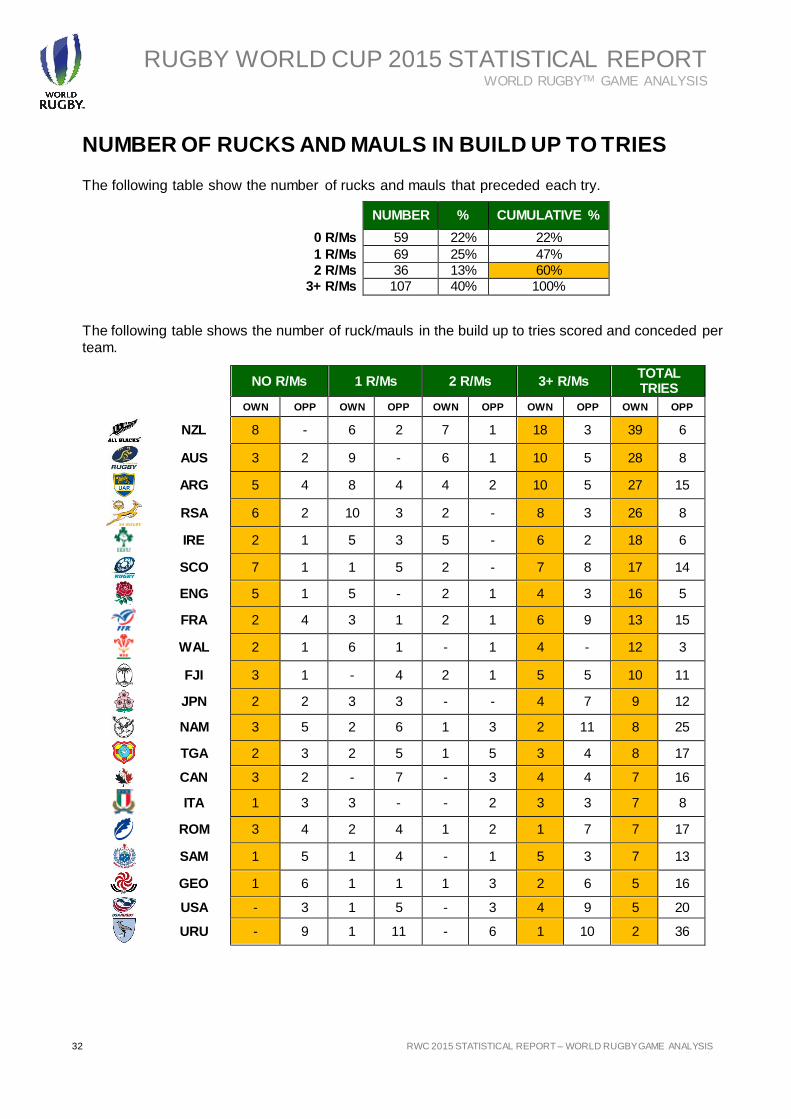
NUMBER OF RUCKS AND MAULS IN BUILD UP TO TRIES The following table show the number of rucks and mauls that preceded each try.
The following table shows the number of ruck/mauls in the build up to tries scored and conceded per team.
NUMBER % CUMULATIVE %
0 R/Ms 59 22% 22%
1 R/Ms 69 25% 47%
2 R/Ms 36 13% 60%
3+ R/Ms 107 40% 100%
NO R/Ms 1 R/Ms 2 R/Ms 3+ R/Ms TOTAL TRIES
OWN OPP OWN OPP OWN OPP OWN OPP OWN OPP
NZL 8 - 6 2 7 1 18 3 39 6
AUS 3 2 9 - 6 1 10 5 28 8
ARG 5 4 8 4 4 2 10 5 27 15
RSA 6 2 10 3 2 - 8 3 26 8
IRE 2 1 5 3 5 - 6 2 18 6
SCO 7 1 1 5 2 - 7 8 17 14
ENG 5 1 5 - 2 1 4 3 16 5
FRA 2 4 3 1 2 1 6 9 13 15
WAL 2 1 6 1 - 1 4 - 12 3
FJI 3 1 - 4 2 1 5 5 10 11
JPN 2 2 3 3 - - 4 7 9 12
NAM 3 5 2 6 1 3 2 11 8 25
TGA 2 3 2 5 1 5 3 4 8 17
CAN 3 2 - 7 - 3 4 4 7 16
ITA 1 3 3 - - 2 3 3 7 8
ROM 3 4 2 4 1 2 1 7 7 17
SAM 1 5 1 4 - 1 5 3 7 13
GEO 1 6 1 1 1 3 2 6 5 16
USA - 3 1 5 - 3 4 9 5 20
URU - 9 1 11 - 6 1 10 2 36
RUGBY WORLD CUP 2015 STATISTICAL REPORT WORLD RUGBYTM GAME ANALYSIS
RWC 2015 STATISTICAL REPORT – WORLD RUGBYTM GAME ANALYSIS 33
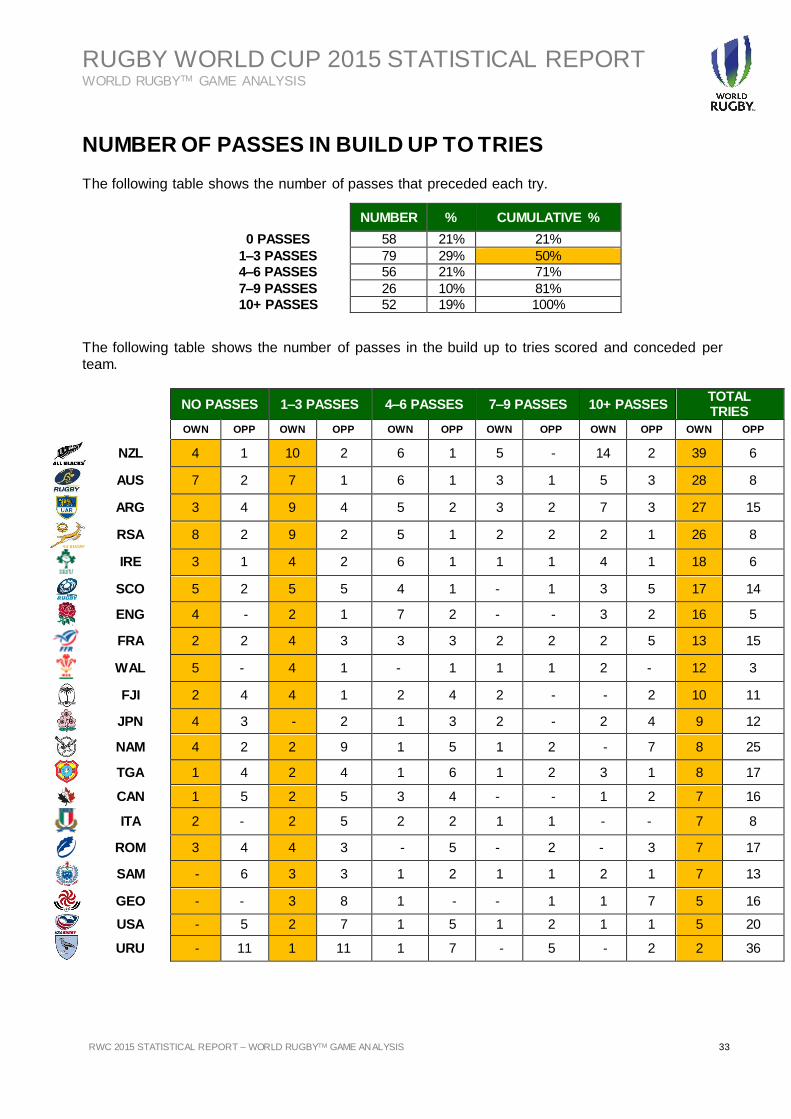
NUMBER OF PASSES IN BUILD UP TO TRIES The following table shows the number of passes that preceded each try.
The following table shows the number of passes in the build up to tries scored and conceded per team.
NUMBER % CUMULATIVE %
0 PASSES 58 21% 21%
1–3 PASSES 79 29% 50%
4–6 PASSES 56 21% 71%
7–9 PASSES 26 10% 81%
10+ PASSES 52 19% 100%
NO PASSES 1–3 PASSES 4–6 PASSES 7–9 PASSES 10+ PASSES TOTAL TRIES
OWN OPP OWN OPP OWN OPP OWN OPP OWN OPP OWN OPP
NZL 4 1 10 2 6 1 5 - 14 2 39 6
AUS 7 2 7 1 6 1 3 1 5 3 28 8
ARG 3 4 9 4 5 2 3 2 7 3 27 15
RSA 8 2 9 2 5 1 2 2 2 1 26 8
IRE 3 1 4 2 6 1 1 1 4 1 18 6
SCO 5 2 5 5 4 1 - 1 3 5 17 14
ENG 4 - 2 1 7 2 - - 3 2 16 5
FRA 2 2 4 3 3 3 2 2 2 5 13 15
WAL 5 - 4 1 - 1 1 1 2 - 12 3
FJI 2 4 4 1 2 4 2 - - 2 10 11
JPN 4 3 - 2 1 3 2 - 2 4 9 12
NAM 4 2 2 9 1 5 1 2 - 7 8 25
TGA 1 4 2 4 1 6 1 2 3 1 8 17
CAN 1 5 2 5 3 4 - - 1 2 7 16
ITA 2 - 2 5 2 2 1 1 - - 7 8
ROM 3 4 4 3 - 5 - 2 - 3 7 17
SAM - 6 3 3 1 2 1 1 2 1 7 13
GEO - - 3 8 1 - - 1 1 7 5 16
USA - 5 2 7 1 5 1 2 1 1 5 20
URU - 11 1 11 1 7 - 5 - 2 2 36
RUGBY WORLD CUP 2015 STATISTICAL REPORT WORLD RUGBYTM GAME ANALYSIS
34 RWC 2015 STATISTICAL REPORT – WORLD RUGBY GAME ANALYSIS 34 Filename/Filepath
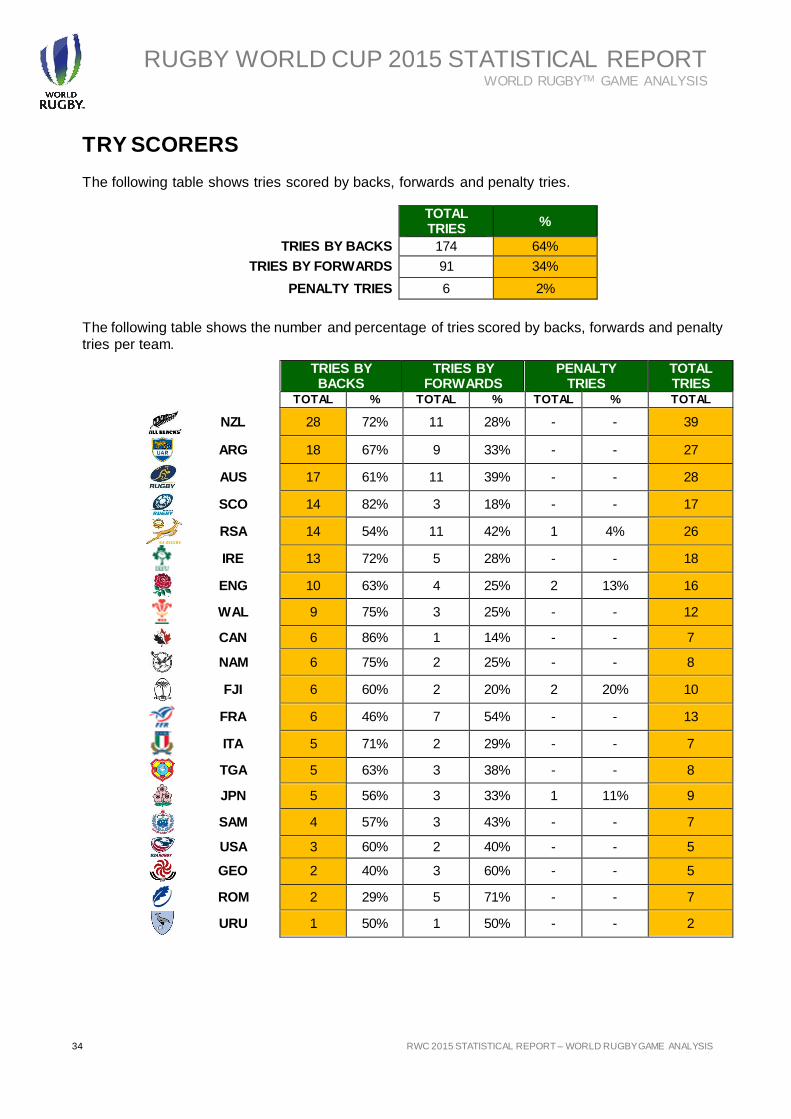
TRY SCORERS
The following table shows tries scored by backs, forwards and penalty tries.
The following table shows the number and percentage of tries scored by backs, forwards and penalty tries per team.
TOTAL TRIES
%
TRIES BY BACKS 174 64%
TRIES BY FORWARDS 91 34%
PENALTY TRIES 6 2%
TRIES BY BACKS
TRIES BY FORWARDS
PENALTY TRIES
TOTAL TRIES
TOTAL % TOTAL % TOTAL % TOTAL
NZL 28 72% 11 28% - - 39
ARG 18 67% 9 33% - - 27
AUS 17 61% 11 39% - - 28
SCO 14 82% 3 18% - - 17
RSA 14 54% 11 42% 1 4% 26
IRE 13 72% 5 28% - - 18
ENG 10 63% 4 25% 2 13% 16
WAL 9 75% 3 25% - - 12
CAN 6 86% 1 14% - - 7
NAM 6 75% 2 25% - - 8
FJI 6 60% 2 20% 2 20% 10
FRA 6 46% 7 54% - - 13
ITA 5 71% 2 29% - - 7
TGA 5 63% 3 38% - - 8
JPN 5 56% 3 33% 1 11% 9
SAM 4 57% 3 43% - - 7
USA 3 60% 2 40% - - 5
GEO 2 40% 3 60% - - 5
ROM 2 29% 5 71% - - 7
URU 1 50% 1 50% - - 2
RUGBY WORLD CUP 2015 STATISTICAL REPORT WORLD RUGBYTM GAME ANALYSIS
RWC 2015 STATISTICAL REPORT – WORLD RUGBYTM GAME ANALYSIS 35
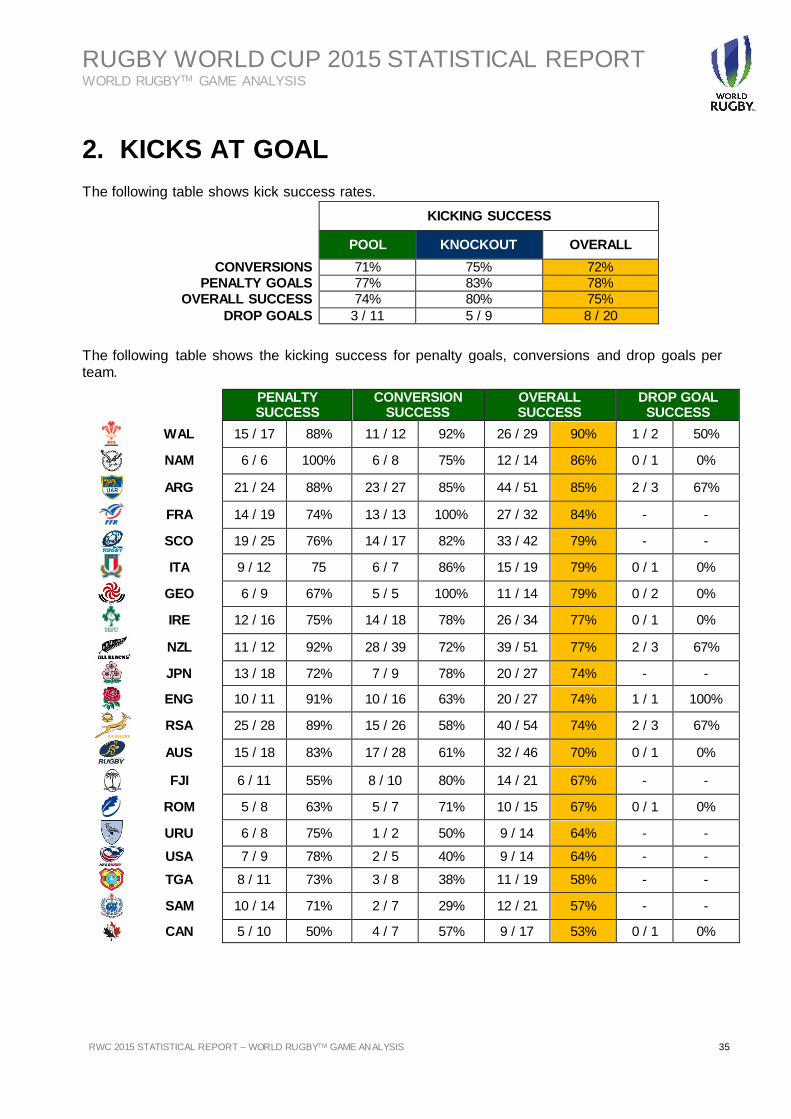
2. KICKS AT GOAL The following table shows kick success rates.
The following table shows the kicking success for penalty goals, conversions and drop goals per team.
KICKING SUCCESS
POOL KNOCKOUT OVERALL
CONVERSIONS 71% 75% 72%
PENALTY GOALS 77% 83% 78%
OVERALL SUCCESS 74% 80% 75%
DROP GOALS 3 / 11 5 / 9 8 / 20
PENALTY SUCCESS
CONVERSION SUCCESS
OVERALL SUCCESS
DROP GOAL SUCCESS
WAL 15 / 17 88% 11 / 12 92% 26 / 29 90% 1 / 2 50%
NAM 6 / 6 100% 6 / 8 75% 12 / 14 86% 0 / 1 0%
ARG 21 / 24 88% 23 / 27 85% 44 / 51 85% 2 / 3 67%
FRA 14 / 19 74% 13 / 13 100% 27 / 32 84% - -
SCO 19 / 25 76% 14 / 17 82% 33 / 42 79% - -
ITA 9 / 12 75 6 / 7 86% 15 / 19 79% 0 / 1 0%
GEO 6 / 9 67% 5 / 5 100% 11 / 14 79% 0 / 2 0%
IRE 12 / 16 75% 14 / 18 78% 26 / 34 77% 0 / 1 0%
NZL 11 / 12 92% 28 / 39 72% 39 / 51 77% 2 / 3 67%
JPN 13 / 18 72% 7 / 9 78% 20 / 27 74% - -
ENG 10 / 11 91% 10 / 16 63% 20 / 27 74% 1 / 1 100%
RSA 25 / 28 89% 15 / 26 58% 40 / 54 74% 2 / 3 67%
AUS 15 / 18 83% 17 / 28 61% 32 / 46 70% 0 / 1 0%
FJI 6 / 11 55% 8 / 10 80% 14 / 21 67% - -
ROM 5 / 8 63% 5 / 7 71% 10 / 15 67% 0 / 1 0%
URU 6 / 8 75% 1 / 2 50% 9 / 14 64% - -
USA 7 / 9 78% 2 / 5 40% 9 / 14 64% - -
TGA 8 / 11 73% 3 / 8 38% 11 / 19 58% - -
SAM 10 / 14 71% 2 / 7 29% 12 / 21 57% - -
CAN 5 / 10 50% 4 / 7 57% 9 / 17 53% 0 / 1 0%
RUGBY WORLD CUP 2015 STATISTICAL REPORT WORLD RUGBYTM GAME ANALYSIS
36 RWC 2015 STATISTICAL REPORT – WORLD RUGBY GAME ANALYSIS 36 Filename/Filepath
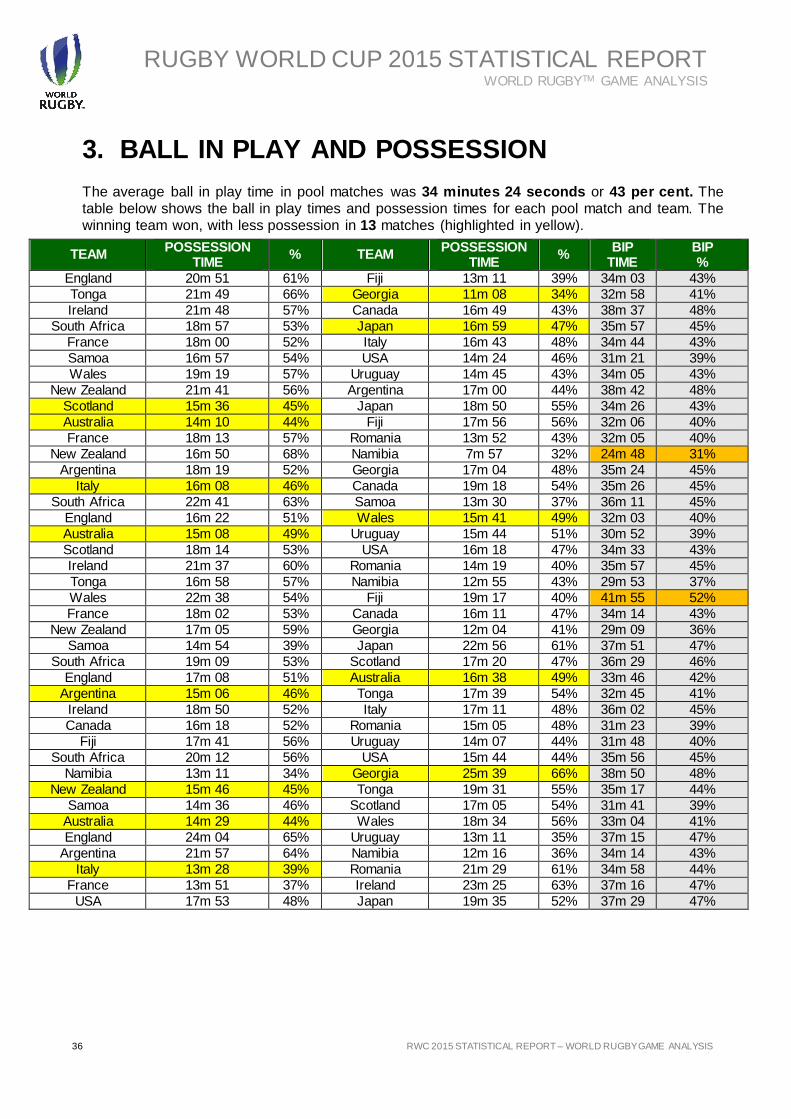
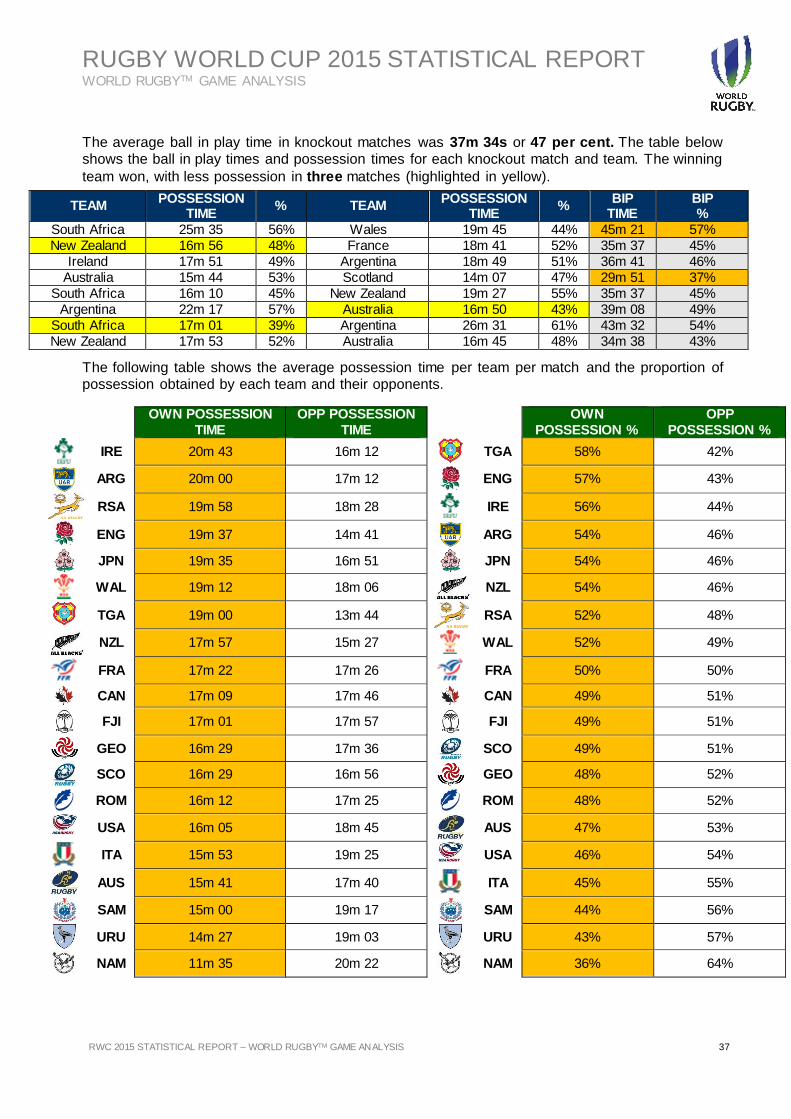
3. BALL IN PLAY AND POSSESSION The average ball in play time in pool matches was 34 minutes 24 seconds or 43 per cent. The table below shows the ball in play times and possession times for each pool match and team. The winning team won, with less possession in 13 matches (highlighted in yellow).
TEAM POSSESSION
TIME % TEAM
POSSESSION TIME
% BIP
TIME BIP %
England 20m 51 61% Fiji 13m 11 39% 34m 03 43%
Tonga 21m 49 66% Georgia 11m 08 34% 32m 58 41%
Ireland 21m 48 57% Canada 16m 49 43% 38m 37 48%
South Africa 18m 57 53% Japan 16m 59 47% 35m 57 45%
France 18m 00 52% Italy 16m 43 48% 34m 44 43%
Samoa 16m 57 54% USA 14m 24 46% 31m 21 39%
Wales 19m 19 57% Uruguay 14m 45 43% 34m 05 43%
New Zealand 21m 41 56% Argentina 17m 00 44% 38m 42 48%
Scotland 15m 36 45% Japan 18m 50 55% 34m 26 43%
Australia 14m 10 44% Fiji 17m 56 56% 32m 06 40%
France 18m 13 57% Romania 13m 52 43% 32m 05 40%
New Zealand 16m 50 68% Namibia 7m 57 32% 24m 48 31%
Argentina 18m 19 52% Georgia 17m 04 48% 35m 24 45%
Italy 16m 08 46% Canada 19m 18 54% 35m 26 45%
South Africa 22m 41 63% Samoa 13m 30 37% 36m 11 45%
England 16m 22 51% Wales 15m 41 49% 32m 03 40%
Australia 15m 08 49% Uruguay 15m 44 51% 30m 52 39%
Scotland 18m 14 53% USA 16m 18 47% 34m 33 43%
Ireland 21m 37 60% Romania 14m 19 40% 35m 57 45%
Tonga 16m 58 57% Namibia 12m 55 43% 29m 53 37%
Wales 22m 38 54% Fiji 19m 17 40% 41m 55 52%
France 18m 02 53% Canada 16m 11 47% 34m 14 43%
New Zealand 17m 05 59% Georgia 12m 04 41% 29m 09 36%
Samoa 14m 54 39% Japan 22m 56 61% 37m 51 47%
South Africa 19m 09 53% Scotland 17m 20 47% 36m 29 46%
England 17m 08 51% Australia 16m 38 49% 33m 46 42%
Argentina 15m 06 46% Tonga 17m 39 54% 32m 45 41%
Ireland 18m 50 52% Italy 17m 11 48% 36m 02 45%
Canada 16m 18 52% Romania 15m 05 48% 31m 23 39%
Fiji 17m 41 56% Uruguay 14m 07 44% 31m 48 40%
South Africa 20m 12 56% USA 15m 44 44% 35m 56 45%
Namibia 13m 11 34% Georgia 25m 39 66% 38m 50 48%
New Zealand 15m 46 45% Tonga 19m 31 55% 35m 17 44%
Samoa 14m 36 46% Scotland 17m 05 54% 31m 41 39%
Australia 14m 29 44% Wales 18m 34 56% 33m 04 41%
England 24m 04 65% Uruguay 13m 11 35% 37m 15 47%
Argentina 21m 57 64% Namibia 12m 16 36% 34m 14 43%
Italy 13m 28 39% Romania 21m 29 61% 34m 58 44%
France 13m 51 37% Ireland 23m 25 63% 37m 16 47%
USA 17m 53 48% Japan 19m 35 52% 37m 29 47%
RUGBY WORLD CUP 2015 STATISTICAL REPORT WORLD RUGBYTM GAME ANALYSIS
RWC 2015 STATISTICAL REPORT – WORLD RUGBYTM GAME ANALYSIS 37
The average ball in play time in knockout matches was 37m 34s or 47 per cent. The table below shows the ball in play times and possession times for each knockout match and team. The winning
team won, with less possession in three matches (highlighted in yellow).
The following table shows the average possession time per team per match and the proportion of possession obtained by each team and their opponents.
TEAM POSSESSION
TIME % TEAM
POSSESSION TIME
% BIP
TIME BIP %
South Africa 25m 35 56% Wales 19m 45 44% 45m 21 57%
New Zealand 16m 56 48% France 18m 41 52% 35m 37 45%
Ireland 17m 51 49% Argentina 18m 49 51% 36m 41 46%
Australia 15m 44 53% Scotland 14m 07 47% 29m 51 37%
South Africa 16m 10 45% New Zealand 19m 27 55% 35m 37 45%
Argentina 22m 17 57% Australia 16m 50 43% 39m 08 49%
South Africa 17m 01 39% Argentina 26m 31 61% 43m 32 54%
New Zealand 17m 53 52% Australia 16m 45 48% 34m 38 43%
OWN POSSESSION
TIME
OPP POSSESSION
TIME
OWN
POSSESSION %
OPP
POSSESSION %
IRE 20m 43 16m 12
TGA 58% 42%
ARG 20m 00 17m 12
ENG 57% 43%
RSA 19m 58 18m 28
IRE 56% 44%
ENG 19m 37 14m 41
ARG 54% 46%
JPN 19m 35 16m 51
JPN 54% 46%
WAL 19m 12 18m 06
NZL 54% 46%
TGA 19m 00 13m 44
RSA 52% 48%
NZL 17m 57 15m 27
WAL 52% 49%
FRA 17m 22 17m 26
FRA 50% 50%
CAN 17m 09 17m 46 CAN 49% 51%
FJI 17m 01 17m 57
FJI 49% 51%
GEO 16m 29 17m 36
SCO 49% 51%
SCO 16m 29 16m 56
GEO 48% 52%
ROM 16m 12 17m 25
ROM 48% 52%
USA 16m 05 18m 45
AUS 47% 53%
ITA 15m 53 19m 25 USA 46% 54%
AUS 15m 41 17m 40
ITA 45% 55%
SAM 15m 00 19m 17
SAM 44% 56%
URU 14m 27 19m 03
URU 43% 57%
NAM 11m 35 20m 22
NAM 36% 64%
RUGBY WORLD CUP 2015 STATISTICAL REPORT WORLD RUGBYTM GAME ANALYSIS
38 RWC 2015 STATISTICAL REPORT – WORLD RUGBY GAME ANALYSIS 38 Filename/Filepath
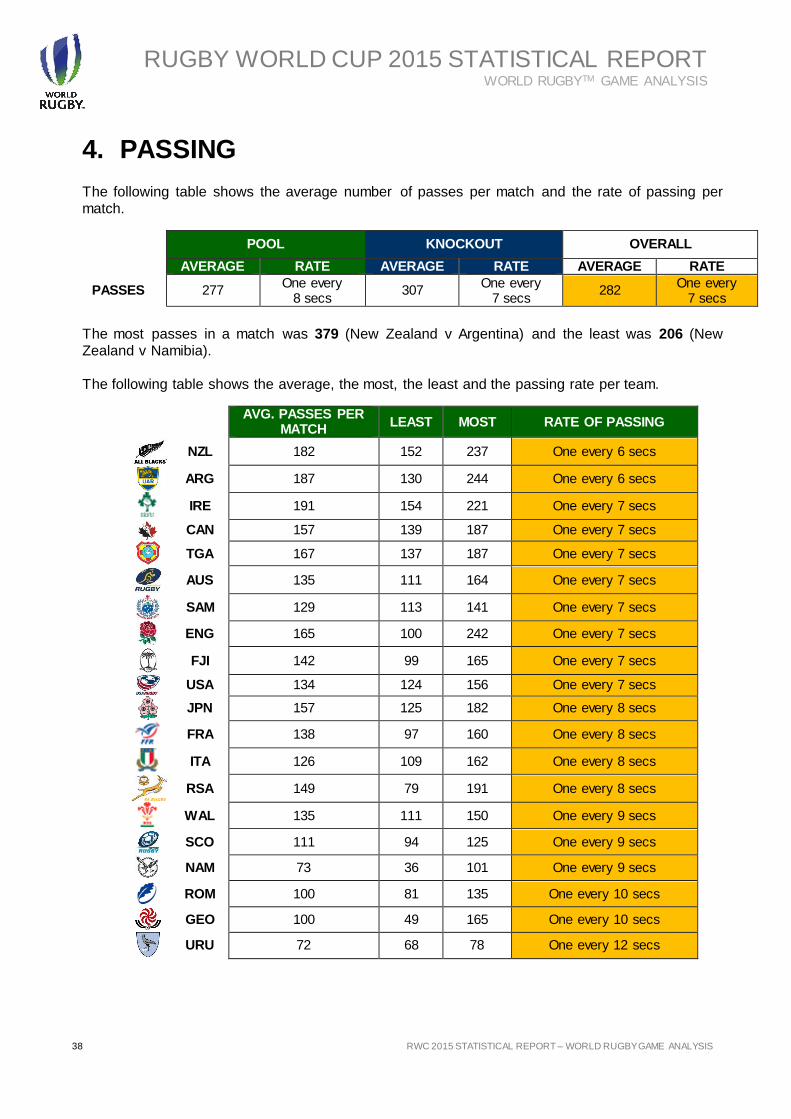
4. PASSING The following table shows the average number of passes per match and the rate of passing per match.
The most passes in a match was 379 (New Zealand v Argentina) and the least was 206 (New Zealand v Namibia). The following table shows the average, the most, the least and the passing rate per team.
POOL KNOCKOUT OVERALL
AVERAGE RATE AVERAGE RATE AVERAGE RATE
PASSES 277 One every
8 secs 307
One every 7 secs
282 One every
7 secs
AVG. PASSES PER MATCH
LEAST MOST RATE OF PASSING
NZL 182 152 237 One every 6 secs
ARG 187 130 244 One every 6 secs
IRE 191 154 221 One every 7 secs
CAN 157 139 187 One every 7 secs
TGA 167 137 187 One every 7 secs
AUS 135 111 164 One every 7 secs
SAM 129 113 141 One every 7 secs
ENG 165 100 242 One every 7 secs
FJI 142 99 165 One every 7 secs
USA 134 124 156 One every 7 secs
JPN 157 125 182 One every 8 secs
FRA 138 97 160 One every 8 secs
ITA 126 109 162 One every 8 secs
RSA 149 79 191 One every 8 secs
WAL 135 111 150 One every 9 secs
SCO 111 94 125 One every 9 secs
NAM 73 36 101 One every 9 secs
ROM 100 81 135 One every 10 secs
GEO 100 49 165 One every 10 secs
URU 72 68 78 One every 12 secs
RUGBY WORLD CUP 2015 STATISTICAL REPORT WORLD RUGBYTM GAME ANALYSIS
RWC 2015 STATISTICAL REPORT – WORLD RUGBYTM GAME ANALYSIS 39
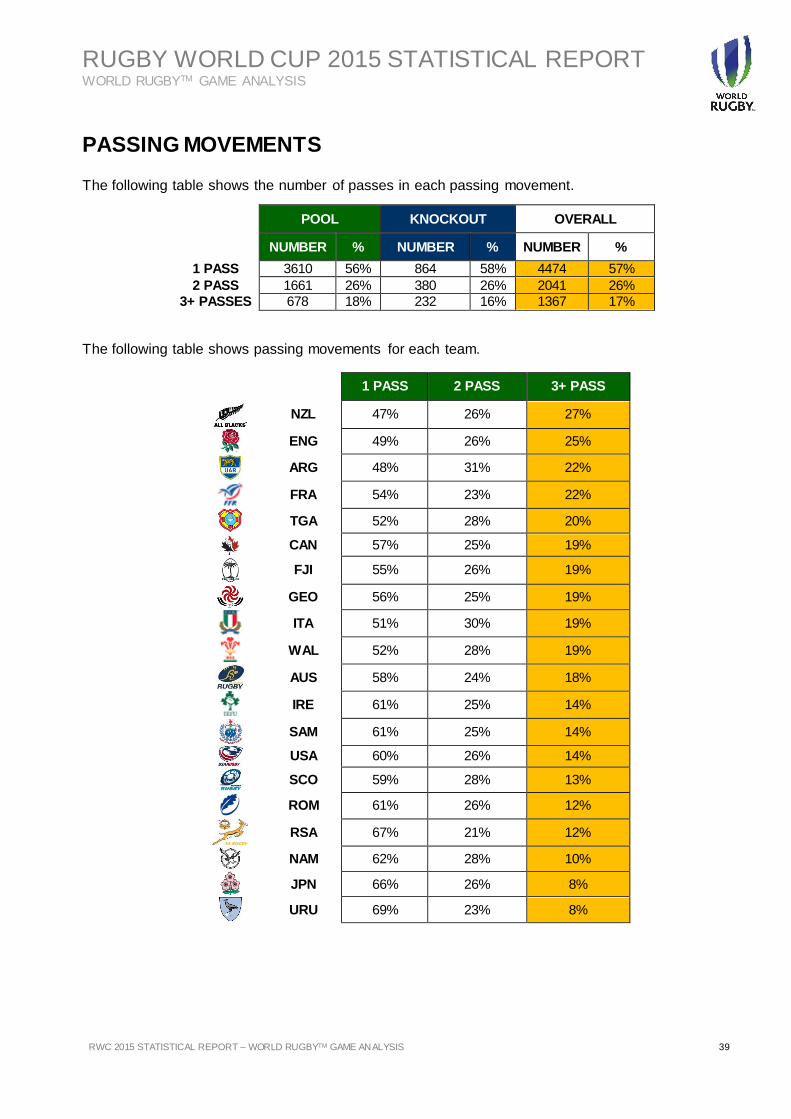
PASSING MOVEMENTS The following table shows the number of passes in each passing movement.
The following table shows passing movements for each team.
POOL KNOCKOUT OVERALL
NUMBER % NUMBER % NUMBER %
1 PASS 3610 56% 864 58% 4474 57%
2 PASS 1661 26% 380 26% 2041 26%
3+ PASSES 678 18% 232 16% 1367 17%
1 PASS 2 PASS 3+ PASS
NZL 47% 26% 27%
ENG 49% 26% 25%
ARG 48% 31% 22%
FRA 54% 23% 22%
TGA 52% 28% 20%
CAN 57% 25% 19%
FJI 55% 26% 19%
GEO 56% 25% 19%
ITA 51% 30% 19%
WAL 52% 28% 19%
AUS 58% 24% 18%
IRE 61% 25% 14%
SAM 61% 25% 14%
USA 60% 26% 14%
SCO 59% 28% 13%
ROM 61% 26% 12%
RSA 67% 21% 12%
NAM 62% 28% 10%
JPN 66% 26% 8%
URU 69% 23% 8%
RUGBY WORLD CUP 2015 STATISTICAL REPORT WORLD RUGBYTM GAME ANALYSIS
40 RWC 2015 STATISTICAL REPORT – WORLD RUGBY GAME ANALYSIS 40 Filename/Filepath
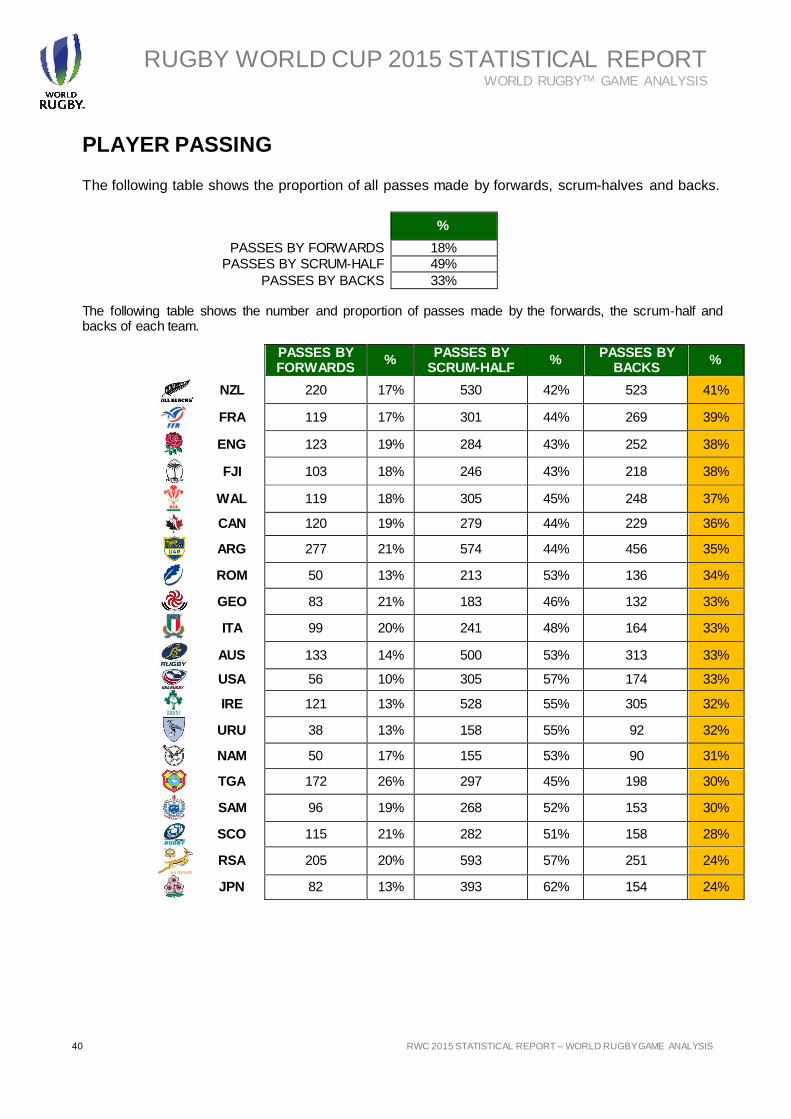
PLAYER PASSING The following table shows the proportion of all passes made by forwards, scrum-halves and backs.
The following table shows the number and proportion of passes made by the forwards, the scrum-half and backs of each team.
%
PASSES BY FORWARDS 18%
PASSES BY SCRUM-HALF 49%
PASSES BY BACKS 33%
PASSES BY FORWARDS
% PASSES BY
SCRUM-HALF %
PASSES BY BACKS
%
NZL 220 17% 530 42% 523 41%
FRA 119 17% 301 44% 269 39%
ENG 123 19% 284 43% 252 38%
FJI 103 18% 246 43% 218 38%
WAL 119 18% 305 45% 248 37%
CAN 120 19% 279 44% 229 36%
ARG 277 21% 574 44% 456 35%
ROM 50 13% 213 53% 136 34%
GEO 83 21% 183 46% 132 33%
ITA 99 20% 241 48% 164 33%
AUS 133 14% 500 53% 313 33%
USA 56 10% 305 57% 174 33%
IRE 121 13% 528 55% 305 32%
URU 38 13% 158 55% 92 32%
NAM 50 17% 155 53% 90 31%
TGA 172 26% 297 45% 198 30%
SAM 96 19% 268 52% 153 30%
SCO 115 21% 282 51% 158 28%
RSA 205 20% 593 57% 251 24%
JPN 82 13% 393 62% 154 24%
RUGBY WORLD CUP 2015 STATISTICAL REPORT WORLD RUGBYTM GAME ANALYSIS
RWC 2015 STATISTICAL REPORT – WORLD RUGBYTM GAME ANALYSIS 41
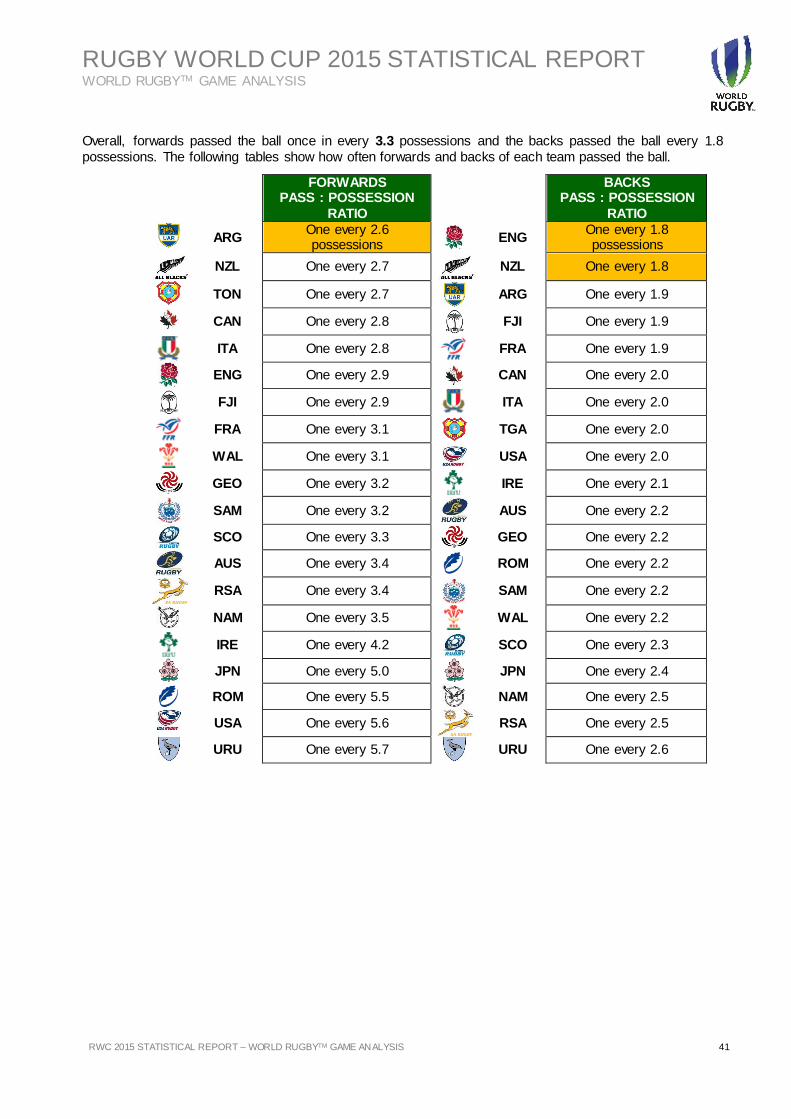
Overall, forwards passed the ball once in every 3.3 possessions and the backs passed the ball every 1.8
possessions. The following tables show how often forwards and backs of each team passed the ball.
FORWARDS PASS : POSSESSION
RATIO
BACKS PASS : POSSESSION
RATIO
ARG One every 2.6 possessions
ENG One every 1.8 possessions
NZL One every 2.7
NZL One every 1.8
TON One every 2.7
ARG One every 1.9
CAN One every 2.8
FJI One every 1.9
ITA One every 2.8
FRA One every 1.9
ENG One every 2.9
CAN One every 2.0
FJI One every 2.9
ITA One every 2.0
FRA One every 3.1
TGA One every 2.0
WAL One every 3.1 USA One every 2.0
GEO One every 3.2
IRE One every 2.1
SAM One every 3.2
AUS One every 2.2
SCO One every 3.3
GEO One every 2.2
AUS One every 3.4
ROM One every 2.2
RSA One every 3.4
SAM One every 2.2
NAM One every 3.5
WAL One every 2.2
IRE One every 4.2
SCO One every 2.3
JPN One every 5.0
JPN One every 2.4
ROM One every 5.5
NAM One every 2.5
USA One every 5.6
RSA One every 2.5
URU One every 5.7
URU One every 2.6
RUGBY WORLD CUP 2015 STATISTICAL REPORT WORLD RUGBYTM GAME ANALYSIS
42 RWC 2015 STATISTICAL REPORT – WORLD RUGBY GAME ANALYSIS 42 Filename/Filepath
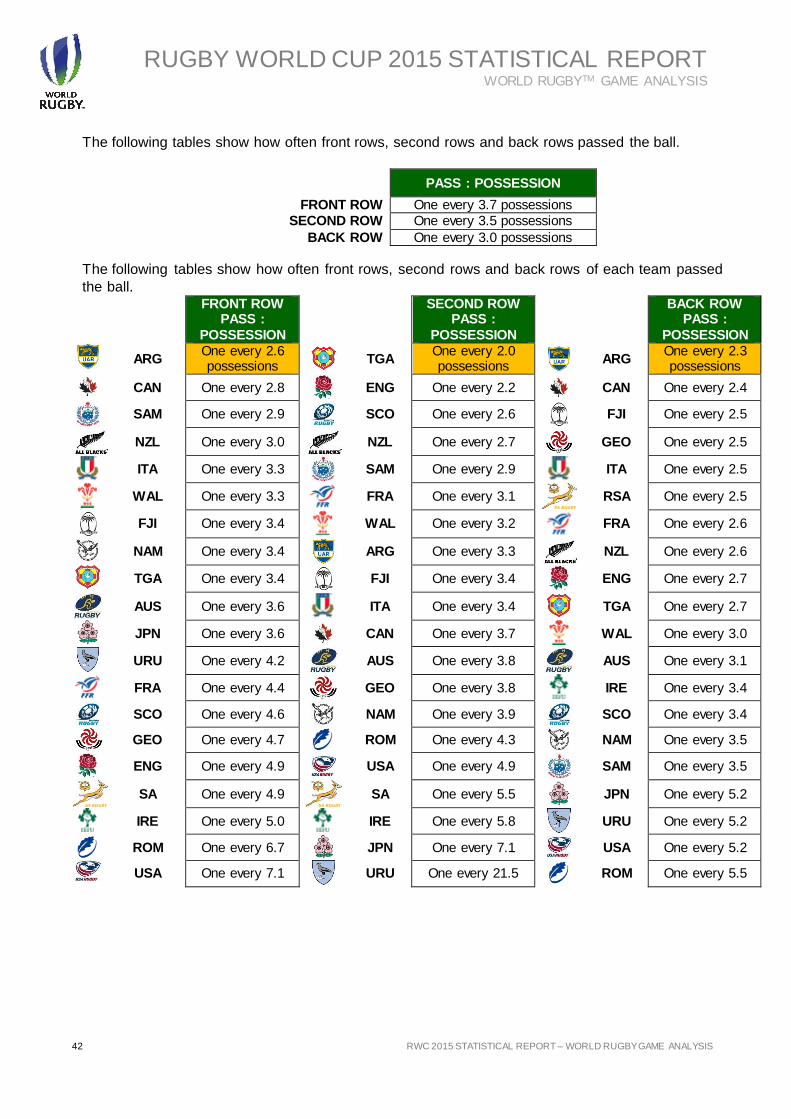
The following tables show how often front rows, second rows and back rows passed the ball.
The following tables show how often front rows, second rows and back rows of each team passed
the ball.
PASS : POSSESSION
FRONT ROW One every 3.7 possessions
SECOND ROW One every 3.5 possessions
BACK ROW One every 3.0 possessions
FRONT ROW PASS :
POSSESSION
SECOND ROW PASS :
POSSESSION
BACK ROW PASS :
POSSESSION
ARG One every 2.6 possessions
TGA One every 2.0 possessions
ARG One every 2.3 possessions
CAN One every 2.8
ENG One every 2.2 CAN One every 2.4
SAM One every 2.9
SCO One every 2.6
FJI One every 2.5
NZL One every 3.0
NZL One every 2.7
GEO One every 2.5
ITA One every 3.3
SAM One every 2.9
ITA One every 2.5
WAL One every 3.3
FRA One every 3.1
RSA One every 2.5
FJI One every 3.4
WAL One every 3.2
FRA One every 2.6
NAM One every 3.4
ARG One every 3.3
NZL One every 2.6
TGA One every 3.4
FJI One every 3.4
ENG One every 2.7
AUS One every 3.6
ITA One every 3.4
TGA One every 2.7
JPN One every 3.6 CAN One every 3.7
WAL One every 3.0
URU One every 4.2
AUS One every 3.8
AUS One every 3.1
FRA One every 4.4
GEO One every 3.8
IRE One every 3.4
SCO One every 4.6
NAM One every 3.9
SCO One every 3.4
GEO One every 4.7
ROM One every 4.3
NAM One every 3.5
ENG One every 4.9 USA One every 4.9
SAM One every 3.5
SA One every 4.9
SA One every 5.5
JPN One every 5.2
IRE One every 5.0
IRE One every 5.8
URU One every 5.2
ROM One every 6.7
JPN One every 7.1 USA One every 5.2
USA One every 7.1
URU One every 21.5
ROM One every 5.5
RUGBY WORLD CUP 2015 STATISTICAL REPORT WORLD RUGBYTM GAME ANALYSIS
RWC 2015 STATISTICAL REPORT – WORLD RUGBYTM GAME ANALYSIS 43
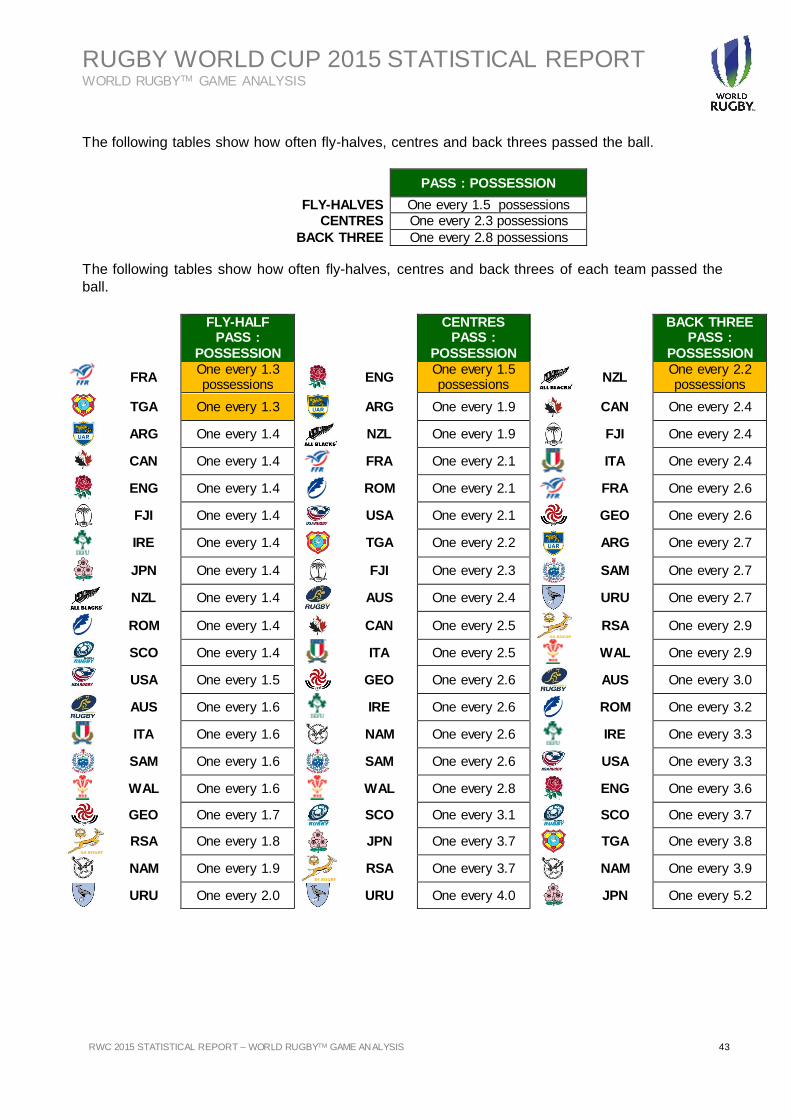
The following tables show how often fly-halves, centres and back threes passed the ball.
The following tables show how often fly-halves, centres and back threes of each team passed the
ball.
PASS : POSSESSION
FLY-HALVES One every 1.5 possessions
CENTRES One every 2.3 possessions
BACK THREE One every 2.8 possessions
FLY-HALF PASS :
POSSESSION
CENTRES PASS :
POSSESSION
BACK THREE PASS :
POSSESSION
FRA One every 1.3 possessions
ENG One every 1.5 possessions
NZL One every 2.2 possessions
TGA One every 1.3
ARG One every 1.9 CAN One every 2.4
ARG One every 1.4
NZL One every 1.9
FJI One every 2.4
CAN One every 1.4
FRA One every 2.1
ITA One every 2.4
ENG One every 1.4
ROM One every 2.1
FRA One every 2.6
FJI One every 1.4 USA One every 2.1
GEO One every 2.6
IRE One every 1.4
TGA One every 2.2
ARG One every 2.7
JPN One every 1.4
FJI One every 2.3
SAM One every 2.7
NZL One every 1.4
AUS One every 2.4
URU One every 2.7
ROM One every 1.4 CAN One every 2.5
RSA One every 2.9
SCO One every 1.4
ITA One every 2.5
WAL One every 2.9
USA One every 1.5
GEO One every 2.6
AUS One every 3.0
AUS One every 1.6
IRE One every 2.6
ROM One every 3.2
ITA One every 1.6
NAM One every 2.6
IRE One every 3.3
SAM One every 1.6
SAM One every 2.6 USA One every 3.3
WAL One every 1.6
WAL One every 2.8
ENG One every 3.6
GEO One every 1.7
SCO One every 3.1
SCO One every 3.7
RSA One every 1.8
JPN One every 3.7
TGA One every 3.8
NAM One every 1.9
RSA One every 3.7
NAM One every 3.9
URU One every 2.0
URU One every 4.0
JPN One every 5.2
RUGBY WORLD CUP 2015 STATISTICAL REPORT WORLD RUGBYTM GAME ANALYSIS
44 RWC 2015 STATISTICAL REPORT – WORLD RUGBY GAME ANALYSIS 44 Filename/Filepath
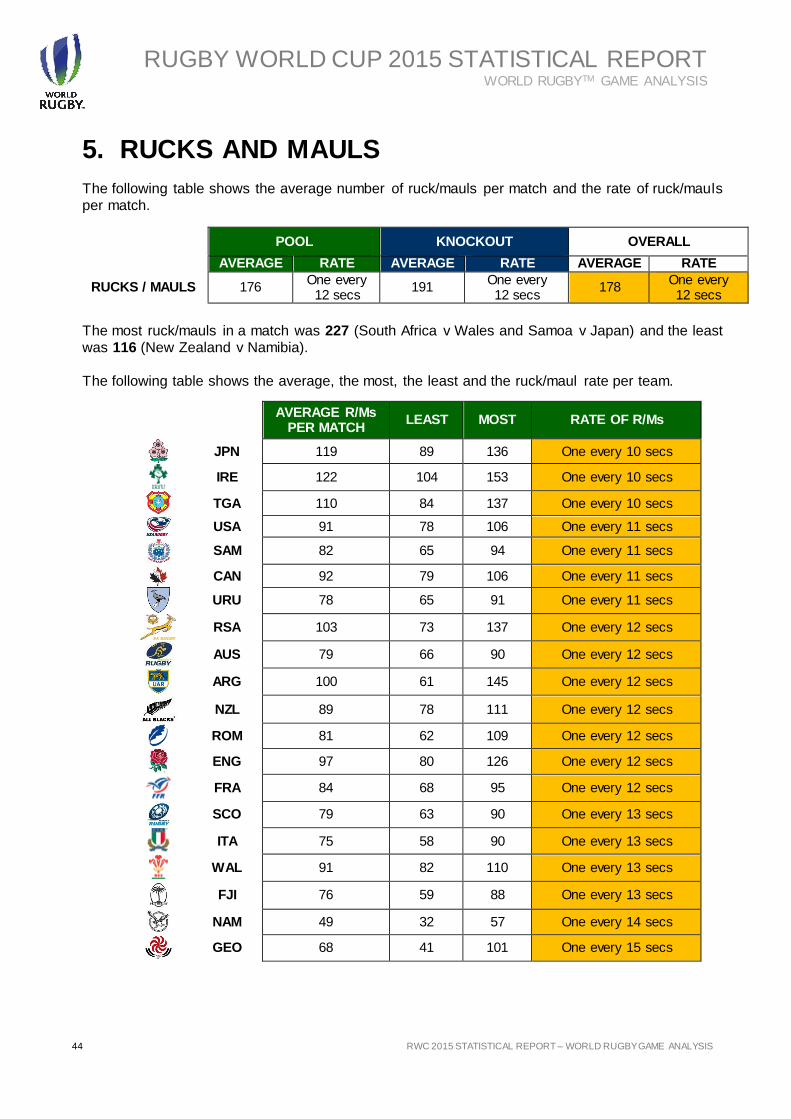
5. RUCKS AND MAULS
The following table shows the average number of ruck/mauls per match and the rate of ruck/mauls per match.
The most ruck/mauls in a match was 227 (South Africa v Wales and Samoa v Japan) and the least was 116 (New Zealand v Namibia). The following table shows the average, the most, the least and the ruck/maul rate per team.
POOL KNOCKOUT OVERALL
AVERAGE RATE AVERAGE RATE AVERAGE RATE
RUCKS / MAULS 176 One every
12 secs 191
One every 12 secs
178 One every 12 secs
AVERAGE R/Ms PER MATCH
LEAST MOST RATE OF R/Ms
JPN 119 89 136 One every 10 secs
IRE 122 104 153 One every 10 secs
TGA 110 84 137 One every 10 secs
USA 91 78 106 One every 11 secs
SAM 82 65 94 One every 11 secs
CAN 92 79 106 One every 11 secs
URU 78 65 91 One every 11 secs
RSA 103 73 137 One every 12 secs
AUS 79 66 90 One every 12 secs
ARG 100 61 145 One every 12 secs
NZL 89 78 111 One every 12 secs
ROM 81 62 109 One every 12 secs
ENG 97 80 126 One every 12 secs
FRA 84 68 95 One every 12 secs
SCO 79 63 90 One every 13 secs
ITA 75 58 90 One every 13 secs
WAL 91 82 110 One every 13 secs
FJI 76 59 88 One every 13 secs
NAM 49 32 57 One every 14 secs
GEO 68 41 101 One every 15 secs
RUGBY WORLD CUP 2015 STATISTICAL REPORT WORLD RUGBYTM GAME ANALYSIS
RWC 2015 STATISTICAL REPORT – WORLD RUGBYTM GAME ANALYSIS 45
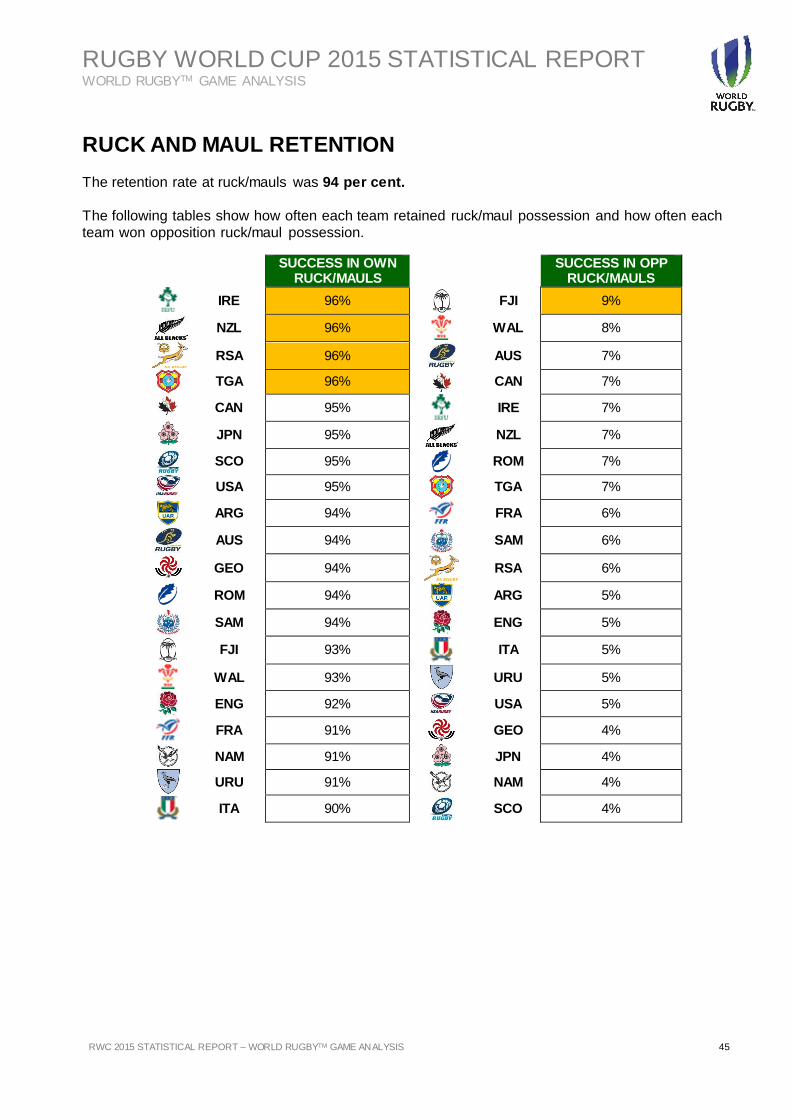
RUCK AND MAUL RETENTION
The retention rate at ruck/mauls was 94 per cent. The following tables show how often each team retained ruck/maul possession and how often each team won opposition ruck/maul possession.
SUCCESS IN OWN RUCK/MAULS
SUCCESS IN OPP RUCK/MAULS
IRE 96%
FJI 9%
NZL 96%
WAL 8%
RSA 96%
AUS 7%
TGA 96%
CAN 7%
CAN 95%
IRE 7%
JPN 95%
NZL 7%
SCO 95%
ROM 7%
USA 95%
TGA 7%
ARG 94%
FRA 6%
AUS 94%
SAM 6%
GEO 94%
RSA 6%
ROM 94%
ARG 5%
SAM 94%
ENG 5%
FJI 93%
ITA 5%
WAL 93%
URU 5%
ENG 92% USA 5%
FRA 91%
GEO 4%
NAM 91%
JPN 4%
URU 91%
NAM 4%
ITA 90%
SCO 4%
RUGBY WORLD CUP 2015 STATISTICAL REPORT WORLD RUGBYTM GAME ANALYSIS
46 RWC 2015 STATISTICAL REPORT – WORLD RUGBY GAME ANALYSIS 46 Filename/Filepath
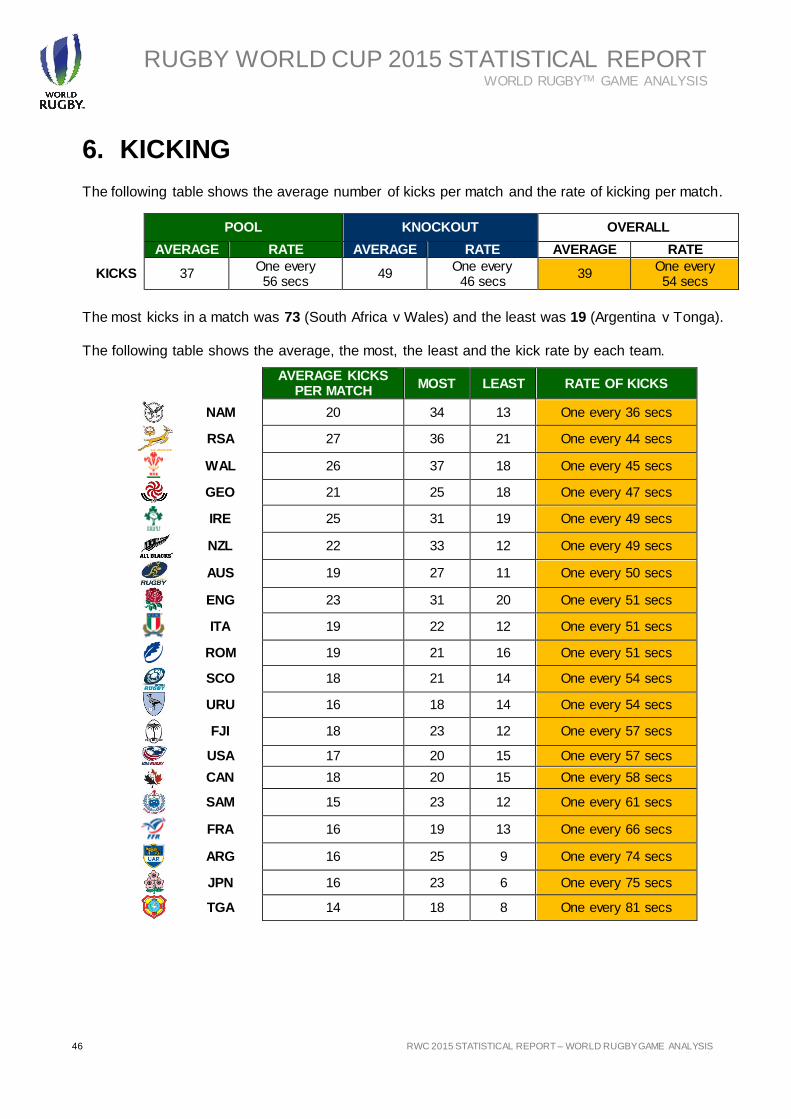
6. KICKING The following table shows the average number of kicks per match and the rate of kicking per match.
The most kicks in a match was 73 (South Africa v Wales) and the least was 19 (Argentina v Tonga). The following table shows the average, the most, the least and the kick rate by each team.
POOL KNOCKOUT OVERALL
AVERAGE RATE AVERAGE RATE AVERAGE RATE
KICKS 37 One every 56 secs
49 One every
46 secs 39
One every 54 secs
AVERAGE KICKS PER MATCH
MOST LEAST RATE OF KICKS
NAM 20 34 13 One every 36 secs
RSA 27 36 21 One every 44 secs
WAL 26 37 18 One every 45 secs
GEO 21 25 18 One every 47 secs
IRE 25 31 19 One every 49 secs
NZL 22 33 12 One every 49 secs
AUS 19 27 11 One every 50 secs
ENG 23 31 20 One every 51 secs
ITA 19 22 12 One every 51 secs
ROM 19 21 16 One every 51 secs
SCO 18 21 14 One every 54 secs
URU 16 18 14 One every 54 secs
FJI 18 23 12 One every 57 secs
USA 17 20 15 One every 57 secs
CAN 18 20 15 One every 58 secs
SAM 15 23 12 One every 61 secs
FRA 16 19 13 One every 66 secs
ARG 16 25 9 One every 74 secs
JPN 16 23 6 One every 75 secs
TGA 14 18 8 One every 81 secs
RUGBY WORLD CUP 2015 STATISTICAL REPORT WORLD RUGBYTM GAME ANALYSIS
RWC 2015 STATISTICAL REPORT – WORLD RUGBYTM GAME ANALYSIS 47
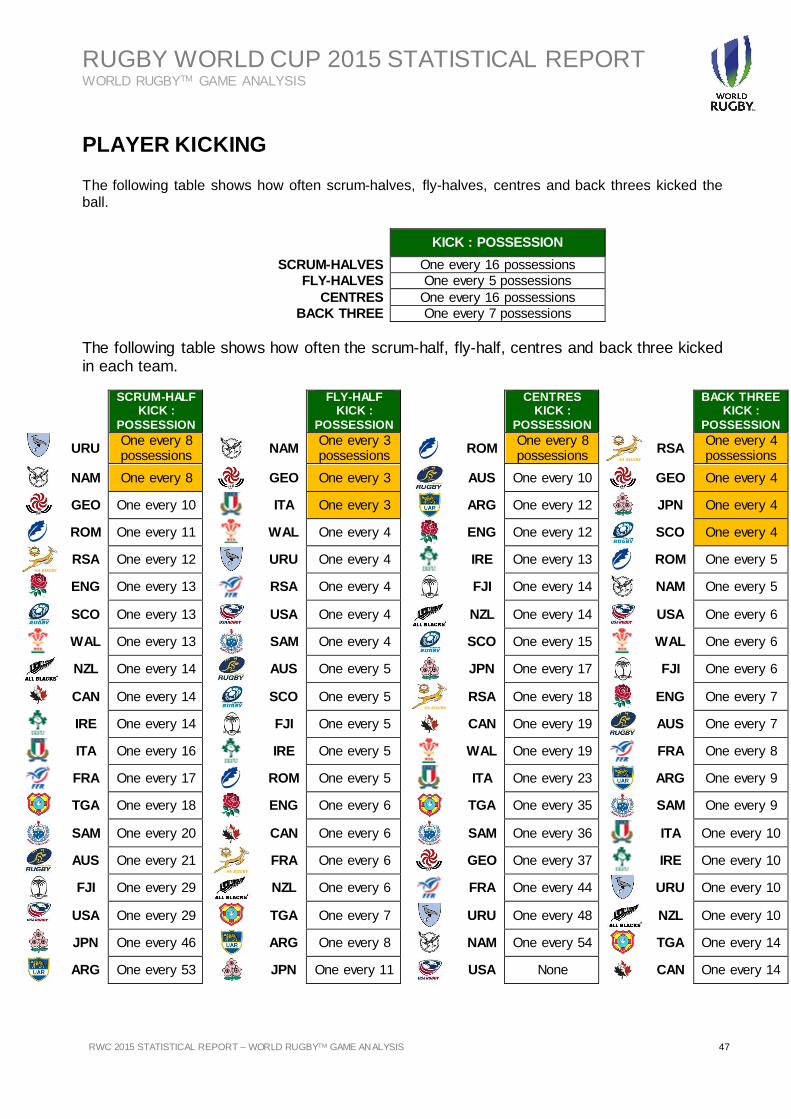
PLAYER KICKING The following table shows how often scrum-halves, fly-halves, centres and back threes kicked the ball.
The following table shows how often the scrum-half, fly-half, centres and back three kicked in each team.
KICK : POSSESSION
SCRUM-HALVES One every 16 possessions
FLY-HALVES One every 5 possessions
CENTRES One every 16 possessions
BACK THREE One every 7 possessions
SCRUM-HALF KICK :
POSSESSION
FLY-HALF KICK :
POSSESSION
CENTRES KICK :
POSSESSION
BACK THREE KICK :
POSSESSION
URU One every 8 possessions
NAM One every 3 possessions
ROM One every 8 possessions
RSA One every 4 possessions
NAM One every 8
GEO One every 3
AUS One every 10
GEO One every 4
GEO One every 10
ITA One every 3
ARG One every 12
JPN One every 4
ROM One every 11
WAL One every 4
ENG One every 12
SCO One every 4
RSA One every 12
URU One every 4
IRE One every 13
ROM One every 5
ENG One every 13
RSA One every 4
FJI One every 14
NAM One every 5
SCO One every 13 USA One every 4
NZL One every 14 USA One every 6
WAL One every 13
SAM One every 4
SCO One every 15
WAL One every 6
NZL One every 14
AUS One every 5
JPN One every 17
FJI One every 6
CAN One every 14
SCO One every 5
RSA One every 18
ENG One every 7
IRE One every 14
FJI One every 5
CAN One every 19
AUS One every 7
ITA One every 16
IRE One every 5
WAL One every 19
FRA One every 8
FRA One every 17
ROM One every 5
ITA One every 23
ARG One every 9
TGA One every 18
ENG One every 6
TGA One every 35
SAM One every 9
SAM One every 20 CAN One every 6
SAM One every 36
ITA One every 10
AUS One every 21
FRA One every 6
GEO One every 37
IRE One every 10
FJI One every 29
NZL One every 6
FRA One every 44
URU One every 10
USA One every 29
TGA One every 7
URU One every 48
NZL One every 10
JPN One every 46
ARG One every 8
NAM One every 54
TGA One every 14
ARG One every 53
JPN One every 11 USA None
CAN One every 14
RUGBY WORLD CUP 2015 STATISTICAL REPORT WORLD RUGBYTM GAME ANALYSIS
48 RWC 2015 STATISTICAL REPORT – WORLD RUGBY GAME ANALYSIS 48 Filename/Filepath
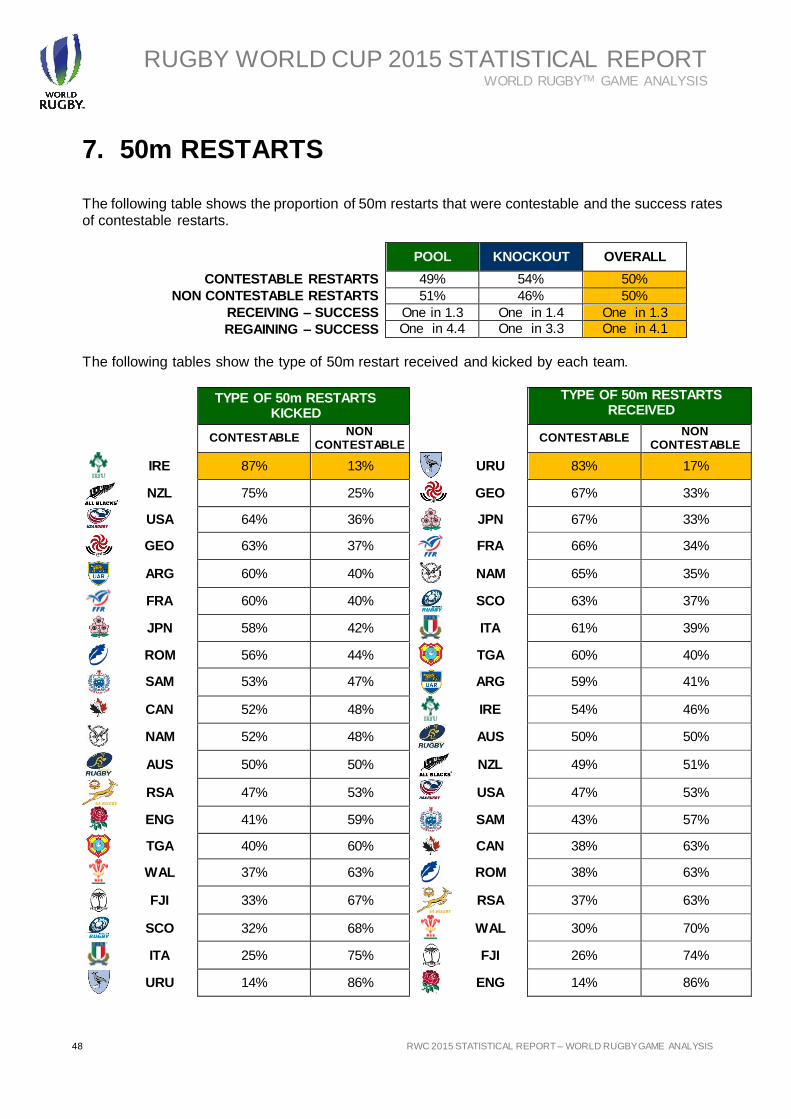
7. 50m RESTARTS
The following table shows the proportion of 50m restarts that were contestable and the success rates of contestable restarts.
The following tables show the type of 50m restart received and kicked by each team.
POOL KNOCKOUT OVERALL
CONTESTABLE RESTARTS 49% 54% 50%
NON CONTESTABLE RESTARTS 51% 46% 50%
RECEIVING – SUCCESS One in 1.3 One in 1.4 One in 1.3
REGAINING – SUCCESS One in 4.4 One in 3.3 One in 4.1
TYPE OF 50m RESTARTS KICKED
TYPE OF 50m RESTARTS RECEIVED
CONTESTABLE NON
CONTESTABLE
CONTESTABLE NON
CONTESTABLE
IRE 87% 13%
URU 83% 17%
NZL 75% 25%
GEO 67% 33%
USA 64% 36%
JPN 67% 33%
GEO 63% 37%
FRA 66% 34%
ARG 60% 40%
NAM 65% 35%
FRA 60% 40%
SCO 63% 37%
JPN 58% 42%
ITA 61% 39%
ROM 56% 44%
TGA 60% 40%
SAM 53% 47%
ARG 59% 41%
CAN 52% 48%
IRE 54% 46%
NAM 52% 48%
AUS 50% 50%
AUS 50% 50%
NZL 49% 51%
RSA 47% 53% USA 47% 53%
ENG 41% 59%
SAM 43% 57%
TGA 40% 60% CAN 38% 63%
WAL 37% 63%
ROM 38% 63%
FJI 33% 67%
RSA 37% 63%
SCO 32% 68%
WAL 30% 70%
ITA 25% 75%
FJI 26% 74%
URU 14% 86%
ENG 14% 86%
RUGBY WORLD CUP 2015 STATISTICAL REPORT WORLD RUGBYTM GAME ANALYSIS
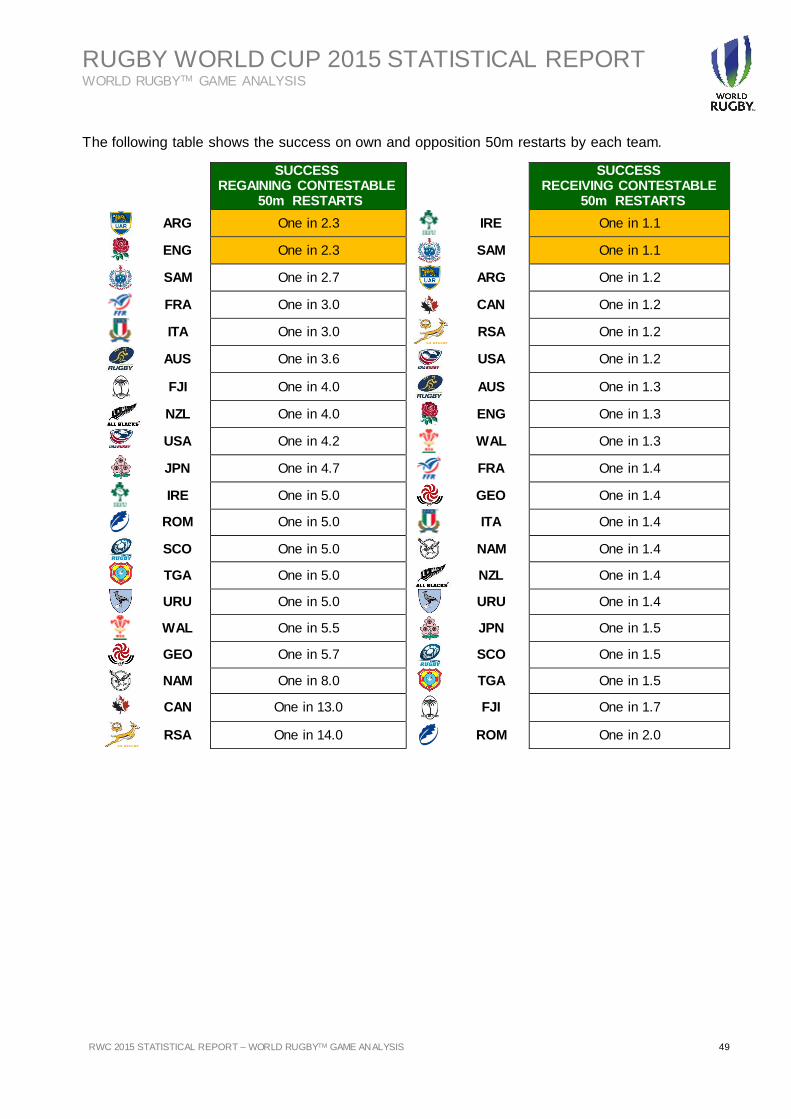
RWC 2015 STATISTICAL REPORT – WORLD RUGBYTM GAME ANALYSIS 49
The following table shows the success on own and opposition 50m restarts by each team.
SUCCESS REGAINING CONTESTABLE
50m RESTARTS
SUCCESS RECEIVING CONTESTABLE
50m RESTARTS
ARG One in 2.3
IRE One in 1.1
ENG One in 2.3
SAM One in 1.1
SAM One in 2.7
ARG One in 1.2
FRA One in 3.0
CAN One in 1.2
ITA One in 3.0
RSA One in 1.2
AUS One in 3.6 USA One in 1.2
FJI One in 4.0
AUS One in 1.3
NZL One in 4.0
ENG One in 1.3
USA One in 4.2
WAL One in 1.3
JPN One in 4.7
FRA One in 1.4
IRE One in 5.0
GEO One in 1.4
ROM One in 5.0
ITA One in 1.4
SCO One in 5.0
NAM One in 1.4
TGA One in 5.0
NZL One in 1.4
URU One in 5.0
URU One in 1.4
WAL One in 5.5
JPN One in 1.5
GEO One in 5.7
SCO One in 1.5
NAM One in 8.0
TGA One in 1.5
CAN One in 13.0
FJI One in 1.7
RSA One in 14.0
ROM One in 2.0
RUGBY WORLD CUP 2015 STATISTICAL REPORT WORLD RUGBYTM GAME ANALYSIS
50 RWC 2015 STATISTICAL REPORT – WORLD RUGBY GAME ANALYSIS 50 Filename/Filepath
8. LINEOUTS The following table shows the average number of lineouts per match, the proportion of lineouts contested, the lineout retention rates and the total number of not straight throws.
The most lineouts in a match was 38 (Australia v Fiji) and the least was 18 (four matches). The following table shows the success per team on their own lineouts, the percentage contested and the total number of steals conceded.
POOL KNOCKOUT OVERALL
AVERAGE PER MATCH 26 24 26
SUCCESS 87% 87% 87%
CONTESTED 42% 49% 43%
NOT STRAIGHT 22 - 22
OWN LINEOUTS
TOTAL LINEOUTS
SUCCESS CONTESTED STEALS
IRE 56 98% 21% 1
NZL 88 95% 36% 4
JPN 46 93% 33% 3
RSA 97 92% 48% 8
WAL 76 92% 30% 6
ARG 78 91% 36% 7
ENG 45 91% 29% 4
SCO 61 89% 41% 7
FJI 54 87% 52% 7
CAN 49 86% 57% 7
AUS 94 85% 44% 14
ITA 62 85% 39% 9
ROM 54 85% 52% 8
SAM 49 84% 49% 8
NAM 45 82% 56% 8
FRA 70 80% 51% 14
TGA 50 80% 54% 10
USA 43 79% 33% 9
GEO 59 78% 53% 13
URU 54 76% 48% 13
RUGBY WORLD CUP 2015 STATISTICAL REPORT WORLD RUGBYTM GAME ANALYSIS
RWC 2015 STATISTICAL REPORT – WORLD RUGBYTM GAME ANALYSIS 51
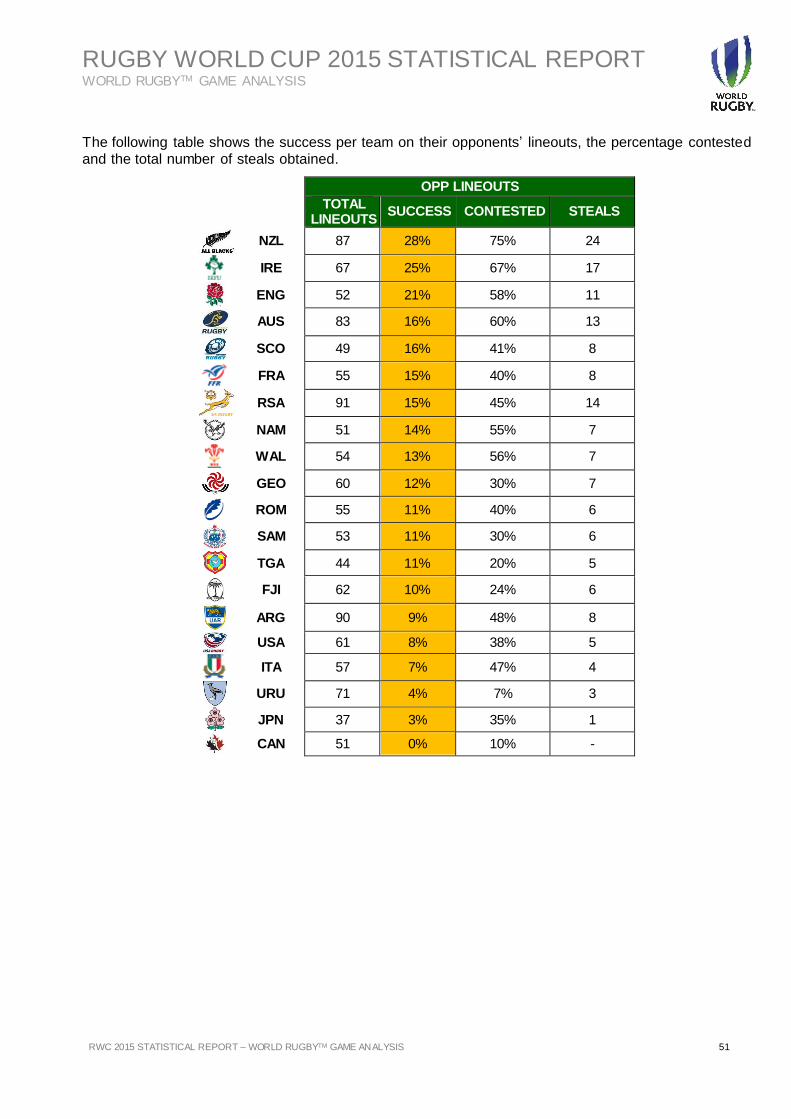
The following table shows the success per team on their opponents’ lineouts, the percentage contested and the total number of steals obtained.
OPP LINEOUTS
TOTAL
LINEOUTS SUCCESS CONTESTED STEALS
NZL 87 28% 75% 24
IRE 67 25% 67% 17
ENG 52 21% 58% 11
AUS 83 16% 60% 13
SCO 49 16% 41% 8
FRA 55 15% 40% 8
RSA 91 15% 45% 14
NAM 51 14% 55% 7
WAL 54 13% 56% 7
GEO 60 12% 30% 7
ROM 55 11% 40% 6
SAM 53 11% 30% 6
TGA 44 11% 20% 5
FJI 62 10% 24% 6
ARG 90 9% 48% 8
USA 61 8% 38% 5
ITA 57 7% 47% 4
URU 71 4% 7% 3
JPN 37 3% 35% 1
CAN 51 0% 10% -
RUGBY WORLD CUP 2015 STATISTICAL REPORT WORLD RUGBYTM GAME ANALYSIS
52 RWC 2015 STATISTICAL REPORT – WORLD RUGBY GAME ANALYSIS 52 Filename/Filepath
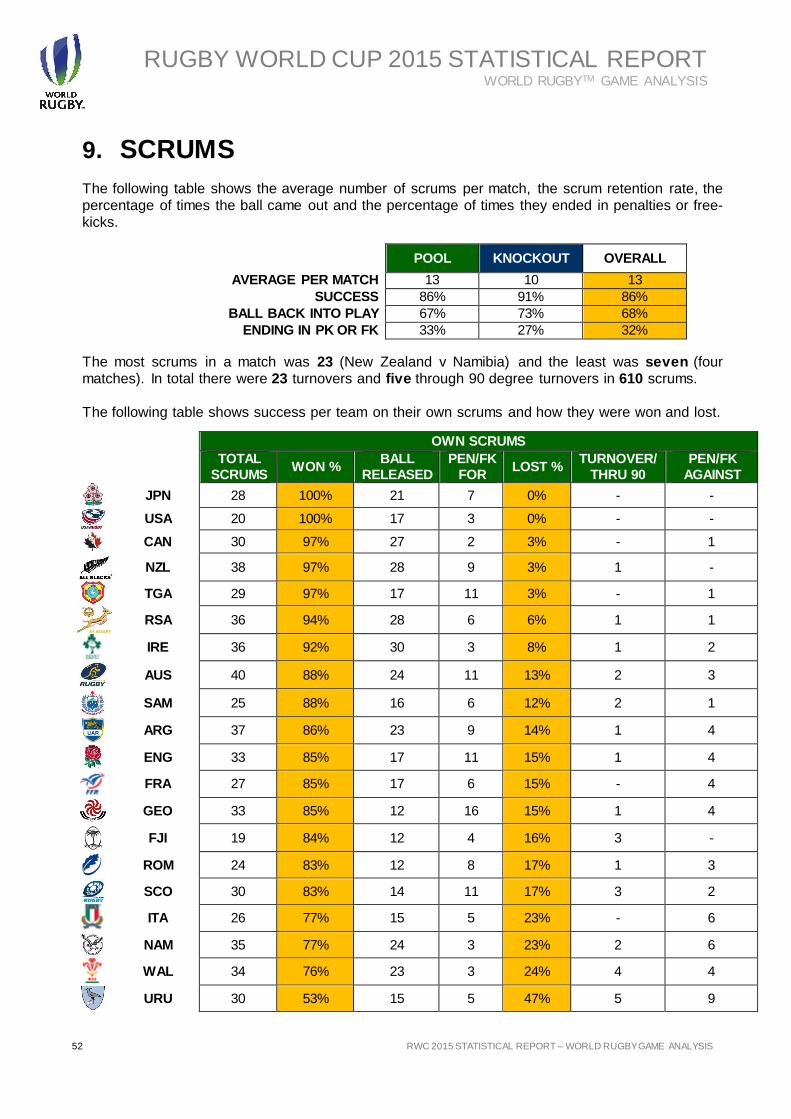
9. SCRUMS
The following table shows the average number of scrums per match, the scrum retention rate, the percentage of times the ball came out and the percentage of times they ended in penalties or free-kicks.
The most scrums in a match was 23 (New Zealand v Namibia) and the least was seven (four matches). In total there were 23 turnovers and five through 90 degree turnovers in 610 scrums. The following table shows success per team on their own scrums and how they were won and lost.
POOL KNOCKOUT OVERALL
AVERAGE PER MATCH 13 10 13
SUCCESS 86% 91% 86%
BALL BACK INTO PLAY 67% 73% 68%
ENDING IN PK OR FK 33% 27% 32%
OWN SCRUMS
TOTAL
SCRUMS WON %
BALL
RELEASED
PEN/FK
FOR LOST %
TURNOVER/
THRU 90
PEN/FK
AGAINST
JPN 28 100% 21 7 0% - -
USA 20 100% 17 3 0% - -
CAN 30 97% 27 2 3% - 1
NZL 38 97% 28 9 3% 1 -
TGA 29 97% 17 11 3% - 1
RSA 36 94% 28 6 6% 1 1
IRE 36 92% 30 3 8% 1 2
AUS 40 88% 24 11 13% 2 3
SAM 25 88% 16 6 12% 2 1
ARG 37 86% 23 9 14% 1 4
ENG 33 85% 17 11 15% 1 4
FRA 27 85% 17 6 15% - 4
GEO 33 85% 12 16 15% 1 4
FJI 19 84% 12 4 16% 3 -
ROM 24 83% 12 8 17% 1 3
SCO 30 83% 14 11 17% 3 2
ITA 26 77% 15 5 23% - 6
NAM 35 77% 24 3 23% 2 6
WAL 34 76% 23 3 24% 4 4
URU 30 53% 15 5 47% 5 9
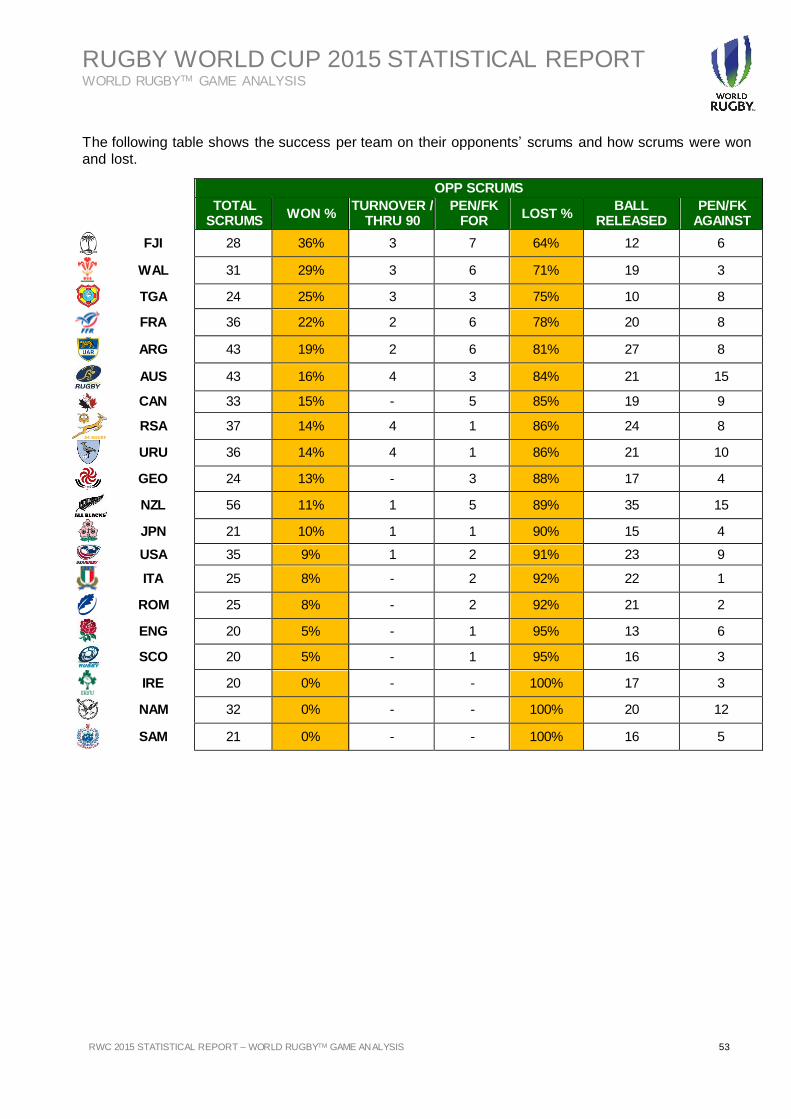
RUGBY WORLD CUP 2015 STATISTICAL REPORT WORLD RUGBYTM GAME ANALYSIS
RWC 2015 STATISTICAL REPORT – WORLD RUGBYTM GAME ANALYSIS 53
The following table shows the success per team on their opponents’ scrums and how scrums were won and lost.
OPP SCRUMS
TOTAL SCRUMS
WON % TURNOVER /
THRU 90 PEN/FK
FOR LOST %
BALL RELEASED
PEN/FK AGAINST
FJI 28 36% 3 7 64% 12 6
WAL 31 29% 3 6 71% 19 3
TGA 24 25% 3 3 75% 10 8
FRA 36 22% 2 6 78% 20 8
ARG 43 19% 2 6 81% 27 8
AUS 43 16% 4 3 84% 21 15
CAN 33 15% - 5 85% 19 9
RSA 37 14% 4 1 86% 24 8
URU 36 14% 4 1 86% 21 10
GEO 24 13% - 3 88% 17 4
NZL 56 11% 1 5 89% 35 15
JPN 21 10% 1 1 90% 15 4
USA 35 9% 1 2 91% 23 9
ITA 25 8% - 2 92% 22 1
ROM 25 8% - 2 92% 21 2
ENG 20 5% - 1 95% 13 6
SCO 20 5% - 1 95% 16 3
IRE 20 0% - - 100% 17 3
NAM 32 0% - - 100% 20 12
SAM 21 0% - - 100% 16 5
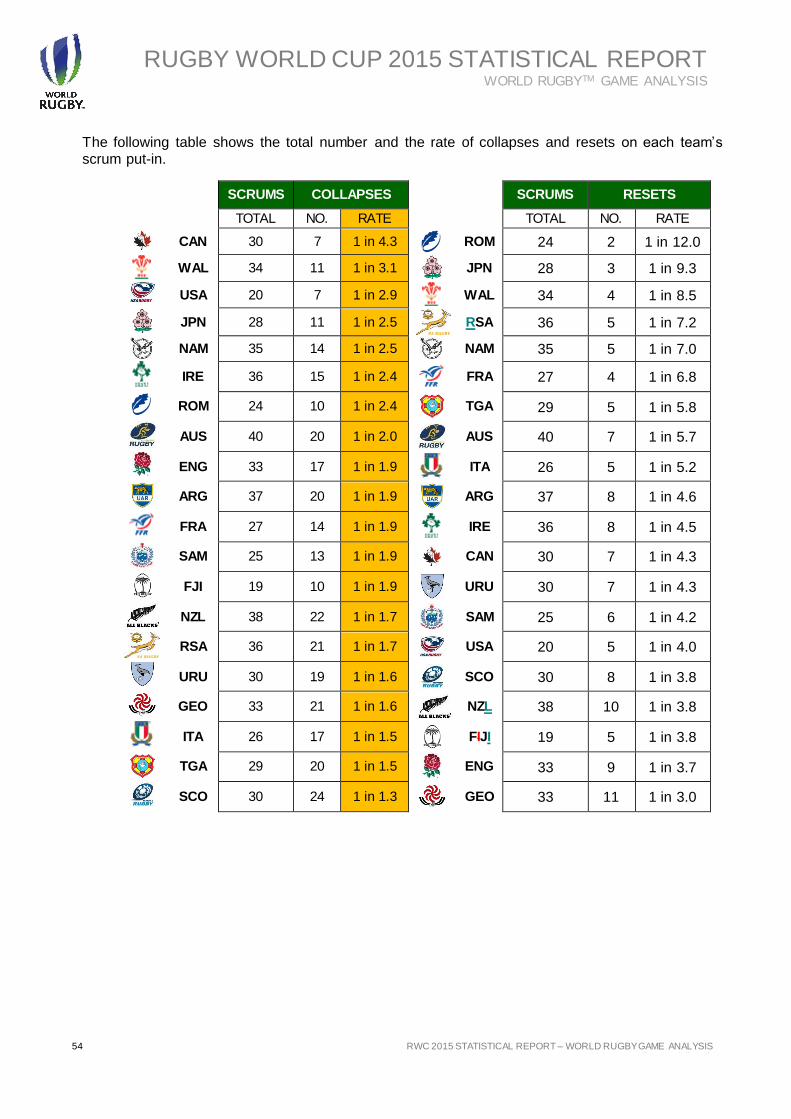
RUGBY WORLD CUP 2015 STATISTICAL REPORT WORLD RUGBYTM GAME ANALYSIS
54 RWC 2015 STATISTICAL REPORT – WORLD RUGBY GAME ANALYSIS 54 Filename/Filepath
The following table shows the total number and the rate of collapses and resets on each team’s scrum put-in.
SCRUMS COLLAPSES SCRUMS RESETS
TOTAL NO. RATE TOTAL NO. RATE
CAN 30 7 1 in 4.3
ROM 24 2 1 in 12.0
WAL 34 11 1 in 3.1
JPN 28 3 1 in 9.3
USA 20 7 1 in 2.9
WAL 34 4 1 in 8.5
JPN 28 11 1 in 2.5
RSA 36 5 1 in 7.2
NAM 35 14 1 in 2.5
NAM 35 5 1 in 7.0
IRE 36 15 1 in 2.4
FRA 27 4 1 in 6.8
ROM 24 10 1 in 2.4
TGA 29 5 1 in 5.8
AUS 40 20 1 in 2.0
AUS 40 7 1 in 5.7
ENG 33 17 1 in 1.9
ITA 26 5 1 in 5.2
ARG 37 20 1 in 1.9
ARG 37 8 1 in 4.6
FRA 27 14 1 in 1.9
IRE 36 8 1 in 4.5
SAM 25 13 1 in 1.9
CAN 30 7 1 in 4.3
FJI 19 10 1 in 1.9
URU 30 7 1 in 4.3
NZL 38 22 1 in 1.7
SAM 25 6 1 in 4.2
RSA 36 21 1 in 1.7 USA 20 5 1 in 4.0
URU 30 19 1 in 1.6
SCO 30 8 1 in 3.8
GEO 33 21 1 in 1.6
NZL 38 10 1 in 3.8
ITA 26 17 1 in 1.5
FIJI 19 5 1 in 3.8
TGA 29 20 1 in 1.5
ENG 33 9 1 in 3.7
SCO 30 24 1 in 1.3
GEO 33 11 1 in 3.0
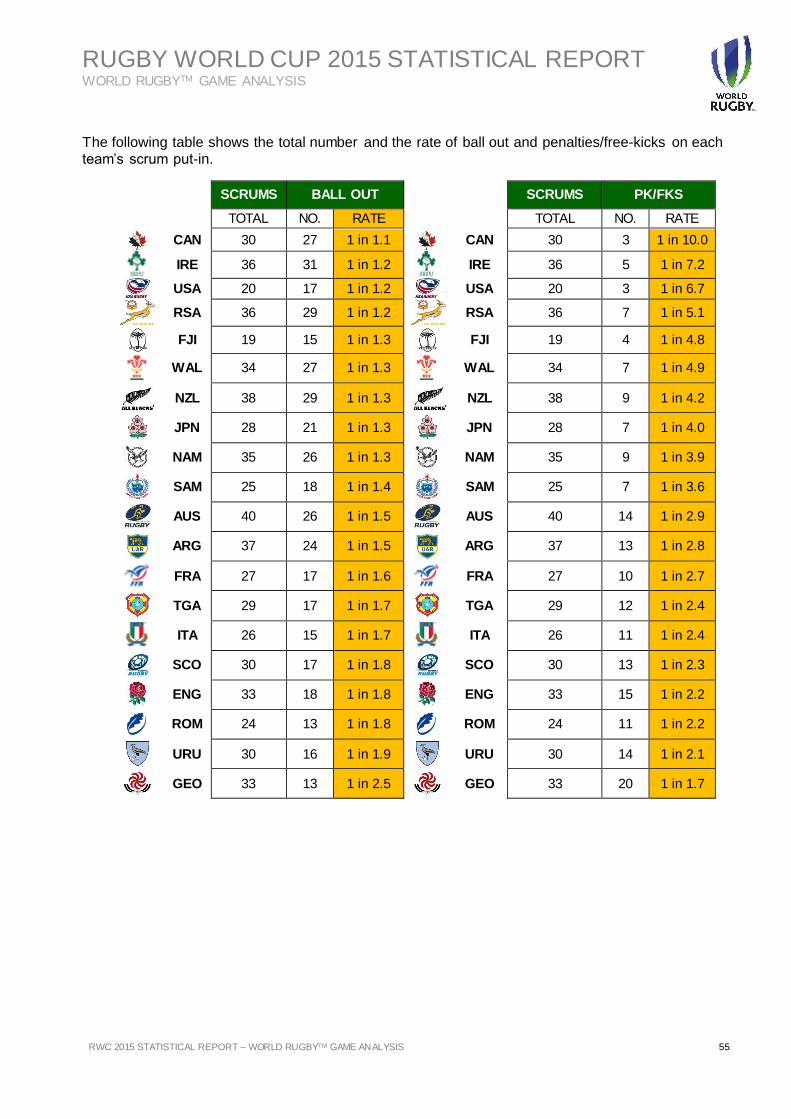
RUGBY WORLD CUP 2015 STATISTICAL REPORT WORLD RUGBYTM GAME ANALYSIS
RWC 2015 STATISTICAL REPORT – WORLD RUGBYTM GAME ANALYSIS 55
The following table shows the total number and the rate of ball out and penalties/free-kicks on each team’s scrum put-in.
SCRUMS BALL OUT SCRUMS PK/FKS
TOTAL NO. RATE TOTAL NO. RATE
CAN 30 27 1 in 1.1
CAN 30 3 1 in 10.0
IRE 36 31 1 in 1.2
IRE 36 5 1 in 7.2
USA 20 17 1 in 1.2 USA 20 3 1 in 6.7
RSA 36 29 1 in 1.2
RSA 36 7 1 in 5.1
FJI 19 15 1 in 1.3
FJI 19 4 1 in 4.8
WAL 34 27 1 in 1.3
WAL 34 7 1 in 4.9
NZL 38 29 1 in 1.3
NZL 38 9 1 in 4.2
JPN 28 21 1 in 1.3
JPN 28 7 1 in 4.0
NAM 35 26 1 in 1.3
NAM 35 9 1 in 3.9
SAM 25 18 1 in 1.4
SAM 25 7 1 in 3.6
AUS 40 26 1 in 1.5
AUS 40 14 1 in 2.9
ARG 37 24 1 in 1.5
ARG 37 13 1 in 2.8
FRA 27 17 1 in 1.6
FRA 27 10 1 in 2.7
TGA 29 17 1 in 1.7
TGA 29 12 1 in 2.4
ITA 26 15 1 in 1.7
ITA 26 11 1 in 2.4
SCO 30 17 1 in 1.8
SCO 30 13 1 in 2.3
ENG 33 18 1 in 1.8
ENG 33 15 1 in 2.2
ROM 24 13 1 in 1.8
ROM 24 11 1 in 2.2
URU 30 16 1 in 1.9
URU 30 14 1 in 2.1
GEO 33 13 1 in 2.5
GEO 33 20 1 in 1.7
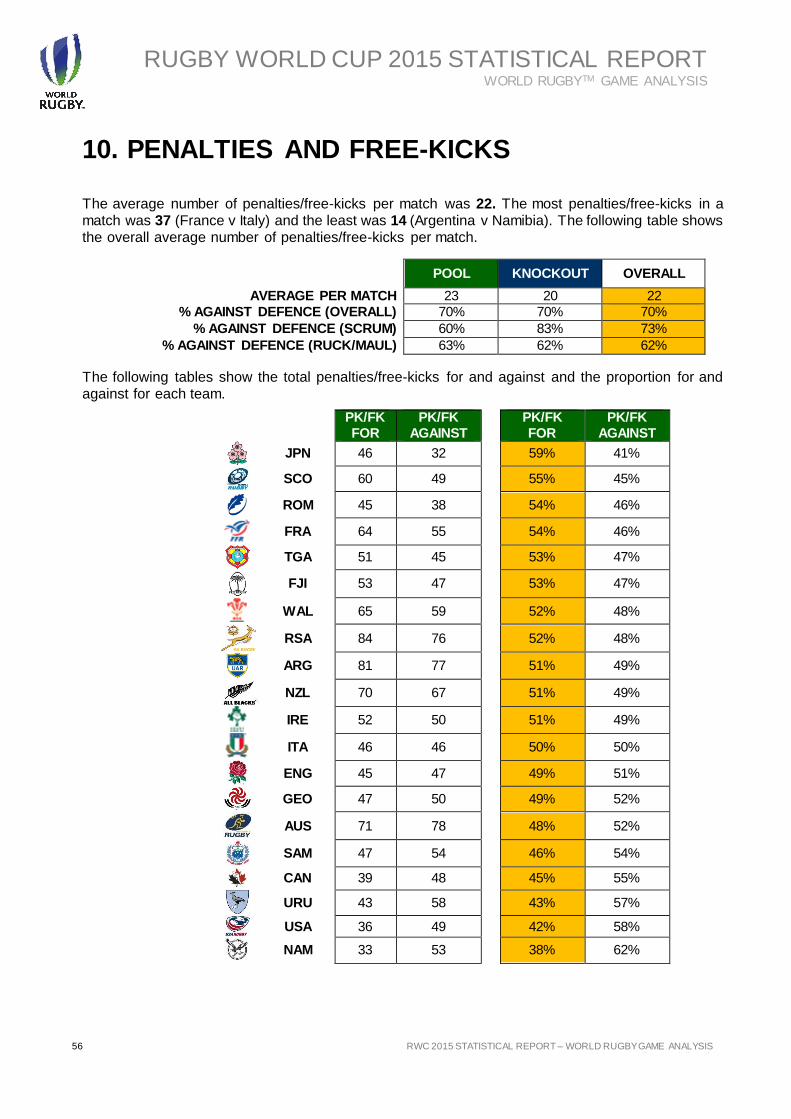
RUGBY WORLD CUP 2015 STATISTICAL REPORT WORLD RUGBYTM GAME ANALYSIS
56 RWC 2015 STATISTICAL REPORT – WORLD RUGBY GAME ANALYSIS 56 Filename/Filepath
10. PENALTIES AND FREE-KICKS
The average number of penalties/free-kicks per match was 22. The most penalties/free-kicks in a match was 37 (France v Italy) and the least was 14 (Argentina v Namibia). The following table shows the overall average number of penalties/free-kicks per match.
The following tables show the total penalties/free-kicks for and against and the proportion for and against for each team.
POOL KNOCKOUT OVERALL
AVERAGE PER MATCH 23 20 22
% AGAINST DEFENCE (OVERALL) 70% 70% 70%
% AGAINST DEFENCE (SCRUM) 60% 83% 73%
% AGAINST DEFENCE (RUCK/MAUL) 63% 62% 62%
PK/FK
FOR
PK/FK
AGAINST
PK/FK
FOR
PK/FK
AGAINST
JPN 46 32 59% 41%
SCO 60 49 55% 45%
ROM 45 38 54% 46%
FRA 64 55 54% 46%
TGA 51 45 53% 47%
FJI 53 47 53% 47%
WAL 65 59 52% 48%
RSA 84 76 52% 48%
ARG 81 77 51% 49%
NZL 70 67 51% 49%
IRE 52 50 51% 49%
ITA 46 46 50% 50%
ENG 45 47 49% 51%
GEO 47 50 49% 52%
AUS 71 78 48% 52%
SAM 47 54 46% 54%
CAN 39 48 45% 55%
URU 43 58 43% 57%
USA 36 49 42% 58%
NAM 33 53 38% 62%
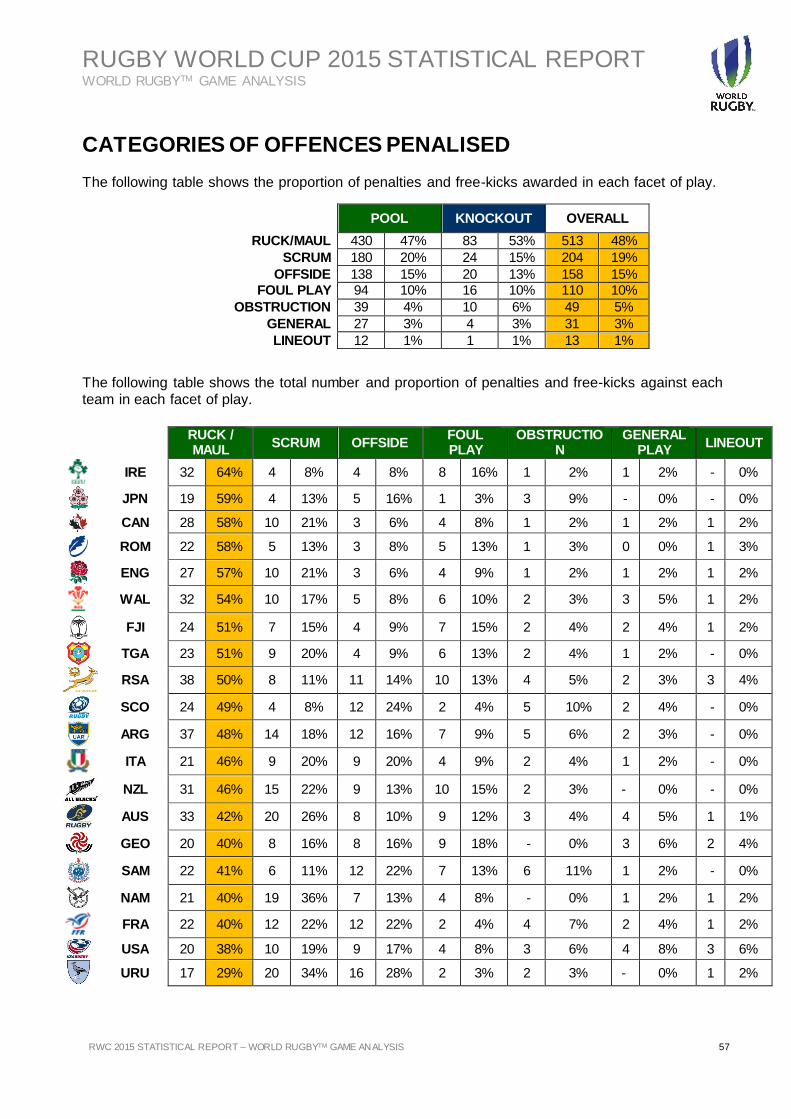
RUGBY WORLD CUP 2015 STATISTICAL REPORT WORLD RUGBYTM GAME ANALYSIS
RWC 2015 STATISTICAL REPORT – WORLD RUGBYTM GAME ANALYSIS 57
CATEGORIES OF OFFENCES PENALISED
The following table shows the proportion of penalties and free-kicks awarded in each facet of play.
The following table shows the total number and proportion of penalties and free-kicks against each team in each facet of play.
POOL KNOCKOUT OVERALL
RUCK/MAUL 430 47% 83 53% 513 48%
SCRUM 180 20% 24 15% 204 19%
OFFSIDE 138 15% 20 13% 158 15%
FOUL PLAY 94 10% 16 10% 110 10%
OBSTRUCTION 39 4% 10 6% 49 5%
GENERAL 27 3% 4 3% 31 3%
LINEOUT 12 1% 1 1% 13 1%
RUCK / MAUL
SCRUM OFFSIDE FOUL PLAY
OBSTRUCTION
GENERAL PLAY
LINEOUT
IRE 32 64% 4 8% 4 8% 8 16% 1 2% 1 2% - 0%
JPN 19 59% 4 13% 5 16% 1 3% 3 9% - 0% - 0%
CAN 28 58% 10 21% 3 6% 4 8% 1 2% 1 2% 1 2%
ROM 22 58% 5 13% 3 8% 5 13% 1 3% 0 0% 1 3%
ENG 27 57% 10 21% 3 6% 4 9% 1 2% 1 2% 1 2%
WAL 32 54% 10 17% 5 8% 6 10% 2 3% 3 5% 1 2%
FJI 24 51% 7 15% 4 9% 7 15% 2 4% 2 4% 1 2%
TGA 23 51% 9 20% 4 9% 6 13% 2 4% 1 2% - 0%
RSA 38 50% 8 11% 11 14% 10 13% 4 5% 2 3% 3 4%
SCO 24 49% 4 8% 12 24% 2 4% 5 10% 2 4% - 0%
ARG 37 48% 14 18% 12 16% 7 9% 5 6% 2 3% - 0%
ITA 21 46% 9 20% 9 20% 4 9% 2 4% 1 2% - 0%
NZL 31 46% 15 22% 9 13% 10 15% 2 3% - 0% - 0%
AUS 33 42% 20 26% 8 10% 9 12% 3 4% 4 5% 1 1%
GEO 20 40% 8 16% 8 16% 9 18% - 0% 3 6% 2 4%
SAM 22 41% 6 11% 12 22% 7 13% 6 11% 1 2% - 0%
NAM 21 40% 19 36% 7 13% 4 8% - 0% 1 2% 1 2%
FRA 22 40% 12 22% 12 22% 2 4% 4 7% 2 4% 1 2%
USA 20 38% 10 19% 9 17% 4 8% 3 6% 4 8% 3 6%
URU 17 29% 20 34% 16 28% 2 3% 2 3% - 0% 1 2%
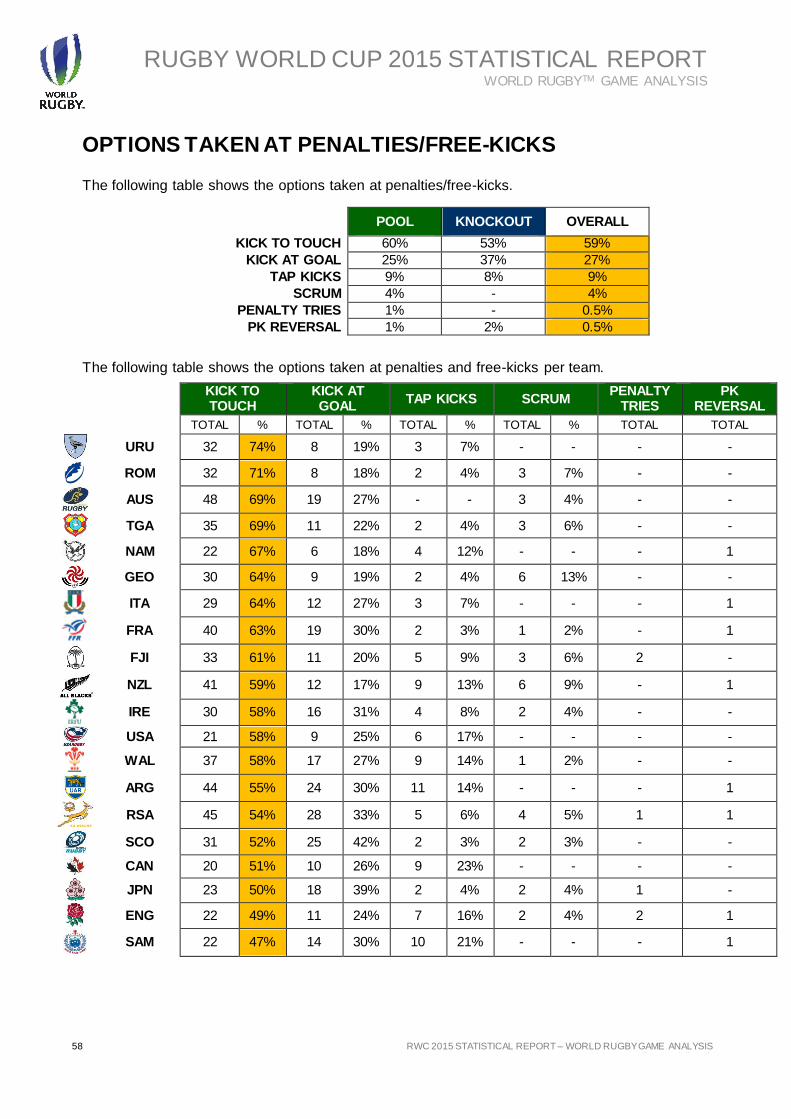
RUGBY WORLD CUP 2015 STATISTICAL REPORT WORLD RUGBYTM GAME ANALYSIS
58 RWC 2015 STATISTICAL REPORT – WORLD RUGBY GAME ANALYSIS 58 Filename/Filepath
OPTIONS TAKEN AT PENALTIES/FREE-KICKS The following table shows the options taken at penalties/free-kicks.
The following table shows the options taken at penalties and free-kicks per team.
POOL KNOCKOUT OVERALL
KICK TO TOUCH 60% 53% 59%
KICK AT GOAL 25% 37% 27%
TAP KICKS 9% 8% 9%
SCRUM 4% - 4%
PENALTY TRIES 1% - 0.5%
PK REVERSAL 1% 2% 0.5%
KICK TO TOUCH
KICK AT GOAL
TAP KICKS SCRUM PENALTY
TRIES PK
REVERSAL
TOTAL % TOTAL % TOTAL % TOTAL % TOTAL TOTAL
URU 32 74% 8 19% 3 7% - - - -
ROM 32 71% 8 18% 2 4% 3 7% - -
AUS 48 69% 19 27% - - 3 4% - -
TGA 35 69% 11 22% 2 4% 3 6% - -
NAM 22 67% 6 18% 4 12% - - - 1
GEO 30 64% 9 19% 2 4% 6 13% - -
ITA 29 64% 12 27% 3 7% - - - 1
FRA 40 63% 19 30% 2 3% 1 2% - 1
FJI 33 61% 11 20% 5 9% 3 6% 2 -
NZL 41 59% 12 17% 9 13% 6 9% - 1
IRE 30 58% 16 31% 4 8% 2 4% - -
USA 21 58% 9 25% 6 17% - - - -
WAL 37 58% 17 27% 9 14% 1 2% - -
ARG 44 55% 24 30% 11 14% - - - 1
RSA 45 54% 28 33% 5 6% 4 5% 1 1
SCO 31 52% 25 42% 2 3% 2 3% - -
CAN 20 51% 10 26% 9 23% - - - -
JPN 23 50% 18 39% 2 4% 2 4% 1 -
ENG 22 49% 11 24% 7 16% 2 4% 2 1
SAM 22 47% 14 30% 10 21% - - - 1
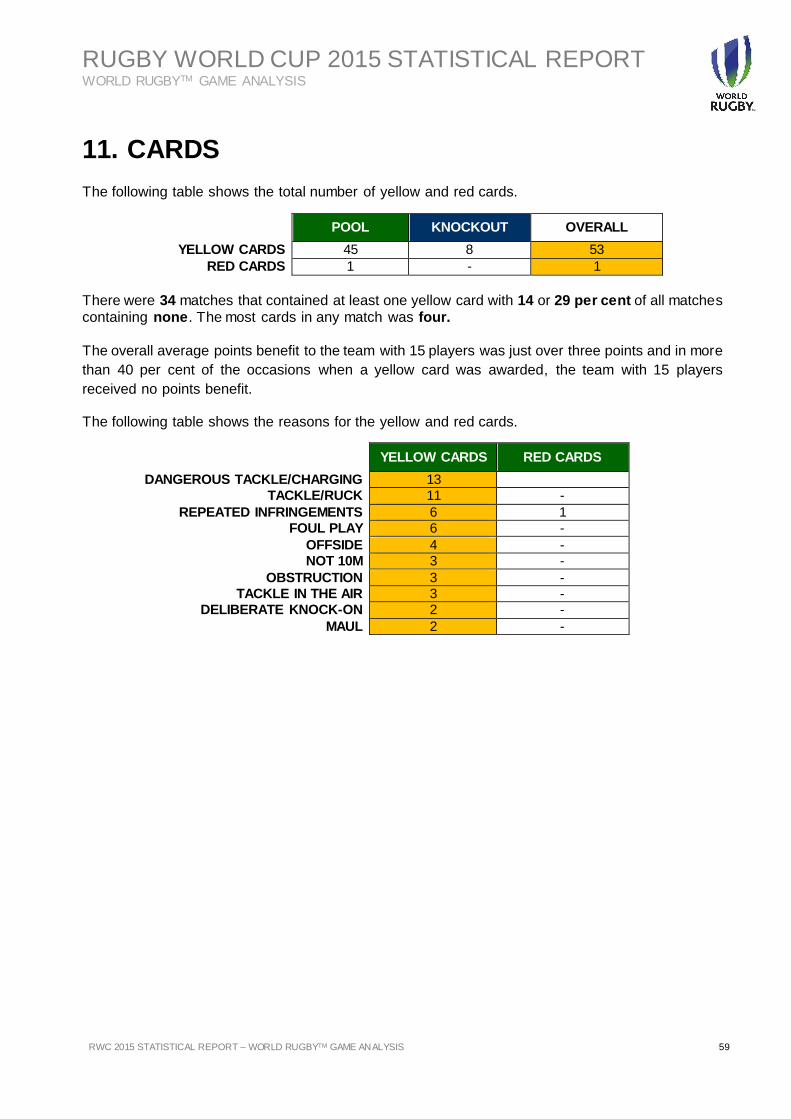
RUGBY WORLD CUP 2015 STATISTICAL REPORT WORLD RUGBYTM GAME ANALYSIS
RWC 2015 STATISTICAL REPORT – WORLD RUGBYTM GAME ANALYSIS 59
11. CARDS The following table shows the total number of yellow and red cards.
There were 34 matches that contained at least one yellow card with 14 or 29 per cent of all matches containing none. The most cards in any match was four. The overall average points benefit to the team with 15 players was just over three points and in more
than 40 per cent of the occasions when a yellow card was awarded, the team with 15 players
received no points benefit.
The following table shows the reasons for the yellow and red cards.
POOL KNOCKOUT OVERALL
YELLOW CARDS 45 8 53
RED CARDS 1 - 1
YELLOW CARDS RED CARDS
DANGEROUS TACKLE/CHARGING 13
TACKLE/RUCK 11 -
REPEATED INFRINGEMENTS 6 1
FOUL PLAY 6 -
OFFSIDE 4 -
NOT 10M 3 -
OBSTRUCTION 3 -
TACKLE IN THE AIR 3 -
DELIBERATE KNOCK-ON 2 -
MAUL 2 -
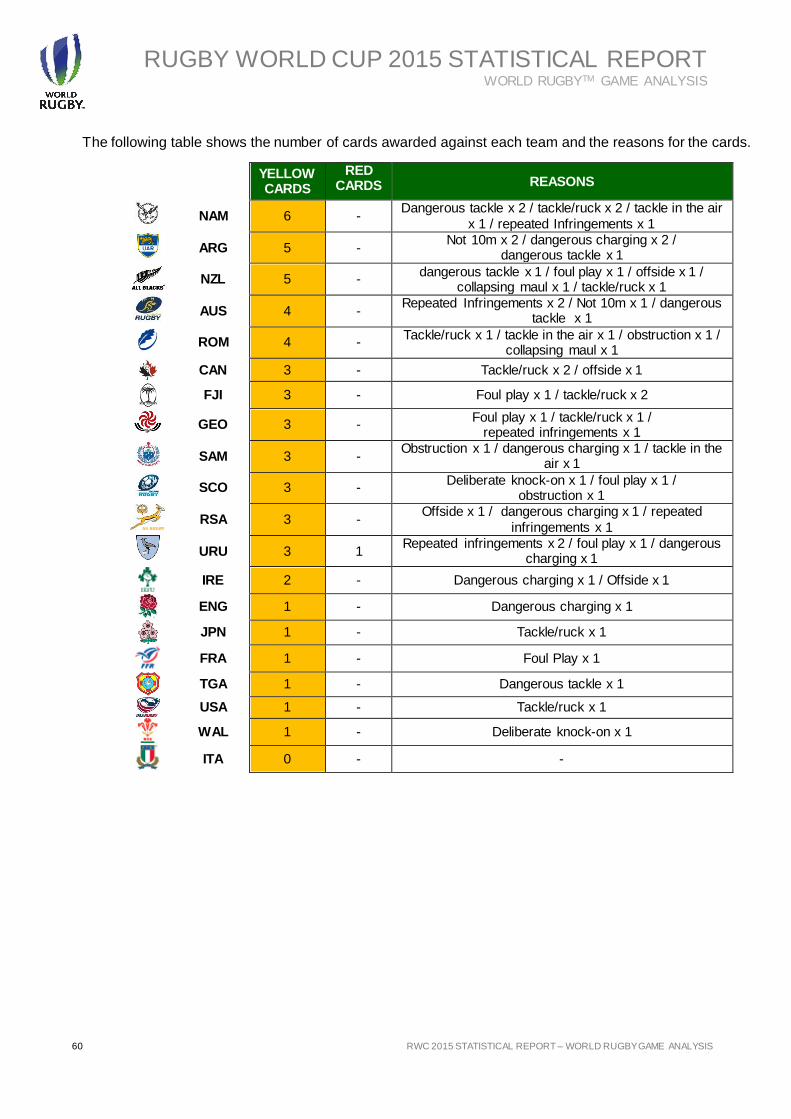
RUGBY WORLD CUP 2015 STATISTICAL REPORT WORLD RUGBYTM GAME ANALYSIS
60 RWC 2015 STATISTICAL REPORT – WORLD RUGBY GAME ANALYSIS 60 Filename/Filepath
The following table shows the number of cards awarded against each team and the reasons for the cards.
YELLOW CARDS
RED CARDS REASONS
NAM 6 - Dangerous tackle x 2 / tackle/ruck x 2 / tackle in the air
x 1 / repeated Infringements x 1
ARG 5 - Not 10m x 2 / dangerous charging x 2 /
dangerous tackle x 1
NZL 5 - dangerous tackle x 1 / foul play x 1 / offside x 1 /
collapsing maul x 1 / tackle/ruck x 1
AUS 4 - Repeated Infringements x 2 / Not 10m x 1 / dangerous
tackle x 1
ROM 4 - Tackle/ruck x 1 / tackle in the air x 1 / obstruction x 1 /
collapsing maul x 1
CAN 3 - Tackle/ruck x 2 / offside x 1
FJI 3 - Foul play x 1 / tackle/ruck x 2
GEO 3 - Foul play x 1 / tackle/ruck x 1 /
repeated infringements x 1
SAM 3 - Obstruction x 1 / dangerous charging x 1 / tackle in the
air x 1
SCO 3 - Deliberate knock-on x 1 / foul play x 1 /
obstruction x 1
RSA 3 - Offside x 1 / dangerous charging x 1 / repeated
infringements x 1
URU 3 1 Repeated infringements x 2 / foul play x 1 / dangerous
charging x 1
IRE 2 - Dangerous charging x 1 / Offside x 1
ENG 1 - Dangerous charging x 1
JPN 1 - Tackle/ruck x 1
FRA 1 - Foul Play x 1
TGA 1 - Dangerous tackle x 1
USA 1 - Tackle/ruck x 1
WAL 1 - Deliberate knock-on x 1
ITA 0 - -
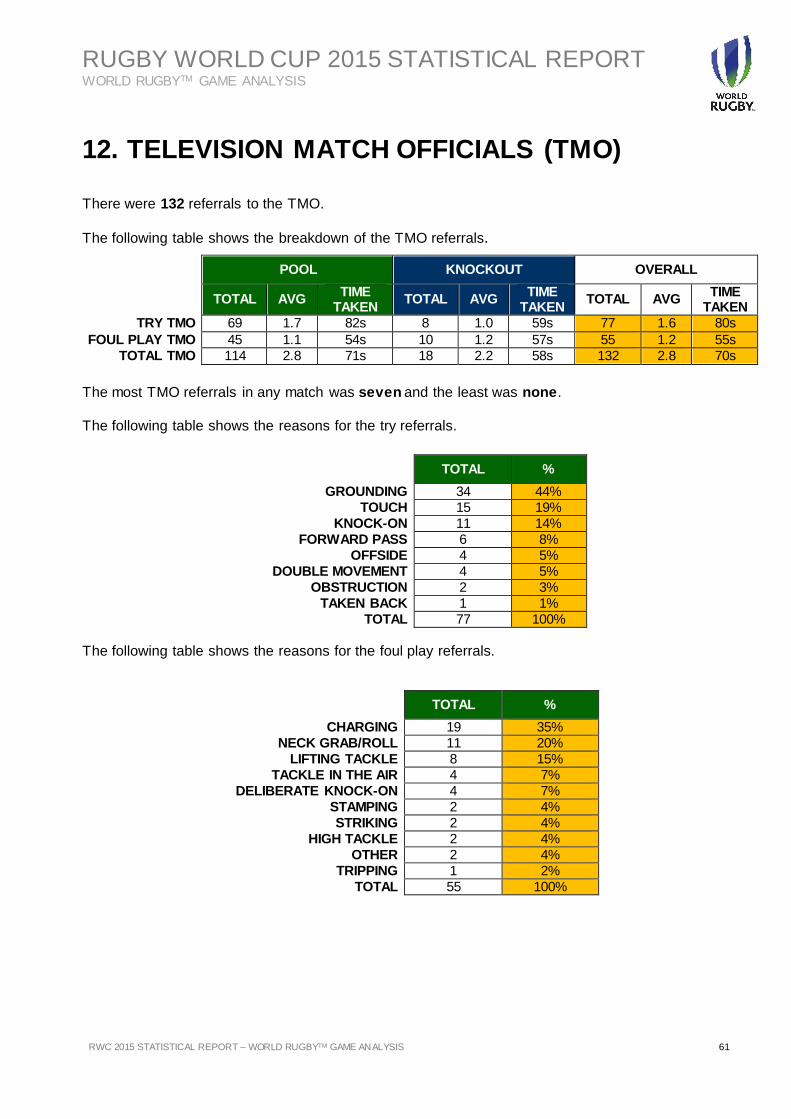
RUGBY WORLD CUP 2015 STATISTICAL REPORT WORLD RUGBYTM GAME ANALYSIS
RWC 2015 STATISTICAL REPORT – WORLD RUGBYTM GAME ANALYSIS 61
12. TELEVISION MATCH OFFICIALS (TMO)
There were 132 referrals to the TMO.
The following table shows the breakdown of the TMO referrals.
The most TMO referrals in any match was seven and the least was none. The following table shows the reasons for the try referrals.
The following table shows the reasons for the foul play referrals.
POOL KNOCKOUT OVERALL
TOTAL AVG
TIME TAKEN
TOTAL AVG TIME
TAKEN TOTAL AVG
TIME TAKEN
TRY TMO 69 1.7 82s 8 1.0 59s 77 1.6 80s
FOUL PLAY TMO 45 1.1 54s 10 1.2 57s 55 1.2 55s
TOTAL TMO 114 2.8 71s 18 2.2 58s 132 2.8 70s
TOTAL %
GROUNDING 34 44%
TOUCH 15 19%
KNOCK-ON 11 14%
FORWARD PASS 6 8%
OFFSIDE 4 5%
DOUBLE MOVEMENT 4 5%
OBSTRUCTION 2 3%
TAKEN BACK 1 1%
TOTAL 77 100%
TOTAL %
CHARGING 19 35%
NECK GRAB/ROLL 11 20%
LIFTING TACKLE 8 15%
TACKLE IN THE AIR 4 7%
DELIBERATE KNOCK-ON 4 7%
STAMPING 2 4%
STRIKING 2 4%
HIGH TACKLE 2 4%
OTHER 2 4%
TRIPPING 1 2%
TOTAL 55 100%
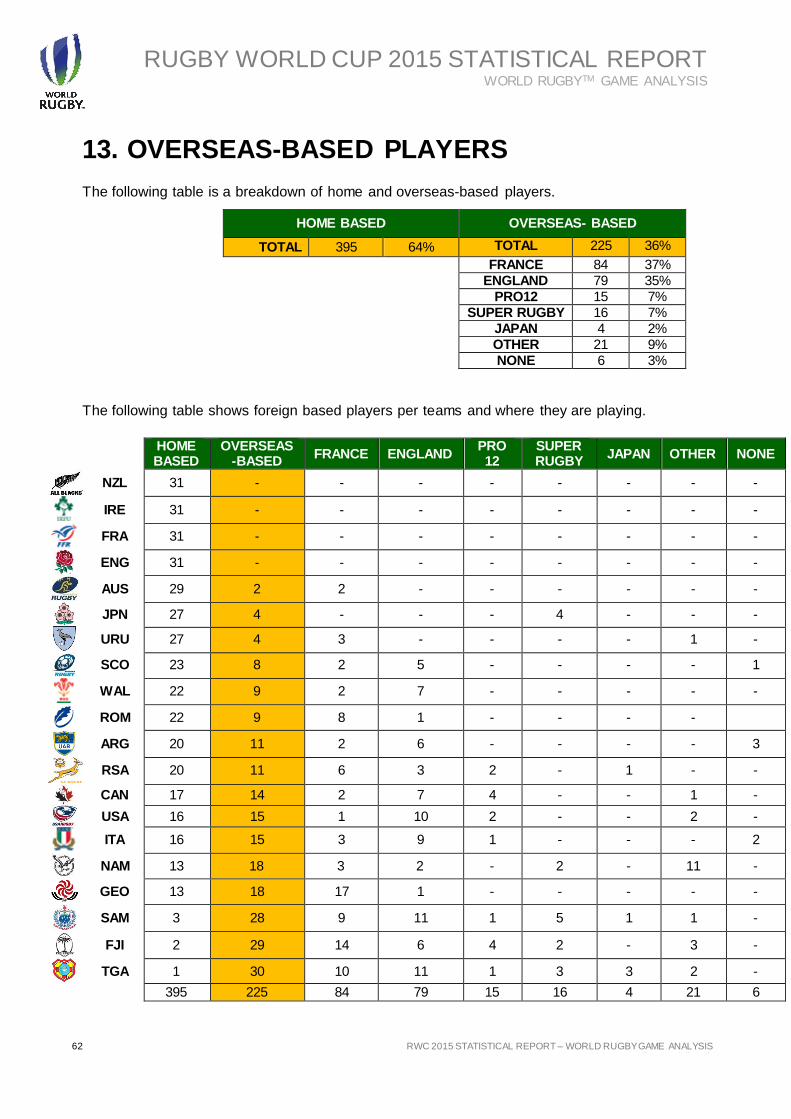
RUGBY WORLD CUP 2015 STATISTICAL REPORT WORLD RUGBYTM GAME ANALYSIS
62 RWC 2015 STATISTICAL REPORT – WORLD RUGBY GAME ANALYSIS 62 Filename/Filepath
13. OVERSEAS-BASED PLAYERS
The following table is a breakdown of home and overseas-based players.
The following table shows foreign based players per teams and where they are playing.
HOME BASED OVERSEAS- BASED
TOTAL 395 64% TOTAL 225 36%
FRANCE 84 37%
ENGLAND 79 35%
PRO12 15 7%
SUPER RUGBY 16 7%
JAPAN 4 2%
OTHER 21 9%
NONE 6 3%
HOME BASED
OVERSEAS-BASED
FRANCE ENGLAND PRO 12
SUPER RUGBY
JAPAN OTHER NONE
NZL 31 - - - - - - - -
IRE 31 - - - - - - - -
FRA 31 - - - - - - - -
ENG 31 - - - - - - - -
AUS 29 2 2 - - - - - -
JPN 27 4 - - - 4 - - -
URU 27 4 3 - - - - 1 -
SCO 23 8 2 5 - - - - 1
WAL 22 9 2 7 - - - - -
ROM 22 9 8 1 - - - -
ARG 20 11 2 6 - - - - 3
RSA 20 11 6 3 2 - 1 - -
CAN 17 14 2 7 4 - - 1 -
USA 16 15 1 10 2 - - 2 -
ITA 16 15 3 9 1 - - - 2
NAM 13 18 3 2 - 2 - 11 -
GEO 13 18 17 1 - - - - -
SAM 3 28 9 11 1 5 1 1 -
FJI 2 29 14 6 4 2 - 3 -
TGA 1 30 10 11 1 3 3 2 -
395 225 84 79 15 16 4 21 6
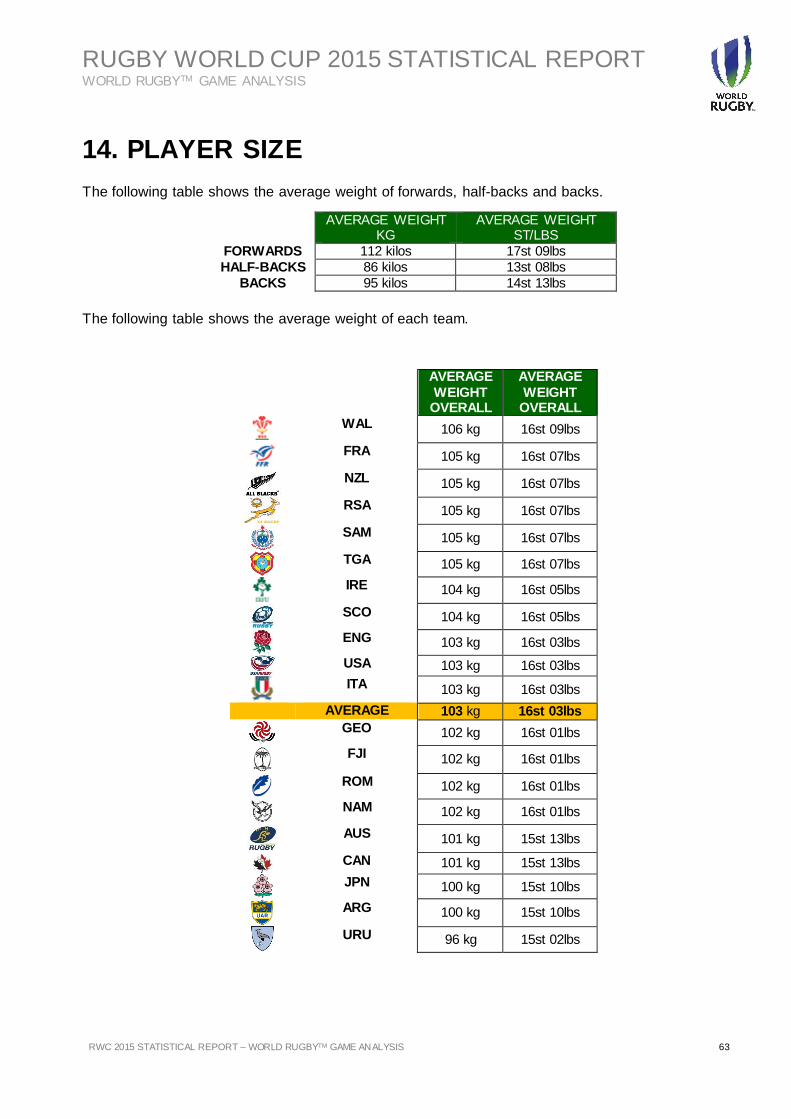
RUGBY WORLD CUP 2015 STATISTICAL REPORT WORLD RUGBYTM GAME ANALYSIS
RWC 2015 STATISTICAL REPORT – WORLD RUGBYTM GAME ANALYSIS 63
14. PLAYER SIZE
The following table shows the average weight of forwards, half-backs and backs.
The following table shows the average weight of each team.
AVERAGE WEIGHT
KG AVERAGE WEIGHT
ST/LBS
FORWARDS 112 kilos 17st 09lbs
HALF-BACKS 86 kilos 13st 08lbs
BACKS 95 kilos 14st 13lbs
AVERAGE
WEIGHT OVERALL
AVERAGE
WEIGHT OVERALL
WAL 106 kg 16st 09lbs
FRA 105 kg 16st 07lbs
NZL 105 kg 16st 07lbs
RSA 105 kg 16st 07lbs
SAM 105 kg 16st 07lbs
TGA 105 kg 16st 07lbs
IRE 104 kg 16st 05lbs
SCO 104 kg 16st 05lbs
ENG 103 kg 16st 03lbs
USA 103 kg 16st 03lbs
ITA 103 kg 16st 03lbs
AVERAGE 103 kg 16st 03lbs
GEO 102 kg 16st 01lbs
FJI 102 kg 16st 01lbs
ROM 102 kg 16st 01lbs
NAM 102 kg 16st 01lbs
AUS 101 kg 15st 13lbs
CAN 101 kg 15st 13lbs
JPN 100 kg 15st 10lbs
ARG 100 kg 15st 10lbs
URU 96 kg 15st 02lbs
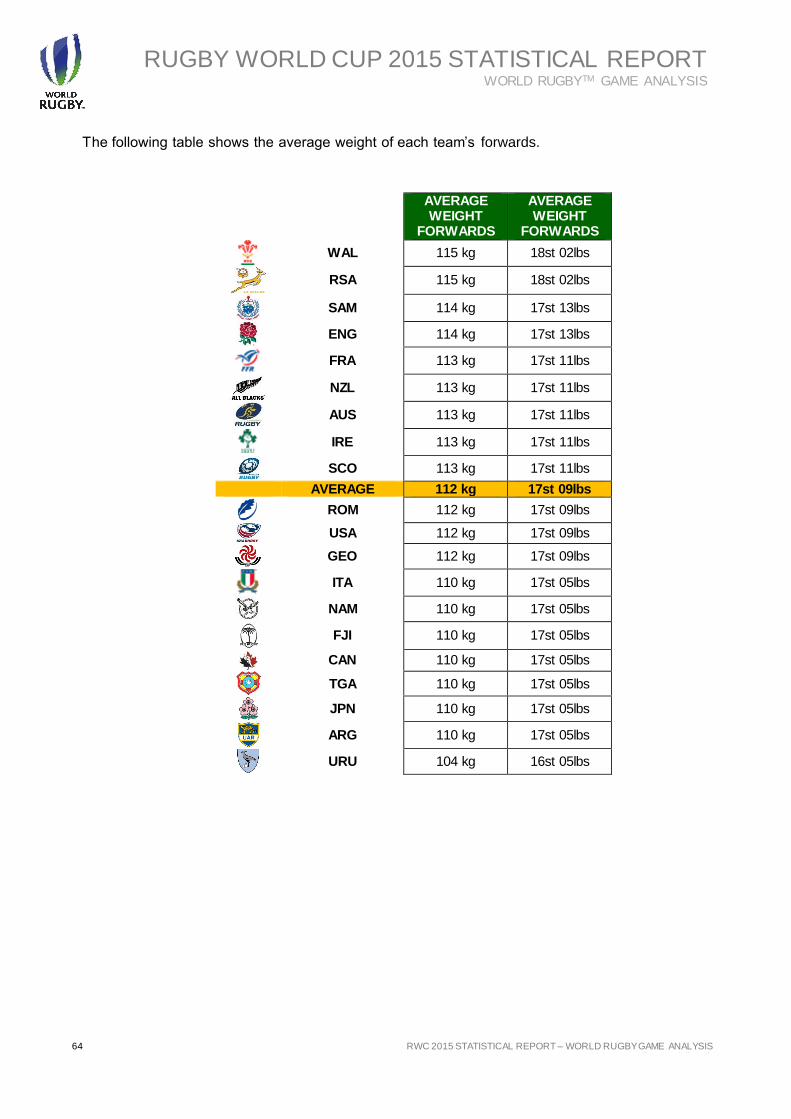
RUGBY WORLD CUP 2015 STATISTICAL REPORT WORLD RUGBYTM GAME ANALYSIS
64 RWC 2015 STATISTICAL REPORT – WORLD RUGBY GAME ANALYSIS 64 Filename/Filepath
The following table shows the average weight of each team’s forwards.
AVERAGE WEIGHT
FORWARDS
AVERAGE WEIGHT
FORWARDS
WAL 115 kg 18st 02lbs
RSA 115 kg 18st 02lbs
SAM 114 kg 17st 13lbs
ENG 114 kg 17st 13lbs
FRA 113 kg 17st 11lbs
NZL 113 kg 17st 11lbs
AUS 113 kg 17st 11lbs
IRE 113 kg 17st 11lbs
SCO 113 kg 17st 11lbs
AVERAGE 112 kg 17st 09lbs
ROM 112 kg 17st 09lbs
USA 112 kg 17st 09lbs
GEO 112 kg 17st 09lbs
ITA 110 kg 17st 05lbs
NAM 110 kg 17st 05lbs
FJI 110 kg 17st 05lbs
CAN 110 kg 17st 05lbs
TGA 110 kg 17st 05lbs
JPN 110 kg 17st 05lbs
ARG 110 kg 17st 05lbs
URU 104 kg 16st 05lbs
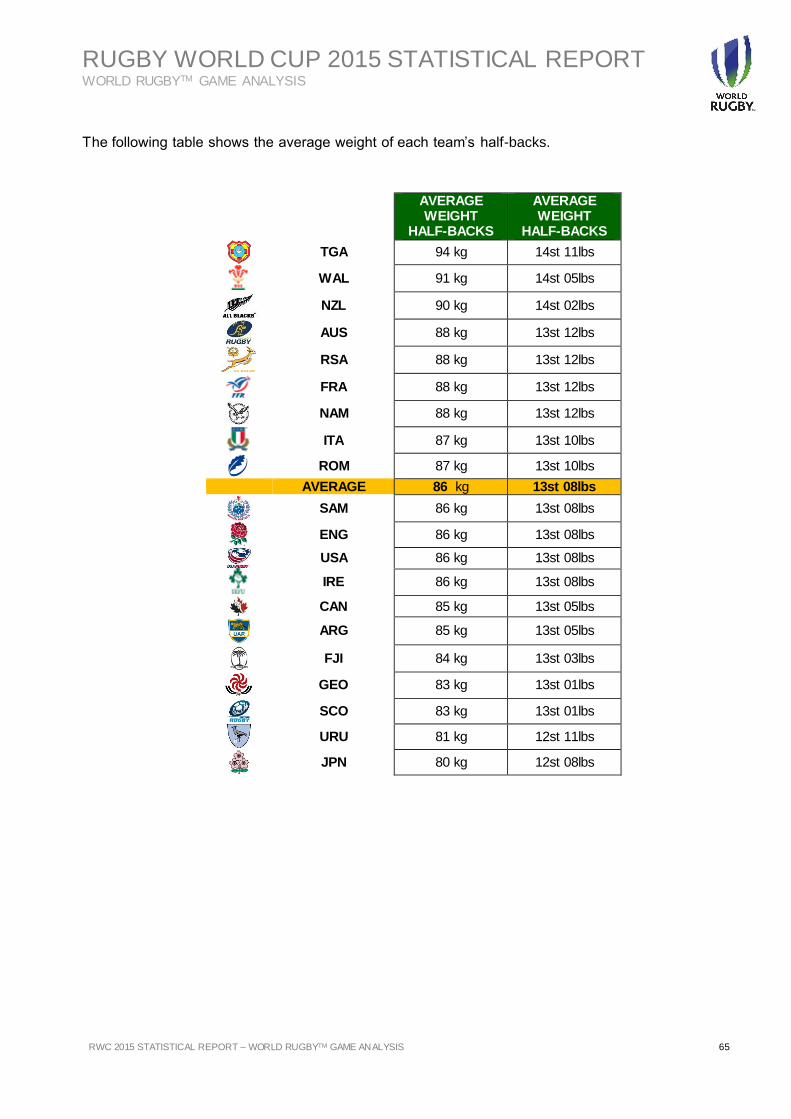
RUGBY WORLD CUP 2015 STATISTICAL REPORT WORLD RUGBYTM GAME ANALYSIS
RWC 2015 STATISTICAL REPORT – WORLD RUGBYTM GAME ANALYSIS 65
The following table shows the average weight of each team’s half-backs.
AVERAGE WEIGHT
HALF-BACKS
AVERAGE WEIGHT
HALF-BACKS
TGA 94 kg 14st 11lbs
WAL 91 kg 14st 05lbs
NZL 90 kg 14st 02lbs
AUS 88 kg 13st 12lbs
RSA 88 kg 13st 12lbs
FRA 88 kg 13st 12lbs
NAM 88 kg 13st 12lbs
ITA 87 kg 13st 10lbs
ROM 87 kg 13st 10lbs
AVERAGE 86 kg 13st 08lbs
SAM 86 kg 13st 08lbs
ENG 86 kg 13st 08lbs
USA 86 kg 13st 08lbs
IRE 86 kg 13st 08lbs
CAN 85 kg 13st 05lbs
ARG 85 kg 13st 05lbs
FJI 84 kg 13st 03lbs
GEO 83 kg 13st 01lbs
SCO 83 kg 13st 01lbs
URU 81 kg 12st 11lbs
JPN 80 kg 12st 08lbs
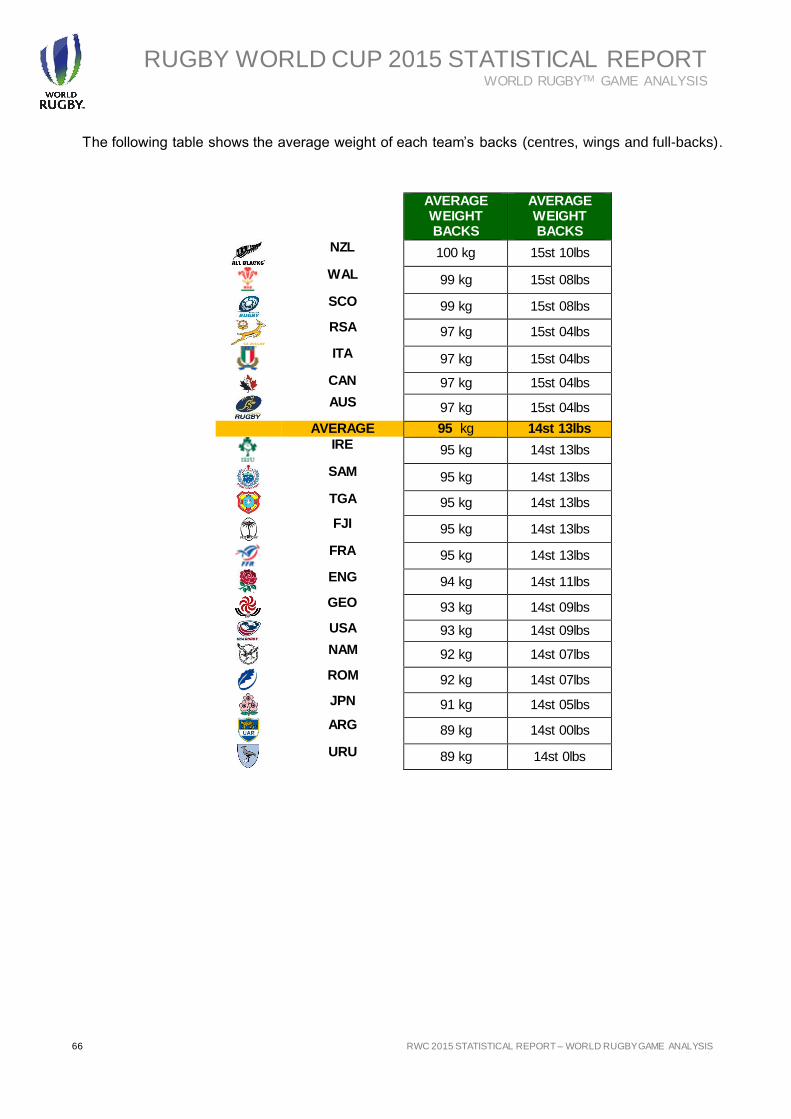
RUGBY WORLD CUP 2015 STATISTICAL REPORT WORLD RUGBYTM GAME ANALYSIS
66 RWC 2015 STATISTICAL REPORT – WORLD RUGBY GAME ANALYSIS 66 Filename/Filepath
The following table shows the average weight of each team’s backs (centres, wings and full-backs).
AVERAGE WEIGHT BACKS
AVERAGE WEIGHT BACKS
NZL 100 kg 15st 10lbs
WAL 99 kg 15st 08lbs
SCO 99 kg 15st 08lbs
RSA 97 kg 15st 04lbs
ITA 97 kg 15st 04lbs
CAN 97 kg 15st 04lbs
AUS 97 kg 15st 04lbs
AVERAGE 95 kg 14st 13lbs
IRE 95 kg 14st 13lbs
SAM 95 kg 14st 13lbs
TGA 95 kg 14st 13lbs
FJI 95 kg 14st 13lbs
FRA 95 kg 14st 13lbs
ENG 94 kg 14st 11lbs
GEO 93 kg 14st 09lbs
USA 93 kg 14st 09lbs
NAM 92 kg 14st 07lbs
ROM 92 kg 14st 07lbs
JPN 91 kg 14st 05lbs
ARG 89 kg 14st 00lbs
URU 89 kg 14st 0lbs
RUGBY WORLD CUP 2015 STATISTICAL REPORT WORLD RUGBYTM GAME ANALYSIS
RWC 2015 STATISTICAL REPORT – WORLD RUGBYTM GAME ANALYSIS 67
APPENDIX 1: POOL TEAM SUMMARIES
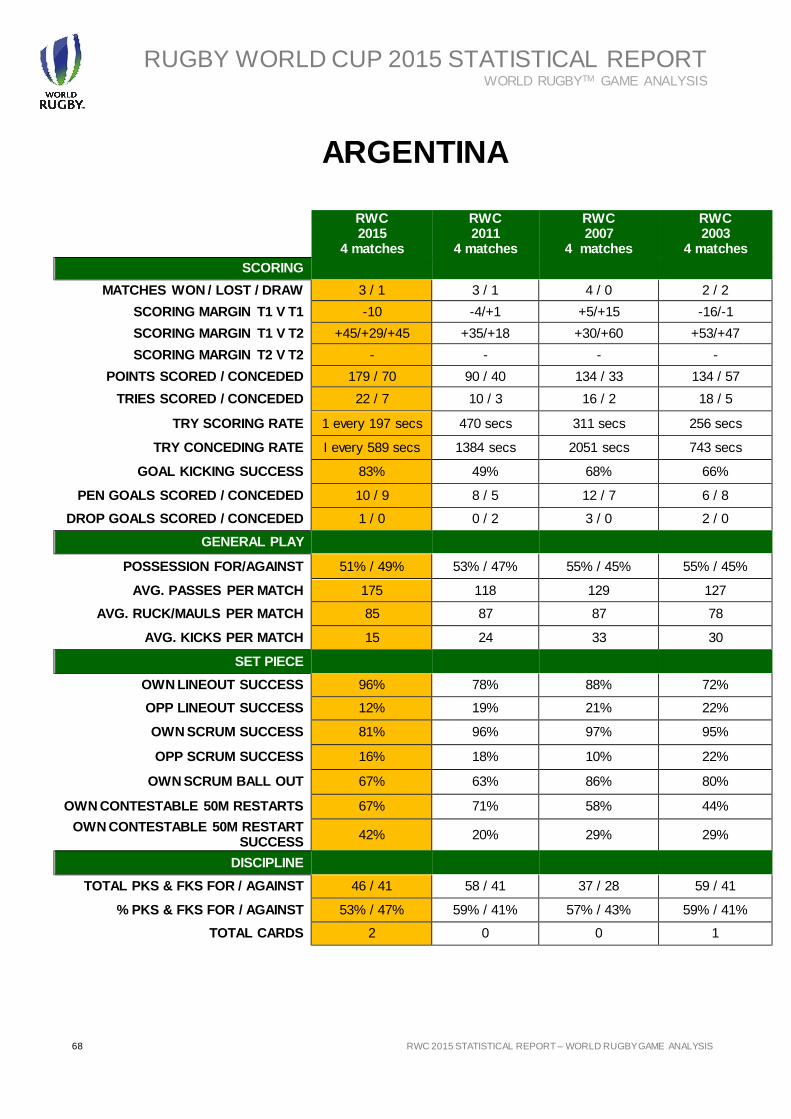
RUGBY WORLD CUP 2015 STATISTICAL REPORT WORLD RUGBYTM GAME ANALYSIS
68 RWC 2015 STATISTICAL REPORT – WORLD RUGBY GAME ANALYSIS 68 Filename/Filepath
ARGENTINA
RWC 2015
4 matches
RWC 2011
4 matches
RWC 2007
4 matches
RWC 2003
4 matches
SCORING
MATCHES WON / LOST / DRAW 3 / 1 3 / 1 4 / 0 2 / 2
SCORING MARGIN T1 V T1 -10 -4/+1 +5/+15 -16/-1
SCORING MARGIN T1 V T2 +45/+29/+45 +35/+18 +30/+60 +53/+47
SCORING MARGIN T2 V T2 - - - -
POINTS SCORED / CONCEDED 179 / 70 90 / 40 134 / 33 134 / 57
TRIES SCORED / CONCEDED 22 / 7 10 / 3 16 / 2 18 / 5
TRY SCORING RATE 1 every 197 secs 470 secs 311 secs 256 secs
TRY CONCEDING RATE I every 589 secs 1384 secs 2051 secs 743 secs
GOAL KICKING SUCCESS 83% 49% 68% 66%
PEN GOALS SCORED / CONCEDED 10 / 9 8 / 5 12 / 7 6 / 8
DROP GOALS SCORED / CONCEDED 1 / 0 0 / 2 3 / 0 2 / 0
GENERAL PLAY
POSSESSION FOR/AGAINST 51% / 49% 53% / 47% 55% / 45% 55% / 45%
AVG. PASSES PER MATCH 175 118 129 127
AVG. RUCK/MAULS PER MATCH 85 87 87 78
AVG. KICKS PER MATCH 15 24 33 30
SET PIECE
OWN LINEOUT SUCCESS 96% 78% 88% 72%
OPP LINEOUT SUCCESS 12% 19% 21% 22%
OWN SCRUM SUCCESS 81% 96% 97% 95%
OPP SCRUM SUCCESS 16% 18% 10% 22%
OWN SCRUM BALL OUT 67% 63% 86% 80%
OWN CONTESTABLE 50M RESTARTS 67% 71% 58% 44%
OWN CONTESTABLE 50M RESTART SUCCESS
42% 20% 29% 29%
DISCIPLINE
TOTAL PKS & FKS FOR / AGAINST 46 / 41 58 / 41 37 / 28 59 / 41
% PKS & FKS FOR / AGAINST 53% / 47% 59% / 41% 57% / 43% 59% / 41%
TOTAL CARDS 2 0 0 1
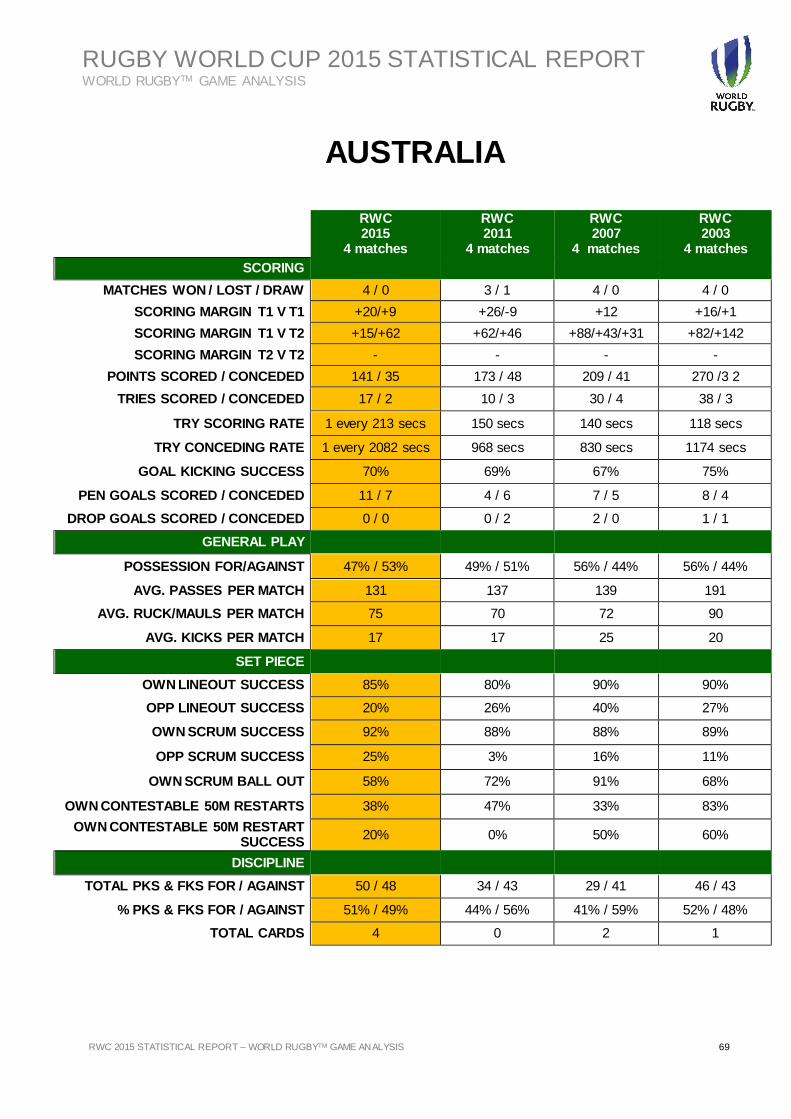
RUGBY WORLD CUP 2015 STATISTICAL REPORT WORLD RUGBYTM GAME ANALYSIS
RWC 2015 STATISTICAL REPORT – WORLD RUGBYTM GAME ANALYSIS 69
AUSTRALIA
RWC 2015
4 matches
RWC 2011
4 matches
RWC 2007
4 matches
RWC 2003
4 matches
SCORING
MATCHES WON / LOST / DRAW 4 / 0 3 / 1 4 / 0 4 / 0
SCORING MARGIN T1 V T1 +20/+9 +26/-9 +12 +16/+1
SCORING MARGIN T1 V T2 +15/+62 +62/+46 +88/+43/+31 +82/+142
SCORING MARGIN T2 V T2 - - - -
POINTS SCORED / CONCEDED 141 / 35 173 / 48 209 / 41 270 /3 2
TRIES SCORED / CONCEDED 17 / 2 10 / 3 30 / 4 38 / 3
TRY SCORING RATE 1 every 213 secs 150 secs 140 secs 118 secs
TRY CONCEDING RATE 1 every 2082 secs 968 secs 830 secs 1174 secs
GOAL KICKING SUCCESS 70% 69% 67% 75%
PEN GOALS SCORED / CONCEDED 11 / 7 4 / 6 7 / 5 8 / 4
DROP GOALS SCORED / CONCEDED 0 / 0 0 / 2 2 / 0 1 / 1
GENERAL PLAY
POSSESSION FOR/AGAINST 47% / 53% 49% / 51% 56% / 44% 56% / 44%
AVG. PASSES PER MATCH 131 137 139 191
AVG. RUCK/MAULS PER MATCH 75 70 72 90
AVG. KICKS PER MATCH 17 17 25 20
SET PIECE
OWN LINEOUT SUCCESS 85% 80% 90% 90%
OPP LINEOUT SUCCESS 20% 26% 40% 27%
OWN SCRUM SUCCESS 92% 88% 88% 89%
OPP SCRUM SUCCESS 25% 3% 16% 11%
OWN SCRUM BALL OUT 58% 72% 91% 68%
OWN CONTESTABLE 50M RESTARTS 38% 47% 33% 83%
OWN CONTESTABLE 50M RESTART SUCCESS
20% 0% 50% 60%
DISCIPLINE
TOTAL PKS & FKS FOR / AGAINST 50 / 48 34 / 43 29 / 41 46 / 43
% PKS & FKS FOR / AGAINST 51% / 49% 44% / 56% 41% / 59% 52% / 48%
TOTAL CARDS 4 0 2 1
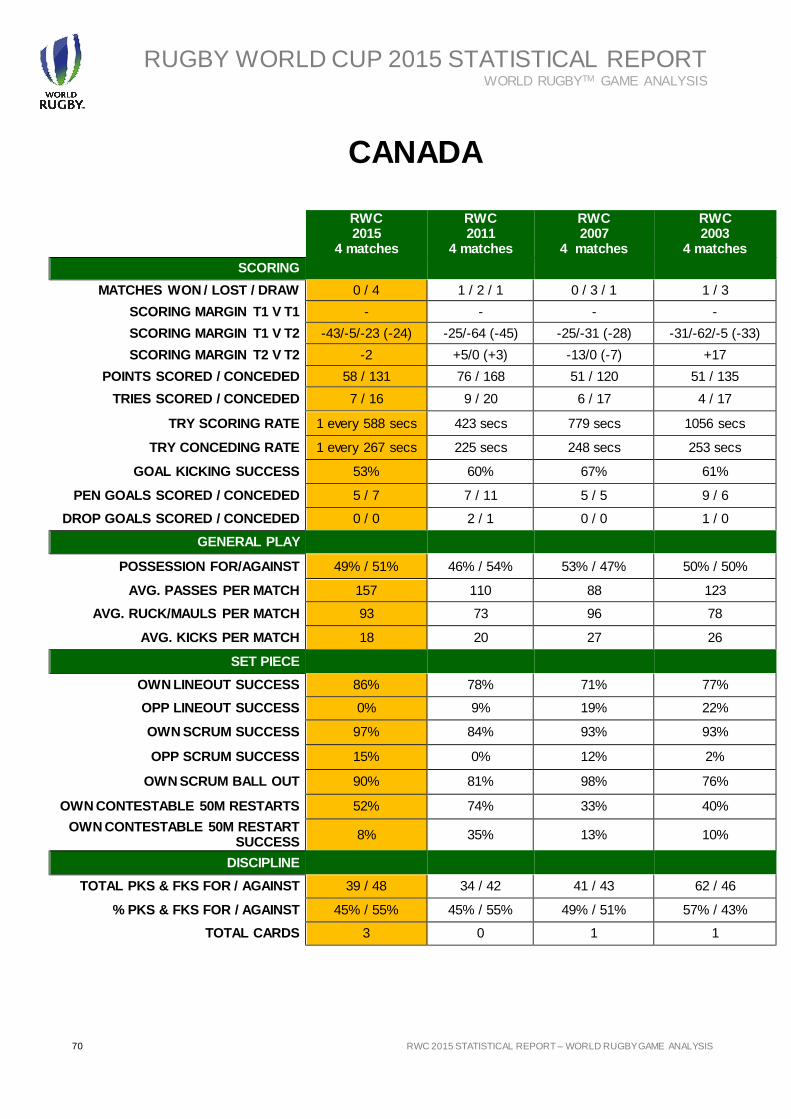
RUGBY WORLD CUP 2015 STATISTICAL REPORT WORLD RUGBYTM GAME ANALYSIS
70 RWC 2015 STATISTICAL REPORT – WORLD RUGBY GAME ANALYSIS 70 Filename/Filepath
CANADA
RWC 2015
4 matches
RWC 2011
4 matches
RWC 2007
4 matches
RWC 2003
4 matches
SCORING
MATCHES WON / LOST / DRAW 0 / 4 1 / 2 / 1 0 / 3 / 1 1 / 3
SCORING MARGIN T1 V T1 - - - -
SCORING MARGIN T1 V T2 -43/-5/-23 (-24) -25/-64 (-45) -25/-31 (-28) -31/-62/-5 (-33)
SCORING MARGIN T2 V T2 -2 +5/0 (+3) -13/0 (-7) +17
POINTS SCORED / CONCEDED 58 / 131 76 / 168 51 / 120 51 / 135
TRIES SCORED / CONCEDED 7 / 16 9 / 20 6 / 17 4 / 17
TRY SCORING RATE 1 every 588 secs 423 secs 779 secs 1056 secs
TRY CONCEDING RATE 1 every 267 secs 225 secs 248 secs 253 secs
GOAL KICKING SUCCESS 53% 60% 67% 61%
PEN GOALS SCORED / CONCEDED 5 / 7 7 / 11 5 / 5 9 / 6
DROP GOALS SCORED / CONCEDED 0 / 0 2 / 1 0 / 0 1 / 0
GENERAL PLAY
POSSESSION FOR/AGAINST 49% / 51% 46% / 54% 53% / 47% 50% / 50%
AVG. PASSES PER MATCH 157 110 88 123
AVG. RUCK/MAULS PER MATCH 93 73 96 78
AVG. KICKS PER MATCH 18 20 27 26
SET PIECE
OWN LINEOUT SUCCESS 86% 78% 71% 77%
OPP LINEOUT SUCCESS 0% 9% 19% 22%
OWN SCRUM SUCCESS 97% 84% 93% 93%
OPP SCRUM SUCCESS 15% 0% 12% 2%
OWN SCRUM BALL OUT 90% 81% 98% 76%
OWN CONTESTABLE 50M RESTARTS 52% 74% 33% 40%
OWN CONTESTABLE 50M RESTART SUCCESS
8% 35% 13% 10%
DISCIPLINE
TOTAL PKS & FKS FOR / AGAINST 39 / 48 34 / 42 41 / 43 62 / 46
% PKS & FKS FOR / AGAINST 45% / 55% 45% / 55% 49% / 51% 57% / 43%
TOTAL CARDS 3 0 1 1

RUGBY WORLD CUP 2015 STATISTICAL REPORT WORLD RUGBYTM GAME ANALYSIS
RWC 2015 STATISTICAL REPORT – WORLD RUGBYTM GAME ANALYSIS 71
ENGLAND
RWC 2015
4 matches
RWC 2011
4 matches
RWC 2007
4 matches
RWC 2003
4 matches
SCORING
MATCHES WON / LOST / DRAW 2 / 2 4 / 0 3 / 1 4 / 0
SCORING MARGIN T1 V T1 -3/-22 +4/+4 -36 +19
SCORING MARGIN T1 V T2 +24/+57 +64/+31 +18/+22/+16 +78/+13/+98
SCORING MARGIN T2 V T2 - - - -
POINTS SCORED / CONCEDED 133 / 75 134 / 34 96 / 88 246 / 47
TRIES SCORED / CONCEDED 16 / 5 18 / 1 11 / 7 34 / 2
TRY SCORING RATE 1 every 294 secs 232 secs 437 secs 153 secs
TRY CONCEDING RATE 1 every 704 secs 4089 secs 532 secs 1666 secs
GOAL KICKING SUCCESS 74% 58% 70% 77%
PEN GOALS SCORED / CONCEDED 10 / 13 6 / 8 9 / 13 8 / 11
DROP GOALS SCORED / CONCEDED 1 / 0 1 / 1 4 / 0 3 / 0
GENERAL PLAY
POSSESSION FOR/AGAINST 57% / 43% 51% / 49% 56% / 44% 61% / 39%
AVG. PASSES PER MATCH 165 139 127 204
AVG. RUCK/MAULS PER MATCH 97 71 83 101
AVG. KICKS PER MATCH 23 19 31 18
SET PIECE
OWN LINEOUT SUCCESS 91% 88% 77% 86%
OPP LINEOUT SUCCESS 21% 28% 25% 23%
OWN SCRUM SUCCESS 85% 78% 97% 100%
OPP SCRUM SUCCESS 5% 3% 19% 8%
OWN SCRUM BALL OUT 55% 41% 71% 81%
OWN CONTESTABLE 50M RESTARTS 41% 83% 70% 69%
OWN CONTESTABLE 50M RESTART SUCCESS
44% 20% 19% 36%
DISCIPLINE
TOTAL PKS & FKS FOR / AGAINST 45 / 47 50 / 54 36 / 40 52 / 50
% PKS & FKS FOR / AGAINST 49% / 51% 48% / 52% 47% / 53% 51% / 49%
TOTAL CARDS 1 2 1 1

RUGBY WORLD CUP 2015 STATISTICAL REPORT WORLD RUGBYTM GAME ANALYSIS
72 RWC 2015 STATISTICAL REPORT – WORLD RUGBY GAME ANALYSIS 72 Filename/Filepath
FIJI
RWC 2015
4 matches
RWC 2011
4 matches
RWC 2007
4 matches
RWC 2003
4 matches
SCORING
MATCHES WON / LOST / DRAW 1 / 3 1 / 3 3 / 1 2 / 2
SCORING MARGIN T1 V T1 - - - -
SCORING MARGIN T1 V T2 -24/-15/-10 (-16) -46/-66 (-56) -43/+4 (-19) -43/-2 (-23)
SCORING MARGIN T2 V T2 +32 +24/-20 (+2) +4/+13 (+9) +1/+28 (+15)
POINTS SCORED / CONCEDED 84 / 101 59 / 167 114 /1 36 98 / 114
TRIES SCORED / CONCEDED 10 / 11 7 / 19 14 / 16 10 / 11
TRY SCORING RATE 1 every 409 secs 604 secs 277 secs 383 secs
TRY CONCEDING RATE 1 every 392 secs 242 secs 307 secs 408 secs
GOAL KICKING SUCCESS 67% 77% 72% 78%
PEN GOALS SCORED / CONCEDED 6 / 10 4 / 10 8 / 11 12 / 14
DROP GOALS SCORED / CONCEDED 0 / 0 0 / 4 0 / 1 0 / 1
GENERAL PLAY
POSSESSION FOR/AGAINST 49% / 51% 48% / 52% 44% / 56% 46% / 54%
AVG. PASSES PER MATCH 142 145 110 101
AVG. RUCK/MAULS PER MATCH 76 81 71 62
AVG. KICKS PER MATCH 18 20 23 30
SET PIECE
OWN LINEOUT SUCCESS 87% 82% 68% 66%
OPP LINEOUT SUCCESS 10% 17% 10% 19%
OWN SCRUM SUCCESS 84% 74% 71% 86%
OPP SCRUM SUCCESS 36% 2% 0% 2%
OWN SCRUM BALL OUT 79% 79% 82% 88%
OWN CONTESTABLE 50M RESTARTS 33% 44% 57% 67%
OWN CONTESTABLE 50M RESTART SUCCESS
25% 33% 24% 24%
DISCIPLINE
TOTAL PKS & FKS FOR / AGAINST 53 / 47 39 / 37 33 / 51 45 / 54
% PKS & FKS FOR / AGAINST 53% / 47% 51% / 49% 39% / 61% 46% / 54%
TOTAL CARDS 3 0 2 3

RUGBY WORLD CUP 2015 STATISTICAL REPORT WORLD RUGBYTM GAME ANALYSIS
RWC 2015 STATISTICAL REPORT – WORLD RUGBYTM GAME ANALYSIS 73
FRANCE
RWC 2015
4 matches
RWC 2011
4 matches
RWC 2007
4 matches
RWC 2003
4 matches
SCORING
MATCHES WON / LOST / DRAW 3 / 1 2 / 2 3 / 1 4 / 0
SCORING MARGIN T1 V T1 +22/-15 -20 -5/+22 +42
SCORING MARGIN T1 V T2 +27/+23 +26/+25/-5 +77/+57 +43/+22/+27
SCORING MARGIN T2 V T2 - - - -
POINTS SCORED / CONCEDED 120 / 63 121 / 96 188 / 37 195 / 70
TRIES SCORED / CONCEDED 12 / 6 13 / 9 24 / 3 23 / 6
TRY SCORING RATE 1 every 341 secs 329 secs 197 secs 189 secs
TRY CONCEDING RATE 1 every 702 secs 476 secs 1167 secs 600 secs
GOAL KICKING SUCCESS 86% 85% 70% 74%
PEN GOALS SCORED / CONCEDED 12 / 9 12 / 10 12 / 4 16 / 10
DROP GOALS SCORED / CONCEDED 0 / 0 1 / 3 0 / 2 3 / 0
GENERAL PLAY
POSSESSION FOR/AGAINST 49% / 51% 50% / 50% 57% / 43% 55% / 45%
AVG. PASSES PER MATCH 132 136 147 149
AVG. RUCK/MAULS PER MATCH 82 78 75 78
AVG. KICKS PER MATCH 16 20 28 27
SET PIECE
OWN LINEOUT SUCCESS 86% 91% 92% 90%
OPP LINEOUT SUCCESS 16% 10% 27% 19%
OWN SCRUM SUCCESS 83% 95% 94% 97%
OPP SCRUM SUCCESS 24% 10% 24% 16%
OWN SCRUM BALL OUT 65% 64% 94% 87%
OWN CONTESTABLE 50M RESTARTS 58% 62% 92% 47%
OWN CONTESTABLE 50M RESTART SUCCESS
27% 0% 27% 22%
DISCIPLINE
TOTAL PKS & FKS FOR / AGAINST 54 / 50 46 / 40 44 / 35 55 / 43
% PKS & FKS FOR / AGAINST 49% / 51% 54% / 46% 56% / 44% 56% / 44%
TOTAL CARDS 0 1 1 2

RUGBY WORLD CUP 2015 STATISTICAL REPORT WORLD RUGBYTM GAME ANALYSIS
74 RWC 2015 STATISTICAL REPORT – WORLD RUGBY GAME ANALYSIS 74 Filename/Filepath
GEORGIA
RWC 2015
4 matches
RWC 2011
4 matches
RWC 2007
4 matches
RWC 2003
4 matches
SCORING
MATCHES WON / LOST / DRAW 2 / 2 1 / 3 1 / 3 0 / 4
SCORING MARGIN T1 V T1 - - - -
SCORING MARGIN T1 V T2 -45/-33 (-39) -9/-31/-18 (-19) -30/-4/-57 (-30) -78/-27 (-52)
SCORING MARGIN T2 V T2 +7/+1 (+4) +16 +30 -37/-12 (-25)
POINTS SCORED / CONCEDED 53 / 123 48 / 90 50 / 111 43 / 200
TRIES SCORED / CONCEDED 5 / 16 3 / 9 5 / 15 1 / 28
TRY SCORING RATE 1 every 791 secs 1359 secs 925 secs 3129 secs
TRY CONCEDING RATE 1 every 264 secs 442 secs 290 secs 168 secs
GOAL KICKING SUCCESS 79% 60% 63% 81%
PEN GOALS SCORED / CONCEDED 6 / 6 9 / 10 5 / 6 12 / 6
DROP GOALS SCORED / CONCEDED 0 / 1 0 / 1 0 / 0 1 / 0
GENERAL PLAY
POSSESSION FOR/AGAINST 48% / 52% 51% / 49% 52% / 48% 40% / 60%
AVG. PASSES PER MATCH 100 107 77 82
AVG. RUCK/MAULS PER MATCH 67 83 87 47
AVG. KICKS PER MATCH 21 20 31 20
SET PIECE
OWN LINEOUT SUCCESS 78% 77% 73% 67%
OPP LINEOUT SUCCESS 12% 21% 17% 14%
OWN SCRUM SUCCESS 85% 89% 89% 83%
OPP SCRUM SUCCESS 13% 3% 15% 2%
OWN SCRUM BALL OUT 39% 89% 92% 87%
OWN CONTESTABLE 50M RESTARTS 63% 87% 48% 53%
OWN CONTESTABLE 50M RESTART SUCCESS
18% 10% 18% 50%
DISCIPLINE
TOTAL PKS & FKS FOR / AGAINST 47 / 50 42 / 51 37 / 42 45 / 57
% PKS & FKS FOR / AGAINST 49% / 51% 45% / 55% 47% / 53% 44% / 56%
TOTAL CARDS 3 0 2 2

RUGBY WORLD CUP 2015 STATISTICAL REPORT WORLD RUGBYTM GAME ANALYSIS
RWC 2015 STATISTICAL REPORT – WORLD RUGBYTM GAME ANALYSIS 75
IRELAND
RWC 2015
4 matches
RWC 2011
4 matches
RWC 2007
4 matches
RWC 2003
4 matches
SCORING
MATCHES WON / LOST / DRAW 4 / 0 4 / 0 2 / 2 3 / 1
SCORING MARGIN T1 V T1 +7/+15 +30/+9 -22/-15 +1/-1
SCORING MARGIN T1 V T2 +43/+34 +12/+50 +15/+4 +28/+57
SCORING MARGIN T2 V T2 - - - -
POINTS SCORED / CONCEDED 134 / 35 132 / 34 61 / 82 138 / 56
TRIES SCORED / CONCEDED 16 / 2 15 / 3 9 / 7 17 / 4
TRY SCORING RATE 1 every 321 secs 289 secs 489 secs 272 secs
TRY CONCEDING RATE 1 every 1866 secs 1066 secs 678 secs 1036 secs
GOAL KICKING SUCCESS 79% 68% 54% 76%
PEN GOALS SCORED / CONCEDED 10 / 7 11 / 5 2 / 10 9 / 7
DROP GOALS SCORED / CONCEDED 0 / 0 1/ 0 1 / 3 1 / 3
GENERAL PLAY
POSSESSION FOR/AGAINST 58% / 42% 58% / 42% 48% / 52% 53% / 47%
AVG. PASSES PER MATCH 199 145 121 130
AVG. RUCK/MAULS PER MATCH 127 91 73 81
AVG. KICKS PER MATCH 27 19 30 35
SET PIECE
OWN LINEOUT SUCCESS 98% 92% 81% 94%
OPP LINEOUT SUCCESS 27% 22% 16% 26%
OWN SCRUM SUCCESS 93% 87% 89% 94%
OPP SCRUM SUCCESS 0% 24% 15% 19%
OWN SCRUM BALL OUT 89% 58% 82% 86%
OWN CONTESTABLE 50M RESTARTS 92% 82% 36% 67%
OWN CONTESTABLE 50M RESTART SUCCESS
17% 22% 13% 42%
DISCIPLINE
TOTAL PKS & FKS FOR / AGAINST 37 / 39 52 / 42 44 / 38 46 / 55
% PKS & FKS FOR / AGAINST 49% / 51% 55% / 45% 54% / 46% 46% / 54%
TOTAL CARDS 2 0 2 1

RUGBY WORLD CUP 2015 STATISTICAL REPORT WORLD RUGBYTM GAME ANALYSIS
76 RWC 2015 STATISTICAL REPORT – WORLD RUGBY GAME ANALYSIS 76 Filename/Filepath
ITALY
RWC 2015
4 matches
RWC 2011
4 matches
RWC 2007
4 matches
RWC 2003
4 matches
SCORING
MATCHES WON / LOST / DRAW 2 / 2 2 / 2 2 / 2 2 / 2
SCORING MARGIN T1 V T1 -22/-7 -26/-30 -62/-2 -63/-12
SCORING MARGIN T1 V T2 +5/+10 +36/+17 +6/+26 +24/+5
SCORING MARGIN T2 V T2 - - - -
POINTS SCORED / CONCEDED 74 / 88 92 / 95 85 / 117 77 / 123
TRIES SCORED / CONCEDED 7 / 8 13 / 11 8 / 14 5 / 17
TRY SCORING RATE 1 every 545 secs 295 secs 525 secs 820 secs
TRY CONCEDING RATE 1 every 582 secs 385 secs 269 secs 268 secs
GOAL KICKING SUCCESS 79% 68% 74% 86%
PEN GOALS SCORED / CONCEDED 9 / 12 5 / 8 11 / 9 14 / 6
DROP GOALS SCORED / CONCEDED 0 / 0 0 / 0 0 / 0 0 / 0
GENERAL PLAY
POSSESSION FOR/AGAINST 45% / 55% 48% / 52% 53% / 47% 47% / 53%
AVG. PASSES PER MATCH 126 101 126 119
AVG. RUCK/MAULS PER MATCH 75 64 65 85
AVG. KICKS PER MATCH 19 18 33 27
SET PIECE
OWN LINEOUT SUCCESS 85% 81% 86% 81%
OPP LINEOUT SUCCESS 7% 16% 18% 17%
OWN SCRUM SUCCESS 77% 83% 97% 89%
OPP SCRUM SUCCESS 8% 18% 19% 12%
OWN SCRUM BALL OUT 58% 43% 85% 85%
OWN CONTESTABLE 50M RESTARTS 25% 55% 48% 46%
OWN CONTESTABLE 50M RESTART SUCCESS
33% 17% 8% 8%
DISCIPLINE
TOTAL PKS & FKS FOR / AGAINST 46 / 46 65 / 37 44 / 38 41 / 49
% PKS & FKS FOR / AGAINST 50% / 50% 64% / 36% 54% / 46% 46% / 54%
TOTAL CARDS 0 1 3 2

RUGBY WORLD CUP 2015 STATISTICAL REPORT WORLD RUGBYTM GAME ANALYSIS
RWC 2015 STATISTICAL REPORT – WORLD RUGBYTM GAME ANALYSIS 77
JAPAN
RWC 2015
4 matches
RWC 2011
4 matches
RWC 2007
4 matches
RWC 2003
4 matches
SCORING
MATCHES WON / LOST / DRAW 3 / 1 0 / 3 / 1 0 / 3 / 1 0 / 4
SCORING MARGIN T1 V T1 - - - -
SCORING MARGIN T1 V T2 +2/-35 (-17) -26/-66 (-46) -88/-54 (-71) -21/-22 (-22)
SCORING MARGIN T2 V T2 +21/+10 (+16) -13/0 (-7) -4/0 (-2) -28/-13 (-21)
POINTS SCORED / CONCEDED 98 / 100 69 / 184 64 / 210 76 / 163
TRIES SCORED / CONCEDED 9 / 12 8 / 25 7 / 30 6 / 21
TRY SCORING RATE 1 every 522 secs 537 secs 586 secs 609 secs
TRY CONCEDING RATE 1 every 337 secs 155 secs 150 secs 212 secs
GOAL KICKING SUCCESS 74% 69% 79% 74%
PEN GOALS SCORED / CONCEDED 13 / 8 7 / 9 7 / 6 12 / 10
DROP GOALS SCORED / CONCEDED 0 / 0 0 / 0 0 / 0 1 / 0
GENERAL PLAY
POSSESSION FOR/AGAINST 54% / 46% 53% / 47% 48% / 52% 45% / 55%
AVG. PASSES PER MATCH 157 149 108 124
AVG. RUCK/MAULS PER MATCH 119 87 72 65
AVG. KICKS PER MATCH 16 13 25 26
SET PIECE
OWN LINEOUT SUCCESS 93% 85% 85% 78%
OPP LINEOUT SUCCESS 3% 21% 17% 16%
OWN SCRUM SUCCESS 100% 89% 87% 92%
OPP SCRUM SUCCESS 0% 4% 9% 4%
OWN SCRUM BALL OUT 75% 75% 87% 92%
OWN CONTESTABLE 50M RESTARTS 58% 97% 33% 26%
OWN CONTESTABLE 50M RESTART SUCCESS
21% 28% 17% 22%
DISCIPLINE
TOTAL PKS & FKS FOR / AGAINST 46 / 32 48 / 46 44 / 32 49 / 45
% PKS & FKS FOR / AGAINST 59% / 41% 51% / 49% 58% / 42% 52% / 48%
TOTAL CARDS 1 1 0 0

RUGBY WORLD CUP 2015 STATISTICAL REPORT WORLD RUGBYTM GAME ANALYSIS
78 RWC 2015 STATISTICAL REPORT – WORLD RUGBY GAME ANALYSIS 78 Filename/Filepath
NAMIBIA
RWC 2015
4 matches
RWC 2011
4 matches
RWC 2007
4 matches
RWC 2003
4 matches
SCORING
MATCHES WON / LOST / DRAW 0 / 4 0 / 4 0 / 4 0 / 4
SCORING MARGIN T1 V T1 - - - -
SCORING MARGIN T1 V T2 -44/-45 (-45) -87/-74/(-76) -15/-77/-60 (-51) -53/-57/-142 (-84)
SCORING MARGIN T2 V T2 -14/-1 (-8) -24/-37 (-31) -30 -30
POINTS SCORED / CONCEDED 70 / 174 35 / 266 27 / 212 28 / 310
TRIES SCORED / CONCEDED 8 / 25 5 / 36 3 / 30 4 / 47
TRY SCORING RATE 1 every 348 secs 653 secs 963 secs 806 secs
TRY CONCEDING RATE 1 every 195 secs 126 secs 154 secs 110 secs
GOAL KICKING SUCCESS 86% 40% 63% 100%
PEN GOALS SCORED / CONCEDED 6 / 5 2 / 8 2 / 6 0 / 3
DROP GOALS SCORED / CONCEDED 0 / 0 3 / 0 1 / 0 0 / 0
GENERAL PLAY
POSSESSION FOR/AGAINST 36% / 64% 42% / 58% 37% / 63% 39% / 61%
AVG. PASSES PER MATCH 74 99 52 72
AVG. RUCK/MAULS PER MATCH 48 56 46 60
AVG. KICKS PER MATCH 20 20 24 18
SET PIECE
OWN LINEOUT SUCCESS 82% 71% 71% 67%
OPP LINEOUT SUCCESS 14% 18% 15% 4%
OWN SCRUM SUCCESS 77% 76% 73% 77%
OPP SCRUM SUCCESS 0% 2% 3% 2%
OWN SCRUM BALL OUT 74% 74% 83% 88%
OWN CONTESTABLE 50M RESTARTS 52% 33% 42% 59%
OWN CONTESTABLE 50M RESTART SUCCESS
13% 20% 13% 27%
DISCIPLINE
TOTAL PKS & FKS FOR / AGAINST 33 / 53 34 / 51 29 / 48 50 / 46
% PKS & FKS FOR / AGAINST 38% / 62% 40% / 60% 38% / 62% 52 / 48
TOTAL CARDS 6 2 1 1
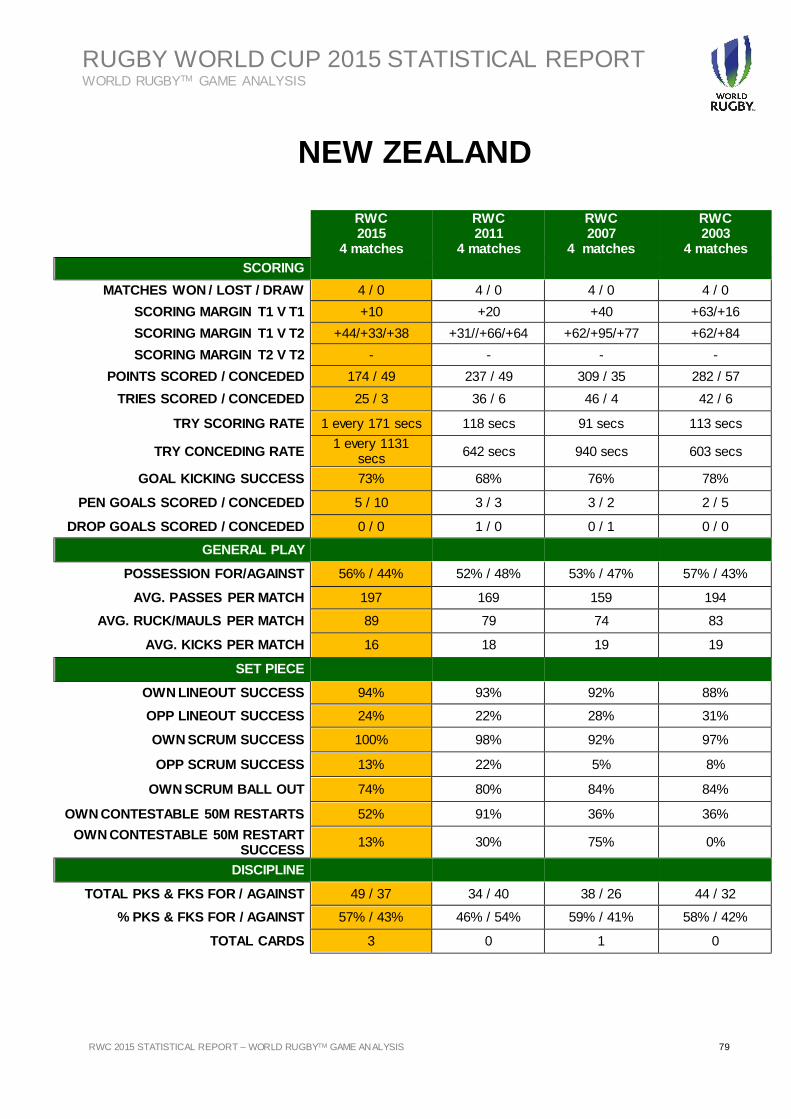
RUGBY WORLD CUP 2015 STATISTICAL REPORT WORLD RUGBYTM GAME ANALYSIS
RWC 2015 STATISTICAL REPORT – WORLD RUGBYTM GAME ANALYSIS 79
NEW ZEALAND
RWC 2015
4 matches
RWC 2011
4 matches
RWC 2007
4 matches
RWC 2003
4 matches
SCORING
MATCHES WON / LOST / DRAW 4 / 0 4 / 0 4 / 0 4 / 0
SCORING MARGIN T1 V T1 +10 +20 +40 +63/+16
SCORING MARGIN T1 V T2 +44/+33/+38 +31//+66/+64 +62/+95/+77 +62/+84
SCORING MARGIN T2 V T2 - - - -
POINTS SCORED / CONCEDED 174 / 49 237 / 49 309 / 35 282 / 57
TRIES SCORED / CONCEDED 25 / 3 36 / 6 46 / 4 42 / 6
TRY SCORING RATE 1 every 171 secs 118 secs 91 secs 113 secs
TRY CONCEDING RATE 1 every 1131
secs 642 secs 940 secs 603 secs
GOAL KICKING SUCCESS 73% 68% 76% 78%
PEN GOALS SCORED / CONCEDED 5 / 10 3 / 3 3 / 2 2 / 5
DROP GOALS SCORED / CONCEDED 0 / 0 1 / 0 0 / 1 0 / 0
GENERAL PLAY
POSSESSION FOR/AGAINST 56% / 44% 52% / 48% 53% / 47% 57% / 43%
AVG. PASSES PER MATCH 197 169 159 194
AVG. RUCK/MAULS PER MATCH 89 79 74 83
AVG. KICKS PER MATCH 16 18 19 19
SET PIECE
OWN LINEOUT SUCCESS 94% 93% 92% 88%
OPP LINEOUT SUCCESS 24% 22% 28% 31%
OWN SCRUM SUCCESS 100% 98% 92% 97%
OPP SCRUM SUCCESS 13% 22% 5% 8%
OWN SCRUM BALL OUT 74% 80% 84% 84%
OWN CONTESTABLE 50M RESTARTS 52% 91% 36% 36%
OWN CONTESTABLE 50M RESTART SUCCESS
13% 30% 75% 0%
DISCIPLINE
TOTAL PKS & FKS FOR / AGAINST 49 / 37 34 / 40 38 / 26 44 / 32
% PKS & FKS FOR / AGAINST 57% / 43% 46% / 54% 59% / 41% 58% / 42%
TOTAL CARDS 3 0 1 0

RUGBY WORLD CUP 2015 STATISTICAL REPORT WORLD RUGBYTM GAME ANALYSIS
80 RWC 2015 STATISTICAL REPORT – WORLD RUGBY GAME ANALYSIS 80 Filename/Filepath
ROMANIA
RWC 2015
4 matches
RWC 2011
4 matches
RWC 2007
4 matches
RWC 2003
4 matches
SCORING
MATCHES WON / LOST / DRAW 1 / 3 0 / 4 1 / 3 1 / 3
SCORING MARGIN T1 V T1 - - - -
SCORING MARGIN T1 V T2 -27/-34/-10 (-24) -10/-35/-64 (-36) -6/-42/-78 (-42) -28/-82/-47 (-56)
SCORING MARGIN T2 V T2 +2 -16 +4 +30
POINTS SCORED / CONCEDED 60 / 129 44 / 169 40 / 161 65 / 192
TRIES SCORED / CONCEDED 7 / 17 3 / 21 5 / 22 8 / 26
TRY SCORING RATE 1 every 555 secs 1076 secs 872 secs 507 secs
TRY CONCEDING RATE 1 every 246 secs 219 secs 182 secs 172 secs
GOAL KICKING SUCCESS 67% 48% 46% 63%
PEN GOALS SCORED / CONCEDED 5 / 6 9 / 12 3 / 5 5 / 6
DROP GOALS SCORED / CONCEDED 0 / 0 0 / 0 0 / 0 0 / 0
GENERAL PLAY
POSSESSION FOR/AGAINST 48% / 52% 41% / 59% 52% / 48% 48% / 52%
AVG. PASSES PER MATCH 100 99 87 115
AVG. RUCK/MAULS PER MATCH 81 56 84 65
AVG. KICKS PER MATCH 19 20 27 25
SET PIECE
OWN LINEOUT SUCCESS 85% 68% 82% 78%
OPP LINEOUT SUCCESS 11% 15% 19% 19%
OWN SCRUM SUCCESS 83% 91% 91% 93%
OPP SCRUM SUCCESS 8% 13% 18% 6%
OWN SCRUM BALL OUT 54% 73% 91% 100%
OWN CONTESTABLE 50M RESTARTS 56% 78% 57% 37%
OWN CONTESTABLE 50M RESTART SUCCESS
20% 7% 12% 8%
DISCIPLINE
TOTAL PKS & FKS FOR / AGAINST 45 / 38 43 / 53 36 / 40 41 / 57
% PKS & FKS FOR / AGAINST 54% / 46% 45% / 55% 47% / 53% 42% / 58%
TOTAL CARDS 4 1 1 1
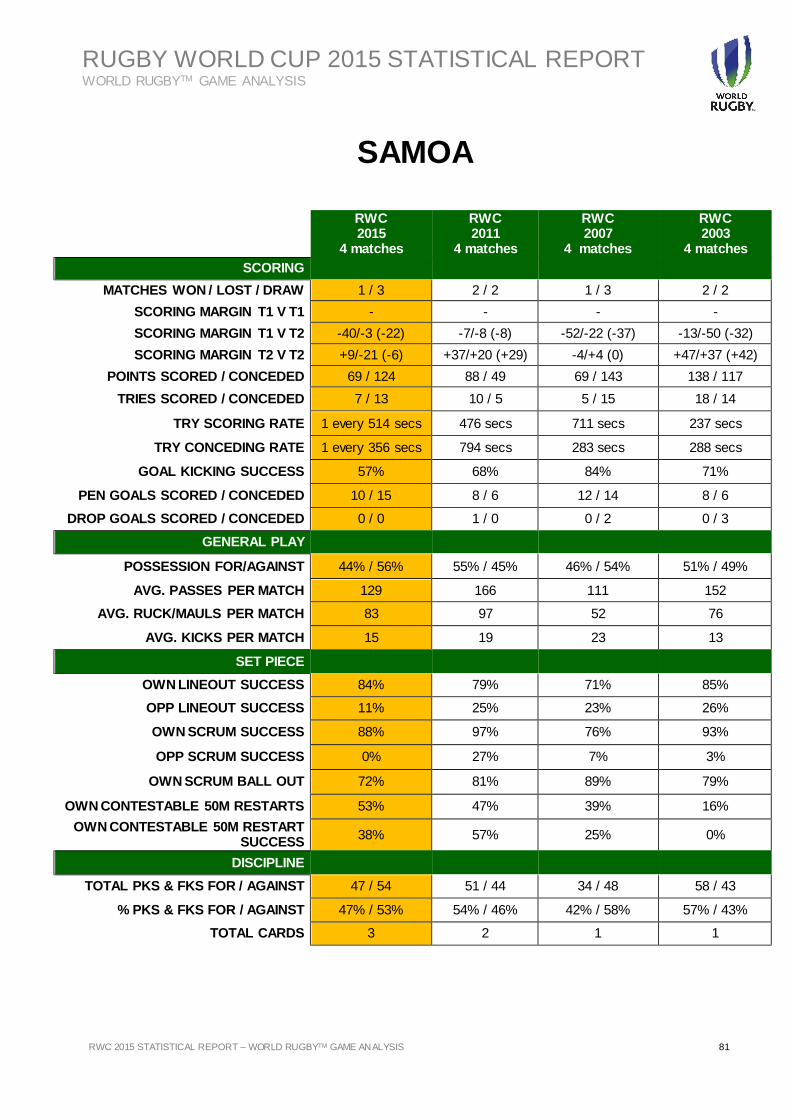
RUGBY WORLD CUP 2015 STATISTICAL REPORT WORLD RUGBYTM GAME ANALYSIS
RWC 2015 STATISTICAL REPORT – WORLD RUGBYTM GAME ANALYSIS 81
SAMOA
RWC 2015
4 matches
RWC 2011
4 matches
RWC 2007
4 matches
RWC 2003
4 matches
SCORING
MATCHES WON / LOST / DRAW 1 / 3 2 / 2 1 / 3 2 / 2
SCORING MARGIN T1 V T1 - - - -
SCORING MARGIN T1 V T2 -40/-3 (-22) -7/-8 (-8) -52/-22 (-37) -13/-50 (-32)
SCORING MARGIN T2 V T2 +9/-21 (-6) +37/+20 (+29) -4/+4 (0) +47/+37 (+42)
POINTS SCORED / CONCEDED 69 / 124 88 / 49 69 / 143 138 / 117
TRIES SCORED / CONCEDED 7 / 13 10 / 5 5 / 15 18 / 14
TRY SCORING RATE 1 every 514 secs 476 secs 711 secs 237 secs
TRY CONCEDING RATE 1 every 356 secs 794 secs 283 secs 288 secs
GOAL KICKING SUCCESS 57% 68% 84% 71%
PEN GOALS SCORED / CONCEDED 10 / 15 8 / 6 12 / 14 8 / 6
DROP GOALS SCORED / CONCEDED 0 / 0 1 / 0 0 / 2 0 / 3
GENERAL PLAY
POSSESSION FOR/AGAINST 44% / 56% 55% / 45% 46% / 54% 51% / 49%
AVG. PASSES PER MATCH 129 166 111 152
AVG. RUCK/MAULS PER MATCH 83 97 52 76
AVG. KICKS PER MATCH 15 19 23 13
SET PIECE
OWN LINEOUT SUCCESS 84% 79% 71% 85%
OPP LINEOUT SUCCESS 11% 25% 23% 26%
OWN SCRUM SUCCESS 88% 97% 76% 93%
OPP SCRUM SUCCESS 0% 27% 7% 3%
OWN SCRUM BALL OUT 72% 81% 89% 79%
OWN CONTESTABLE 50M RESTARTS 53% 47% 39% 16%
OWN CONTESTABLE 50M RESTART SUCCESS
38% 57% 25% 0%
DISCIPLINE
TOTAL PKS & FKS FOR / AGAINST 47 / 54 51 / 44 34 / 48 58 / 43
% PKS & FKS FOR / AGAINST 47% / 53% 54% / 46% 42% / 58% 57% / 43%
TOTAL CARDS 3 2 1 1

RUGBY WORLD CUP 2015 STATISTICAL REPORT WORLD RUGBYTM GAME ANALYSIS
82 RWC 2015 STATISTICAL REPORT – WORLD RUGBY GAME ANALYSIS 82 Filename/Filepath
SCOTLAND
RWC 2015
4 matches
RWC 2011
4 matches
RWC 2007
4 matches
RWC 2003
4 matches
SCORING
MATCHES WON / LOST / DRAW 3 / 1 2 / 2 3 / 1 3 / 1
SCORING MARGIN T1 V T1 -18 -1/-4 -40/+2 -42
SCORING MARGIN T1 V T2 +35/+23/+3 +10/+9 +46/+42 +21/+24/+2
SCORING MARGIN T2 V T2 - - - -
POINTS SCORED / CONCEDED 136 / 93 61 / 59 116 / 66 102 / 97
TRIES SCORED / CONCEDED 14 / 9 4 / 4 14 / 8 11 / 8
TRY SCORING RATE 1 every 293 secs 1122 secs 298 secs 421 secs
TRY CONCEDING RATE 1 every 459 secs 964 secs 519 secs 481 secs
GOAL KICKING SUCCESS 77% 64% 100% 72%
PEN GOALS SCORED / CONCEDED 14 / 11 13 / 10 6 / 6 11 / 13
DROP GOALS SCORED / CONCEDED 0 / 1 4 / 1 0 / 0 0 / 2
GENERAL PLAY
POSSESSION FOR/AGAINST 50% / 50% 54% / 46% 50% / 50% 55% / 45%
AVG. PASSES PER MATCH 114 147 116 152
AVG. RUCK/MAULS PER MATCH 84 88 74 86
AVG. KICKS PER MATCH 18 24 25 27
SET PIECE
OWN LINEOUT SUCCESS 89% 88% 87% 85%
OPP LINEOUT SUCCESS 18% 22% 27% 22%
OWN SCRUM SUCCESS 78% 84% 86% 92%
OPP SCRUM SUCCESS 6% 24% 2% 11%
OWN SCRUM BALL OUT 61% 72% 79% 79%
OWN CONTESTABLE 50M RESTARTS 25% 56% 39% 25%
OWN CONTESTABLE 50M RESTART SUCCESS
17% 50% 43% 33%
DISCIPLINE
TOTAL PKS & FKS FOR / AGAINST 53 / 41 49 / 43 39 / 42 45 / 50
% PKS & FKS FOR / AGAINST 56% / 44% 53% / 47% 48% / 52% 47% / 53%
TOTAL CARDS 2 0 1 1

RUGBY WORLD CUP 2015 STATISTICAL REPORT WORLD RUGBYTM GAME ANALYSIS
RWC 2015 STATISTICAL REPORT – WORLD RUGBYTM GAME ANALYSIS 83
SOUTH AFRICA
RWC 2015
4 matches
RWC 2011
4 matches
RWC 2007
4 matches
RWC 2003
4 matches
SCORING
MATCHES WON / LOST / DRAW 3 / 1 4 / 0 4 / 0 3 / 1
SCORING MARGIN T1 V T1 +18 +1 +36 -19
SCORING MARGIN T1 V T2 -2/+40/+64 +46/+87/+8 +52/+5/+49 +66/+27/+50
SCORING MARGIN T2 V T2 - - - -
POINTS SCORED / CONCEDED 176 / 56 166 / 24 189 / 47 181 / 60
TRIES SCORED / CONCEDED 23 / 4 21 / 2 24 / 6 27 / 3
TRY SCORING RATE 1 every 211 secs 224 secs 160 secs 158 secs
TRY CONCEDING RATE 1 every 953 secs 2423 secs 687 secs 1364 secs
GOAL KICKING SUCCESS 73% 82% 73% 59%
PEN GOALS SCORED / CONCEDED 10 / 10 7 / 4 11 / 3 4 / 11
DROP GOALS SCORED / CONCEDED 1 / 0 0 / 0 0 / 0 1 / 2
GENERAL PLAY
POSSESSION FOR/AGAINST 56% / 44% 49% / 51% 48% / 52% 51% / 49%
AVG. PASSES PER MATCH 168 159 125 140
AVG. RUCK/MAULS PER MATCH 109 84 58 68
AVG. KICKS PER MATCH 24 25 28 24
SET PIECE
OWN LINEOUT SUCCESS 94% 82% 85% 88%
OPP LINEOUT SUCCESS 19% 17% 34% 22%
OWN SCRUM SUCCESS 95% 100% 90% 100%
OPP SCRUM SUCCESS 13% 21% 7% 12%
OWN SCRUM BALL OUT 76% 71% 90% 87%
OWN CONTESTABLE 50M RESTARTS 59% 60% 23% 40%
OWN CONTESTABLE 50M RESTART SUCCESS
10% 33% 0% 25%
DISCIPLINE
TOTAL PKS & FKS FOR / AGAINST 44 / 50 43 / 34 43 / 35 48 / 50
% PKS & FKS FOR / AGAINST 47% / 53% 56% / 44% 55% / 45% 49% / 51%
TOTAL CARDS 2 1 2 1
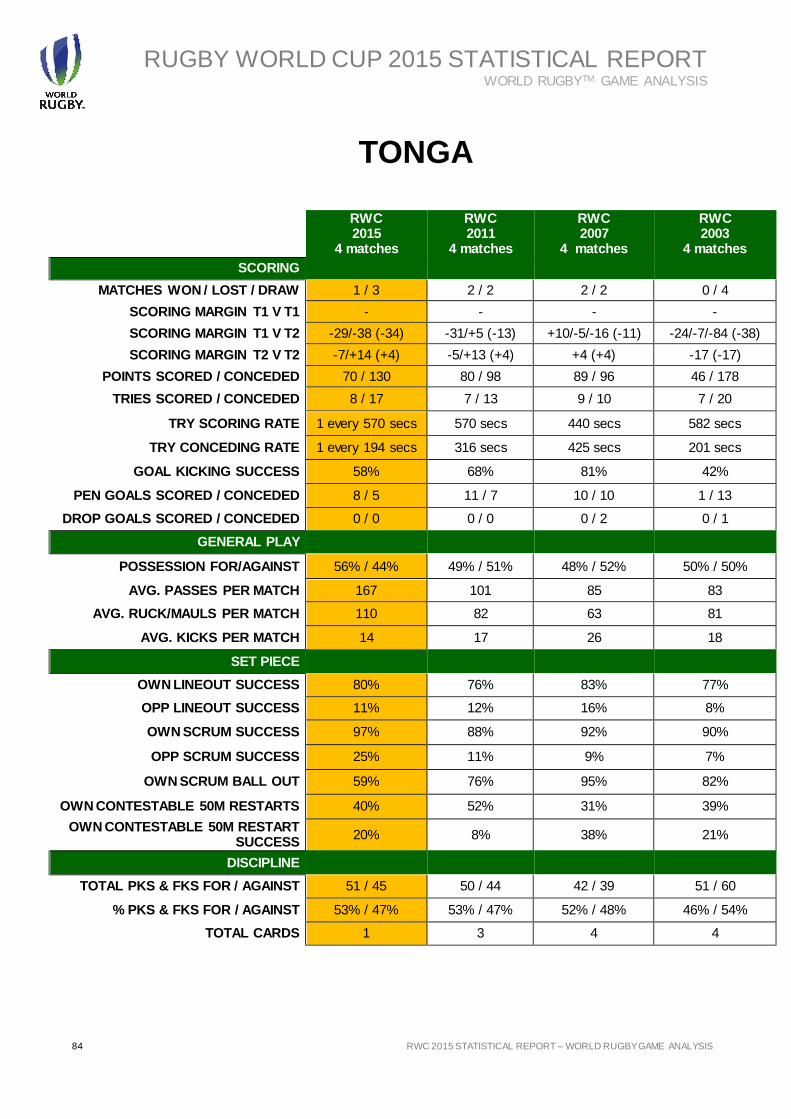
RUGBY WORLD CUP 2015 STATISTICAL REPORT WORLD RUGBYTM GAME ANALYSIS
84 RWC 2015 STATISTICAL REPORT – WORLD RUGBY GAME ANALYSIS 84 Filename/Filepath
TONGA
RWC 2015
4 matches
RWC 2011
4 matches
RWC 2007
4 matches
RWC 2003
4 matches
SCORING
MATCHES WON / LOST / DRAW 1 / 3 2 / 2 2 / 2 0 / 4
SCORING MARGIN T1 V T1 - - - -
SCORING MARGIN T1 V T2 -29/-38 (-34) -31/+5 (-13) +10/-5/-16 (-11) -24/-7/-84 (-38)
SCORING MARGIN T2 V T2 -7/+14 (+4) -5/+13 (+4) +4 (+4) -17 (-17)
POINTS SCORED / CONCEDED 70 / 130 80 / 98 89 / 96 46 / 178
TRIES SCORED / CONCEDED 8 / 17 7 / 13 9 / 10 7 / 20
TRY SCORING RATE 1 every 570 secs 570 secs 440 secs 582 secs
TRY CONCEDING RATE 1 every 194 secs 316 secs 425 secs 201 secs
GOAL KICKING SUCCESS 58% 68% 81% 42%
PEN GOALS SCORED / CONCEDED 8 / 5 11 / 7 10 / 10 1 / 13
DROP GOALS SCORED / CONCEDED 0 / 0 0 / 0 0 / 2 0 / 1
GENERAL PLAY
POSSESSION FOR/AGAINST 56% / 44% 49% / 51% 48% / 52% 50% / 50%
AVG. PASSES PER MATCH 167 101 85 83
AVG. RUCK/MAULS PER MATCH 110 82 63 81
AVG. KICKS PER MATCH 14 17 26 18
SET PIECE
OWN LINEOUT SUCCESS 80% 76% 83% 77%
OPP LINEOUT SUCCESS 11% 12% 16% 8%
OWN SCRUM SUCCESS 97% 88% 92% 90%
OPP SCRUM SUCCESS 25% 11% 9% 7%
OWN SCRUM BALL OUT 59% 76% 95% 82%
OWN CONTESTABLE 50M RESTARTS 40% 52% 31% 39%
OWN CONTESTABLE 50M RESTART SUCCESS
20% 8% 38% 21%
DISCIPLINE
TOTAL PKS & FKS FOR / AGAINST 51 / 45 50 / 44 42 / 39 51 / 60
% PKS & FKS FOR / AGAINST 53% / 47% 53% / 47% 52% / 48% 46% / 54%
TOTAL CARDS 1 3 4 4
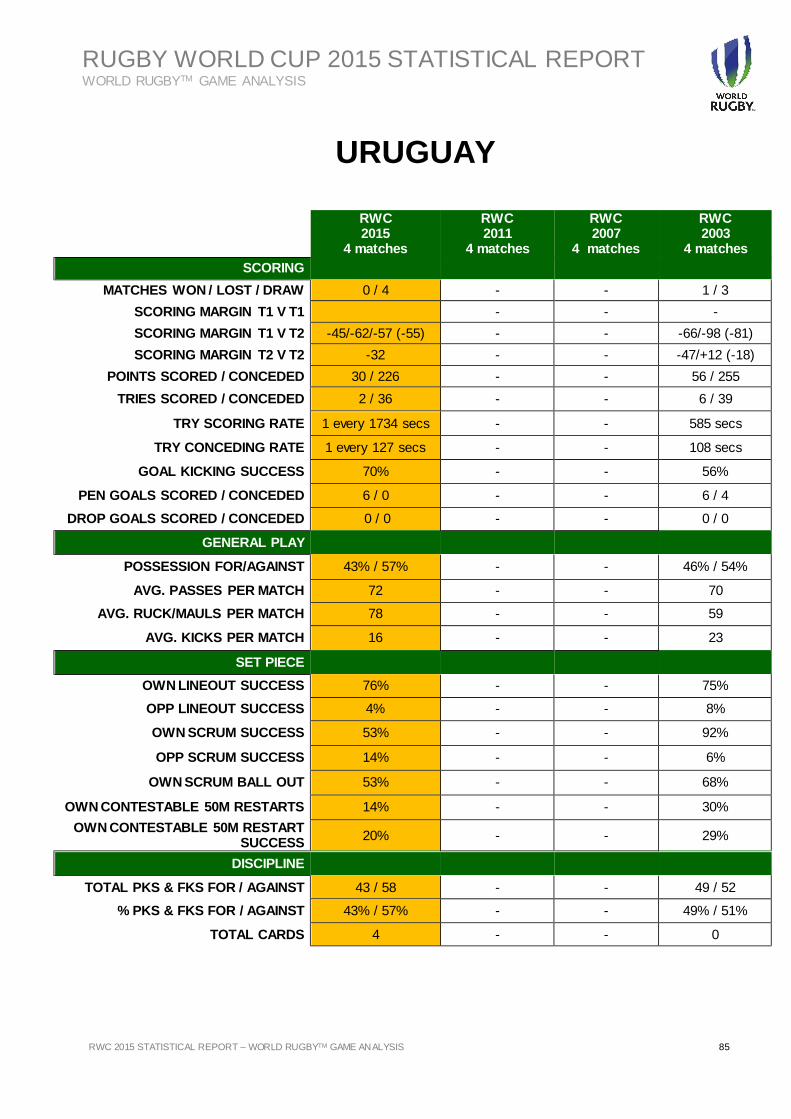
RUGBY WORLD CUP 2015 STATISTICAL REPORT WORLD RUGBYTM GAME ANALYSIS
RWC 2015 STATISTICAL REPORT – WORLD RUGBYTM GAME ANALYSIS 85
URUGUAY
RWC 2015
4 matches
RWC 2011
4 matches
RWC 2007
4 matches
RWC 2003
4 matches
SCORING
MATCHES WON / LOST / DRAW 0 / 4 - - 1 / 3
SCORING MARGIN T1 V T1 - - -
SCORING MARGIN T1 V T2 -45/-62/-57 (-55) - - -66/-98 (-81)
SCORING MARGIN T2 V T2 -32 - - -47/+12 (-18)
POINTS SCORED / CONCEDED 30 / 226 - - 56 / 255
TRIES SCORED / CONCEDED 2 / 36 - - 6 / 39
TRY SCORING RATE 1 every 1734 secs - - 585 secs
TRY CONCEDING RATE 1 every 127 secs - - 108 secs
GOAL KICKING SUCCESS 70% - - 56%
PEN GOALS SCORED / CONCEDED 6 / 0 - - 6 / 4
DROP GOALS SCORED / CONCEDED 0 / 0 - - 0 / 0
GENERAL PLAY
POSSESSION FOR/AGAINST 43% / 57% - - 46% / 54%
AVG. PASSES PER MATCH 72 - - 70
AVG. RUCK/MAULS PER MATCH 78 - - 59
AVG. KICKS PER MATCH 16 - - 23
SET PIECE
OWN LINEOUT SUCCESS 76% - - 75%
OPP LINEOUT SUCCESS 4% - - 8%
OWN SCRUM SUCCESS 53% - - 92%
OPP SCRUM SUCCESS 14% - - 6%
OWN SCRUM BALL OUT 53% - - 68%
OWN CONTESTABLE 50M RESTARTS 14% - - 30%
OWN CONTESTABLE 50M RESTART SUCCESS
20% - - 29%
DISCIPLINE
TOTAL PKS & FKS FOR / AGAINST 43 / 58 - - 49 / 52
% PKS & FKS FOR / AGAINST 43% / 57% - - 49% / 51%
TOTAL CARDS 4 - - 0
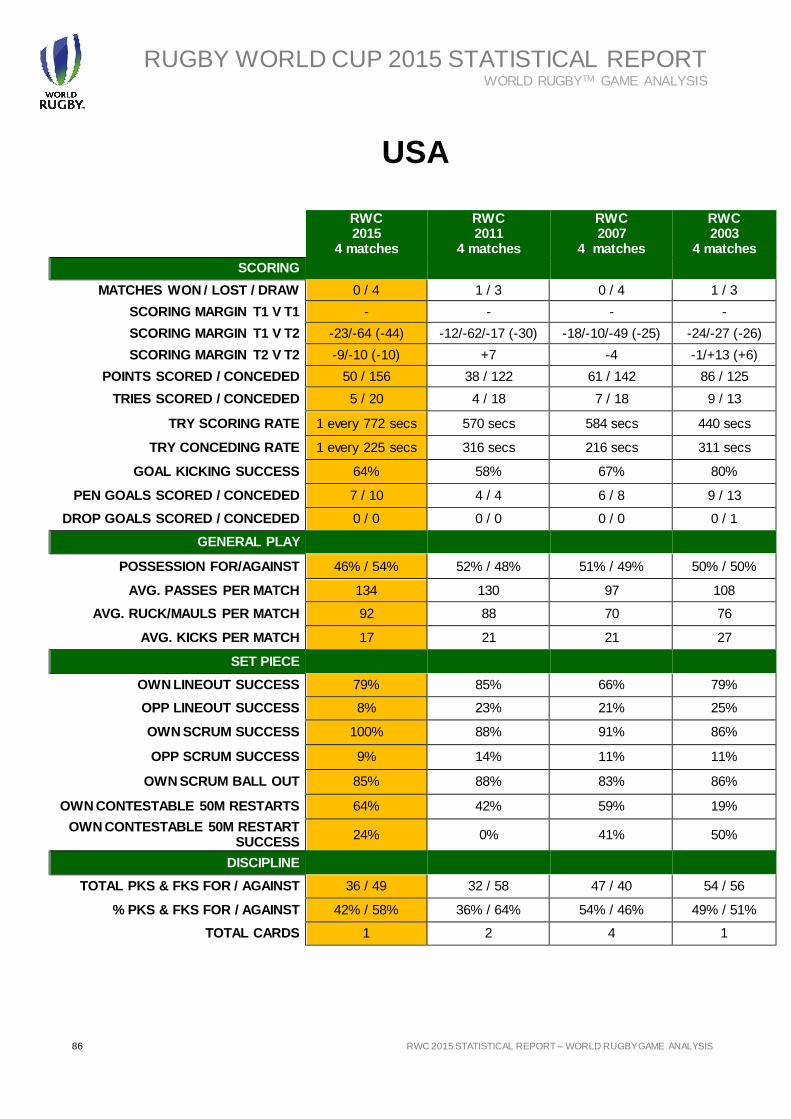
RUGBY WORLD CUP 2015 STATISTICAL REPORT WORLD RUGBYTM GAME ANALYSIS
86 RWC 2015 STATISTICAL REPORT – WORLD RUGBY GAME ANALYSIS 86 Filename/Filepath
USA
RWC 2015
4 matches
RWC 2011
4 matches
RWC 2007
4 matches
RWC 2003
4 matches
SCORING
MATCHES WON / LOST / DRAW 0 / 4 1 / 3 0 / 4 1 / 3
SCORING MARGIN T1 V T1 - - - -
SCORING MARGIN T1 V T2 -23/-64 (-44) -12/-62/-17 (-30) -18/-10/-49 (-25) -24/-27 (-26)
SCORING MARGIN T2 V T2 -9/-10 (-10) +7 -4 -1/+13 (+6)
POINTS SCORED / CONCEDED 50 / 156 38 / 122 61 / 142 86 / 125
TRIES SCORED / CONCEDED 5 / 20 4 / 18 7 / 18 9 / 13
TRY SCORING RATE 1 every 772 secs 570 secs 584 secs 440 secs
TRY CONCEDING RATE 1 every 225 secs 316 secs 216 secs 311 secs
GOAL KICKING SUCCESS 64% 58% 67% 80%
PEN GOALS SCORED / CONCEDED 7 / 10 4 / 4 6 / 8 9 / 13
DROP GOALS SCORED / CONCEDED 0 / 0 0 / 0 0 / 0 0 / 1
GENERAL PLAY
POSSESSION FOR/AGAINST 46% / 54% 52% / 48% 51% / 49% 50% / 50%
AVG. PASSES PER MATCH 134 130 97 108
AVG. RUCK/MAULS PER MATCH 92 88 70 76
AVG. KICKS PER MATCH 17 21 21 27
SET PIECE
OWN LINEOUT SUCCESS 79% 85% 66% 79%
OPP LINEOUT SUCCESS 8% 23% 21% 25%
OWN SCRUM SUCCESS 100% 88% 91% 86%
OPP SCRUM SUCCESS 9% 14% 11% 11%
OWN SCRUM BALL OUT 85% 88% 83% 86%
OWN CONTESTABLE 50M RESTARTS 64% 42% 59% 19%
OWN CONTESTABLE 50M RESTART SUCCESS
24% 0% 41% 50%
DISCIPLINE
TOTAL PKS & FKS FOR / AGAINST 36 / 49 32 / 58 47 / 40 54 / 56
% PKS & FKS FOR / AGAINST 42% / 58% 36% / 64% 54% / 46% 49% / 51%
TOTAL CARDS 1 2 4 1
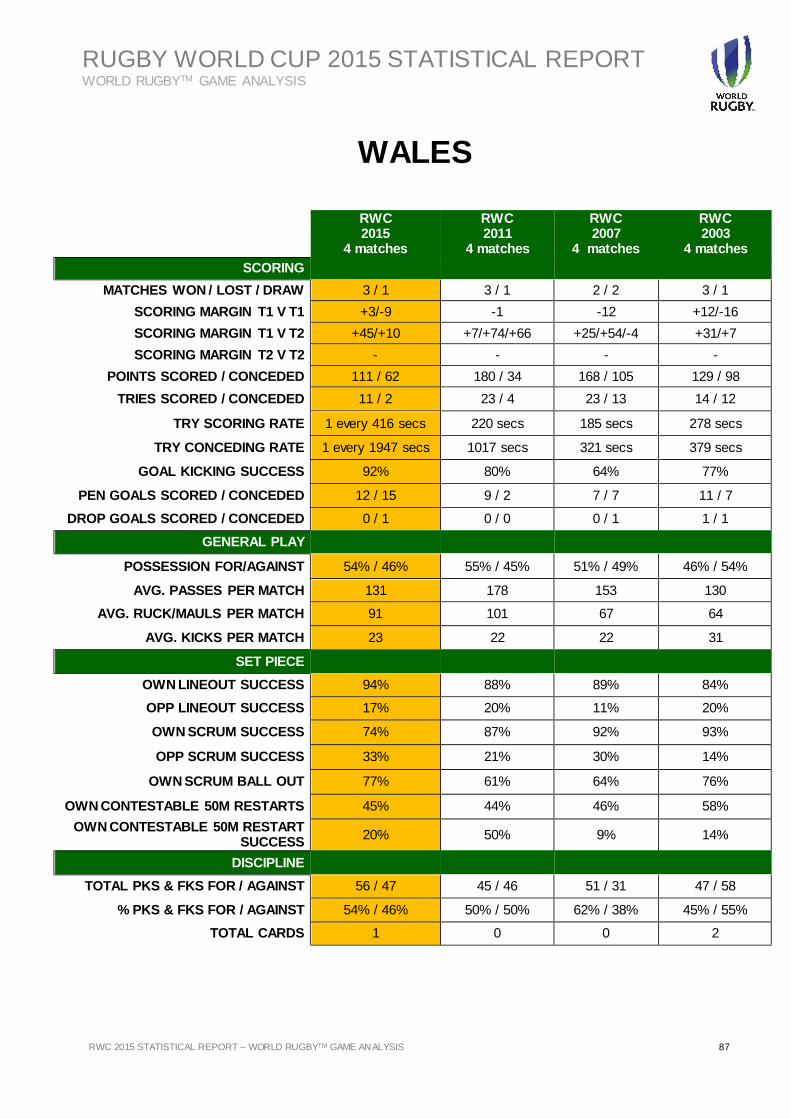
RUGBY WORLD CUP 2015 STATISTICAL REPORT WORLD RUGBYTM GAME ANALYSIS
RWC 2015 STATISTICAL REPORT – WORLD RUGBYTM GAME ANALYSIS 87
WALES
RWC 2015
4 matches
RWC 2011
4 matches
RWC 2007
4 matches
RWC 2003
4 matches
SCORING
MATCHES WON / LOST / DRAW 3 / 1 3 / 1 2 / 2 3 / 1
SCORING MARGIN T1 V T1 +3/-9 -1 -12 +12/-16
SCORING MARGIN T1 V T2 +45/+10 +7/+74/+66 +25/+54/-4 +31/+7
SCORING MARGIN T2 V T2 - - - -
POINTS SCORED / CONCEDED 111 / 62 180 / 34 168 / 105 129 / 98
TRIES SCORED / CONCEDED 11 / 2 23 / 4 23 / 13 14 / 12
TRY SCORING RATE 1 every 416 secs 220 secs 185 secs 278 secs
TRY CONCEDING RATE 1 every 1947 secs 1017 secs 321 secs 379 secs
GOAL KICKING SUCCESS 92% 80% 64% 77%
PEN GOALS SCORED / CONCEDED 12 / 15 9 / 2 7 / 7 11 / 7
DROP GOALS SCORED / CONCEDED 0 / 1 0 / 0 0 / 1 1 / 1
GENERAL PLAY
POSSESSION FOR/AGAINST 54% / 46% 55% / 45% 51% / 49% 46% / 54%
AVG. PASSES PER MATCH 131 178 153 130
AVG. RUCK/MAULS PER MATCH 91 101 67 64
AVG. KICKS PER MATCH 23 22 22 31
SET PIECE
OWN LINEOUT SUCCESS 94% 88% 89% 84%
OPP LINEOUT SUCCESS 17% 20% 11% 20%
OWN SCRUM SUCCESS 74% 87% 92% 93%
OPP SCRUM SUCCESS 33% 21% 30% 14%
OWN SCRUM BALL OUT 77% 61% 64% 76%
OWN CONTESTABLE 50M RESTARTS 45% 44% 46% 58%
OWN CONTESTABLE 50M RESTART SUCCESS
20% 50% 9% 14%
DISCIPLINE
TOTAL PKS & FKS FOR / AGAINST 56 / 47 45 / 46 51 / 31 47 / 58
% PKS & FKS FOR / AGAINST 54% / 46% 50% / 50% 62% / 38% 45% / 55%
TOTAL CARDS 1 0 0 2
RUGBY WORLD CUP 2015 STATISTICAL REPORT WORLD RUGBYTM GAME ANALYSIS
88 RWC 2015 STATISTICAL REPORT – WORLD RUGBY GAME ANALYSIS 88 Filename/Filepath
APPENDIX 2: KNOCKOUT TEAM SUMMARIES
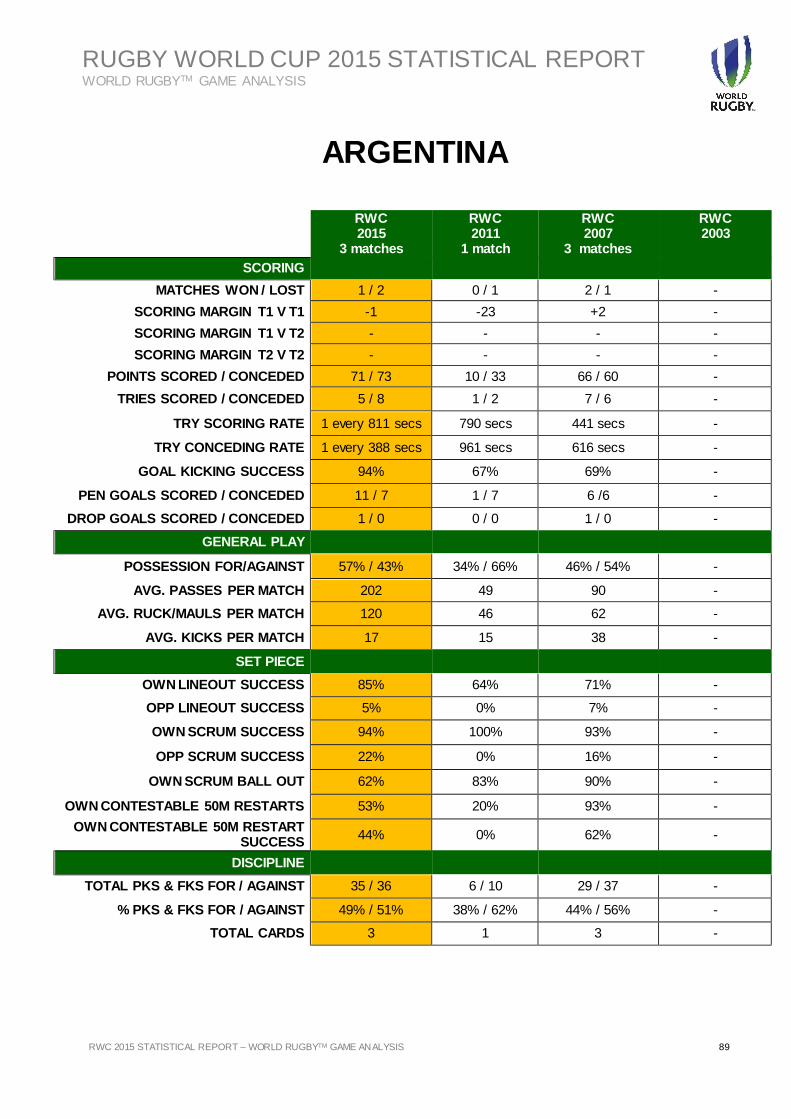
RUGBY WORLD CUP 2015 STATISTICAL REPORT WORLD RUGBYTM GAME ANALYSIS
RWC 2015 STATISTICAL REPORT – WORLD RUGBYTM GAME ANALYSIS 89
ARGENTINA
RWC 2015
3 matches
RWC 2011
1 match
RWC 2007
3 matches
RWC 2003
SCORING
MATCHES WON / LOST 1 / 2 0 / 1 2 / 1 -
SCORING MARGIN T1 V T1 -1 -23 +2 -
SCORING MARGIN T1 V T2 - - - -
SCORING MARGIN T2 V T2 - - - -
POINTS SCORED / CONCEDED 71 / 73 10 / 33 66 / 60 -
TRIES SCORED / CONCEDED 5 / 8 1 / 2 7 / 6 -
TRY SCORING RATE 1 every 811 secs 790 secs 441 secs -
TRY CONCEDING RATE 1 every 388 secs 961 secs 616 secs -
GOAL KICKING SUCCESS 94% 67% 69% -
PEN GOALS SCORED / CONCEDED 11 / 7 1 / 7 6 /6 -
DROP GOALS SCORED / CONCEDED 1 / 0 0 / 0 1 / 0 -
GENERAL PLAY
POSSESSION FOR/AGAINST 57% / 43% 34% / 66% 46% / 54% -
AVG. PASSES PER MATCH 202 49 90 -
AVG. RUCK/MAULS PER MATCH 120 46 62 -
AVG. KICKS PER MATCH 17 15 38 -
SET PIECE
OWN LINEOUT SUCCESS 85% 64% 71% -
OPP LINEOUT SUCCESS 5% 0% 7% -
OWN SCRUM SUCCESS 94% 100% 93% -
OPP SCRUM SUCCESS 22% 0% 16% -
OWN SCRUM BALL OUT 62% 83% 90% -
OWN CONTESTABLE 50M RESTARTS 53% 20% 93% -
OWN CONTESTABLE 50M RESTART SUCCESS
44% 0% 62% -
DISCIPLINE
TOTAL PKS & FKS FOR / AGAINST 35 / 36 6 / 10 29 / 37 -
% PKS & FKS FOR / AGAINST 49% / 51% 38% / 62% 44% / 56% -
TOTAL CARDS 3 1 3 -
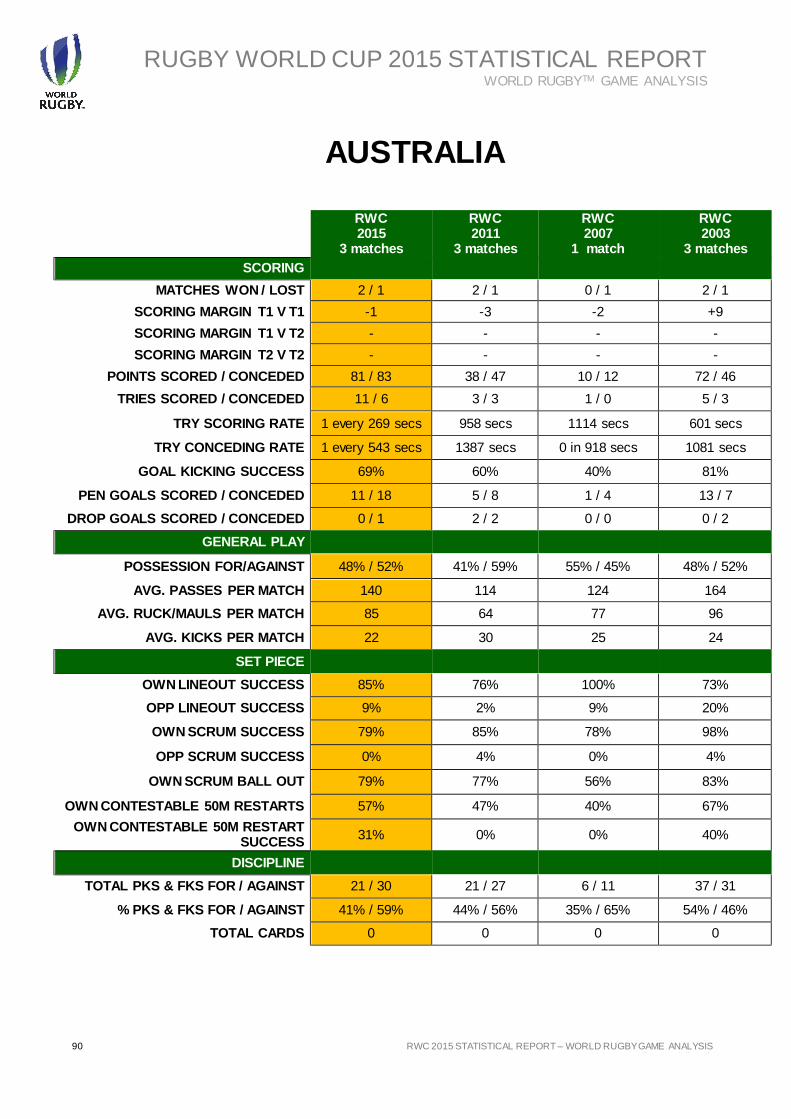
RUGBY WORLD CUP 2015 STATISTICAL REPORT WORLD RUGBYTM GAME ANALYSIS
90 RWC 2015 STATISTICAL REPORT – WORLD RUGBY GAME ANALYSIS 90 Filename/Filepath
AUSTRALIA
RWC 2015
3 matches
RWC 2011
3 matches
RWC 2007
1 match
RWC 2003
3 matches
SCORING
MATCHES WON / LOST 2 / 1 2 / 1 0 / 1 2 / 1
SCORING MARGIN T1 V T1 -1 -3 -2 +9
SCORING MARGIN T1 V T2 - - - -
SCORING MARGIN T2 V T2 - - - -
POINTS SCORED / CONCEDED 81 / 83 38 / 47 10 / 12 72 / 46
TRIES SCORED / CONCEDED 11 / 6 3 / 3 1 / 0 5 / 3
TRY SCORING RATE 1 every 269 secs 958 secs 1114 secs 601 secs
TRY CONCEDING RATE 1 every 543 secs 1387 secs 0 in 918 secs 1081 secs
GOAL KICKING SUCCESS 69% 60% 40% 81%
PEN GOALS SCORED / CONCEDED 11 / 18 5 / 8 1 / 4 13 / 7
DROP GOALS SCORED / CONCEDED 0 / 1 2 / 2 0 / 0 0 / 2
GENERAL PLAY
POSSESSION FOR/AGAINST 48% / 52% 41% / 59% 55% / 45% 48% / 52%
AVG. PASSES PER MATCH 140 114 124 164
AVG. RUCK/MAULS PER MATCH 85 64 77 96
AVG. KICKS PER MATCH 22 30 25 24
SET PIECE
OWN LINEOUT SUCCESS 85% 76% 100% 73%
OPP LINEOUT SUCCESS 9% 2% 9% 20%
OWN SCRUM SUCCESS 79% 85% 78% 98%
OPP SCRUM SUCCESS 0% 4% 0% 4%
OWN SCRUM BALL OUT 79% 77% 56% 83%
OWN CONTESTABLE 50M RESTARTS 57% 47% 40% 67%
OWN CONTESTABLE 50M RESTART SUCCESS
31% 0% 0% 40%
DISCIPLINE
TOTAL PKS & FKS FOR / AGAINST 21 / 30 21 / 27 6 / 11 37 / 31
% PKS & FKS FOR / AGAINST 41% / 59% 44% / 56% 35% / 65% 54% / 46%
TOTAL CARDS 0 0 0 0
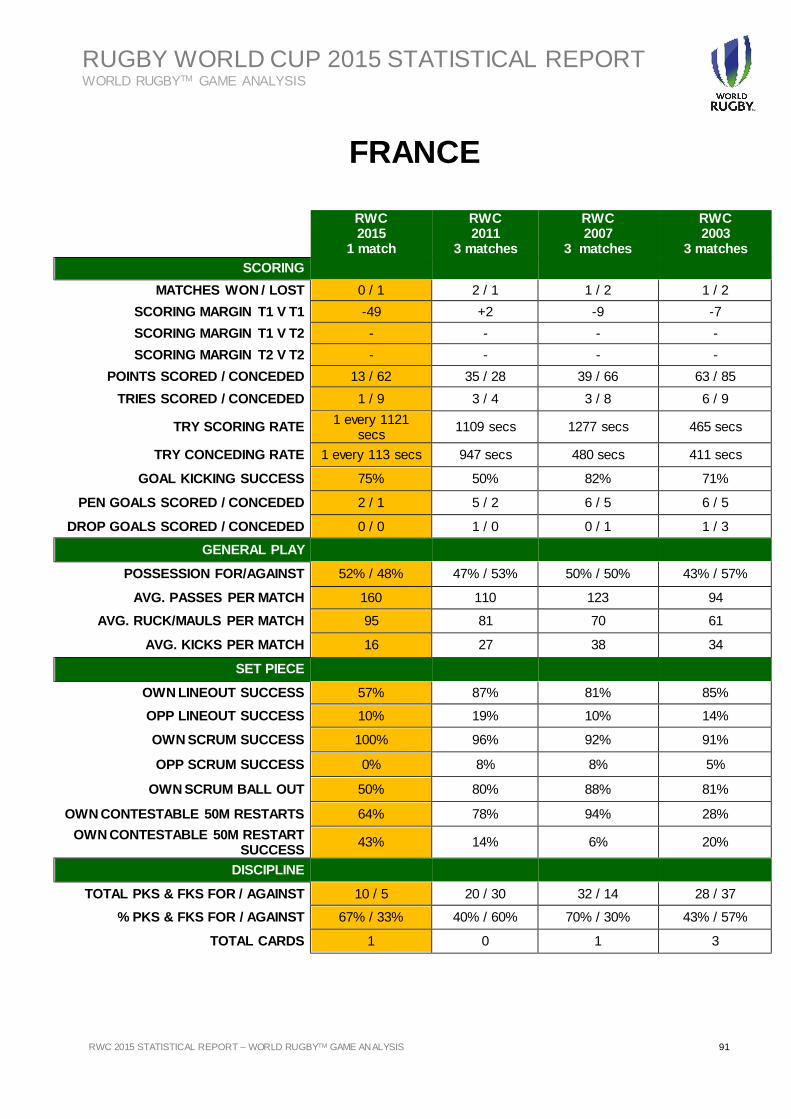
RUGBY WORLD CUP 2015 STATISTICAL REPORT WORLD RUGBYTM GAME ANALYSIS
RWC 2015 STATISTICAL REPORT – WORLD RUGBYTM GAME ANALYSIS 91
FRANCE
RWC 2015
1 match
RWC 2011
3 matches
RWC 2007
3 matches
RWC 2003
3 matches
SCORING
MATCHES WON / LOST 0 / 1 2 / 1 1 / 2 1 / 2
SCORING MARGIN T1 V T1 -49 +2 -9 -7
SCORING MARGIN T1 V T2 - - - -
SCORING MARGIN T2 V T2 - - - -
POINTS SCORED / CONCEDED 13 / 62 35 / 28 39 / 66 63 / 85
TRIES SCORED / CONCEDED 1 / 9 3 / 4 3 / 8 6 / 9
TRY SCORING RATE 1 every 1121
secs 1109 secs 1277 secs 465 secs
TRY CONCEDING RATE 1 every 113 secs 947 secs 480 secs 411 secs
GOAL KICKING SUCCESS 75% 50% 82% 71%
PEN GOALS SCORED / CONCEDED 2 / 1 5 / 2 6 / 5 6 / 5
DROP GOALS SCORED / CONCEDED 0 / 0 1 / 0 0 / 1 1 / 3
GENERAL PLAY
POSSESSION FOR/AGAINST 52% / 48% 47% / 53% 50% / 50% 43% / 57%
AVG. PASSES PER MATCH 160 110 123 94
AVG. RUCK/MAULS PER MATCH 95 81 70 61
AVG. KICKS PER MATCH 16 27 38 34
SET PIECE
OWN LINEOUT SUCCESS 57% 87% 81% 85%
OPP LINEOUT SUCCESS 10% 19% 10% 14%
OWN SCRUM SUCCESS 100% 96% 92% 91%
OPP SCRUM SUCCESS 0% 8% 8% 5%
OWN SCRUM BALL OUT 50% 80% 88% 81%
OWN CONTESTABLE 50M RESTARTS 64% 78% 94% 28%
OWN CONTESTABLE 50M RESTART SUCCESS
43% 14% 6% 20%
DISCIPLINE
TOTAL PKS & FKS FOR / AGAINST 10 / 5 20 / 30 32 / 14 28 / 37
% PKS & FKS FOR / AGAINST 67% / 33% 40% / 60% 70% / 30% 43% / 57%
TOTAL CARDS 1 0 1 3
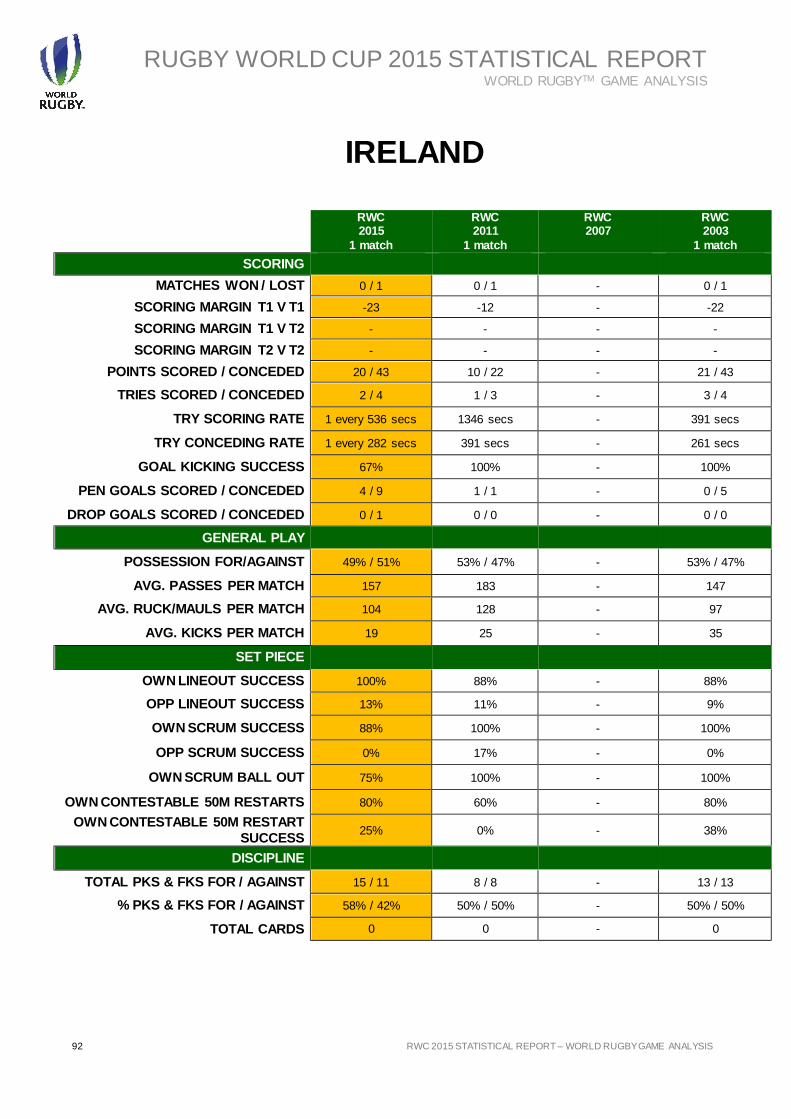
RUGBY WORLD CUP 2015 STATISTICAL REPORT WORLD RUGBYTM GAME ANALYSIS
92 RWC 2015 STATISTICAL REPORT – WORLD RUGBY GAME ANALYSIS 92 Filename/Filepath
IRELAND
RWC 2015
1 match
RWC 2011
1 match
RWC 2007
RWC 2003
1 match
SCORING
MATCHES WON / LOST 0 / 1 0 / 1 - 0 / 1
SCORING MARGIN T1 V T1 -23 -12 - -22
SCORING MARGIN T1 V T2 - - - -
SCORING MARGIN T2 V T2 - - - -
POINTS SCORED / CONCEDED 20 / 43 10 / 22 - 21 / 43
TRIES SCORED / CONCEDED 2 / 4 1 / 3 - 3 / 4
TRY SCORING RATE 1 every 536 secs 1346 secs - 391 secs
TRY CONCEDING RATE 1 every 282 secs 391 secs - 261 secs
GOAL KICKING SUCCESS 67% 100% - 100%
PEN GOALS SCORED / CONCEDED 4 / 9 1 / 1 - 0 / 5
DROP GOALS SCORED / CONCEDED 0 / 1 0 / 0 - 0 / 0
GENERAL PLAY
POSSESSION FOR/AGAINST 49% / 51% 53% / 47% - 53% / 47%
AVG. PASSES PER MATCH 157 183 - 147
AVG. RUCK/MAULS PER MATCH 104 128 - 97
AVG. KICKS PER MATCH 19 25 - 35
SET PIECE
OWN LINEOUT SUCCESS 100% 88% - 88%
OPP LINEOUT SUCCESS 13% 11% - 9%
OWN SCRUM SUCCESS 88% 100% - 100%
OPP SCRUM SUCCESS 0% 17% - 0%
OWN SCRUM BALL OUT 75% 100% - 100%
OWN CONTESTABLE 50M RESTARTS 80% 60% - 80%
OWN CONTESTABLE 50M RESTART
SUCCESS 25% 0% - 38%
DISCIPLINE
TOTAL PKS & FKS FOR / AGAINST 15 / 11 8 / 8 - 13 / 13
% PKS & FKS FOR / AGAINST 58% / 42% 50% / 50% - 50% / 50%
TOTAL CARDS 0 0 - 0
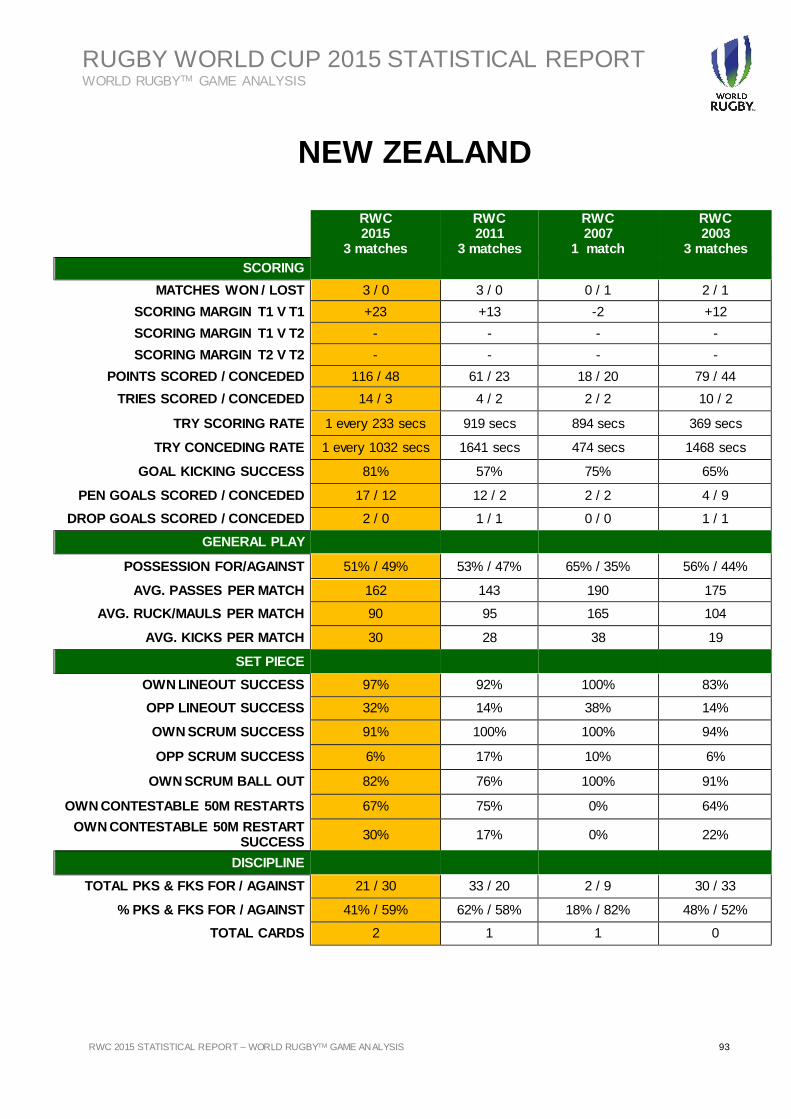
RUGBY WORLD CUP 2015 STATISTICAL REPORT WORLD RUGBYTM GAME ANALYSIS
RWC 2015 STATISTICAL REPORT – WORLD RUGBYTM GAME ANALYSIS 93
NEW ZEALAND
RWC 2015
3 matches
RWC 2011
3 matches
RWC 2007
1 match
RWC 2003
3 matches
SCORING
MATCHES WON / LOST 3 / 0 3 / 0 0 / 1 2 / 1
SCORING MARGIN T1 V T1 +23 +13 -2 +12
SCORING MARGIN T1 V T2 - - - -
SCORING MARGIN T2 V T2 - - - -
POINTS SCORED / CONCEDED 116 / 48 61 / 23 18 / 20 79 / 44
TRIES SCORED / CONCEDED 14 / 3 4 / 2 2 / 2 10 / 2
TRY SCORING RATE 1 every 233 secs 919 secs 894 secs 369 secs
TRY CONCEDING RATE 1 every 1032 secs 1641 secs 474 secs 1468 secs
GOAL KICKING SUCCESS 81% 57% 75% 65%
PEN GOALS SCORED / CONCEDED 17 / 12 12 / 2 2 / 2 4 / 9
DROP GOALS SCORED / CONCEDED 2 / 0 1 / 1 0 / 0 1 / 1
GENERAL PLAY
POSSESSION FOR/AGAINST 51% / 49% 53% / 47% 65% / 35% 56% / 44%
AVG. PASSES PER MATCH 162 143 190 175
AVG. RUCK/MAULS PER MATCH 90 95 165 104
AVG. KICKS PER MATCH 30 28 38 19
SET PIECE
OWN LINEOUT SUCCESS 97% 92% 100% 83%
OPP LINEOUT SUCCESS 32% 14% 38% 14%
OWN SCRUM SUCCESS 91% 100% 100% 94%
OPP SCRUM SUCCESS 6% 17% 10% 6%
OWN SCRUM BALL OUT 82% 76% 100% 91%
OWN CONTESTABLE 50M RESTARTS 67% 75% 0% 64%
OWN CONTESTABLE 50M RESTART SUCCESS
30% 17% 0% 22%
DISCIPLINE
TOTAL PKS & FKS FOR / AGAINST 21 / 30 33 / 20 2 / 9 30 / 33
% PKS & FKS FOR / AGAINST 41% / 59% 62% / 58% 18% / 82% 48% / 52%
TOTAL CARDS 2 1 1 0
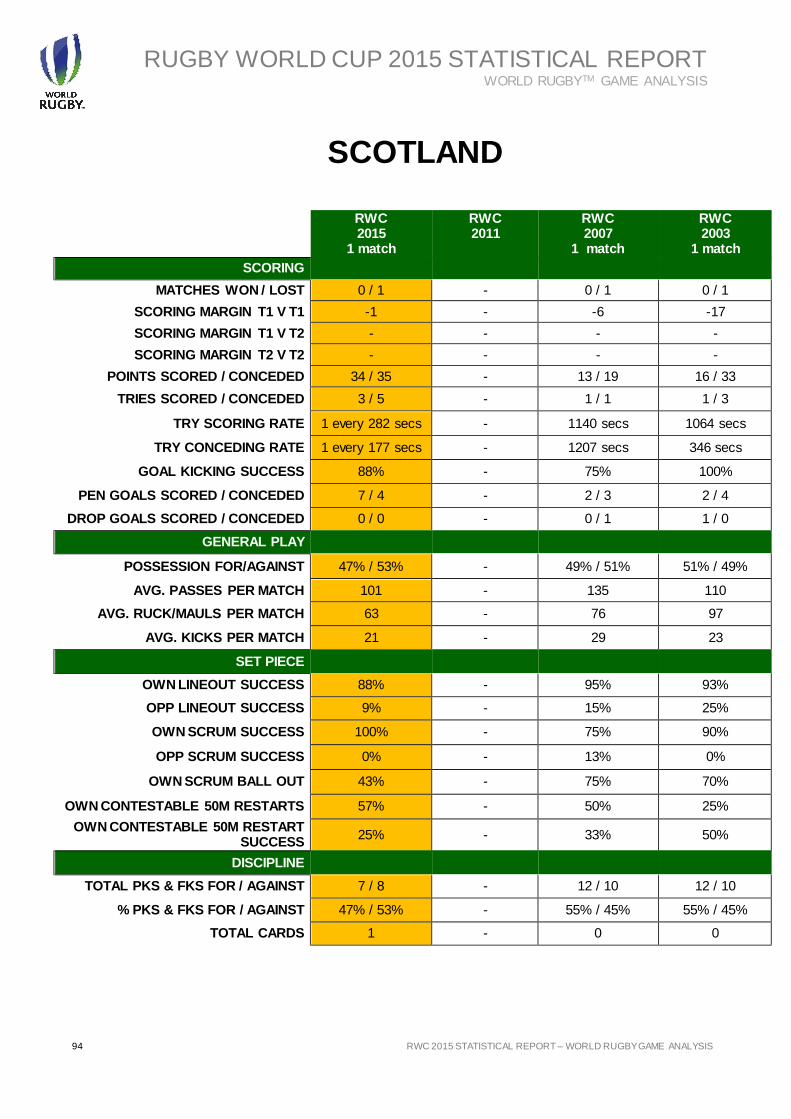
RUGBY WORLD CUP 2015 STATISTICAL REPORT WORLD RUGBYTM GAME ANALYSIS
94 RWC 2015 STATISTICAL REPORT – WORLD RUGBY GAME ANALYSIS 94 Filename/Filepath
SCOTLAND
RWC 2015
1 match
RWC 2011
RWC 2007
1 match
RWC 2003
1 match
SCORING
MATCHES WON / LOST 0 / 1 - 0 / 1 0 / 1
SCORING MARGIN T1 V T1 -1 - -6 -17
SCORING MARGIN T1 V T2 - - - -
SCORING MARGIN T2 V T2 - - - -
POINTS SCORED / CONCEDED 34 / 35 - 13 / 19 16 / 33
TRIES SCORED / CONCEDED 3 / 5 - 1 / 1 1 / 3
TRY SCORING RATE 1 every 282 secs - 1140 secs 1064 secs
TRY CONCEDING RATE 1 every 177 secs - 1207 secs 346 secs
GOAL KICKING SUCCESS 88% - 75% 100%
PEN GOALS SCORED / CONCEDED 7 / 4 - 2 / 3 2 / 4
DROP GOALS SCORED / CONCEDED 0 / 0 - 0 / 1 1 / 0
GENERAL PLAY
POSSESSION FOR/AGAINST 47% / 53% - 49% / 51% 51% / 49%
AVG. PASSES PER MATCH 101 - 135 110
AVG. RUCK/MAULS PER MATCH 63 - 76 97
AVG. KICKS PER MATCH 21 - 29 23
SET PIECE
OWN LINEOUT SUCCESS 88% - 95% 93%
OPP LINEOUT SUCCESS 9% - 15% 25%
OWN SCRUM SUCCESS 100% - 75% 90%
OPP SCRUM SUCCESS 0% - 13% 0%
OWN SCRUM BALL OUT 43% - 75% 70%
OWN CONTESTABLE 50M RESTARTS 57% - 50% 25%
OWN CONTESTABLE 50M RESTART SUCCESS
25% - 33% 50%
DISCIPLINE
TOTAL PKS & FKS FOR / AGAINST 7 / 8 - 12 / 10 12 / 10
% PKS & FKS FOR / AGAINST 47% / 53% - 55% / 45% 55% / 45%
TOTAL CARDS 1 - 0 0
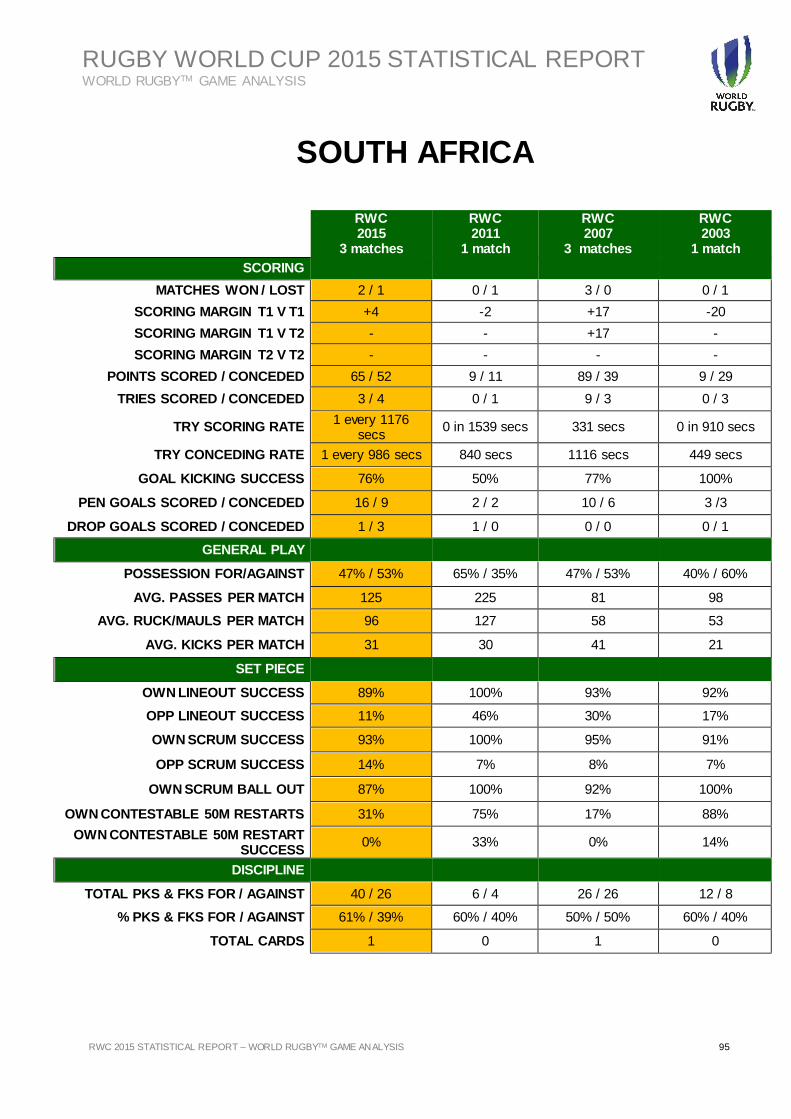
RUGBY WORLD CUP 2015 STATISTICAL REPORT WORLD RUGBYTM GAME ANALYSIS
RWC 2015 STATISTICAL REPORT – WORLD RUGBYTM GAME ANALYSIS 95
SOUTH AFRICA
RWC 2015
3 matches
RWC 2011
1 match
RWC 2007
3 matches
RWC 2003
1 match
SCORING
MATCHES WON / LOST 2 / 1 0 / 1 3 / 0 0 / 1
SCORING MARGIN T1 V T1 +4 -2 +17 -20
SCORING MARGIN T1 V T2 - - +17 -
SCORING MARGIN T2 V T2 - - - -
POINTS SCORED / CONCEDED 65 / 52 9 / 11 89 / 39 9 / 29
TRIES SCORED / CONCEDED 3 / 4 0 / 1 9 / 3 0 / 3
TRY SCORING RATE 1 every 1176
secs 0 in 1539 secs 331 secs 0 in 910 secs
TRY CONCEDING RATE 1 every 986 secs 840 secs 1116 secs 449 secs
GOAL KICKING SUCCESS 76% 50% 77% 100%
PEN GOALS SCORED / CONCEDED 16 / 9 2 / 2 10 / 6 3 /3
DROP GOALS SCORED / CONCEDED 1 / 3 1 / 0 0 / 0 0 / 1
GENERAL PLAY
POSSESSION FOR/AGAINST 47% / 53% 65% / 35% 47% / 53% 40% / 60%
AVG. PASSES PER MATCH 125 225 81 98
AVG. RUCK/MAULS PER MATCH 96 127 58 53
AVG. KICKS PER MATCH 31 30 41 21
SET PIECE
OWN LINEOUT SUCCESS 89% 100% 93% 92%
OPP LINEOUT SUCCESS 11% 46% 30% 17%
OWN SCRUM SUCCESS 93% 100% 95% 91%
OPP SCRUM SUCCESS 14% 7% 8% 7%
OWN SCRUM BALL OUT 87% 100% 92% 100%
OWN CONTESTABLE 50M RESTARTS 31% 75% 17% 88%
OWN CONTESTABLE 50M RESTART SUCCESS
0% 33% 0% 14%
DISCIPLINE
TOTAL PKS & FKS FOR / AGAINST 40 / 26 6 / 4 26 / 26 12 / 8
% PKS & FKS FOR / AGAINST 61% / 39% 60% / 40% 50% / 50% 60% / 40%
TOTAL CARDS 1 0 1 0
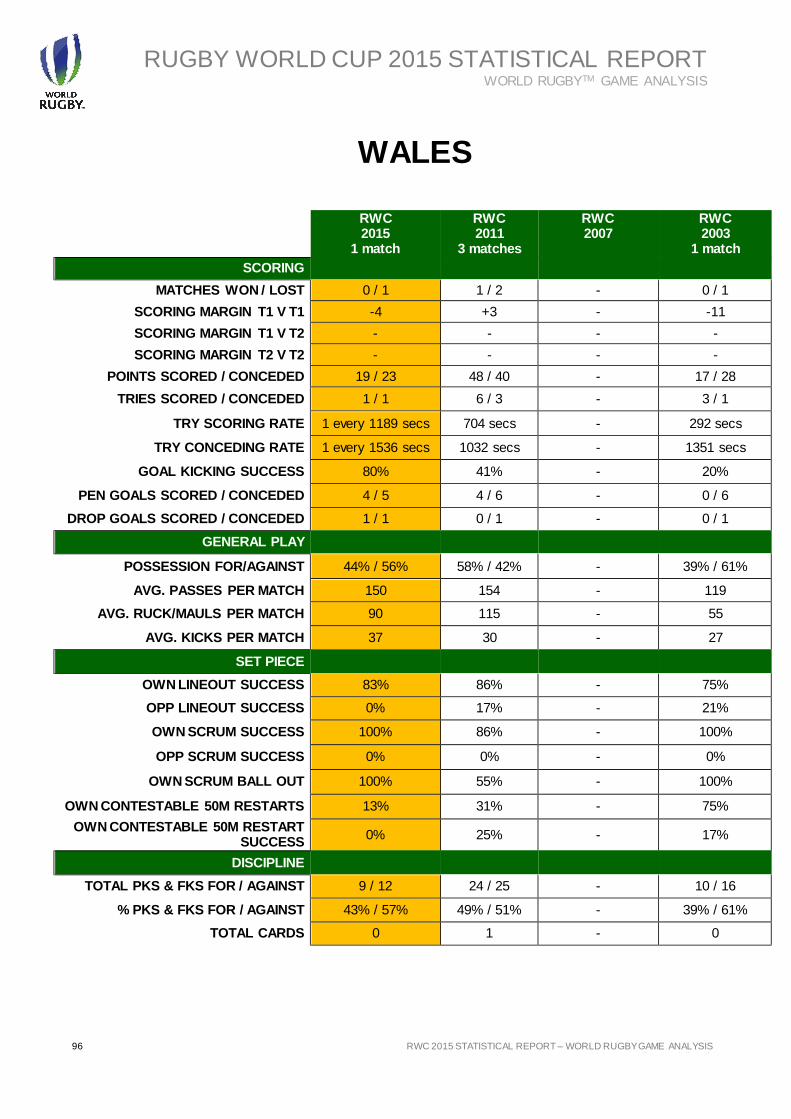
RUGBY WORLD CUP 2015 STATISTICAL REPORT WORLD RUGBYTM GAME ANALYSIS
96 RWC 2015 STATISTICAL REPORT – WORLD RUGBY GAME ANALYSIS 96 Filename/Filepath
WALES
RWC 2015
1 match
RWC 2011
3 matches
RWC 2007
RWC 2003
1 match
SCORING
MATCHES WON / LOST 0 / 1 1 / 2 - 0 / 1
SCORING MARGIN T1 V T1 -4 +3 - -11
SCORING MARGIN T1 V T2 - - - -
SCORING MARGIN T2 V T2 - - - -
POINTS SCORED / CONCEDED 19 / 23 48 / 40 - 17 / 28
TRIES SCORED / CONCEDED 1 / 1 6 / 3 - 3 / 1
TRY SCORING RATE 1 every 1189 secs 704 secs - 292 secs
TRY CONCEDING RATE 1 every 1536 secs 1032 secs - 1351 secs
GOAL KICKING SUCCESS 80% 41% - 20%
PEN GOALS SCORED / CONCEDED 4 / 5 4 / 6 - 0 / 6
DROP GOALS SCORED / CONCEDED 1 / 1 0 / 1 - 0 / 1
GENERAL PLAY
POSSESSION FOR/AGAINST 44% / 56% 58% / 42% - 39% / 61%
AVG. PASSES PER MATCH 150 154 - 119
AVG. RUCK/MAULS PER MATCH 90 115 - 55
AVG. KICKS PER MATCH 37 30 - 27
SET PIECE
OWN LINEOUT SUCCESS 83% 86% - 75%
OPP LINEOUT SUCCESS 0% 17% - 21%
OWN SCRUM SUCCESS 100% 86% - 100%
OPP SCRUM SUCCESS 0% 0% - 0%
OWN SCRUM BALL OUT 100% 55% - 100%
OWN CONTESTABLE 50M RESTARTS 13% 31% - 75%
OWN CONTESTABLE 50M RESTART SUCCESS
0% 25% - 17%
DISCIPLINE
TOTAL PKS & FKS FOR / AGAINST 9 / 12 24 / 25 - 10 / 16
% PKS & FKS FOR / AGAINST 43% / 57% 49% / 51% - 39% / 61%
TOTAL CARDS 0 1 - 0