Embed Size (px)
Citation preview
Title: SNP Genotyping by Unlabeled Probe Melting Analysis
Running Title: Unlabeled Probes
Maria Erali
Institute for Clinical and Experimental Pathology, ARUP Laboratories, Salt Lake City,
UT
Robert Palais
Department of Mathematics, University of Utah, Salt Lake City, UT
Carl Wittwer
Department of Pathology, University of Utah School of Medicine, Salt
Lake City, UT
Corresponding author :
Carl Wittwer
Department of Pathology, UUMC, 5B418
50 N. Medical Dr., Salt Lake City, UT 84105
Phone: 801-581-4737
Fax: 801-581-4517
e-mail: [email protected]
- 1 -
i. Summary
Fluorescent nucleic acid detection in PCR generally uses oligonucleotide probes labeled
with dyes. However, unlabeled oligonucleotides in the presence of saturating DNA dyes
can also serve as hybridization probes. The DNA dye, LCGreen Plus, and a 3’-blocked
unlabeled probe are added before amplification, and asymmetric PCR is performed at a
1:5 to 1:10 primer ratio. After PCR is complete, fluorescent melting curves reveal both
probe melting at low temperature and amplicon melting at high temperature. After
background removal, the melting temperature(s) of the probe/target duplex specific to the
allele(s) amplified are revealed. Probes between 20 and 40 bp with Tms between 50 and
85 °C are effective. The method requires only three standard oligonucleotides and
endpoint fluorescence melting. No real-time PCR or allele-specific amplification is
required. Unlabeled probes are inexpensive, provide the sequence specificity of probes,
and allow simultaneous identification of multiple alleles by melting analysis.
ii. Key words: unlabeled probes, genotyping, LCGreen Plus, asymmetric PCR, melting
analysis
1. Introduction
Dye methods remain very popular in real-time PCR, even without the specificity
of an internal probe. The reason is simple. Fluorescent probes with covalently attached
labels are expensive irrespective of the specific design. In addition to the expense, they
require more time to obtain from commercial suppliers, quality control is problematic,
- 2 -
and a new probe is needed for each target of interest. In contrast, a DNA dye can be used
for any target. Furthermore, product melting analysis can identify the amplified product
with an accuracy that depends on the resolution of the melting instrument (Herrmann et
al. 2006). Even so, probes remain preferred by many, especially in clinical diagnostic
applications. A method with the specificity of a probe and the cost and simplicity of a
closed-tube dye analysis would be desirable.
The dye, SYBR® Green I, was first used in real-time PCR in 1997 (Ririe et al.
1997, Wittwer et al. 1997). SYBR Green I is commonly used to detect duplex PCR
products. In addition, SYBR Green I can successfully detect probe/product melting if
single stranded product is isolated and immobilized (Jobs et al. 2003, Prince et al. 2001).
Although processing is required, genotyping by melting is possible without labeled
probes. However, SYBR Green I melting analysis is limited in closed-tube systems when
multiple duplexes are present in solution. Higher Tm products are preferentially detected
and heteroduplexes are not observed at dye concentrations compatible with PCR
(Wittwer et al. 2003). Indeed, genotyping in solution with unlabeled probes after
asymmetric PCR was not successful when SYBR Green I was used (Zhou et al. 2004a).
At PCR compatible concentrations, SYBR Green I does not saturate all DNA duplexes
present and the dye appears to redistribute to higher Tm duplexes during melting.
The LCGreen® family of dyes detects all duplexes present in solution because
saturating concentrations can be used that do not inhibit PCR (Wittwer et al. 2004).
Unlabeled probes are included in PCR that are not extended by polymerase because they
are 3’-blocked. After asymmetric PCR, the probes anneal to single-stranded product.
Melting curves show regions of both probe/product and product/product melting (Zhou et
- 3 -
al. 2005). Different alleles result in different probe/product melting transitions based on
the stability of the mismatches present (Zhou et al. 2004a). It is easiest to see the
transitions by plotting the negative derivative (-dF/dT) of fluorescence (F) vs temperature
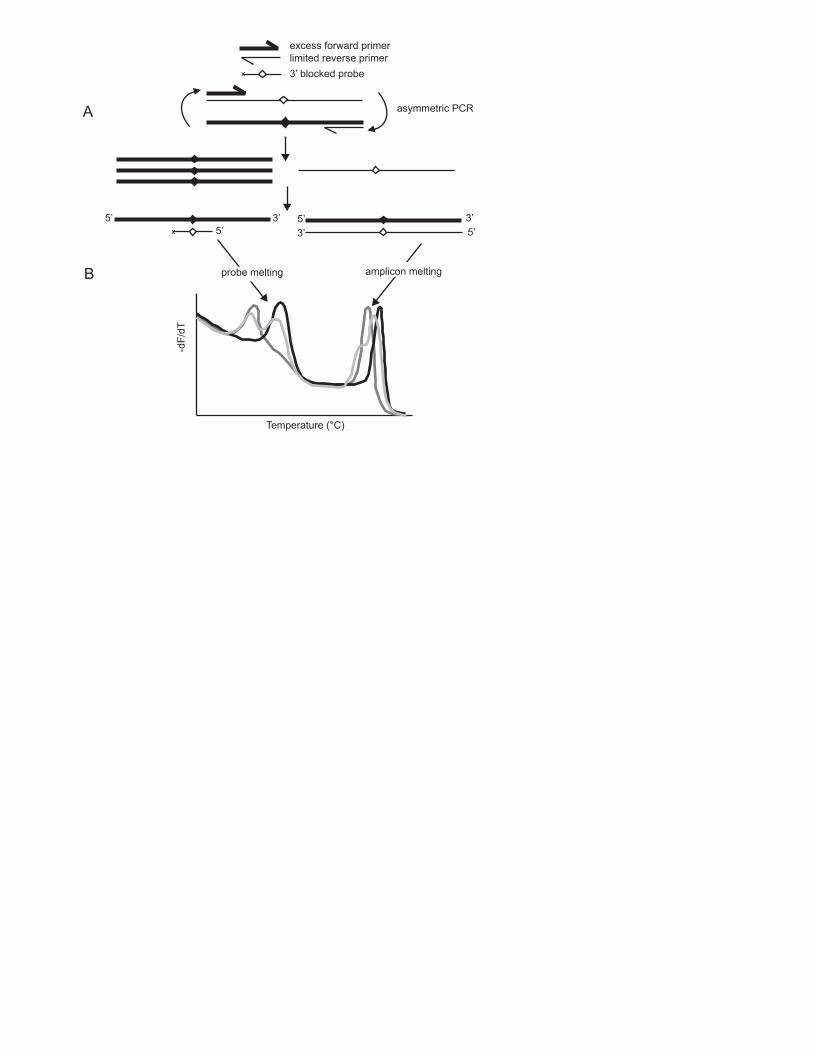
(T). Figure 1 diagrams the method. Often, background fluorescence is high, resulting in
an elevated background, especially at low temperatures.
Background fluorescence can be optimally subtracted by fitting a decreasing
exponential to the slope of the curve in regions where no melting occurs. Although
exponentials are usually fit to values rather than slopes, both approaches require two
equations with two unknowns. Since the contribution of background to total fluorescence
is not known, fluorescence values cannot be used. However, in regions where no melting
occurs, the slope of the curve is entirely attributable to background because the slope
contribution from melting is zero. This exponential approach is superior to linear
baseline normalization (Wittwer and Kusukawa 2004) in removing background
fluorescence from unlabeled probe and combined unlabeled probe/amplicon melting
curves that cannot be normalized using baselines. It also provides better background
removal when multiple small amplicons are analyzed ((Liew et al. 2006, Liew et al.
2004).
The following procedure is for unlabeled probe genotyping of the common
clinical target, factor V Leiden, a risk factor for coagulation. Any SNP or small
deletion/insertion can be genotyped by similar means.
2. Materials
- 4 -
2.1 DNA Isolation (see Note 1)
1. Sample: EDTA/ACD/sodium citrate/sodium heparin anti-coagulated human blood
2. QIAamp DNA Blood Mini Kit (Qiagen).
3. Ethanol (96 – 100%)
2.2 Polymerase Chain Reaction
1. 10X thermostable DNA Polymerase (see Note 2), 0.4 U/µl, diluted from
concentrated stock in Taq dilution buffer (2.5 mg/ml BSA, 10 mM Tris, pH 8.3,
Idaho Technology). For example, Taq (Roche Applied Science) or KlenTaq1
(AB Peptides).
2. 10X PCR buffer, 500 mM Tris, pH 8.3, 2.5 mg/ml BSA, 30 mM MgCl2 (Idaho
Technology).
3. 10X dNTPs: 2 mM each of dATP, dCTP, dGTP and dTTP (Idaho Technology)
(see Note 3).
4. 10X LCGreen Plus (Idaho Technology) (see Note 4)
5. 10X primers/probe (see Notes 5/6):
Factor V forward primer (5 uM): CTGAAAGGTTACTTCAAGGAC
Factor V reverse primer (1 uM): GACATCGCCTCTGGG
Factor V probe (4 uM): TGGACAGGCGAGGAATACAGGTT-P
2.3 Instrumentation (see Note 7)
1. GeneAmp® PCR System 9700 (Applied Biosystems)
2. LightCycler® (Roche)
- 5 -
3. LightScanner™ (Idaho Technology)
4. HR-1™ Instrument (Idaho Technology)
3. Methods
3.1 DNA Isolation
1. Whole blood obtained in EDTA, ACD, sodium citrate, or sodium heparin tubes is
processed according to the QIAamp DNA Blood Mini Kit Handbook.
2. Measure the absorbance at 260 nm and adjust to an absorbance of 1.0 (50 ng/ul).
3.2 PCR Preparation (see Note 8)
1. Mix one part of each of the following 10X solutions with four parts water: DNA
polymerase, PCR buffer, dNTPs, LCGreen Plus, and primer/probe mix.
2. Aliquot 9 parts of the above master mix into each well or capillary.
3. Add 1 part of DNA to each well or capillary.
3.3 PCR Amplification in 96/384 plates
1. Overlay each well with 10 ul (384-well) or 15 ul (96-well) of mineral oil.
2. Briefly spin the plate in a centrifuge.
3. Amplify with an initial denaturation of 94 °C for 10 s followed by 50 cycles of 94
°C for 5 s, 57 °C for 2 s, and 72 °C for 2 s.
4. After amplification, heat to 94 °C for 1 s then cool to 10 °C before melting.
- 6 -
3.4 PCR Amplification in capillaries
1. Spin all samples down into the capillaries on a centrifuge.
2. Amplify on a LightCycler with an initial denaturation of 94 °C for 10 s followed
by 50 cycles of 94 °C for 0 s, 55 °C for 0 s, and 72 °C for 2 s.
3. After amplification, heat to 94 °C for 1 s then rapidly cool at 20 °C/s to 40 °C
before melting.
3.5 Melting Acquisition on the LightScanner
1. Transfer the plate from the thermocycler to the LightScanner.
2. Heat the plate from 55 °C to 88 °C at 0.1 °C/s, giving ~25 points/°C.
3.6 Melting Acquisition with HR1
1. Transfer each capillary to the HR-1 high-resolution melting instrument.
2. Perform melting from 55 °C to 88 °C with a slope of 0.3 °C/s, giving 65
points/°C.
3.7 Melting Analysis
Software on most instruments allows visualization of probe and product melting
transitions as derivative peaks, usually by Salvitsky-Golay polymonial estimation of
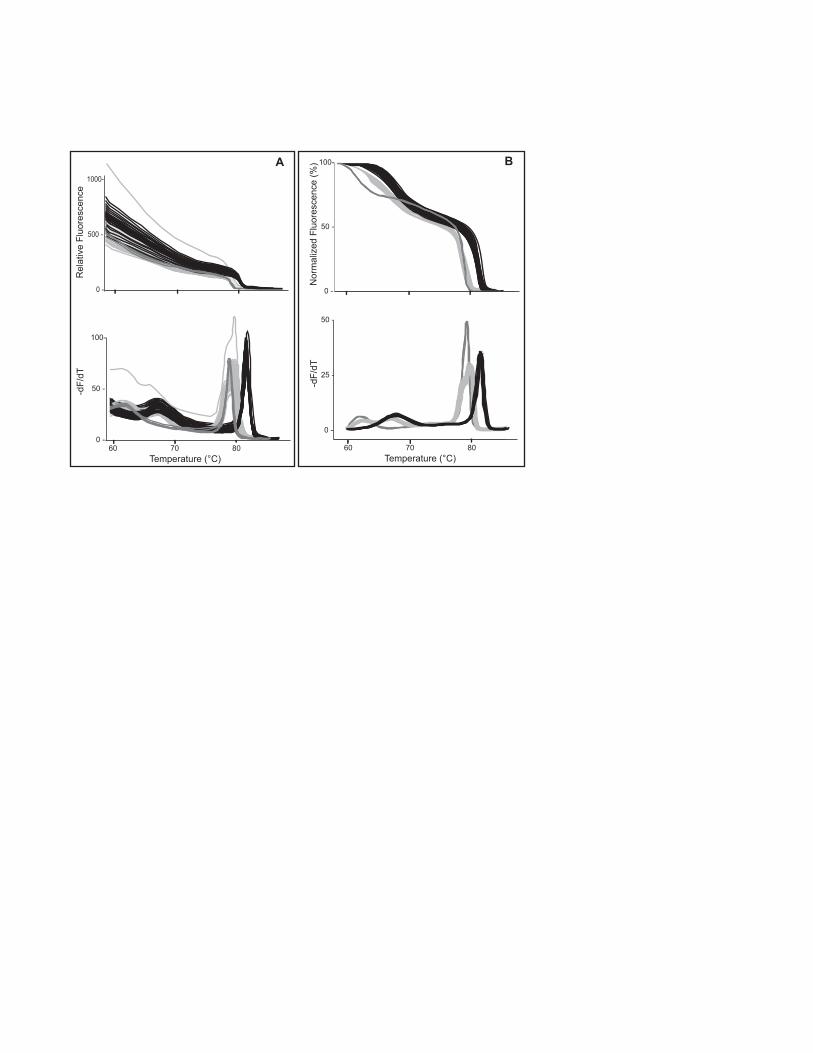
the slope at each point (Wittwer and Kusukawa 2004). Analysis of a 384-well run for
factor V Leiden is shown in Fig. 2. Part A shows the data without background
subtraction, both as the original melting curve (top) and its derivative (bottom). Part
- 7 -
B shows the data after exponential background subtraction (see Note 9), both as a
normalized melting curve (top) and a derivative plot (bottom).
4. Notes
1. Although a common commercial DNA preparation kit is referred to here, any
DNA purification procedure can be used.
2. Various Taq polymerases can be used, including Taq DNA Polymerase (Roche
Applied Science), KlenTaq1™ (AB Peptides) with TaqStart™ antibody
(Clontech), and FastStart Taq DNA polymerase (Roche). A chemically modified
hot start Taq polymerase or the addition of TaqStart antibody is not necessary, but
makes the PCR more robust. However, whether the polymerase has 5’-
exonuclease activity will impact the design of the probes. If a 5’-exo-negative
polymerase is used, the probe can block enzyme extension if it is bound to the
template during enzyme extension. Therefore, the probe Tm should be lower than
the PCR extension temperature (<70°C). If a 5’-exo-positive polymerase is used,
the probe Tm can be as high as 85°C.
3. A dNTP mix that includes dUTP may also be used and will shift the probe Tm to
lower temperatures. If the total dNTP concentration changes, adjust the MgCl2
concentration accordingly. Uracil-N-glycosylase may also be included (Liew et
al. 2004) although it is usually not considered necessary in closed-tube systems
(Wang et al. 2005).
4. Saturating dyes, LCGreen® I or LCGreen® Plus (Idaho Technology) can be used
for unlabeled probe genotyping. These dyes differ from the commonly used
- 8 -
SYBR® Green I in their ability to be used at high concentrations, allowing all
available double-stranded binding sites to be saturated while not inhibiting PCR
amplification. The excitation maximum for the LCGreen dyes is 450 nm with
emission at 470 nm, allowing use on the SYBR Green I channel of most real-time
instruments. However, the LCGreen dyes are not excited by argon-ion laser-
based instruments (Herrmann et al. 2006). The use of LCGreen dyes increases
the melting temperature of DNA probes by about 1-3 °C, and adjustment of
cycling parameters may be required. LCGreen Plus has higher fluorescence
intensity than LCGreen I and is best used on plate-based instruments.
5. Primers are prepared with standard desalting. Unlabeled probe signals are
stronger with shorter PCR products. Amplicons less than 100 bp are optimal,
while 200 bp amplicons still give strong signals and most probes within 400 bp
amplicons can still be used. Asymmetric PCR (1:5 to 1:10) produces both
double-stranded amplicon and the appropriate single-stranded DNA for probe
binding (Figure 1).
6. Probes are blocked on the 3’ end to prevent extension. The most common blocker
is a phosphate. Incomplete phosphate blocking (from either incomplete synthesis
or hydrolysis on storage) produces longer probes that appear as extra peaks on
derivative plots between the expected probe and product melting temperatures.
When this occurs, a C3 blocker may be more effective in preventing extension
(Cradic et al. 2004). The length of an unlabeled probe is usually 20 to 40 bases
depending on the GC content and the desired Tm (Zhou et al. 2004a). Longer
probes give stronger signals. Tms between 50 and 85 °C have been successfully
- 9 -
used. Probe Tm can be lowered by using dUTP instead of dTTP during probe
systhesis (Zhou et al. 2004b), or increased by substituting locked nucleic acids
into the probe (Chou et al. 2005). As with any probe based system, mismatches
destabilize the probe and lower the Tm. Irrelevant polymorphisms can be masked
by incorporating mismatches, deletions, or universal bases into the probes
(Margraf et al. 2006).
7. Unlabeled probes can be analyzed on any fluorescent melting instrument
compatible with LCGreen dyes. Different alleles are best discriminated on
instruments specifically designed for high-resolution melting analysis (HR-1 and
the LightScanner). The HR-1 instrument performs melting analysis on samples
contained in capillaries that were previously amplified on a LightCycler. The HR-
1 processes one sample at a time with a throughput of ~ 40 samples per hour. The
LightScanner analyzes 96 or 384 well plates that have been amplified in any 96 or
384 well thermocycler. The time for analysis in the LightScanner is 5-15 minutes
for a full plate, depending on ramp times and temperature ranges. An extensive
comparison of 9 instruments capable of melting analysis has been recently
reported (Herrmann et al. 2006). In addition to the HR-1 instrument and the
LightScanner, this study evaluated the melting capabilities of the ABI PRISM®
7000, ABI PRISM® 7900HT, BioRad iCycler, Cepheid SmartCycler®, Corbett
Rotor-Gene™ 3000, and the Roche LightCycler 1.2 and 2.0. All but the 7900HT
were compatible with unlabeled probe analysis with LCGreen Plus. Roche has
recently introduced the LightCycler 480 System, which is a real time 96/384-well
- 10 -
PCR instrument that should also be useful for melting analysis of unlabeled
probes.
8. The usual total reaction volume is 10 ul. However, reactions can be scaled down
to 5 ul if desired in either capillaries or plates.
9. Exponential background subtraction is not currently incorporated into any
commercial software. However, the method is straightforward and is easily
implemented as follows: Fit the slope of the collective (signal plus background)
curve, F(T) = M(T) + B(T) at two temperatures, TL and TR, below and above any
melting transition temperatures, so that the slope M′(TL)=M′( TR)=0 and
therefore F′(TL) = B′(TL) and F′(TR) = B′(TR). Fit an exponential model for B(T)
= Cea(T−TL
), shifted to TL for numerical stability to these two values: B′(T) =
aCea(T−TL
) at T = TR, TL. At T = TL, this gives aC = B′(TL) and at T=TR this gives
aCea(TR−T
L) = B′(TR). Since the two values on the right hand sides have been
measured, we may use them to obtain the model parameters a and C as follows.
Dividing the second equation by the first gives ea(TR−T
L) = B′(TR)/B′(TL) so that a =
ln(B′(TR)/B′(TL))/(TR−TL) and the first equation gives C = B′(TL)/a. Finally,
obtain the signal with the background removed by subtraction: M(T) = F(T) −
Cea(T−TL
) with the parameters C and a determined as above. The signal M(T) may
optionally be normalized to the range 0 − 100 by applying the linear shift and
rescaling M(T) = 100(M(T) − m)/(M − m) where m = min{M(T)} and M =
max{M(T)} on the interval of interest.
- 11 -
Figure Legends
Fig. 1. Genotyping by unlabeled probe melting analysis. (A) Asymmetric PCR in the
presence of LCGreen dye and an unlabeled probe produces both probe/product and
product/product duplexes. (B) Melting analysis reveals both low temperature
(probe/product) and high temperature (product/product) melting transitions (Zhou et al.
2005). Complete SNP genotyping is possible by analysis of either region. However,
probe genotyping does not require high-resolution instrumentation or analysis techniques.
Fig. 2. Unlabeled probe genotyping of factor V Leiden in 384-well format on the
LightScanner. Data are displayed as melting curves (top) and derivative plots (bottom)
either without (A) or with (B) exponential background subtraction. It is much easier to
cluster the curves by genotype after exponential background subtraction.
- 12 -
References
Chou, L.-S., C. Meadows, C. T. Wittwer, and E. Lyon. 2005. Unlabeled oligonucleotide
probes modified with locked nucleic acids for improved mismatch discrimination
in genotyping by melting analysis. BioTechniques 39: 644-650.
Cradic, K. W., J. E. Wells, L. Allen, K. E. Kruckeberg, R. J. Singh, and S. K. Grebe.
2004. Substitution of 3'-phosphate cap with a carbon-based blocker reduces the
possibility of fluorescence resonance energy transfer probe failure in real-time
PCR assays. Clin Chem 50: 1080-2.
Herrmann, M. G., J. D. Durtschi, L. K. Bromley, C. T. Wittwer, and K. V. Voelkerding.
2006. DNA Melting Analysis for Mutation Scanning and Genotyping: A Cross
Platform Comparison. Clinical Chemistry in press.
Jobs, M., W. M. Howell, L. Stromqvist, T. Mayr, and A. J. Brookes. 2003. DASH-2:
flexible, low-cost, and high-throughput SNP genotyping by dynamic allele-
specific hybridization on membrane arrays. Genome Res 13: 916-24.
Liew, M., L. Nelson, R. L. Margraf, S. Mitchell, M. Erali, R. Mao, E. Lyon, and C. T.
Wittwer. 2006. Genotyping of human platelet antigens 1-6 &15 by high-
resolution amplicon melting and conventional hybridization probes. J Molec
Diagn in press.
Liew, M., R. Pryor, R. Palais, C. Meadows, M. Erali, E. Lyon, and C. Wittwer. 2004.
Genotyping of single-nucleotide polymorphisms by high-resolution melting of
small amplicons. Clin Chem 50: 1156-64.
- 13 -
Margraf, R. L., R. Mao, and C. T. Wittwer. 2006. Masking selected sequence variation by
incorporating mismatches into melting analysis probes. Human Mutation in press.
Prince, J. A., L. Feuk, W. M. Howell, M. Jobs, T. Emahazion, K. Blennow, and A. J.
Brookes. 2001. Robust and accurate single nucleotide polymorphism genotyping
by dynamic allele-specific hybridization (DASH): design criteria and assay
validation. Genome Res 11: 152-62.
Ririe, K. M., R. P. Rasmussen, and C. T. Wittwer. 1997. Product differentiation by
analysis of DNA melting curves during the polymerase chain reaction. Anal
Biochem 245: 154-60.
Wang, J., K. Chuang, M. Ahluwalia, S. Patel, N. Umblas, D. Mirel, R. Higuchi, and S.
Germer. 2005. High-throughput SNP genotyping by single-tube PCR with Tm-
shift primers. Biotechniques 39: 885-893.
Wittwer, C. T., V. E. Dujols, G. Reed, and L. Zhou. 2004. Amplicon melting analysis
with saturation dyes.
Wittwer, C. T., M. G. Herrmann, A. A. Moss, and R. P. Rasmussen. 1997. Continuous
fluorescence monitoring of rapid cycle DNA amplification. Biotechniques 22:
130-1, 134-8.
Wittwer, C. T., and N. Kusukawa. 2004. Real-time PCR. Pages 71-84 in D. H. Persing, F.
C. Tenover, J. Versalovic, Y. W. Tang, E. R. Unger, D. A. Relman, and T. J.
White, eds. Diagnostic molecular microbiology; principles and applications.
ASM Press, Washington DC.
- 14 -
Wittwer, C. T., G. H. Reed, C. N. Gundry, J. G. Vandersteen, and R. J. Pryor. 2003.
High-resolution genotyping by amplicon melting analysis using LCGreen. Clin
Chem 49: 853-60.
Zhou, L., A. N. Myers, J. G. Vandersteen, L. Wang, and C. T. Wittwer. 2004a. Closed-
tube genotyping with unlabeled oligonucleotide probes and a saturating DNA dye.
Clin Chem 50: 1328-35.
Zhou, L., J. Vandersteen, L. Wang, T. Fuller, M. Taylor, B. Palais, and C. T. Wittwer.
2004b. High-resolution DNA melting curve analysis to establish HLA genotypic
identity. Tissue Antigens 64: 156-64.
Zhou, L., L. Wang, R. Palais, R. Pryor, and C. T. Wittwer. 2005. High-Resolution DNA
Melting Analysis for Simultaneous Mutation Scanning and Genotyping in
Solution. Clin Chem 51: 1770-1777.
- 15 -
excess forward primerlimited reverse primer3’ blocked probex
asymmetric PCR
3’ 5’ x 5’ 3’
5’ 3’ 5’
amplicon melting
Temperature (°C)
-dF/
dT
probe melting
A
B
100-
50 -
0 -
Nor
mal
ized
Flu
ores
cenc
e (%
)-d
F/dT
50 -
25 -
0 -
60 70 80 Temperature (°C)
B1000-
500 -
0 -
Rel
ativ
e Fl
uore
scen
ce
60 70 80 Temperature (°C)
100-
50 -
0 -
-dF/
dT
A