Embed Size (px)
Citation preview
S h li d Child L bOslo Workshop on Child Labor and EFA - October 20-21 2008
Schooling and Child Labor: What role for education policies?What role for education policies?
M M dMarco Manacorda Queen Mary University of LondonCEP- London School of Economics & UCW
Educational policiesp
Costs of /returns to schoolingSupply - Accessibility pp y yRepetition policiesQualityQuality MM10

Diapositiva 2
MM10 Marco Manacorda_2, 19/10/2008
Why education policies?y p
School attendance easier to monitor
Caution: work in combination with school / idlenessschool costly (siblings’) y ( g )CAUSALITY crucial to design policies
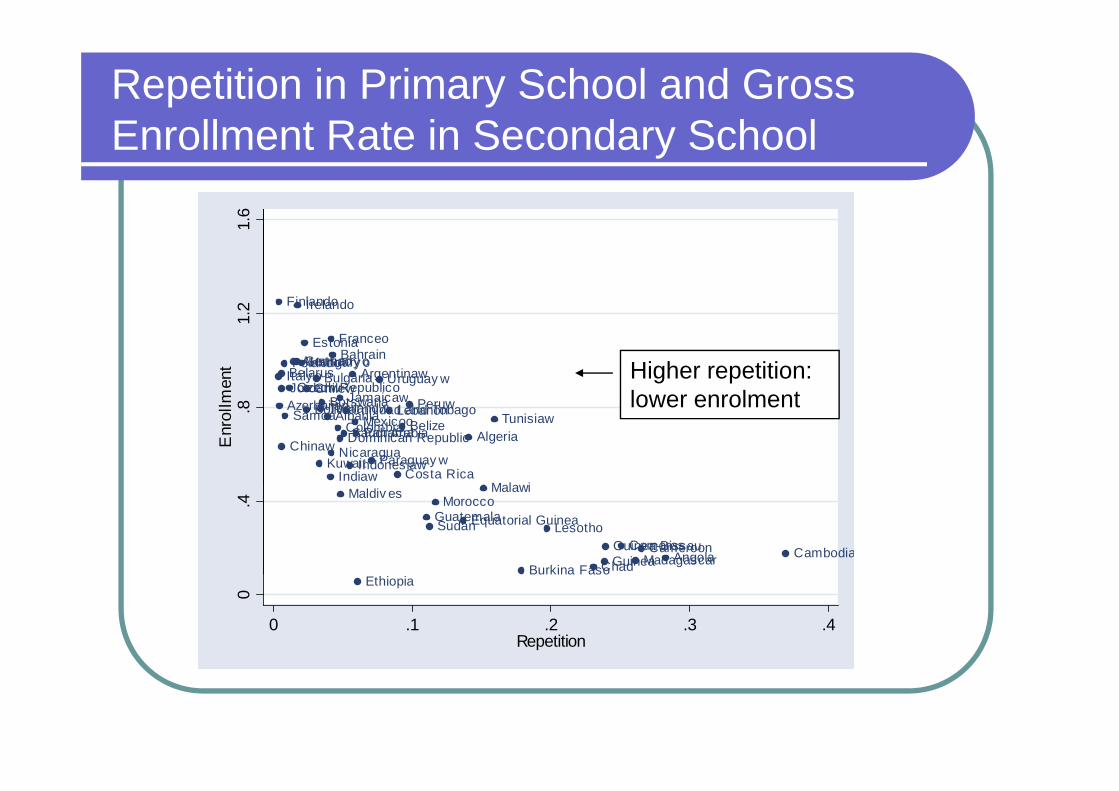
Repetition in Primary School and Gross E ll t R t i S d S h lEnrollment Rate in Secondary School
6
FinlandoIrelando21.
6
Bahrain
JordanwBelarusBulgaria
Czech Republico
EstoniaHungary oPolando
ArgentinawChilew
JamaicawUruguay w
Austriao
a do
Franceo
Germany o
Irelando
Italy o
1.2
men
t Higher repetition: lower enrolment
Algeria
Kuwait
Lebanon
Saudi ArabiaTunisiawAlbania
Azerbaijan
ChinawIndonesiaw
SamoaThailandwBelize
Boliv iaColombia
Costa Rica
Dominican Republic
Jamaicaw
Mexicoo
NicaraguaPanama
Paraguay w
PeruwTrinidad and Tobago
Indiaw
Botswana
Malawi
.8E
nrol
lm lower enrolment
Morocco
Sudan
Cambodia
Guatemala
Maldiv es
AngolaBurkina Faso
CameroonChad
Comoros
Equatorial Guinea
GuineaGuinea-Bissau
Lesotho
Madagascar
Malawi
.4
Ethiopia
0
0 .1 .2 .3 .4Repetition
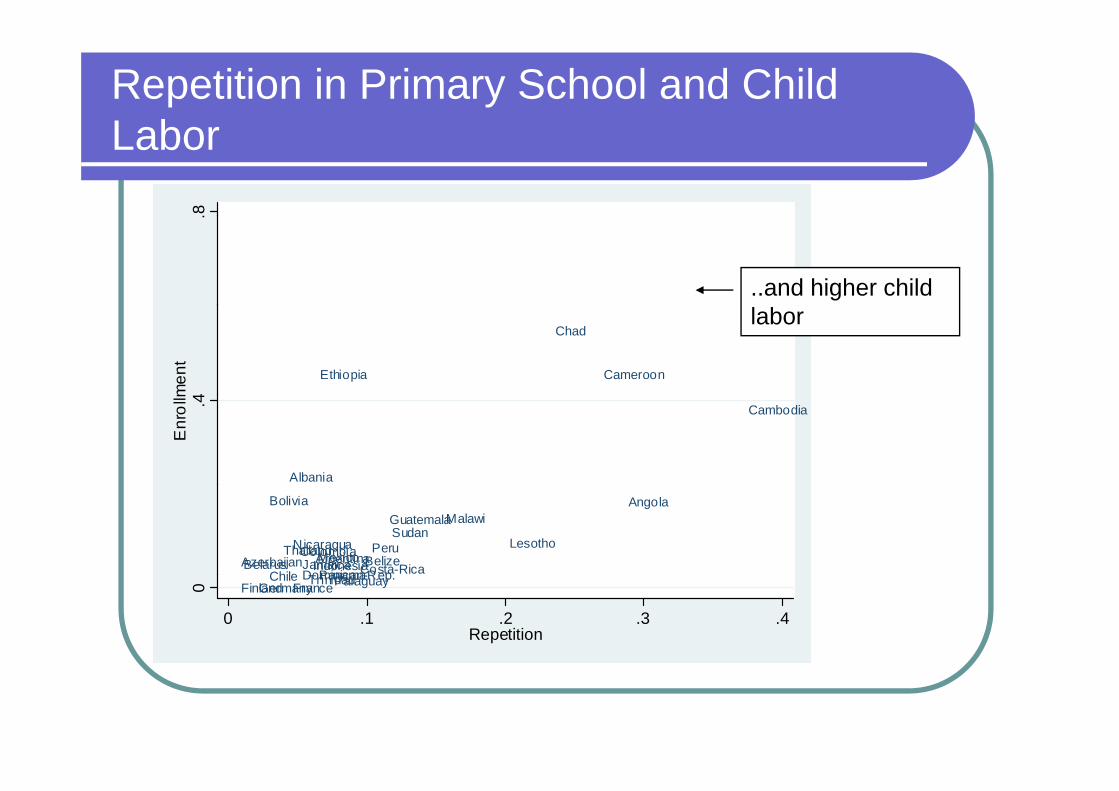
Repetition in Primary School and Child L bLabor
.8.
..and higher child
Cameroon
Chad
Ethiopia
4men
t
labor
Albania
Cambodia.4E
nrol
lm
Angola
ArgentinaAzerbaijanBelarus Belize
Bolivia
Chile
ColombiaCosta-RicaDominican Rep
Guatemala
IndonesiaJamaicaLesotho
Malawi
MexicoNicaragua
Panama
PeruSudan
Thailand
T i id dChile Dominican-Rep.Finland FranceGermany
PanamaParaguayTrinidad0
0 .1 .2 .3 .4Repetition
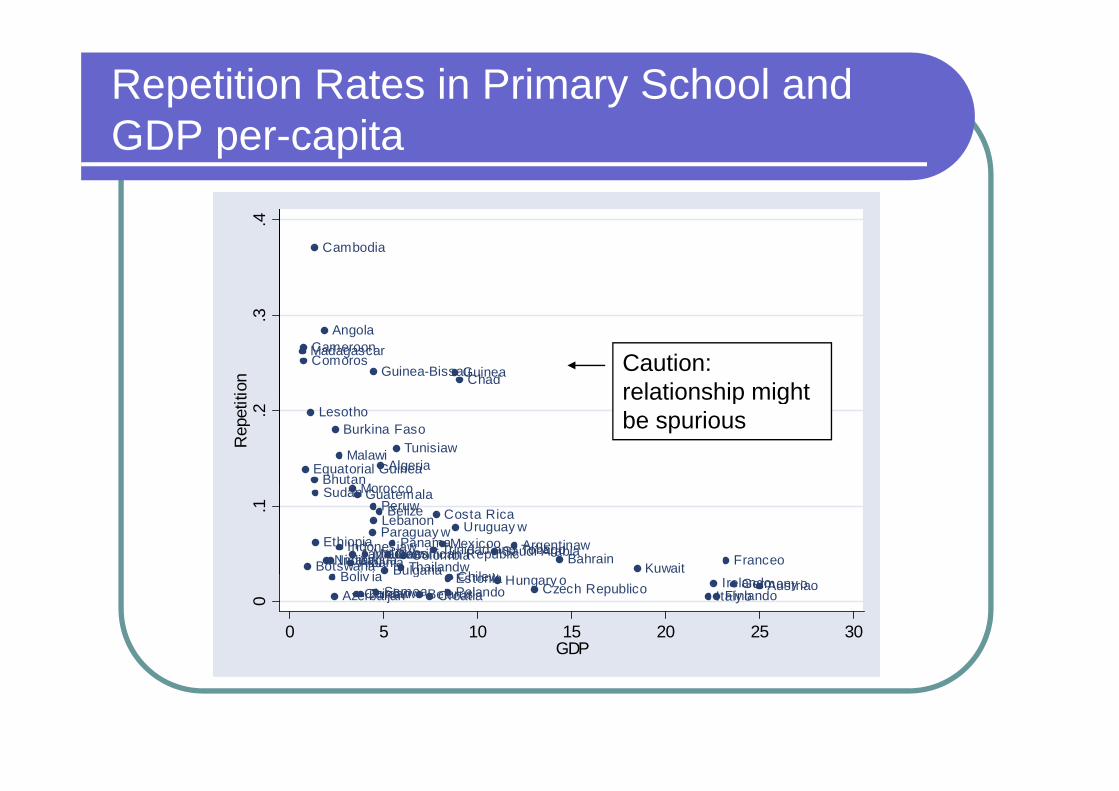
Repetition Rates in Primary School and GDP itGDP per-capita
4Cambodia
.4
AngolaCameroon
ChadComoros
GuineaGuinea-BissauMadagascar
.3io
n
Caution: relationship might
Algeria
M
Tunisiaw
Bhutan
Burkina Faso
Equatorial Guinea
Lesotho
Malawi
.2R
epet
it relationship might be spurious
BahrainKuwait
Lebanon
Morocco
Saudi Arabia
Sudan
AlbaniaBulgaria E t i
IndonesiawThailandw
Argentinaw
Belize
Boliv ia ChilewColombia
Costa Rica
Dominican Republic
Guatemala
JamaicawMexicoo
NicaraguaPanama
Paraguay w
Peruw
Trinidad and TobagoUruguay w
FranceoIndiawMaldiv esBotswana
Ethiopia
.1
Jordanw Belarus
g
Croatia Czech RepublicoEstonia Hungary oPolandoAzerbaijanChinawSamoa
Boliv ia Chilew AustriaoFinlando
Germany oIrelandoItaly o0
0 5 10 15 20 25 30GDP

Grade Repetitionp
Learning benefitsSocio-emotional consequencesSocio emotional consequences Knowledge/discipline Improves quality of match Deterrent against underperformanceDeterrent against underperformance GE + externalities
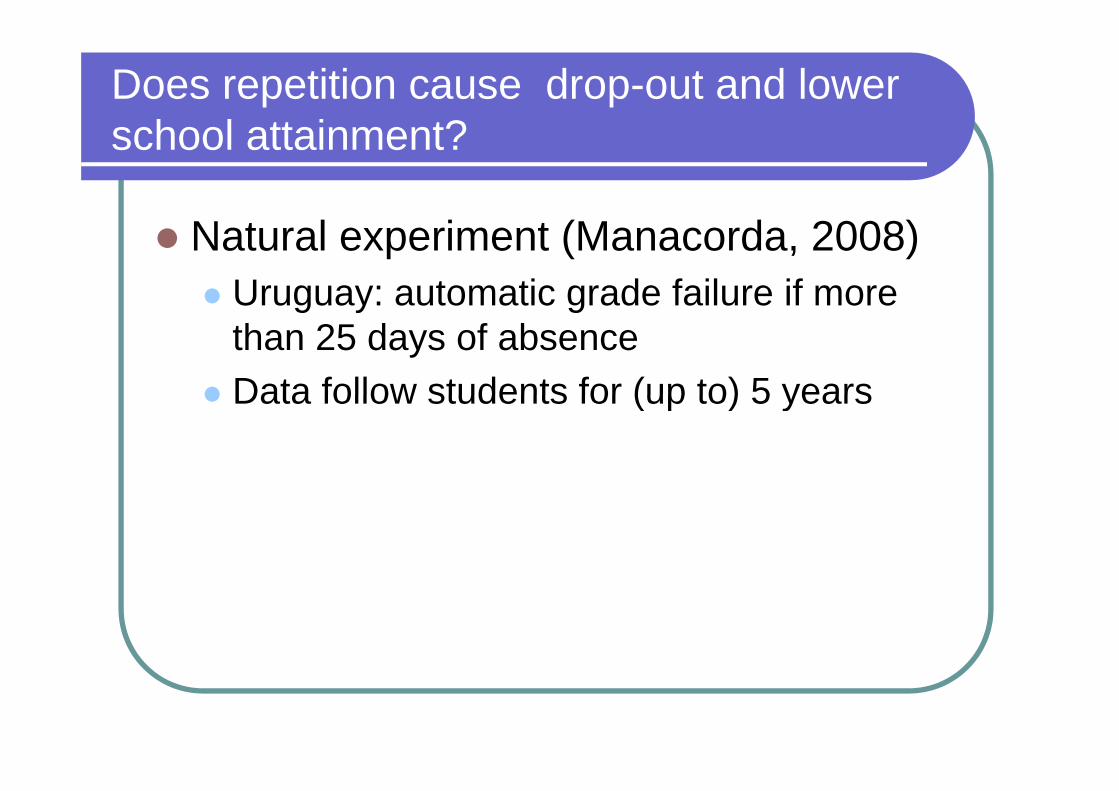
Does repetition cause drop-out and lower h l tt i t?school attainment?
Natural experiment (Manacorda, 2008)Uruguay: automatic grade failure if more g y gthan 25 days of absenceData follow students for (up to) 5 yearsData follow students for (up to) 5 years
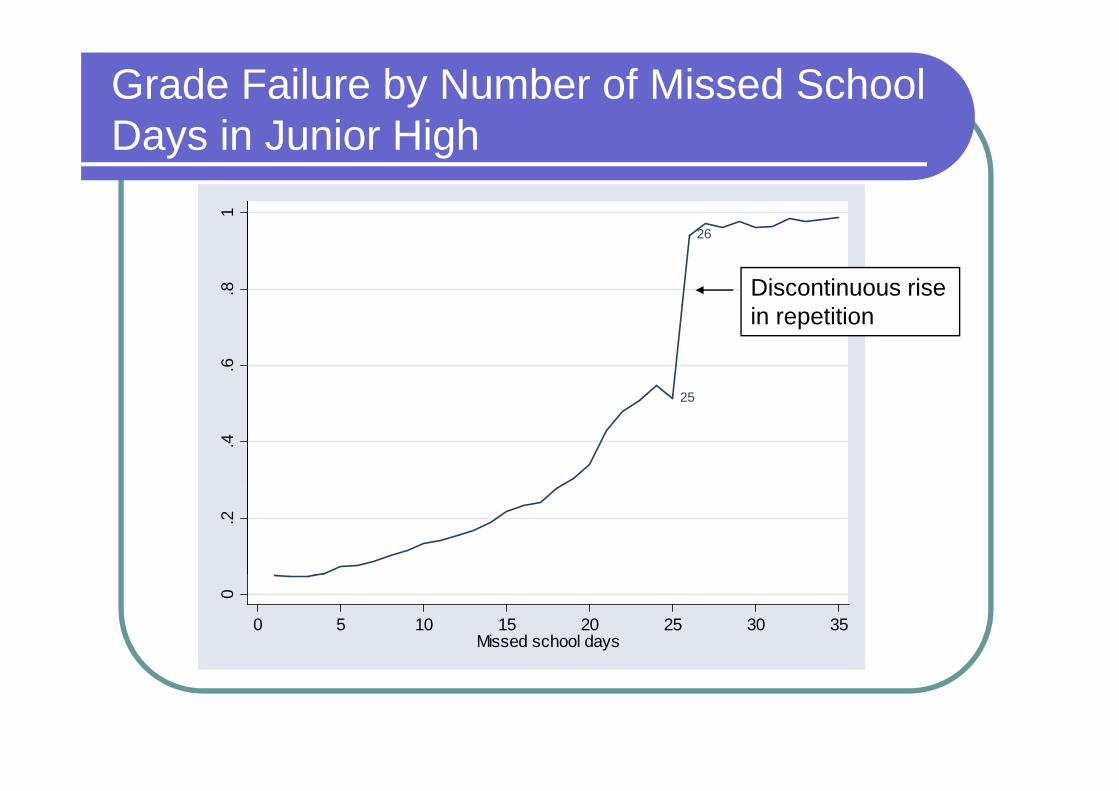
Grade Failure by Number of Missed School D i J i Hi hDays in Junior High
126
.8 Discontinuous rise
25
.6
in repetition
25
.4.2
0
0 5 10 15 20 25 30 35Missed school days
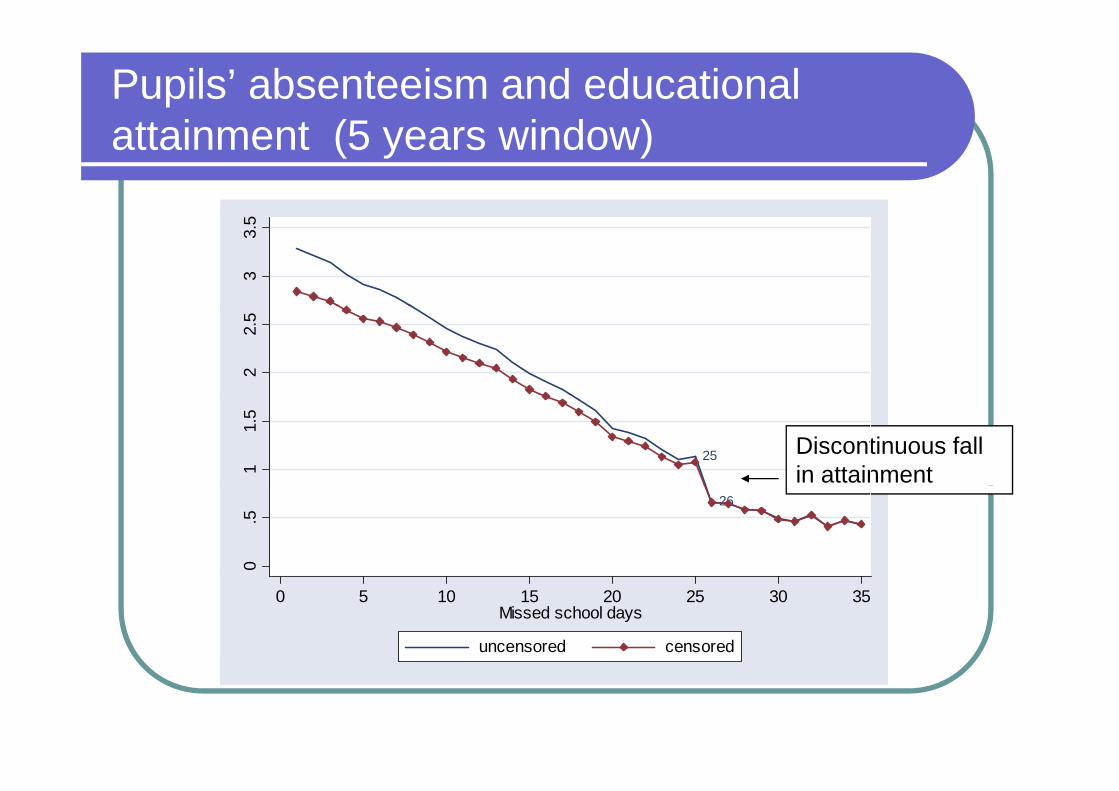
Pupils’ absenteeism and educational tt i t (5 i d )attainment (5 years window)
33.
52
2.5
25
11.
5
Discontinuous fall in attainment
26
0.5
0 5 10 15 20 25 30 35Missed school days
uncensored censored
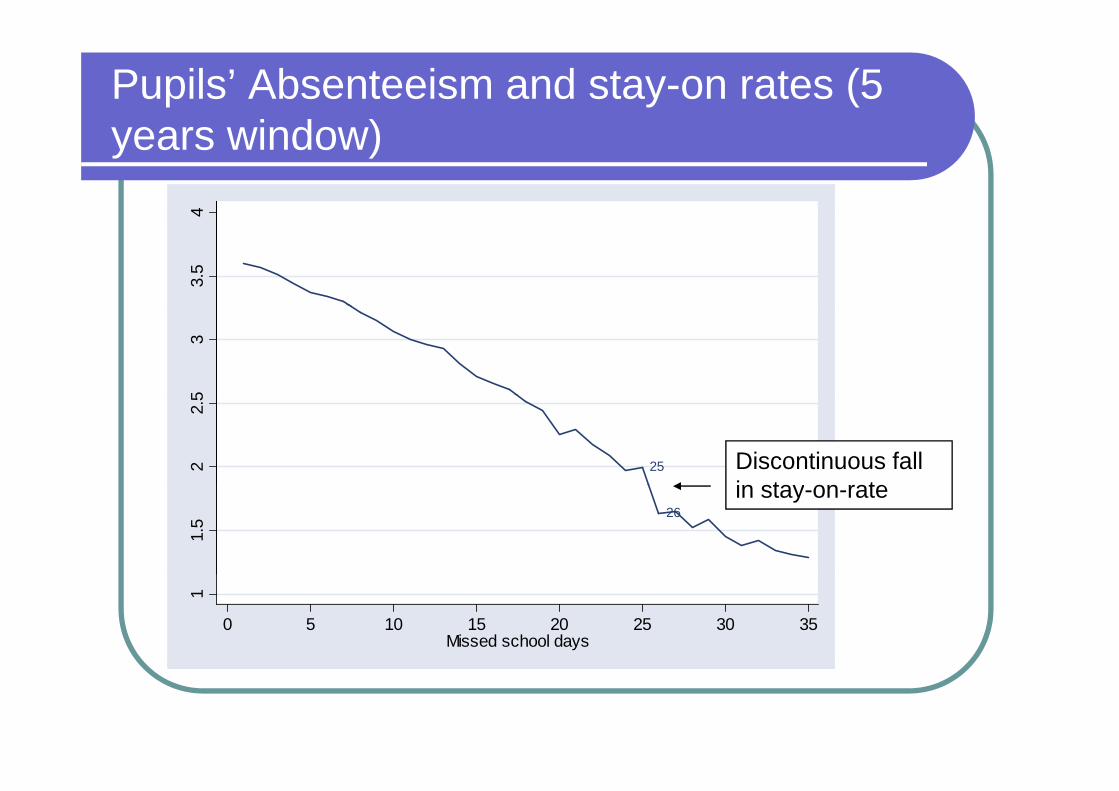
Pupils’ Absenteeism and stay-on rates (5 i d )years window)
43.
54
53
2522.
5
Discontinuous fall in stay on rate
26
1.5
in stay-on-rate
1
0 5 10 15 20 25 30 35Missed school days
The cost of grade repetitiong p
Grade repetition• After 5 yearsy• Lowers school attainment by half a year
Increases drop out by similar amount (after• Increases drop out by similar amount (after 5 years)
How to remedy repetition?y p
Pre-schoolingEarly Human Capital investmentEarly Human Capital investmentSocialization to schoolEnforcementAdditional benefits (mother’s work)Additional benefits (mother s work)
Does re-school lower repetition?p
Berlinski, Galiani and Manacorda (2008)Compare siblings’ school trajectoriesCompare siblings school trajectoriesUruguay: universal pre-school
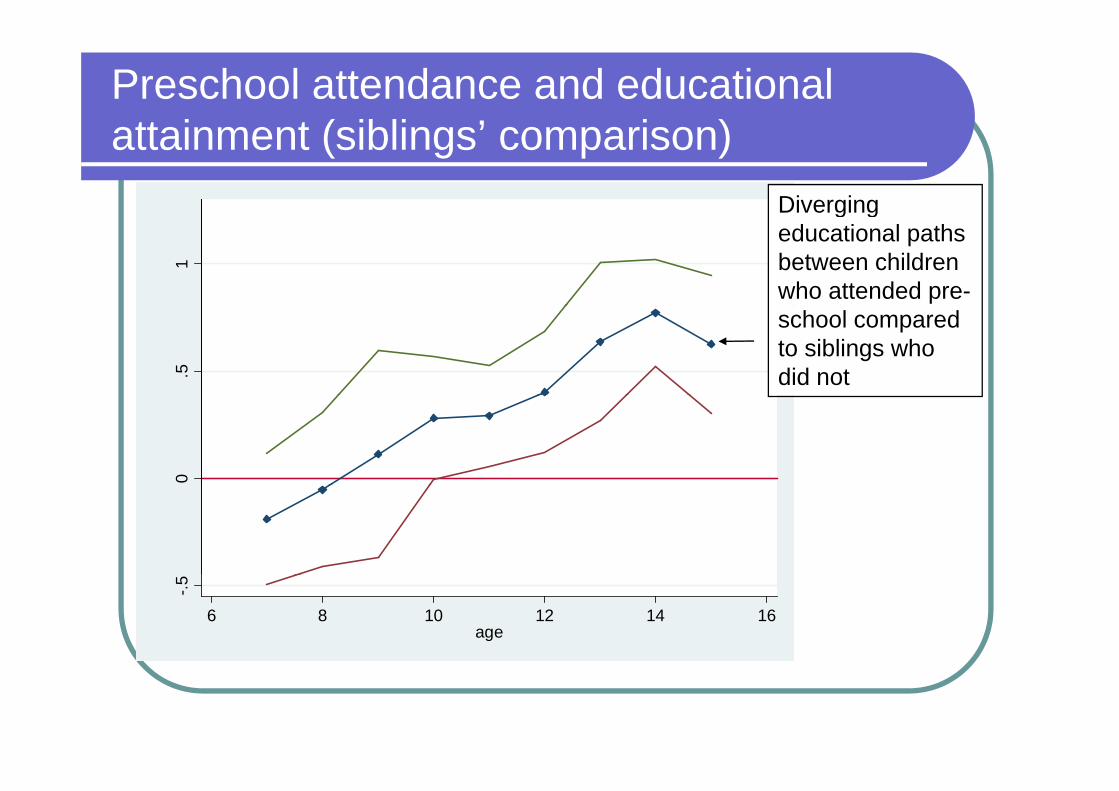
Preschool attendance and educational tt i t ( ibli ’ i )attainment (siblings’ comparison)
Diverging 1
g geducational paths between children who attended pre-
.5
school compared to siblings who did not
0
-.5
6 8 10 12 14 16age
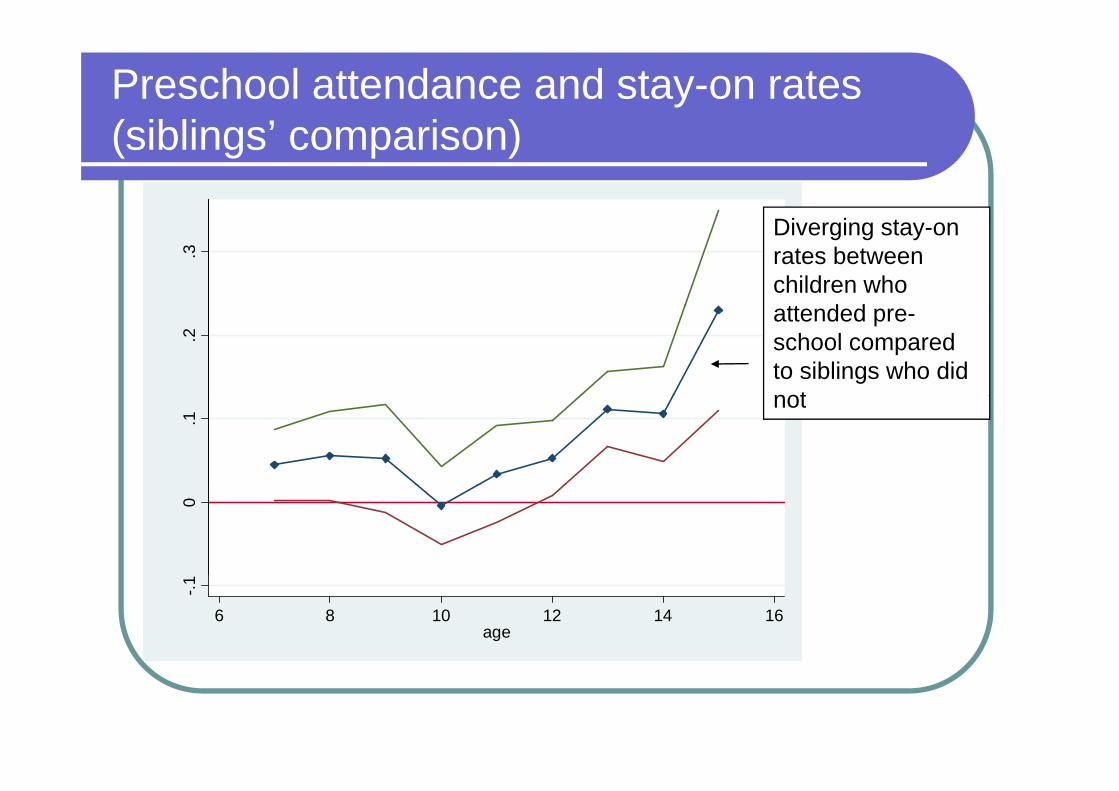
Preschool attendance and stay-on rates ( ibli ’ i )(siblings’ comparison)
.3
Diverging stay-on rates between children who
tt d d
.2
attended pre-school compared to siblings who did not
.1 not
0-.1
6 8 10 12 14 16age
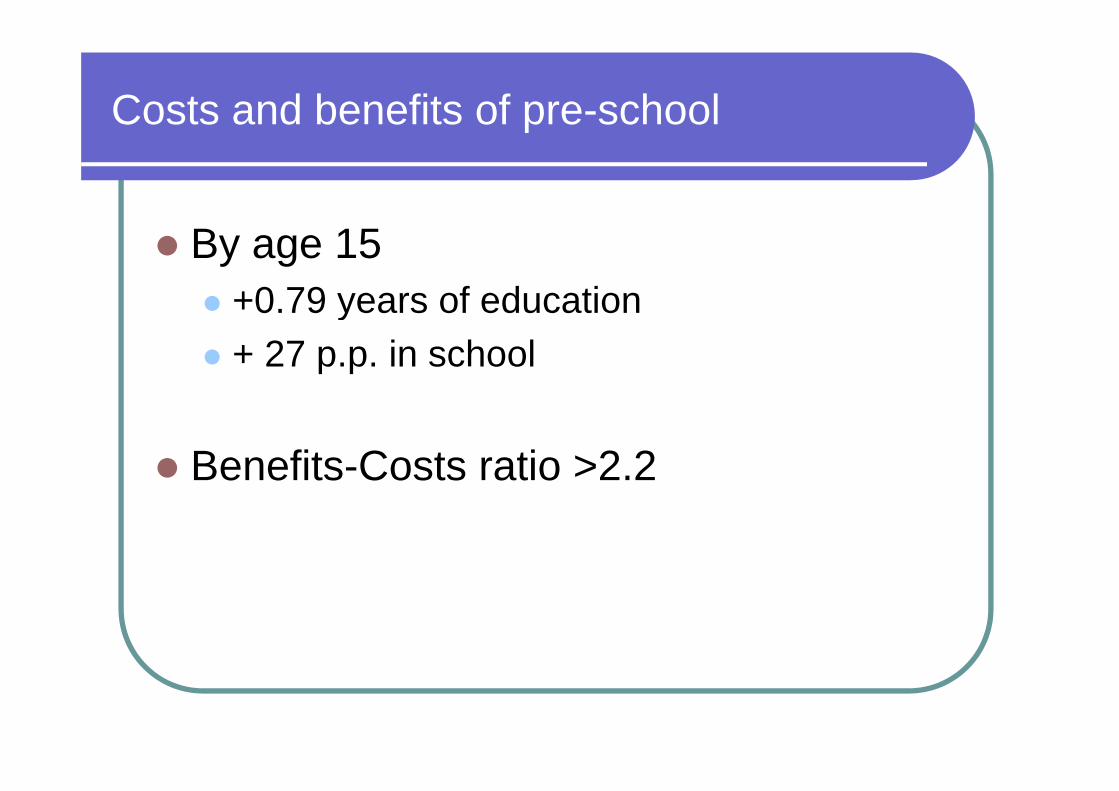
Costs and benefits of pre-schoolp
By age 15 +0 79 years of education+0.79 years of education + 27 p.p. in school
Benefits-Costs ratio >2.2
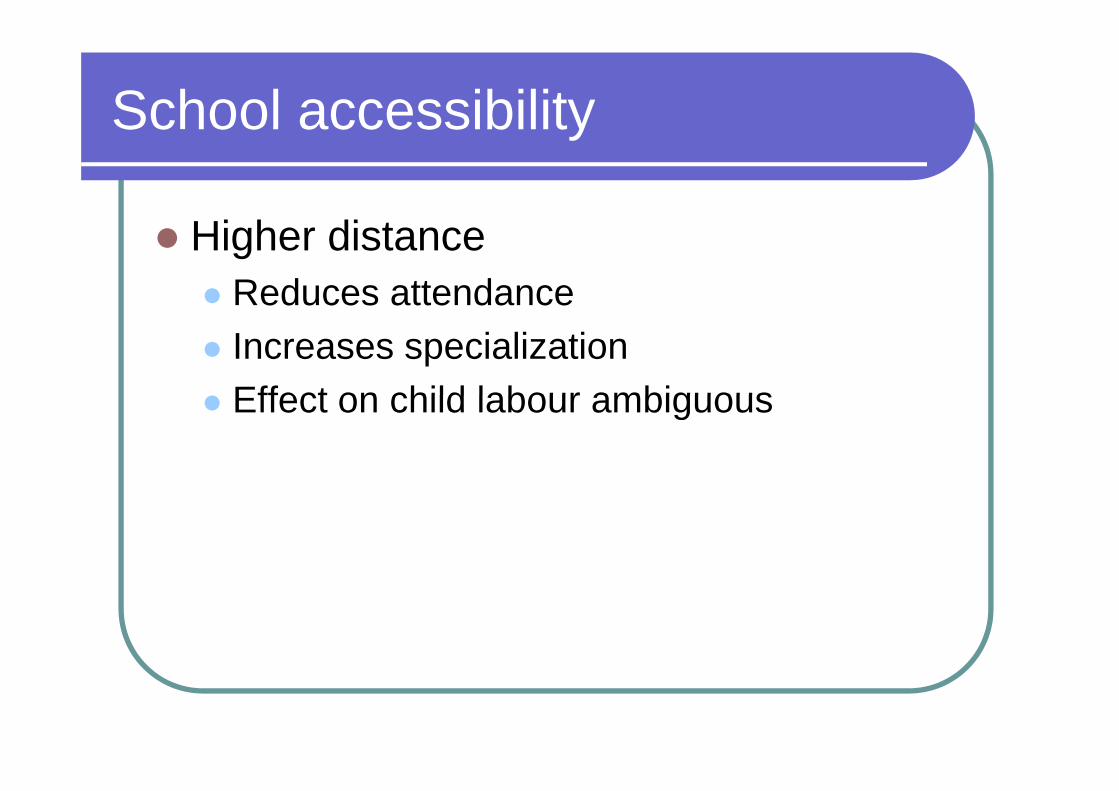
School accessibilitySchool accessibility
Higher distance Reduces attendance Increases specialization Effect on child labour ambiguousEffect on child labour ambiguous
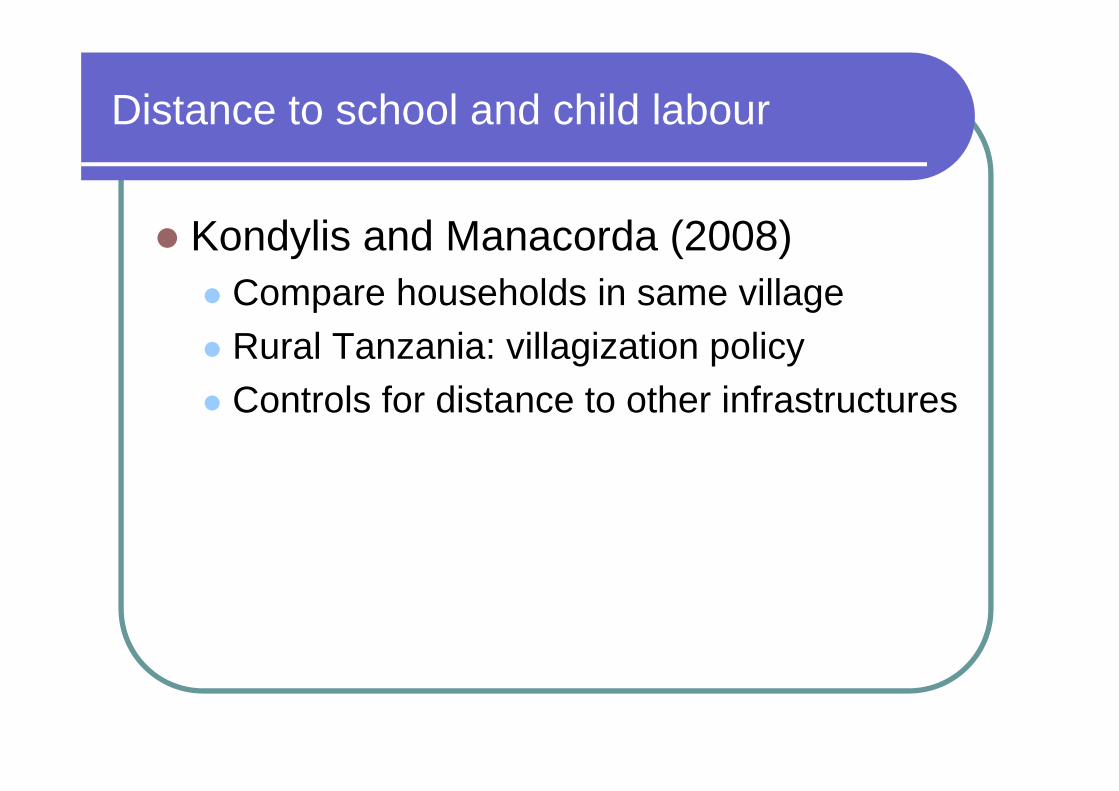
Distance to school and child labour
Kondylis and Manacorda (2008)Compare households in same village p gRural Tanzania: villagization policyControls for distance to other infrastructuresControls for distance to other infrastructures
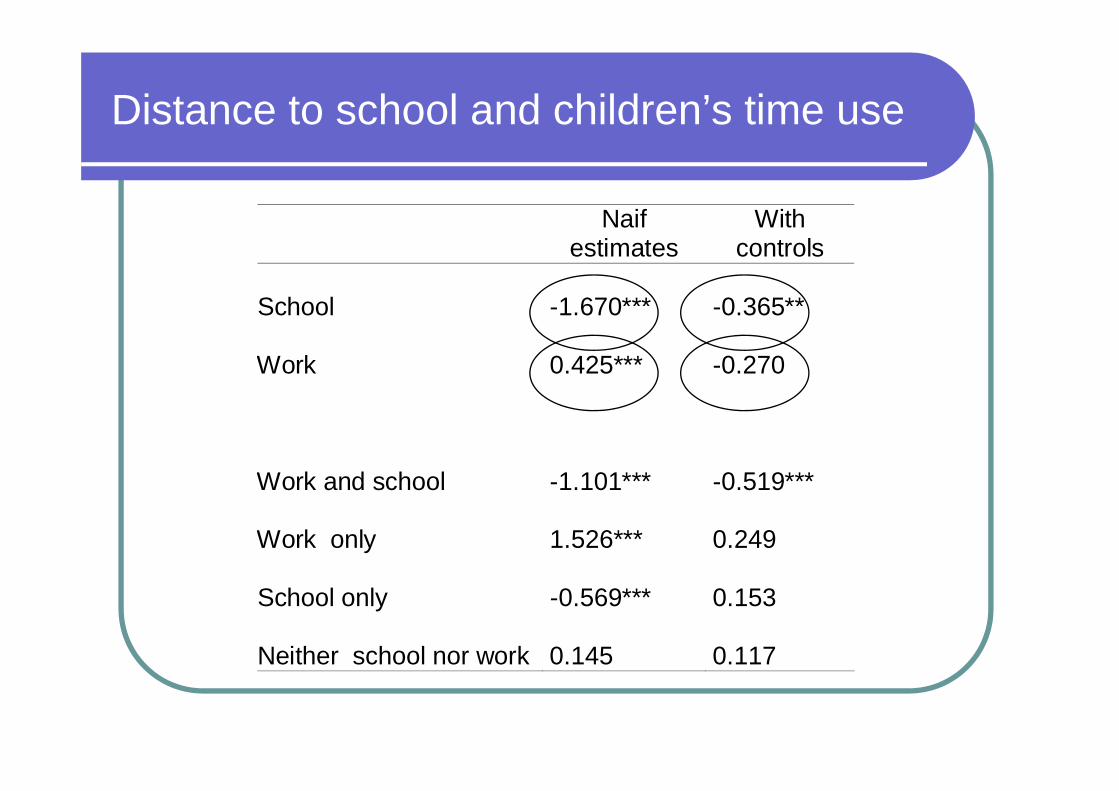
Distance to school and children’s time use
Naif With Naif estimates
With controls
School 1 670*** 0 365**School -1.670 -0.365
Work 0.425*** -0.270
Work and school -1 101*** -0 519***Work and school 1.101 0.519
Work only 1.526*** 0.249
School only -0.569*** 0.153
Neither school nor work 0.145 0.117
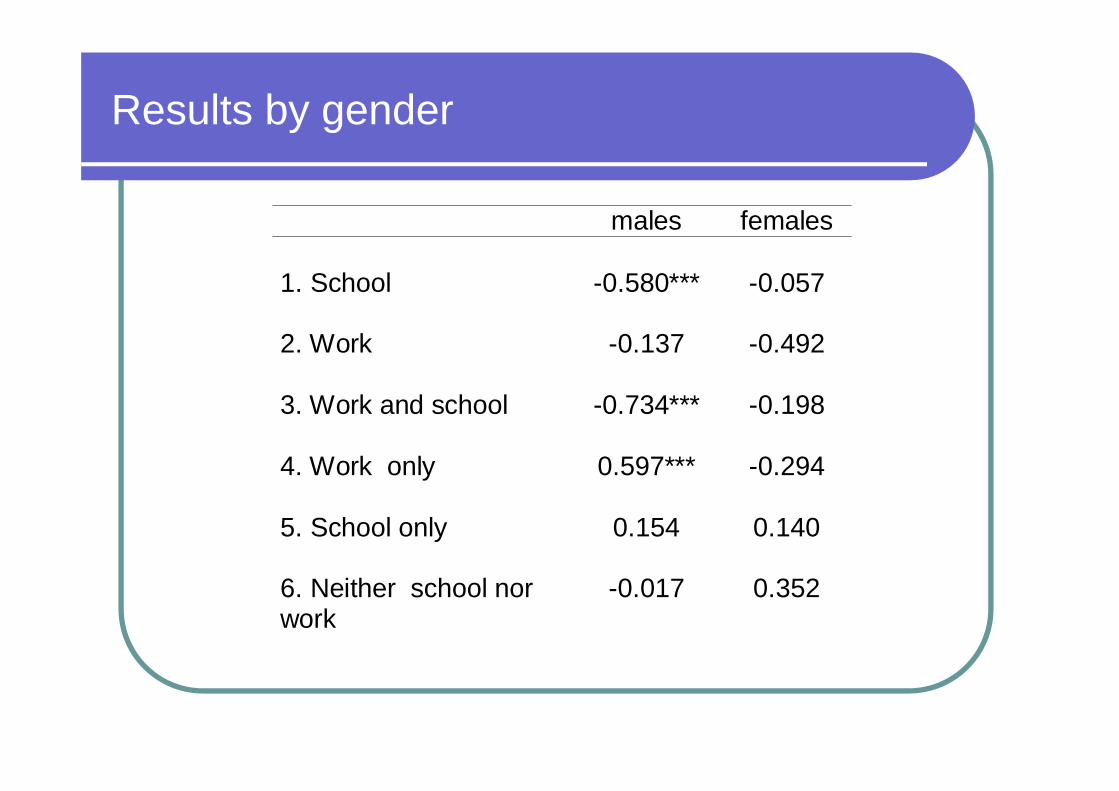
Results by gendery g
males femalesmales females 1. School -0.580*** -0.057 2. Work -0.137 -0.492 3 W k d h l 0 734*** 0 1983. Work and school -0.734*** -0.198 4. Work only 0.597*** -0.294 5. School only 0.154 0.140 6. Neither school nor work
-0.017 0.352
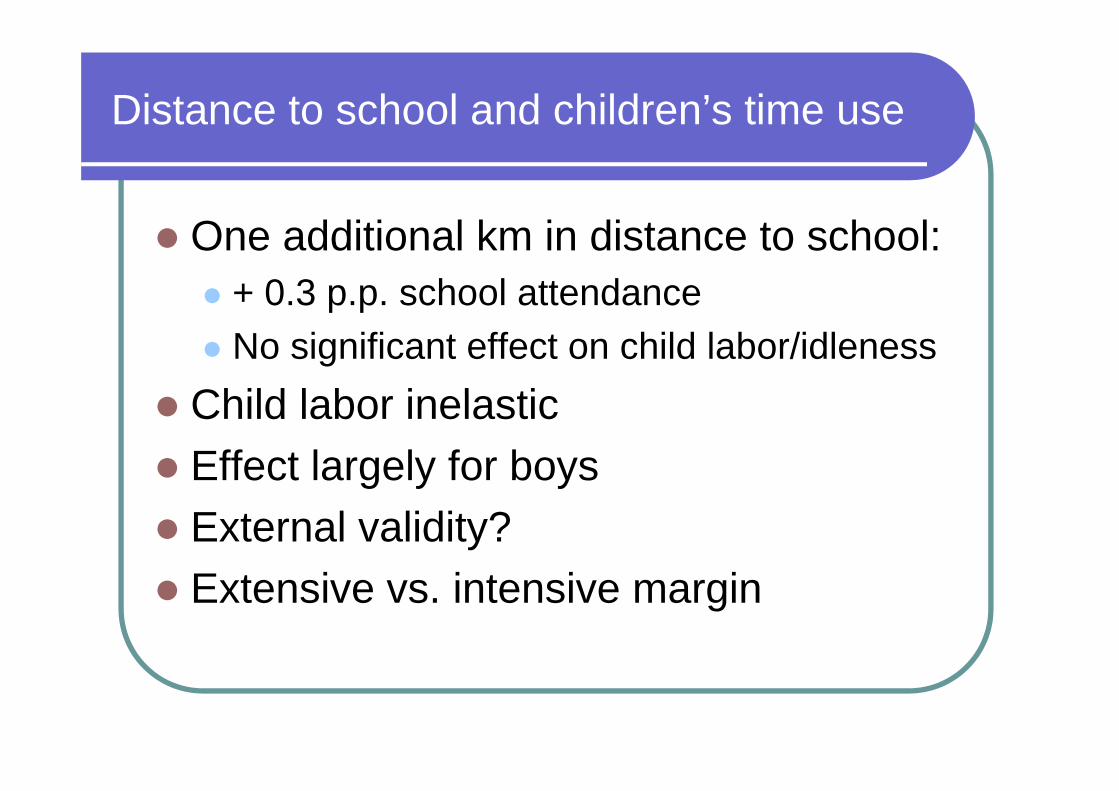
Distance to school and children’s time use
One additional km in distance to school:+ 0.3 p.p. school attendancep pNo significant effect on child labor/idleness
Child l b i l tiChild labor inelasticEffect largely for boysg y yExternal validity? E t i i t i iExtensive vs. intensive margin
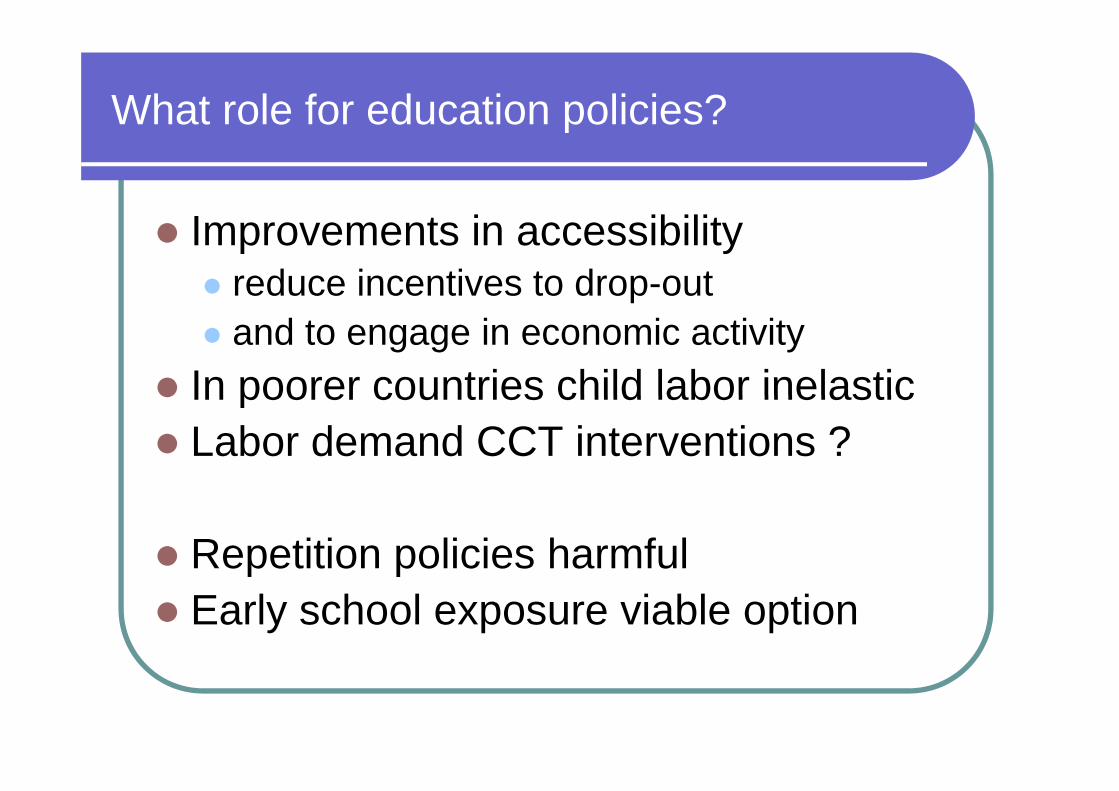
What role for education policies?p
I t i ibilitImprovements in accessibilityreduce incentives to drop-outand to engage in economic activity
In poorer countries child labor inelasticIn poorer countries child labor inelasticLabor demand CCT interventions ?
Repetition policies harmfulp pEarly school exposure viable option