Embed Size (px)
Citation preview

1
Safe Advanced Mobile Power IEEE Consumer Electronics Future Directions Committee
February 14, 2015 (Version 2)
Authors: Sunish Gupta, William Lumpkins, Joe Ziomek, Joe Wei, Peter Corcoran, Joe Decuir, Yu Yuan, Mark Maynard, Murlin Marks, Kevin Ravo, Lorinda Badalian, Zekarias Bekele, Nawatt Silawan, Lee Stogner, Anna Stukas, Jerry Dikun, Zahid Najam, Jitendra Kulkarni, Joseph Wei, Avery Lu, Lenny Richiuso, Reginald Little, Rachel Moore, Donal Leech, Jacob Lerenius, Philip Catherwood and Tom Coughlin
Table of Contents Table of Contents ............................................................................................................................................ 1 Table of Figures ............................................................................................................................................... 1 Executive Summary ........................................................................................................................................ 2 Introduction .................................................................................................................................................... 3 Definition of the Problem ............................................................................................................................... 3
A Moore’s Law for Mobile Energy—Defining the Problem ........................................................................ 3 Normal Use of a Mobile Phone .................................................................................................................. 3 Other Consumer User Considerations ....................................................................................................... 5 Consumer Product Environmental Requirements ..................................................................................... 6
Safety and Sustainability ................................................................................................................................. 9 Allowable Solutions ...................................................................................................................................... 10
Battery Technology .................................................................................................................................. 11 Charging Circuit ........................................................................................................................................ 13 Battery Safety .......................................................................................................................................... 15 Energy Generation ................................................................................................................................... 18 Energy Harvesting .................................................................................................................................... 20 Wireless Power ........................................................................................................................................ 22 Green Software Development ................................................................................................................. 24
Business Feasibility and The Future .............................................................................................................. 27
Table of Figures Figure 1. Energy Storage Capacitive Potential ............................................................................................. 12 Figure 2. The Periodic Figure for Batteries .................................................................................................. 12 Figure 3. Basic Battery System ..................................................................................................................... 13 Figure 4. The Charging System ..................................................................................................................... 13 Figure 5. USB Charging System .................................................................................................................... 14 Figure 6. ABC News Report on Cell Phone Fire Hazard ................................................................................ 15 Figure 7. Lithium-‐ion Battery Discharge Curves Versus Temperature ......................................................... 17 Figure 8. Lithium-‐ion Battery Storage Characteristics ................................................................................. 17 Figure 9. Lithium-‐ion Battery Discharge Curves Versus Temperature and Capacity/Ah ............................. 18 Figure 10. External Fuel Cell Charger Technology ........................................................................................ 19 Figure 11. 2008 Prototype of a Phone with an Internal Fuel Cell ................................................................ 19 Figure 12. Theoretical Energy Density of Several Fuel Cell Fuels ................................................................. 20 Figure 13. Energy Harvesting Sources and Their Relative Power Sourcing Availability (Courtesy of Nikkei
Publishing) ........................................................................................................................................... 21 Figure 14. Potential Energy Harvesting Sources in the ................................................................................. 21 Figure 15. Calculating Fco ............................................................................................................................. 22

2
Figure 16. Recovery of RF Energy to an Output Load Block Diagram ........................................................... 22 Figure 17. Toyota Magnetic Resonance Example (Courtesy of Toyota Motors Inc.) .................................... 23 Figure 18. WiTricity Wireless Power Demonstration ................................................................................... 24 Figure 19. Energy required to play a MB of Music in Music Players ............................................................. 25 Figure 20. SEPIA GUI .................................................................................................................................... 25 Figure 21. Energy Bug-‐fixing using SEPIA ..................................................................................................... 26 Figure 22: Energy Consumption in Background Activities ............................................................................ 27 Figure 23. Rough Process for Invention and Design and Product Ramp ...................................................... 29 Figure 24. Elements in Finished Product Total Costs ................................................................................... 29 Figure 25. Example of Reduction of Unit Cost with Production ................................................................... 30 List of Tables Table 1. Rated and Actual Energy Use and Battery Energy Storage for Conventional Smart Phones ........... 4 Table 2. Galaxy S4 Mobile Phone Specifications ............................................................................................ 5 Table 3. Basic Strength Tests of Products-‐1 ................................................................................................... 7 Table 4. Basic Strength Tests of Products-‐2 ................................................................................................... 7 Table 5. Important Characteristics for Mobile Consumer Electronic Devices ............................................... 8 Table 6. Typical Li-‐ion Battery Cell Specifications ........................................................................................ 16 Table 7. Most Common Energy Harvesting Sources .................................................................................... 20 Table 8. Manufacturing Bill of Materials for a Smart Phone and Tablet ...................................................... 27
Executive Summary Conventional batteries in mobile devices, such as smart mobile phones, have limited energy that does not meet the needs of many users. We believe that there is demand for an energy source that can supply more mobile power for a longer period of time between recharges from a fixed power source. There is considerable research on-‐going to create higher capacity energy sources for mobile devices, but to meet the anticipated needs of power and even casual smart phone users, especially for several days of use, considerable advancements in mobile power technology are needed. Battery technology is advancing at a gradual rate, estimated as roughly doubling in energy density with every decade in time. Based upon this estimate for battery energy density growth, it will take decades to develop a battery that can supply enough energy to power a smart phone for a week’s worth of “normal” use. In order to accelerate this development we need something like a “Moore’s Law for Mobile Energy.” The IEEE Consumer Electronics Future Directions Committee wishes to engage with the business and technical community to create an initiative to develop energy sources for mobile devices (e.g. smart phones) that can enable a week’s worth of “normal” energy use without recharging from proximity to a fixed power source. We envision that this may result from the use of one or more of several technologies. These technologies include energy storage (like modern batteries or perhaps something else), energy generation (e.g. fuel cells), energy harvesting or non-‐proximity wireless power. We would also encourage judicious use of stored or harvested energy through energy aware development of mobile applications and software management. This white paper outlines our objectives and looks at the current state of various technology alternatives. We also look at safety, sustainability and business aspects for creating a mobile power technology that can be used inside a mobile device, is safe for consumers and the environment, and can be manufactured for a cost within the means of normal consumers. We believe that the IEEE should engage with like-‐minded groups, such as the X-‐Prize foundation, to make

3
and promote initiatives that may help us to achieve these objectives within a short period of time. Providing a longer powered mobile device technology will have enormous implications for the implementation of mobile device applications and the empowerment of human beings throughout the world.
Introduction Although popular mobile devices use energy storage devices (batteries) as their power source, battery technology for consumer mobile applications has not changed much since mobile phones were introduced to mainstream consumers in the 1990’s. Advances in mobile battery technology are much slower than increases in processing power, network speeds and digital storage technology. This slower technological development in mobile power technology is limiting the application of many new and potentially revolutionary applications. Mobile device power is in need of its own version of something like “Moore’s Law.” We are currently at the dawn of the set of technologies and applications commonly known as the Internet of Things (IoT). Advances in novel battery technologies will enhance the IoT by enabling in a plethora of new applications. Features that utilize ‘always ON,’ enabled by higher energy mobile power sources, will revolutionize the IoT’s ability to interact with its surroundings and provide a virtual extension of human knowledge and influence in ways we do not yet fully appreciate. Likewise the availability of more mobile device power would enable the operation of additional hardware such as multiple radios in simultaneous use and wide-‐spread use of technologies such as micro-‐projectors in common mobile devices. This document will define the problem of power to support mobile applications, discuss requirements for safety and sustainability, look more closely at the candidate technologies and finally look at various factors in cost and manufacturability of the solution.
Definition of the Problem
A Moore’s Law for Mobile Energy—Defining the Problem In this section of the white paper we will estimate the power requirements for mobile devices during normal consumer and business use and project how much energy these devices would require for a week’s worth of “normal” use. Here “normal” is defined as a reasonable use of common applications, over the course of 7 days, on a mobile phone, by a single user. We will look at the current state of the art for various energy sources that could be used by mobile devices.
Normal Use of a Mobile Phone There are a few ways to estimate the required energy for a week’s worth of activity. One approach is to look at the current energy stored in a phone and make an estimate based off that number about how much energy is needed for a week. Another approach is to make estimates of actual energy used for various discrete operations and then calculate how much time and thus energy is spent on these operations in the course of a regular day1. Of course we also need to take into account that the cell phone might have more use during weekdays than weekends. However all of these estimates depend upon some knowledge of user patterns that may not cover all individuals.
1P. Perrucci, F.H. P. Fitzek and J. Widmer, Survey on Energy Consumption Entities on the Smartphone Platform, Vehicular Technology Conference (VTC Spring), 2011 IEEE 73rd

4
Let’s look at the energy in the batteries of conventional smart cell phones. Table 1 shows examples of present day mobile smart phone products, their current consumption and their estimated run time on the installed battery. Item 5 seems to be an outlier on actual run time. Item 5 is a cell phone with a much higher battery capacity, which is always a potential solution although with conventional technology it adds cost, size and weight. All these devices tout being able to “run” for thirty -‐ forty hours but in reality, the battery charge tends to run out in two to eight hours, depending on use. There are many factors for this, including the applications being used as well as the usage environment and features enabled at a given point in time. In addition to the applications explicitly in use, several services run in the background consuming power. Analyzing energy consumption of mobile software with its applications and background services yields many opportunities for energy conservation and is discussed further in the section on Green Software Development. Table 1. Rated and Actual Energy Use and Battery Energy Storage for Conventional
Smart Phones
Product Name Mfg. Standby Vendor Reported Run Time
Actual Run Time *1
Installed Battery
1 HTC Dream 406 h 5h 20 min 2 ~ 3.5 h Li-‐Ion 1500 mAh 2 Google Nexus One 290 h 7h 3.5 ~ 5.5 h Li-‐Ion 1400 mAh 3 Apple IPhone 5 225 h 8h 3 ~ 5 h Li-‐Po 1440 mAh 4 Samsung Galaxy 5 375 h 6.45 h 2.5 ~ 4.5 h 2800 mAh 5 Nokia Lumen 1520 32 days 24 h 9 ~ 10.8h 3400 mAh *2
The goal of the Safe Advanced Mobile Power Solution would be a system that allows the product to operate with a run time of seven days between a full recharge cycle, meaning plugging the device into the wall or extracting power from a hard wired inductive wireless charging source. In addition, the product should not require charging by an external battery device during this period. In order to make some calculations on the amount of energy that is required for a week’s use let us look at a casual and power cell phone user. The casual user might get 5 hours of use with a 1,400 mAh (1.4 Ah) battery. If this was consistent across 7 days the total energy requirement is 7 X 1.4 Ah or 9.8 Ah. Assuming this is a 3.7 V device then the actual energy used is 9.8 Ah X 3.7 V = 36.3 Wh or 130,536 Joules. On the other hand a power user might want 12 hours of intense use with lots of radios running (Blue Tooth, WiFi, GPS and NFC), downloading lots of data and watching movies. This user may consumer 1,400 mAh (1.4 Ah) in only 3 hours and actually want to consume 4 times more power in the day or 4 X 1.4 Ah = 5.6 Ah. If this is a 3.7 V device the energy required for one day would be 5.6 Ah X 3.7V = 20.7 Wh. A 7 day energy requirement for such a user would then be 7X20.7Wh = 145Wh = 522,144 Joules. Today’s cell phone batteries typically have about 1,400 mAh = 1.4Ah of power or 1.4 Ah X 3.7 V = 5.2 Wh of power. Based upon our calculations a casual phone user may need about 7 X more energy for a full week while a power user may need about 28 X more energy that these batteries. Thus the required energy for a weeks cell phone use could range from about 36.3 Wh (130,536 Joules) to 145 Wh (522,144 Joules). This is well beyond the capability of conventional batteries used in cell phones. In order to create an energy source that can meet these challenging requirements we will need to go beyond the capabilities of currently used technologies in mobile devices.

5
Note that some mobile devices (such as headsets) are moving from 3 V to 1.5 V and will likely go under 1 V (in fact, there is some testing with products at 850 mV). However current mobile phones require a higher power level.
Other Consumer User Considerations Table 2 gives specifications for a popular cell phone, a Galaxy S4 with LT+ with 5 inch super AMOLED capacitive touch screen. This table gives an idea of the complexity and capabilities of modern smart phones.
Table 2. Galaxy S4 Mobile Phone Specifications
Network 2G GSM 850/900/1800/1900-‐19506 3G HSDPA 850/900/1900/2100-‐19506
HSDPA 1900/2100-‐SHV-‐E330S 4G LTE 800/850/900/1800/2100/2600-‐19506
LTE 850/1800-‐SHV-‐E330S SIM Micro SIM Year Announced
2013 Q3
Body 5.38x2.75x0.31in Weight 130g (4.59oz) Display Type Supper AMOLED Capacitive Touch, 16M Colors Size 1080x1920 Pixels (HD), 5.0 in (Density 441 ppi) Touch Capacitive – Multi-‐touch Display
Protection Corning Gorilla Glass 3
Sound Vibration, Loudspeaker, 3.5mm Jack Memory Card –
Optional Micro SD <=64GB
Internal 16/32GB, 2GB RAM DATA GPRS Yes GPS Yes with A-‐GPS, GLONASS EDGE Yes Speed HSDPA, 42.2Mbps; HSUPA, 5.76Mbps; LTE, Cat4, 50Mbps WLAN 802.11 a/b/g/n/ac, dual band, Wi-‐Fi Direct, DLNA, Hotspot BT V4.0, A2DP, EDR, LE NFC Yes IR Port Yes USB Micro USB2.0/OTG/USB Host Camera Primary 13MP 4128x3096/AF/LED FLASH Sec 2MP 1080P30, dual Video Call Chipset Qualcomm MSM8974 Snapdragon 800 OS Android OS V4.2.2 GPU Adreno 330 Sensors Accelerometer/Gyro/Proximity/Compass/Barometer/Temperature/Humidity/
Gesture Battery Li-‐Ion 2600Mah Stand-‐By 2G/up to 370h (3G) Talk Time (2G)/up to 17hr (3G) Music Paly Up to 62 Hrs

6
Consumer Product Environmental Requirements Consumer electronic products have become extremely complex: cellphones and tablets receive considerable abuse during their lifespan that can be characterized as follows:
• Bumps & shocks in transportation and use • Drops as loose cargo or human negligence in handling • Drop impact with no addition buffer protection • High humidity • Excessive moisture (wet through clothing) or water drops • Surface scratches • Point impact on screen and damage to the display or electronics • Sharp objects with point of impact into the enclosure
Protection against exposure to high humidity or water is very dependent upon the design of the external casing. Given that the wet environment can damage or destroy electronic components, more and more manufactures are starting to provide products such as cell phones or tablets with adequate protection by providing special seals or construction and use of different materials that can withstand the day to day normal use and exposure to the elements. With respect to vibration and damage due to accidental drop impact for the product, the International Electrotechnical Commission, known as IEC, provides basic requirements for shock tests. Most consumer products are tested per the IEC standard to meet basic functional criteria, but as the products get more complex, it’s also the method by which the design teams can learn how their product behaves in terms of design and have a comparison compared to similar competitor products. A good example is the removable battery in cell phones that may get dislodged on drop impact as these are generally held in place by few spring-‐loaded contacts behind an enclosure lid. The battery can be damaged or can cause damage if shorted, charged/discharged rapidly, cut, punctured or exposed to conditions other than described in Table 3 and Table 4 from the EIC. IEC and UL standards are there to ensure that the product meets the minimal safety requirements.

7
Table 3. Basic Strength Tests of Products-‐1
Table 4. Basic Strength Tests of Products-‐2
Under certain vibration or impact conditions, the electronic parts, PCB, or contacts can be damaged. In the case where the connections or power are intermittent or the parts break down or short, the product will become virtually unusable or dangerous. It’s these conditions that IEC & UL standards are designed to replicate so the product can go through rigorous user tests before launched into the market. These tests are commonly used to test the products durability of bumps and vibrations over the 3 axis that are encountered in most day to day use situations.

8
Following are common vibration tests2: Frequency range: 1 to 2000 Hz (bare table) Sine wave Max force output: 5000Kgf (11023 lbs.) Max displacement: 80mm Max velocity: 78 in/s (2 m/sec) Max acceleration: 77g Vertical table: 40*40/cm, 70*70/cm, 150*150/cm Horizontal slip table: 70*70/cm, 150*150/cm Digital vibration controller 8CH
Mechanical Shock Test Max acceleration: 600g Shock table: 115 (W)*115(D)/cm Pulse shape: Half-‐sine and trapezoidal wave Pulse duration: 0.1 ms to 65 ms
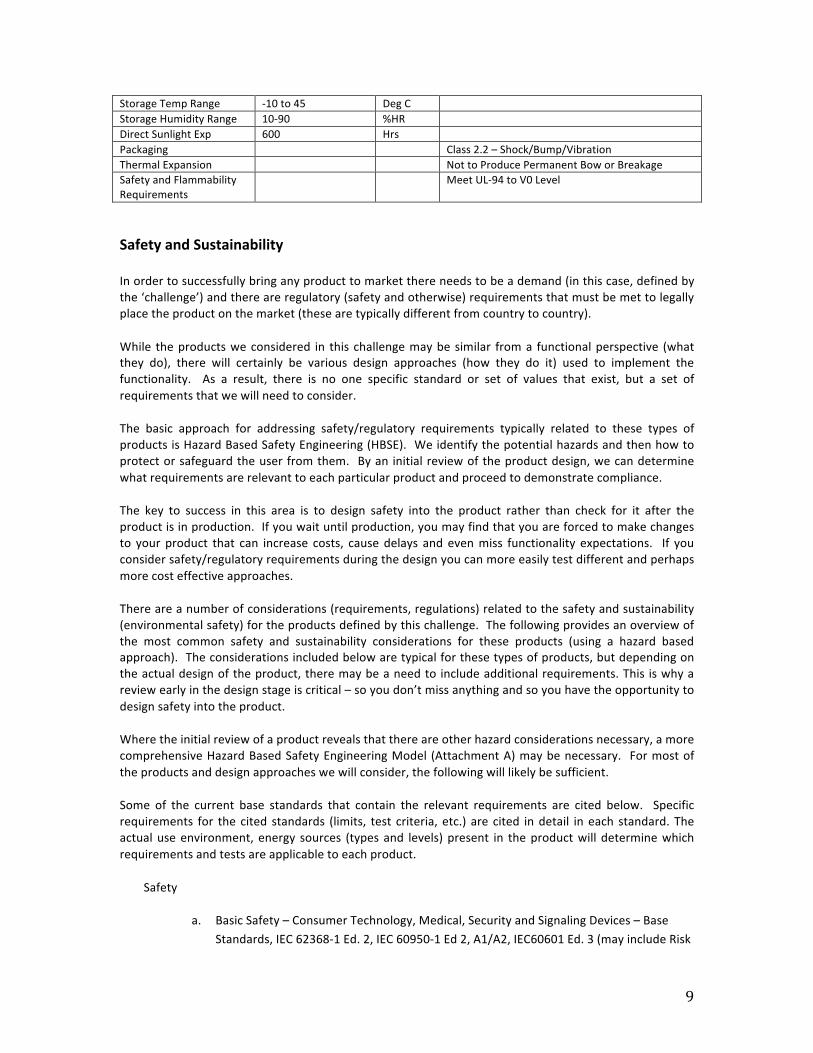
Non-‐operating temperatures in phones can be in the range of -‐20 degrees to 45 degrees C. Operating temperatures are generally in the range of 0 to 35 degrees C. Relative humidity should be in the range of 5% to 95% noncondensing. Maximum operating altitude is 3,000 m. Some other important characteristics and product requirements for mobile consumer electronics devices are shown in Table 5.
Table 5. Important Characteristics for Mobile Consumer Electronic Devices
Condition Requirement Units Comment Product Life Time 3 Years Consumer Environment Operating Temperature Normal Use
0-‐40 Dec C In Doors
Short Term Operating Temp
40-‐60 Dec C Use on Beach or in Car in Hot Climate
Min/MAX Operating Humidity
15-‐80 %RH
Display Window Hardness =2 H Dimensions X,Y,C Product Dimensions Texture Product Texture Display Resolution/Screen Size Weight G Twist Bend Points Screen Transitiveness % Back Light to View Brightness Display Brightness L Related to Back Light and Control Finger Touch and Resolution
Static/Dynamic/Linear/Accuracy/Resolution/Multi-‐touch/Response Time
Surface Anti-‐Glare/Gloss/Matt Power Consumption Target User Models But Also Includes Stand-‐by Reliability Not-‐in Use – Class 1.1 Weather Protected, Partly Temperate Controlled
(Represents Home/Office Conditions) In-‐Use – Class 7.3E Partly Weather Protected and Partly Use in Non-‐
weather Protected (Indoor/Outdoor Usage)
2 Source—Integrated Service Technology
9
Storage Temp Range -‐10 to 45 Deg C Storage Humidity Range 10-‐90 %HR Direct Sunlight Exp 600 Hrs Packaging Class 2.2 – Shock/Bump/Vibration Thermal Expansion Not to Produce Permanent Bow or Breakage Safety and Flammability Requirements
Meet UL-‐94 to V0 Level
Safety and Sustainability In order to successfully bring any product to market there needs to be a demand (in this case, defined by the ‘challenge’) and there are regulatory (safety and otherwise) requirements that must be met to legally place the product on the market (these are typically different from country to country).
While the products we considered in this challenge may be similar from a functional perspective (what they do), there will certainly be various design approaches (how they do it) used to implement the functionality. As a result, there is no one specific standard or set of values that exist, but a set of requirements that we will need to consider.
The basic approach for addressing safety/regulatory requirements typically related to these types of products is Hazard Based Safety Engineering (HBSE). We identify the potential hazards and then how to protect or safeguard the user from them. By an initial review of the product design, we can determine what requirements are relevant to each particular product and proceed to demonstrate compliance.
The key to success in this area is to design safety into the product rather than check for it after the product is in production. If you wait until production, you may find that you are forced to make changes to your product that can increase costs, cause delays and even miss functionality expectations. If you consider safety/regulatory requirements during the design you can more easily test different and perhaps more cost effective approaches.
There are a number of considerations (requirements, regulations) related to the safety and sustainability (environmental safety) for the products defined by this challenge. The following provides an overview of the most common safety and sustainability considerations for these products (using a hazard based approach). The considerations included below are typical for these types of products, but depending on the actual design of the product, there may be a need to include additional requirements. This is why a review early in the design stage is critical – so you don’t miss anything and so you have the opportunity to design safety into the product.
Where the initial review of a product reveals that there are other hazard considerations necessary, a more comprehensive Hazard Based Safety Engineering Model (Attachment A) may be necessary. For most of the products and design approaches we will consider, the following will likely be sufficient.
Some of the current base standards that contain the relevant requirements are cited below. Specific requirements for the cited standards (limits, test criteria, etc.) are cited in detail in each standard. The actual use environment, energy sources (types and levels) present in the product will determine which requirements and tests are applicable to each product.
Safety
a. Basic Safety – Consumer Technology, Medical, Security and Signaling Devices – Base Standards, IEC 62368-‐1 Ed. 2, IEC 60950-‐1 Ed 2, A1/A2, IEC60601 Ed. 3 (may include Risk

10
Management) and others, addressing: i. Energy Sources ii. Electrically Caused Injury iii. Electrically Caused Fire iv. Hazardous Substances v. Mechanical Injury vi. Thermal Burn vii. Radiation viii. Functional Safety
b. Battery – Primary and Secondary – IEC60086, IEC61960, IEC62133, UL1642, UL2054 c. Optical Radiation – Lasers and LEDs – IEC60825-‐1, IEC62471, FDA 21 CFR 1010 and 1040 d. Medical – Software – IEC 62304; Quality Systems –ISO13485 e. RF Exposure – Specific Absorption Rate (SAR) – IEC 62209-‐1, IEC 62209-‐2, IEEE 1528
Other Requirements
f. Electro Magnetic Compatibility (EMC) – Federal Communication Commission (FCC), Industry Canada (IC) and European Union (EU) EMC Directive, etc.
g. Wireless Regulatory – FCC, IC, EU Radio and Telecommunication Terminal Equipment (R&TTE) Directive, etc.
h. Wireless Interoperability – Bluetooth Certification, WiFi Alliance, etc. i. Sustainability – Impact on environment during product life cycle j. Responsible Sourcing – Deals with human rights, working conditions/hours, social
auditing, supply chain risk management, etc. k. Chemicals – Restriction of Hazardous Substances (RoHS); Waste Electrical and Electronic
Equipment Directive (WEEE); Registration, Evaluation, Authorization and Restriction of Chemicals (REACH); Polycyclic Aromatic Hydrocarbon (PAH), Mercury, Cadmium & Lead Content; Nickel Release, etc.
The actual requirements related to the above exist in a variety of published documents that are controlled by copyright. There are a number of sources from which these documents can be obtained, including the organizations responsible for publication of the documents. The first step then is to obtain the standards that are appropriate to your particular product.
Demonstrating compliance to the relevant requirements is necessary to obtain the certifications/approvals to actually place your product on the market. It should be noted that in many cases specialized skills and test equipment may be necessary to carry out the related testing and you may want/need to contract this work out to a suitably accredited laboratory.
Once you have demonstrated compliance to the relevant requirements for your product and have the necessary certifications and approvals you are much closer to being ready to bring your product to market.
Allowable Solutions A prior section of this white paper discussed use requirements for this advanced mobile power source. This section will analyze the technologies available and specify which of these technologies are allowable in the challenge specified in this white paper (one week of “normal” use without charging from

11
a “fixed” power source. The winning technology in this challenge would meet all the requirements specified in the various sections of this white paper.
The advanced mobile energy source can be any technology that doesn’t require direct connection or close proximity to a “fixed” power source. This includes plugging the mobile device into wall outlets for charging or inductive charging of the mobile device requiring the device to be kept very close to a fixed location inductive charging source. Note that the allowable technologies could be used individually, or in combination, to achieve the usage definition as long as other requirements, such as safety and manufacturability at the target price range, can be met.
Possible technologies that could be used are:
1) Longer life, higher energy batteries (power storage devices) 2) Other energy storage devices such as super-‐capacitors, nano-‐flywheels, etc. 3) Energy generating technologies such as fuel cells 4) Energy harvesting from the local environment such as solar energy, RF harvesting or user generated energy 5) Wireless power that doesn’t require keeping the mobile device in close proximity to the power source 6) Any other means for providing energy needed by the mobile device that doesn’t require attachment or proximity to a fixed location energy source.
We will next look at each of these approaches to get some idea of what may be possible with each. Also note that the actual solution for providing a week’s power to a mobile device might actually utilize more than one of these approaches. This is fine as long as the energy, safety, sustainability, size and cost constraints can be met.
Battery Technology Battery technology development today does not follow Moore’s law. Battery performance and price have not improved at the same rate as the semiconductor’s price/performance ratio. Battery performance has only marginally improved over decades. Some estimates are that battery energy density has been doubling every 10 years, versus a doubling of the number of transistors per chip every 18 months in Moore’s law. For developing innovative advanced and disruptive applications to emerge in mobile devices, a 20X or more improvement in mobile energy is essential. With a doubling every 10 years in battery energy density this would require more than 50 years of technical development at the current development trend! This is far too long to wait for the IoT and the personal mobile technology of the future. Figure 13 shows a comparison of various approaches for the storage of energy for later use in terms of the total energy storage potential of the technology as well as discharge time. This figure includes physical energy storage methods such as pumped hydraulic energy storage and compressed air as well as a variety of battery technologies now in use or in development. Many of these approaches are not easily implemented in the space available in a cell phone.
3Energy Storage Association Chart

12
Figure 1. Energy Storage Capacitive Potential
Infrastructure requirements for a new battery ecosystem; availability of materials for extraction, ease of production, life cycle considerations, storage verses weight ratio, environmental sustainability, acceptable cost and risk management during storage, operations and transfer of energy are important factors in the development of higher density energy storage technologies. These are a few of the critical issues that need to be addressed before one of these power storage technologies can become part of an acceptable and successful mainstream consumer application. Historical battery research has been based upon material characteristics established over a number of years as documented in Figure 2. Current battery research demonstrates that higher energy are available for future batteries.
Figure 2. The Periodic Figure for Batteries

13
Traditional batteries are composed of the following elements: The self-‐contained battery system itself, Figure 3. Basic Battery System
Charging Circuit Figure 4 shows a basic low cost linear charging circuit where the external source provides the charging current and power to the processor’s power management circuitry, when connected to an external adaptor.
Figure 4. The Charging System
Given the circuit’s simplicity, this charger is not very efficient. The wasted energy (difference between the product of the difference between the adapter voltage of the charging integrate circuit (IC) to the battery terminal voltage (delta V) and the current flow (A) from the external adaptor) will heat-‐up the charger IC while it also powering the processor and during the battery charging.

14
As the charging path is shared with both the battery and the processor’s power management’s input, there may be a delay in powering the electronics from a totally discharged cell. The charging cell voltage would have to reach a predetermined level to power up the processor safely. 4.
Figure 3. Basic Battery System
Charging Circuit Figure 4 shows a basic low cost linear charging circuit where the external source provides the charging current and power to the processor’s power management circuitry, when connected to an external adaptor.
4 Image from LG Inc.

15
Figure 4. The Charging System5
Given the circuit’s simplicity, this charger is not very efficient. The wasted energy (difference between the product of the difference between the adapter voltage of the charging integrate circuit (IC) to the battery terminal voltage (delta V) and the current flow (A) from the external adaptor) will heat-‐up the charger IC while it also powering the processor and during the battery charging. As the charging path is shared with both the battery and the processor’s power management’s input, there may be a delay in powering the electronics from a totally discharged cell. The charging cell voltage would have to reach a predetermined level to power up the processor safely. Figure 5 shows a circuit that, although a bit more costly, provides separate pathways for the external adaptor to the battery (for charging) and power for the processor. By providing separate paths from the external source, the processor can be powered immediately, even with a dead battery that will charge slowly until the cell voltage reaches a determined voltage (V). At that point the battery can be connected to the supply path.
5 From Microchip

16
Figure 5. USB Charging System6
The external MOSFET Switch in Figure 5 also helps reduce power loss when the battery powers the processor. The switch internal to the IC as an alternative path if cost or board real estate prohibits using external MOSFET switch Most charger IC’s follow the industry standard based on specific cell chemistry and cell origination. Equally, the efficiency of the charger IC can be improved by the use of switched power supply circuitry in the charger circuit. The cost of this approach is higher due to an added inductor and other discrete parts.
Battery Safety For consumers, increased battery life is a priority. High energy density batteries are desired by most users. Today’s mobile phone battery cells are constructed with non-‐metallic Lithium batteries that utilize Lithium ions. This is much safer than the first cells, which were constructed with inherently unstable lithium metal. Monitoring temperatures during a controlled charging and discharging cycle allows better control of the energy flow and thus safer batteries. Additionally, the cells contain safety circuits that avoid overcharge and undercharge, and short circuit protection in case the terminals are shorted With such high energy stored in a small volume, the manufactures are always looking to improve the safety of the cells. This largely depends on construction and avoidance of contamination that could potentially cause short circuits. However, even with controlled manufacturing and embedded safety
6 Linear Technology LTC 4085 USB Power Manager

17
circuits, there have been reported cases of fires or meltdowns such as the case covered by ABC News where a cell phone burned a hole in a girl’s bed due to overheating—see Figure 6.
Figure 6. ABC News Report on Cell Phone Fire Hazard
Lithium-‐ion cells offer twice the energy density of nickel-‐based cells, and four times the energy density than lead cells. Battery manufacturing processes become more critical to make safer product in order to avoid devastating consequences. In fact one of the older tests: using a nail to penetrate the cell, causing the cell to short circuit, is no longer applied to cells that have higher energy density than 1300mAH as the test would cause an explosion with a fully charged cell. Today the consumer electronics industry requires the cells to meet safety standards such as the UL 1642. Table 6 shows a typical Li-‐Ion cell’s specifications and the safety standards that it must pass for use in
consumer products.
Table 6. Typical Li-‐ion Battery Cell Specifications
Item Specifications Capacity 1800mHA Impedance <180mohm Dimensions 4.8mmx50mmx67mm max Weight 50g Maximum Charge Voltage (V) 4.28V Maximum Charge Current (I) 1CmA Minimum Discharge Voltage (V) 3.0V Maximum Discharge Current (I) 1CmA Charge Temperature 0deg C to +45deg C Discharge Temperature -‐20 deg C to +60deg C Storage Temperature -‐5 C to 25+-‐5C Storage Humidity <=75% RH Charge Voltage 4.2V
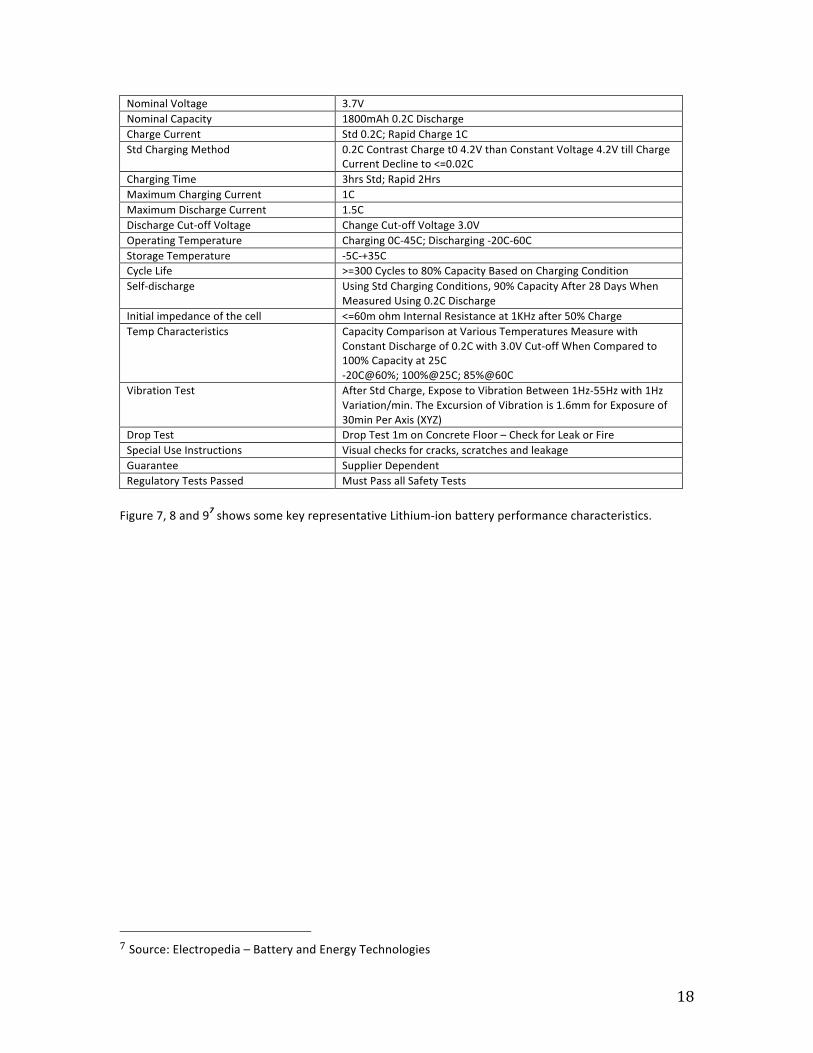
18
Nominal Voltage 3.7V Nominal Capacity 1800mAh 0.2C Discharge Charge Current Std 0.2C; Rapid Charge 1C Std Charging Method 0.2C Contrast Charge t0 4.2V than Constant Voltage 4.2V till Charge
Current Decline to <=0.02C Charging Time 3hrs Std; Rapid 2Hrs Maximum Charging Current 1C Maximum Discharge Current 1.5C Discharge Cut-‐off Voltage Change Cut-‐off Voltage 3.0V Operating Temperature Charging 0C-‐45C; Discharging -‐20C-‐60C Storage Temperature -‐5C-‐+35C Cycle Life >=300 Cycles to 80% Capacity Based on Charging Condition Self-‐discharge Using Std Charging Conditions, 90% Capacity After 28 Days When
Measured Using 0.2C Discharge Initial impedance of the cell <=60m ohm Internal Resistance at 1KHz after 50% Charge Temp Characteristics Capacity Comparison at Various Temperatures Measure with
Constant Discharge of 0.2C with 3.0V Cut-‐off When Compared to 100% Capacity at 25C -‐20C@60%; 100%@25C; 85%@60C
Vibration Test After Std Charge, Expose to Vibration Between 1Hz-‐55Hz with 1Hz Variation/min. The Excursion of Vibration is 1.6mm for Exposure of 30min Per Axis (XYZ)
Drop Test Drop Test 1m on Concrete Floor – Check for Leak or Fire Special Use Instructions Visual checks for cracks, scratches and leakage Guarantee Supplier Dependent Regulatory Tests Passed Must Pass all Safety Tests
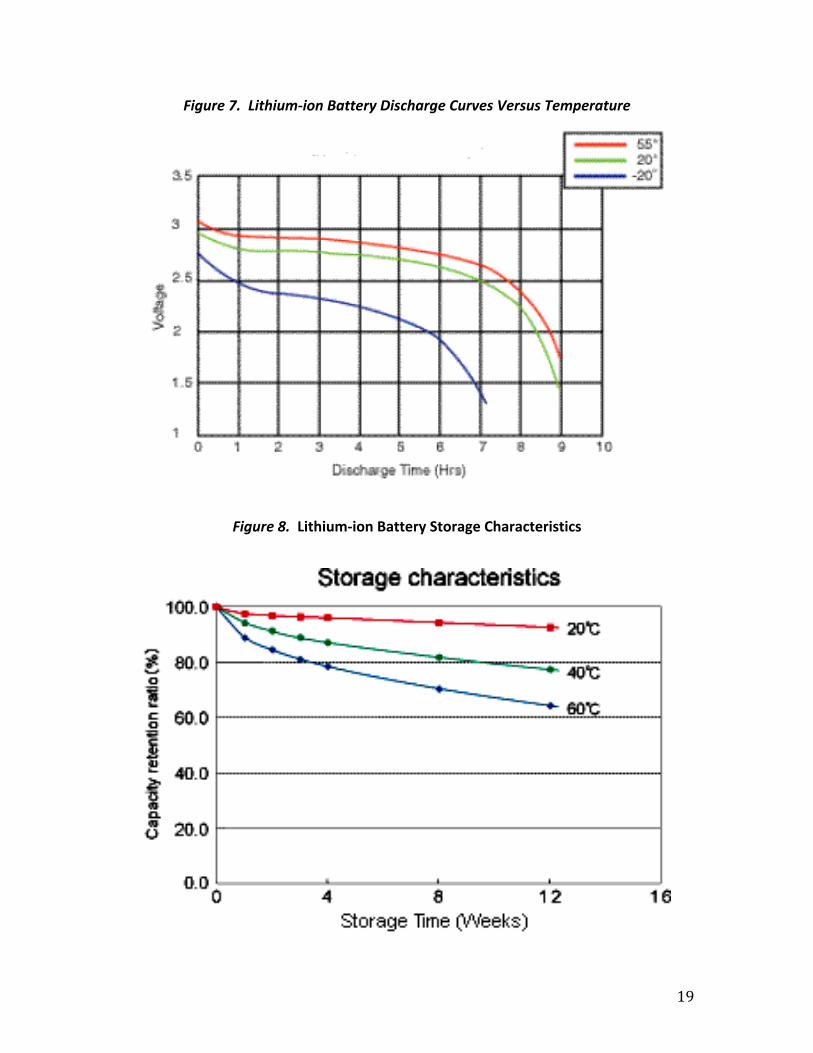
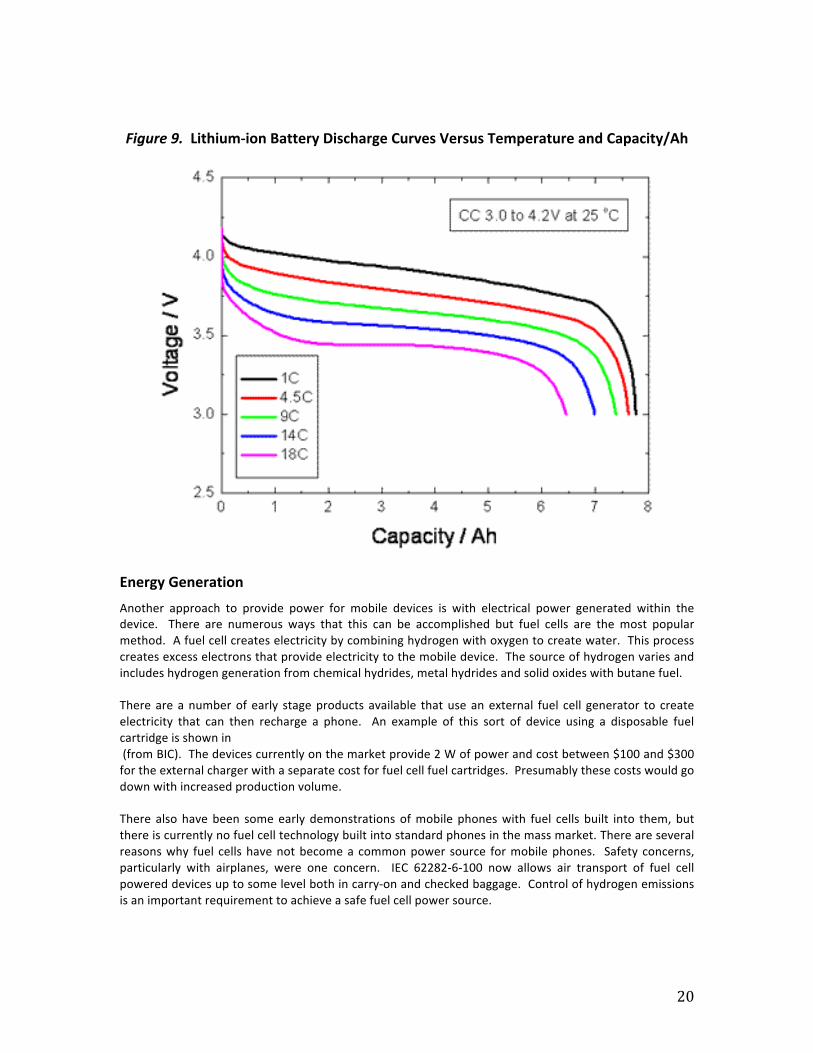
Figure 7, 8 and 97 shows some key representative Lithium-‐ion battery performance characteristics.
7 Source: Electropedia – Battery and Energy Technologies
19
Figure 7. Lithium-‐ion Battery Discharge Curves Versus Temperature
Figure 8. Lithium-‐ion Battery Storage Characteristics
20
Figure 9. Lithium-‐ion Battery Discharge Curves Versus Temperature and Capacity/Ah
Energy Generation Another approach to provide power for mobile devices is with electrical power generated within the device. There are numerous ways that this can be accomplished but fuel cells are the most popular method. A fuel cell creates electricity by combining hydrogen with oxygen to create water. This process creates excess electrons that provide electricity to the mobile device. The source of hydrogen varies and includes hydrogen generation from chemical hydrides, metal hydrides and solid oxides with butane fuel. There are a number of early stage products available that use an external fuel cell generator to create electricity that can then recharge a phone. An example of this sort of device using a disposable fuel cartridge is shown in (from BIC). The devices currently on the market provide 2 W of power and cost between $100 and $300 for the external charger with a separate cost for fuel cell fuel cartridges. Presumably these costs would go down with increased production volume. There also have been some early demonstrations of mobile phones with fuel cells built into them, but there is currently no fuel cell technology built into standard phones in the mass market. There are several reasons why fuel cells have not become a common power source for mobile phones. Safety concerns, particularly with airplanes, were one concern. IEC 62282-‐6-‐100 now allows air transport of fuel cell powered devices up to some level both in carry-‐on and checked baggage. Control of hydrogen emissions is an important requirement to achieve a safe fuel cell power source.
21
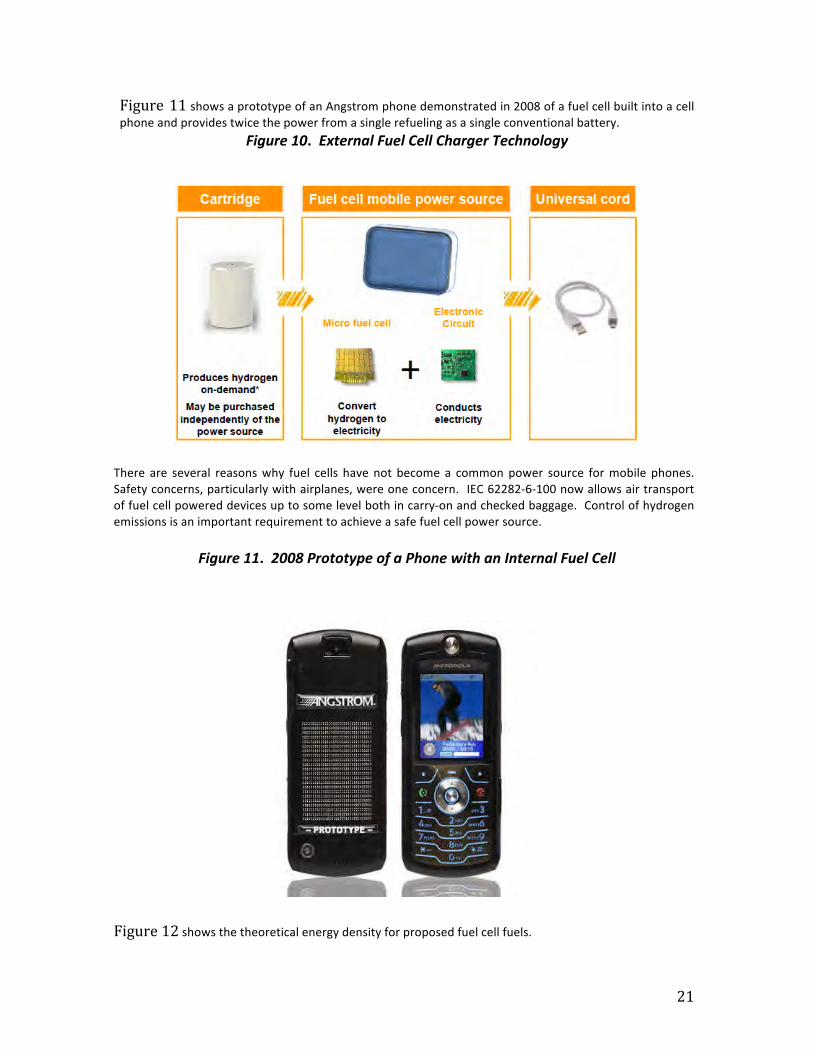
Figure 11 shows a prototype of an Angstrom phone demonstrated in 2008 of a fuel cell built into a cell phone and provides twice the power from a single refueling as a single conventional battery.
Figure 10. External Fuel Cell Charger Technology
There are several reasons why fuel cells have not become a common power source for mobile phones. Safety concerns, particularly with airplanes, were one concern. IEC 62282-‐6-‐100 now allows air transport of fuel cell powered devices up to some level both in carry-‐on and checked baggage. Control of hydrogen emissions is an important requirement to achieve a safe fuel cell power source.
Figure 11. 2008 Prototype of a Phone with an Internal Fuel Cell
Figure 12 shows the theoretical energy density for proposed fuel cell fuels.

22
Figure 12. Theoretical Energy Density of Several Fuel Cell Fuels
The actual power generated by a fuel cell depends upon both the conversion efficiency as well as the overall efficiency of the rest of the power plant. There is a potential for a four times spread in net energy density for the sale fuel with different fuel cell technologies.
Energy Harvesting
Extracting energy from the ambient environment of the mobile device is energy harvesting. This energy may be energy generated by the movement of the phone user, power recovered by photovoltaic cells and energy recapture from RFID/NFC systems, power generated by differences in temperature and other ways to get useful power from the local environment. In Error! Reference source not found. we list some of the most common Energy Harvesting sources as they relate to mobile devices.
Table 7. Most Common Energy Harvesting Sources
Energy Source Technology Example Inductive Charging Power Mat, Qi Light (Solar) Optics Solar Cell, Infrared Optics, Fluorescent Optic Recovery RF Field Recovery Wireless Power, NFC, RFID, EM Field Recovery Magnetic Resonance Automotive Charging Stations, See Figure 7 Kinetic/Motion Currently Only Used with Vehicles, i.e. Brake Recovery
presents an x-‐y graph showing the relationship of power production to vibration frequency to show a comparative view of potential energy harvesting sources.

23
Figure 13. Energy Harvesting Sources and Their Relative Power Sourcing Availability (Courtesy of Nikkei Publishing)
Figure 14 shows potential energy harvesting sources for mobile applications.
Figure 14. Potential Energy Harvesting Sources in the Mobile Users Environment

24
Ambient electromagnetic radiation as a power source is an interesting approach for energy harvesting. Considering RF Energy harvesting or RF energy in the 535Khz ~ 80 Ghz range (encompassing AM/FM range, ISM, Automotive RADAR bands). The common approach to harvest this energy is as follows; RF energy is received by an Antenna with a Fco of that frequency as in Figure 15.
Figure 15. Calculating Fco
Then the RF energy of the Fco is received into the RF-‐to-‐DC conversion circuitry as shown in Figure 16. The resulting DC is condition or “cleaned” of spurious noise spikes before being allowed to pass to the load or battery storage device.
Figure 16. Recovery of RF Energy to an Output Load Block Diagram
Wireless Power
The particular technologies that we are looking at here are ways to project power into a device from a distance, rather than inductive charging and other ways to charge mobile devices that require close proximity to a fixed power source. The market for wireless power requiring close proximity to the energy source is growing rapidly. The market need is felt from three segments:
1. Devices the size of modern smart phones – close proximity inductive power is being deployed now.

25
2. Smaller devices e.g. wearables 3. Larger devices e.g. kitchen appliances
There are now three standards setting organizations in the close proximity charging market today:
1. Wireless Power Consortium, trade named Qi – deployed now 2. Rezence aka Alliance for Wireless Power, A4WP 3. NFC Forum, Wireless Charging Task Force
The first generation products use inductive coupling at frequencies of several MHz, including those harmonically related to NFC. There is need for modifying the systems so that they can adaptively scale power delivered. (Otherwise, devices get fried.) Additional needs for the proximity-‐based wireless power technology:
• Charge more than one device at a time. • Cross compatibility, or multi-‐protocol wireless charging. • More freedom: escaping from the charging mat.
Resources:
1. WPC: http://www.wirelesspowerconsortium.com 2. Rezence: http://www.rezence.com/ 3. NFC Forum: http://www.nfcforum.org/
Besides magnetic induction magnetic resonance is being looked at as a way to charge consumer products. Figure 17 shows magnetic resonance as a means for charging electric vehicles.
Figure 17. Toyota Magnetic Resonance Example (Courtesy of Toyota Motors Inc.)

26
In addition to the current generation of close proximity wireless power there are efforts going on to enable longer range wireless power. Companies such as WiTricity and Artemis are working on technologies that will enable wireless power transmission over significant distances. Figure 18 shows a demonstration of wireless power transmission by WiTricity.
Figure 18. WiTricity Wireless Power Demonstration
Green Software Development It is easy to squander the energy stored or harvested in a cell phone battery unless applications and services that run on the phone are developed with energy optimization in mind. Present method of application development prioritizes performance, responsiveness and features. Many times even the a sanity check for energy consumption is not performed. As a result, applications with similar functionality may differ widely in their energy footprint. This is illustrated in Figure 19, which compares energy footprints of popular music streaming applications using ‘Samsung Electronics Power Information Analyzer ( SEPIA)’ 8, which is an energy optimization tool targeted towards application developers and release engineers. The reference also cites other energy profiling tools that have been developed so far. Energy profiling tools differ from traditional performance oriented profilers in important ways. Many times, the performance profilers view the phone as a whole, which has many software components that application developers do not control and which are not monitored. A performance profiler monitors and reports activity in various parts of the mobile system, such as different elements in the CPU and GPU pipelines. This information is important for analyzing performance bottlenecks. However this activity does not directly translate into power usage since a more complex but less active part has the potential to consume more power than a more active but less complex part of the circuit. Energy profilers may monitor activity but they combine this activity with a power model to predict energy consumption.
8 K, Barde et. al., “SEPIA: A Framework for Optimizing Energy Consumption in Android Devices”, accepted for publication in the proceedings of the IEEE Consumer Communications and Networking Conference, Jan 2015.

27
Figure 19. Energy required to play a MB of Music in Music Players
SEPIA has fine-‐grained models for all the major power using components on a recent (Samsung Galaxy S4) Android smartphone. It offers several features useful to development and release engineers that allow them to automatically catch harmful behavior and trace it to lines in the source code. SEPIA also enables developer to inspect the energy footprint of their application in a GUI as shown in Error! Reference source not found.
Figure 20. SEPIA GUI

28
SEPIA enables developers to optionally instrument their application code in order to automatically catch energy bugs such as sockets not being closed and activity when applications are idle. Lastly, SEPIA can be scripted and made part of the build and release flow to ensure that an application consumes energy only as intended. An example of an energy bug caught by SEPIA is shown in Figure 21. This application had a metadata thread that synchronized with the server. It was observed that this synchronization was frequent even when idle and that its frequency was such that the radio would never go to its low power state. Once caught, the bug was easily fixed resulting in 30% savings in energy consumption.
Figure 21. Energy Bug-‐fixing using SEPIA
Another interesting fact that can be derived from tools such as SEPIA is that many times the energy is consumed in background activities such as advertisements, keeping websockets alive, sending heartbeats and periodic updates. Once such activities are identified using the tool, they can be either optimized out or performed in batches to optimize energy consumption. Error! Reference source not found. shows relative energy consumption of various activities in the S-‐Educate application, which is an annotation application over Khan Academy. Video streaming is the principal component of this application, however background tasks such as awarding points for watching video, authorization requests and menu synchronization was responsible for 80% of its energy consumption. Traditionally, it has been assumed that the operating system will make decisions about power consumption of the devices. However in energy constrained hand held computers such as mobile phones, energy profilers can offer vast improvements in energy efficiency since application developers have the additional contextual information of what is useful and what is not in their application. We have shown in this section that energy profilers are indeed effective in optimizing energy consumption of applications and should be used for mobile software development.

29
Figure 22: Energy Consumption in Background Activities
.
Business Feasibility and The Future In order for a power source to be used in a consumer mobile device, like a smart phone, it must also meet certain cost objectives. A successful power source that can go for a week without recharging from a static power source must cost in the range of current mobile device power sources. Current mobile device power sources are mostly batteries, in particular Li-‐ion batteries. Table 8 shows an estimate for the manufacturing bill of materials for a smart phone and tablet computer9.
Table 8. Manufacturing Bill of Materials for a Smart Phone and Tablet
Function Smart Phone Tablet Display/Touch Screen Display $23.00 $69.00 Touch Screen $14.00 $63,00 Main PCB Memory NAND Flash $20.00 $20.00 DRAM $8.50 $8.50 Apps Processing $20.00 $20.00 Power Management $8.00 $20.00 User Interface Sensors $5.75 $4.50
9 Eric Estave, IPnest, SemiWiki, On November 15, 2011, http://www.semiwiki.com/forum/content/866-‐media-‐tablet-‐smartphones-‐generate-‐6-‐billion-‐market-‐%85-‐power-‐management-‐ic-‐segment-‐2012-‐says-‐ipnest.html

30
Other $2.00 $2.00 Connectivity WLAN $2.60 $2.60 Blue Tooth $1.20 $1.20 Mobile 3G $2.70 Touch Control/Drivers Drivers $11.75 $15.00 Mech/Elec. Mech. $38.00 $43.00 Battery Pack $5.50 $20.00 Camera $15.00 $2.50 Box Content Literature $5.00 $5.00 Bill of Materials Cost $183.00 $296.30 Manufacturing Costs $9.00 $11.00 Total $192.00 $306.30 Not included in this bill of materials is the cost for a new wall/car charger for the phone. Whether one is needed or what its characteristics are, depends upon the energy source being used. As shown in the Figure, typical mobile device batteries cost the manufacturer somewhere between $5.00 and $20.00 US. Thus it seems reasonable to have our objective for a mobile device energy source that provides a week’s use without recharging from a static power source, be a volume cost to a mobile device manufacturer (the BOM cost) of less than $20.00. Note that a user might be willing to pay a bit more than a conventional energy source for the added convenience of only needing to charge once a week from a static power source. By volume cost we mean the cost for a reasonable scale of manufacturing. Let us define this as the sales price to a mobile device assembler for an annual volume of 100 million of these power sources. This manufactured part must meet all specification and quality requirements as discussed in the earlier sections of this white paper including environmental, safety and sustainability requirements, as well as energy usage and supply requirements. It is expected that the costs of developing and making the initial demonstration devices that meet the one-‐week between static power source recharging requirements could be considerable. However the technology should be scalable, so the cost of manufacturing the power source declines with annual unit volume to meet the sub-‐$20.00 price to the mobile device manufacturer. A typical technology ramp from invention and product design to volume manufacturing follows a rough process going from initial invention to pilot line production (very low volume for evaluation of the finished parts for quality and specification conformance) and then into a manufacturing ramp capable of being scaled to the expected high volume production level, in this case 100 million units per year. Error! Reference source not found. shows this development and production ramp process. In practice there may be many steps in the invention and development phase before a product is ready for pilot production and a consequent production ramp.

31
Figure 23. Rough Process for Invention and Design and Product Ramp
Making a product that will enable the required final cost based upon an intelligent initial design and choice of materials is often referred to as Design for Manufacturing. Figure 24 shows the various elements that determine the final cost (and thus the price once some profit margin is included) of a product. Note that some of these factors are what are called fixed costs (such as the costs of building and operating a manufacturing plant) and other costs are variable costs such as the costs of components or labor to build the product, which can vary depending upon demand. Fixed costs are charged against the manufactured items, this done by amortization of these assets. Amortization writes off a certain percentage of the asset (like a manufacturing machine or building) on an annual basis. Thus if the building and capital equipment in the factory are capable of building say 100 M units the AMORTIZED costs of this equipment on the final product will be greater if only 10 M units are produced.
Figure 24. Elements in Finished Product Total Costs
Raw materials costs also decrease with an increasing production volume. This is often referred to as a volume discount. Some other variable costs, such as labor, may also scale even when the actual salaries of the workers increases due to increasing efficiencies for producing products that often result as a product is scaled to larger and larger production volumes. Thus both fixed and variable costs may decrease as the production volume increases, at least up to a point. Error! Reference source not found. shows how these factors of fixed costs and variable costs may scale with production volume, leading to a final price to the mobile device assembler of $20.00 (with a 20% profit margin so the actual costs to manufacture at $16.00).

32
Figure 25. Example of Reduction of Unit Cost with Production
Volume Due to Decline in Variable and Fixed Costs
Note that although all this analysis of the business factors for the target mobile power device focuses only on mobile applications such as in smart phones and tablet computers the basic technology discussed here may have extension to other applications. These other applications might include electrified transportation as well as larger power systems and data centers. The applicability of this technology to these other applications is highly dependent upon the actual technology and whether it can be repurposed in some other form to meet the needs and requirements for another market needing energy sources. However if this technology can be modified and scaled for use in other applications, such as transportation electrification then there may be even more production cost reductions possible with the greater additional production volume – depending of course on whether the existing production facilities can handle the changed requirements for the power source for these additional applications. At the very least the raw materials volumes would increase likely lowering their unit costs.


![Creating Pships Govt, Comm, Univ Toachieve Results With Children [1]](https://img.pdfslide.net/doc/110x75/577d27ad1a28ab4e1ea487e0/creating-pships-govt-comm-univ-toachieve-results-with-children-1.jpg)

