Embed Size (px)
Citation preview
SagePoint Semis 60Q1 2010 Performance Review
An Analysis of Public Communications,Computing & Media Semiconductor Companies
from a Valuation and M&A Perspective
June 2010
Prepared By:
For more information contact David Michaels at (858) 926-5950 or [email protected]
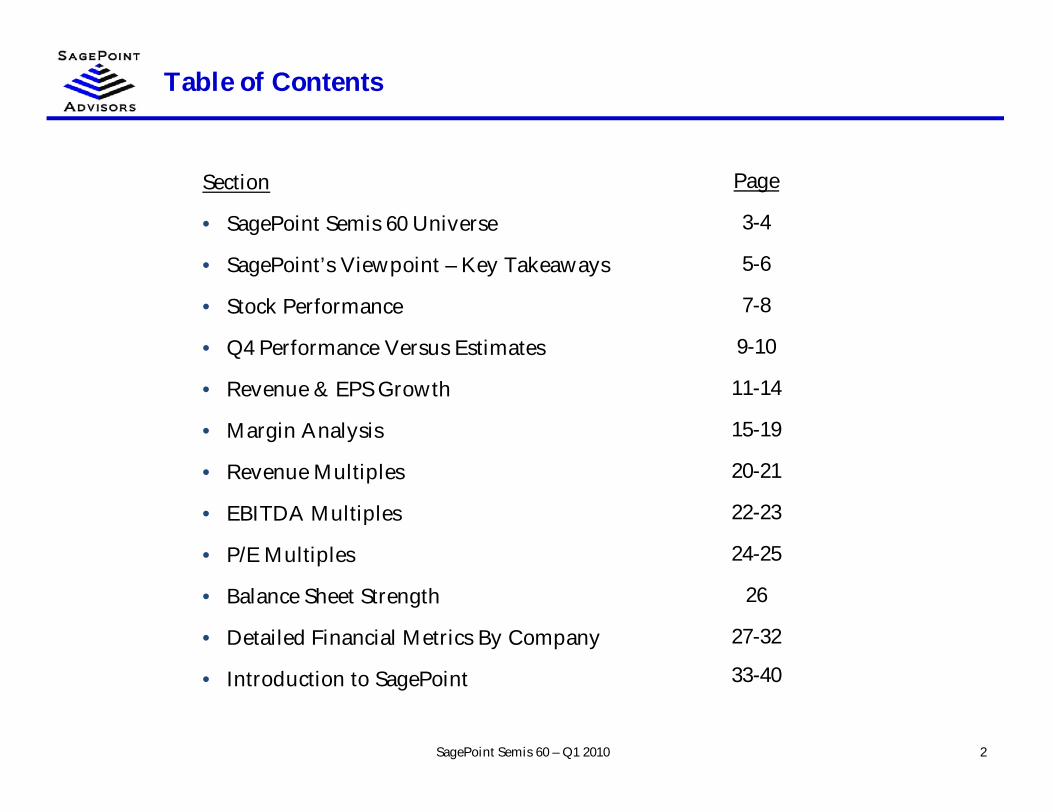
Table of Contents
Section
• SagePoint Semis 60 Universe
• SagePoint’s Viewpoint – Key Takeaways
• Stock Performance
• Q4 Performance Versus Estimates
• Revenue & EPS Growth
• Margin Analysis
• Revenue Multiples
• EBITDA Multiples
• P/E Multiples
• Balance Sheet Strength
• Detailed Financial Metrics By Company
• Introduction to SagePoint
2
Page
3-4
5-6
7-8
9-10
11-14
15-19
20-21
22-23
24-25
26
27-32
33-40
SagePoint Semis 60 – Q1 2010
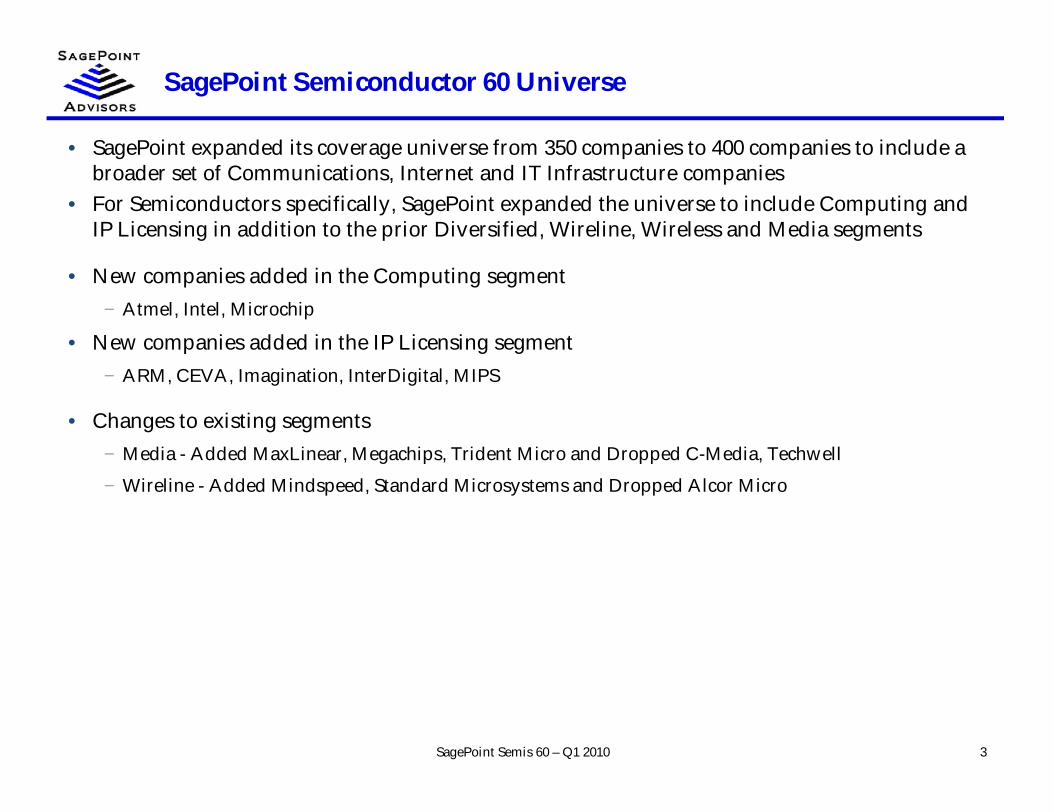
SagePoint Semiconductor 60 Universe
• SagePoint expanded its coverage universe from 350 companies to 400 companies to include abroader set of Communications, Internet and IT Infrastructure companies
• For Semiconductors specifically, SagePoint expanded the universe to include Computing andIP Licensing in addition to the prior Diversified, Wireline, Wireless and Media segments
• New companies added in the Computing segment− Atmel, Intel, Microchip
• New companies added in the IP Licensing segment− ARM, CEVA, Imagination, InterDigital, MIPS
• Changes to existing segments− Media - Added MaxLinear, Megachips, Trident Micro and Dropped C-Media, Techwell
− Wireline - Added Mindspeed, Standard Microsystems and Dropped Alcor Micro
SagePoint Semis 60 – Q1 2010 3
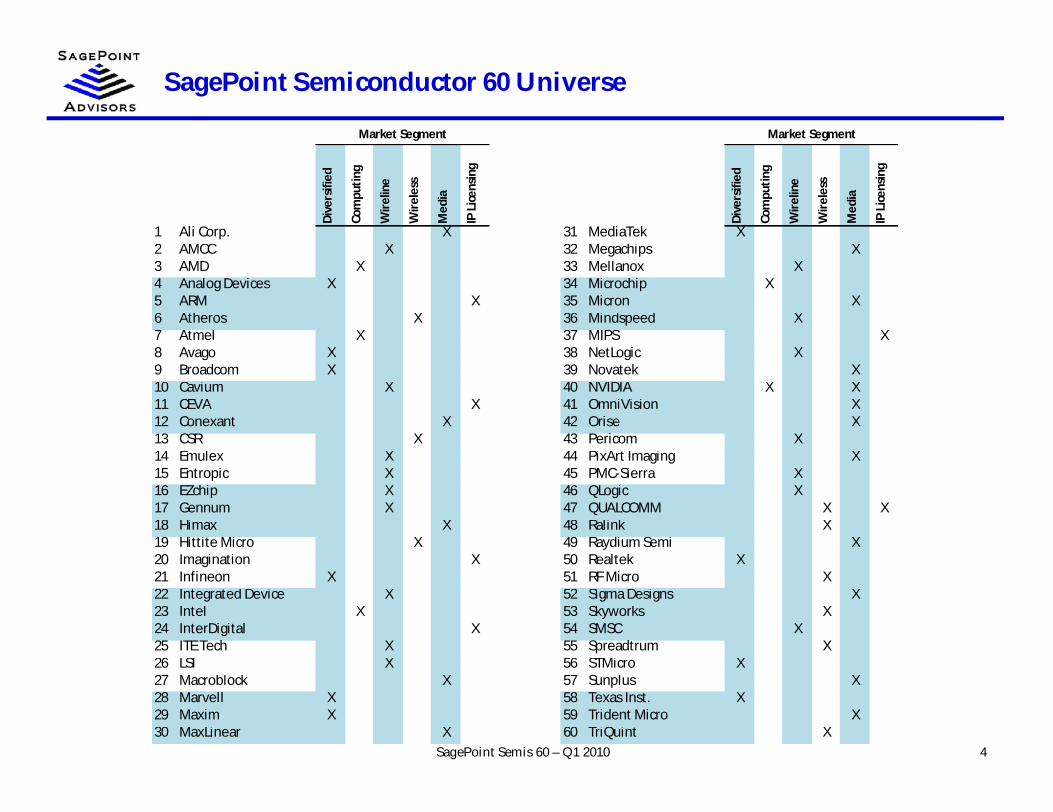
SagePoint Semiconductor 60 Universe
SagePoint Semis 60 – Q1 2010 4
Market Segment Market Segment
Div
ersi
fied
Com
puti
ng
Wir
elin
e
Wir
eles
s
Med
ia
IP L
icen
sing
Div
ersi
fied
Com
puti
ng
Wir
elin
e
Wir
eles
s
Med
ia
IP L
icen
sing
1 Ali Corp. X 31 MediaTek X2 AMCC X 32 Megachips X3 AMD X 33 Mellanox X4 Analog Devices X 34 Microchip X5 ARM X 35 Micron X6 Atheros X 36 Mindspeed X7 Atmel X 37 MIPS X8 Avago X 38 NetLogic X9 Broadcom X 39 Novatek X10 Cavium X 40 NVIDIA X X11 CEVA X 41 OmniVision X12 Conexant X 42 Orise X13 CSR X 43 Pericom X14 Emulex X 44 PixArt Imaging X15 Entropic X 45 PMC-Sierra X16 EZchip X 46 QLogic X17 Gennum X 47 QUALCOMM X X18 Himax X 48 Ralink X19 Hittite Micro X 49 Raydium Semi X20 Imagination X 50 Realtek X21 Infineon X 51 RF Micro X22 Integrated Device X 52 Sigma Designs X23 Intel X 53 Skyworks X24 InterDigital X 54 SMSC X25 ITE Tech X 55 Spreadtrum X26 LSI X 56 STMicro X27 Macroblock X 57 Sunplus X28 Marvell X 58 Texas Inst. X29 Maxim X 59 Trident Micro X30 MaxLinear X 60 TriQuint X
SagePoint’s Viewpoint - Key Takeaways
5SagePoint Semis 60 – Q1 2010
• Stock price recovery is mixed in the semiconductor segment following European economicconcerns
− The SagePoint Semis 60 posted a median decline of 2.9% since the beginning of Q1− Wireless and Wireline led with median gains of 10-12% while Media and Diversified underperformed
• Semis vendors were nearly perfect this earnings season, with all companies meeting or beatingrevenue estimates and all but one meeting or beating EPS targets
• Median revenue growth of 50% in Q1 continues the major turnaround in revenue trajectory andbodes well for a return to growth mode throughout 2010
− Media led the growth, up 62% over the prior year quarter− The Semis 60 is expected to maintain a 22%+ median growth rate over the next twelve months with
double digit growth expected for all segments• Median EPS growth reached a new peak in Q1, up to 148% due to strong revenue growth,
recent cost cutting and relatively weak profitability in Q1’09− Computing, Wireline and Wireless outperformed the median with Wireline projecting strong continued
growth of 76% over the next twelve months− The Semis 60 is expected to continue to deliver strong median EPS growth of 37% in the next 12 months− Projected EPS growth is driven by 20+% revenue growth while maintaining disciplined opex
SagePoint’s Viewpoint - Key Takeaways Continued
6SagePoint Semis 60 – Q1 2010
• Semis 60 operating models have been repaired and are now solidly profitable and stable− Median gross margin surpassed the 50% mark, hitting a three year high of 50.3%
− R&D spending as a % of revenues increased slightly as most vendors feel comfortable investing inthe future as revenues have returned and outlook is positive
− Median SG&A as a % of revenues remained flat following several quarters of deep spending cuts asvendors refocus on driving expected growth
− Median net margins fell slightly in Q1 to 14.8%, still near their highest level in the past 12 quarterswith IP Licensing solidly outperforming and Diversified outperforming as well
• Valuation multiples have slipped from Q4’09 amid European economic concerns butremain at reasonable levels
− Median LTM revenue multiple of 2.3x remains nearly 35% off the 2007 peak− Median LTM P/E multiples have slipped below 20x for the first time since Q1’09 and are currently at
18.5x, about 35% off their peak
• M&A activity remained steady in Q1 and SagePoint expects continued deal activity in 2010− Notable Q1 deals include Intersil’s $434M acquisition of Techwell, Ralink’s $169M acquisition of
Trendchip and Broadcom’s $123M acquisition of Teknovus− Balance sheet strength remains very high and several active buyers have cash war chests− Consolidation will continue across all segments because scale drives profitability and equipment
OEMs would prefer to rely on just a few strategic vendors− The Media and Wireline market segments remain fragmented with more than 70% of the vendors’
market caps below $1B which should be a catalyst for further consolidation
SagePoint Semis 60 Index Performance
7SagePoint Semis 60 – Q1 2010
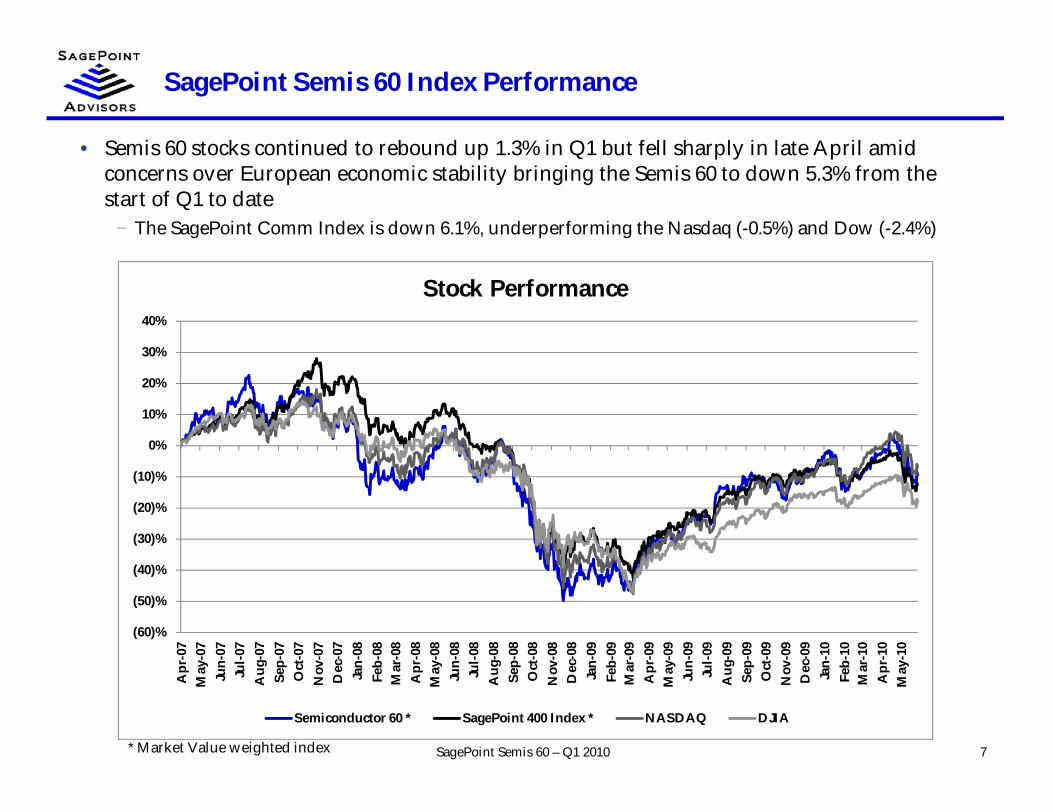
• Semis 60 stocks continued to rebound up 1.3% in Q1 but fell sharply in late April amidconcerns over European economic stability bringing the Semis 60 to down 5.3% from thestart of Q1 to date
− The SagePoint Comm Index is down 6.1%, underperforming the Nasdaq (-0.5%) and Dow (-2.4%)
* Market Value weighted index
(60)%
(50)%
(40)%
(30)%
(20)%
(10)%
0%
10%
20%
30%
40%
Apr
-07
May
-07
Jun-
07Ju
l-07
Aug
-07
Sep-
07O
ct-0
7N
ov-0
7D
ec-0
7Ja
n-08
Feb-
08M
ar-0
8A
pr-0
8M
ay-0
8Ju
n-08
Jul-0
8A
ug-0
8Se
p-08
Oct
-08
Nov
-08
Dec
-08
Jan-
09Fe
b-09
Mar
-09
Apr
-09
May
-09
Jun-
09Ju
l-09
Aug
-09
Sep-
09O
ct-0
9N
ov-0
9D
ec-0
9Ja
n-10
Feb-
10M
ar-1
0A
pr-1
0M
ay-1
0
Stock Performance
Semiconductor 60 * SagePoint 400 Index * NASDAQ DJIA
Stock Performance Since Beginning of Q1
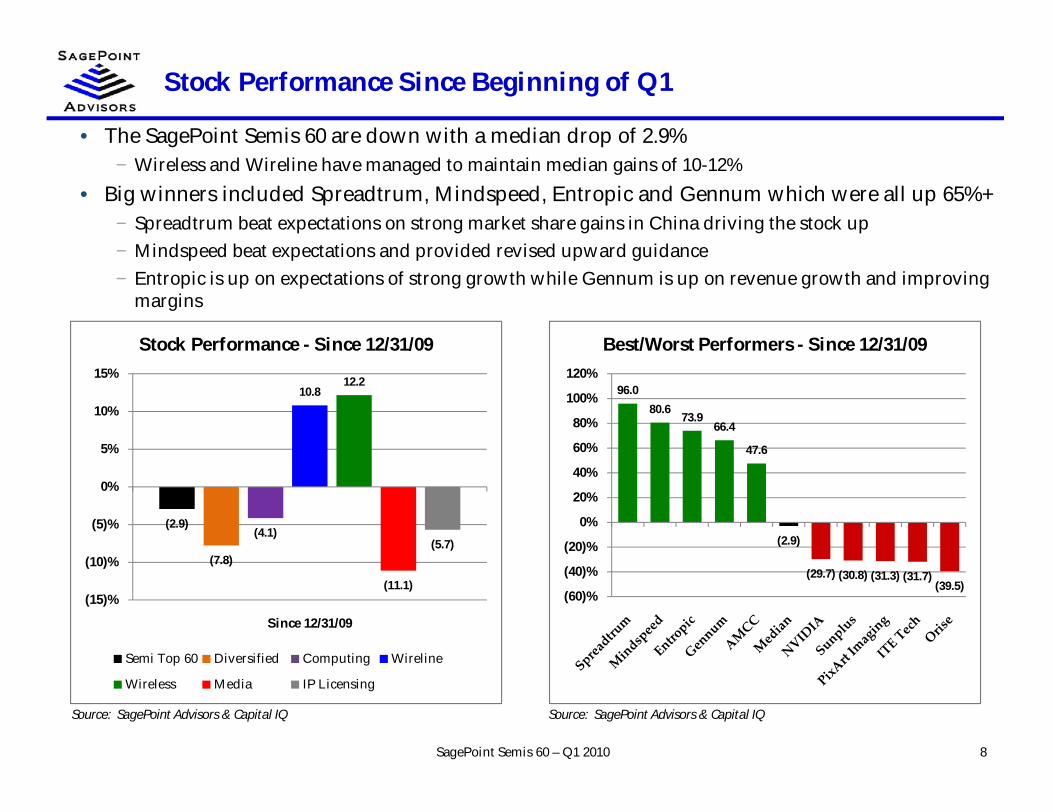
• The SagePoint Semis 60 are down with a median drop of 2.9%− Wireless and Wireline have managed to maintain median gains of 10-12%
• Big winners included Spreadtrum, Mindspeed, Entropic and Gennum which were all up 65%+− Spreadtrum beat expectations on strong market share gains in China driving the stock up− Mindspeed beat expectations and provided revised upward guidance− Entropic is up on expectations of strong growth while Gennum is up on revenue growth and improving
margins
8
Source: SagePoint Advisors & Capital IQ Source: SagePoint Advisors & Capital IQ
SagePoint Semis 60 – Q1 2010
96.080.6
73.966.4
47.6
(2.9)
(29.7) (30.8) (31.3) (31.7)(39.5)
(60)%
(40)%
(20)%
0%
20%
40%
60%
80%
100%
120%
Best/Worst Performers - Since 12/31/09
(2.9)
(7.8)
(4.1)
10.812.2
(11.1)
(5.7)
(15)%
(10)%
(5)%
0%
5%
10%
15%
Since 12/31/09
Stock Performance - Since 12/31/09
Semi Top 60 Diversified Computing Wireline
Wireless Media IP Licensing
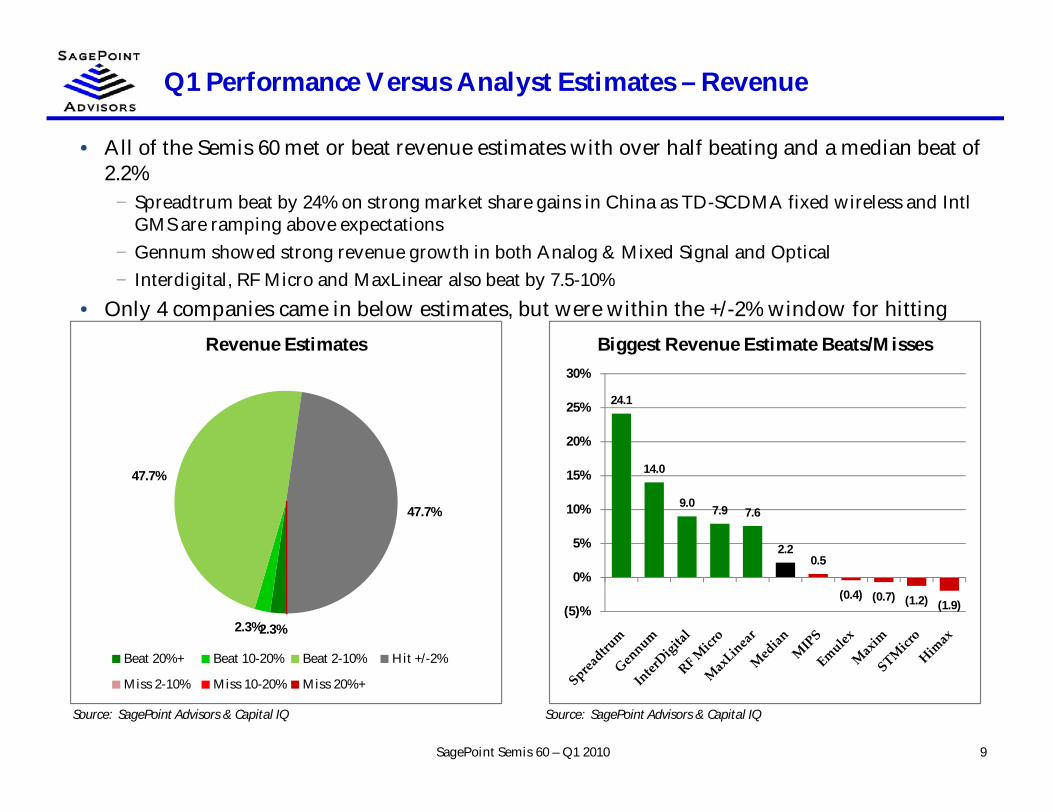
Q1 Performance Versus Analyst Estimates – Revenue
9SagePoint Semis 60 – Q1 2010
Source: SagePoint Advisors & Capital IQ Source: SagePoint Advisors & Capital IQ
• All of the Semis 60 met or beat revenue estimates with over half beating and a median beat of2.2%
− Spreadtrum beat by 24% on strong market share gains in China as TD-SCDMA fixed wireless and IntlGMS are ramping above expectations
− Gennum showed strong revenue growth in both Analog & Mixed Signal and Optical− Interdigital, RF Micro and MaxLinear also beat by 7.5-10%
• Only 4 companies came in below estimates, but were within the +/-2% window for hitting
2.3%2.3%
47.7%
47.7%
Revenue Estimates
Beat 20%+ Beat 10-20% Beat 2-10% Hit +/-2%
Miss 2-10% Miss 10-20% Miss 20%+
24.1
14.0
9.0 7.9 7.6
2.20.5
(0.4) (0.7) (1.2) (1.9)(5)%
0%
5%
10%
15%
20%
25%
30%
Biggest Revenue Estimate Beats/Misses
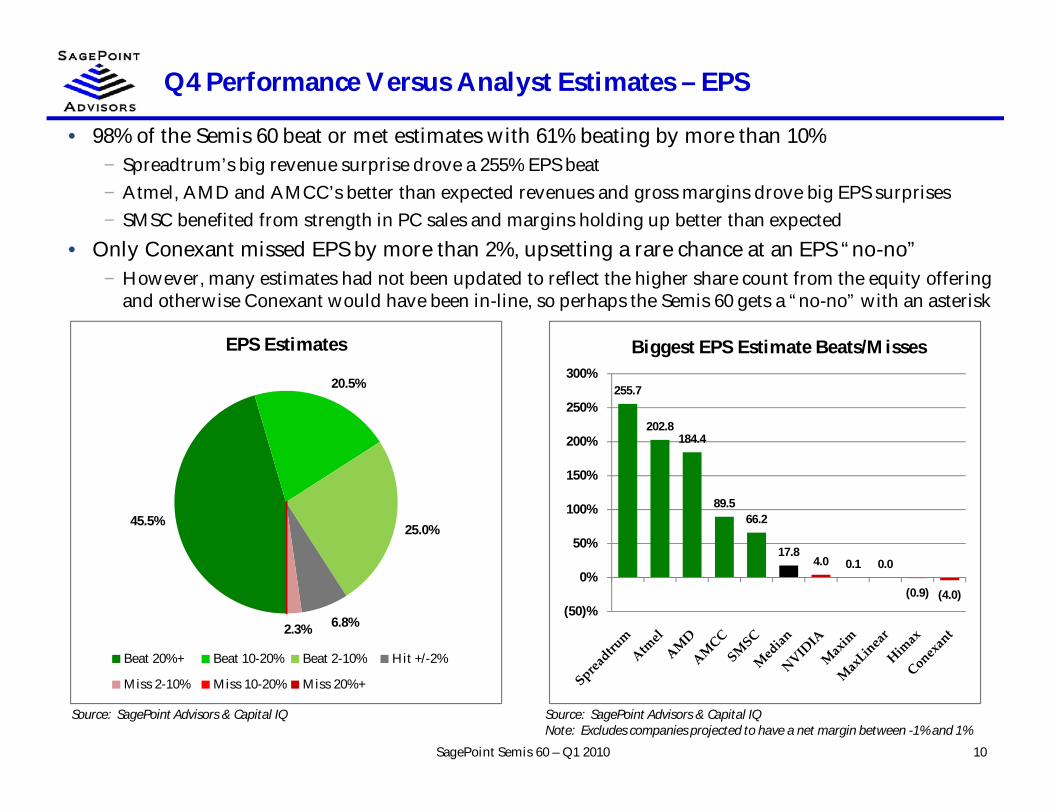
Q4 Performance Versus Analyst Estimates – EPS
10SagePoint Semis 60 – Q1 2010
Source: SagePoint Advisors & Capital IQ Source: SagePoint Advisors & Capital IQNote: Excludes companies projected to have a net margin between -1% and 1%
• 98% of the Semis 60 beat or met estimates with 61% beating by more than 10%− Spreadtrum’s big revenue surprise drove a 255% EPS beat− Atmel, AMD and AMCC’s better than expected revenues and gross margins drove big EPS surprises− SMSC benefited from strength in PC sales and margins holding up better than expected
• Only Conexant missed EPS by more than 2%, upsetting a rare chance at an EPS “no-no”− However, many estimates had not been updated to reflect the higher share count from the equity offering
and otherwise Conexant would have been in-line, so perhaps the Semis 60 gets a “no-no” with an asterisk
45.5%
20.5%
25.0%
6.8%2.3%
EPS Estimates
Beat 20%+ Beat 10-20% Beat 2-10% Hit +/-2%
Miss 2-10% Miss 10-20% Miss 20%+
255.7
202.8184.4
89.566.2
17.84.0 0.1 0.0
(0.9) (4.0)(50)%
0%
50%
100%
150%
200%
250%
300%
Biggest EPS Estimate Beats/Misses
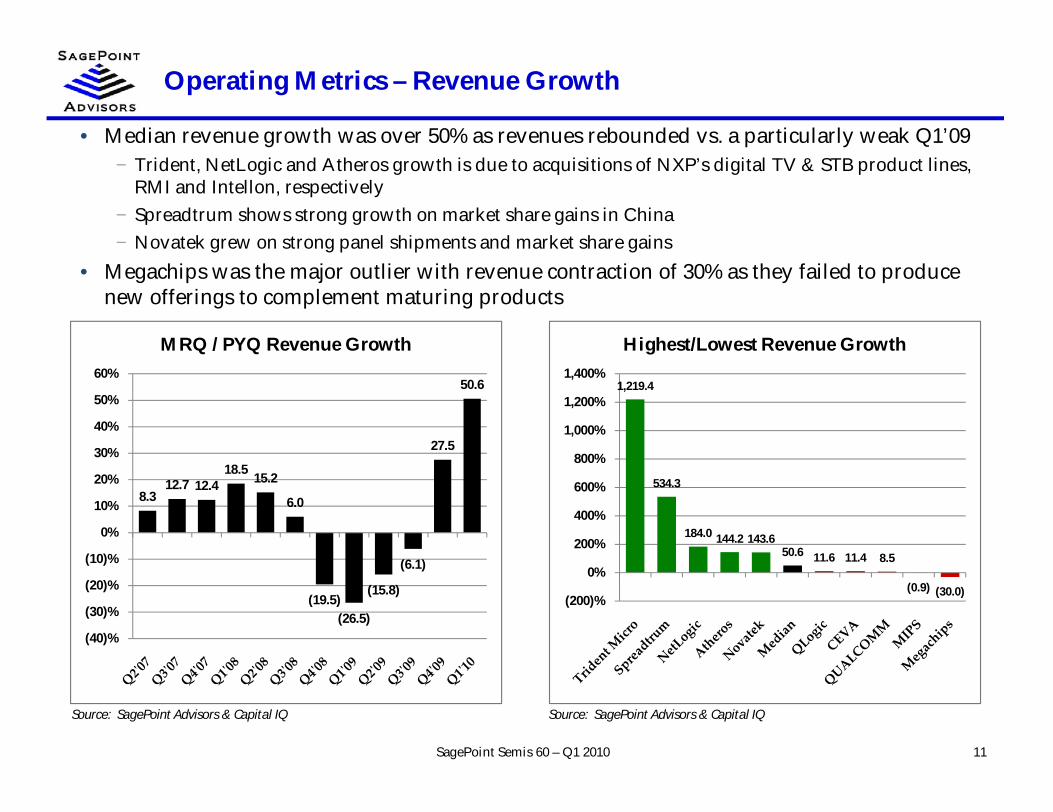
Operating Metrics – Revenue Growth
11SagePoint Semis 60 – Q1 2010
Source: SagePoint Advisors & Capital IQ Source: SagePoint Advisors & Capital IQ
• Median revenue growth was over 50% as revenues rebounded vs. a particularly weak Q1’09− Trident, NetLogic and Atheros growth is due to acquisitions of NXP’s digital TV & STB product lines,
RMI and Intellon, respectively− Spreadtrum shows strong growth on market share gains in China− Novatek grew on strong panel shipments and market share gains
• Megachips was the major outlier with revenue contraction of 30% as they failed to producenew offerings to complement maturing products
8.312.7 12.4
18.5 15.2
6.0
(19.5)(26.5)
(15.8)
(6.1)
27.5
50.6
(40)%
(30)%
(20)%
(10)%
0%
10%
20%
30%
40%
50%
60%
MRQ / PYQ Revenue Growth
1,219.4
534.3
184.0 144.2 143.650.6 11.6 11.4 8.5
(0.9) (30.0)(200)%
0%
200%
400%
600%
800%
1,000%
1,200%
1,400%
Highest/Lowest Revenue Growth
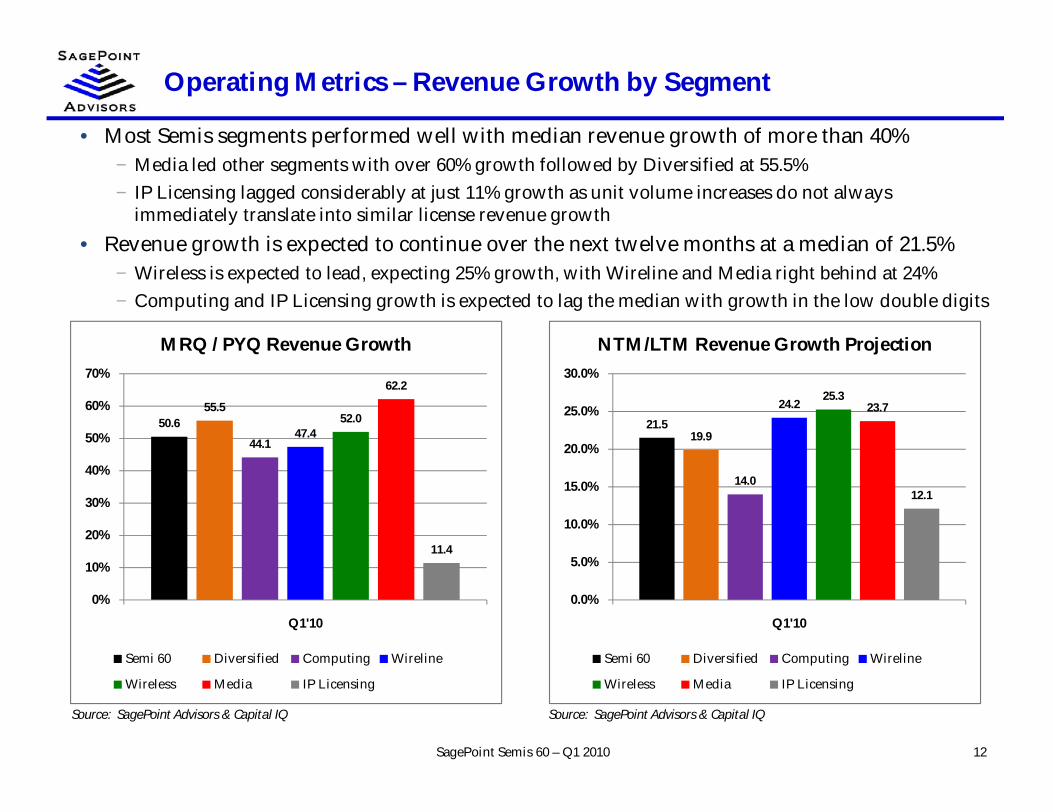
Operating Metrics – Revenue Growth by Segment
12SagePoint Semis 60 – Q1 2010
Source: SagePoint Advisors & Capital IQ Source: SagePoint Advisors & Capital IQ
• Most Semis segments performed well with median revenue growth of more than 40%− Media led other segments with over 60% growth followed by Diversified at 55.5%− IP Licensing lagged considerably at just 11% growth as unit volume increases do not always
immediately translate into similar license revenue growth• Revenue growth is expected to continue over the next twelve months at a median of 21.5%
− Wireless is expected to lead, expecting 25% growth, with Wireline and Media right behind at 24%− Computing and IP Licensing growth is expected to lag the median with growth in the low double digits
50.655.5
44.147.4
52.0
62.2
11.4
0%
10%
20%
30%
40%
50%
60%
70%
Q1'10
MRQ / PYQ Revenue Growth
Semi 60 Diversified Computing Wireline
Wireless Media IP Licensing
21.519.9
14.0
24.225.3
23.7
12.1
0.0%
5.0%
10.0%
15.0%
20.0%
25.0%
30.0%
Q1'10
NTM/LTM Revenue Growth Projection
Semi 60 Diversified Computing Wireline
Wireless Media IP Licensing
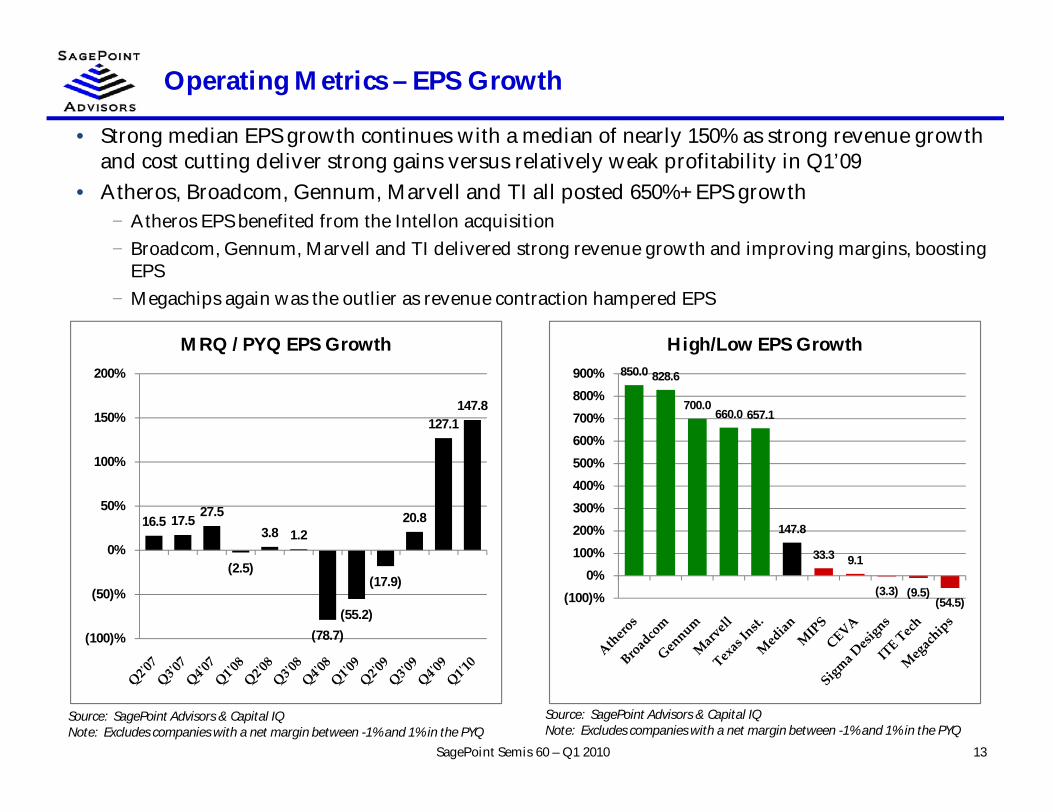
Operating Metrics – EPS Growth
13SagePoint Semis 60 – Q1 2010
Source: SagePoint Advisors & Capital IQNote: Excludes companies with a net margin between -1% and 1% in the PYQ
Source: SagePoint Advisors & Capital IQNote: Excludes companies with a net margin between -1% and 1% in the PYQ
• Strong median EPS growth continues with a median of nearly 150% as strong revenue growthand cost cutting deliver strong gains versus relatively weak profitability in Q1’09
• Atheros, Broadcom, Gennum, Marvell and TI all posted 650%+ EPS growth− Atheros EPS benefited from the Intellon acquisition− Broadcom, Gennum, Marvell and TI delivered strong revenue growth and improving margins, boosting
EPS− Megachips again was the outlier as revenue contraction hampered EPS
16.5 17.5 27.5
(2.5)
3.8 1.2
(78.7)(55.2)
(17.9)
20.8
127.1147.8
(100)%
(50)%
0%
50%
100%
150%
200%
MRQ / PYQ EPS Growth850.0 828.6
700.0660.0 657.1
147.8
33.3 9.1
(3.3) (9.5)(54.5)(100)%
0%
100%
200%
300%
400%
500%
600%
700%
800%
900%
High/Low EPS Growth
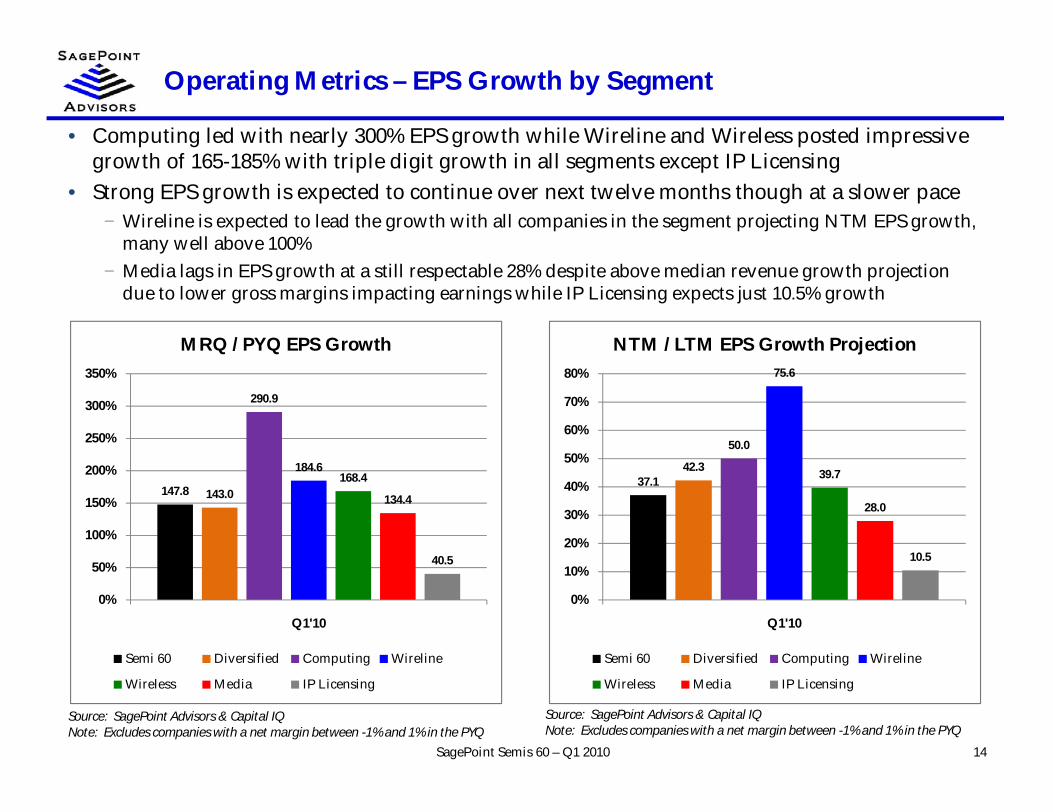
Operating Metrics – EPS Growth by Segment
14SagePoint Semis 60 – Q1 2010
Source: SagePoint Advisors & Capital IQNote: Excludes companies with a net margin between -1% and 1% in the PYQ
Source: SagePoint Advisors & Capital IQNote: Excludes companies with a net margin between -1% and 1% in the PYQ
• Computing led with nearly 300% EPS growth while Wireline and Wireless posted impressivegrowth of 165-185% with triple digit growth in all segments except IP Licensing
• Strong EPS growth is expected to continue over next twelve months though at a slower pace− Wireline is expected to lead the growth with all companies in the segment projecting NTM EPS growth,
many well above 100%− Media lags in EPS growth at a still respectable 28% despite above median revenue growth projection
due to lower gross margins impacting earnings while IP Licensing expects just 10.5% growth
37.142.3
50.0
75.6
39.7
28.0
10.5
0%
10%
20%
30%
40%
50%
60%
70%
80%
Q1'10
NTM / LTM EPS Growth Projection
Semi 60 Diversified Computing Wireline
Wireless Media IP Licensing
147.8 143.0
290.9
184.6168.4
134.4
40.5
0%
50%
100%
150%
200%
250%
300%
350%
Q1'10
MRQ / PYQ EPS Growth
Semi 60 Diversified Computing Wireline
Wireless Media IP Licensing
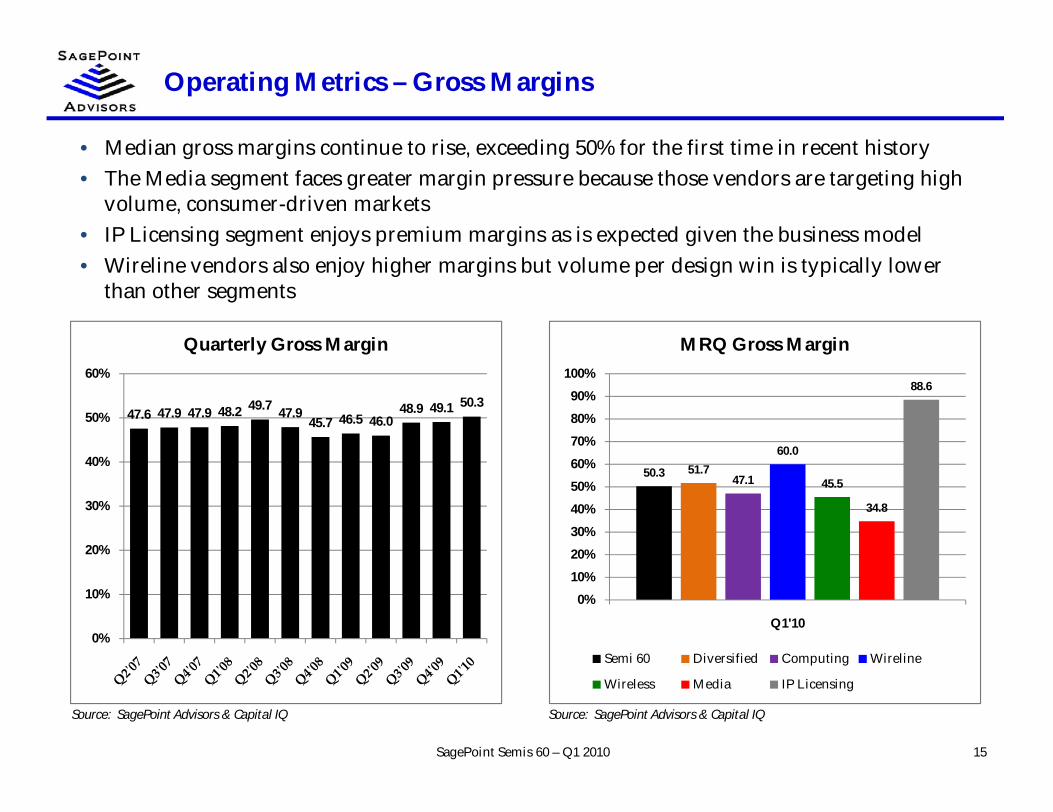
Operating Metrics – Gross Margins
15SagePoint Semis 60 – Q1 2010
Source: SagePoint Advisors & Capital IQ Source: SagePoint Advisors & Capital IQ
• Median gross margins continue to rise, exceeding 50% for the first time in recent history• The Media segment faces greater margin pressure because those vendors are targeting high
volume, consumer-driven markets• IP Licensing segment enjoys premium margins as is expected given the business model• Wireline vendors also enjoy higher margins but volume per design win is typically lower
than other segments
47.6 47.9 47.9 48.2 49.7 47.945.7 46.5 46.0
48.9 49.1 50.3
0%
10%
20%
30%
40%
50%
60%
Quarterly Gross Margin
50.3 51.747.1
60.0
45.5
34.8
88.6
0%
10%
20%
30%
40%
50%
60%
70%
80%
90%
100%
Q1'10
MRQ Gross Margin
Semi 60 Diversified Computing Wireline
Wireless Media IP Licensing
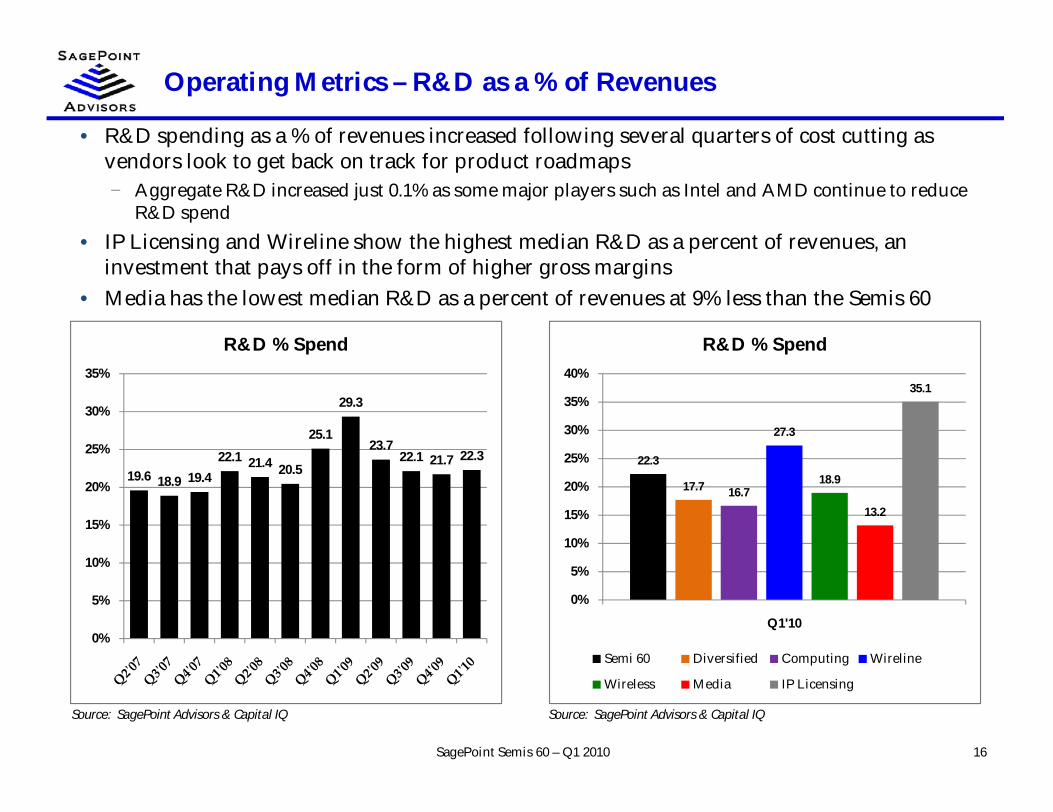
Operating Metrics – R&D as a % of Revenues
16SagePoint Semis 60 – Q1 2010
Source: SagePoint Advisors & Capital IQ Source: SagePoint Advisors & Capital IQ
• R&D spending as a % of revenues increased following several quarters of cost cutting asvendors look to get back on track for product roadmaps− Aggregate R&D increased just 0.1% as some major players such as Intel and AMD continue to reduce
R&D spend• IP Licensing and Wireline show the highest median R&D as a percent of revenues, an
investment that pays off in the form of higher gross margins• Media has the lowest median R&D as a percent of revenues at 9% less than the Semis 60
19.6 18.9 19.422.1 21.4 20.5
25.1
29.3
23.722.1 21.7 22.3
0%
5%
10%
15%
20%
25%
30%
35%
R&D % Spend
22.3
17.7 16.7
27.3
18.9
13.2
35.1
0%
5%
10%
15%
20%
25%
30%
35%
40%
Q1'10
R&D % Spend
Semi 60 Diversified Computing Wireline
Wireless Media IP Licensing
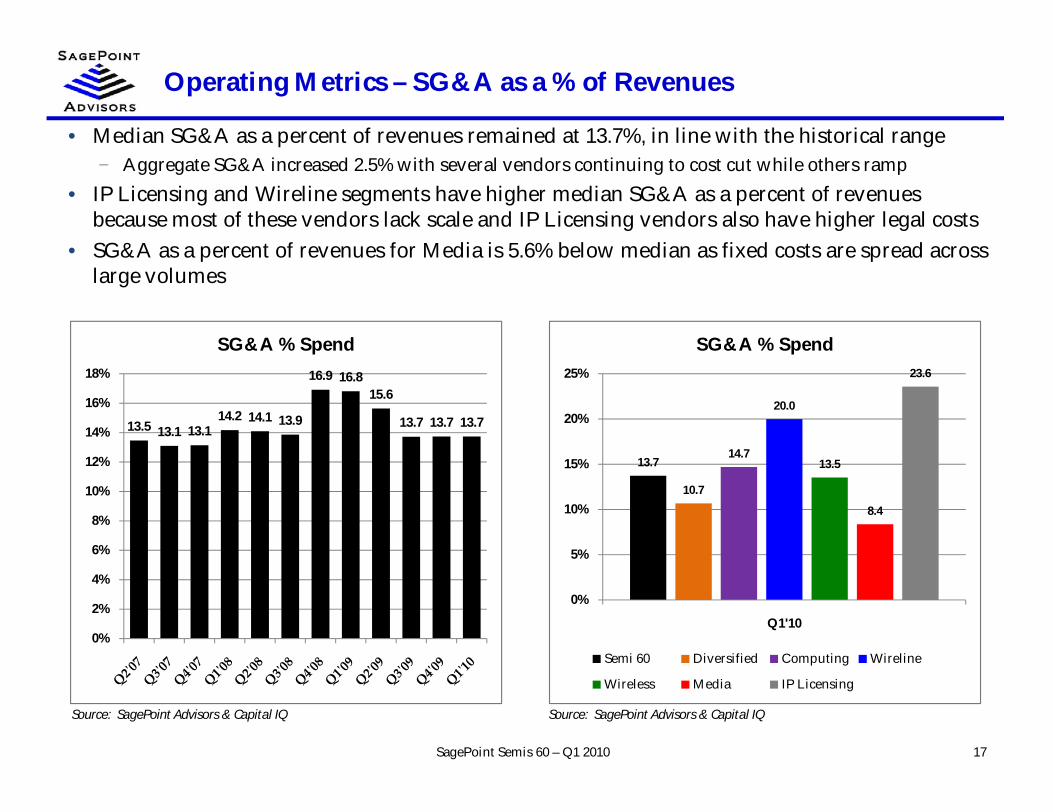
Operating Metrics – SG&A as a % of Revenues
17SagePoint Semis 60 – Q1 2010
Source: SagePoint Advisors & Capital IQ Source: SagePoint Advisors & Capital IQ
• Median SG&A as a percent of revenues remained at 13.7%, in line with the historical range− Aggregate SG&A increased 2.5% with several vendors continuing to cost cut while others ramp
• IP Licensing and Wireline segments have higher median SG&A as a percent of revenuesbecause most of these vendors lack scale and IP Licensing vendors also have higher legal costs
• SG&A as a percent of revenues for Media is 5.6% below median as fixed costs are spread acrosslarge volumes
13.5 13.1 13.114.2 14.1 13.9
16.9 16.815.6
13.7 13.7 13.7
0%
2%
4%
6%
8%
10%
12%
14%
16%
18%
SG&A % Spend
13.7
10.7
14.7
20.0
13.5
8.4
23.6
0%
5%
10%
15%
20%
25%
Q1'10
SG&A % Spend
Semi 60 Diversified Computing Wireline
Wireless Media IP Licensing
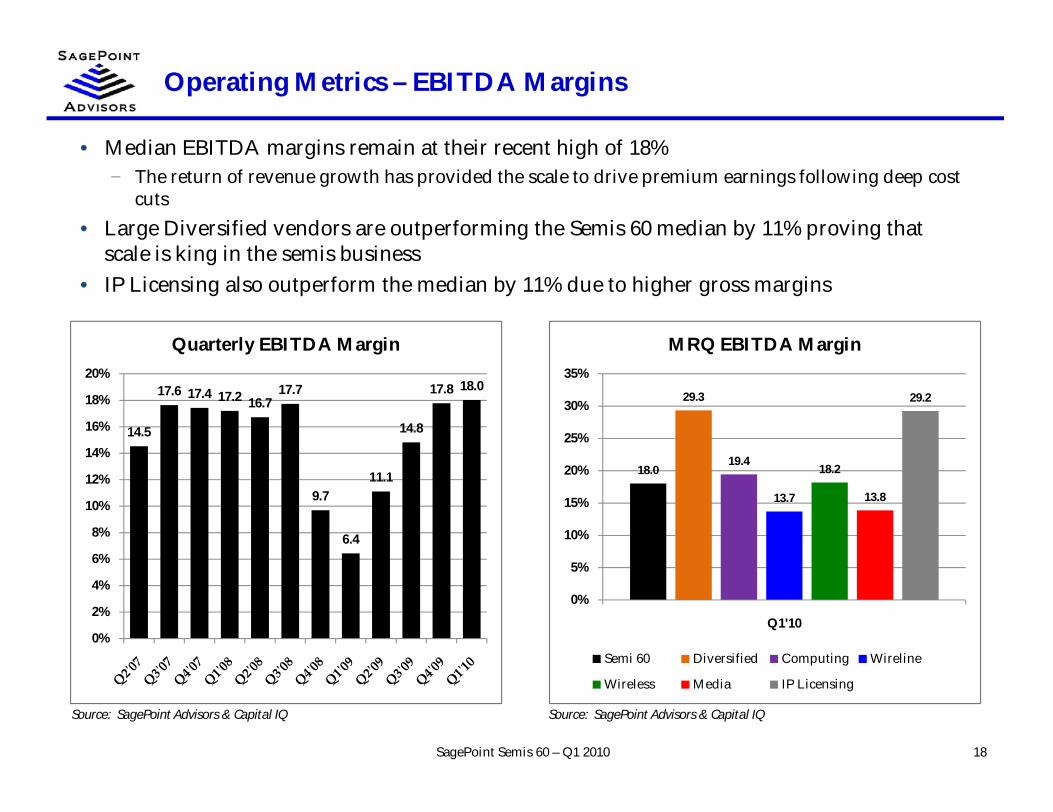
Operating Metrics – EBITDA Margins
18SagePoint Semis 60 – Q1 2010
Source: SagePoint Advisors & Capital IQ Source: SagePoint Advisors & Capital IQ
• Median EBITDA margins remain at their recent high of 18%− The return of revenue growth has provided the scale to drive premium earnings following deep cost
cuts• Large Diversified vendors are outperforming the Semis 60 median by 11% proving that
scale is king in the semis business• IP Licensing also outperform the median by 11% due to higher gross margins
14.5
17.6 17.4 17.2 16.717.7
9.7
6.4
11.1
14.8
17.8 18.0
0%
2%
4%
6%
8%
10%
12%
14%
16%
18%
20%
Quarterly EBITDA Margin
18.0
29.3
19.4
13.7
18.2
13.8
29.2
0%
5%
10%
15%
20%
25%
30%
35%
Q1'10
MRQ EBITDA Margin
Semi 60 Diversified Computing Wireline
Wireless Media IP Licensing
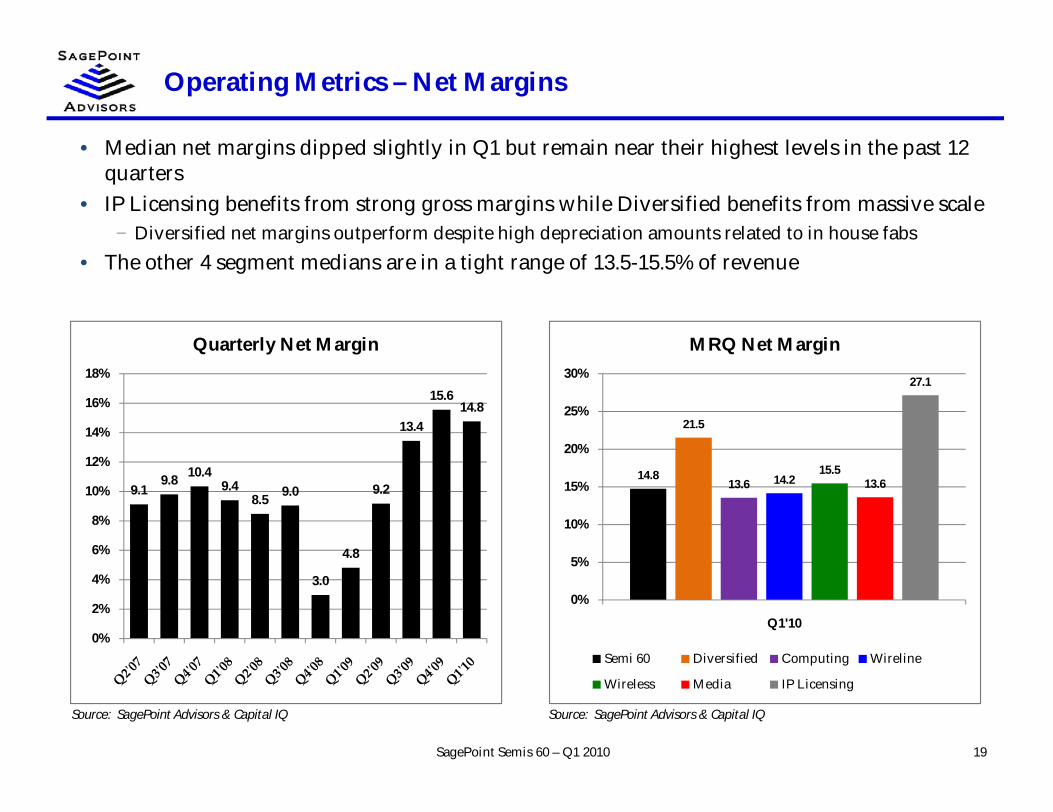
Operating Metrics – Net Margins
19SagePoint Semis 60 – Q1 2010
Source: SagePoint Advisors & Capital IQ Source: SagePoint Advisors & Capital IQ
• Median net margins dipped slightly in Q1 but remain near their highest levels in the past 12quarters
• IP Licensing benefits from strong gross margins while Diversified benefits from massive scale− Diversified net margins outperform despite high depreciation amounts related to in house fabs
• The other 4 segment medians are in a tight range of 13.5-15.5% of revenue
9.19.8 10.4
9.48.5 9.0
3.0
4.8
9.2
13.4
15.614.8
0%
2%
4%
6%
8%
10%
12%
14%
16%
18%
Quarterly Net Margin
14.8
21.5
13.6 14.215.5
13.6
27.1
0%
5%
10%
15%
20%
25%
30%
Q1'10
MRQ Net Margin
Semi 60 Diversified Computing Wireline
Wireless Media IP Licensing
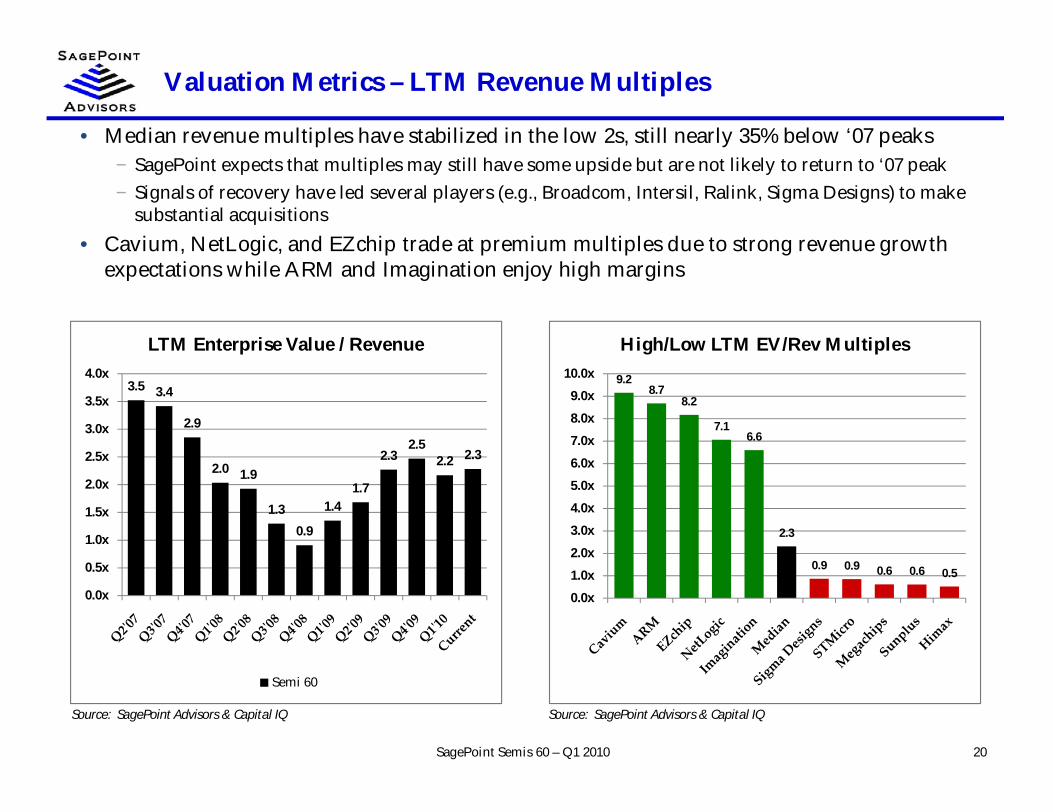
Valuation Metrics – LTM Revenue Multiples
20SagePoint Semis 60 – Q1 2010
Source: SagePoint Advisors & Capital IQ Source: SagePoint Advisors & Capital IQ
• Median revenue multiples have stabilized in the low 2s, still nearly 35% below ‘07 peaks− SagePoint expects that multiples may still have some upside but are not likely to return to ‘07 peak− Signals of recovery have led several players (e.g., Broadcom, Intersil, Ralink, Sigma Designs) to make
substantial acquisitions• Cavium, NetLogic, and EZchip trade at premium multiples due to strong revenue growth
expectations while ARM and Imagination enjoy high margins
9.28.7
8.2
7.16.6
2.3
0.9 0.9 0.6 0.6 0.5
0.0x
1.0x
2.0x
3.0x
4.0x
5.0x
6.0x
7.0x
8.0x
9.0x
10.0x
High/Low LTM EV/Rev Multiples
3.5 3.4
2.9
2.0 1.9
1.30.9
1.41.7
2.32.5
2.2 2.3
0.0x
0.5x
1.0x
1.5x
2.0x
2.5x
3.0x
3.5x
4.0x
LTM Enterprise Value / Revenue
Semi 60
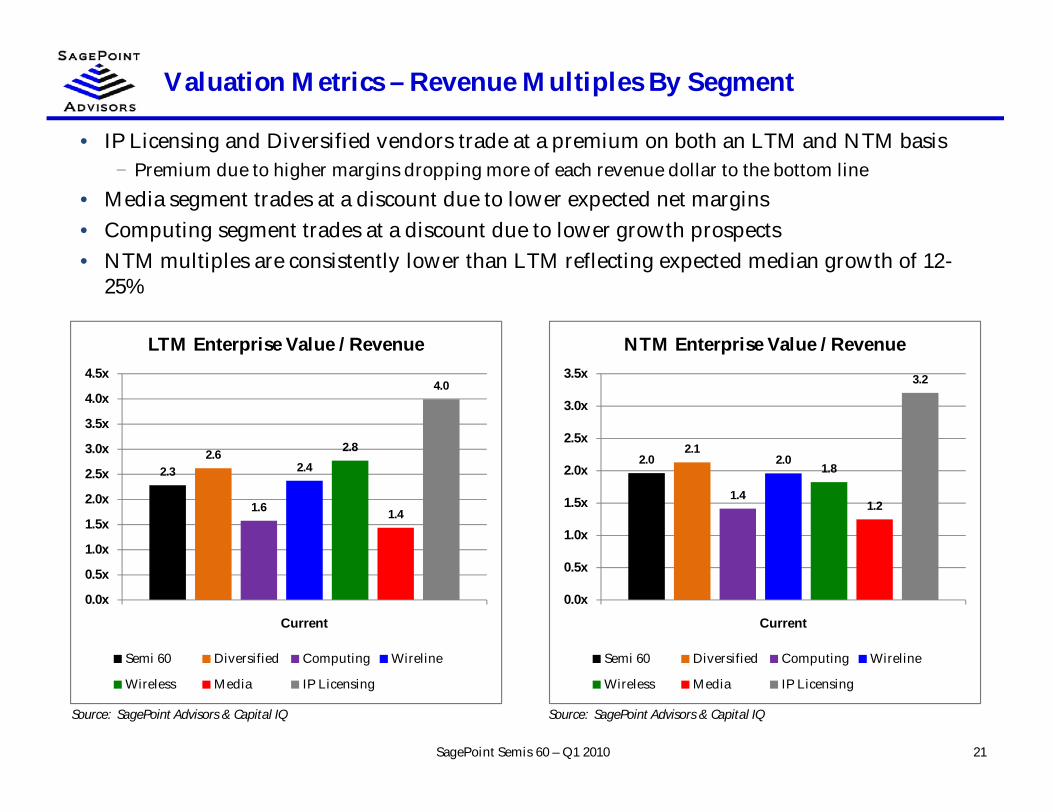
Valuation Metrics – Revenue Multiples By Segment
21SagePoint Semis 60 – Q1 2010
Source: SagePoint Advisors & Capital IQ Source: SagePoint Advisors & Capital IQ
• IP Licensing and Diversified vendors trade at a premium on both an LTM and NTM basis− Premium due to higher margins dropping more of each revenue dollar to the bottom line
• Media segment trades at a discount due to lower expected net margins• Computing segment trades at a discount due to lower growth prospects• NTM multiples are consistently lower than LTM reflecting expected median growth of 12-
25%
2.32.6
1.6
2.4
2.8
1.4
4.0
0.0x
0.5x
1.0x
1.5x
2.0x
2.5x
3.0x
3.5x
4.0x
4.5x
Current
LTM Enterprise Value / Revenue
Semi 60 Diversified Computing Wireline
Wireless Media IP Licensing
2.02.1
1.4
2.01.8
1.2
3.2
0.0x
0.5x
1.0x
1.5x
2.0x
2.5x
3.0x
3.5x
Current
NTM Enterprise Value / Revenue
Semi 60 Diversified Computing Wireline
Wireless Media IP Licensing
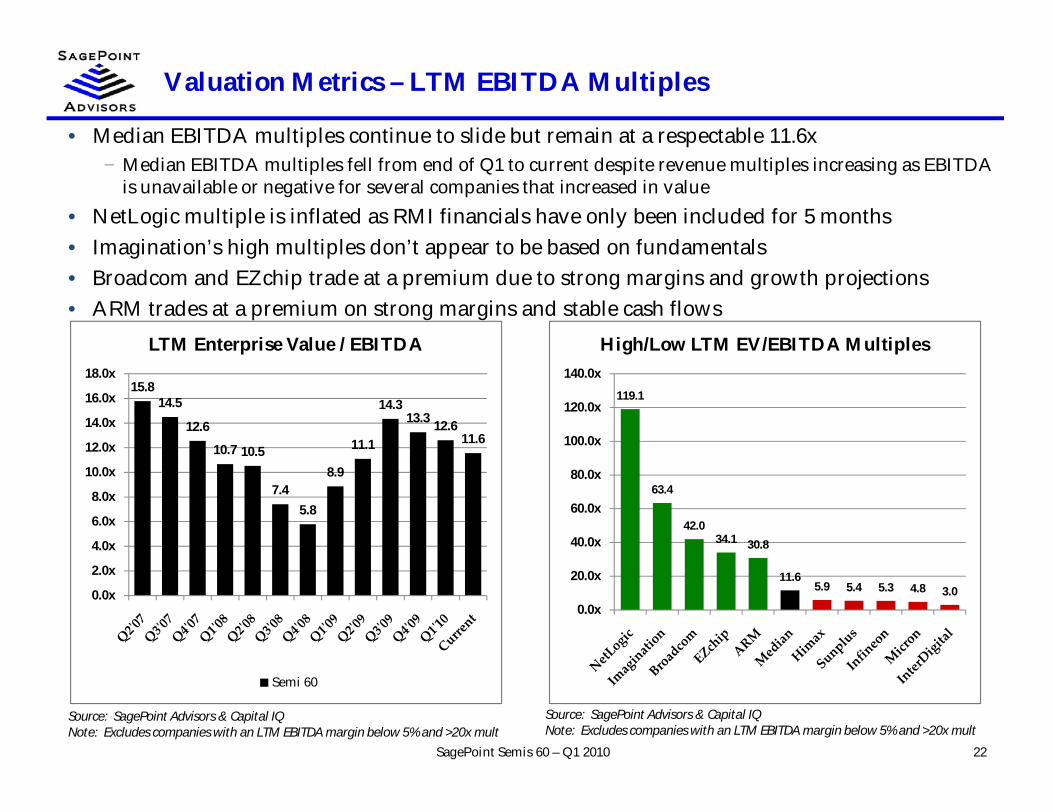
Valuation Metrics – LTM EBITDA Multiples
22SagePoint Semis 60 – Q1 2010
• Median EBITDA multiples continue to slide but remain at a respectable 11.6x− Median EBITDA multiples fell from end of Q1 to current despite revenue multiples increasing as EBITDA
is unavailable or negative for several companies that increased in value• NetLogic multiple is inflated as RMI financials have only been included for 5 months• Imagination’s high multiples don’t appear to be based on fundamentals• Broadcom and EZchip trade at a premium due to strong margins and growth projections• ARM trades at a premium on strong margins and stable cash flows
Source: SagePoint Advisors & Capital IQNote: Excludes companies with an LTM EBITDA margin below 5% and >20x mult
Source: SagePoint Advisors & Capital IQNote: Excludes companies with an LTM EBITDA margin below 5% and >20x mult
119.1
63.4
42.034.1 30.8
11.65.9 5.4 5.3 4.8 3.0
0.0x
20.0x
40.0x
60.0x
80.0x
100.0x
120.0x
140.0x
High/Low LTM EV/EBITDA Multiples
15.814.5
12.6
10.7 10.5
7.45.8
8.9
11.1
14.313.3 12.6
11.6
0.0x
2.0x
4.0x
6.0x
8.0x
10.0x
12.0x
14.0x
16.0x
18.0x
LTM Enterprise Value / EBITDA
Semi 60
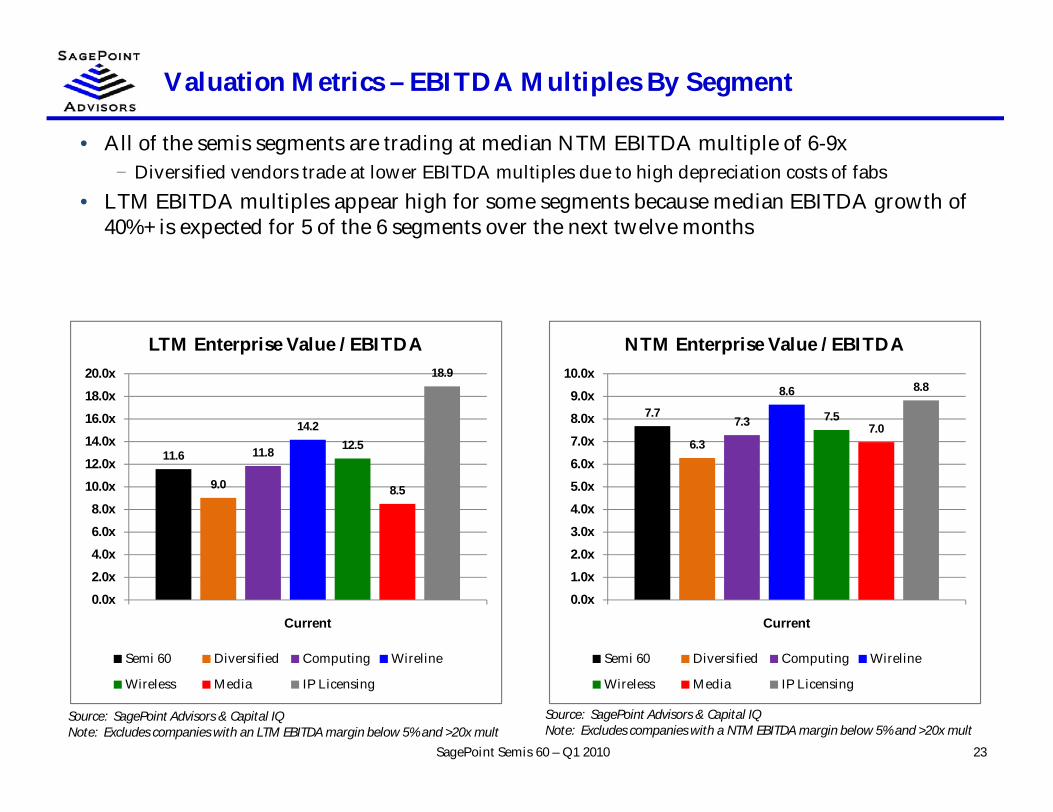
Valuation Metrics – EBITDA Multiples By Segment
23SagePoint Semis 60 – Q1 2010
• All of the semis segments are trading at median NTM EBITDA multiple of 6-9x− Diversified vendors trade at lower EBITDA multiples due to high depreciation costs of fabs
• LTM EBITDA multiples appear high for some segments because median EBITDA growth of40%+ is expected for 5 of the 6 segments over the next twelve months
Source: SagePoint Advisors & Capital IQNote: Excludes companies with a NTM EBITDA margin below 5% and >20x mult
Source: SagePoint Advisors & Capital IQNote: Excludes companies with an LTM EBITDA margin below 5% and >20x mult
11.6
9.0
11.8
14.212.5
8.5
18.9
0.0x
2.0x
4.0x
6.0x
8.0x
10.0x
12.0x
14.0x
16.0x
18.0x
20.0x
Current
LTM Enterprise Value / EBITDA
Semi 60 Diversified Computing Wireline
Wireless Media IP Licensing
7.7
6.3
7.3
8.6
7.57.0
8.8
0.0x
1.0x
2.0x
3.0x
4.0x
5.0x
6.0x
7.0x
8.0x
9.0x
10.0x
Current
NTM Enterprise Value / EBITDA
Semi 60 Diversified Computing Wireline
Wireless Media IP Licensing
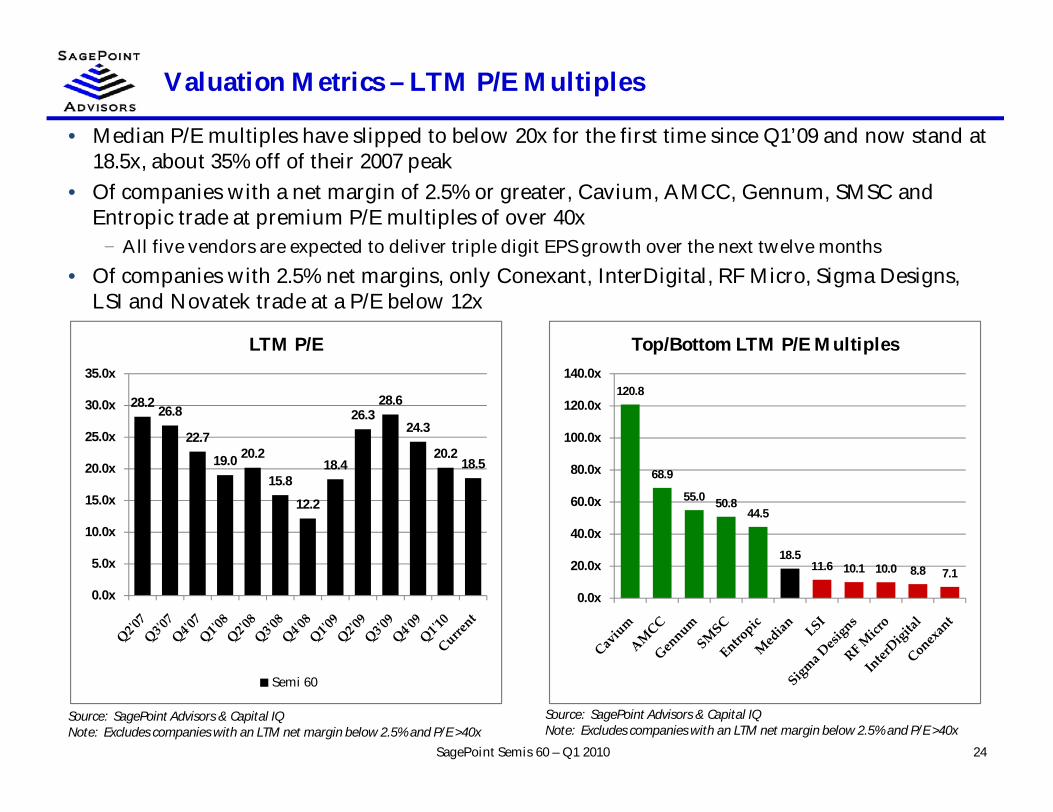
Valuation Metrics – LTM P/E Multiples
24SagePoint Semis 60 – Q1 2010
• Median P/E multiples have slipped to below 20x for the first time since Q1’09 and now stand at18.5x, about 35% off of their 2007 peak
• Of companies with a net margin of 2.5% or greater, Cavium, AMCC, Gennum, SMSC andEntropic trade at premium P/E multiples of over 40x
− All five vendors are expected to deliver triple digit EPS growth over the next twelve months• Of companies with 2.5% net margins, only Conexant, InterDigital, RF Micro, Sigma Designs,
LSI and Novatek trade at a P/E below 12x
Source: SagePoint Advisors & Capital IQNote: Excludes companies with an LTM net margin below 2.5% and P/E >40x
Source: SagePoint Advisors & Capital IQNote: Excludes companies with an LTM net margin below 2.5% and P/E >40x
120.8
68.9
55.0 50.844.5
18.511.6 10.1 10.0 8.8 7.1
0.0x
20.0x
40.0x
60.0x
80.0x
100.0x
120.0x
140.0x
Top/Bottom LTM P/E Multiples
28.2 26.8
22.7
19.0 20.2
15.8
12.2
18.4
26.328.6
24.3
20.218.5
0.0x
5.0x
10.0x
15.0x
20.0x
25.0x
30.0x
35.0x
LTM P/E
Semi 60
Valuation Metrics – P/E Multiples By Segment
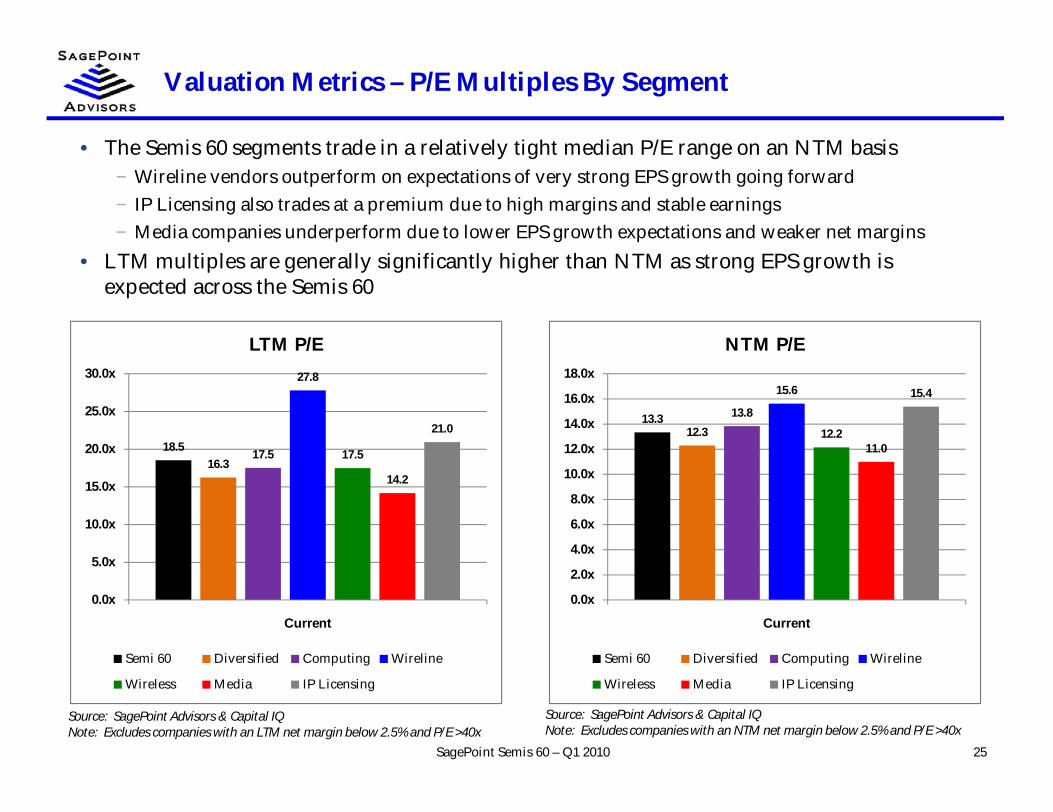
25SagePoint Semis 60 – Q1 2010
• The Semis 60 segments trade in a relatively tight median P/E range on an NTM basis− Wireline vendors outperform on expectations of very strong EPS growth going forward− IP Licensing also trades at a premium due to high margins and stable earnings− Media companies underperform due to lower EPS growth expectations and weaker net margins
• LTM multiples are generally significantly higher than NTM as strong EPS growth isexpected across the Semis 60
Source: SagePoint Advisors & Capital IQNote: Excludes companies with an NTM net margin below 2.5% and P/E >40x
Source: SagePoint Advisors & Capital IQNote: Excludes companies with an LTM net margin below 2.5% and P/E >40x
18.516.3
17.5
27.8
17.5
14.2
21.0
0.0x
5.0x
10.0x
15.0x
20.0x
25.0x
30.0x
Current
LTM P/E
Semi 60 Diversified Computing Wireline
Wireless Media IP Licensing
13.312.3
13.8
15.6
12.211.0
15.4
0.0x
2.0x
4.0x
6.0x
8.0x
10.0x
12.0x
14.0x
16.0x
18.0x
Current
NTM P/E
Semi 60 Diversified Computing Wireline
Wireless Media IP Licensing
Balance Sheet Strength – Net Cash Position
26SagePoint Semis 60 – Q1 2010
Source: SagePoint Advisors & Capital IQ Source: SagePoint Advisors & Capital IQ
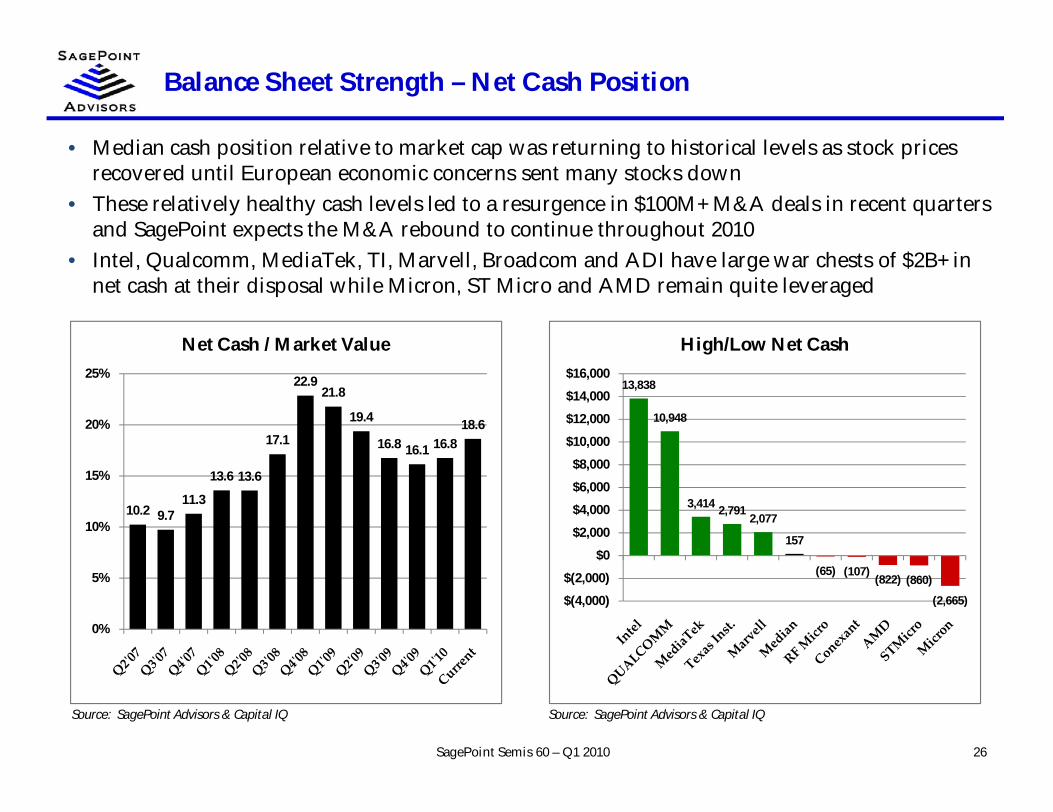
• Median cash position relative to market cap was returning to historical levels as stock pricesrecovered until European economic concerns sent many stocks down
• These relatively healthy cash levels led to a resurgence in $100M+ M&A deals in recent quartersand SagePoint expects the M&A rebound to continue throughout 2010
• Intel, Qualcomm, MediaTek, TI, Marvell, Broadcom and ADI have large war chests of $2B+ innet cash at their disposal while Micron, ST Micro and AMD remain quite leveraged
10.2 9.711.3
13.6 13.6
17.1
22.921.8
19.4
16.8 16.1 16.818.6
0%
5%
10%
15%
20%
25%
Net Cash / Market Value
13,838
10,948
3,414 2,7912,077
157
(65) (107)(822) (860)
(2,665)$(4,000)
$(2,000)
$0
$2,000
$4,000
$6,000
$8,000
$10,000
$12,000
$14,000
$16,000
High/Low Net Cash
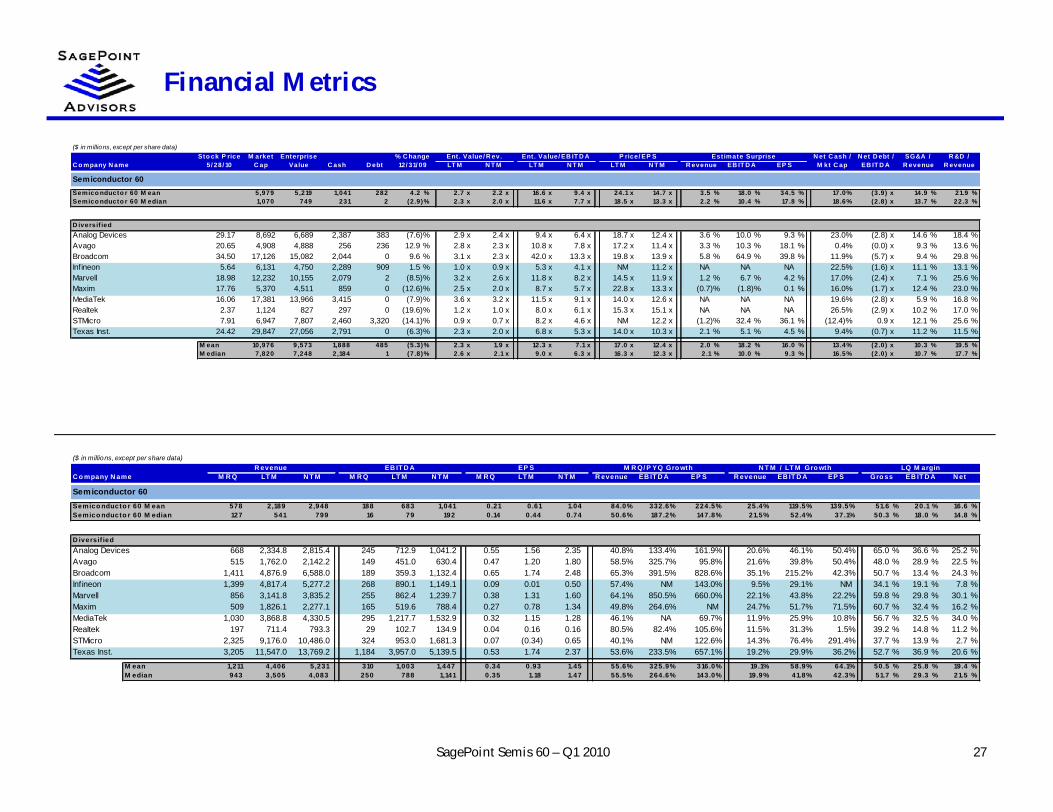
Financial Metrics
27SagePoint Semis 60 – Q1 2010
($ in millions, except per share data)Sto ck P rice M arket Enterprise % C hange Ent. Value/ R ev. Ent . Value/ EB IT D A P rice/ EP S Est imate Surprise N et C ash / N et D ebt / SG&A / R &D /
C o mpany N ame 5/ 28/ 10 C ap Value C ash D ebt 12/ 31/ 09 LT M N T M LT M N T M LT M N T M R evenue EB IT D A EP S M kt C ap EB IT D A R evenue R evenue
Semiconductor 60Semico nducto r 60 M ean 5,979 5,219 1,041 282 4.2 % 2.7 x 2.2 x 16.6 x 9.4 x 24.1 x 14.7 x 3.5 % 18.0 % 34.5 % 17.0% (3.9) x 14.9 % 21.9 %Semico nducto r 60 M edian 1,070 749 231 2 (2.9)% 2.3 x 2.0 x 11.6 x 7.7 x 18.5 x 13.3 x 2.2 % 10.4 % 17.8 % 18.6% (2.8) x 13.7 % 22.3 %
D iversif iedAnalog Devices 29.17 8,692 6,689 2,387 383 (7.6)% 2.9 x 2.4 x 9.4 x 6.4 x 18.7 x 12.4 x 3.6 % 10.0 % 9.3 % 23.0% (2.8) x 14.6 % 18.4 %Avago 20.65 4,908 4,888 256 236 12.9 % 2.8 x 2.3 x 10.8 x 7.8 x 17.2 x 11.4 x 3.3 % 10.3 % 18.1 % 0.4% (0.0) x 9.3 % 13.6 %Broadcom 34.50 17,126 15,082 2,044 0 9.6 % 3.1 x 2.3 x 42.0 x 13.3 x 19.8 x 13.9 x 5.8 % 64.9 % 39.8 % 11.9% (5.7) x 9.4 % 29.8 %Infineon 5.64 6,131 4,750 2,289 909 1.5 % 1.0 x 0.9 x 5.3 x 4.1 x NM 11.2 x NA NA NA 22.5% (1.6) x 11.1 % 13.1 %Marvell 18.98 12,232 10,155 2,079 2 (8.5)% 3.2 x 2.6 x 11.8 x 8.2 x 14.5 x 11.9 x 1.2 % 6.7 % 4.2 % 17.0% (2.4) x 7.1 % 25.6 %Maxim 17.76 5,370 4,511 859 0 (12.6)% 2.5 x 2.0 x 8.7 x 5.7 x 22.8 x 13.3 x (0.7)% (1.8)% 0.1 % 16.0% (1.7) x 12.4 % 23.0 %MediaTek 16.06 17,381 13,966 3,415 0 (7.9)% 3.6 x 3.2 x 11.5 x 9.1 x 14.0 x 12.6 x NA NA NA 19.6% (2.8) x 5.9 % 16.8 %Realtek 2.37 1,124 827 297 0 (19.6)% 1.2 x 1.0 x 8.0 x 6.1 x 15.3 x 15.1 x NA NA NA 26.5% (2.9) x 10.2 % 17.0 %STMicro 7.91 6,947 7,807 2,460 3,320 (14.1)% 0.9 x 0.7 x 8.2 x 4.6 x NM 12.2 x (1.2)% 32.4 % 36.1 % (12.4)% 0.9 x 12.1 % 25.6 %Texas Inst. 24.42 29,847 27,056 2,791 0 (6.3)% 2.3 x 2.0 x 6.8 x 5.3 x 14.0 x 10.3 x 2.1 % 5.1 % 4.5 % 9.4% (0.7) x 11.2 % 11.5 %
M ean 10,976 9,573 1,888 485 (5.3)% 2.3 x 1.9 x 12.3 x 7.1 x 17.0 x 12.4 x 2.0 % 18.2 % 16.0 % 13.4% (2.0) x 10.3 % 19.5 %M edian 7,820 7,248 2,184 1 (7.8)% 2.6 x 2.1 x 9.0 x 6.3 x 16.3 x 12.3 x 2.1 % 10.0 % 9.3 % 16.5% (2.0) x 10.7 % 17.7 %
($ in millions, except per share data)R evenue EB IT D A EP S M R Q/ P YQ Gro wth N T M / LT M Gro wth LQ M argin
C o mpany N ame M R Q LT M N T M M R Q LT M N T M M R Q LT M N T M R evenue EB IT D A EP S R evenue EB IT D A EP S Gro ss EB IT D A N et
Semiconductor 60Semico nducto r 60 M ean 578 2,189 2,948 188 683 1,041 0.21 0.61 1.04 84.0% 332.6% 224.5% 25.4% 119.5% 139.5% 51.6 % 20.1 % 16.6 %Semico nducto r 60 M edian 127 541 799 16 79 192 0.14 0.44 0.74 50.6% 187.2% 147.8% 21.5% 52.4% 37.1% 50.3 % 18.0 % 14.8 %
D iversif iedAnalog Devices 668 2,334.8 2,815.4 245 712.9 1,041.2 0.55 1.56 2.35 40.8% 133.4% 161.9% 20.6% 46.1% 50.4% 65.0 % 36.6 % 25.2 %Avago 515 1,762.0 2,142.2 149 451.0 630.4 0.47 1.20 1.80 58.5% 325.7% 95.8% 21.6% 39.8% 50.4% 48.0 % 28.9 % 22.5 %Broadcom 1,411 4,876.9 6,588.0 189 359.3 1,132.4 0.65 1.74 2.48 65.3% 391.5% 828.6% 35.1% 215.2% 42.3% 50.7 % 13.4 % 24.3 %Infineon 1,399 4,817.4 5,277.2 268 890.1 1,149.1 0.09 0.01 0.50 57.4% NM 143.0% 9.5% 29.1% NM 34.1 % 19.1 % 7.8 %Marvell 856 3,141.8 3,835.2 255 862.4 1,239.7 0.38 1.31 1.60 64.1% 850.5% 660.0% 22.1% 43.8% 22.2% 59.8 % 29.8 % 30.1 %Maxim 509 1,826.1 2,277.1 165 519.6 788.4 0.27 0.78 1.34 49.8% 264.6% NM 24.7% 51.7% 71.5% 60.7 % 32.4 % 16.2 %MediaTek 1,030 3,868.8 4,330.5 295 1,217.7 1,532.9 0.32 1.15 1.28 46.1% NA 69.7% 11.9% 25.9% 10.8% 56.7 % 32.5 % 34.0 %Realtek 197 711.4 793.3 29 102.7 134.9 0.04 0.16 0.16 80.5% 82.4% 105.6% 11.5% 31.3% 1.5% 39.2 % 14.8 % 11.2 %STMicro 2,325 9,176.0 10,486.0 324 953.0 1,681.3 0.07 (0.34) 0.65 40.1% NM 122.6% 14.3% 76.4% 291.4% 37.7 % 13.9 % 2.7 %Texas Inst. 3,205 11,547.0 13,769.2 1,184 3,957.0 5,139.5 0.53 1.74 2.37 53.6% 233.5% 657.1% 19.2% 29.9% 36.2% 52.7 % 36.9 % 20.6 %
M ean 1,211 4,406 5,231 310 1,003 1,447 0.34 0.93 1.45 55.6% 325.9% 316.0% 19.1% 58.9% 64.1% 50.5 % 25.8 % 19.4 %M edian 943 3,505 4,083 250 788 1,141 0.35 1.18 1.47 55.5% 264.6% 143.0% 19.9% 41.8% 42.3% 51.7 % 29.3 % 21.5 %
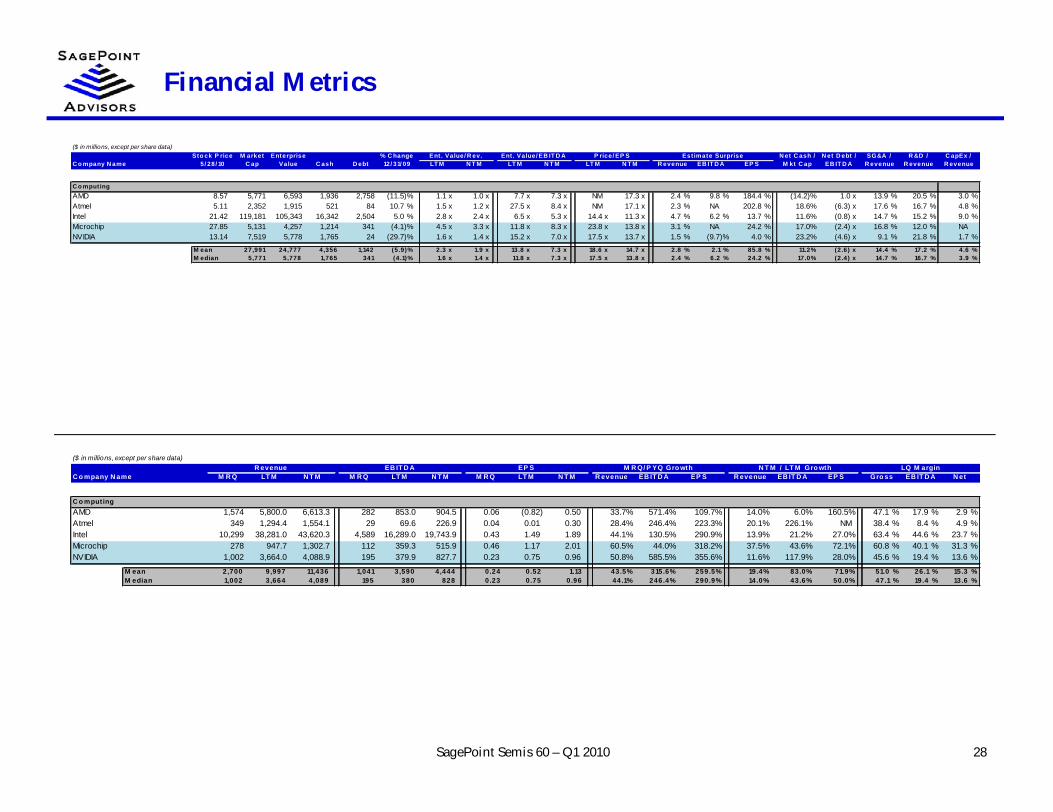
Financial Metrics
28SagePoint Semis 60 – Q1 2010
($ in millions, except per share data)Sto ck P rice M arket Enterprise % C hange Ent. Value/ R ev. Ent . Value/ EB IT D A P rice/ EP S Est imate Surprise N et C ash / N et D ebt / SG&A / R &D / C apEx /
C o mpany N ame 5/ 28/ 10 C ap Value C ash D ebt 12/ 31/ 09 LT M N T M LT M N T M LT M N T M R evenue EB IT D A EP S M kt C ap EB IT D A R evenue R evenue R evenue
C o mputingAMD 8.57 5,771 6,593 1,936 2,758 (11.5)% 1.1 x 1.0 x 7.7 x 7.3 x NM 17.3 x 2.4 % 9.8 % 184.4 % (14.2)% 1.0 x 13.9 % 20.5 % 3.0 %Atmel 5.11 2,352 1,915 521 84 10.7 % 1.5 x 1.2 x 27.5 x 8.4 x NM 17.1 x 2.3 % NA 202.8 % 18.6% (6.3) x 17.6 % 16.7 % 4.8 %Intel 21.42 119,181 105,343 16,342 2,504 5.0 % 2.8 x 2.4 x 6.5 x 5.3 x 14.4 x 11.3 x 4.7 % 6.2 % 13.7 % 11.6% (0.8) x 14.7 % 15.2 % 9.0 %Microchip 27.85 5,131 4,257 1,214 341 (4.1)% 4.5 x 3.3 x 11.8 x 8.3 x 23.8 x 13.8 x 3.1 % NA 24.2 % 17.0% (2.4) x 16.8 % 12.0 % NANVIDIA 13.14 7,519 5,778 1,765 24 (29.7)% 1.6 x 1.4 x 15.2 x 7.0 x 17.5 x 13.7 x 1.5 % (9.7)% 4.0 % 23.2% (4.6) x 9.1 % 21.8 % 1.7 %
M ean 27,991 24,777 4,356 1,142 (5.9)% 2.3 x 1.9 x 13.8 x 7.3 x 18.6 x 14.7 x 2.8 % 2.1 % 85.8 % 11.2% (2.6) x 14.4 % 17.2 % 4.6 %M edian 5,771 5,778 1,765 341 (4.1)% 1.6 x 1.4 x 11.8 x 7.3 x 17.5 x 13.8 x 2.4 % 6.2 % 24.2 % 17.0% (2.4) x 14.7 % 16.7 % 3.9 %
($ in millions, except per share data)R evenue EB IT D A EP S M R Q/ P YQ Gro wth N T M / LT M Gro wth LQ M argin
C o mpany N ame M R Q LT M N T M M R Q LT M N T M M R Q LT M N T M R evenue EB IT D A EP S R evenue EB IT D A EP S Gro ss EB IT D A N et
C o mputingAMD 1,574 5,800.0 6,613.3 282 853.0 904.5 0.06 (0.82) 0.50 33.7% 571.4% 109.7% 14.0% 6.0% 160.5% 47.1 % 17.9 % 2.9 %Atmel 349 1,294.4 1,554.1 29 69.6 226.9 0.04 0.01 0.30 28.4% 246.4% 223.3% 20.1% 226.1% NM 38.4 % 8.4 % 4.9 %Intel 10,299 38,281.0 43,620.3 4,589 16,289.0 19,743.9 0.43 1.49 1.89 44.1% 130.5% 290.9% 13.9% 21.2% 27.0% 63.4 % 44.6 % 23.7 %Microchip 278 947.7 1,302.7 112 359.3 515.9 0.46 1.17 2.01 60.5% 44.0% 318.2% 37.5% 43.6% 72.1% 60.8 % 40.1 % 31.3 %NVIDIA 1,002 3,664.0 4,088.9 195 379.9 827.7 0.23 0.75 0.96 50.8% 585.5% 355.6% 11.6% 117.9% 28.0% 45.6 % 19.4 % 13.6 %
M ean 2,700 9,997 11,436 1,041 3,590 4,444 0.24 0.52 1.13 43.5% 315.6% 259.5% 19.4% 83.0% 71.9% 51.0 % 26.1 % 15.3 %M edian 1,002 3,664 4,089 195 380 828 0.23 0.75 0.96 44.1% 246.4% 290.9% 14.0% 43.6% 50.0% 47.1 % 19.4 % 13.6 %
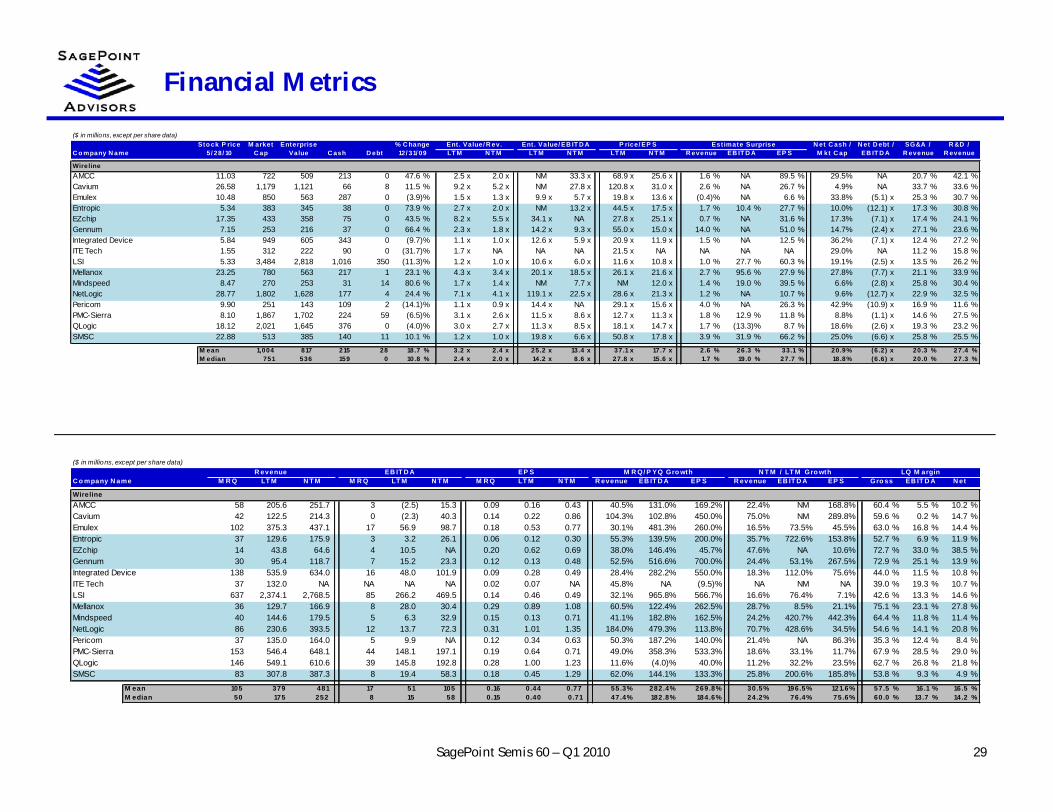
Financial Metrics
29SagePoint Semis 60 – Q1 2010
($ in millions, except per share data)Sto ck P rice M arket Enterprise % C hange Ent. Value/ R ev. Ent . Value/ EB IT D A P rice/ EP S Est imate Surprise N et C ash / N et D ebt / SG&A / R &D /
C o mpany N ame 5/ 28/ 10 C ap Value C ash D ebt 12/ 31/ 09 LT M N T M LT M N T M LT M N T M R evenue EB IT D A EP S M kt C ap EB IT D A R evenue R evenue
WirelineAMCC 11.03 722 509 213 0 47.6 % 2.5 x 2.0 x NM 33.3 x 68.9 x 25.6 x 1.6 % NA 89.5 % 29.5% NA 20.7 % 42.1 %Cavium 26.58 1,179 1,121 66 8 11.5 % 9.2 x 5.2 x NM 27.8 x 120.8 x 31.0 x 2.6 % NA 26.7 % 4.9% NA 33.7 % 33.6 %Emulex 10.48 850 563 287 0 (3.9)% 1.5 x 1.3 x 9.9 x 5.7 x 19.8 x 13.6 x (0.4)% NA 6.6 % 33.8% (5.1) x 25.3 % 30.7 %Entropic 5.34 383 345 38 0 73.9 % 2.7 x 2.0 x NM 13.2 x 44.5 x 17.5 x 1.7 % 10.4 % 27.7 % 10.0% (12.1) x 17.3 % 30.8 %EZchip 17.35 433 358 75 0 43.5 % 8.2 x 5.5 x 34.1 x NA 27.8 x 25.1 x 0.7 % NA 31.6 % 17.3% (7.1) x 17.4 % 24.1 %Gennum 7.15 253 216 37 0 66.4 % 2.3 x 1.8 x 14.2 x 9.3 x 55.0 x 15.0 x 14.0 % NA 51.0 % 14.7% (2.4) x 27.1 % 23.6 %Integrated Device 5.84 949 605 343 0 (9.7)% 1.1 x 1.0 x 12.6 x 5.9 x 20.9 x 11.9 x 1.5 % NA 12.5 % 36.2% (7.1) x 12.4 % 27.2 %ITE Tech 1.55 312 222 90 0 (31.7)% 1.7 x NA NA NA 21.5 x NA NA NA NA 29.0% NA 11.2 % 15.8 %LSI 5.33 3,484 2,818 1,016 350 (11.3)% 1.2 x 1.0 x 10.6 x 6.0 x 11.6 x 10.8 x 1.0 % 27.7 % 60.3 % 19.1% (2.5) x 13.5 % 26.2 %Mellanox 23.25 780 563 217 1 23.1 % 4.3 x 3.4 x 20.1 x 18.5 x 26.1 x 21.6 x 2.7 % 95.6 % 27.9 % 27.8% (7.7) x 21.1 % 33.9 %Mindspeed 8.47 270 253 31 14 80.6 % 1.7 x 1.4 x NM 7.7 x NM 12.0 x 1.4 % 19.0 % 39.5 % 6.6% (2.8) x 25.8 % 30.4 %NetLogic 28.77 1,802 1,628 177 4 24.4 % 7.1 x 4.1 x 119.1 x 22.5 x 28.6 x 21.3 x 1.2 % NA 10.7 % 9.6% (12.7) x 22.9 % 32.5 %Pericom 9.90 251 143 109 2 (14.1)% 1.1 x 0.9 x 14.4 x NA 29.1 x 15.6 x 4.0 % NA 26.3 % 42.9% (10.9) x 16.9 % 11.6 %PMC-Sierra 8.10 1,867 1,702 224 59 (6.5)% 3.1 x 2.6 x 11.5 x 8.6 x 12.7 x 11.3 x 1.8 % 12.9 % 11.8 % 8.8% (1.1) x 14.6 % 27.5 %QLogic 18.12 2,021 1,645 376 0 (4.0)% 3.0 x 2.7 x 11.3 x 8.5 x 18.1 x 14.7 x 1.7 % (13.3)% 8.7 % 18.6% (2.6) x 19.3 % 23.2 %SMSC 22.88 513 385 140 11 10.1 % 1.2 x 1.0 x 19.8 x 6.6 x 50.8 x 17.8 x 3.9 % 31.9 % 66.2 % 25.0% (6.6) x 25.8 % 25.5 %
M ean 1,004 817 215 28 18.7 % 3.2 x 2.4 x 25.2 x 13.4 x 37.1 x 17.7 x 2.6 % 26.3 % 33.1 % 20.9% (6.2) x 20.3 % 27.4 %M edian 751 536 159 0 10.8 % 2.4 x 2.0 x 14.2 x 8.6 x 27.8 x 15.6 x 1.7 % 19.0 % 27.7 % 18.8% (6.6) x 20.0 % 27.3 %
($ in millions, except per share data)R evenue EB IT D A EP S M R Q/ P YQ Gro wth N T M / LT M Gro wth LQ M argin
C o mpany N ame M R Q LT M N T M M R Q LT M N T M M R Q LT M N T M R evenue EB IT D A EP S R evenue EB IT D A EP S Gro ss EB IT D A N et
WirelineAMCC 58 205.6 251.7 3 (2.5) 15.3 0.09 0.16 0.43 40.5% 131.0% 169.2% 22.4% NM 168.8% 60.4 % 5.5 % 10.2 %Cavium 42 122.5 214.3 0 (2.3) 40.3 0.14 0.22 0.86 104.3% 102.8% 450.0% 75.0% NM 289.8% 59.6 % 0.2 % 14.7 %Emulex 102 375.3 437.1 17 56.9 98.7 0.18 0.53 0.77 30.1% 481.3% 260.0% 16.5% 73.5% 45.5% 63.0 % 16.8 % 14.4 %Entropic 37 129.6 175.9 3 3.2 26.1 0.06 0.12 0.30 55.3% 139.5% 200.0% 35.7% 722.6% 153.8% 52.7 % 6.9 % 11.9 %EZchip 14 43.8 64.6 4 10.5 NA 0.20 0.62 0.69 38.0% 146.4% 45.7% 47.6% NA 10.6% 72.7 % 33.0 % 38.5 %Gennum 30 95.4 118.7 7 15.2 23.3 0.12 0.13 0.48 52.5% 516.6% 700.0% 24.4% 53.1% 267.5% 72.9 % 25.1 % 13.9 %Integrated Device 138 535.9 634.0 16 48.0 101.9 0.09 0.28 0.49 28.4% 282.2% 550.0% 18.3% 112.0% 75.6% 44.0 % 11.5 % 10.8 %ITE Tech 37 132.0 NA NA NA NA 0.02 0.07 NA 45.8% NA (9.5)% NA NM NA 39.0 % 19.3 % 10.7 %LSI 637 2,374.1 2,768.5 85 266.2 469.5 0.14 0.46 0.49 32.1% 965.8% 566.7% 16.6% 76.4% 7.1% 42.6 % 13.3 % 14.6 %Mellanox 36 129.7 166.9 8 28.0 30.4 0.29 0.89 1.08 60.5% 122.4% 262.5% 28.7% 8.5% 21.1% 75.1 % 23.1 % 27.8 %Mindspeed 40 144.6 179.5 5 6.3 32.9 0.15 0.13 0.71 41.1% 182.8% 162.5% 24.2% 420.7% 442.3% 64.4 % 11.8 % 11.4 %NetLogic 86 230.6 393.5 12 13.7 72.3 0.31 1.01 1.35 184.0% 479.3% 113.8% 70.7% 428.6% 34.5% 54.6 % 14.1 % 20.8 %Pericom 37 135.0 164.0 5 9.9 NA 0.12 0.34 0.63 50.3% 187.2% 140.0% 21.4% NA 86.3% 35.3 % 12.4 % 8.4 %PMC-Sierra 153 546.4 648.1 44 148.1 197.1 0.19 0.64 0.71 49.0% 358.3% 533.3% 18.6% 33.1% 11.7% 67.9 % 28.5 % 29.0 %QLogic 146 549.1 610.6 39 145.8 192.8 0.28 1.00 1.23 11.6% (4.0)% 40.0% 11.2% 32.2% 23.5% 62.7 % 26.8 % 21.8 %SMSC 83 307.8 387.3 8 19.4 58.3 0.18 0.45 1.29 62.0% 144.1% 133.3% 25.8% 200.6% 185.8% 53.8 % 9.3 % 4.9 %
M ean 105 379 481 17 51 105 0.16 0.44 0.77 55.3% 282.4% 269.8% 30.5% 196.5% 121.6% 57.5 % 16.1 % 16.5 %M edian 50 175 252 8 15 58 0.15 0.40 0.71 47.4% 182.8% 184.6% 24.2% 76.4% 75.6% 60.0 % 13.7 % 14.2 %
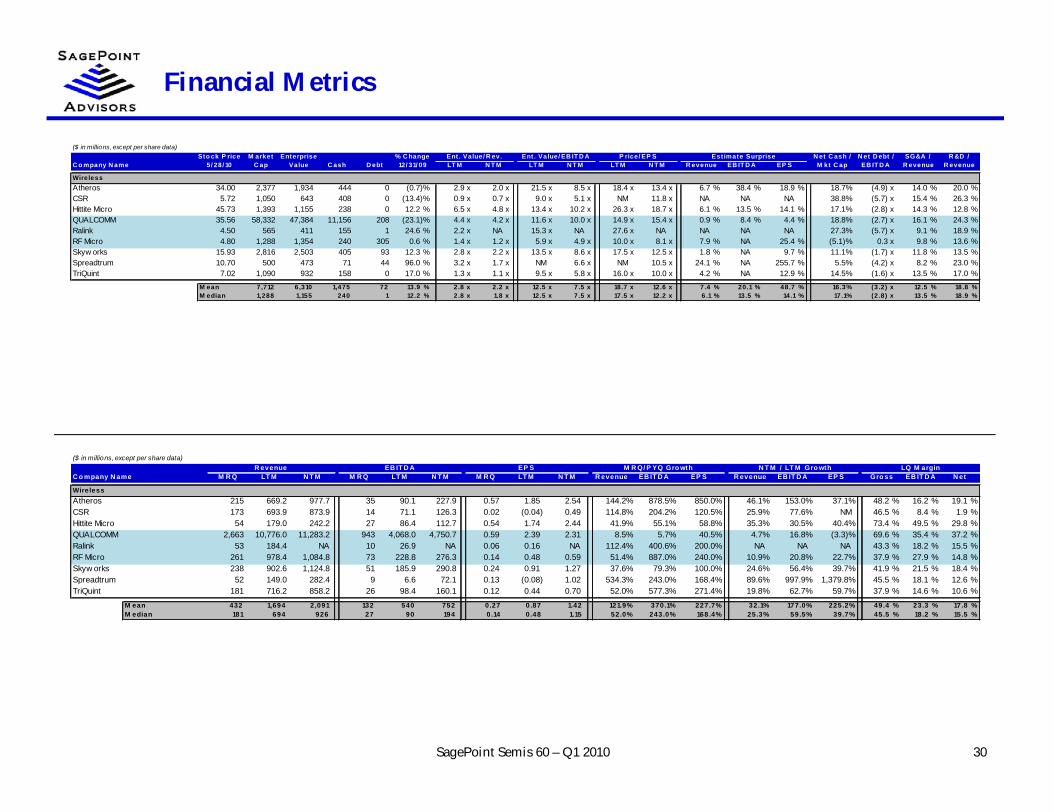
Financial Metrics
30SagePoint Semis 60 – Q1 2010
($ in millions, except per share data)Sto ck P rice M arket Enterprise % C hange Ent. Value/ R ev. Ent . Value/ EB IT D A P rice/ EP S Est imate Surprise N et C ash / N et D ebt / SG&A / R &D /
C o mpany N ame 5/ 28/ 10 C ap Value C ash D ebt 12/ 31/ 09 LT M N T M LT M N T M LT M N T M R evenue EB IT D A EP S M kt C ap EB IT D A R evenue R evenue
WirelessAtheros 34.00 2,377 1,934 444 0 (0.7)% 2.9 x 2.0 x 21.5 x 8.5 x 18.4 x 13.4 x 6.7 % 38.4 % 18.9 % 18.7% (4.9) x 14.0 % 20.0 %CSR 5.72 1,050 643 408 0 (13.4)% 0.9 x 0.7 x 9.0 x 5.1 x NM 11.8 x NA NA NA 38.8% (5.7) x 15.4 % 26.3 %Hittite Micro 45.73 1,393 1,155 238 0 12.2 % 6.5 x 4.8 x 13.4 x 10.2 x 26.3 x 18.7 x 6.1 % 13.5 % 14.1 % 17.1% (2.8) x 14.3 % 12.8 %QUALCOMM 35.56 58,332 47,384 11,156 208 (23.1)% 4.4 x 4.2 x 11.6 x 10.0 x 14.9 x 15.4 x 0.9 % 8.4 % 4.4 % 18.8% (2.7) x 16.1 % 24.3 %Ralink 4.50 565 411 155 1 24.6 % 2.2 x NA 15.3 x NA 27.6 x NA NA NA NA 27.3% (5.7) x 9.1 % 18.9 %RF Micro 4.80 1,288 1,354 240 305 0.6 % 1.4 x 1.2 x 5.9 x 4.9 x 10.0 x 8.1 x 7.9 % NA 25.4 % (5.1)% 0.3 x 9.8 % 13.6 %Skyw orks 15.93 2,816 2,503 405 93 12.3 % 2.8 x 2.2 x 13.5 x 8.6 x 17.5 x 12.5 x 1.8 % NA 9.7 % 11.1% (1.7) x 11.8 % 13.5 %Spreadtrum 10.70 500 473 71 44 96.0 % 3.2 x 1.7 x NM 6.6 x NM 10.5 x 24.1 % NA 255.7 % 5.5% (4.2) x 8.2 % 23.0 %TriQuint 7.02 1,090 932 158 0 17.0 % 1.3 x 1.1 x 9.5 x 5.8 x 16.0 x 10.0 x 4.2 % NA 12.9 % 14.5% (1.6) x 13.5 % 17.0 %
M ean 7,712 6,310 1,475 72 13.9 % 2.8 x 2.2 x 12.5 x 7.5 x 18.7 x 12.6 x 7.4 % 20.1 % 48.7 % 16.3% (3.2) x 12.5 % 18.8 %M edian 1,288 1,155 240 1 12.2 % 2.8 x 1.8 x 12.5 x 7.5 x 17.5 x 12.2 x 6.1 % 13.5 % 14.1 % 17.1% (2.8) x 13.5 % 18.9 %
($ in millions, except per share data)R evenue EB IT D A EP S M R Q/ P YQ Gro wth N T M / LT M Gro wth LQ M argin
C o mpany N ame M R Q LT M N T M M R Q LT M N T M M R Q LT M N T M R evenue EB IT D A EP S R evenue EB IT D A EP S Gro ss EB IT D A N et
WirelessAtheros 215 669.2 977.7 35 90.1 227.9 0.57 1.85 2.54 144.2% 878.5% 850.0% 46.1% 153.0% 37.1% 48.2 % 16.2 % 19.1 %CSR 173 693.9 873.9 14 71.1 126.3 0.02 (0.04) 0.49 114.8% 204.2% 120.5% 25.9% 77.6% NM 46.5 % 8.4 % 1.9 %Hittite Micro 54 179.0 242.2 27 86.4 112.7 0.54 1.74 2.44 41.9% 55.1% 58.8% 35.3% 30.5% 40.4% 73.4 % 49.5 % 29.8 %QUALCOMM 2,663 10,776.0 11,283.2 943 4,068.0 4,750.7 0.59 2.39 2.31 8.5% 5.7% 40.5% 4.7% 16.8% (3.3)% 69.6 % 35.4 % 37.2 %Ralink 53 184.4 NA 10 26.9 NA 0.06 0.16 NA 112.4% 400.6% 200.0% NA NA NA 43.3 % 18.2 % 15.5 %RF Micro 261 978.4 1,084.8 73 228.8 276.3 0.14 0.48 0.59 51.4% 887.0% 240.0% 10.9% 20.8% 22.7% 37.9 % 27.9 % 14.8 %Skyw orks 238 902.6 1,124.8 51 185.9 290.8 0.24 0.91 1.27 37.6% 79.3% 100.0% 24.6% 56.4% 39.7% 41.9 % 21.5 % 18.4 %Spreadtrum 52 149.0 282.4 9 6.6 72.1 0.13 (0.08) 1.02 534.3% 243.0% 168.4% 89.6% 997.9% 1,379.8% 45.5 % 18.1 % 12.6 %TriQuint 181 716.2 858.2 26 98.4 160.1 0.12 0.44 0.70 52.0% 577.3% 271.4% 19.8% 62.7% 59.7% 37.9 % 14.6 % 10.6 %
M ean 432 1,694 2,091 132 540 752 0.27 0.87 1.42 121.9% 370.1% 227.7% 32.1% 177.0% 225.2% 49.4 % 23.3 % 17.8 %M edian 181 694 926 27 90 194 0.14 0.48 1.15 52.0% 243.0% 168.4% 25.3% 59.5% 39.7% 45.5 % 18.2 % 15.5 %
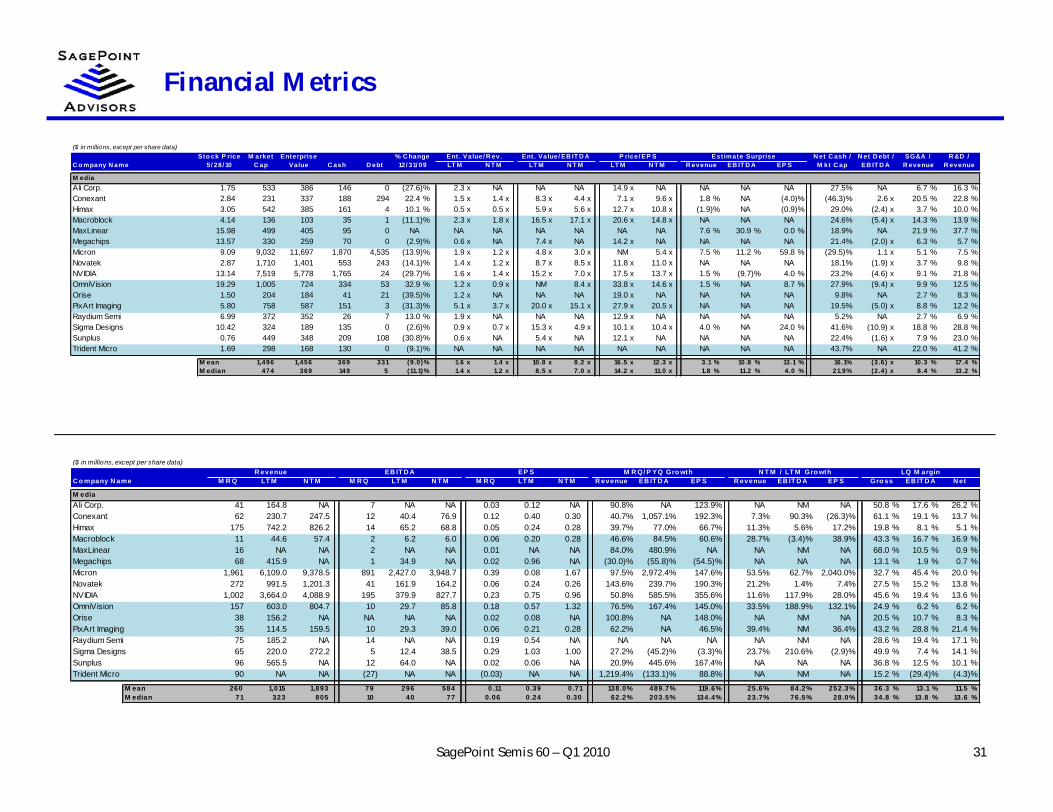
Financial Metrics
31SagePoint Semis 60 – Q1 2010
($ in millions, except per share data)Sto ck P rice M arket Enterprise % C hange Ent. Value/ R ev. Ent . Value/ EB IT D A P rice/ EP S Est imate Surprise N et C ash / N et D ebt / SG&A / R &D /
C o mpany N ame 5/ 28/ 10 C ap Value C ash D ebt 12/ 31/ 09 LT M N T M LT M N T M LT M N T M R evenue EB IT D A EP S M kt C ap EB IT D A R evenue R evenue
M ediaAli Corp. 1.75 533 386 146 0 (27.6)% 2.3 x NA NA NA 14.9 x NA NA NA NA 27.5% NA 6.7 % 16.3 %Conexant 2.84 231 337 188 294 22.4 % 1.5 x 1.4 x 8.3 x 4.4 x 7.1 x 9.6 x 1.8 % NA (4.0)% (46.3)% 2.6 x 20.5 % 22.8 %Himax 3.05 542 385 161 4 10.1 % 0.5 x 0.5 x 5.9 x 5.6 x 12.7 x 10.8 x (1.9)% NA (0.9)% 29.0% (2.4) x 3.7 % 10.0 %Macroblock 4.14 136 103 35 1 (11.1)% 2.3 x 1.8 x 16.5 x 17.1 x 20.6 x 14.8 x NA NA NA 24.6% (5.4) x 14.3 % 13.9 %MaxLinear 15.98 499 405 95 0 NA NA NA NA NA NA NA 7.6 % 30.9 % 0.0 % 18.9% NA 21.9 % 37.7 %Megachips 13.57 330 259 70 0 (2.9)% 0.6 x NA 7.4 x NA 14.2 x NA NA NA NA 21.4% (2.0) x 6.3 % 5.7 %Micron 9.09 9,032 11,697 1,870 4,535 (13.9)% 1.9 x 1.2 x 4.8 x 3.0 x NM 5.4 x 7.5 % 11.2 % 59.8 % (29.5)% 1.1 x 5.1 % 7.5 %Novatek 2.87 1,710 1,401 553 243 (14.1)% 1.4 x 1.2 x 8.7 x 8.5 x 11.8 x 11.0 x NA NA NA 18.1% (1.9) x 3.7 % 9.8 %NVIDIA 13.14 7,519 5,778 1,765 24 (29.7)% 1.6 x 1.4 x 15.2 x 7.0 x 17.5 x 13.7 x 1.5 % (9.7)% 4.0 % 23.2% (4.6) x 9.1 % 21.8 %OmniVision 19.29 1,005 724 334 53 32.9 % 1.2 x 0.9 x NM 8.4 x 33.8 x 14.6 x 1.5 % NA 8.7 % 27.9% (9.4) x 9.9 % 12.5 %Orise 1.50 204 184 41 21 (39.5)% 1.2 x NA NA NA 19.0 x NA NA NA NA 9.8% NA 2.7 % 8.3 %PixArt Imaging 5.80 758 587 151 3 (31.3)% 5.1 x 3.7 x 20.0 x 15.1 x 27.9 x 20.5 x NA NA NA 19.5% (5.0) x 8.8 % 12.2 %Raydium Semi 6.99 372 352 26 7 13.0 % 1.9 x NA NA NA 12.9 x NA NA NA NA 5.2% NA 2.7 % 6.9 %Sigma Designs 10.42 324 189 135 0 (2.6)% 0.9 x 0.7 x 15.3 x 4.9 x 10.1 x 10.4 x 4.0 % NA 24.0 % 41.6% (10.9) x 18.8 % 28.8 %Sunplus 0.76 449 348 209 108 (30.8)% 0.6 x NA 5.4 x NA 12.1 x NA NA NA NA 22.4% (1.6) x 7.9 % 23.0 %Trident Micro 1.69 298 168 130 0 (9.1)% NA NA NA NA NA NA NA NA NA 43.7% NA 22.0 % 41.2 %
M ean 1,496 1,456 369 331 (9.0)% 1.6 x 1.4 x 10.8 x 8.2 x 16.5 x 12.3 x 3.1 % 10.8 % 13.1 % 16.1% (3.6) x 10.3 % 17.4 %M edian 474 369 149 5 (11.1)% 1.4 x 1.2 x 8.5 x 7.0 x 14.2 x 11.0 x 1.8 % 11.2 % 4.0 % 21.9% (2.4) x 8.4 % 13.2 %
($ in millions, except per share data)R evenue EB IT D A EP S M R Q/ P YQ Gro wth N T M / LT M Gro wth LQ M argin
C o mpany N ame M R Q LT M N T M M R Q LT M N T M M R Q LT M N T M R evenue EB IT D A EP S R evenue EB IT D A EP S Gro ss EB IT D A N et
M ediaAli Corp. 41 164.8 NA 7 NA NA 0.03 0.12 NA 90.8% NA 123.9% NA NM NA 50.8 % 17.6 % 26.2 %Conexant 62 230.7 247.5 12 40.4 76.9 0.12 0.40 0.30 40.7% 1,057.1% 192.3% 7.3% 90.3% (26.3)% 61.1 % 19.1 % 13.7 %Himax 175 742.2 826.2 14 65.2 68.8 0.05 0.24 0.28 39.7% 77.0% 66.7% 11.3% 5.6% 17.2% 19.8 % 8.1 % 5.1 %Macroblock 11 44.6 57.4 2 6.2 6.0 0.06 0.20 0.28 46.6% 84.5% 60.6% 28.7% (3.4)% 38.9% 43.3 % 16.7 % 16.9 %MaxLinear 16 NA NA 2 NA NA 0.01 NA NA 84.0% 480.9% NA NA NM NA 68.0 % 10.5 % 0.9 %Megachips 68 415.9 NA 1 34.9 NA 0.02 0.96 NA (30.0)% (55.8)% (54.5)% NA NA NA 13.1 % 1.9 % 0.7 %Micron 1,961 6,109.0 9,378.5 891 2,427.0 3,948.7 0.39 0.08 1.67 97.5% 2,972.4% 147.6% 53.5% 62.7% 2,040.0% 32.7 % 45.4 % 20.0 %Novatek 272 991.5 1,201.3 41 161.9 164.2 0.06 0.24 0.26 143.6% 239.7% 190.3% 21.2% 1.4% 7.4% 27.5 % 15.2 % 13.8 %NVIDIA 1,002 3,664.0 4,088.9 195 379.9 827.7 0.23 0.75 0.96 50.8% 585.5% 355.6% 11.6% 117.9% 28.0% 45.6 % 19.4 % 13.6 %OmniVision 157 603.0 804.7 10 29.7 85.8 0.18 0.57 1.32 76.5% 167.4% 145.0% 33.5% 188.9% 132.1% 24.9 % 6.2 % 6.2 %Orise 38 156.2 NA NA NA NA 0.02 0.08 NA 100.8% NA 148.0% NA NM NA 20.5 % 10.7 % 8.3 %PixArt Imaging 35 114.5 159.5 10 29.3 39.0 0.06 0.21 0.28 62.2% NA 46.5% 39.4% NM 36.4% 43.2 % 28.8 % 21.4 %Raydium Semi 75 185.2 NA 14 NA NA 0.19 0.54 NA NA NA NA NA NM NA 28.6 % 19.4 % 17.1 %Sigma Designs 65 220.0 272.2 5 12.4 38.5 0.29 1.03 1.00 27.2% (45.2)% (3.3)% 23.7% 210.6% (2.9)% 49.9 % 7.4 % 14.1 %Sunplus 96 565.5 NA 12 64.0 NA 0.02 0.06 NA 20.9% 445.6% 167.4% NA NA NA 36.8 % 12.5 % 10.1 %Trident Micro 90 NA NA (27) NA NA (0.03) NA NA 1,219.4% (133.1)% 88.8% NA NM NA 15.2 % (29.4)% (4.3)%
M ean 260 1,015 1,893 79 296 584 0.11 0.39 0.71 138.0% 489.7% 119.6% 25.6% 84.2% 252.3% 36.3 % 13.1 % 11.5 %M edian 71 323 805 10 40 77 0.06 0.24 0.30 62.2% 203.5% 134.4% 23.7% 76.5% 28.0% 34.8 % 13.8 % 13.6 %
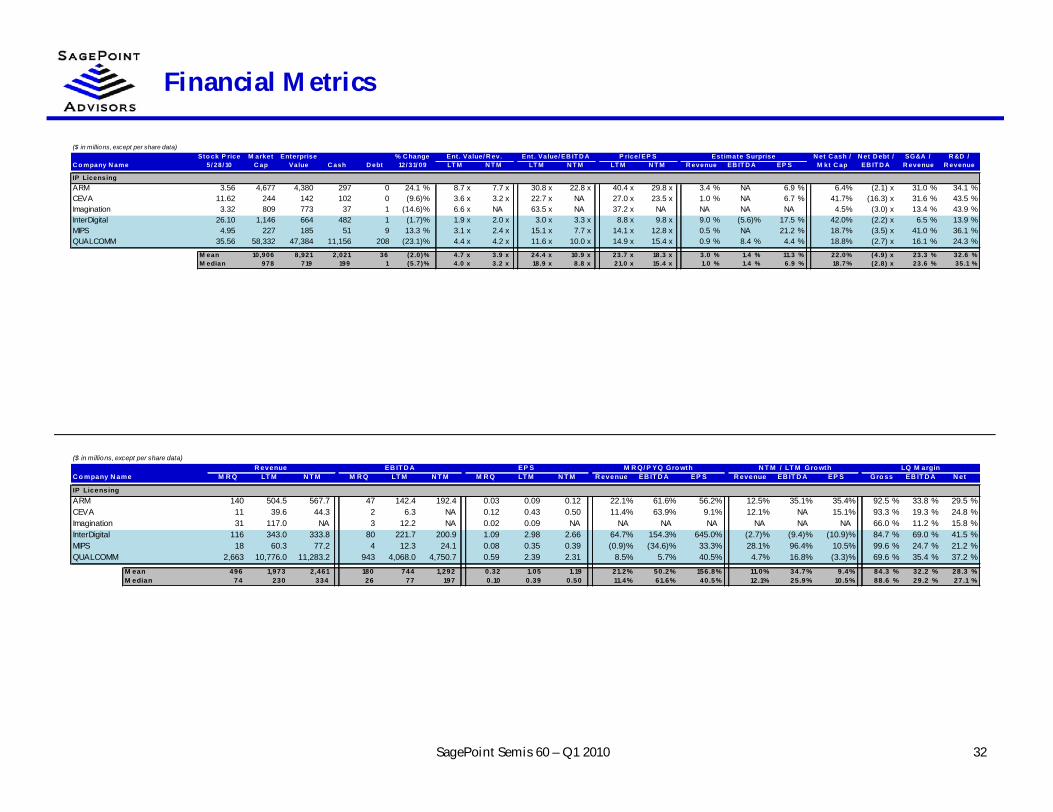
Financial Metrics
32SagePoint Semis 60 – Q1 2010
($ in millions, except per share data)Sto ck P rice M arket Enterprise % C hange Ent. Value/ R ev. Ent . Value/ EB IT D A P rice/ EP S Est imate Surprise N et C ash / N et D ebt / SG&A / R &D /
C o mpany N ame 5/ 28/ 10 C ap Value C ash D ebt 12/ 31/ 09 LT M N T M LT M N T M LT M N T M R evenue EB IT D A EP S M kt C ap EB IT D A R evenue R evenue
IP LicensingARM 3.56 4,677 4,380 297 0 24.1 % 8.7 x 7.7 x 30.8 x 22.8 x 40.4 x 29.8 x 3.4 % NA 6.9 % 6.4% (2.1) x 31.0 % 34.1 %CEVA 11.62 244 142 102 0 (9.6)% 3.6 x 3.2 x 22.7 x NA 27.0 x 23.5 x 1.0 % NA 6.7 % 41.7% (16.3) x 31.6 % 43.5 %Imagination 3.32 809 773 37 1 (14.6)% 6.6 x NA 63.5 x NA 37.2 x NA NA NA NA 4.5% (3.0) x 13.4 % 43.9 %InterDigital 26.10 1,146 664 482 1 (1.7)% 1.9 x 2.0 x 3.0 x 3.3 x 8.8 x 9.8 x 9.0 % (5.6)% 17.5 % 42.0% (2.2) x 6.5 % 13.9 %MIPS 4.95 227 185 51 9 13.3 % 3.1 x 2.4 x 15.1 x 7.7 x 14.1 x 12.8 x 0.5 % NA 21.2 % 18.7% (3.5) x 41.0 % 36.1 %QUALCOMM 35.56 58,332 47,384 11,156 208 (23.1)% 4.4 x 4.2 x 11.6 x 10.0 x 14.9 x 15.4 x 0.9 % 8.4 % 4.4 % 18.8% (2.7) x 16.1 % 24.3 %
M ean 10,906 8,921 2,021 36 (2.0)% 4.7 x 3.9 x 24.4 x 10.9 x 23.7 x 18.3 x 3.0 % 1.4 % 11.3 % 22.0% (4.9) x 23.3 % 32.6 %M edian 978 719 199 1 (5.7)% 4.0 x 3.2 x 18.9 x 8.8 x 21.0 x 15.4 x 1.0 % 1.4 % 6.9 % 18.7% (2.8) x 23.6 % 35.1 %
($ in millions, except per share data)R evenue EB IT D A EP S M R Q/ P YQ Gro wth N T M / LT M Gro wth LQ M argin
C o mpany N ame M R Q LT M N T M M R Q LT M N T M M R Q LT M N T M R evenue EB IT D A EP S R evenue EB IT D A EP S Gro ss EB IT D A N et
IP LicensingARM 140 504.5 567.7 47 142.4 192.4 0.03 0.09 0.12 22.1% 61.6% 56.2% 12.5% 35.1% 35.4% 92.5 % 33.8 % 29.5 %CEVA 11 39.6 44.3 2 6.3 NA 0.12 0.43 0.50 11.4% 63.9% 9.1% 12.1% NA 15.1% 93.3 % 19.3 % 24.8 %Imagination 31 117.0 NA 3 12.2 NA 0.02 0.09 NA NA NA NA NA NA NA 66.0 % 11.2 % 15.8 %InterDigital 116 343.0 333.8 80 221.7 200.9 1.09 2.98 2.66 64.7% 154.3% 645.0% (2.7)% (9.4)% (10.9)% 84.7 % 69.0 % 41.5 %MIPS 18 60.3 77.2 4 12.3 24.1 0.08 0.35 0.39 (0.9)% (34.6)% 33.3% 28.1% 96.4% 10.5% 99.6 % 24.7 % 21.2 %QUALCOMM 2,663 10,776.0 11,283.2 943 4,068.0 4,750.7 0.59 2.39 2.31 8.5% 5.7% 40.5% 4.7% 16.8% (3.3)% 69.6 % 35.4 % 37.2 %
M ean 496 1,973 2,461 180 744 1,292 0.32 1.05 1.19 21.2% 50.2% 156.8% 11.0% 34.7% 9.4% 84.3 % 32.2 % 28.3 %M edian 74 230 334 26 77 197 0.10 0.39 0.50 11.4% 61.6% 40.5% 12.1% 25.9% 10.5% 88.6 % 29.2 % 27.1 %

Introduction to SagePoint Advisors
SagePoint Semis 60 – Q1 2010
Introduction to SagePoint Advisors
34
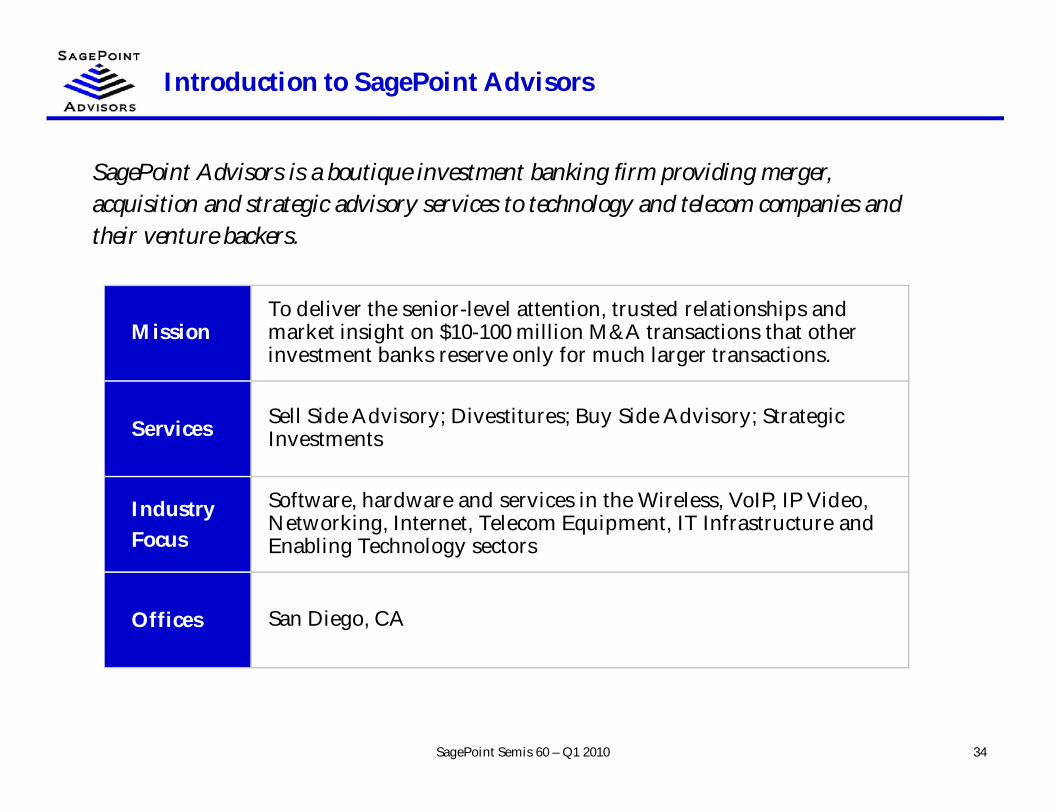
SagePoint Advisors is a boutique investment banking firm providing merger,acquisition and strategic advisory services to technology and telecom companies andtheir venture backers.
SagePoint Semis 60 – Q1 2010
MissionTo deliver the senior-level attention, trusted relationships andmarket insight on $10-100 million M&A transactions that otherinvestment banks reserve only for much larger transactions.
Services Sell Side Advisory; Divestitures; Buy Side Advisory; StrategicInvestments
IndustryFocus
Software, hardware and services in the Wireless, VoIP, IP Video,Networking, Internet, Telecom Equipment, IT Infrastructure andEnabling Technology sectors
Offices San Diego, CA

SagePoint Advisors Team
35
David P. Michaels - Founder & Managing DirectorPrior to founding SagePoint Advisors in 2008, David Michaels was a Co-Founder, Partner and Managing Director atMontgomery & Co., a leading investment bank focused on serving emerging-growth technology companies and their venturebackers. Mr. Michaels co-founded Montgomery’s investment banking business in 1996 as the lead banker and played aninstrumental role in building the business to over $50 million in revenues and 80 employees. Mr. Michaels launchedMontgomery’s San Diego office in 2003 and established Montgomery as the dominant brand in the region. Mr. Michaels alsoran the firm’s Communications and Digital Media Technology practice areas for several years prior to his departure. Duringhis 14 year tenure at Montgomery, Mr. Michaels advised CEOs and Boards on more than 75 corporate strategy, M&A and fundraising engagements.
Mr. Michaels has intimate knowledge of the strategic landscape, market dynamics and technology underpinnings of severalhigh technology market segments including wireless infrastructure, software and services, voice, video and datainfrastructure, software and services, storage infrastructure and software, networking equipment, Internet software andservices and semiconductors. Prior to co-founding Montgomery’s investment banking business, Mr. Michaels managedstrategic consulting assignments for the firm including market entry analysis, acquisition search studies and strategic portfolioassessments.
Prior to joining the Montgomery in 1994, Mr. Michaels held various investment banking positions including a position withinBankers Trust Corporate Finance Department, where he helped execute merger and acquisition assignments such as salemandates and valuation analyses. Prior to that, Mr. Michaels worked as a structural engineer at General Dynamics, where heassisted on the Advanced Tactical Fighter program. Mr. Michaels received an M.B.A. with an emphasis in marketing andentrepreneurship from the Anderson School of Management at UCLA and holds a B.S. in Mechanical Engineering from theUniversity of Michigan.
Teak Murphy - Senior AssociatePrior to joining SagePoint, Teak worked as a Senior Associate with Enterprise Partners Venture Capital, the largest SouthernCalifornia based VC firm, where he evaluated investment opportunities and worked closely with senior management andboard members to successfully grow portfolio companies. Prior to Enterprise Partners, Teak worked as an Associate intechnology investment banking at Montgomery & Co. where he spent three years working closely with SagePoint's founderDavid Michaels on buy-side and sell-side M&A transactions. Prior to Montgomery, Teak worked at Cowen & Co. advisingtechnology companies on M&A and IPO transactions.
Teak's experience working on fund raising, mergers and acquisitions, and initial public offerings as both an advisor andinvestor provides unique insight into the needs of venture-backed companies. Teak graduated from the University of SouthernCalifornia with honors, receiving a B.S. in Business Administration and Finance .
SagePoint Semis 60 – Q1 2010
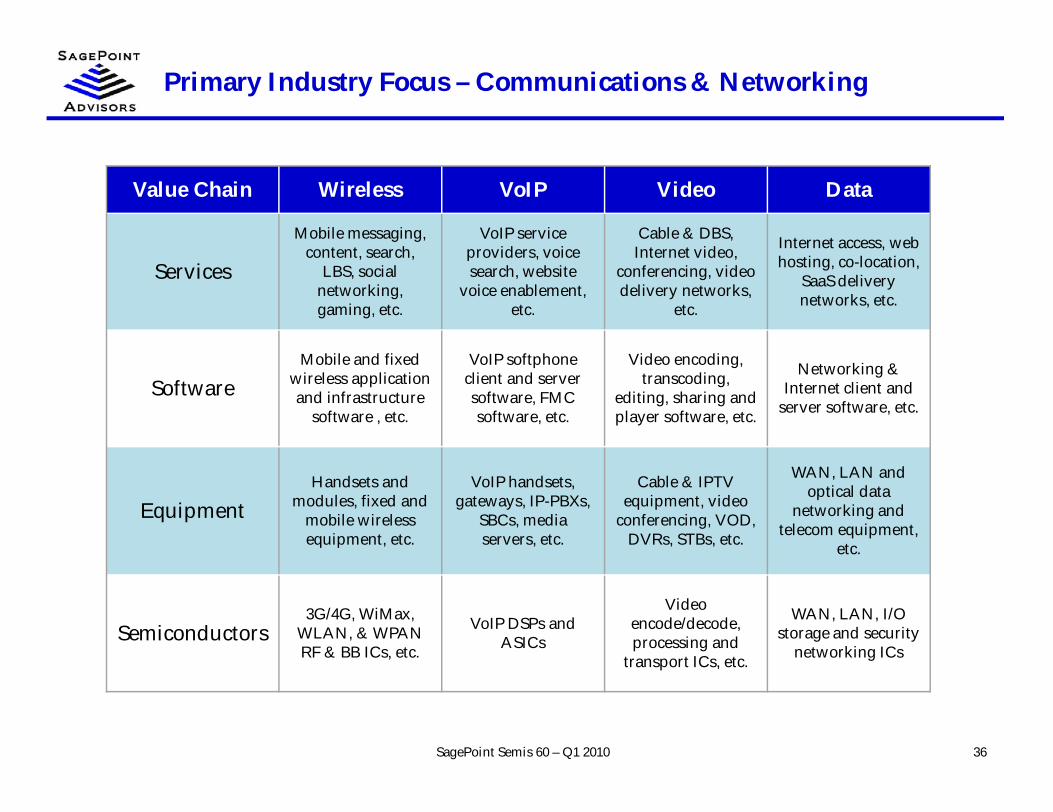
Primary Industry Focus – Communications & Networking
36SagePoint Semis 60 – Q1 2010
Value Chain Wireless VoIP Video Data
Services
Mobile messaging,content, search,
LBS, socialnetworking,gaming, etc.
VoIP serviceproviders, voicesearch, website
voice enablement,etc.
Cable & DBS,Internet video,
conferencing, videodelivery networks,
etc.
Internet access, webhosting, co-location,
SaaS deliverynetworks, etc.
SoftwareMobile and fixed
wireless applicationand infrastructure
software , etc.
VoIP softphoneclient and serversoftware, FMCsoftware, etc.
Video encoding,transcoding,
editing, sharing andplayer software, etc.
Networking &Internet client and
server software, etc.
EquipmentHandsets and
modules, fixed andmobile wirelessequipment, etc.
VoIP handsets,gateways, IP-PBXs,
SBCs, mediaservers, etc.
Cable & IPTVequipment, video
conferencing, VOD,DVRs, STBs, etc.
WAN, LAN andoptical data
networking andtelecom equipment,
etc.
Semiconductors3G/4G, WiMax,
WLAN, & WPANRF & BB ICs, etc.
VoIP DSPs andASICs
Videoencode/decode,processing and
transport ICs, etc.
WAN, LAN, I/Ostorage and security
networking ICs
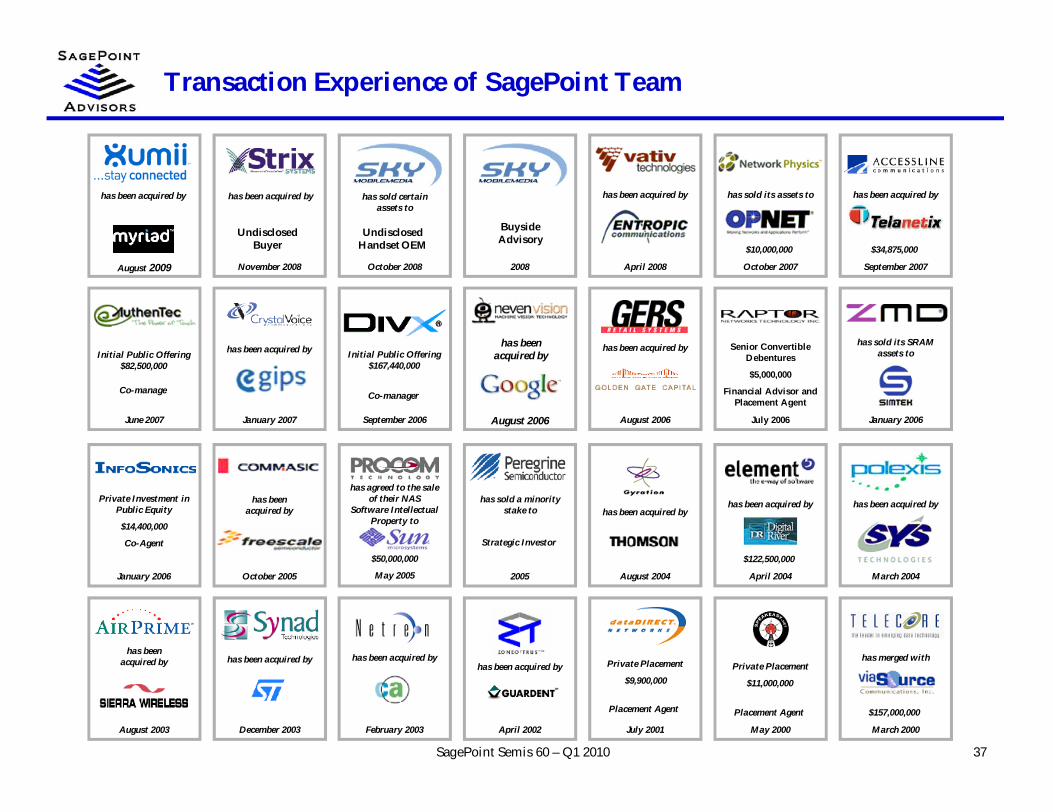
Transaction Experience of SagePoint Team
37SagePoint Semis 60 – Q1 2010
has beenacquired by
August 2006
has beenacquired by
October 2005
has beenacquired by
August 2003
October 2008
has sold certainassets to
UndisclosedHandset OEM
2008
BuysideAdvisory
November 2008
has been acquired by
UndisclosedBuyer
Senior ConvertibleDebentures
$5,000,000
Financial Advisor andPlacement Agent
July 2006
has agreed to the saleof their NAS
Software IntellectualProperty to
$50,000,000
May 2005
has been acquired by
September 2007
$34,875,000
has been acquired by
January 2007
August 2009
has been acquired by
Private Investment inPublic Equity
$14,400,000
Co-Agent
January 2006 2005
Strategic Investor
has sold a minoritystake to
has been acquired by
April 2008
has sold its assets to
October 2007
$10,000,000
Initial Public Offering$82,500,000
June 2007
Co-manage
Initial Public Offering$167,440,000
September 2006
Co-manager
has been acquired by
August 2006
has sold its SRAMassets to
January 2006
has been acquired by
August 2004
has been acquired by
April 2004
$122,500,000
has been acquired by
March 2004
has been acquired by
February 2003
has been acquired by
April 2002
Private Placement
July 2001
Placement Agent
$9,900,000Private Placement
May 2000
Placement Agent
$11,000,000
has merged with
March 2000
$157,000,000
has been acquired by
December 2003
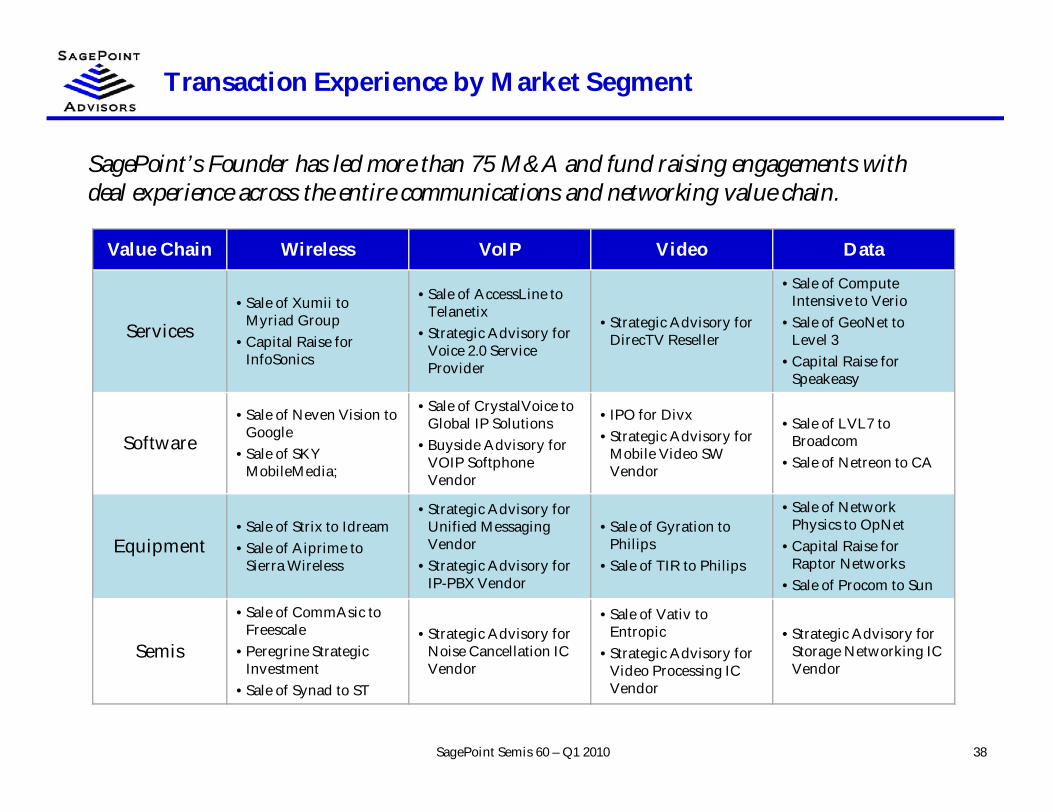
Transaction Experience by Market Segment
38SagePoint Semis 60 – Q1 2010
SagePoint’s Founder has led more than 75 M&A and fund raising engagements withdeal experience across the entire communications and networking value chain.
Value Chain Wireless VoIP Video Data
Services• Sale of Xumii to
Myriad Group• Capital Raise for
InfoSonics
• Sale of AccessLine toTelanetix
• Strategic Advisory forVoice 2.0 ServiceProvider
• Strategic Advisory forDirecTV Reseller
• Sale of ComputeIntensive to Verio
• Sale of GeoNet toLevel 3
• Capital Raise forSpeakeasy
Software• Sale of Neven Vision to
Google• Sale of SKY
MobileMedia;
• Sale of CrystalVoice toGlobal IP Solutions
• Buyside Advisory forVOIP SoftphoneVendor
• IPO for Divx• Strategic Advisory for
Mobile Video SWVendor
• Sale of LVL7 toBroadcom
• Sale of Netreon to CA
Equipment• Sale of Strix to Idream• Sale of Aiprime to
Sierra Wireless
• Strategic Advisory forUnified MessagingVendor
• Strategic Advisory forIP-PBX Vendor
• Sale of Gyration toPhilips
• Sale of TIR to Philips
• Sale of NetworkPhysics to OpNet
• Capital Raise forRaptor Networks
• Sale of Procom to Sun
Semis
• Sale of CommAsic toFreescale
• Peregrine StrategicInvestment
• Sale of Synad to ST
• Strategic Advisory forNoise Cancellation ICVendor
• Sale of Vativ toEntropic
• Strategic Advisory forVideo Processing ICVendor
• Strategic Advisory forStorage Networking ICVendor
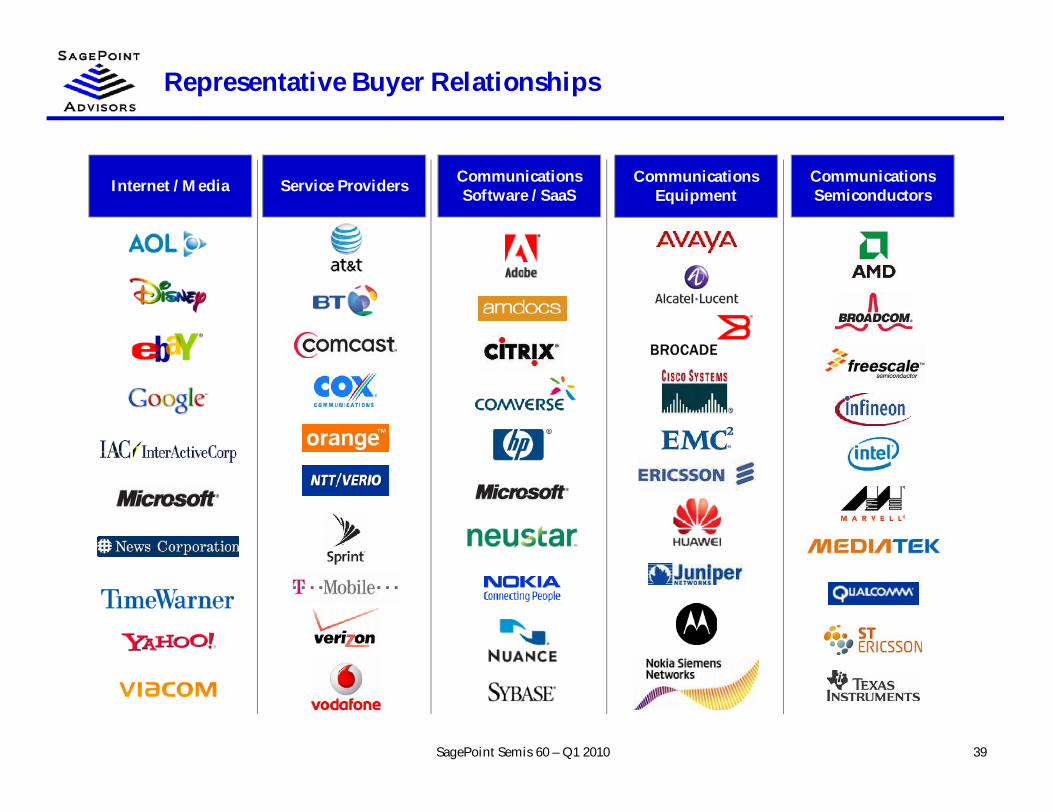
Representative Buyer Relationships
39
Internet / Media Service Providers CommunicationsEquipment
CommunicationsSemiconductors
CommunicationsSoftware / SaaS
SagePoint Semis 60 – Q1 2010
Why Work With SagePoint?
40SagePoint Semis 60 – Q1 2010
• SagePoint delivers the senior-level attention, trusted relationships and market insight on$10-100M transactions that larger investment banks reserve only for much largertransactions
• SagePoint’s domain knowledge is world-class across the entire communications andnetworking value chain
• SagePoint has developed trusted relationships with the most active strategic buyers acrossthe communications value chain
• SagePoint has the M&A expertise that comes only from decades of experience focusing onstrategic transactions
• SagePoint’s unwavering integrity and commitment to intellectual honesty ensures that wetell our clients what they need to hear to make sound business decisions
• At SagePoint, we offer sage advice that points our clients in the right direction to ensure anoptimal outcome