Embed Size (px)
Citation preview
© 2018 Korn Ferry. All rights reserved 1
Q3 2018
Sales Compensation Trends and Issues for 2018
© 2018 Korn Ferry. All rights reserved 2
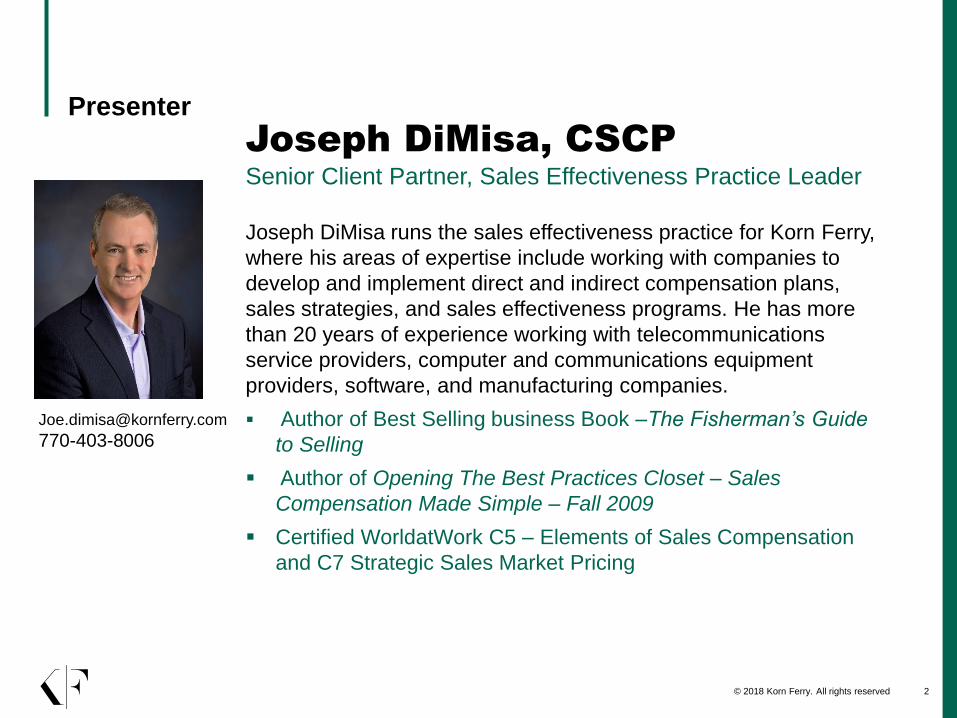
Presenter
Joseph DiMisa, CSCP
Senior Client Partner, Sales Effectiveness Practice Leader
Joseph DiMisa runs the sales effectiveness practice for Korn Ferry,
where his areas of expertise include working with companies to
develop and implement direct and indirect compensation plans,
sales strategies, and sales effectiveness programs. He has more
than 20 years of experience working with telecommunications
service providers, computer and communications equipment
providers, software, and manufacturing companies.
▪ Author of Best Selling business Book –The Fisherman’s Guide
to Selling
▪ Author of Opening The Best Practices Closet – Sales
Compensation Made Simple – Fall 2009
▪ Certified WorldatWork C5 – Elements of Sales Compensation
and C7 Strategic Sales Market Pricing
770-403-8006
© 2018 Korn Ferry. All rights reserved 3
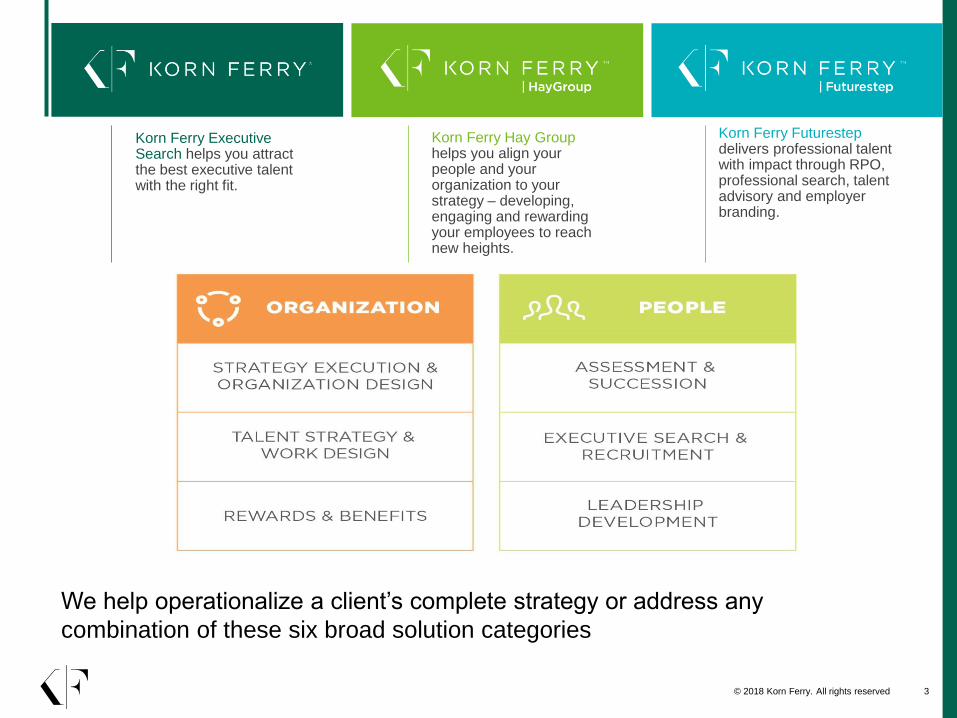
We help operationalize a client’s complete strategy or address any
combination of these six broad solution categories
Korn Ferry Executive Search helps you attract the best executive talent with the right fit.
Korn Ferry Hay Group helps you align your people and your organization to your strategy – developing, engaging and rewarding your employees to reach new heights.
Korn Ferry Futurestep delivers professional talent with impact through RPO, professional search, talent advisory and employer branding.
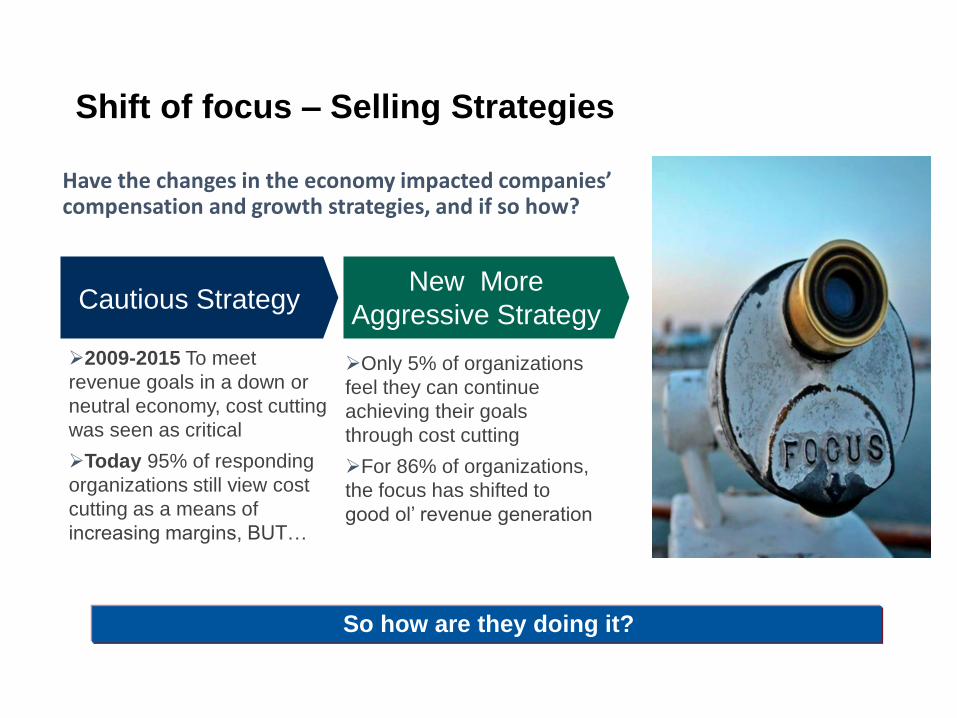
Shift of focus – Selling Strategies
Cautious StrategyNew More
Aggressive Strategy
➢2009-2015 To meet
revenue goals in a down or
neutral economy, cost cutting
was seen as critical
➢Today 95% of responding
organizations still view cost
cutting as a means of
increasing margins, BUT…
➢Only 5% of organizations
feel they can continue
achieving their goals
through cost cutting
➢For 86% of organizations,
the focus has shifted to
good ol’ revenue generation
Have the changes in the economy impacted companies’ compensation and growth strategies, and if so how?
So how are they doing it?
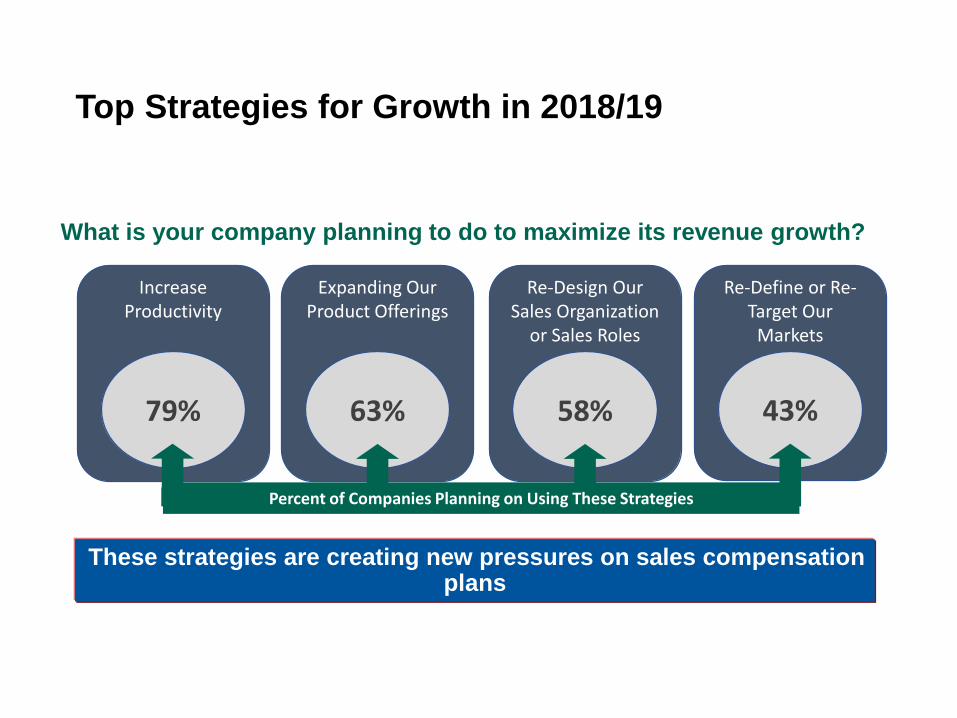
Top Strategies for Growth in 2018/19
What is your company planning to do to maximize its revenue growth?
Increase Productivity
79%
Expanding Our Product Offerings
63%
Re-Design Our Sales Organization
or Sales Roles
58%
Re-Define or Re-Target Our
Markets
43%
Percent of Companies Planning on Using These Strategies
These strategies are creating new pressures on sales compensation plans
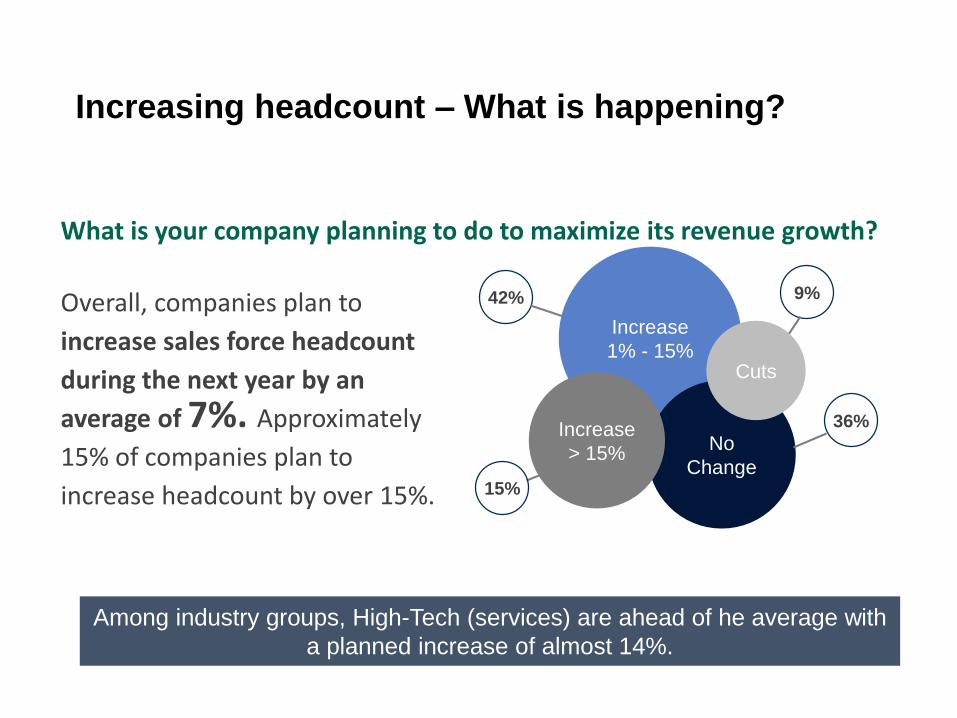
Increasing headcount – What is happening?
Among industry groups, High-Tech (services) are ahead of he average with
a planned increase of almost 14%.
Increase
1% - 15%
No
Change
Increase
> 15%
42%
15%
9%
Cuts
36%
What is your company planning to do to maximize its revenue growth?
Overall, companies plan to
increase sales force headcount
during the next year by an
average of 7%. Approximately
15% of companies plan to
increase headcount by over 15%.
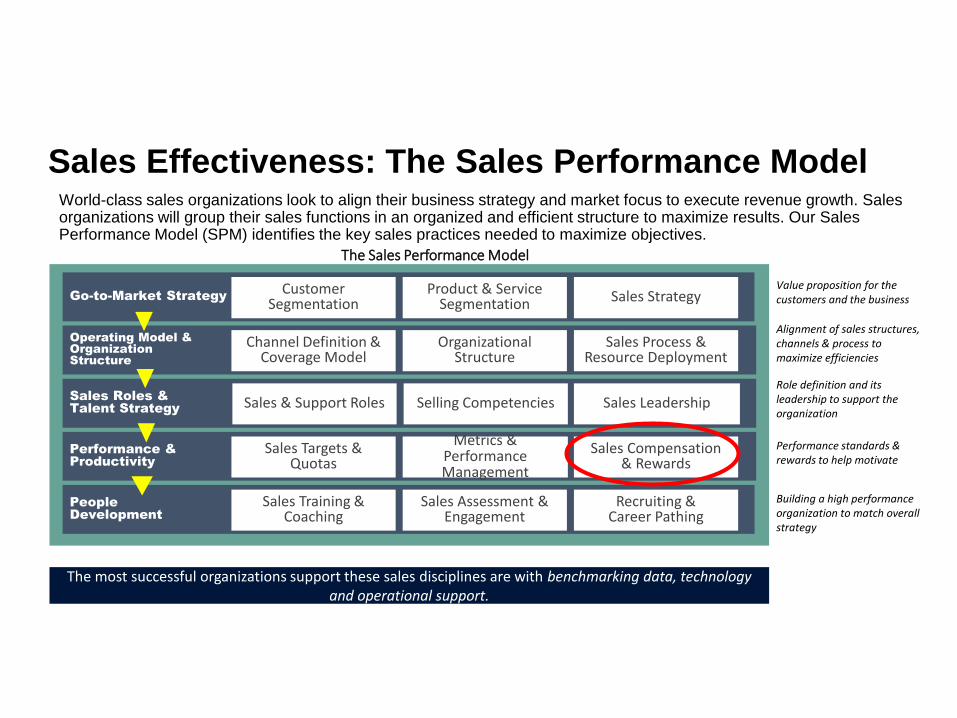
Sales Effectiveness: The Sales Performance Model World-class sales organizations look to align their business strategy and market focus to execute revenue growth. Sales organizations will group their sales functions in an organized and efficient structure to maximize results. Our Sales Performance Model (SPM) identifies the key sales practices needed to maximize objectives.
Value proposition for the customers and the business
Role definition and its leadership to support the organization
Performance standards & rewards to help motivate
Building a high performance organization to match overall strategy
Alignment of sales structures, channels & process to maximize efficiencies
Go-to-Market Strategy
Operating Model &
Organization
Structure
Sales Roles &
Talent Strategy
Performance &
Productivity
People
Development
Customer Segmentation
Product & Service Segmentation Sales Strategy
Channel Definition & Coverage Model
Organizational Structure
Sales Process & Resource Deployment
Sales & Support Roles Selling Competencies Sales Leadership
Sales Targets & Quotas
Metrics & Performance Management
Sales Compensation & Rewards
Sales Training & Coaching
Sales Assessment & Engagement
Recruiting & Career Pathing
The Sales Performance Model
The most successful organizations support these sales disciplines are with benchmarking data, technology and operational support.
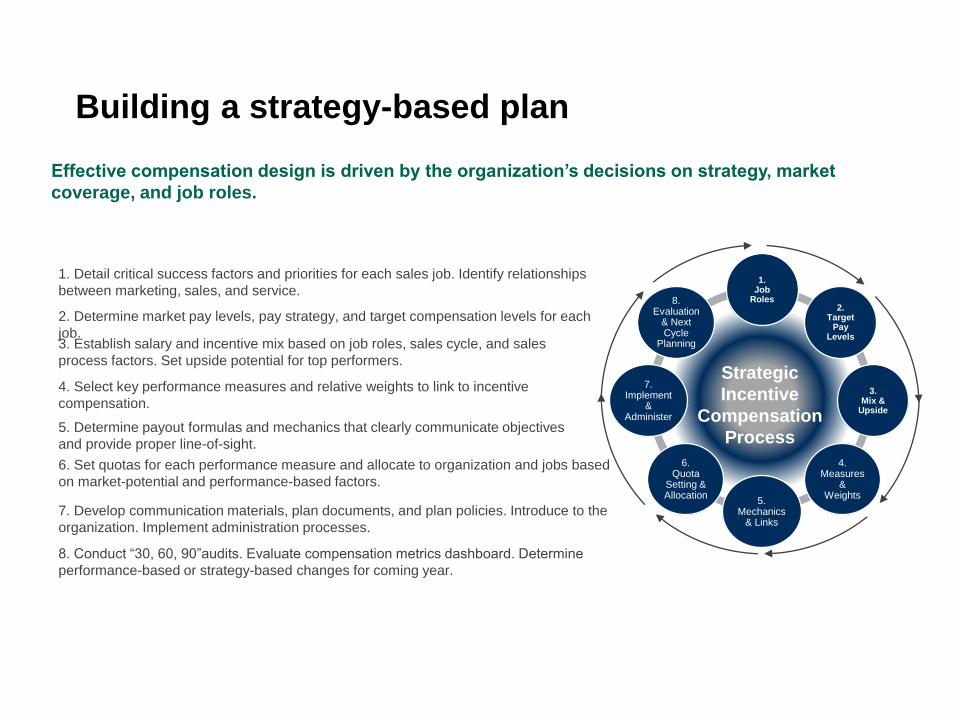
Building a strategy-based plan
Effective compensation design is driven by the organization’s decisions on strategy, market
coverage, and job roles.
1. Detail critical success factors and priorities for each sales job. Identify relationships
between marketing, sales, and service.
2. Determine market pay levels, pay strategy, and target compensation levels for each
job.3. Establish salary and incentive mix based on job roles, sales cycle, and sales
process factors. Set upside potential for top performers.
4. Select key performance measures and relative weights to link to incentive
compensation.
5. Determine payout formulas and mechanics that clearly communicate objectives
and provide proper line-of-sight.
8. Conduct “30, 60, 90”audits. Evaluate compensation metrics dashboard. Determine
performance-based or strategy-based changes for coming year.
7. Develop communication materials, plan documents, and plan policies. Introduce to the
organization. Implement administration processes.
6. Set quotas for each performance measure and allocate to organization and jobs based
on market-potential and performance-based factors.
1.Job
Roles
3.Mix &
Upside
4. Measures
&Weights
5. Mechanics
& Links
6.Quota
Setting & Allocation
7. Implement
& Administer
8. Evaluation
& Next Cycle
Planning
2.Target
Pay Levels
Strategic
Incentive
Compensation
Process
© 2018 Korn Ferry. All rights reserved 9
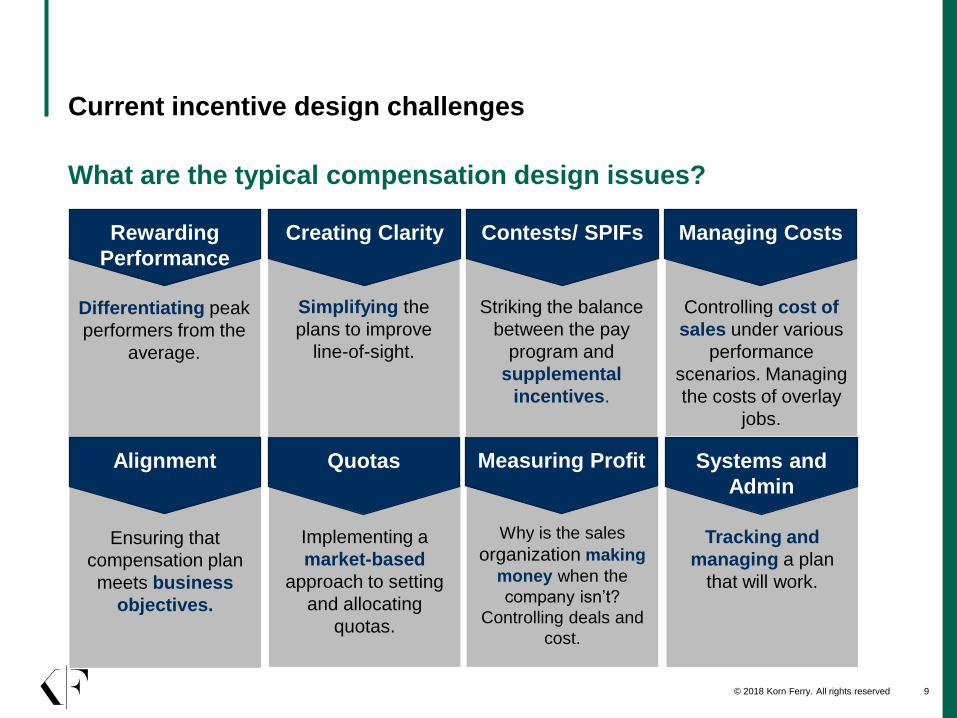
What are the typical compensation design issues?
Current incentive design challenges
Differentiating peak
performers from the
average.
Rewarding
Performance
Ensuring that
compensation plan
meets business
objectives.
Implementing a
market-based
approach to setting
and allocating
quotas.
Why is the sales
organization making
money when the
company isn’t?
Controlling deals and
cost.
Tracking and
managing a plan
that will work.
Alignment Quotas Measuring Profit Systems and
Admin
Simplifying the
plans to improve
line-of-sight.
Striking the balance
between the pay
program and
supplemental
incentives.
Creating Clarity Contests/ SPIFs
Controlling cost of
sales under various
performance
scenarios. Managing
the costs of overlay
jobs.
Managing Costs
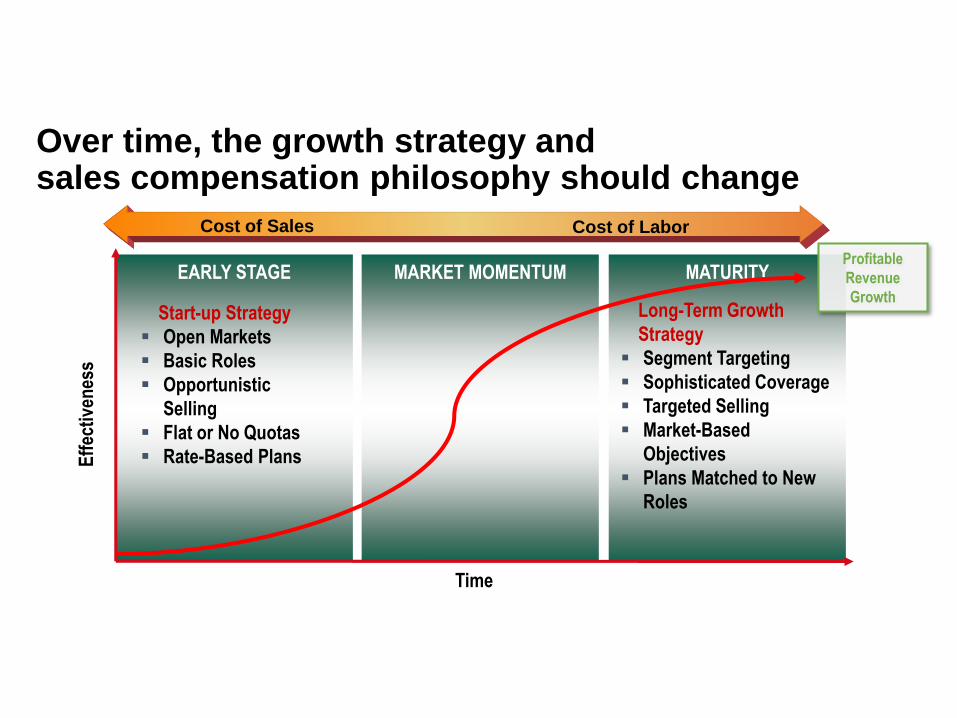
Over time, the growth strategy and sales compensation philosophy should change
EARLY STAGE MARKET MOMENTUM MATURITY
Eff
ecti
ven
ess
Time
Profitable
Revenue
GrowthLong-Term Growth
Strategy
▪ Segment Targeting
▪ Sophisticated Coverage
▪ Targeted Selling
▪ Market-Based
Objectives
▪ Plans Matched to New
Roles
Start-up Strategy
▪ Open Markets
▪ Basic Roles
▪ Opportunistic
Selling
▪ Flat or No Quotas
▪ Rate-Based Plans
Cost of Sales Cost of Labor
© 2018 Korn Ferry. All rights reserved 11
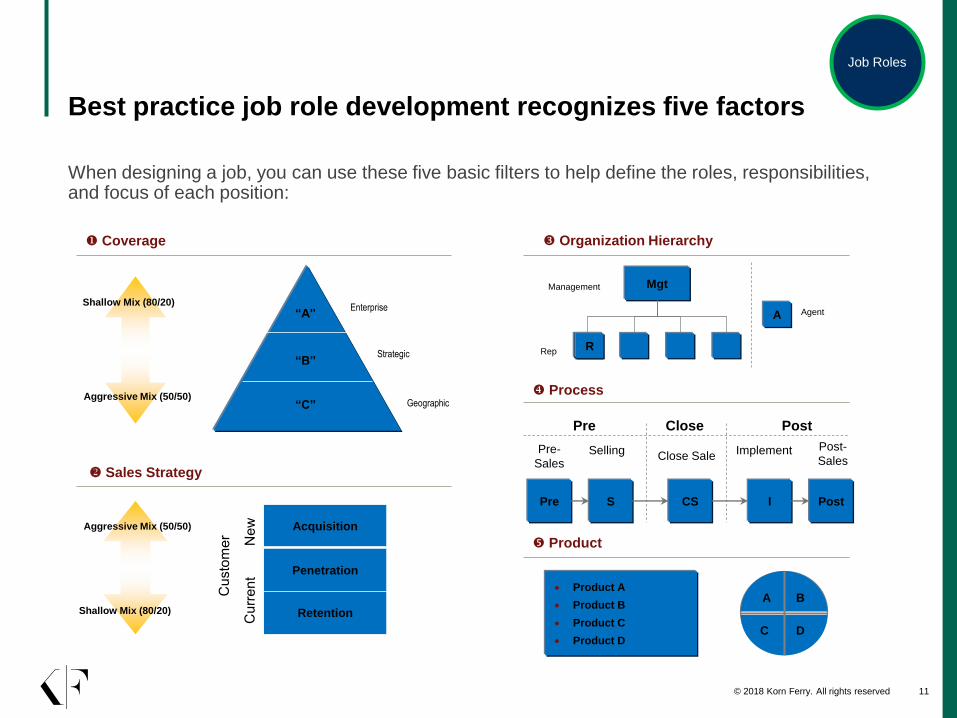
Best practice job role development recognizes five factors
When designing a job, you can use these five basic filters to help define the roles, responsibilities, and focus of each position:
Acquisition
Retention
Penetration
“A”
“B”
“C”
Enterprise
Strategic
Geographic
Mgt
R
• Product A
• Product B
• Product C
• Product D
A
Organization Hierarchy
Process
Product
Coverage
Sales Strategy
R
Shallow Mix (80/20)
Aggressive Mix (50/50)
Shallow Mix (80/20)
Aggressive Mix (50/50)
Agent
Rep
Management
Pre S CS
Pre-
SalesImplementClose SaleSelling Post-
Sales
I Post
Pre Close Post
D
BA
C
Job Roles
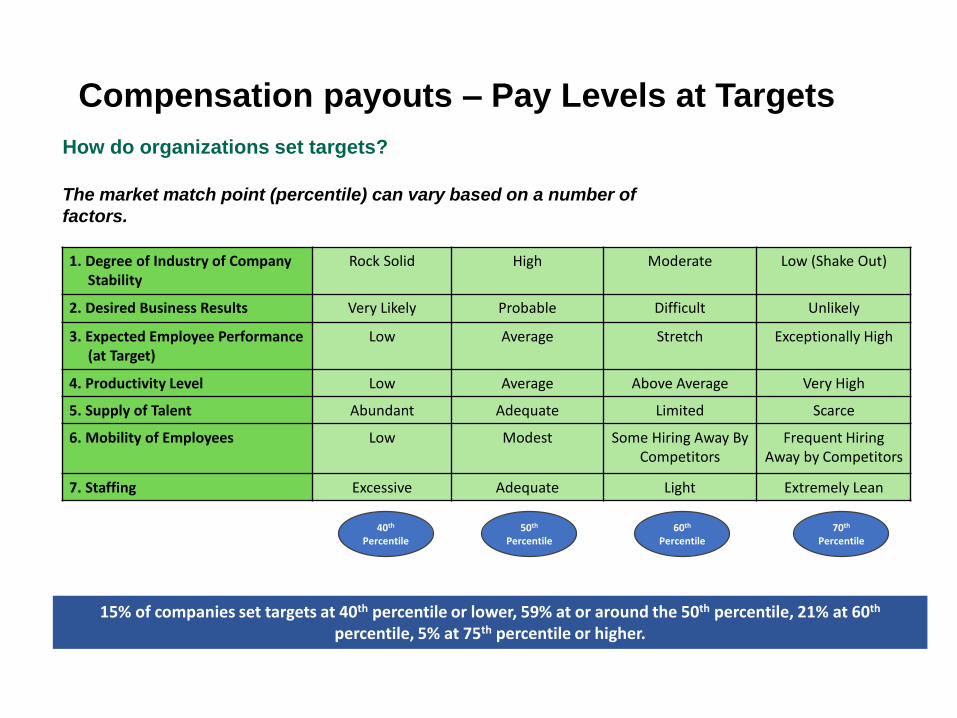
Compensation payouts – Pay Levels at Targets
How do organizations set targets?
The market match point (percentile) can vary based on a number of
factors.
1. Degree of Industry of Company Stability
Rock Solid High Moderate Low (Shake Out)
2. Desired Business Results Very Likely Probable Difficult Unlikely
3. Expected Employee Performance (at Target)
Low Average Stretch Exceptionally High
4. Productivity Level Low Average Above Average Very High
5. Supply of Talent Abundant Adequate Limited Scarce
6. Mobility of Employees Low Modest Some Hiring Away By Competitors
Frequent Hiring Away by Competitors
7. Staffing Excessive Adequate Light Extremely Lean
40th
Percentile50th
Percentile60th
Percentile70th
Percentile
15% of companies set targets at 40th percentile or lower, 59% at or around the 50th percentile, 21% at 60th
percentile, 5% at 75th percentile or higher.
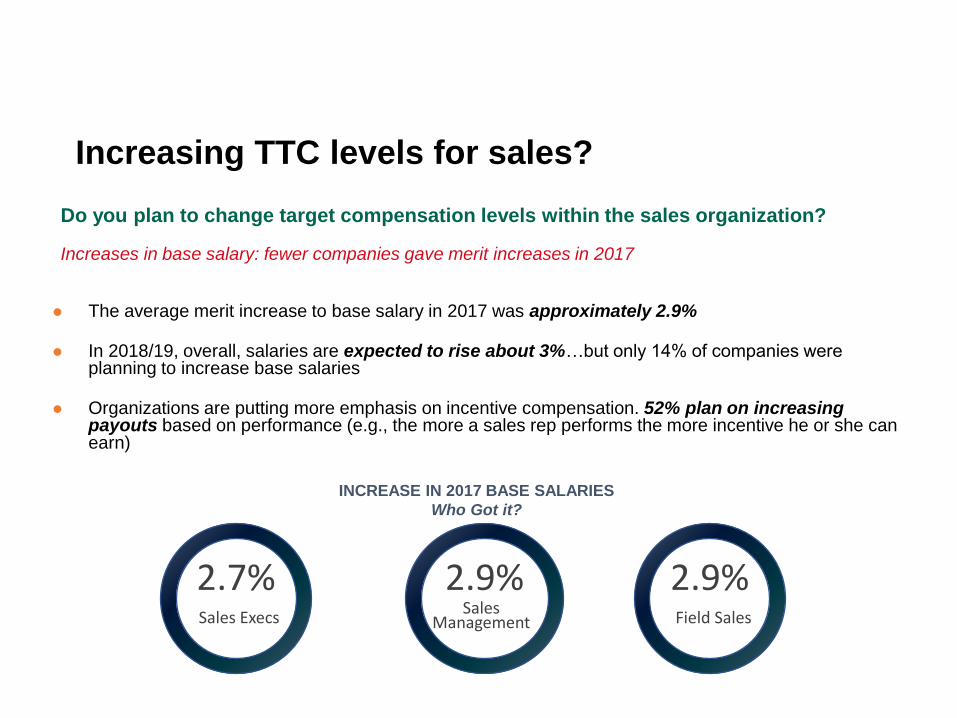
Increasing TTC levels for sales?
Do you plan to change target compensation levels within the sales organization?
Increases in base salary: fewer companies gave merit increases in 2017
⚫ The average merit increase to base salary in 2017 was approximately 2.9%
⚫ In 2018/19, overall, salaries are expected to rise about 3%…but only 14% of companies were planning to increase base salaries
⚫ Organizations are putting more emphasis on incentive compensation. 52% plan on increasing payouts based on performance (e.g., the more a sales rep performs the more incentive he or she can earn)
INCREASE IN 2017 BASE SALARIES
Who Got it?
2.7%Sales Execs
2.9%Sales
Management
2.9%Field Sales
© 2018 Korn Ferry. All rights reserved 14
Compensation payouts
Recently, we have been asked to do surveys or provide guidance on specific
areas where retention or acquisition of sales reps has been difficult. It appears
that differential pay may be making a comeback. Stay tuned…
Base salary and use of pay differentials
What is happening with pay levels?
Use pay differentials:
▪ 31% of organizations differentiate pay levels by geographic region
− 20% differentiate in terms of total target compensation
(i.e., both base salary and target incentive are adjusted)
− 80% differentiate through base salary only
▪ 69% of organizations use pay ranges to differentiate sellers within given regions
▪ “Our organization prefers not to pay differentials as it creates issues within our sales
organization. We will do it where we need to though”…

Compensation payouts – SPIFs – Mixed Thoughts…
Are companies using SPIF and Award
Programs?
⚫ Companies are spending more money on SPIFS and awards
today than they have in years past
⚫ 72% of surveyed companies reward sales people with
SPIFs
⚫ For 80% of respondents, these programs make up 3% –
10% of total incentive dollars paid:
⚫ 3% – 5%: 40% of companies
⚫ 5% – 10%: 40% of companies
⚫ 10% – 20%: 20% of companies
⚫ Typical awards are paid on the following items:
⚫ Renewal of contracts or customer satisfaction
⚫ Percentage over a target
⚫ Net sales
⚫ Strategic products (services)
⚫ Contract length
⚫ New “logo”
© 2018 Korn Ferry. All rights reserved 16
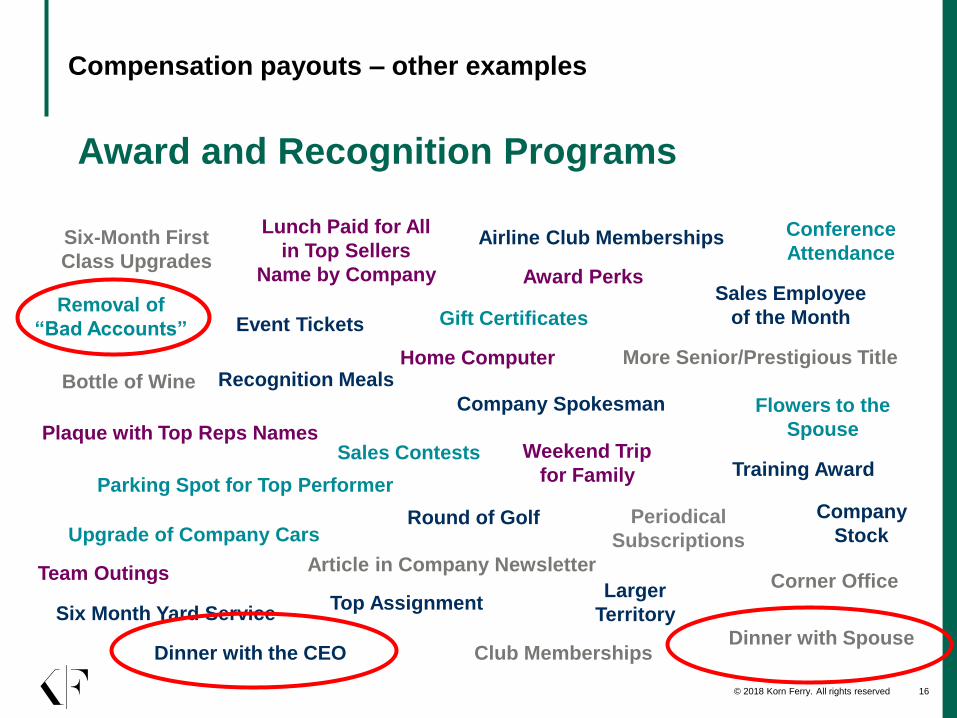
Compensation payouts – other examples
Periodical
Subscriptions
Larger
Territory
Time Off
Lunch Paid for All
in Top Sellers
Name by Company
Parking Spot for Top Performer
Conference
Attendance
Gift Certificates
Bottle of Wine
Home Computer
Flowers to the
Spouse
Recognition Meals
Sales Contests
Round of Golf
Letters from Supervisor
Team Outings
Award Perks
Weekend Trip
for Family Training Award
Top Assignment
Event Tickets
Sales Employee
of the Month
Dinner with the CEO Club Memberships
Corner Office
Dinner with Spouse
Upgrade of Company Cars
Six Month Yard Service
Company Spokesman
Article in Company Newsletter
More Senior/Prestigious Title
Airline Club Memberships
Company
Stock
Removal of
“Bad Accounts”
Six-Month First
Class Upgrades
Plaque with Top Reps Names
Award and Recognition Programs
© 2018 Korn Ferry. All rights reserved 17
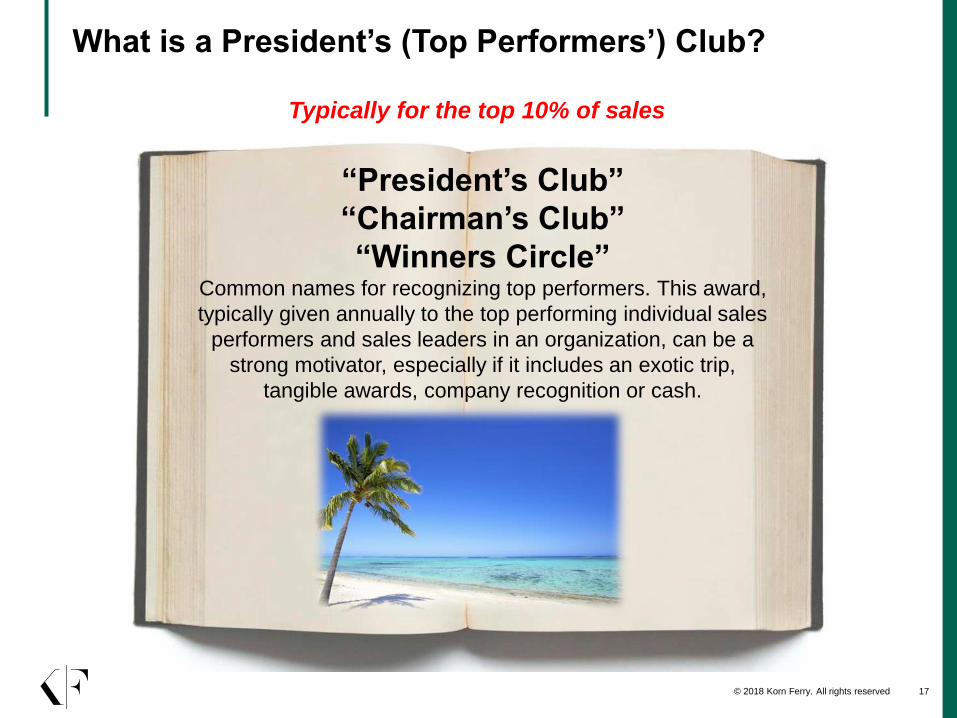
What is a President’s (Top Performers’) Club?
“President’s Club”
“Chairman’s Club”
“Winners Circle” Common names for recognizing top performers. This award,
typically given annually to the top performing individual sales
performers and sales leaders in an organization, can be a
strong motivator, especially if it includes an exotic trip,
tangible awards, company recognition or cash.
Typically for the top 10% of sales
© 2018 Korn Ferry. All rights reserved 18
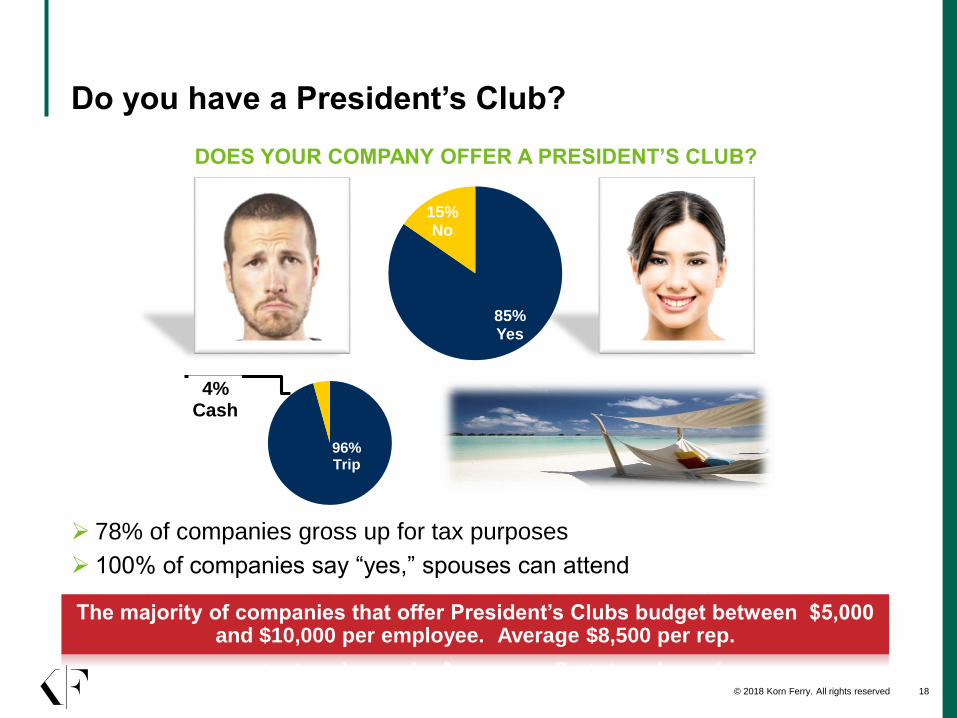
85%Yes
15%No
Do you have a President’s Club?
96%Trip
4%Cash
The majority of companies that offer President’s Clubs budget between $5,000 and $10,000 per employee. Average $8,500 per rep.
➢ 78% of companies gross up for tax purposes
➢ 100% of companies say “yes,” spouses can attend
DOES YOUR COMPANY OFFER A PRESIDENT’S CLUB?
© 2018 Korn Ferry. All rights reserved 19
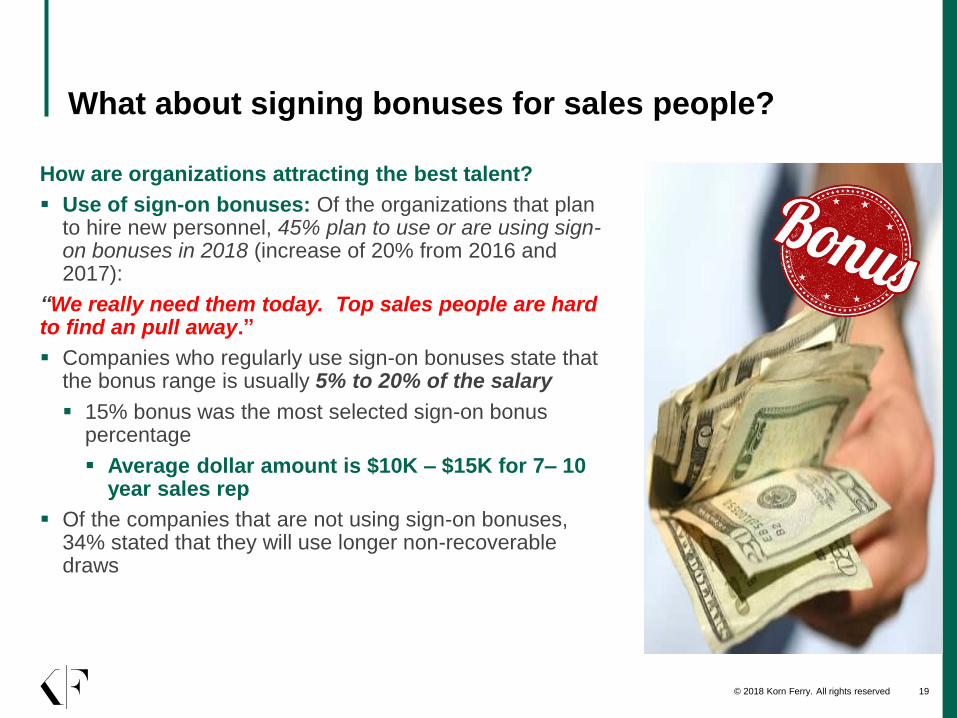
How are organizations attracting the best talent?
▪ Use of sign-on bonuses: Of the organizations that plan to hire new personnel, 45% plan to use or are using sign-on bonuses in 2018 (increase of 20% from 2016 and 2017):
“We really need them today. Top sales people are hard to find an pull away.”
▪ Companies who regularly use sign-on bonuses state that the bonus range is usually 5% to 20% of the salary
▪ 15% bonus was the most selected sign-on bonus percentage
▪ Average dollar amount is $10K – $15K for 7– 10 year sales rep
▪ Of the companies that are not using sign-on bonuses, 34% stated that they will use longer non-recoverable draws
What about signing bonuses for sales people?
© 2018 Korn Ferry. All rights reserved 20
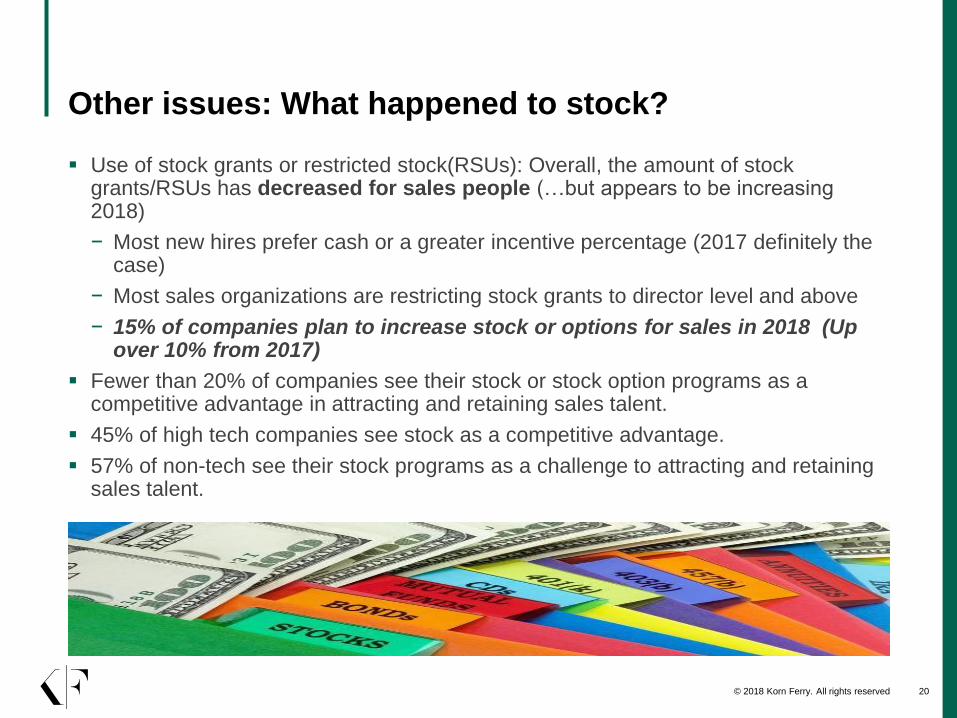
Other issues: What happened to stock?
▪ Use of stock grants or restricted stock(RSUs): Overall, the amount of stock grants/RSUs has decreased for sales people (…but appears to be increasing 2018)
− Most new hires prefer cash or a greater incentive percentage (2017 definitely the case)
− Most sales organizations are restricting stock grants to director level and above
− 15% of companies plan to increase stock or options for sales in 2018 (Up over 10% from 2017)
▪ Fewer than 20% of companies see their stock or stock option programs as a competitive advantage in attracting and retaining sales talent.
▪ 45% of high tech companies see stock as a competitive advantage.
▪ 57% of non-tech see their stock programs as a challenge to attracting and retaining sales talent.
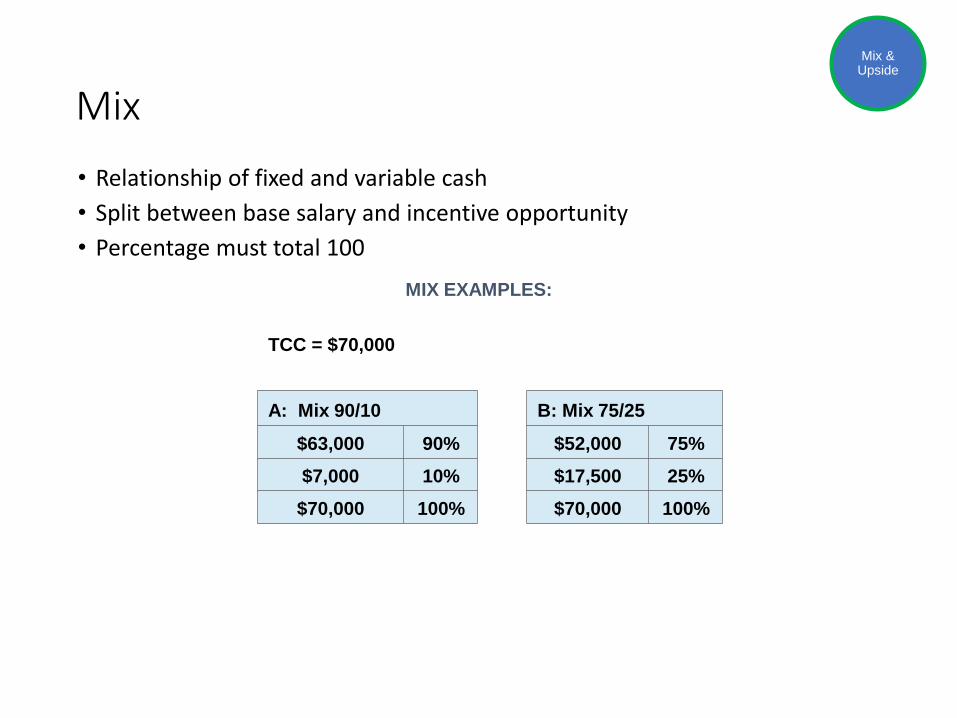
Mix
• Relationship of fixed and variable cash
• Split between base salary and incentive opportunity
• Percentage must total 100
Mix & Upside
MIX EXAMPLES:
TCC = $70,000
A: Mix 90/10 B: Mix 75/25
$63,000 90% $52,000 75%
$7,000 10% $17,500 25%
$70,000 100% $70,000 100%
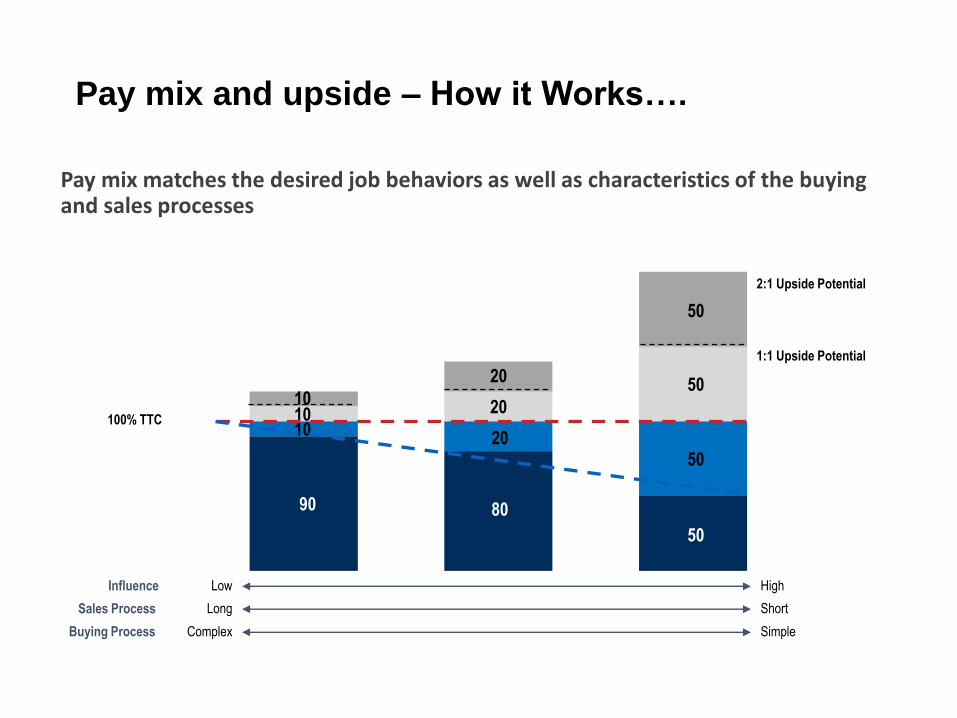
Pay mix and upside – How it Works….
Pay mix matches the desired job behaviors as well as characteristics of the buying and sales processes
90 80
50
10 2050
10 20
5010
20
50
2:1 Upside Potential
1:1 Upside Potential
100% TTC
Low HighInfluence
Long ShortSales Process
Complex SimpleBuying Process
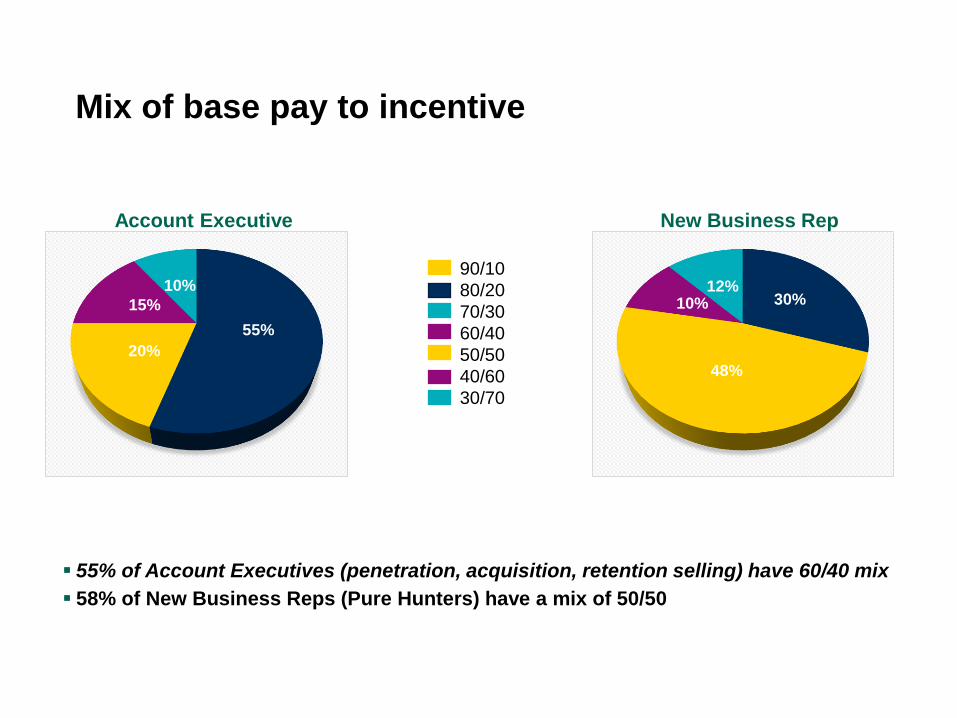
Mix of base pay to incentive
30%
48%
10%12%
90/10
80/20
70/30
60/40
50/50
40/60
30/70
55%
20%
15%
10%
Account Executive New Business Rep
▪ 55% of Account Executives (penetration, acquisition, retention selling) have 60/40 mix
▪ 58% of New Business Reps (Pure Hunters) have a mix of 50/50
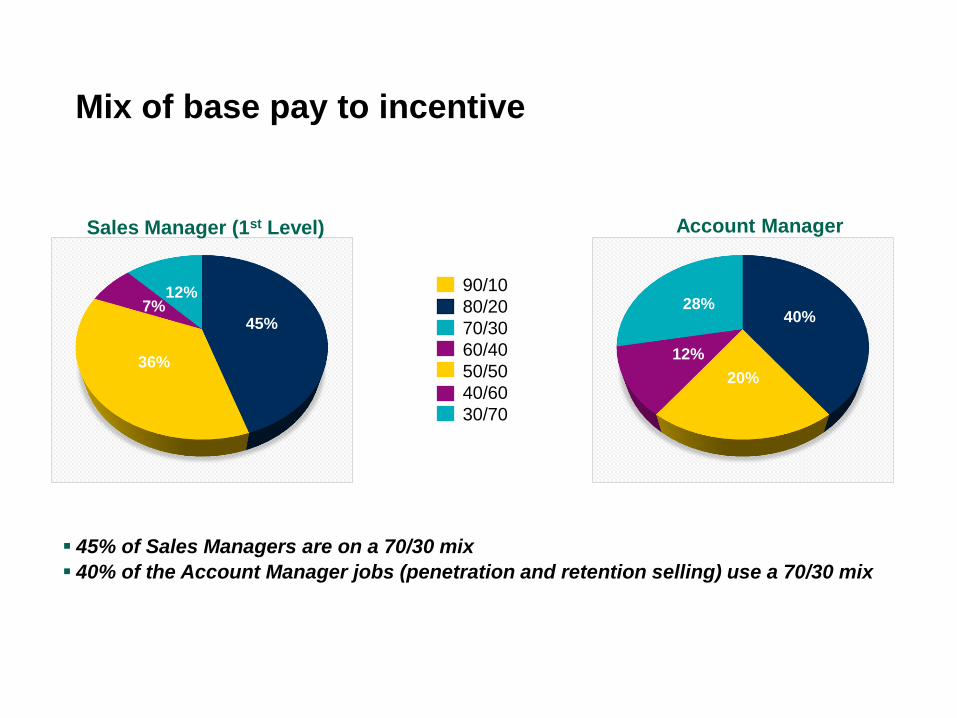
Mix of base pay to incentive
90/10
80/20
70/30
60/40
50/50
40/60
30/70
45%
36%
7%12%
40%
20%
12%
28%
Sales Manager (1st Level) Account Manager
▪ 45% of Sales Managers are on a 70/30 mix
▪ 40% of the Account Manager jobs (penetration and retention selling) use a 70/30 mix
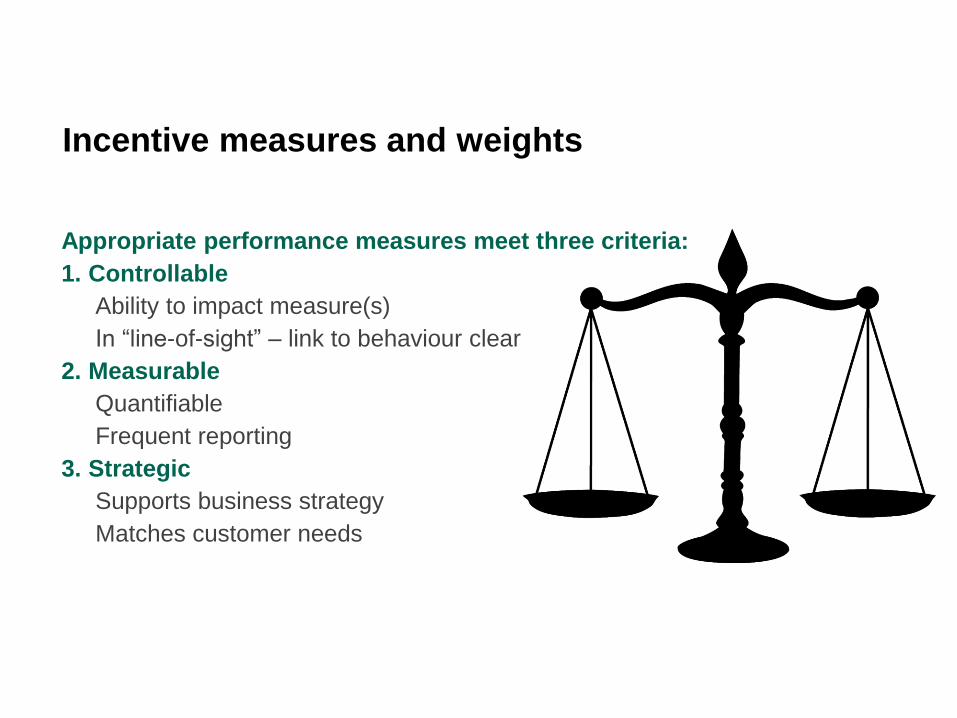
Incentive measures and weights
Appropriate performance measures meet three criteria:
1. Controllable
−Ability to impact measure(s)
− In “line-of-sight” – link to behaviour clear
2. Measurable
−Quantifiable
−Frequent reporting
3. Strategic
−Supports business strategy
−Matches customer needs
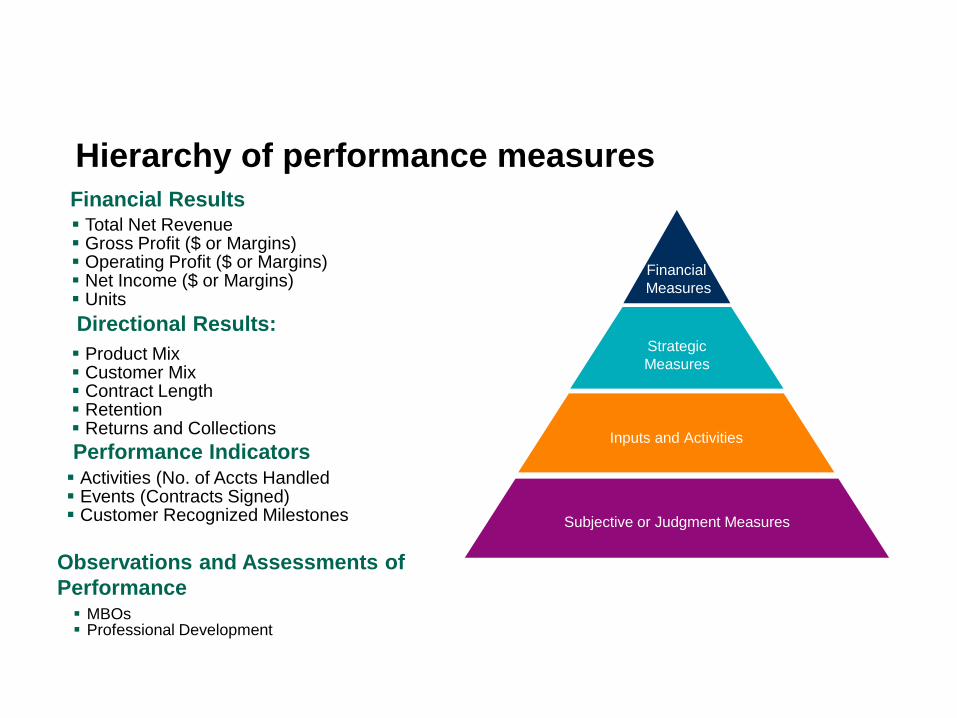
Hierarchy of performance measures
▪ Total Net Revenue▪ Gross Profit ($ or Margins)▪ Operating Profit ($ or Margins)▪ Net Income ($ or Margins)▪ Units
Financial Results
▪ Product Mix▪ Customer Mix▪ Contract Length▪ Retention▪ Returns and Collections
Directional Results:
▪ Activities (No. of Accts Handled▪ Events (Contracts Signed)▪ Customer Recognized Milestones
Performance Indicators
▪ MBOs▪ Professional Development
Observations and Assessments of
Performance
Subjective or Judgment Measures
Inputs and Activities
Strategic
Measures
Financial
Measures
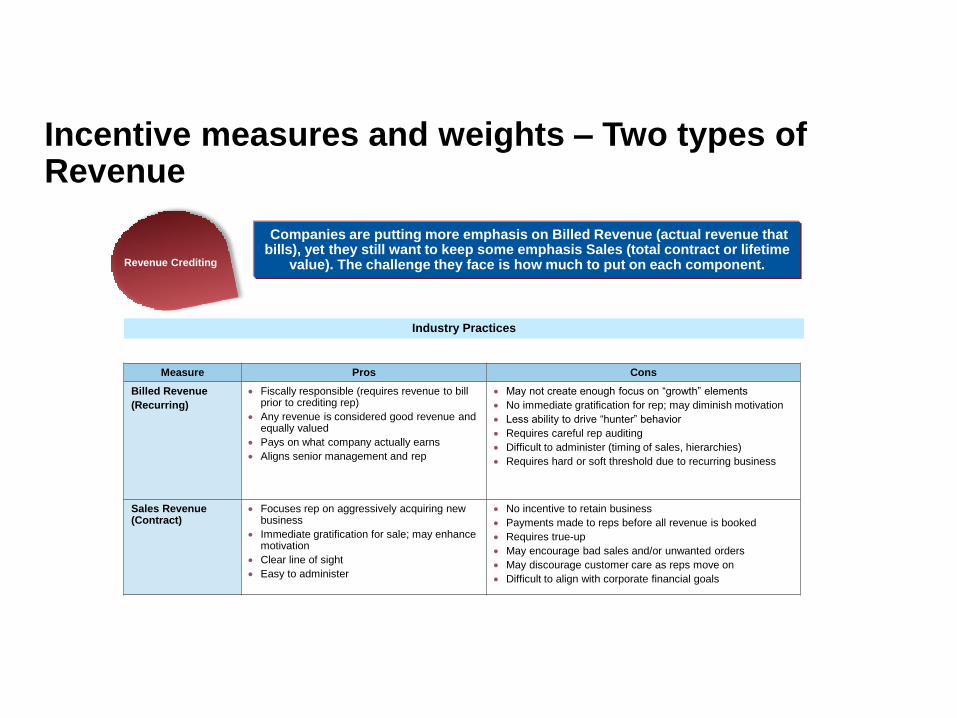
Industry Practices
Revenue Crediting
Measure Pros Cons
Billed Revenue
(Recurring)
• Fiscally responsible (requires revenue to bill prior to crediting rep)
• Any revenue is considered good revenue and equally valued
• Pays on what company actually earns
• Aligns senior management and rep
• May not create enough focus on “growth” elements
• No immediate gratification for rep; may diminish motivation
• Less ability to drive “hunter” behavior
• Requires careful rep auditing
• Difficult to administer (timing of sales, hierarchies)
• Requires hard or soft threshold due to recurring business
Sales Revenue (Contract)
• Focuses rep on aggressively acquiring new business
• Immediate gratification for sale; may enhance motivation
• Clear line of sight
• Easy to administer
• No incentive to retain business
• Payments made to reps before all revenue is booked
• Requires true-up
• May encourage bad sales and/or unwanted orders
• May discourage customer care as reps move on
• Difficult to align with corporate financial goals
Companies are putting more emphasis on Billed Revenue (actual revenue that bills), yet they still want to keep some emphasis Sales (total contract or lifetime
value). The challenge they face is how much to put on each component.
Incentive measures and weights – Two types of Revenue
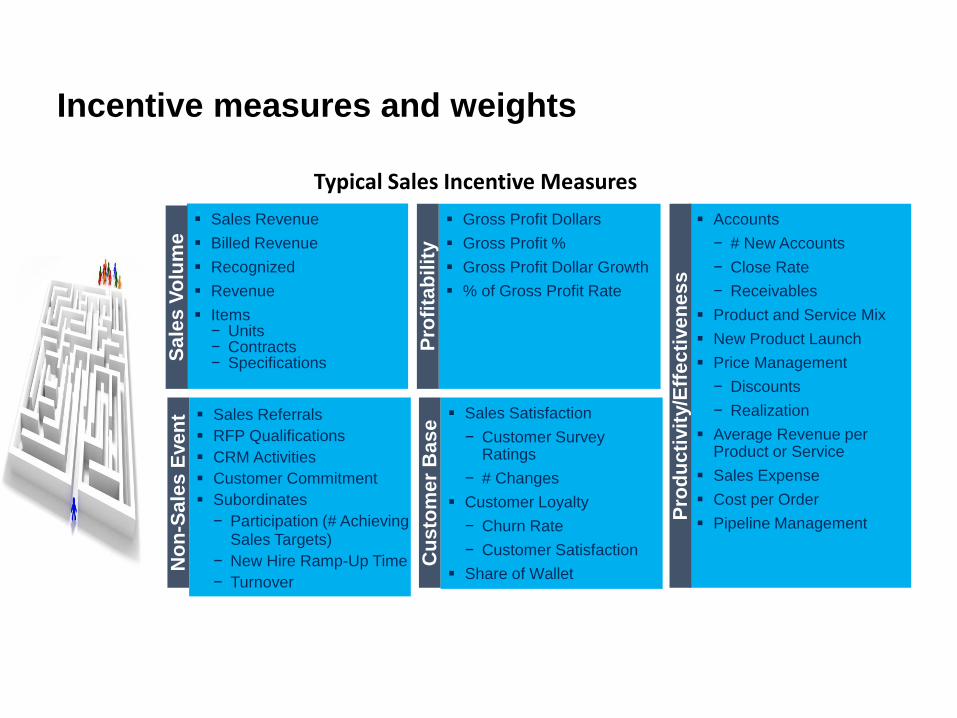
Incentive measures and weights
Typical Sales Incentive MeasuresN
on
-Sa
les
Eve
nt
Cu
sto
me
r B
as
e
▪ Sales Revenue
▪ Billed Revenue
▪ Recognized
▪ Revenue
▪ Items− Units− Contracts− Specifications
▪ Accounts
− # New Accounts
− Close Rate
− Receivables
▪ Product and Service Mix
▪ New Product Launch
▪ Price Management
− Discounts
− Realization
▪ Average Revenue per Product or Service
▪ Sales Expense
▪ Cost per Order
▪ Pipeline Management
▪ Gross Profit Dollars
▪ Gross Profit %
▪ Gross Profit Dollar Growth
▪ % of Gross Profit Rate
▪ Sales Referrals
▪ RFP Qualifications
▪ CRM Activities
▪ Customer Commitment
▪ Subordinates
− Participation (# Achieving Sales Targets)
− New Hire Ramp-Up Time
− Turnover
▪ Sales Satisfaction
− Customer Survey Ratings
− # Changes
▪ Customer Loyalty
− Churn Rate
− Customer Satisfaction
▪ Share of Wallet
Sa
les
Vo
lum
e
Pro
fita
bil
ity
Pro
du
cti
vit
y/E
ffe
cti
ve
ne
ss
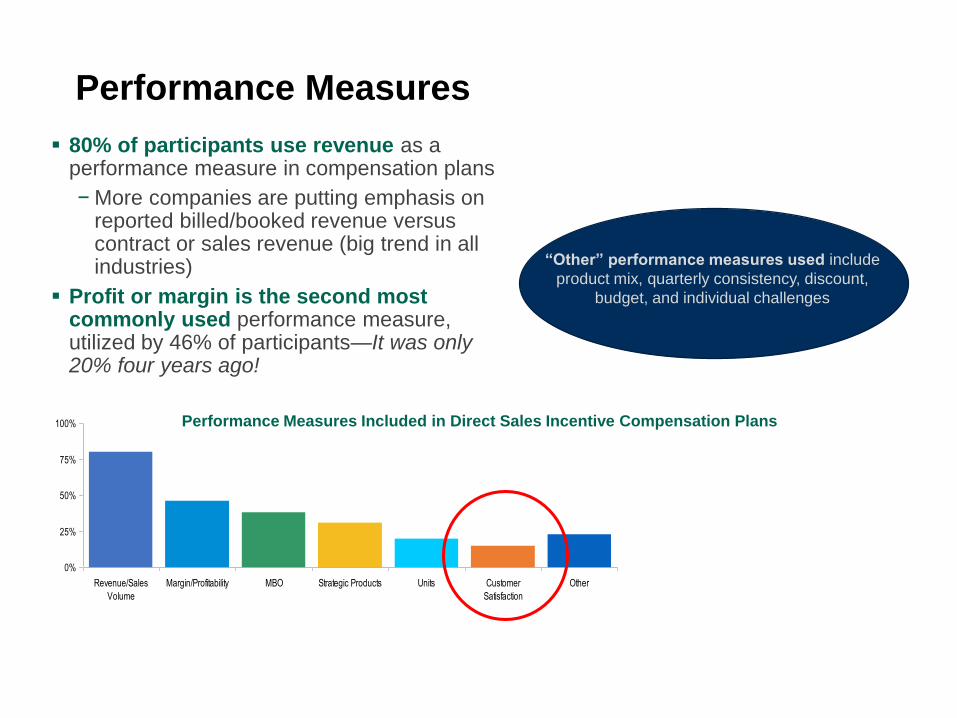
Performance Measures
▪ 80% of participants use revenue as a performance measure in compensation plans
− More companies are putting emphasis on reported billed/booked revenue versus contract or sales revenue (big trend in all industries)
▪ Profit or margin is the second most commonly used performance measure, utilized by 46% of participants—It was only 20% four years ago!
38%31%
80%
46%
15%23%20%
0%
25%
50%
75%
100%
Revenue/Sales
Volume
Margin/Profitability MBO Strategic Products Units Customer
Satisfaction
Other
Performance Measures Included in Direct Sales Incentive Compensation Plans
“Other” performance measures used include
product mix, quarterly consistency, discount,
budget, and individual challenges
© 2018 Korn Ferry. All rights reserved 30
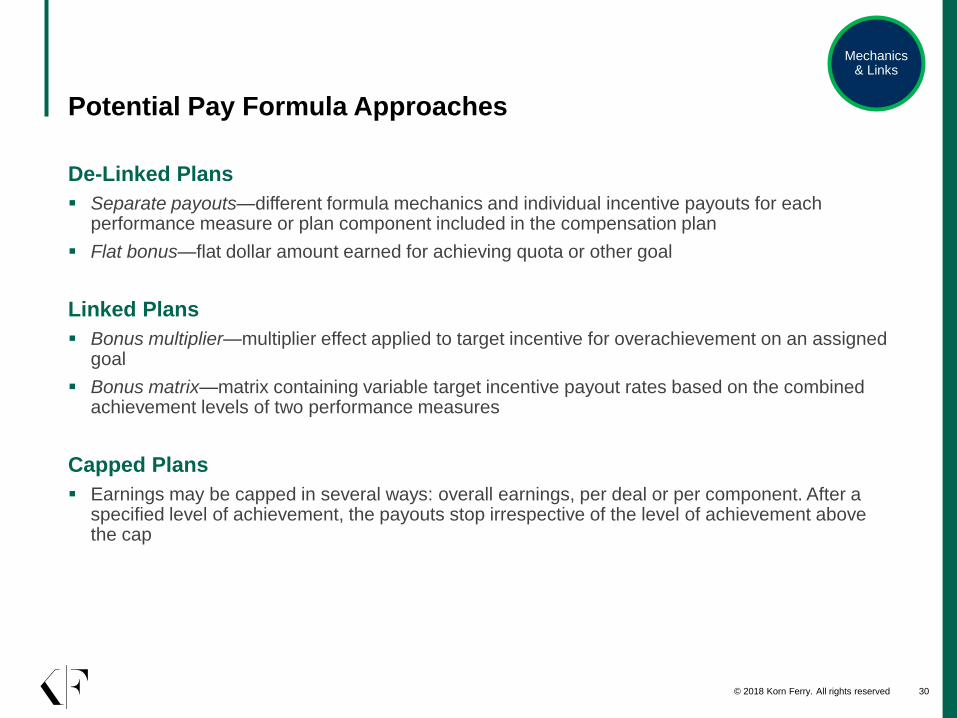
Potential Pay Formula Approaches
De-Linked Plans
▪ Separate payouts—different formula mechanics and individual incentive payouts for each performance measure or plan component included in the compensation plan
▪ Flat bonus—flat dollar amount earned for achieving quota or other goal
Linked Plans
▪ Bonus multiplier—multiplier effect applied to target incentive for overachievement on an assigned goal
▪ Bonus matrix—matrix containing variable target incentive payout rates based on the combined achievement levels of two performance measures
Capped Plans
▪ Earnings may be capped in several ways: overall earnings, per deal or per component. After a specified level of achievement, the payouts stop irrespective of the level of achievement above the cap
Mechanics & Links
© 2018 Korn Ferry. All rights reserved 31
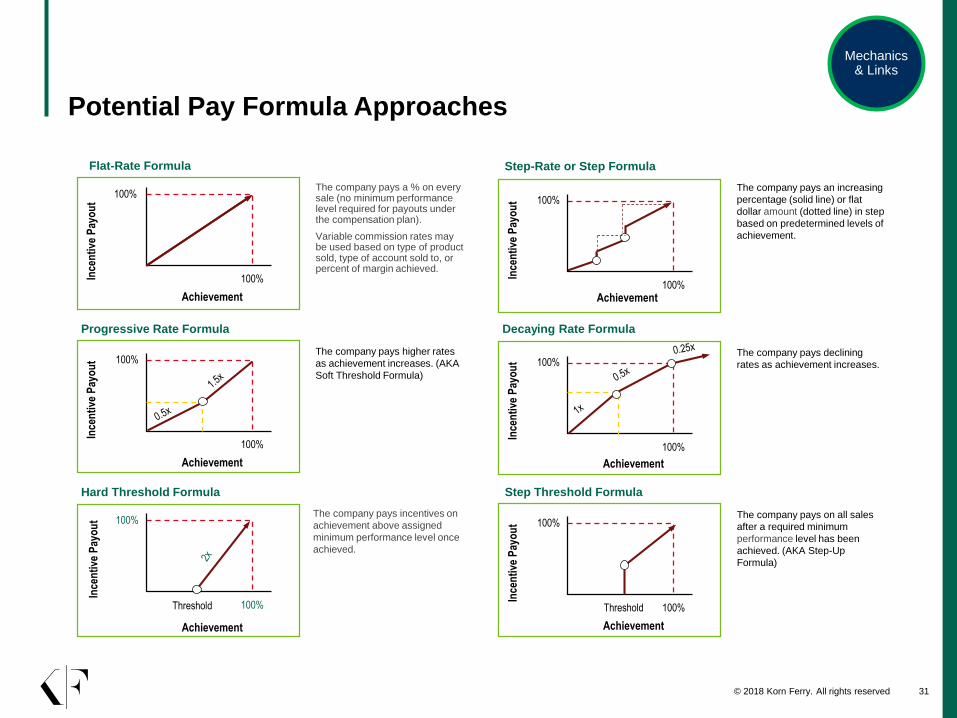
Potential Pay Formula Approaches
The company pays a % on every sale (no minimum performance level required for payouts under the compensation plan).
Variable commission rates may be used based on type of product sold, type of account sold to, or percent of margin achieved.
Flat-Rate Formula
Progressive Rate Formula
100%
100%Ince
nti
ve P
ayo
ut
Achievement
The company pays higher rates
as achievement increases. (AKA
Soft Threshold Formula)
Decaying Rate Formula
The company pays declining
rates as achievement increases.100%
100%
Ince
nti
ve P
ayo
ut
Achievement
100%
100%
Ince
nti
ve P
ayo
ut
Achievement
Hard Threshold Formula
The company pays incentives on
achievement above assigned
minimum performance level once
achieved.
100%
100%
Ince
nti
ve P
ayo
ut
Achievement
Threshold
Step Threshold Formula
100%
100%
Ince
nti
ve P
ayo
ut
Achievement
The company pays on all sales
after a required minimum
performance level has been
achieved. (AKA Step-Up
Formula)
Threshold
Step-Rate or Step Formula
The company pays an increasing
percentage (solid line) or flat
dollar amount (dotted line) in step
based on predetermined levels of
achievement.
100%
100%
Ince
nti
ve P
ayo
ut
Achievement
Mechanics & Links
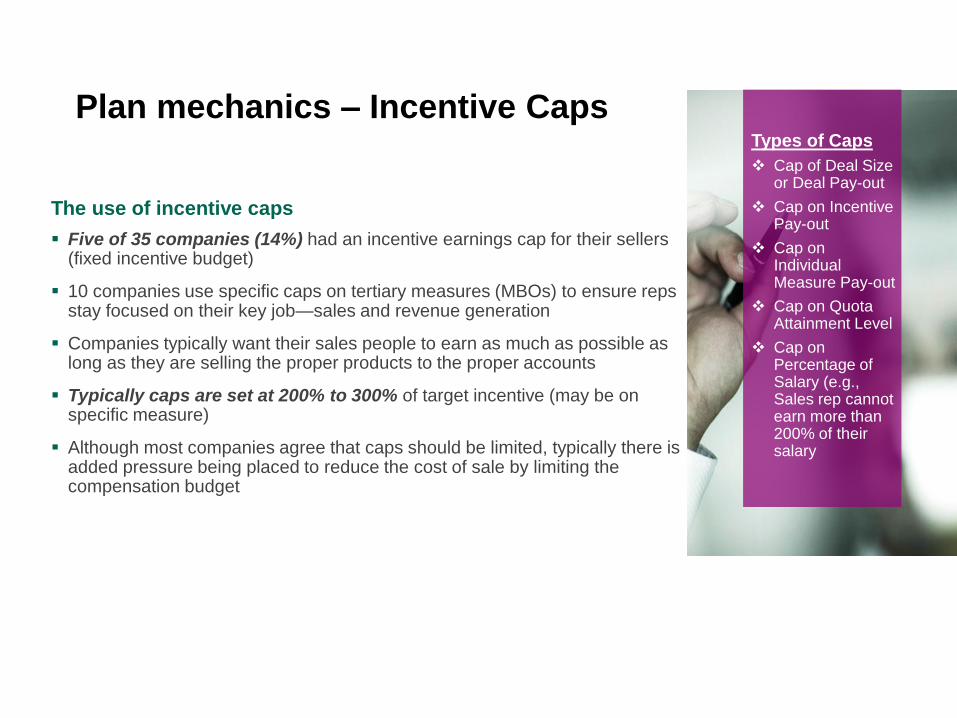
Plan mechanics – Incentive Caps
▪ Five of 35 companies (14%) had an incentive earnings cap for their sellers (fixed incentive budget)
▪ 10 companies use specific caps on tertiary measures (MBOs) to ensure reps stay focused on their key job—sales and revenue generation
▪ Companies typically want their sales people to earn as much as possible as long as they are selling the proper products to the proper accounts
▪ Typically caps are set at 200% to 300% of target incentive (may be on specific measure)
▪ Although most companies agree that caps should be limited, typically there is added pressure being placed to reduce the cost of sale by limiting the compensation budget
The use of incentive caps
Types of Caps
❖ Cap of Deal Size or Deal Pay-out
❖ Cap on Incentive Pay-out
❖ Cap on Individual Measure Pay-out
❖ Cap on Quota Attainment Level
❖ Cap on Percentage of Salary (e.g., Sales rep cannot earn more than 200% of their salary
© 2018 Korn Ferry. All rights reserved 33
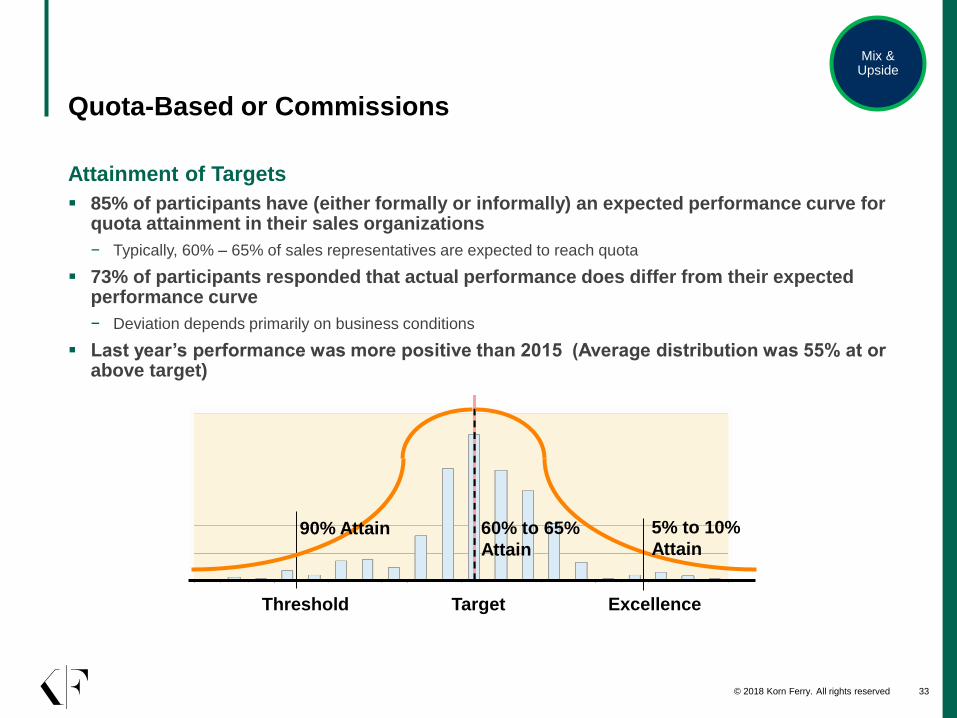
Quota-Based or Commissions
Attainment of Targets
▪ 85% of participants have (either formally or informally) an expected performance curve for quota attainment in their sales organizations
− Typically, 60% – 65% of sales representatives are expected to reach quota
▪ 73% of participants responded that actual performance does differ from their expected performance curve
− Deviation depends primarily on business conditions
▪ Last year’s performance was more positive than 2015 (Average distribution was 55% at or above target)
Threshold Target Excellence
60% to 65%
Attain
5% to 10%
Attain90% Attain
Mix & Upside
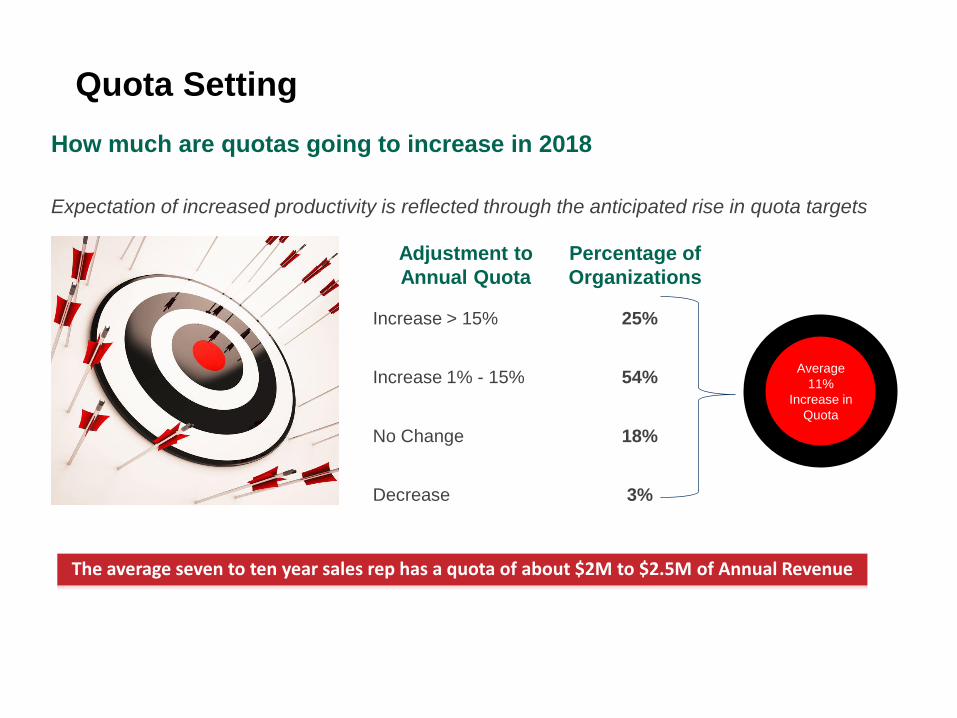
Quota Setting
How much are quotas going to increase in 2018
Expectation of increased productivity is reflected through the anticipated rise in quota targets
Adjustment to
Annual Quota
Increase > 15%
Increase 1% - 15%
No Change
Decrease
Percentage of
Organizations
25%
54%
18%
3%
Average
11%
Increase in
Quota
The average seven to ten year sales rep has a quota of about $2M to $2.5M of Annual Revenue
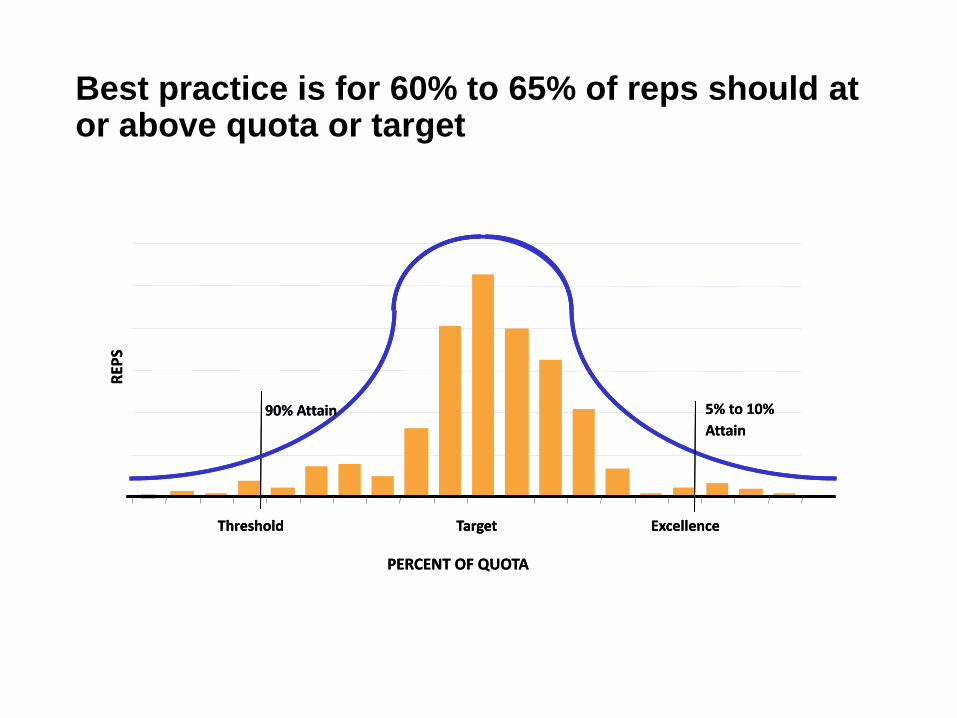
Best practice is for 60% to 65% of reps should at or above quota or target
PERCENT OF QUOTA
REP
S
Threshold Target Excellence
5% to 10%
Attain
90% Attain
PERCENT OF QUOTA
REP
S
Threshold Target Excellence
5% to 10%
Attain
90% Attain
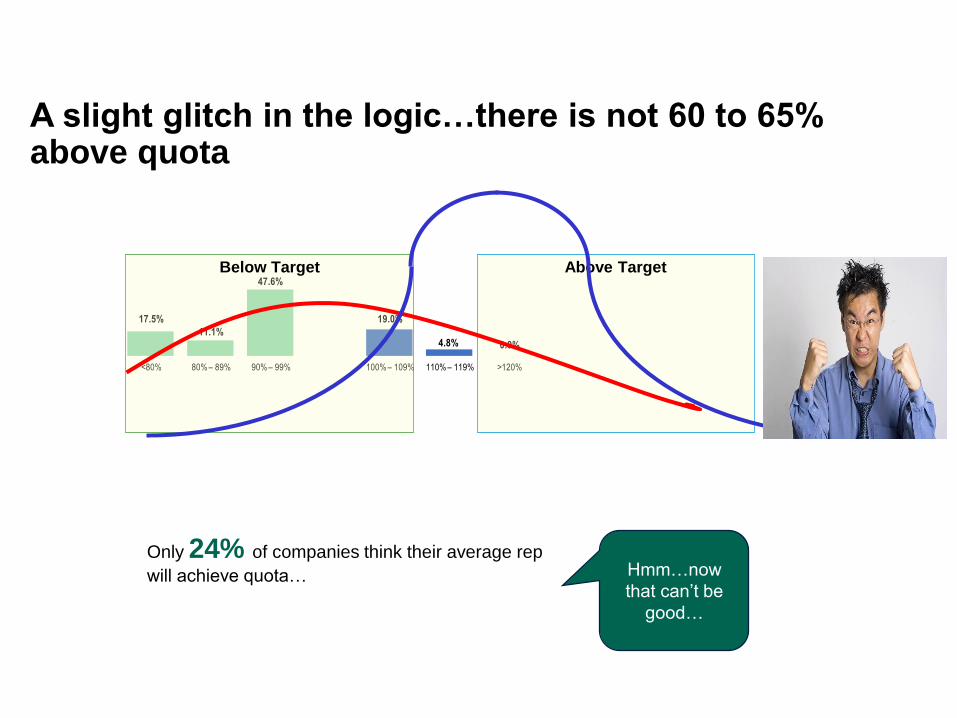
A slight glitch in the logic…there is not 60 to 65% above quota
Hmm…now
that can’t be
good…
Only 24% of companies think their average rep
will achieve quota…
0.0%
11.1%
17.5% 19.0%
4.8%
47.6%
<80% 80% – 89% 90% – 99% 100% – 109% 110% – 119% >120%
Below Target Above Target
© 2018 Korn Ferry. All rights reserved 38
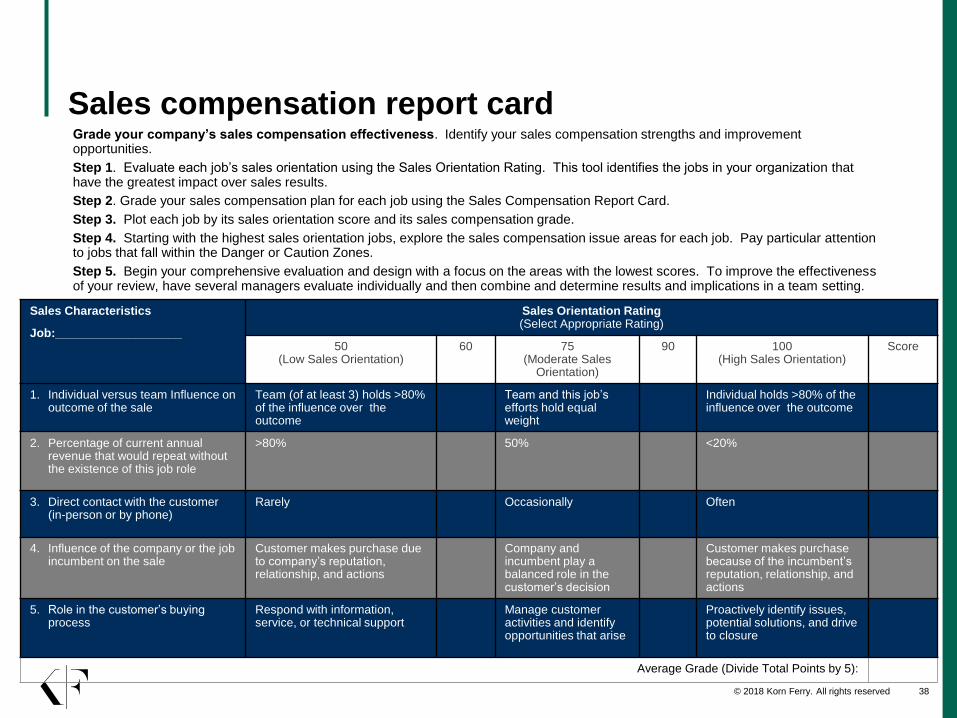
Sales compensation report card
Sales Characteristics
Job:___________________
Sales Orientation Rating (Select Appropriate Rating)
50(Low Sales Orientation)
60 75(Moderate Sales
Orientation)
90 100 (High Sales Orientation)
Score
1. Individual versus team Influence on outcome of the sale
Team (of at least 3) holds >80% of the influence over the outcome
Team and this job’s efforts hold equal weight
Individual holds >80% of the influence over the outcome
2. Percentage of current annual revenue that would repeat without the existence of this job role
>80% 50% <20%
3. Direct contact with the customer (in-person or by phone)
Rarely Occasionally Often
4. Influence of the company or the job incumbent on the sale
Customer makes purchase due to company’s reputation, relationship, and actions
Company and incumbent play a balanced role in the customer’s decision
Customer makes purchase because of the incumbent’s reputation, relationship, and actions
5. Role in the customer’s buying process
Respond with information, service, or technical support
Manage customer activities and identify opportunities that arise
Proactively identify issues, potential solutions, and drive to closure
Average Grade (Divide Total Points by 5):
Grade your company’s sales compensation effectiveness. Identify your sales compensation strengths and improvement opportunities.
Step 1. Evaluate each job’s sales orientation using the Sales Orientation Rating. This tool identifies the jobs in your organization that have the greatest impact over sales results.
Step 2. Grade your sales compensation plan for each job using the Sales Compensation Report Card.
Step 3. Plot each job by its sales orientation score and its sales compensation grade.
Step 4. Starting with the highest sales orientation jobs, explore the sales compensation issue areas for each job. Pay particular attention to jobs that fall within the Danger or Caution Zones.
Step 5. Begin your comprehensive evaluation and design with a focus on the areas with the lowest scores. To improve the effectivenessof your review, have several managers evaluate individually and then combine and determine results and implications in a team setting.
© 2018 Korn Ferry. All rights reserved 39
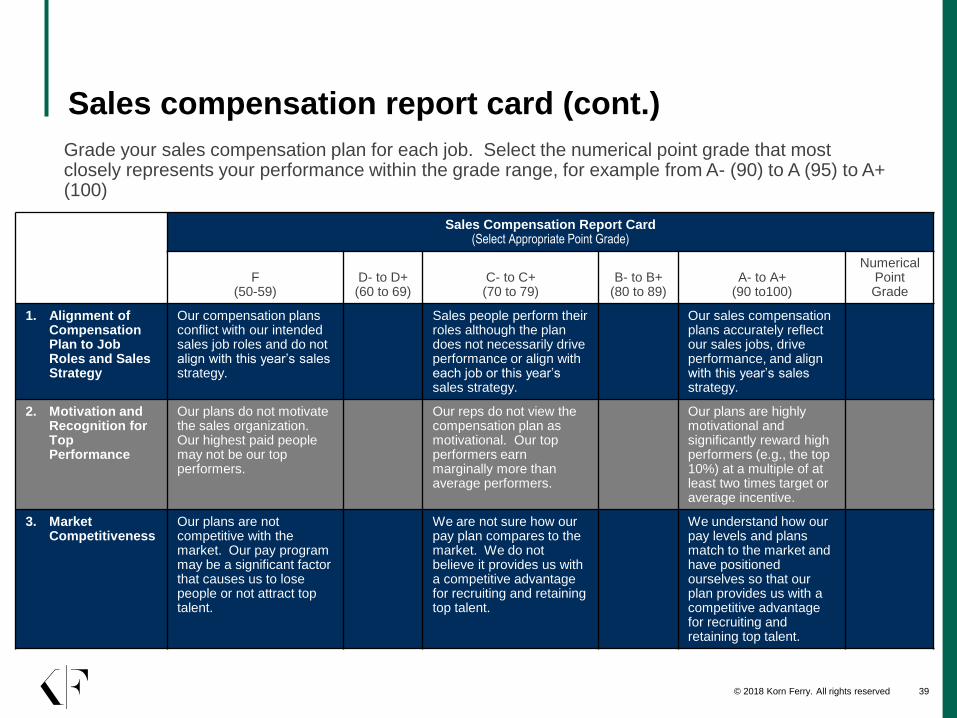
Sales compensation report card (cont.)
Grade your sales compensation plan for each job. Select the numerical point grade that most closely represents your performance within the grade range, for example from A- (90) to A (95) to A+ (100)
Sales Compensation Report Card(Select Appropriate Point Grade)
F (50-59)
D- to D+ (60 to 69)
C- to C+ (70 to 79)
B- to B+ (80 to 89)
A- to A+ (90 to100)
Numerical Point Grade
1. Alignment of Compensation Plan to Job Roles and Sales Strategy
Our compensation plans conflict with our intended sales job roles and do not align with this year’s sales strategy.
Sales people perform their roles although the plan does not necessarily drive performance or align with each job or this year’s sales strategy.
Our sales compensation plans accurately reflect our sales jobs, drive performance, and align with this year’s sales strategy.
2. Motivation and Recognition for Top Performance
Our plans do not motivate the sales organization. Our highest paid people may not be our top performers.
Our reps do not view the compensation plan as motivational. Our top performers earn marginally more than average performers.
Our plans are highly motivational and significantly reward high performers (e.g., the top 10%) at a multiple of at least two times target or average incentive.
3. Market Competitiveness
Our plans are not competitive with the market. Our pay program may be a significant factor that causes us to lose people or not attract top talent.
We are not sure how our pay plan compares to the market. We do not believe it provides us with a competitive advantage for recruiting and retaining top talent.
We understand how our pay levels and plans match to the market and have positioned ourselves so that our plan provides us with a competitive advantage for recruiting and retaining top talent.
© 2018 Korn Ferry. All rights reserved 40
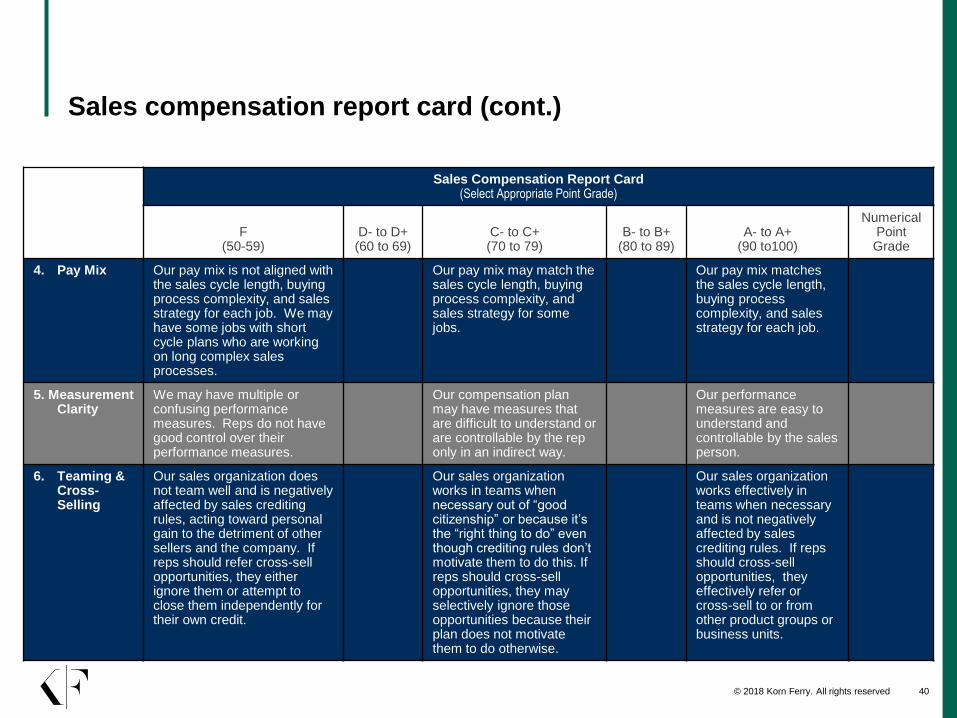
Sales compensation report card (cont.)
Sales Compensation Report Card(Select Appropriate Point Grade)
F (50-59)
D- to D+ (60 to 69)
C- to C+ (70 to 79)
B- to B+ (80 to 89)
A- to A+ (90 to100)
Numerical Point Grade
4. Pay Mix Our pay mix is not aligned with the sales cycle length, buying process complexity, and sales strategy for each job. We may have some jobs with short cycle plans who are working on long complex sales processes.
Our pay mix may match the sales cycle length, buying process complexity, and sales strategy for some jobs.
Our pay mix matches the sales cycle length, buying process complexity, and sales strategy for each job.
5. Measurement Clarity
We may have multiple or confusing performance measures. Reps do not have good control over their performance measures.
Our compensation plan may have measures that are difficult to understand or are controllable by the rep only in an indirect way.
Our performance measures are easy to understand and controllable by the sales person.
6. Teaming & Cross-Selling
Our sales organization does not team well and is negatively affected by sales crediting rules, acting toward personal gain to the detriment of other sellers and the company. If reps should refer cross-sell opportunities, they either ignore them or attempt to close them independently for their own credit.
Our sales organization works in teams when necessary out of “good citizenship” or because it’s the “right thing to do” even though crediting rules don’t motivate them to do this. If reps should cross-sell opportunities, they may selectively ignore those opportunities because their plan does not motivate them to do otherwise.
Our sales organization works effectively in teams when necessary and is not negatively affected by sales crediting rules. If reps should cross-sell opportunities, they effectively refer or cross-sell to or from other product groups or business units.
© 2018 Korn Ferry. All rights reserved 41
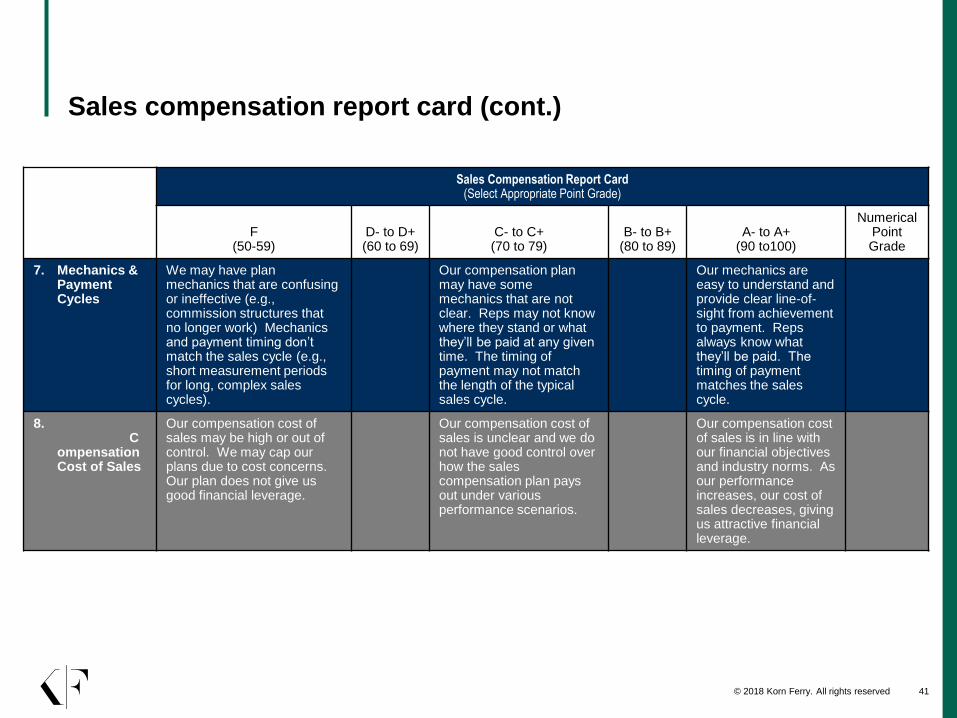
Sales compensation report card (cont.)
Sales Compensation Report Card(Select Appropriate Point Grade)
F (50-59)
D- to D+ (60 to 69)
C- to C+ (70 to 79)
B- to B+ (80 to 89)
A- to A+ (90 to100)
Numerical Point Grade
7. Mechanics & Payment Cycles
We may have plan mechanics that are confusing or ineffective (e.g., commission structures that no longer work) Mechanics and payment timing don’t match the sales cycle (e.g., short measurement periods for long, complex sales cycles).
Our compensation plan may have some mechanics that are not clear. Reps may not know where they stand or what they’ll be paid at any given time. The timing of payment may not match the length of the typical sales cycle.
Our mechanics are easy to understand and provide clear line-of-sight from achievement to payment. Reps always know what they’ll be paid. The timing of payment matches the sales cycle.
8.C
ompensation Cost of Sales
Our compensation cost of sales may be high or out of control. We may cap our plans due to cost concerns. Our plan does not give us good financial leverage.
Our compensation cost of sales is unclear and we do not have good control over how the sales compensation plan pays out under various performance scenarios.
Our compensation cost of sales is in line with our financial objectives and industry norms. As our performance increases, our cost of sales decreases, giving us attractive financial leverage.
© 2018 Korn Ferry. All rights reserved 42
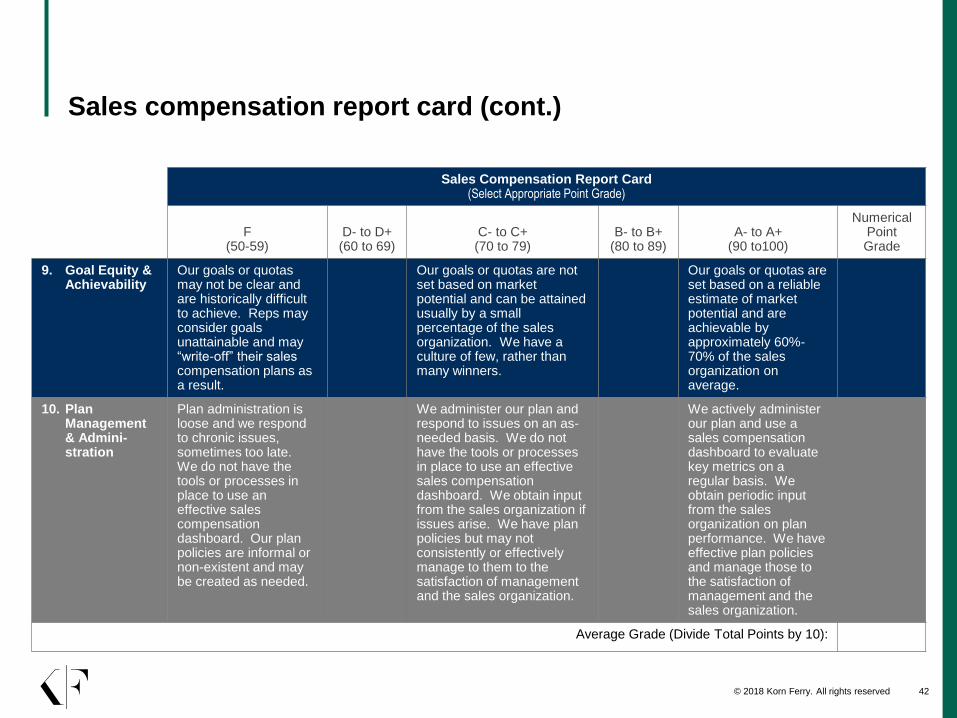
Sales compensation report card (cont.)
Sales Compensation Report Card(Select Appropriate Point Grade)
F (50-59)
D- to D+ (60 to 69)
C- to C+ (70 to 79)
B- to B+ (80 to 89)
A- to A+ (90 to100)
Numerical Point Grade
9. Goal Equity & Achievability
Our goals or quotas may not be clear and are historically difficult to achieve. Reps may consider goals unattainable and may “write-off” their sales compensation plans as a result.
Our goals or quotas are not set based on market potential and can be attained usually by a small percentage of the sales organization. We have a culture of few, rather than many winners.
Our goals or quotas are set based on a reliable estimate of market potential and are achievable by approximately 60%-70% of the sales organization on average.
10. Plan Management & Admini-stration
Plan administration is loose and we respond to chronic issues, sometimes too late. We do not have the tools or processes in place to use an effective sales compensation dashboard. Our plan policies are informal or non-existent and may be created as needed.
We administer our plan and respond to issues on an as-needed basis. We do not have the tools or processes in place to use an effective sales compensation dashboard. We obtain input from the sales organization if issues arise. We have plan policies but may not consistently or effectively manage to them to the satisfaction of management and the sales organization.
We actively administer our plan and use a sales compensation dashboard to evaluate key metrics on a regular basis. We obtain periodic input from the sales organization on plan performance. We have effective plan policies and manage those to the satisfaction of management and the sales organization.
Average Grade (Divide Total Points by 10):
© 2018 Korn Ferry. All rights reserved 43
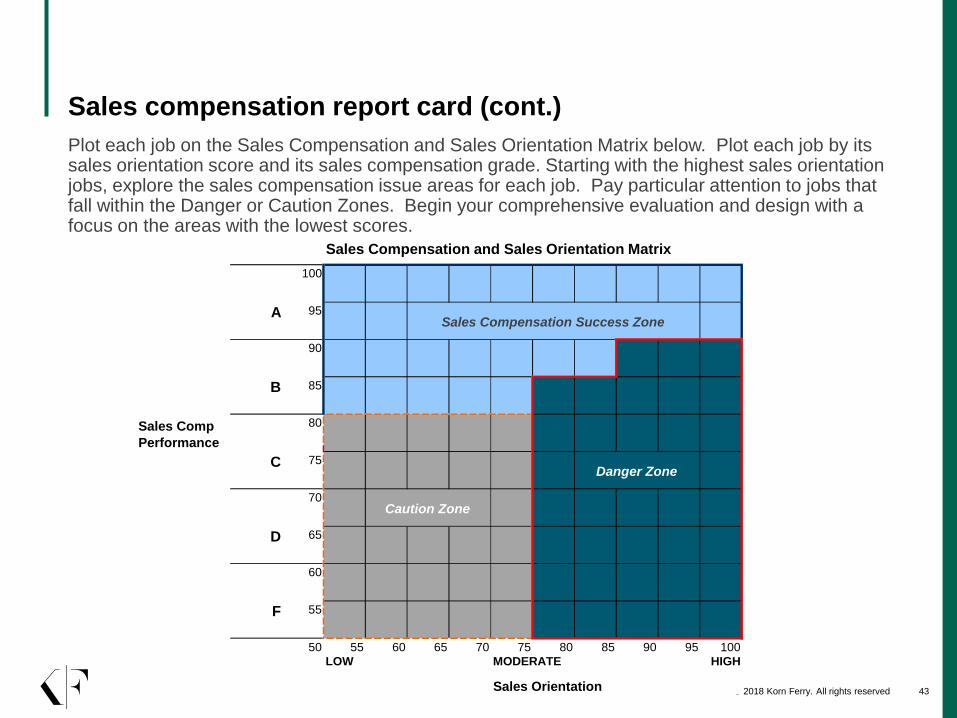
Sales compensation report card (cont.)
Plot each job on the Sales Compensation and Sales Orientation Matrix below. Plot each job by its sales orientation score and its sales compensation grade. Starting with the highest sales orientation jobs, explore the sales compensation issue areas for each job. Pay particular attention to jobs that fall within the Danger or Caution Zones. Begin your comprehensive evaluation and design with a focus on the areas with the lowest scores.
Sales Compensation and Sales Orientation Matrix
100
A 95Sales Compensation Success Zone
90
B 85
Sales Comp
Performance
80
C 75Danger Zone
70Caution Zone
D 65
60
F 55
50 55 60 65 70 75 80 85 90 95 100
LOW MODERATE HIGH
Sales Orientation

Thank you