Embed Size (px)
Citation preview

San Leandro Unified
School Board
Looking Closely About Our Data
September 6, 2006
Presented byDepartment of Curriculum and Instruction
Prepared by Daniel Chaja, Assistant Director of Research and
Program Evaluation

California Standards Test(CST)
2006 CSTs
Content Area Grades
ELA
Grade-levels 2 through 11
Grade-level Writing 4 & 7
Math
Grade-levels 2 through 7
End-of-year Courses 8 through 11
Social Sciences Grade-levels 8, 10, 11
Science
Grade-levels 5, 8, 10, 11
End-of-year Courses 9 through 11
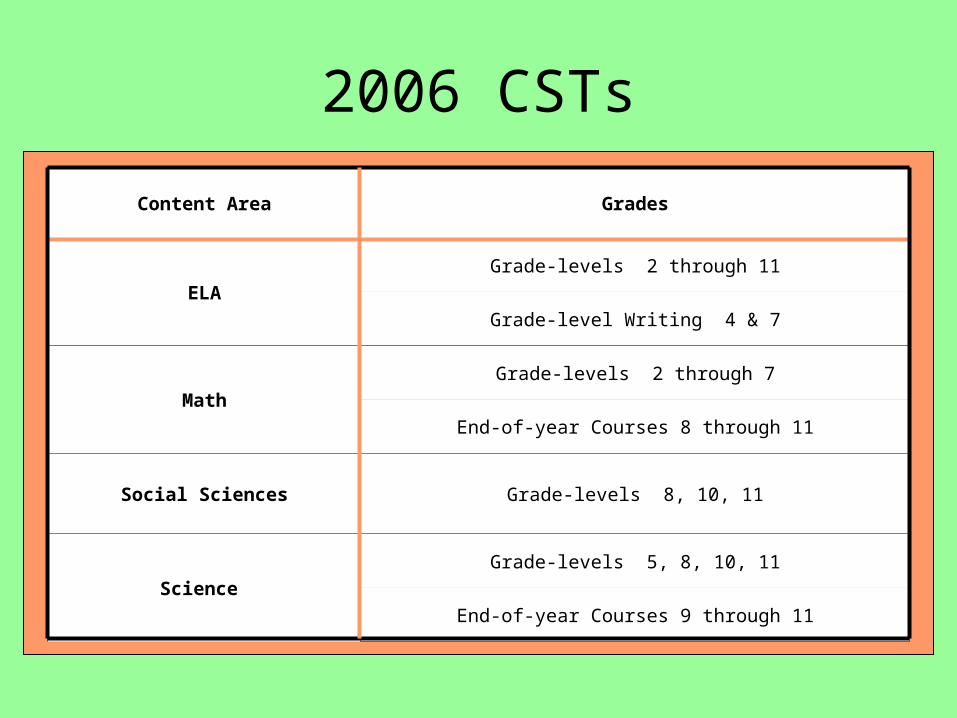
SLUSD - California Standards Test - E/ LA - Grades 2-5
813 12 11
17 17 17 16
8 9 812
913 14 12
19
23
18 18
23 2427
20
1719
15
1517
16 13 18
39
35
31 31
3234
31
33
3736
3733
41 33 3533
23
22
28 29
2118 18
23
26 2326
23
26
24 25 23
117
11 118 7 7 9
13 13 1417
6
13 12 14
0%
10%
20%
30%
40%
50%
60%
70%
80%
90%
100%
Gr. 2,
200
3
Gr. 2,
200
4
Gr. 2,
200
5
Gr. 2,
200
6
Gr. 3,
200
3
Gr. 3,
200
4
Gr. 3,
200
5
Gr. 3,
200
6
Gr. 4,
200
3
Gr. 4,
200
4
Gr. 4,
200
5
Gr. 4,
200
6
Gr. 5,
200
3
Gr. 5,
200
4
Gr. 5,
200
5
Gr. 5,
200
6
Grade and Year Tested
Perc
ent
of
Stu
den
ts
Far Below Basic Below Basic Basic Proficient Advanced
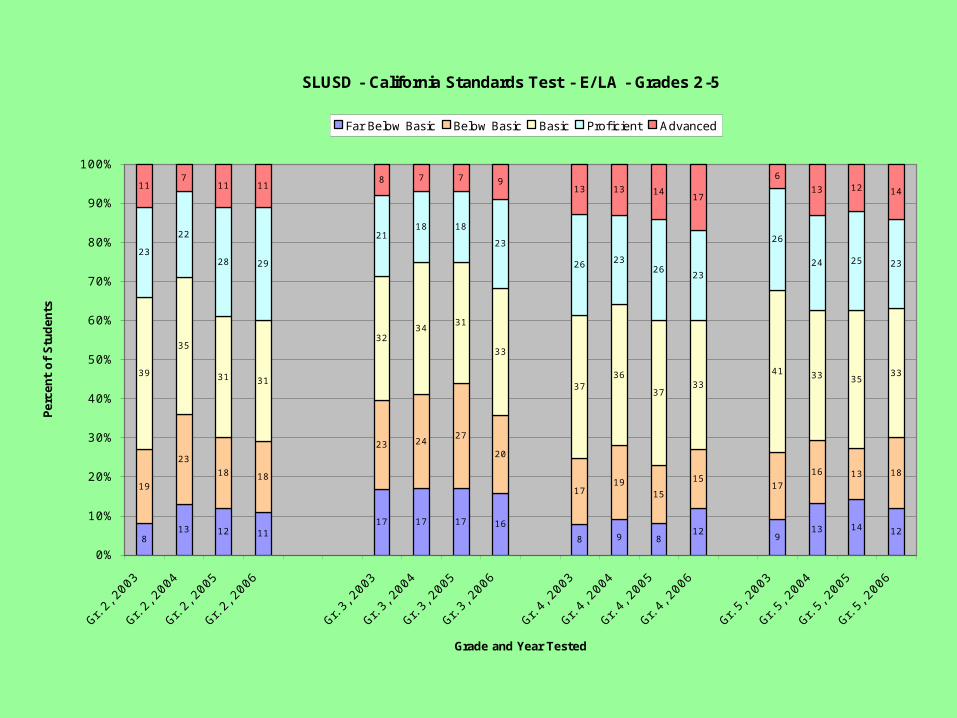
SLUSD - California Standards Test - E/ LA - Grades 6-8
9 9 1014
11 9 1014
11 118
13
15 16 16
18
1615
16
15 19 20
18
17
4041 40
3441
39 3332
42 40
4037
2724 25 23
2529
31 26
21 21
23 20
9 9 10 117 8 10 12
7 811 12
0%
10%
20%
30%
40%
50%
60%
70%
80%
90%
100%
Gr. 6,
2003
Gr. 6,
2004
Gr. 6,
2005
Gr. 6,
2006
Gr. 7,
2003
Gr. 7,
2004
Gr. 7,
2005
Gr. 7,
2006
Gr. 8,
2003
Gr. 8,
2004
Gr. 8,
2005
Gr. 8,
2006
Grade and Year Tested
Perc
ent
of
Stu
den
ts
Far Below Basic Below Basic Basic Proficient Advanced
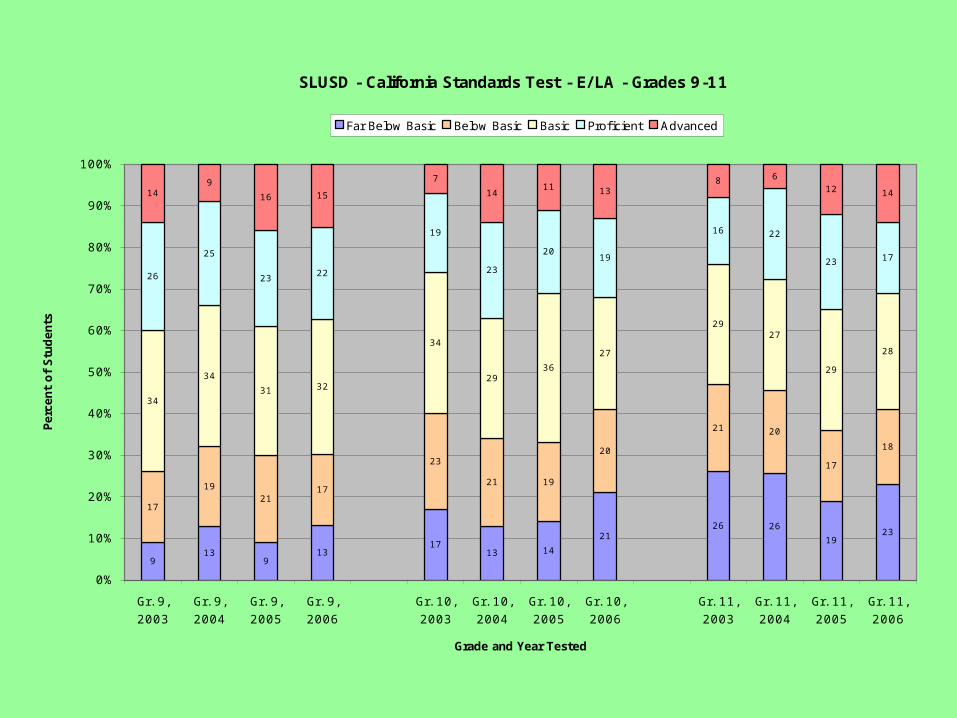
SLUSD - California Standards Test - E/ LA - Grades 9-11
913
913
1713 14
2126 26
1923
17
1921
17
23
21 19
20
21 20
17
18
34
34
31 32
34
2936
27
2927
29
28
26
25
2322
19
23
2019
16 22
23 17
149
16 15
7
1411 13
8 612 14
0%
10%
20%
30%
40%
50%
60%
70%
80%
90%
100%
Gr. 9,
2003
Gr. 9,
2004
Gr. 9,
2005
Gr. 9,
2006
Gr. 10,
2003
Gr. 10,
2004
Gr. 10,
2005
Gr. 10,
2006
Gr. 11,
2003
Gr. 11,
2004
Gr. 11,
2005
Gr. 11,
2006
Grade and Year Tested
Perc
ent
of
Stu
den
ts
Far Below Basic Below Basic Basic Proficient Advanced
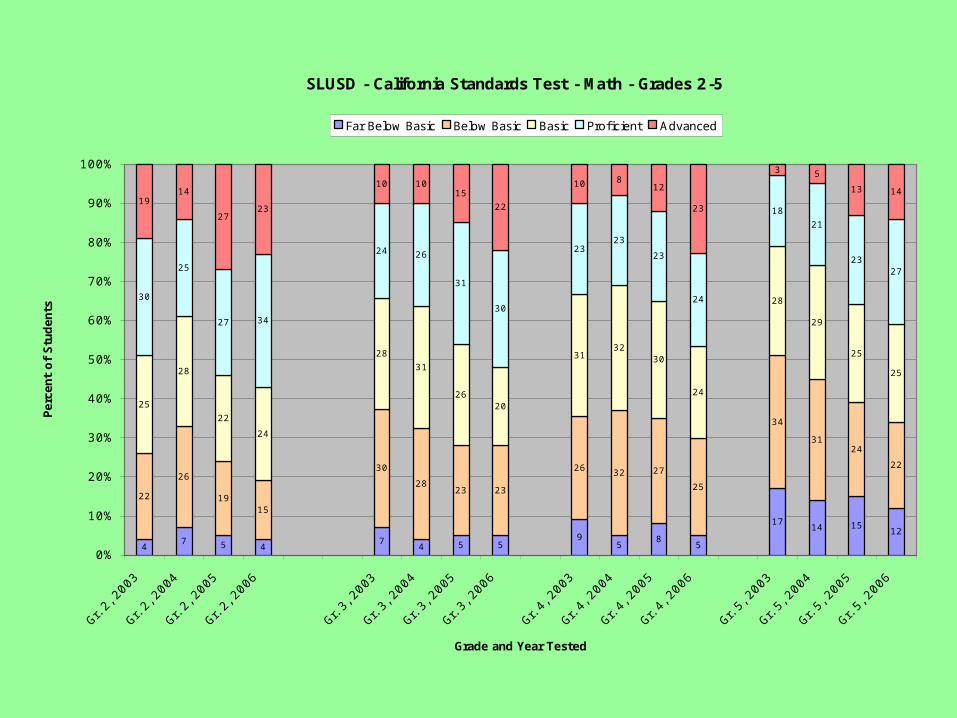
SLUSD - California Standards Test - Math - Grades 2-5
47 5 4
74 5 5
95
85
1714 15
12
22
26
1915
30
2823 23
26 32 27
25
34
3124
22
25
28
22
24
28
31
2620
3132
30
24
28
29
25
25
30
25
27 34
24 26
31
30
2323
23
24
18
21
2327
1914
2723
10 1015
22
10 812
23
3 5
13 14
0%
10%
20%
30%
40%
50%
60%
70%
80%
90%
100%
Gr. 2,
200
3
Gr. 2,
200
4
Gr. 2,
200
5
Gr. 2,
200
6
Gr. 3,
200
3
Gr. 3,
200
4
Gr. 3,
200
5
Gr. 3,
200
6
Gr. 4,
200
3
Gr. 4,
200
4
Gr. 4,
200
5
Gr. 4,
200
6
Gr. 5,
200
3
Gr. 5,
200
4
Gr. 5,
200
5
Gr. 5,
200
6
Grade and Year Tested
Perc
ent
of
Stu
den
ts
Far Below Basic Below Basic Basic Proficient Advanced
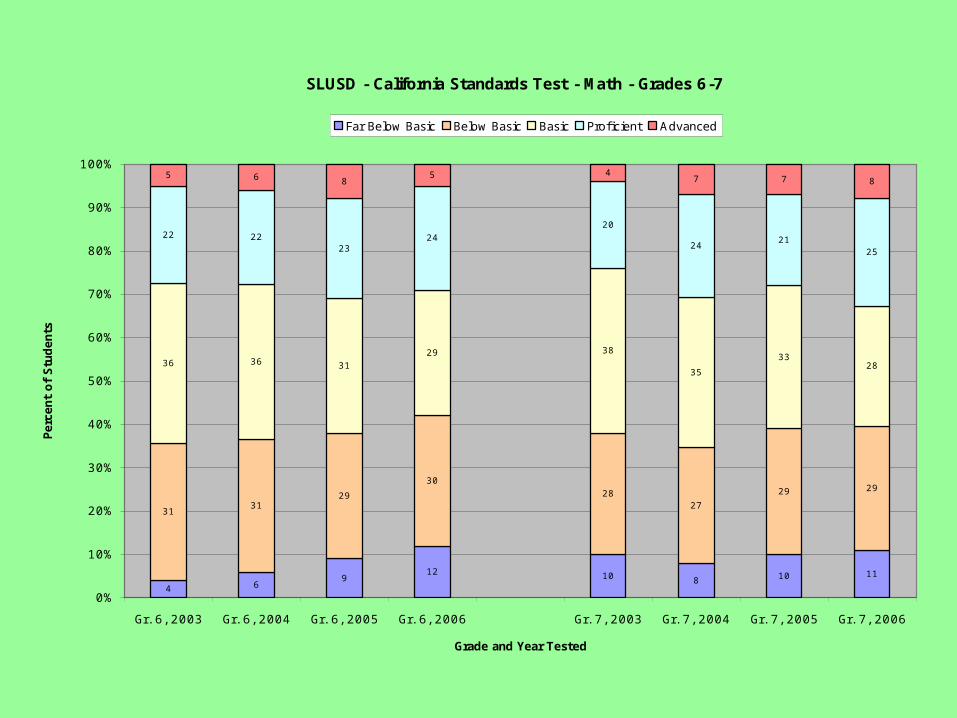
SLUSD - California Standards Test - Math - Grades 6-7
4 69
12 10 8 10 11
3131
29
3028
27
29 29
36 36 3129 38
35
3328
22 2223
2420
2421
25
5 6 85 4
7 7 8
0%
10%
20%
30%
40%
50%
60%
70%
80%
90%
100%
Gr. 6, 2003 Gr. 6, 2004 Gr. 6, 2005 Gr. 6, 2006 Gr. 7, 2003 Gr. 7, 2004 Gr. 7, 2005 Gr. 7, 2006
Grade and Year Tested
Perc
ent
of
Stu
den
ts
Far Below Basic Below Basic Basic Proficient Advanced
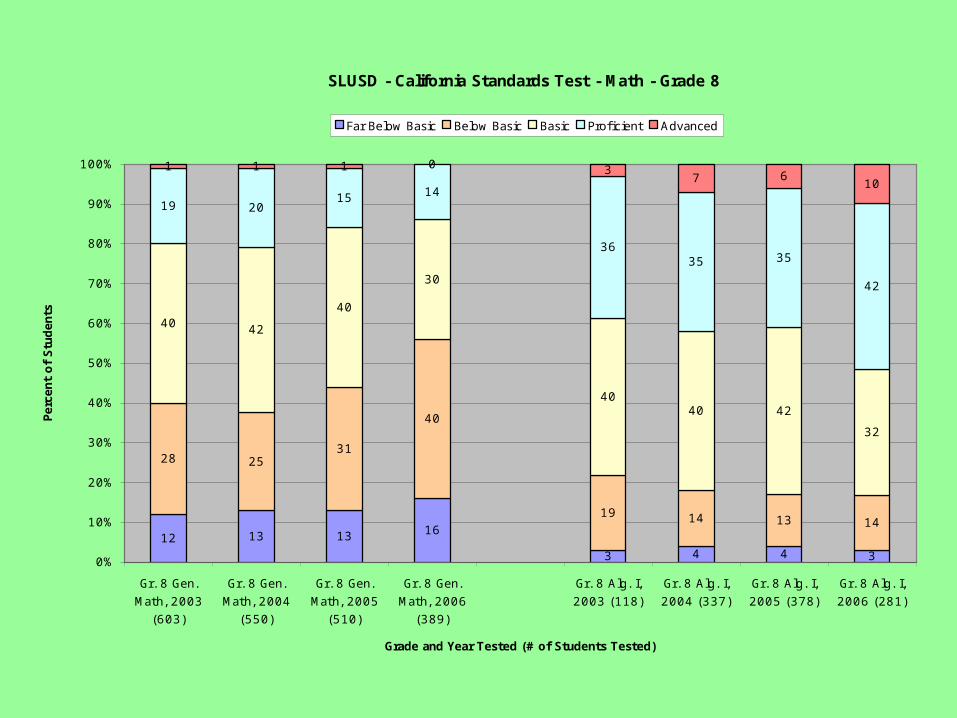
SLUSD - California Standards Test - Math - Grade 8
12 13 13 16
3 4 4 3
28 2531
40
19 14 13 14
40 42
40
30
4040 42
32
19 2015 14
3635 35
42
1 1 1 0 37 6
10
0%
10%
20%
30%
40%
50%
60%
70%
80%
90%
100%
Gr. 8 Gen.
Math, 2003
(603)
Gr. 8 Gen.
Math, 2004
(550)
Gr. 8 Gen.
Math, 2005
(510)
Gr. 8 Gen.
Math, 2006
(389)
Gr. 8 Alg. I,
2003 (118)
Gr. 8 Alg. I,
2004 (337)
Gr. 8 Alg. I,
2005 (378)
Gr. 8 Alg. I,
2006 (281)
Grade and Year Tested (# of Students Tested)
Perc
ent
of
Stu
den
ts
Far Below Basic Below Basic Basic Proficient Advanced
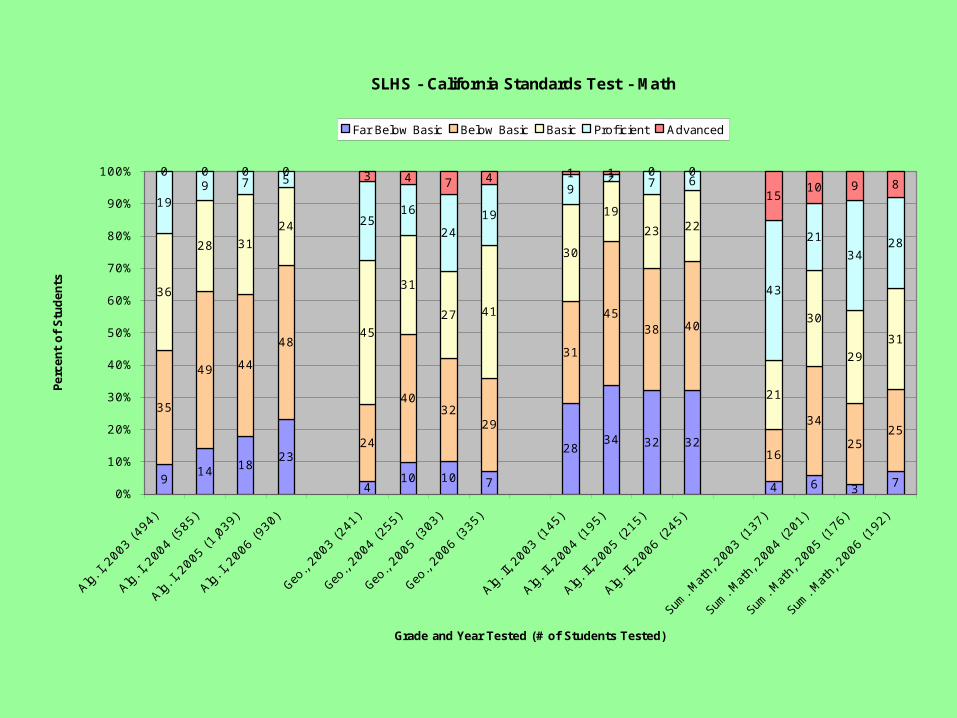
SLHS - California Standards Test - Math
914 18
23
410 10 7
2834 32 32
4 6 3 7
35
49 44
48
24
4032
29
31
4538 40
16
34
2525
36
28 31
24
45
31
27 41
30
19
23 22
21
30
29
31
199 7 5
2516
24
19
92 7 6
43
21
3428
0 0 0 0 3 4 7 4 1 1 0 0
1510 9 8
0%
10%
20%
30%
40%
50%
60%
70%
80%
90%
100%
Alg. I, 2
003
(494
)
Alg. I, 2
004
(585
)
Alg. I, 2
005
(1,0
39)
Alg. I, 2
006
(930
)
Geo.,
2003
(241
)
Geo.,
2004
(255
)
Geo.,
2005
(303
)
Geo.,
2006
(335
)
Alg. II, 20
03 (1
45)
Alg. II, 20
04 (1
95)
Alg. II, 20
05 (2
15)
Alg. II, 20
06 (2
45)
Sum. M
ath, 2
003
(137
)
Sum. M
ath, 2
004
(201
)
Sum. M
ath, 2
005
(176
)
Sum. M
ath, 2
006
(192
)
Grade and Year Tested (# of Students Tested)
Perc
ent
of
Stu
den
ts
Far Below Basic Below Basic Basic Proficient Advanced
ELA & Math CSTs By Ethnicity
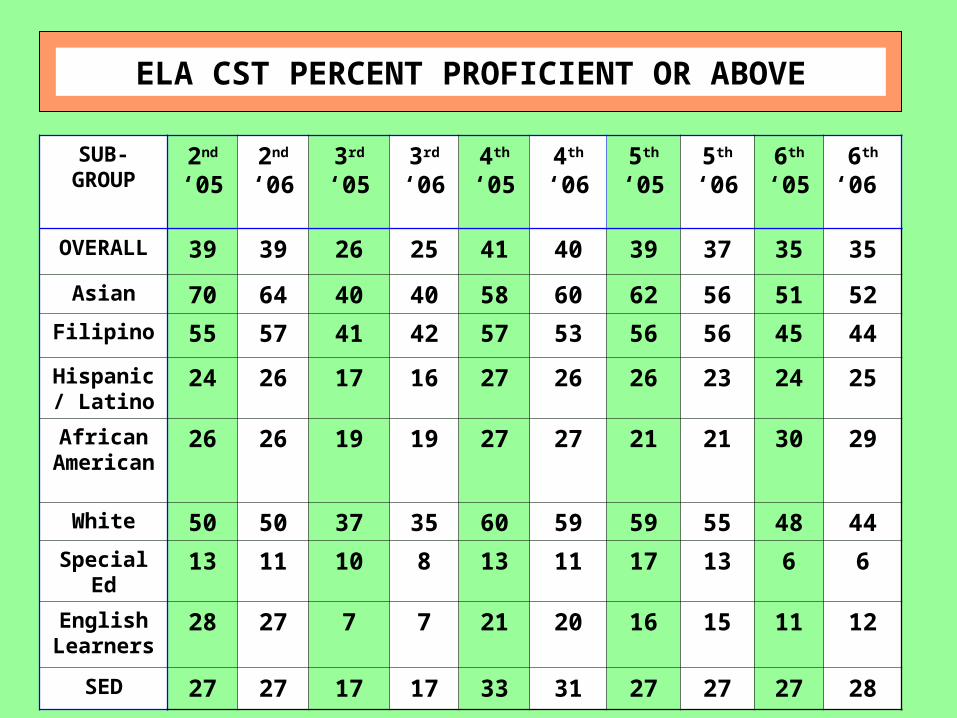
SUB-GROUP
2nd ‘05
2nd ‘06
3rd ‘05
3rd ‘06
4th ‘05
4th ‘06
5th ‘05
5th ‘06
6th ‘05
6th ‘06
OVERALL 39 39 26 25 41 40 39 37 35 35
Asian 70 64 40 40 58 60 62 56 51 52
Filipino 55 57 41 42 57 53 56 56 45 44
Hispanic / Latino
24 26 17 16 27 26 26 23 24 25
African America
n
26 26 19 19 27 27 21 21 30 29
White 50 50 37 35 60 59 59 55 48 44
Special Ed
13 11 10 8 13 11 17 13 6 6
English Learners
28 27 7 7 21 20 16 15 11 12
SED 27 27 17 17 33 31 27 27 27 28
ELA CST PERCENT PROFICIENT OR ABOVE
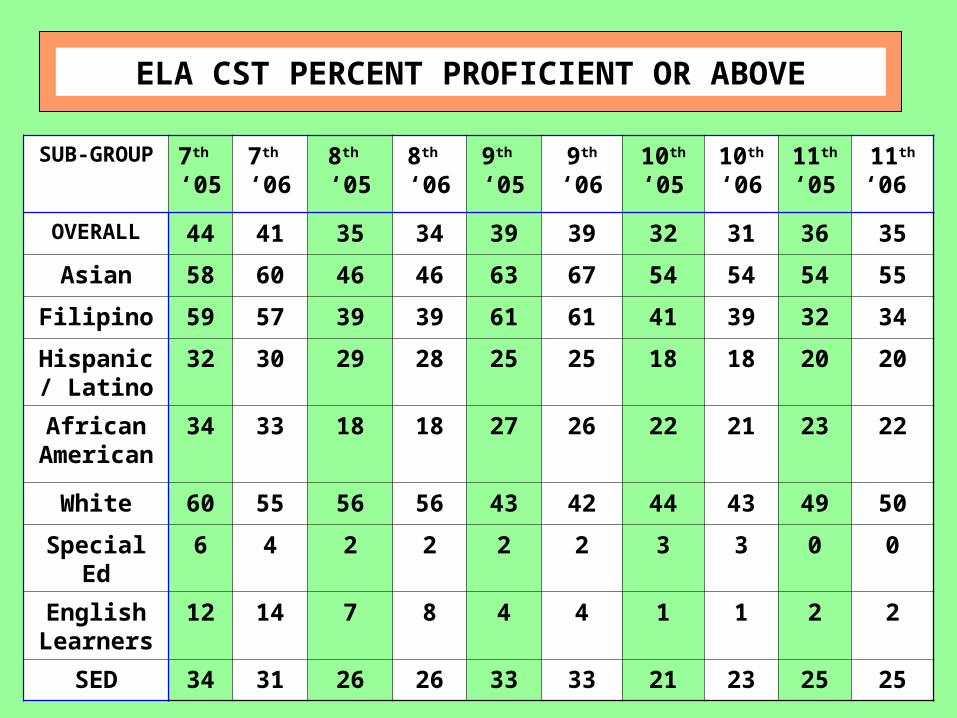
SUB-GROUP
7th ‘05
7th ‘06
8th ‘05
8th ‘06
9th ‘05
9th ‘06
10th ‘05
10th ‘06
11th ‘05
11th ‘06
OVERALL 44 41 35 34 39 39 32 31 36 35
Asian 58 60 46 46 63 67 54 54 54 55
Filipino 59 57 39 39 61 61 41 39 32 34
Hispanic / Latino
32 30 29 28 25 25 18 18 20 20
African America
n
34 33 18 18 27 26 22 21 23 22
White 60 55 56 56 43 42 44 43 49 50
Special Ed
6 4 2 2 2 2 3 3 0 0
English Learners
12 14 7 8 4 4 1 1 2 2
SED 34 31 26 26 33 33 21 23 25 25
ELA CST PERCENT PROFICIENT OR ABOVE
SUB-GROUP
2nd ‘05
2nd ‘06
3rd ‘05
3rd ‘06
4th ‘05
4th ‘06
5th ‘05
5th ‘06
6th ‘05
6th ‘06
7th ‘05
7th ‘06
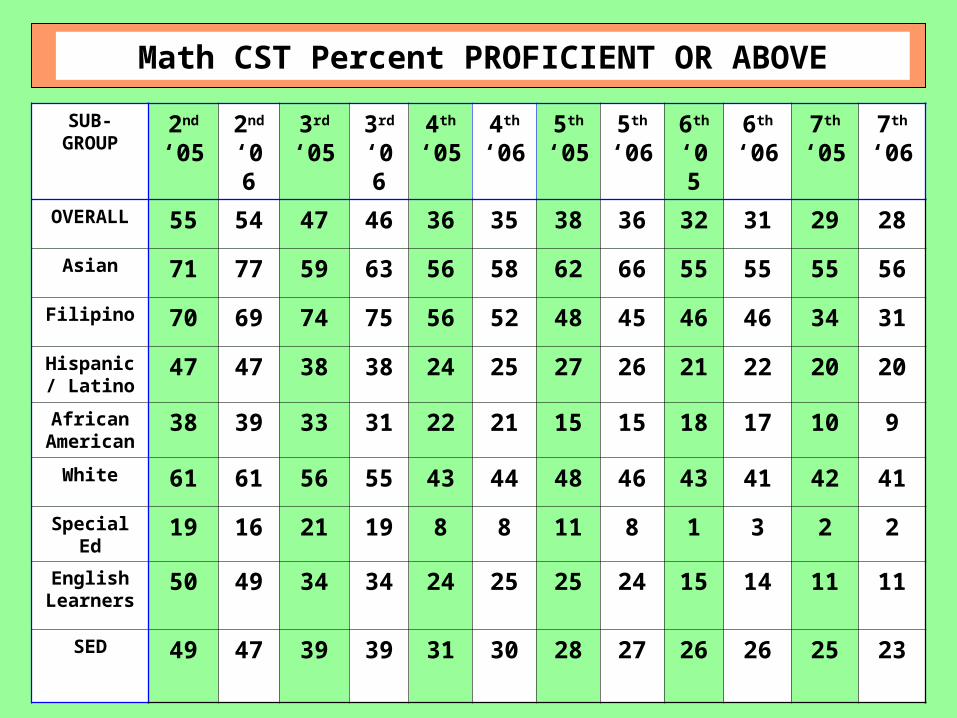
OVERALL 55 54 47 46 36 35 38 36 32 31 29 28Asian 71 77 59 63 56 58 62 66 55 55 55 56
Filipino 70 69 74 75 56 52 48 45 46 46 34 31Hispanic / Latino
47 47 38 38 24 25 27 26 21 22 20 20
African America
n
38 39 33 31 22 21 15 15 18 17 10 9
White 61 61 56 55 43 44 48 46 43 41 42 41Special
Ed19 16 21 19 8 8 11 8 1 3 2 2
English Learners
50 49 34 34 24 25 25 24 15 14 11 11
SED 49 47 39 39 31 30 28 27 26 26 25 23
Math CST Percent PROFICIENT OR ABOVE
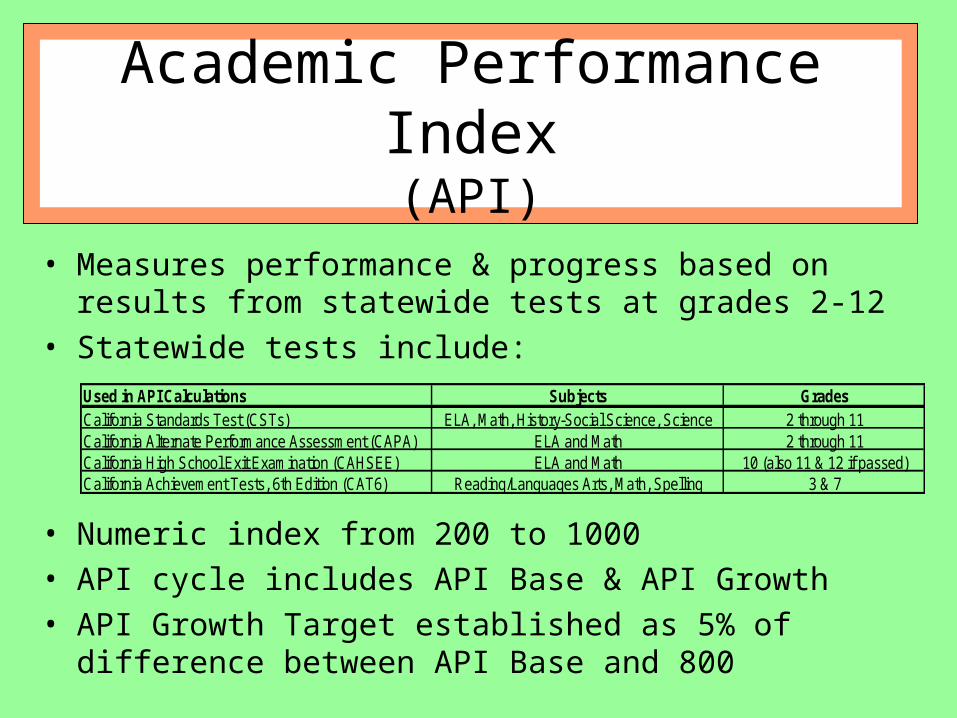
Academic Performance Index(API)
• Measures performance & progress based on results from statewide tests at grades 2-12
• Statewide tests include:
• Numeric index from 200 to 1000• API cycle includes API Base & API Growth• API Growth Target established as 5% of difference between
API Base and 800
Used in API Calculations Subjects GradesCalifornia Standards Test (CSTs) ELA, Math, History-Social Science, Science 2 through 11California Alternate Performance Assessment (CAPA) ELA and Math 2 through 11California High School Exit Examination (CAHSEE) ELA and Math 10 (also 11 & 12 if passed)California Achievement Tests, 6th Edition (CAT6) Reading/Languages Arts, Math, Spelling 3 & 7
SLUSD API Results
Reported by District, School and Subgroup
(2005-2006 API Cycle)
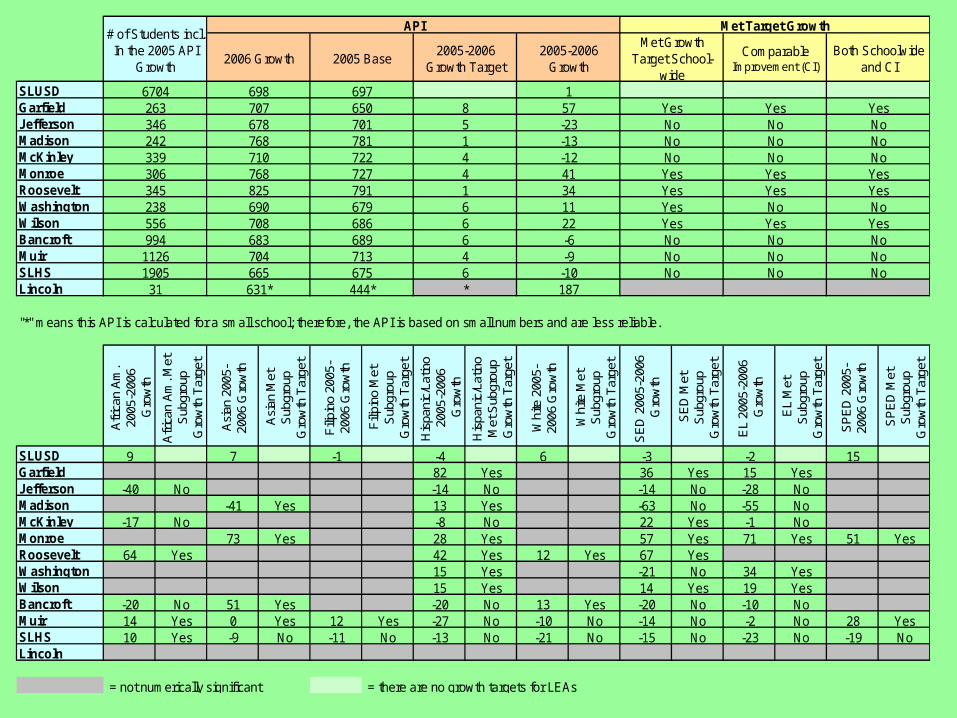
SLUSDGarfieldJeffersonMadisonMcKinleyMonroeRooseveltWashingtonWilsonBancroftMuirSLHSLincoln
"*" means this API is calculated for a small school; therefore, the API is based on small numbers and are less reliable.
Afr
ican
Am
. 20
05-2
006
Gro
wth
Afr
ican
Am
. Met
S
ubgr
oup
Gro
wth
Tar
get
Asi
an 2
005-
2006
Gro
wth
Asi
an M
et
Sub
grou
p G
row
th T
arge
t
Fili
pino
200
5-20
06 G
row
th
Fili
pino
Met
S
ubgr
oup
Gro
wth
Tar
get
His
pani
c/La
tino
2005
-200
6 G
row
th
His
pani
c/La
tino
Met
Sub
grou
p G
row
th T
arge
t
Whi
te 2
005-
2006
Gro
wth
Whi
te M
et
Sub
grou
p G
row
th T
arge
t
SE
D 2
005-
2006
G
row
th
SE
D M
et
Sub
grou
p G
row
th T
arge
t
EL
2005
-200
6 G
row
th
EL
Met
S
ubgr
oup
Gro
wth
Tar
get
SP
ED
200
5-20
06 G
row
th
SP
ED
Met
S
ubgr
oup
Gro
wth
Tar
get
SLUSD 9 7 -1 -4 6 -3 -2 15Garfield 82 Yes 36 Yes 15 YesJefferson -40 No -14 No -14 No -28 NoMadison -41 Yes 13 Yes -63 No -55 NoMcKinley -17 No -8 No 22 Yes -1 NoMonroe 73 Yes 28 Yes 57 Yes 71 Yes 51 YesRoosevelt 64 Yes 42 Yes 12 Yes 67 YesWashington 15 Yes -21 No 34 YesWilson 15 Yes 14 Yes 19 YesBancroft -20 No 51 Yes -20 No 13 Yes -20 No -10 NoMuir 14 Yes 0 Yes 12 Yes -27 No -10 No -14 No -2 No 28 YesSLHS 10 Yes -9 No -11 No -13 No -21 No -15 No -23 No -19 NoLincoln
= not numerically significant = there are no growth targets for LEAs
YesYesNoYesNoNoNo
YesNoNoNo
NoNoNo
YesYesNoYes
YesNoNoNo
NoNoNo
YesYesYesYes
YesNoNoNo
-6-9
-10187
41341122
57-23-13-12
646*
4166
8514
689713675444*
727791679686
650701781722
683704665631*
768825690708
707678768710
99411261905
31
306345238556
263346242339
16704 698 697
Met Growth Target School-
wide
Comparable Improvement (CI)
Both Schoolwide and CI
# of Students incl. In the 2005 API
Growth2006 Growth 2005 Base
2005-2006 Growth Target
API Met Target Growth
2005-2006 Growth
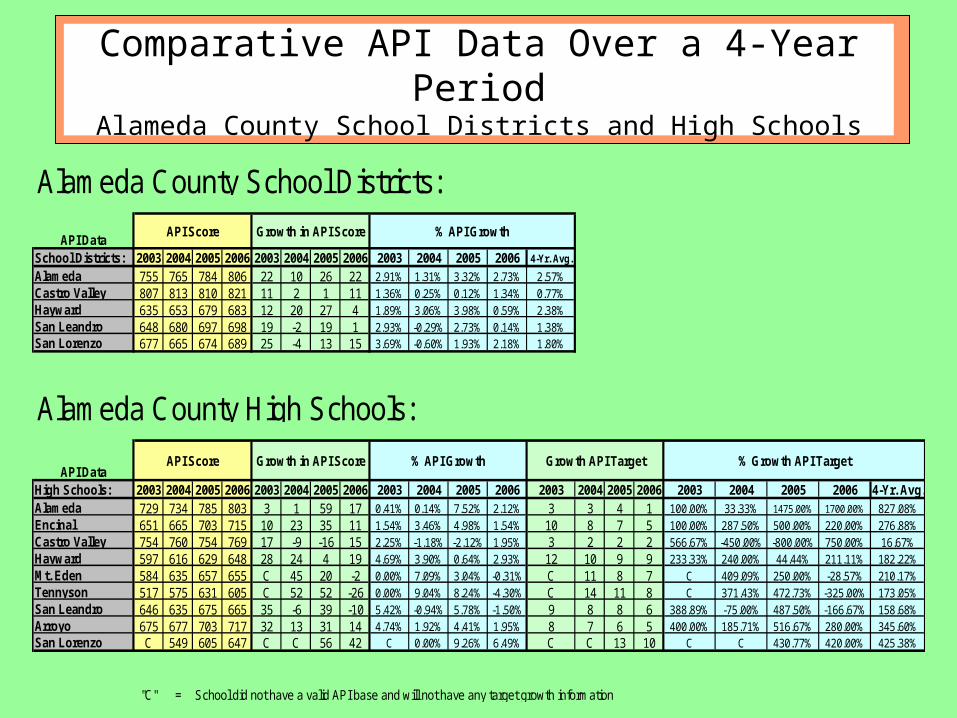
Comparative API Data Over a 4-Year PeriodAlameda County School Districts and High Schools
Alameda County School Districts:
API Data School Districts: 2003 2004 2005 2006 2003 2004 2005 2006 2003 2004 2005 2006 4-Yr. Avg.
Alameda 755 765 784 806 22 10 26 22 2.91% 1.31% 3.32% 2.73% 2.57%Castro Valley 807 813 810 821 11 2 1 11 1.36% 0.25% 0.12% 1.34% 0.77%Hayward 635 653 679 683 12 20 27 4 1.89% 3.06% 3.98% 0.59% 2.38%San Leandro 648 680 697 698 19 -2 19 1 2.93% -0.29% 2.73% 0.14% 1.38%San Lorenzo 677 665 674 689 25 -4 13 15 3.69% -0.60% 1.93% 2.18% 1.80%
Alameda County High Schools:
API DataHigh Schools: 2003 2004 2005 2006 2003 2004 2005 2006 2003 2004 2005 2006 2003 2004 2005 2006 2003 2004 2005 2006 4-Yr. Avg.Alameda 729 734 785 803 3 1 59 17 0.41% 0.14% 7.52% 2.12% 3 3 4 1 100.00% 33.33% 1475.00% 1700.00% 827.08%Encinal 651 665 703 715 10 23 35 11 1.54% 3.46% 4.98% 1.54% 10 8 7 5 100.00% 287.50% 500.00% 220.00% 276.88%Castro Valley 754 760 754 769 17 -9 -16 15 2.25% -1.18% -2.12% 1.95% 3 2 2 2 566.67% -450.00% -800.00% 750.00% 16.67%Hayward 597 616 629 648 28 24 4 19 4.69% 3.90% 0.64% 2.93% 12 10 9 9 233.33% 240.00% 44.44% 211.11% 182.22%Mt. Eden 584 635 657 655 C 45 20 -2 0.00% 7.09% 3.04% -0.31% C 11 8 7 C 409.09% 250.00% -28.57% 210.17%Tennyson 517 575 631 605 C 52 52 -26 0.00% 9.04% 8.24% -4.30% C 14 11 8 C 371.43% 472.73% -325.00% 173.05%San Leandro 646 635 675 665 35 -6 39 -10 5.42% -0.94% 5.78% -1.50% 9 8 8 6 388.89% -75.00% 487.50% -166.67% 158.68%Arroyo 675 677 703 717 32 13 31 14 4.74% 1.92% 4.41% 1.95% 8 7 6 5 400.00% 185.71% 516.67% 280.00% 345.60%San Lorenzo C 549 605 647 C C 56 42 C 0.00% 9.26% 6.49% C C 13 10 C C 430.77% 420.00% 425.38%
"C" = School did not have a valid API base and will not have any target growth information
API Score Growth in API Score % API Growth
% Growth API TargetAPI Score Growth in API Score % API Growth Growth API Target
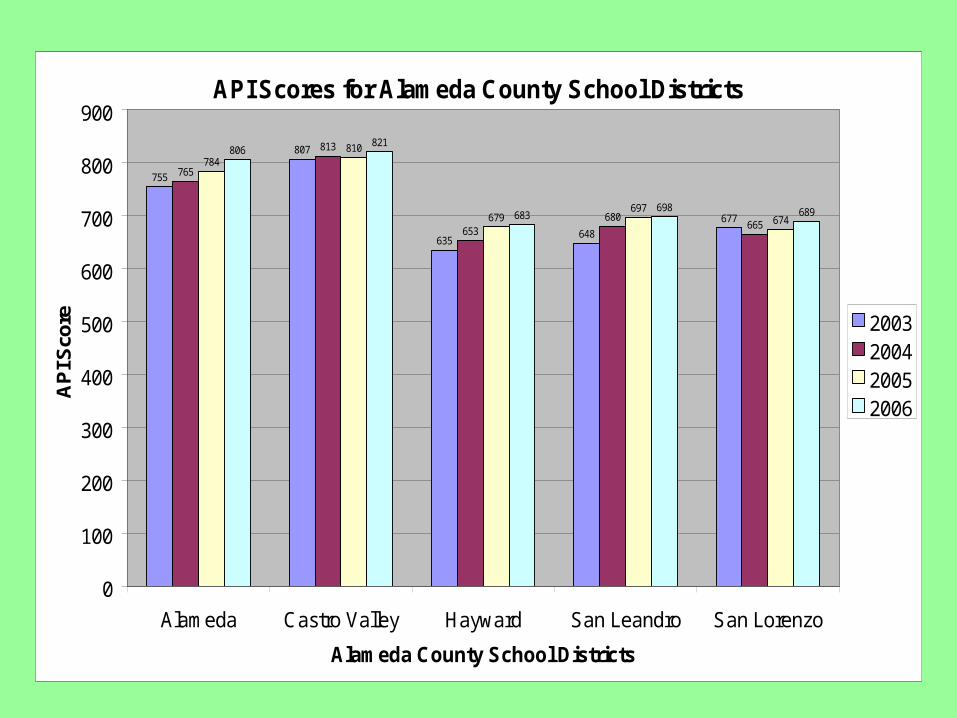
API Scores for Alameda County School Districts
755
807
635648
677
765
813
653680
665
784810
679697
674
806821
683698 689
0
100
200
300
400
500
600
700
800
900
Alameda Castro Valley Hayward San Leandro San Lorenzo
Alameda County School Districts
AP
I Sco
re 2003200420052006
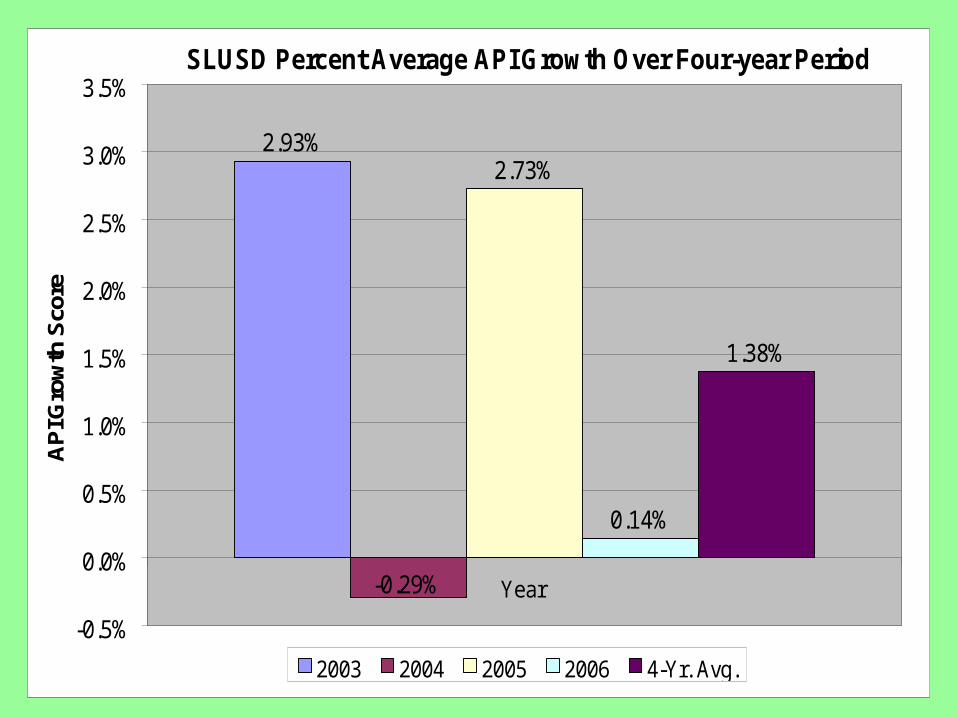
SLUSD Percent Average API Growth Over Four-year Period
2.93%2.73%
0.14%
1.38%
-0.29%
-0.5%
0.0%
0.5%
1.0%
1.5%
2.0%
2.5%
3.0%
3.5%
1
AP
I Gro
wth
Sco
re
2003 2004 2005 2006 4-Yr. Avg.
Year
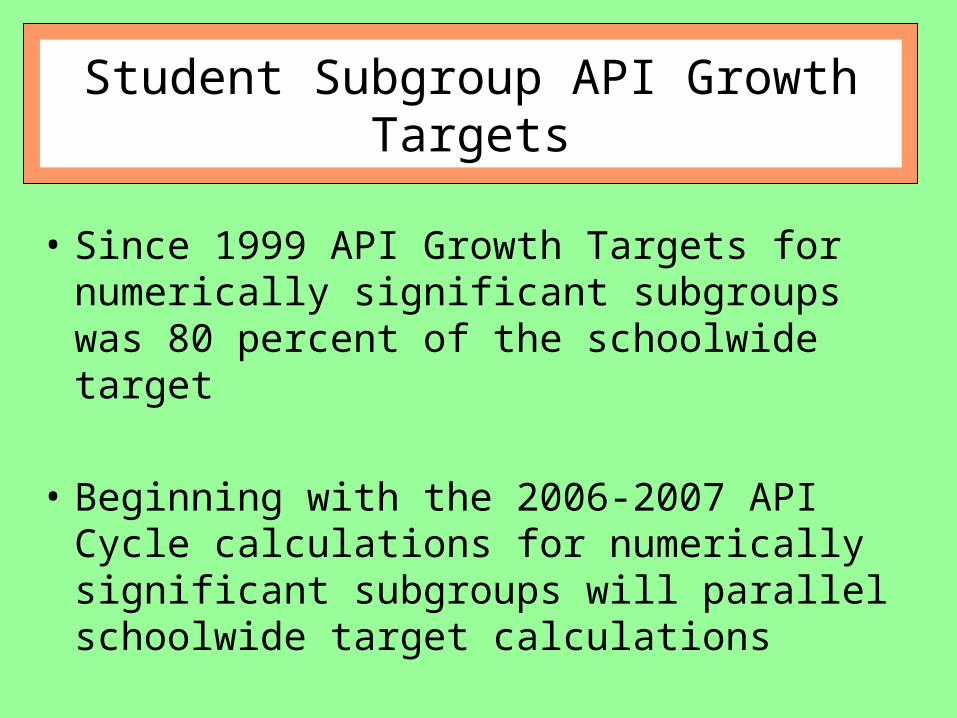
Student Subgroup API Growth Targets
• Since 1999 API Growth Targets for numerically significant subgroups was 80 percent of the schoolwide target
• Beginning with the 2006-2007 API Cycle calculations for numerically significant subgroups will parallel schoolwide target calculations
API By Student Subgroups
• African American
• Hispanic/Latino
• EL Hispanic/Latino
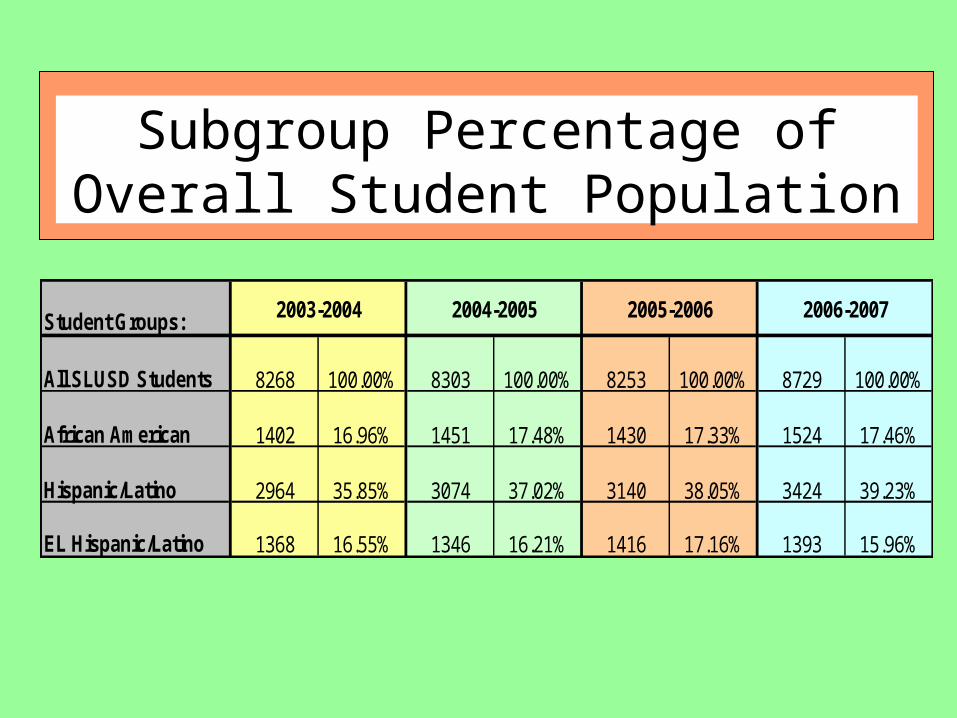
Subgroup Percentage of Overall Student Population
Student Groups:
All SLUSD Students 8268 100.00% 8303 100.00% 8253 100.00% 8729 100.00%
African American 1402 16.96% 1451 17.48% 1430 17.33% 1524 17.46%
Hispanic/Latino 2964 35.85% 3074 37.02% 3140 38.05% 3424 39.23%
EL Hispanic/Latino 1368 16.55% 1346 16.21% 1416 17.16% 1393 15.96%
2003-2004 2004-2005 2005-2006 2006-2007
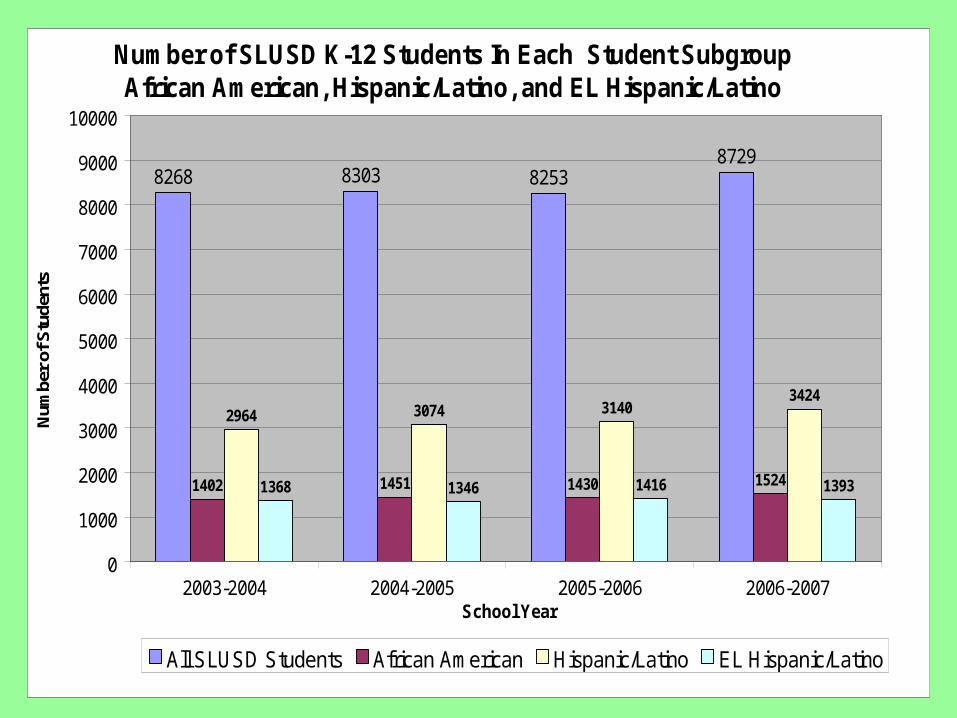
Number of SLUSD K-12 Students In Each Student Subgroup African American, Hispanic/Latino, and EL Hispanic/Latino
8268 8303 82538729
1402 1451 1430 1524
2964 3074 31403424
1368 1346 1416 1393
0
1000
2000
3000
4000
5000
6000
7000
8000
9000
10000
2003-2004 2004-2005 2005-2006 2006-2007School Year
Num
ber
of S
tude
nts
All SLUSD Students African American Hispanic/Latino EL Hispanic/Latino
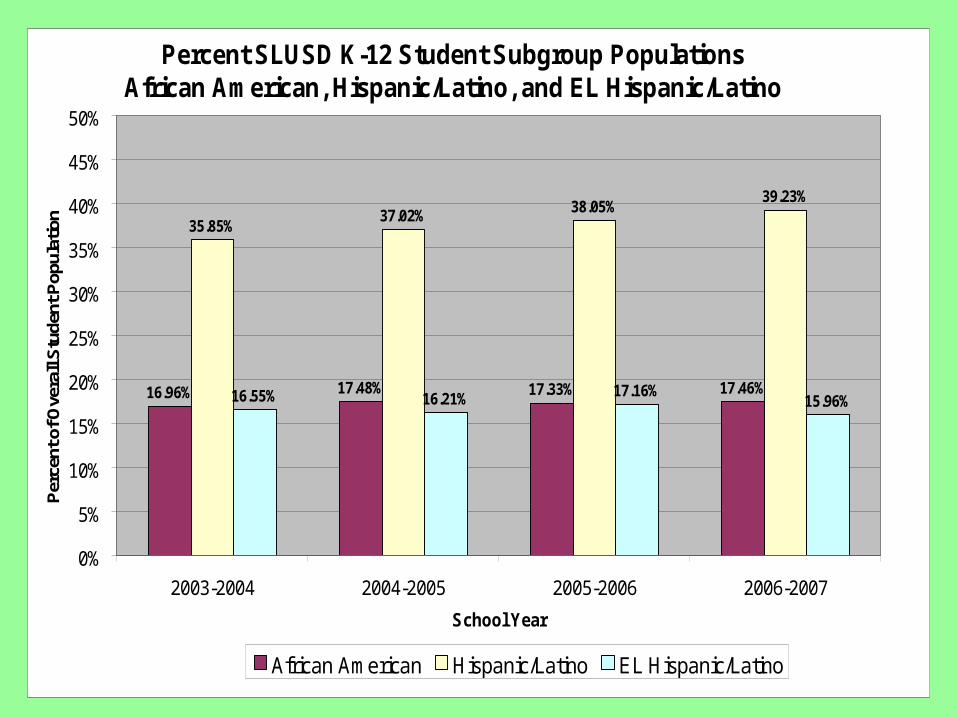
Percent SLUSD K-12 Student Subgroup PopulationsAfrican American, Hispanic/Latino, and EL Hispanic/Latino
16.96% 17.48% 17.33% 17.46%
35.85%37.02% 38.05%
39.23%
16.55% 16.21% 17.16%15.96%
0%
5%
10%
15%
20%
25%
30%
35%
40%
45%
50%
2003-2004 2004-2005 2005-2006 2006-2007
School Year
Per
cent
of O
vera
ll S
tude
nt P
opul
atio
n
African American Hispanic/Latino EL Hispanic/Latino
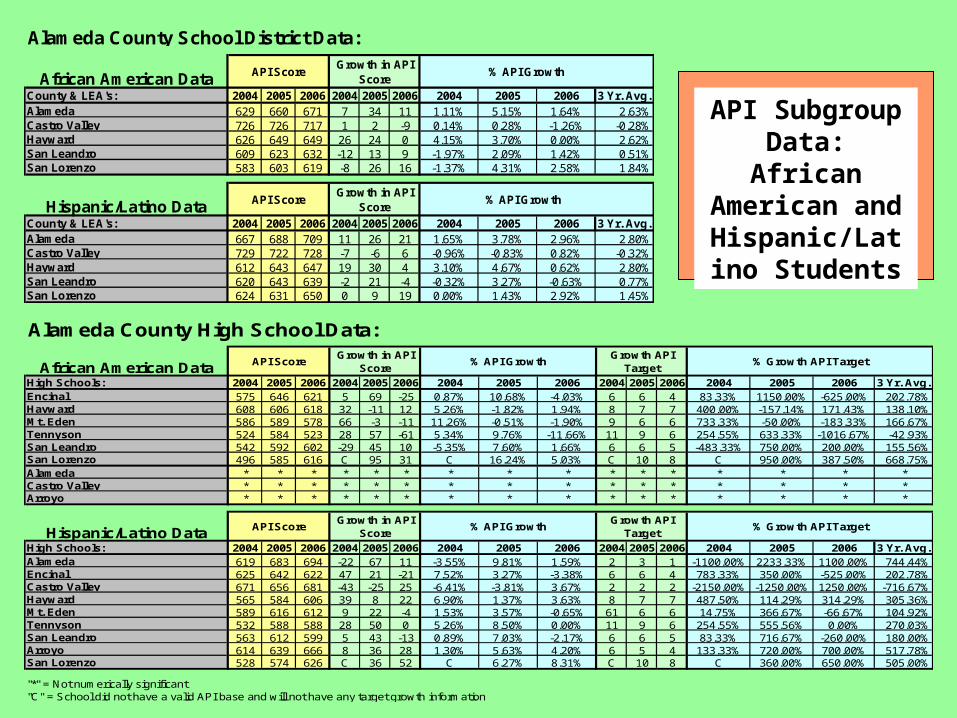
Alameda County School District Data:
African American DataCounty & LEA's: 2004 2005 2006 2004 2005 2006 2004 2005 2006Alameda 629 660 671 7 34 11 1.11% 5.15% 1.64%Castro Valley 726 726 717 1 2 -9 0.14% 0.28% -1.26%Hayward 626 649 649 26 24 0 4.15% 3.70% 0.00%San Leandro 609 623 632 -12 13 9 -1.97% 2.09% 1.42%San Lorenzo 583 603 619 -8 26 16 -1.37% 4.31% 2.58%
Hispanic/Latino DataCounty & LEA's: 2004 2005 2006 2004 2005 2006 2004 2005 2006Alameda 667 688 709 11 26 21 1.65% 3.78% 2.96%Castro Valley 729 722 728 -7 -6 6 -0.96% -0.83% 0.82%Hayward 612 643 647 19 30 4 3.10% 4.67% 0.62%San Leandro 620 643 639 -2 21 -4 -0.32% 3.27% -0.63%San Lorenzo 624 631 650 0 9 19 0.00% 1.43% 2.92%
Alameda County High School Data:
African American DataHigh Schools: 2004 2005 2006 2004 2005 2006 2004 2005 2006 2004 2005 2006 2004 2005 2006 3 Yr. Avg.Encinal 575 646 621 5 69 -25 0.87% 10.68% -4.03% 6 6 4 83.33% 1150.00% -625.00% 202.78%Hayward 608 606 618 32 -11 12 5.26% -1.82% 1.94% 8 7 7 400.00% -157.14% 171.43% 138.10%Mt. Eden 586 589 578 66 -3 -11 11.26% -0.51% -1.90% 9 6 6 733.33% -50.00% -183.33% 166.67%Tennyson 524 584 523 28 57 -61 5.34% 9.76% -11.66% 11 9 6 254.55% 633.33% -1016.67% -42.93%San Leandro 542 592 602 -29 45 10 -5.35% 7.60% 1.66% 6 6 5 -483.33% 750.00% 200.00% 155.56%San Lorenzo 496 585 616 C 95 31 C 16.24% 5.03% C 10 8 C 950.00% 387.50% 668.75%Alameda * * * * * * * * * * * * * * * *Castro Valley * * * * * * * * * * * * * * * *Arroyo * * * * * * * * * * * * * * * *
Hispanic/Latino DataHigh Schools: 2004 2005 2006 2004 2005 2006 2004 2005 2006 2004 2005 2006 2004 2005 2006 3 Yr. Avg.Alameda 619 683 694 -22 67 11 -3.55% 9.81% 1.59% 2 3 1 -1100.00% 2233.33% 1100.00% 744.44%Encinal 625 642 622 47 21 -21 7.52% 3.27% -3.38% 6 6 4 783.33% 350.00% -525.00% 202.78%Castro Valley 671 656 681 -43 -25 25 -6.41% -3.81% 3.67% 2 2 2 -2150.00% -1250.00% 1250.00% -716.67%Hayward 565 584 606 39 8 22 6.90% 1.37% 3.63% 8 7 7 487.50% 114.29% 314.29% 305.36%Mt. Eden 589 616 612 9 22 -4 1.53% 3.57% -0.65% 61 6 6 14.75% 366.67% -66.67% 104.92%Tennyson 532 588 588 28 50 0 5.26% 8.50% 0.00% 11 9 6 254.55% 555.56% 0.00% 270.03%San Leandro 563 612 599 5 43 -13 0.89% 7.03% -2.17% 6 6 5 83.33% 716.67% -260.00% 180.00%Arroyo 614 639 666 8 36 28 1.30% 5.63% 4.20% 6 5 4 133.33% 720.00% 700.00% 517.78%San Lorenzo 528 574 626 C 36 52 C 6.27% 8.31% C 10 8 C 360.00% 650.00% 505.00%
"*" = Not numerically significant"C" = School did not have a valid API base and will not have any target growth information
API ScoreGrowth in API
Score% API Growth
API ScoreGrowth in API
Score% API Growth
% Growth API Target
% Growth API Target
API ScoreGrowth in API
Score% API Growth
Growth API Target
Growth API Target
API ScoreGrowth in API
Score% API Growth
Alameda County School District Data:
African American DataCounty & LEA's: 2004 2005 2006 2004 2005 2006 2004 2005 2006 3 Yr. Avg.Alameda 629 660 671 7 34 11 1.11% 5.15% 1.64% 2.63%Castro Valley 726 726 717 1 2 -9 0.14% 0.28% -1.26% -0.28%Hayward 626 649 649 26 24 0 4.15% 3.70% 0.00% 2.62%San Leandro 609 623 632 -12 13 9 -1.97% 2.09% 1.42% 0.51%San Lorenzo 583 603 619 -8 26 16 -1.37% 4.31% 2.58% 1.84%
Hispanic/Latino DataCounty & LEA's: 2004 2005 2006 2004 2005 2006 2004 2005 2006 3 Yr. Avg.Alameda 667 688 709 11 26 21 1.65% 3.78% 2.96% 2.80%Castro Valley 729 722 728 -7 -6 6 -0.96% -0.83% 0.82% -0.32%Hayward 612 643 647 19 30 4 3.10% 4.67% 0.62% 2.80%San Leandro 620 643 639 -2 21 -4 -0.32% 3.27% -0.63% 0.77%San Lorenzo 624 631 650 0 9 19 0.00% 1.43% 2.92% 1.45%
API ScoreGrowth in API
Score % API Growth
API ScoreGrowth in API
Score % API Growth
API Subgroup Data: African American and
Hispanic/Latino Students
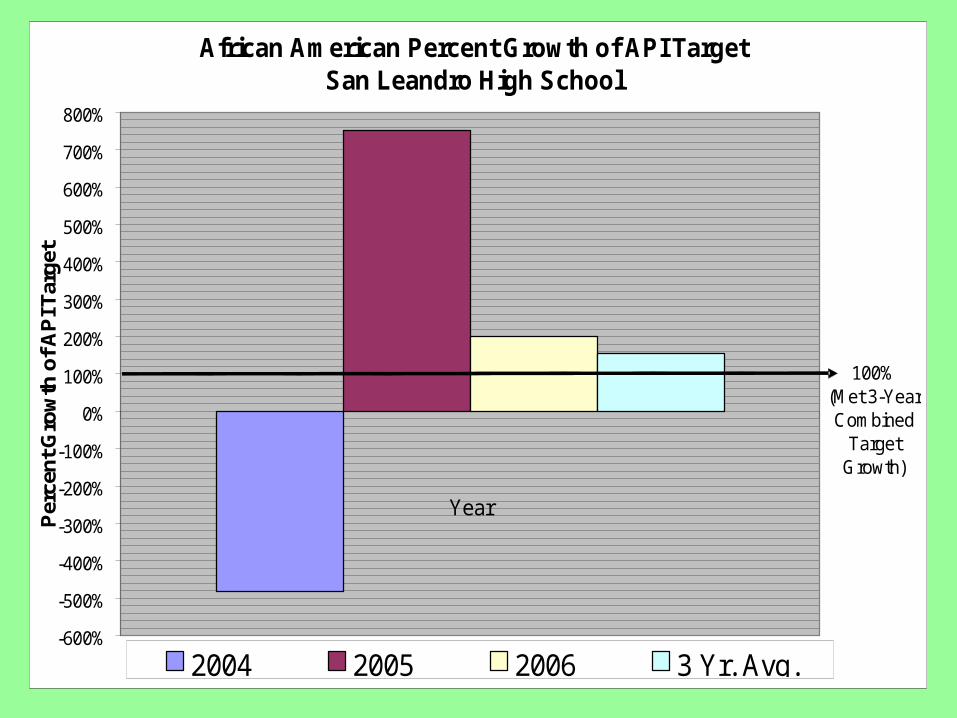
African American Percent Growth of API TargetSan Leandro High School
-600%
-500%
-400%
-300%
-200%
-100%
0%
100%
200%
300%
400%
500%
600%
700%
800%
Year
Per
cen
t Gro
wth
of A
PI T
arg
et
2004 2005 2006 3 Yr. Avg.
100%(Met 3-Year Combined
Target Growth)
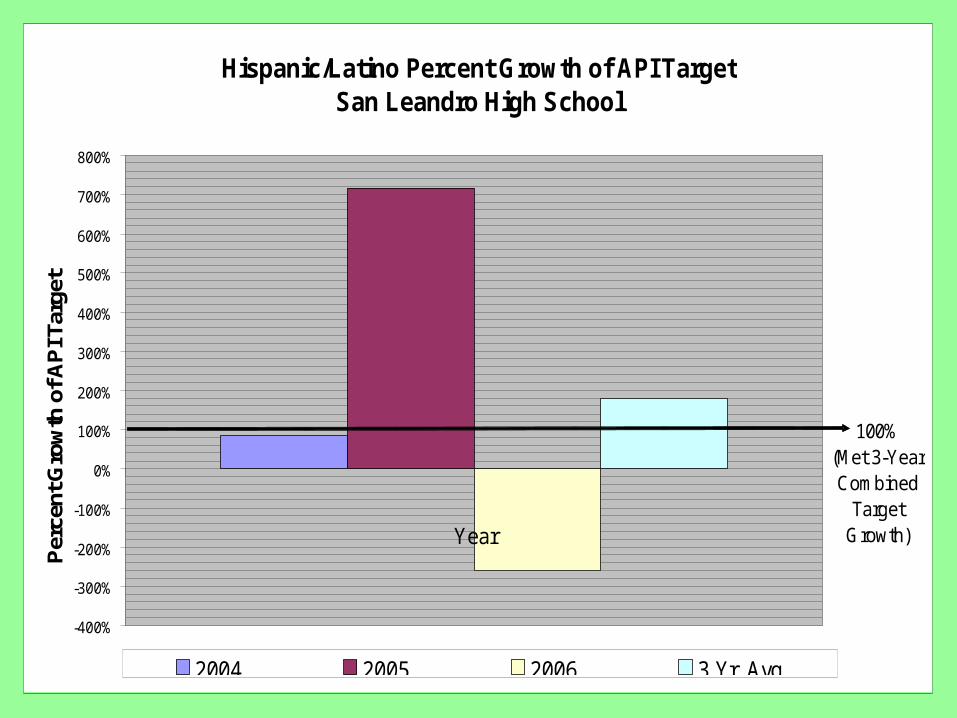
Hispanic/Latino Percent Growth of API TargetSan Leandro High School
-400%
-300%
-200%
-100%
0%
100%
200%
300%
400%
500%
600%
700%
800%
Year
Year
Per
cent
Gro
wth
of A
PI T
arge
t
2004 2005 2006 3 Yr. Avg.
100%(Met 3-Year Combined
Target Growth)
Adequate Yearly Progress(AYP)
• Must meet annual targets that increase over time
• Goal is 100% of students proficient in ELA and mathematics by 2013-2014
• Annual determination for schools and LEAs
Requirements:
Federal No Child Left Behind (NCLB) requires states to reports results of each public school and school district
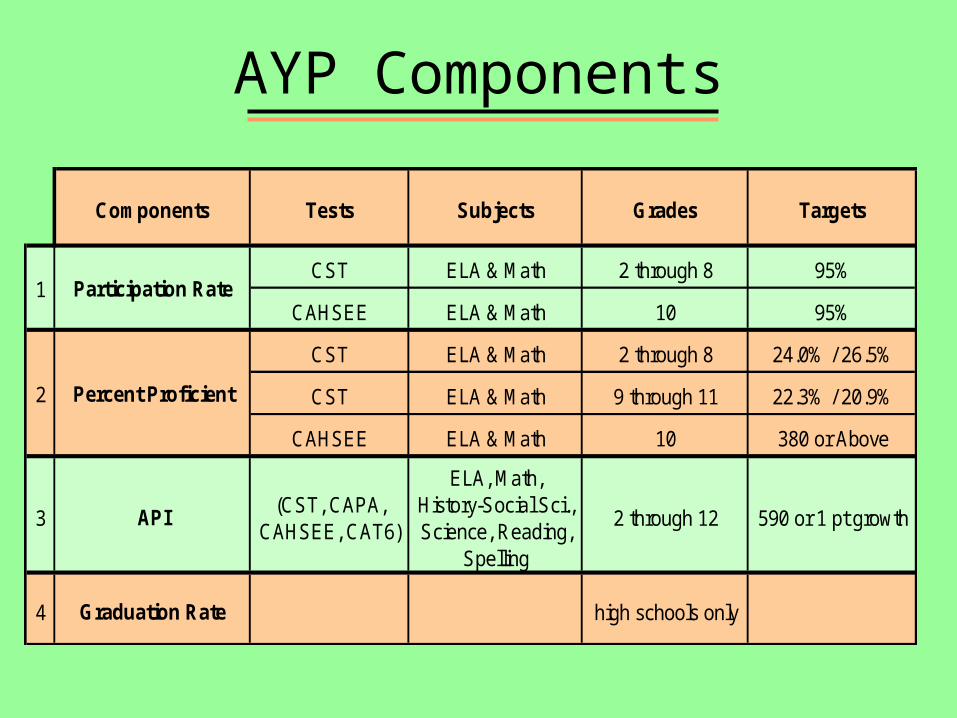
AYP Components
Components Tests Subjects Grades Targets
CST ELA & Math 2 through 8 95%
CAHSEE ELA & Math 10 95%
CST ELA & Math 2 through 8 24.0% / 26.5%
CST ELA & Math 9 through 11 22.3% / 20.9%
CAHSEE ELA & Math 10 380 or Above
3 API(CST, CAPA,
CAHSEE, CAT6)
ELA, Math, History-Social Sci., Science, Reading,
Spelling
2 through 12 590 or 1 pt growth
4 Graduation Rate high schools only
Participation Rate1
Percent Proficient2
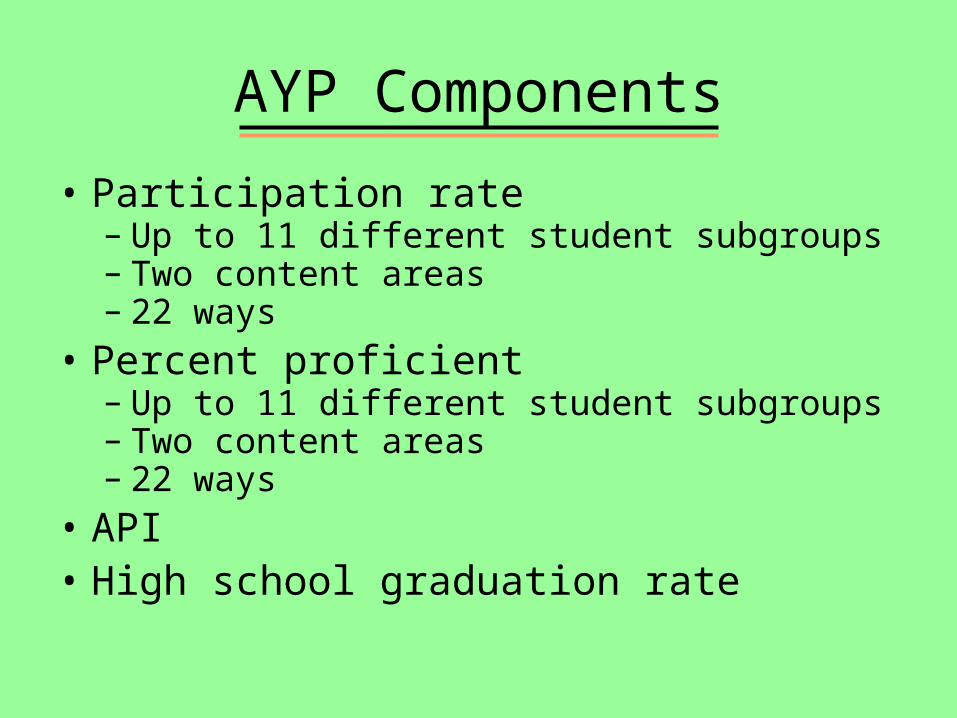
• Participation rate– Up to 11 different student subgroups– Two content areas– 22 ways
• Percent proficient– Up to 11 different student subgroups– Two content areas– 22 ways
• API• High school graduation rate
AYP Components
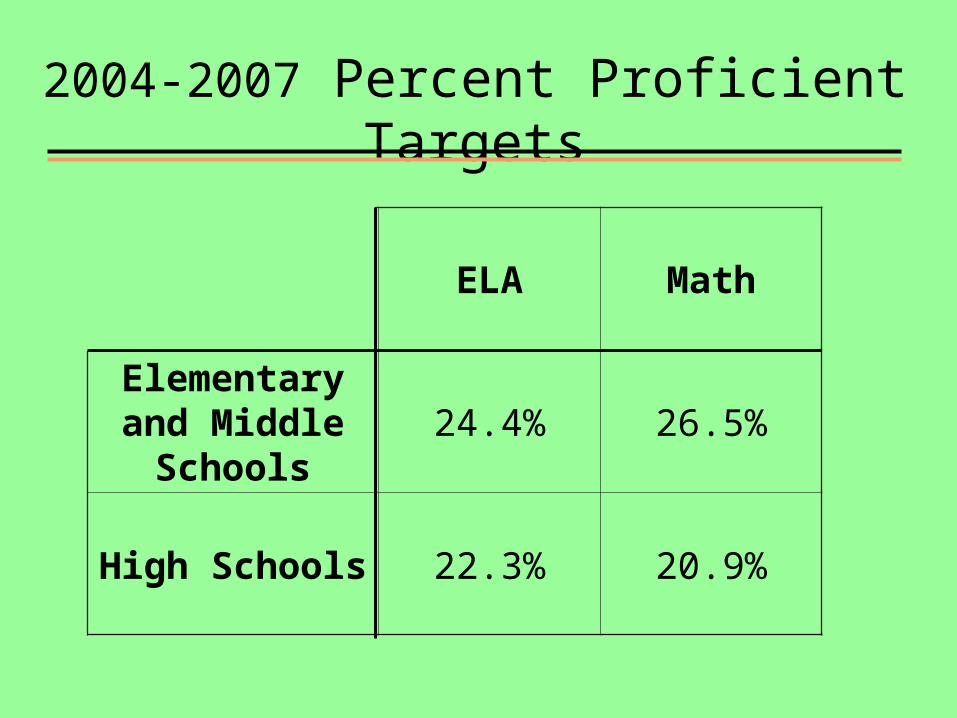
ELA Math
Elementary and Middle
Schools24.4% 26.5%
High Schools 22.3% 20.9%
2004-2007 Percent Proficient Targets
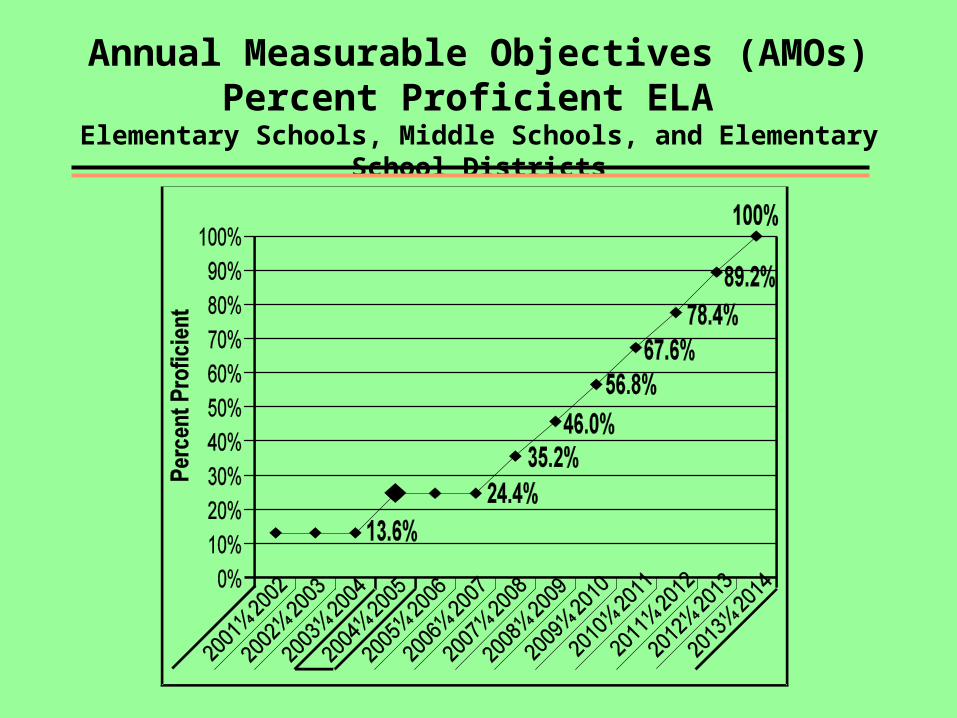
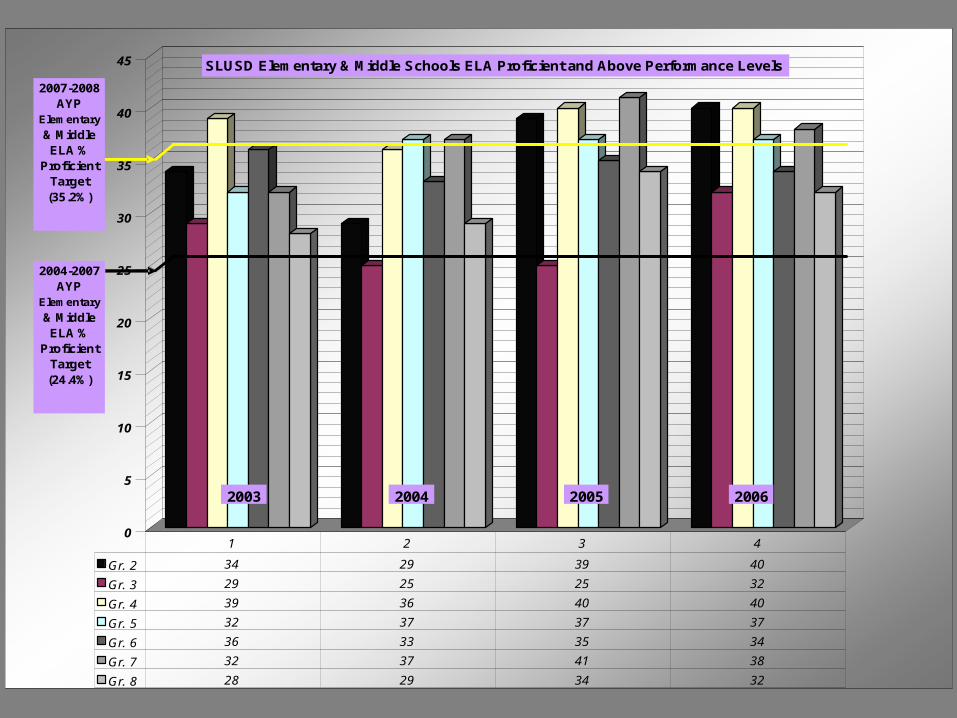
Annual Measurable Objectives (AMOs)Percent Proficient ELA
Elementary Schools, Middle Schools, and Elementary School Districts
0
5
10
15
20
25
30
35
40
45
Gr. 2 34 29 39 40
Gr. 3 29 25 25 32
Gr. 4 39 36 40 40
Gr. 5 32 37 37 37
Gr. 6 36 33 35 34
Gr. 7 32 37 41 38
Gr. 8 28 29 34 32
1 2 3 4
2003 2004 2005 2006
SLUSD Elementary & Middle Schools ELA Proficient and Above Performance Levels
2004-2007 AYP
Elementary
& Middle ELA %
Proficient Target(24.4%)
2007-2008 AYP
Elementary
& Middle ELA %
Proficient Target(35.2%)
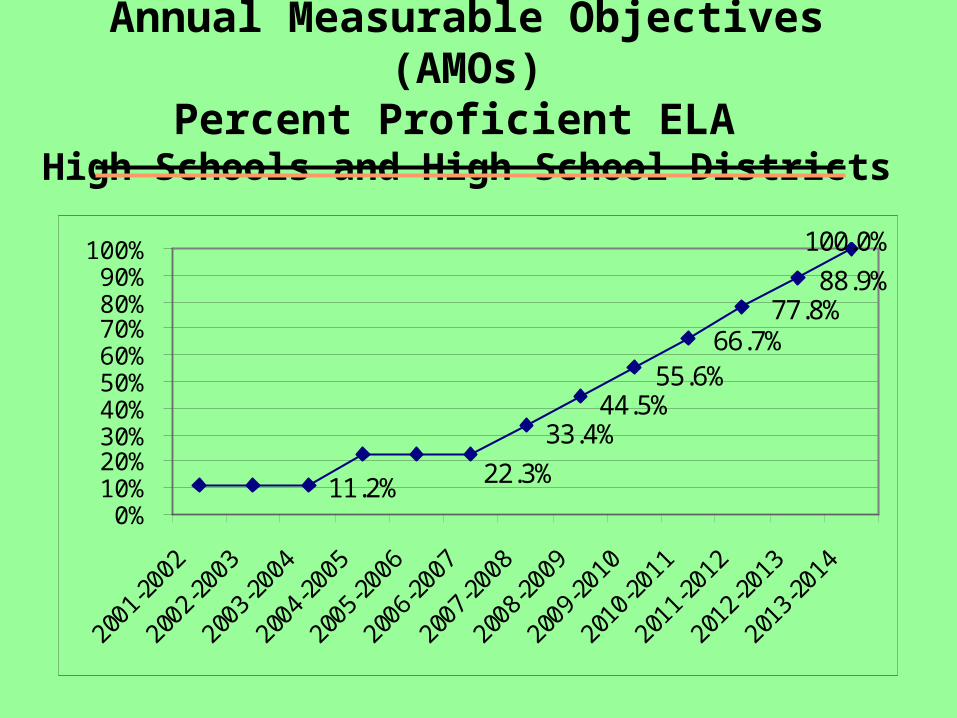
11.2%
88.9%
22.3%
100.0%
77.8%
33.4%44.5%
55.6%66.7%
0%10%20%30%40%50%60%70%80%90%
100%
2001
-200
2
2002
-200
3
2003
-200
4
2004
-200
5
2005
-200
6
2006
-200
7
2007
-200
8
2008
-200
9
2009
-201
0
2010
-201
1
2011
-201
2
2012
-201
3
2013
-201
4
Annual Measurable Objectives (AMOs)Percent Proficient ELA
High Schools and High School Districts
0
5
10
15
20
25
30
35
40
45
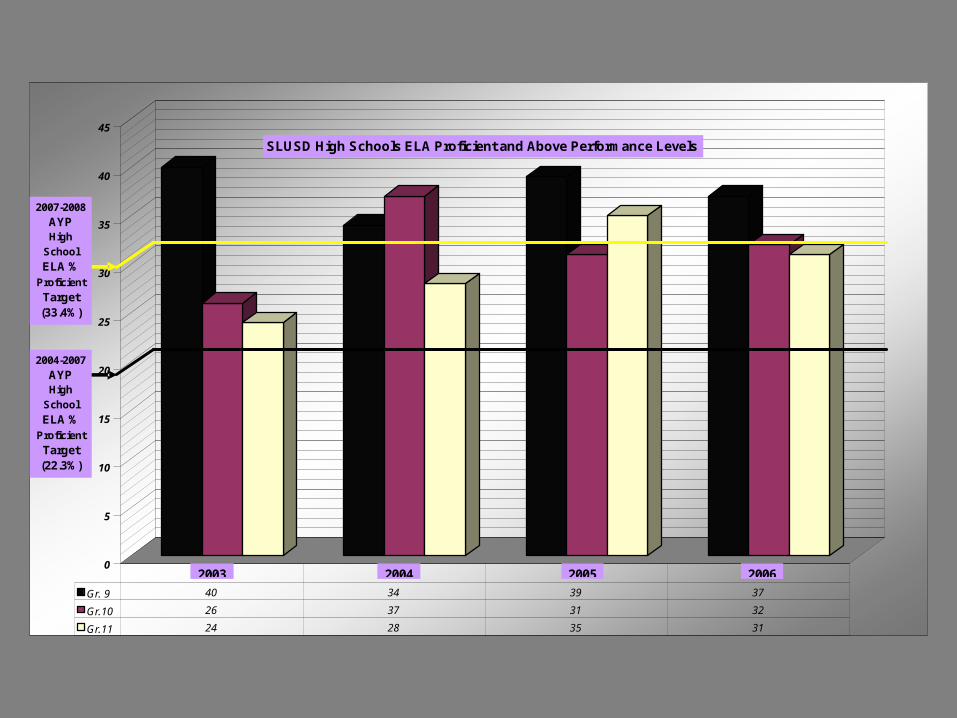
Gr. 9 40 34 39 37
Gr.10 26 37 31 32
Gr.11 24 28 35 31
1 2 3 42003 2004 2005 2006
SLUSD High Schools ELA Proficient and Above Performance Levels
2004-2007
AYPHigh
School
ELA % Proficient
Target(22.3%)
2007-2008
AYPHigh
School
ELA % Proficient
Target(33.4%)
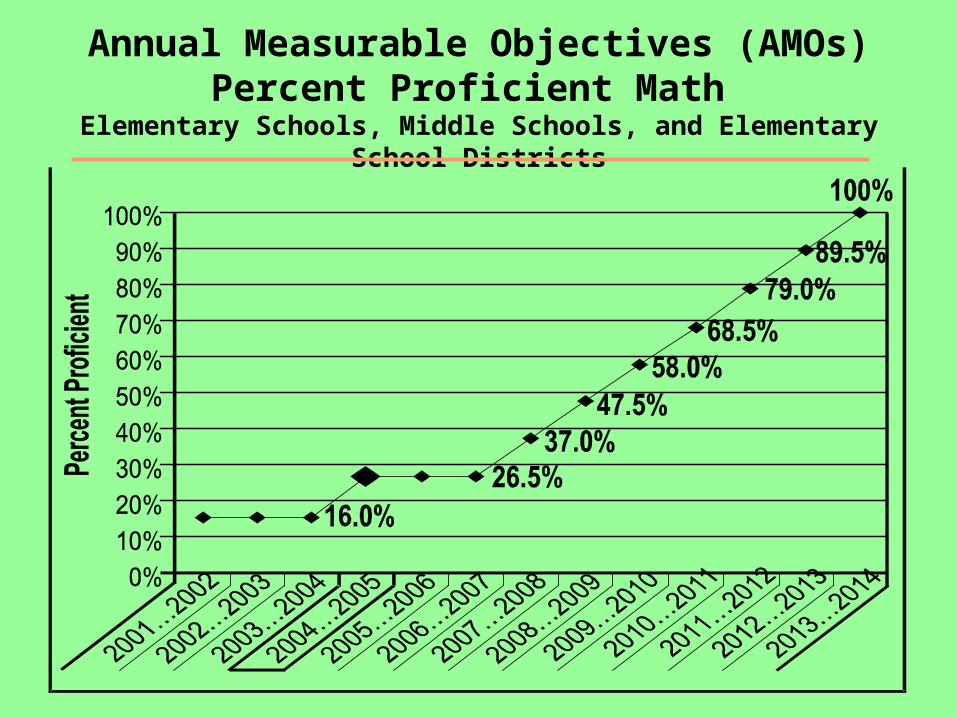
Annual Measurable Objectives (AMOs)Percent Proficient Math
Elementary Schools, Middle Schools, and Elementary School Districts
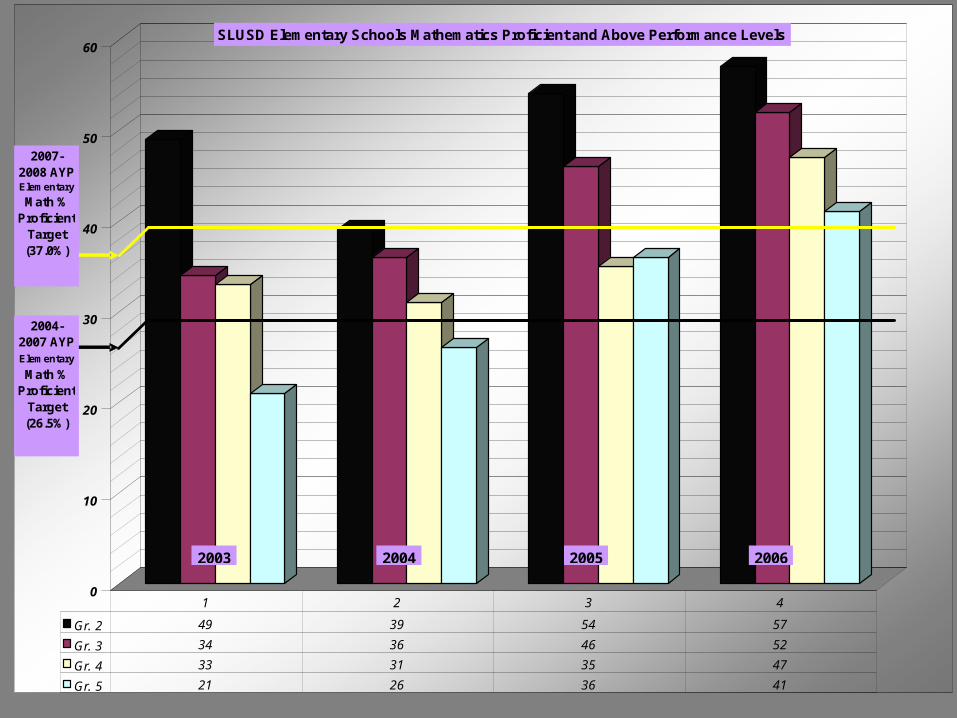
0
10
20
30
40
50
60
Gr. 2 49 39 54 57
Gr. 3 34 36 46 52
Gr. 4 33 31 35 47
Gr. 5 21 26 36 41
1 2 3 4
2003 2004 2005 2006
SLUSD Elementary Schools Mathematics Proficient and Above Performance Levels
2004-2007 AYPElementary
Math % Proficient
Target(26.5%)
2007-2008 AYPElementary
Math % Proficient
Target(37.0%)
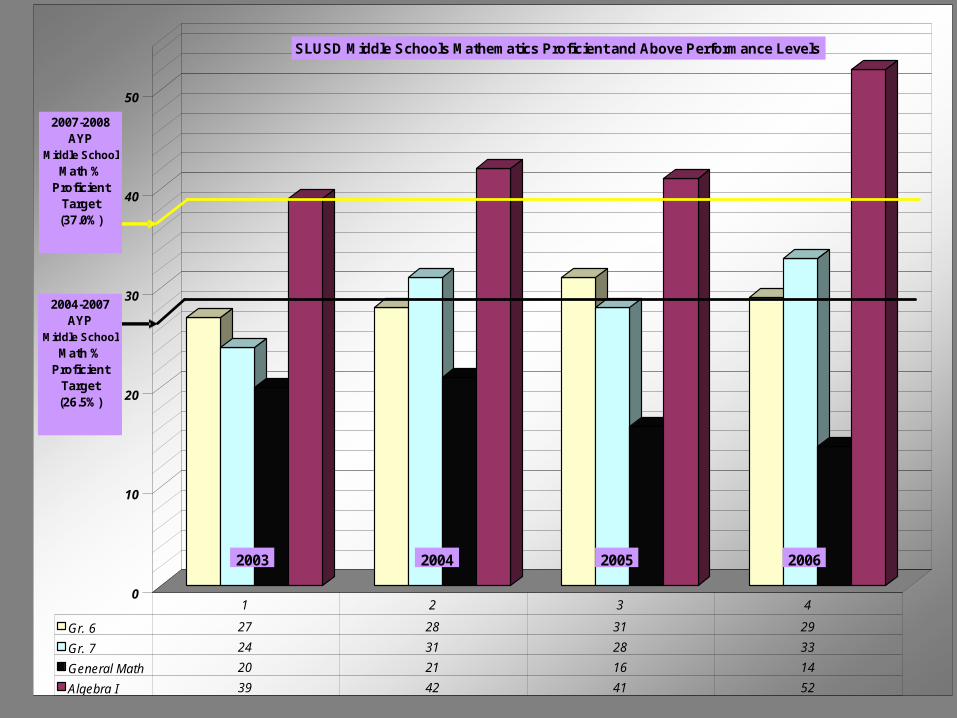
0
10
20
30
40
50
Gr. 6 27 28 31 29
Gr. 7 24 31 28 33
General Math 20 21 16 14
Algebra I 39 42 41 52
1 2 3 4
2003 2004 2005 2006
SLUSD Middle Schools Mathematics Proficient and Above Performance Levels
2004-2007 AYP
Middle School
Math % Proficient
Target(26.5%)
2007-2008 AYP
Middle School
Math % Proficient
Target(37.0%)
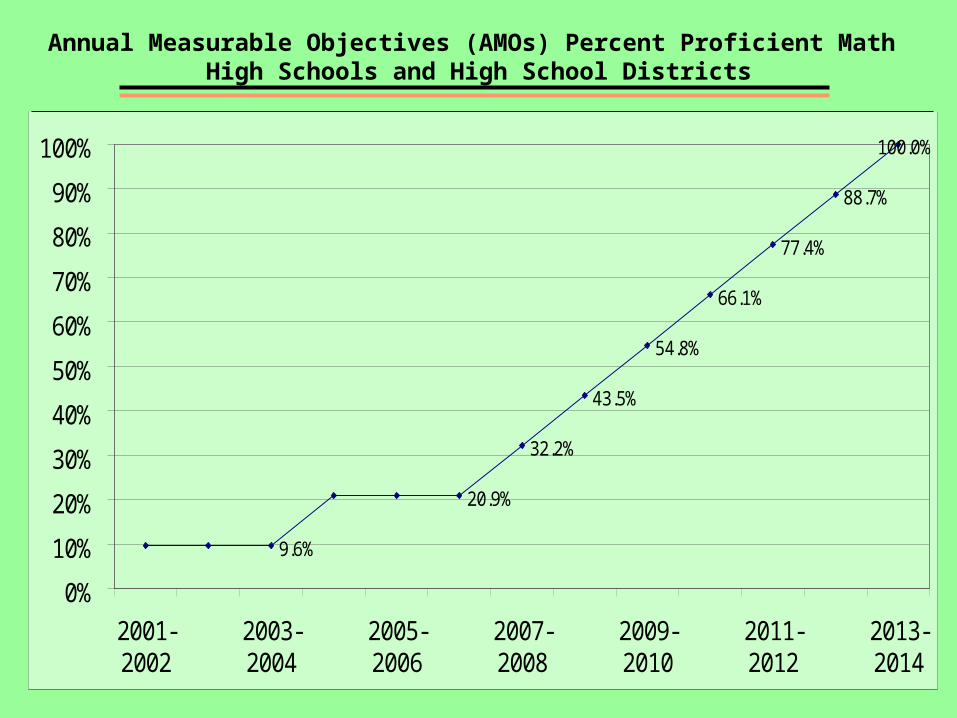
9.6%
20.9%
32.2%
43.5%
54.8%
66.1%
77.4%
88.7%
100.0%
0%
10%
20%
30%
40%
50%
60%
70%
80%
90%
100%
2001-2002
2003-2004
2005-2006
2007-2008
2009-2010
2011-2012
2013-2014
Annual Measurable Objectives for High Schools - Percent Proficient Math
Annual Measurable Objectives (AMOs) Percent Proficient Math High Schools and High School Districts
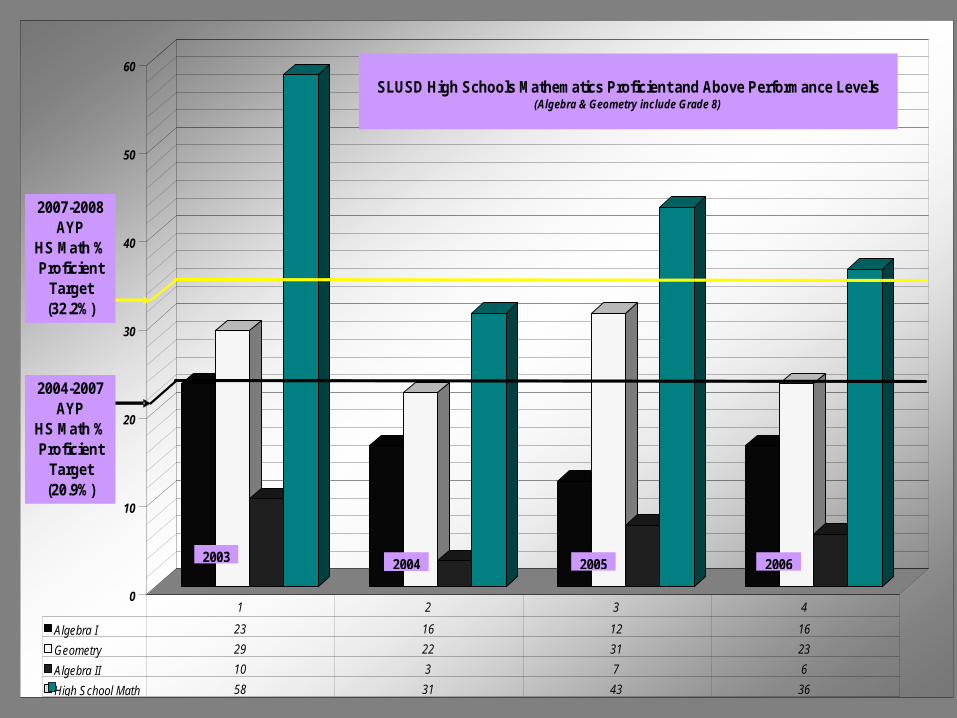
0
10
20
30
40
50
60
Algebra I 23 16 12 16
Geometry 29 22 31 23
Algebra II 10 3 7 6
High School Math 58 31 43 36
1 2 3 4
2004-2007 AYP
HS Math % Proficient
Target (20.9%)
2003 2004 2005 2006
SLUSD High Schools Mathematics Proficient and Above Performance Levels(Algebra & Geometry include Grade 8)
2007-2008 AYP
HS Math % Proficient
Target (32.2%)
Annual Measurable Achievement Objectives
(AMAOs)
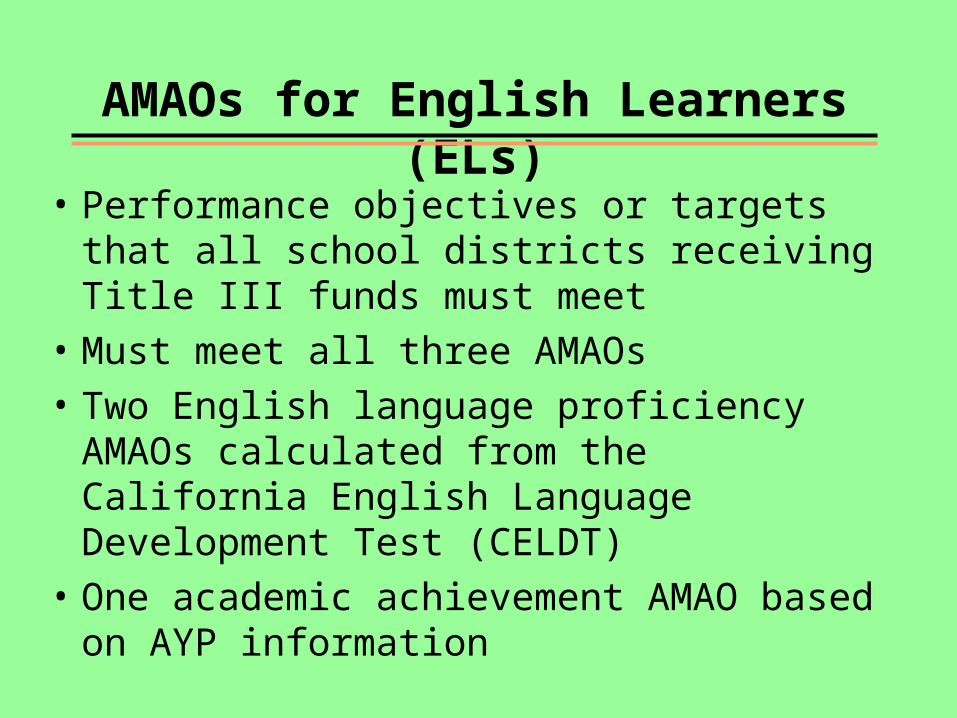
AMAOs for English Learners (ELs)
• Performance objectives or targets that all school districts receiving Title III funds must meet
• Must meet all three AMAOs
• Two English language proficiency AMAOs calculated from the California English Language Development Test (CELDT)
• One academic achievement AMAO based on AYP information
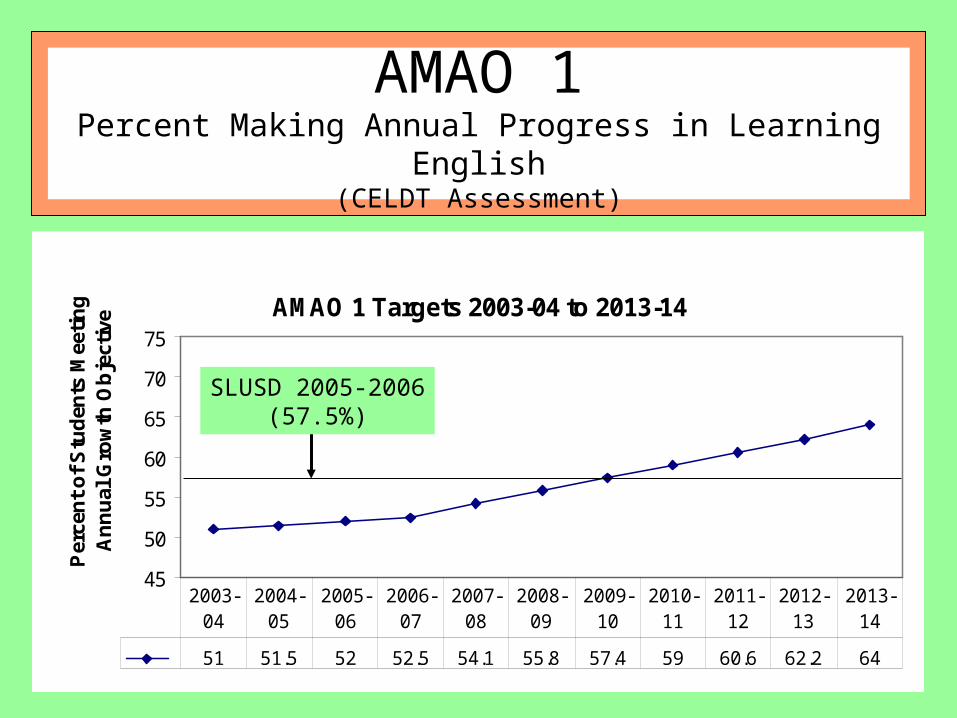
AMAO 1Percent Making Annual Progress in Learning English
(CELDT Assessment)
Figure 2
AMAO 1 Targets 2003-04 to 2013-14
45
50
55
60
65
70
75
Per
cen
t o
f S
tud
ents
Mee
tin
g
An
nu
al G
row
th O
bje
ctiv
e
51 51.5 52 52.5 54.1 55.8 57.4 59 60.6 62.2 64
2003-04
2004-05
2005-06
2006-07
2007-08
2008-09
2009-10
2010-11
2011-12
2012-13
2013-14
SLUSD 2005-2006(57.5%)
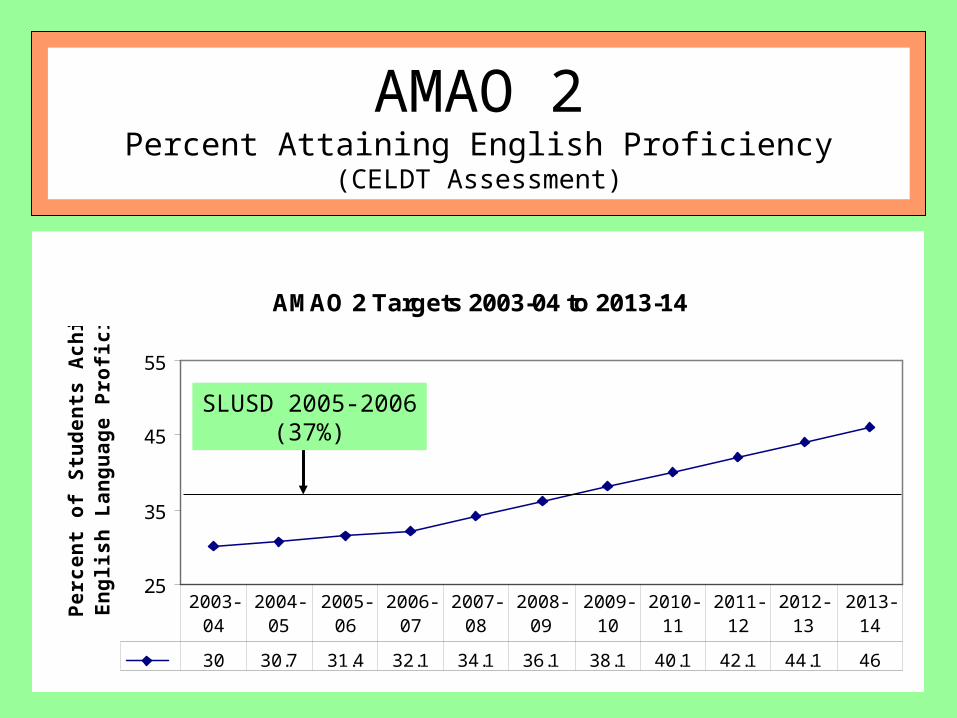
Figure 3
AMAO 2 Targets 2003-04 to 2013-14
25
35
45
55
Per
cen
t o
f S
tud
ents
Ach
ievin
g
En
gli
sh L
ang
uag
e P
rofi
cie
ncy
30 30.7 31.4 32.1 34.1 36.1 38.1 40.1 42.1 44.1 46
2003-04
2004-05
2005-06
2006-07
2007-08
2008-09
2009-10
2010-11
2011-12
2012-13
2013-14
AMAO 2Percent Attaining English Proficiency
(CELDT Assessment)
SLUSD 2005-2006(37%)
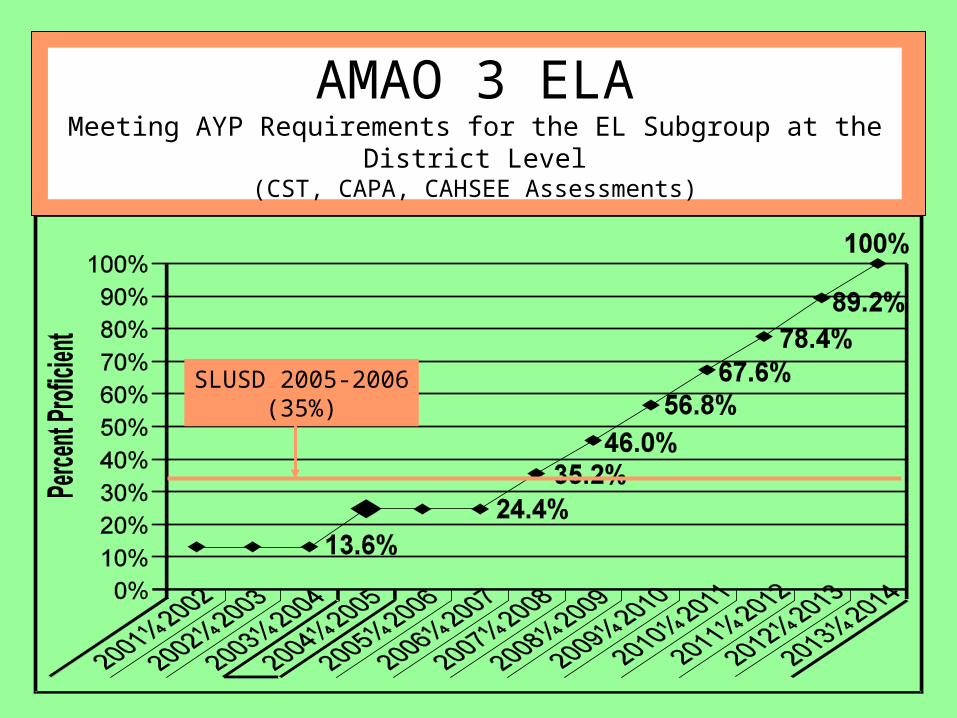
AMAO 3 ELAMeeting AYP Requirements for the EL Subgroup at the District Level
(CST, CAPA, CAHSEE Assessments)
SLUSD 2005-2006(35%)
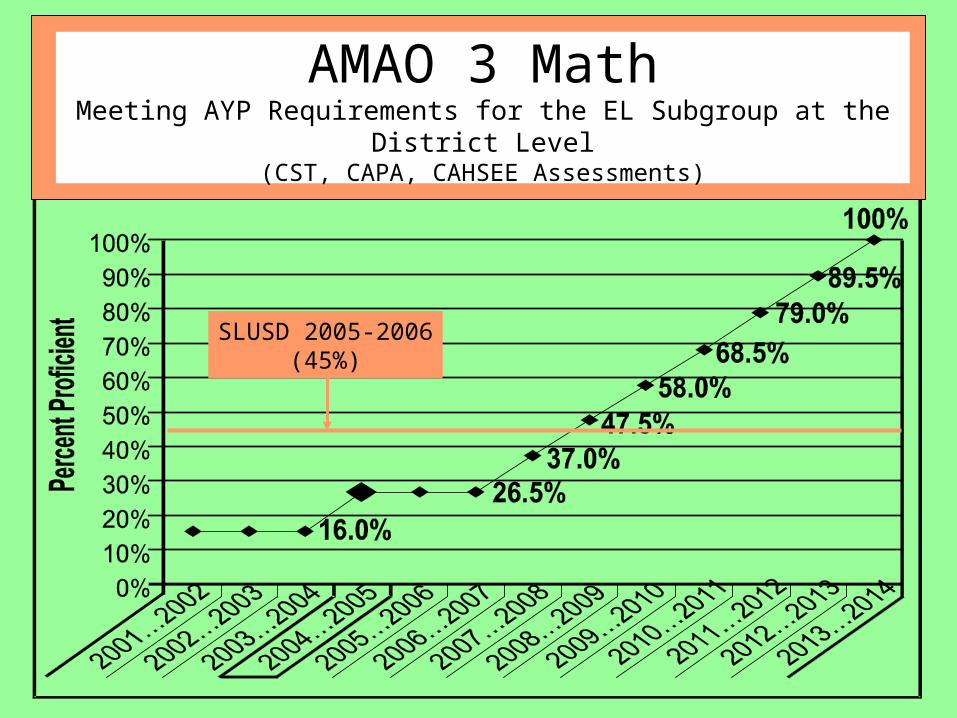
AMAO 3 MathMeeting AYP Requirements for the EL Subgroup at the District Level
(CST, CAPA, CAHSEE Assessments)
SLUSD 2005-2006(45%)
Program Improvement(PI)
• Applies only to schools and school districts that receive federal Title I funds
• Status assigned only if AYP targets were not met for 2 consecutive years within specific areas
• Must implement additional federal requirements• Exiting PI status requires meeting AYP for 2
consecutive years
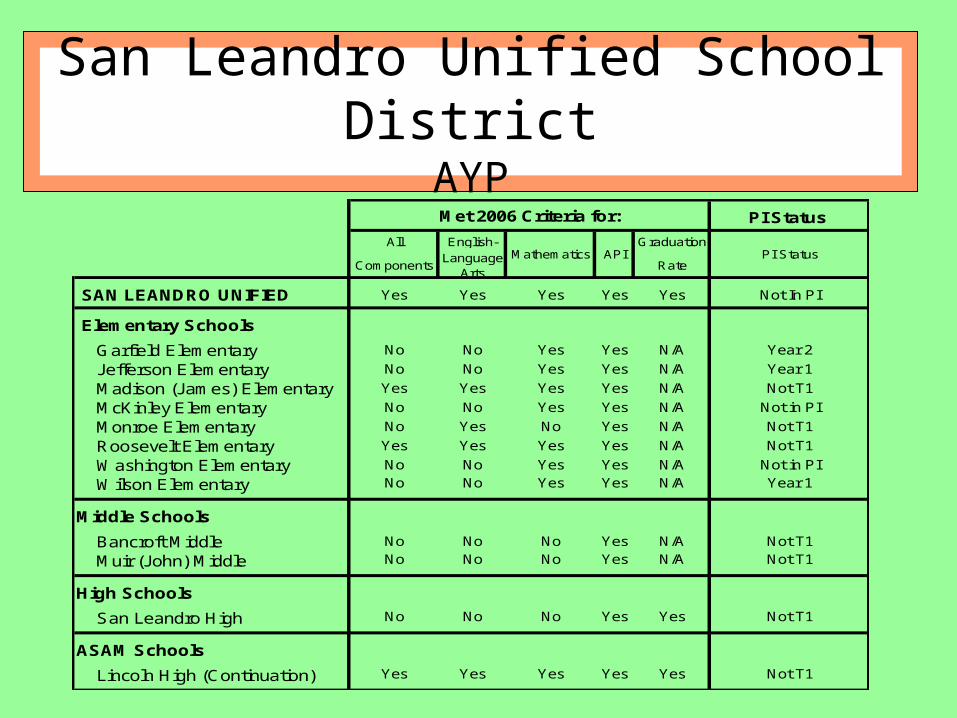
San Leandro Unified School DistrictAYP
PI Status
All English- Graduation
Components Language
ArtsRate
SAN LEANDRO UNIFIED Yes Yes Yes Yes Yes Not In PI
Elementary Schools
Garfield Elementary No No Yes Yes N/A Year 2
Jefferson Elementary No No Yes Yes N/A Year 1
Madison (James) Elementary Yes Yes Yes Yes N/A Not T1
McKinley Elementary No No Yes Yes N/A Not in PI
Monroe Elementary No Yes No Yes N/A Not T1
Roosevelt Elementary Yes Yes Yes Yes N/A Not T1
Washington Elementary No No Yes Yes N/A Not in PI
Wilson Elementary No No Yes Yes N/A Year 1
Middle Schools
Bancroft Middle No No No Yes N/A Not T1
Muir (John) Middle No No No Yes N/A Not T1
High Schools
San Leandro High No No No Yes Yes Not T1
ASAM Schools
Lincoln High (Continuation) Yes Yes Yes Yes Yes Not T1
PI Status
Met 2006 Criteria for:
Mathematics API

California High School Exit Exam(CAHSEE)
California High School Exit Examination (CAHSEE)
• Aims to significantly improve pupil achievement in public high schools
• Ensures that pupils who graduate from public high schools can demonstrate grade level competency in reading, writing, and mathematics
• Helps identify students who are not developing skills that are essential for life after high school
• Encourages districts to give these students the attention and resources needed to help them achieve these skills during their high school years
• Is used in determining AYP (participation rate – grade 10 and graduation rate)
0.00%
20.00%
40.00%
60.00%
80.00%
100.00%
Perc
ent o
f Sen
iors
Pas
sing
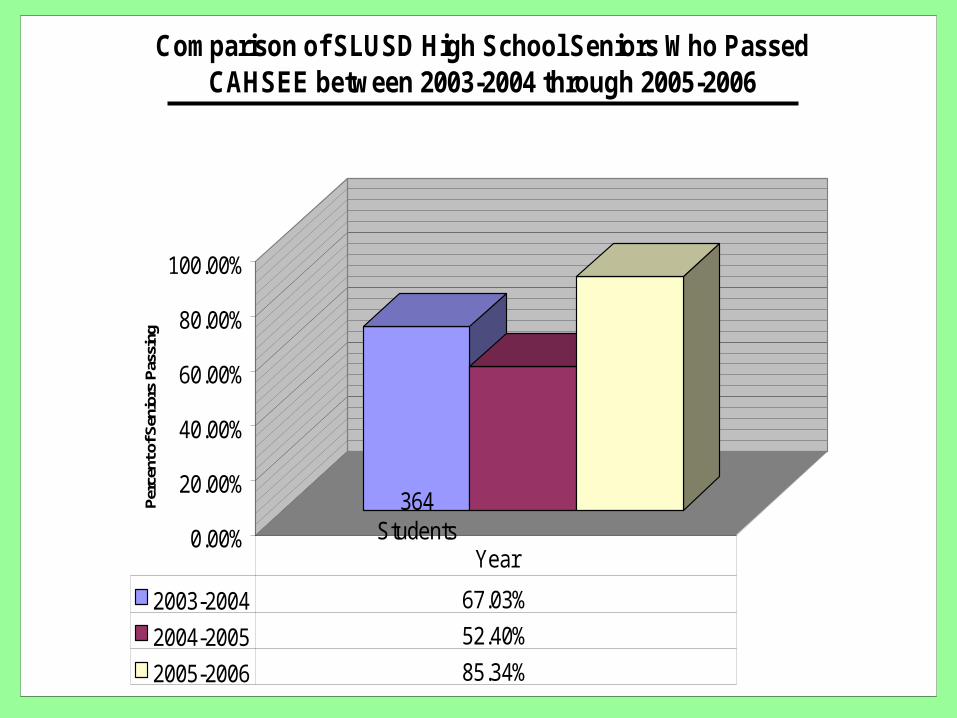
Comparison of SLUSD High School Seniors Who Passed CAHSEE between 2003-2004 through 2005-2006
2003-2004 67.03%
2004-2005 52.40%
2005-2006 85.34%
Year
364 Students
306 Students
483 Students
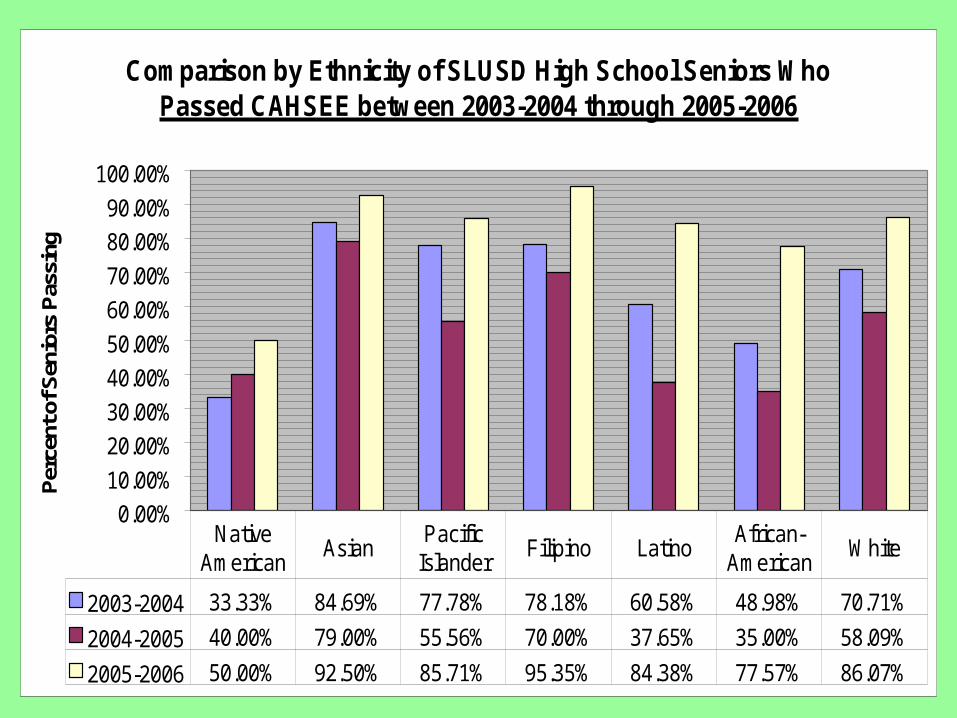
Comparison by Ethnicity of SLUSD High School Seniors Who Passed CAHSEE between 2003-2004 through 2005-2006
0.00%
10.00%
20.00%
30.00%
40.00%
50.00%
60.00%
70.00%
80.00%
90.00%
100.00%
Per
cent
of S
enio
rs P
assi
ng
2003-2004 33.33% 84.69% 77.78% 78.18% 60.58% 48.98% 70.71%
2004-2005 40.00% 79.00% 55.56% 70.00% 37.65% 35.00% 58.09%
2005-2006 50.00% 92.50% 85.71% 95.35% 84.38% 77.57% 86.07%
Native American
AsianPacific
IslanderFilipino Latino
African-American
White
Student Suspensions & Expulsions
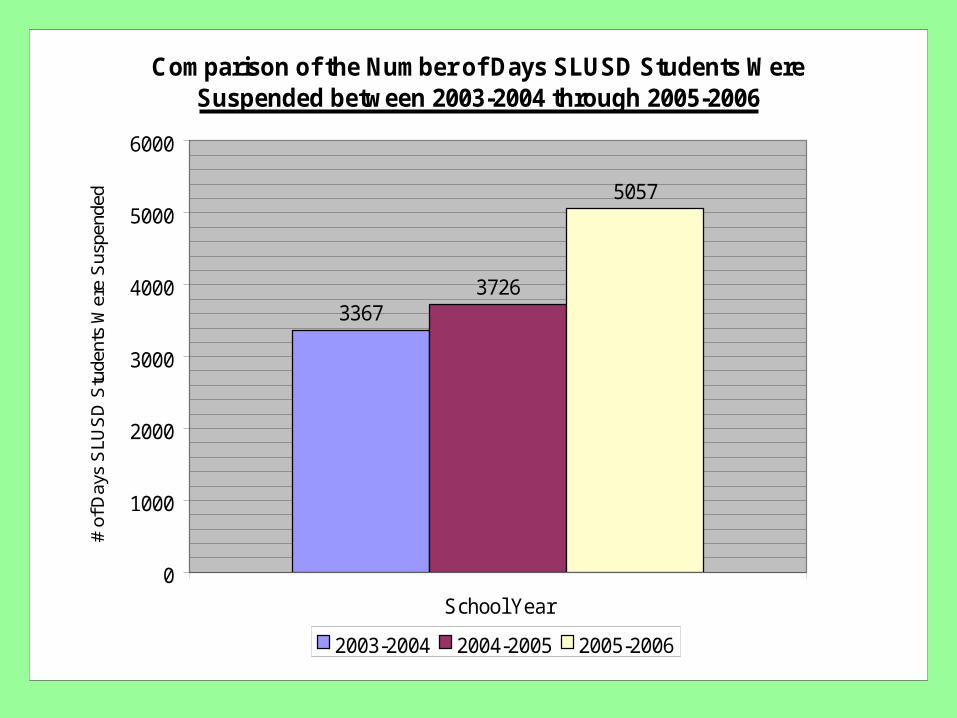
Comparison of the Number of Days SLUSD Students Were Suspended between 2003-2004 through 2005-2006
33673726
5057
0
1000
2000
3000
4000
5000
6000
School Year
# of
Day
s S
LUS
D S
tude
nts
Wer
e S
uspe
nded
2003-2004 2004-2005 2005-2006
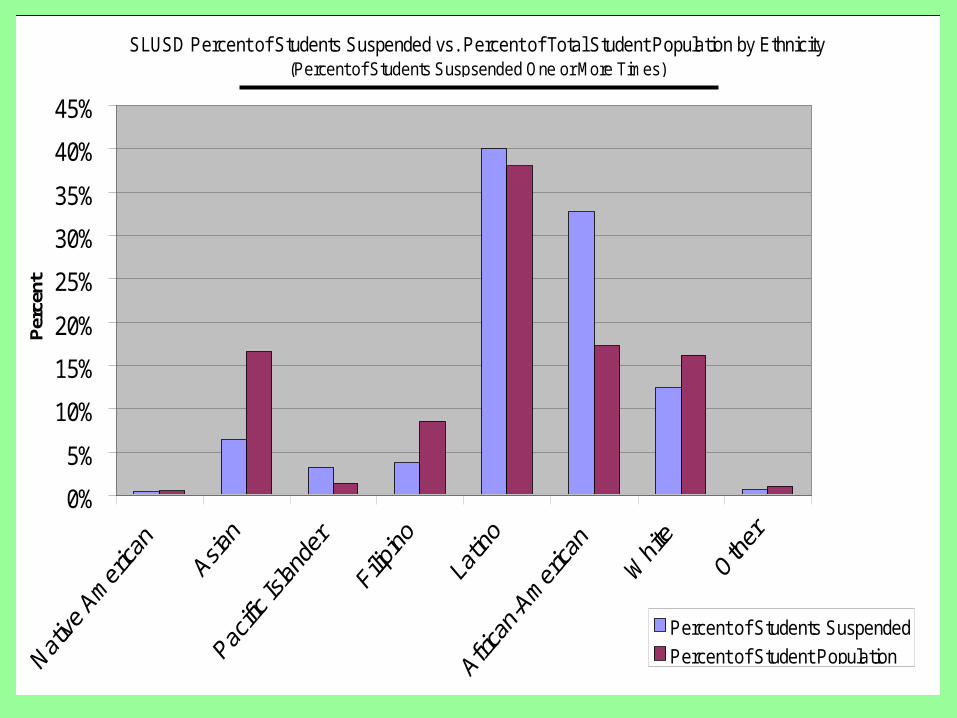
Percent of Students Suspended One or More Times vs. Percent of Student Population by Ethnicity for
the District and for Each School During the 2005-2006 School Year
Note: Schools not depicted had no suspensions
0%
5%
10%
15%
20%
25%
30%
35%
40%
45%
Per
cent
Percent of Students Suspended
Percent of Student Population
SLUSD Percent of Students Suspended vs. Percent of Total Student Population by Ethnicity(Percent of Students Suspsended One or More Times)
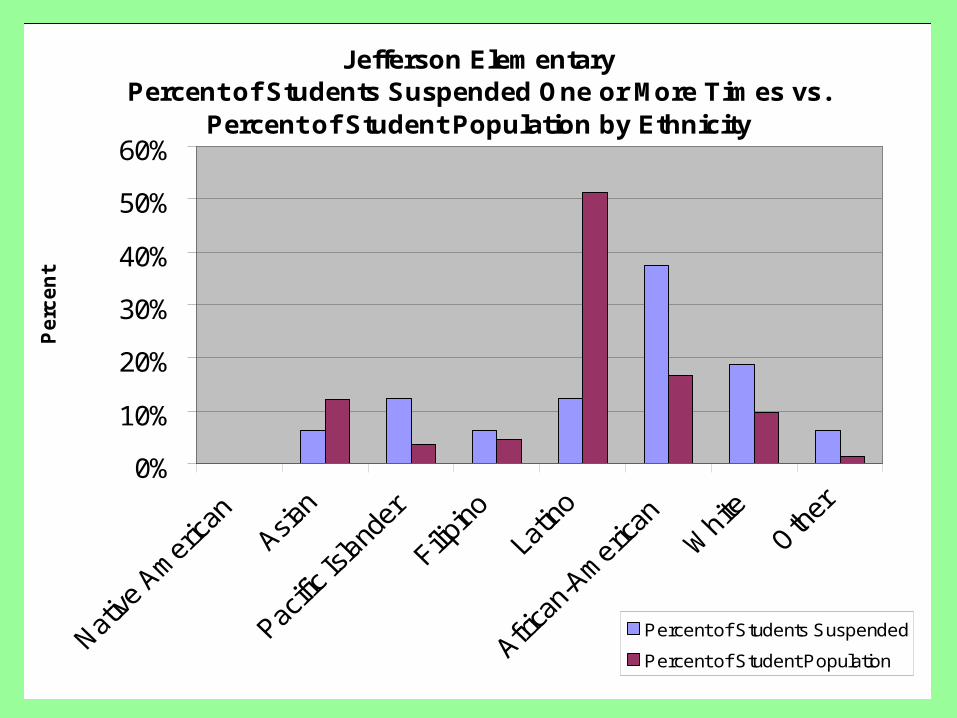
Jefferson ElementaryPercent of Students Suspended One or More Times vs.
Percent of Student Population by Ethnicity
0%
10%
20%
30%
40%
50%
60%
Pe
rce
nt
Percent of Students Suspended
Percent of Student Population
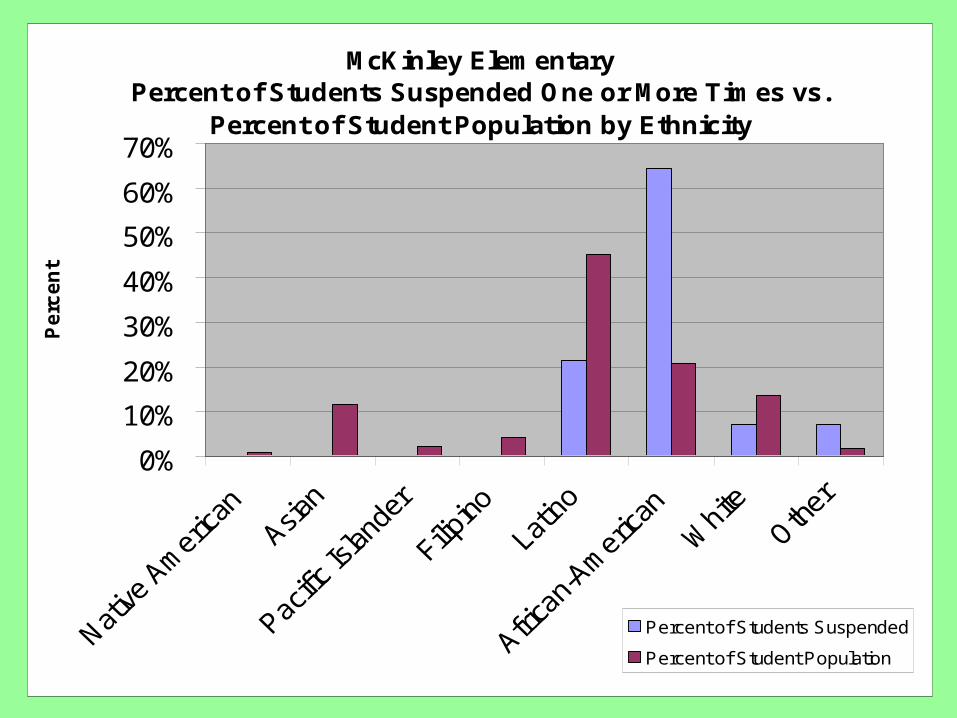
McKinley ElementaryPercent of Students Suspended One or More Times vs.
Percent of Student Population by Ethnicity
0%
10%
20%
30%
40%
50%
60%
70%
Pe
rce
nt
Percent of Students Suspended
Percent of Student Population
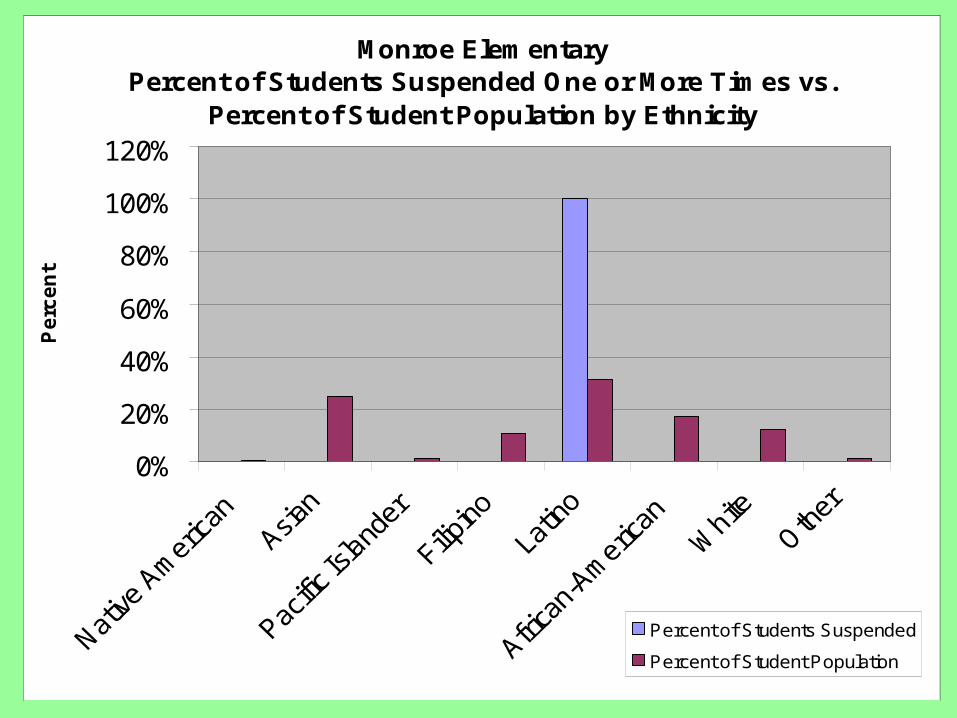
Monroe ElementaryPercent of Students Suspended One or More Times vs.
Percent of Student Population by Ethnicity
0%
20%
40%
60%
80%
100%
120%
Pe
rce
nt
Percent of Students Suspended
Percent of Student Population
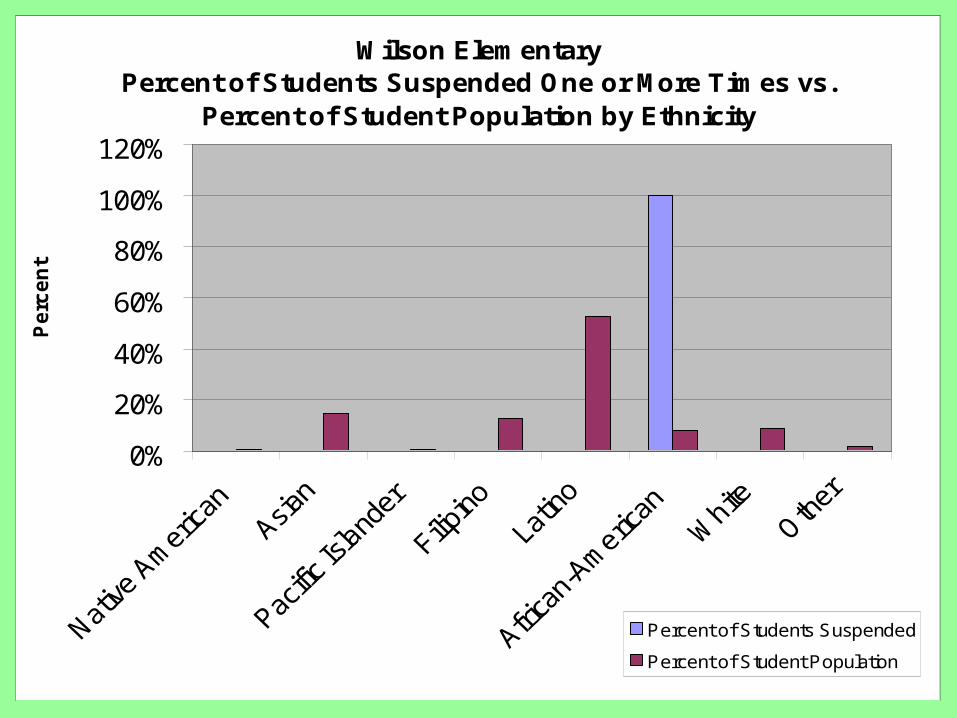
Wilson ElementaryPercent of Students Suspended One or More Times vs.
Percent of Student Population by Ethnicity
0%
20%
40%
60%
80%
100%
120%
Pe
rce
nt
Percent of Students Suspended
Percent of Student Population
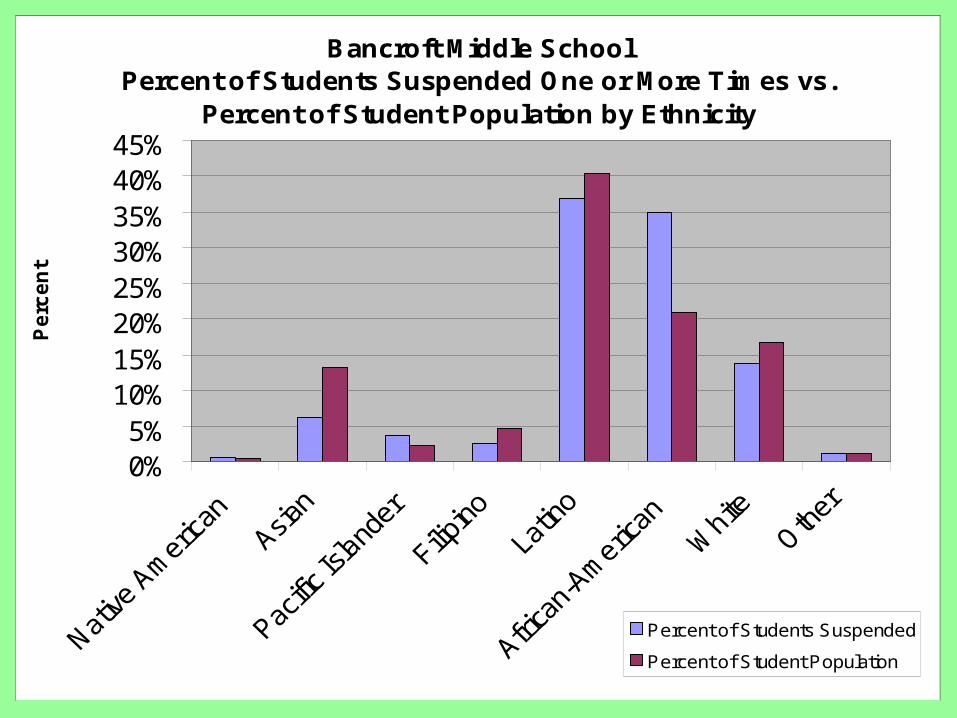
Bancroft Middle SchoolPercent of Students Suspended One or More Times vs.
Percent of Student Population by Ethnicity
0%5%
10%15%20%25%30%35%40%45%
Pe
rce
nt
Percent of Students Suspended
Percent of Student Population
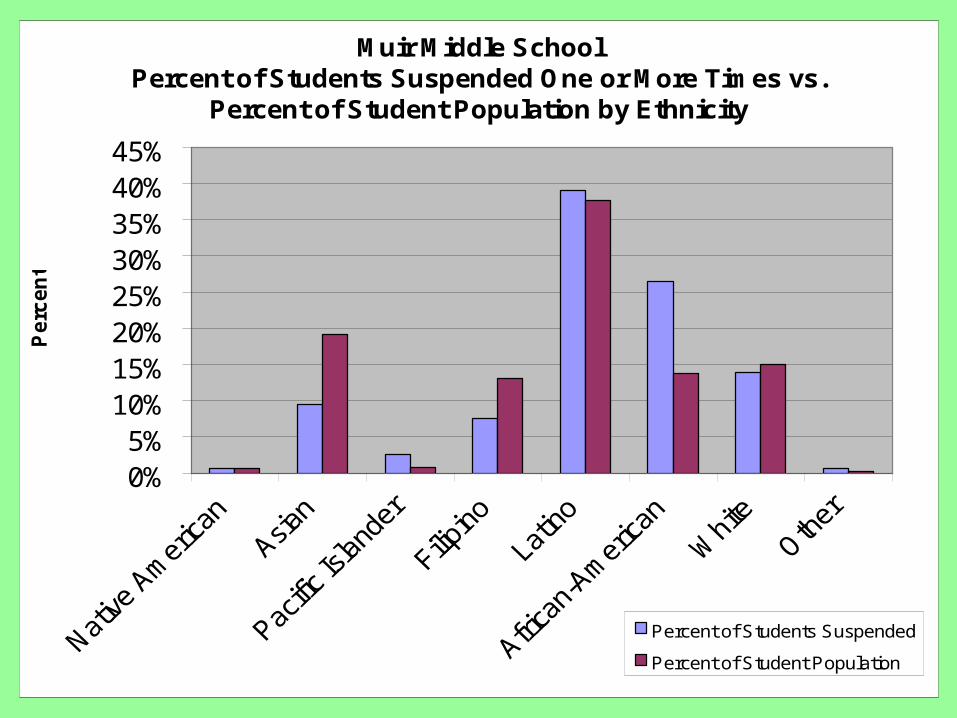
Muir Middle SchoolPercent of Students Suspended One or More Times vs.
Percent of Student Population by Ethnicity
0%5%
10%15%20%25%30%35%40%45%
Pe
rce
nt
Percent of Students Suspended
Percent of Student Population
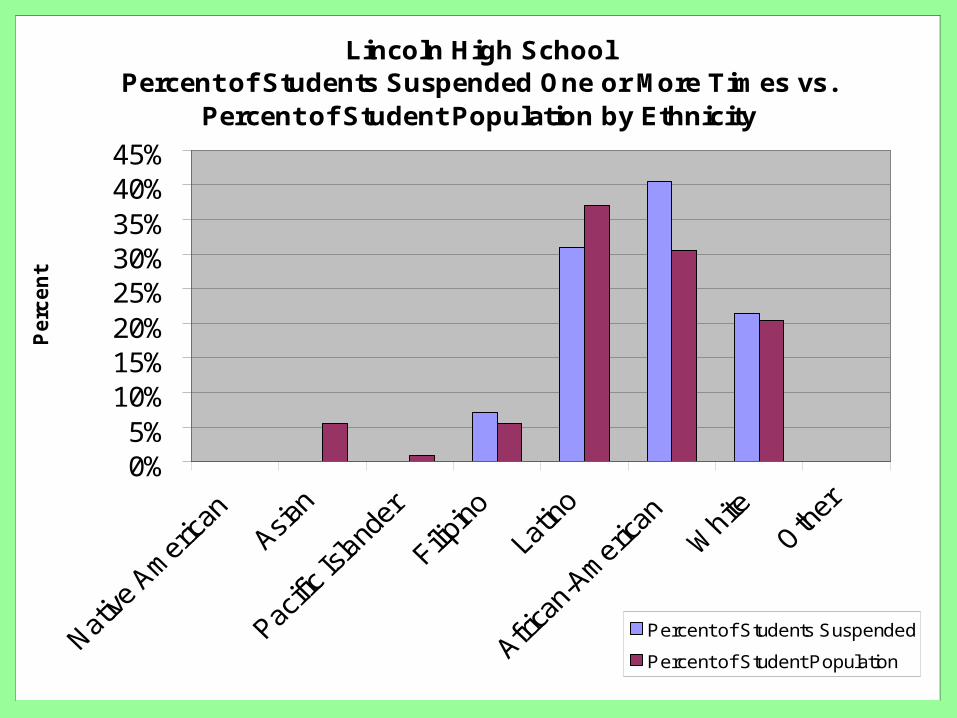
Lincoln High SchoolPercent of Students Suspended One or More Times vs.
Percent of Student Population by Ethnicity
0%5%
10%15%20%25%30%35%40%45%
Pe
rce
nt
Percent of Students Suspended
Percent of Student Population
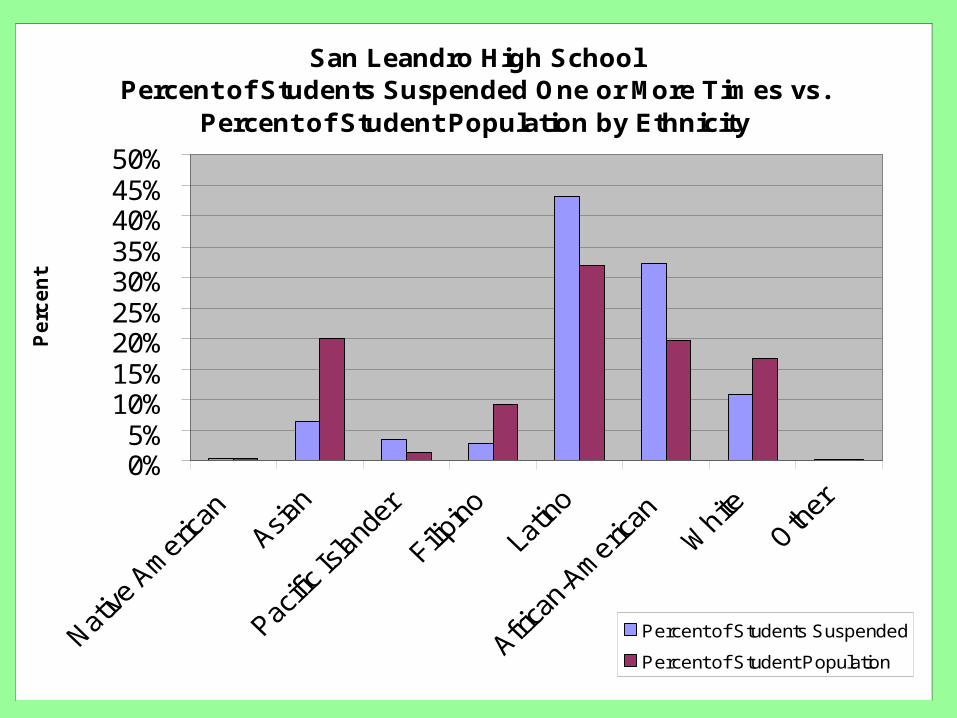
San Leandro High SchoolPercent of Students Suspended One or More Times vs.
Percent of Student Population by Ethnicity
0%5%
10%15%20%25%30%35%40%45%50%
Pe
rce
nt
Percent of Students Suspended
Percent of Student Population
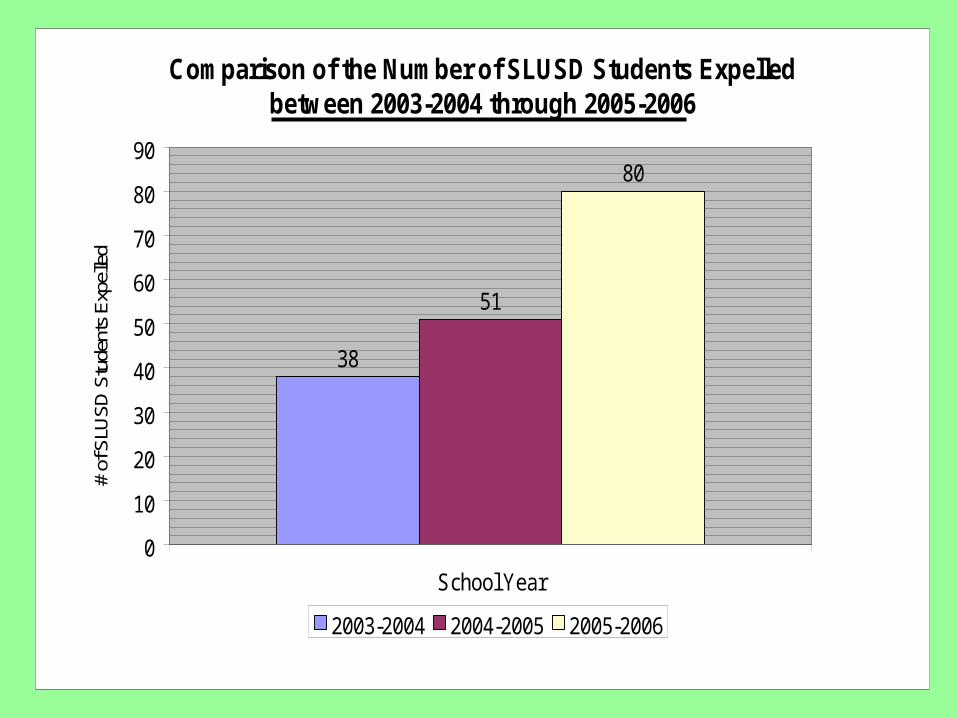
Comparison of the Number of SLUSD Students Expelled between 2003-2004 through 2005-2006
38
51
80
0
10
20
30
40
50
60
70
80
90
School Year
# of
SLU
SD S
tude
nts
Expe
lled
2003-2004 2004-2005 2005-2006
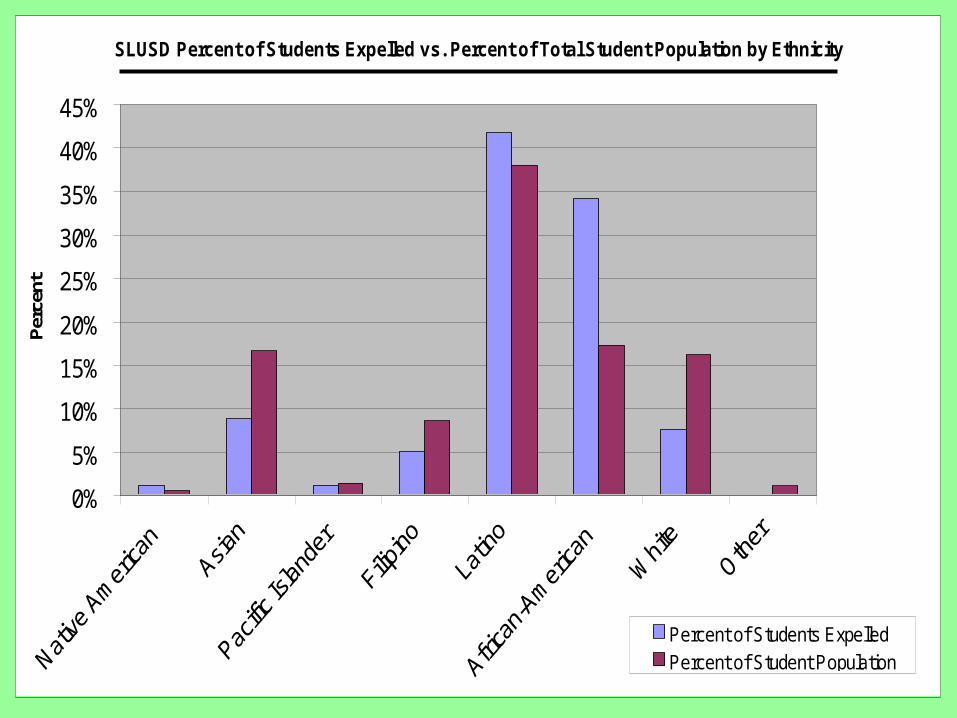
SLUSD Percent of Students Expelled vs. Percent of Total Student Population by Ethnicity
0%
5%
10%
15%
20%
25%
30%
35%
40%
45%
Per
cent
Percent of Students ExpelledPercent of Student Population

The End