Embed Size (px)
Citation preview

SANSAND20UnlimitePrinted D
SoftMomPlan John L.
Prepared bySandia NatioAlbuquerque Sandia Natioowned subsAdministratio Approved fo
D REP010-8703 ed Release December
t X-raymentumnetary
Remo, Mic
y onal Laboratoriese New Mexico 87
onal Laboratoriessidiary of Lockheeon under contrac
or public release;
PORT
2010
y Shocm CouMate
chael D. Fur
s 7185 and Liverm
s is a multi-progred Martin Corporct DE-AC04-94A
further dissemin
ck Loauplingrials
rnish, and R
more, California, 9
ram laboratory mration, for the U.S
AL85000.
nation is unlimite
1
ading g in Me
R. Jeffery L
94550
managed and opeS. Department o
d.
and eteori
Lawrence
erated by Sandiaof Energy’s Natio
te and
a Corporation, a wnal Nuclear Secu
d
wholly urity

2
Issued by Sandia National Laboratories, operated for the United States Department of Energy by Sandia Corporation.
NOTICE: This report was prepared as an account of work sponsored by an agency of the United States Government. Neither the United States Government, nor any agency thereof, nor any of their employees, nor any of their contractors, subcontractors, or their employees, make any warranty, express or implied, or assume any legal liability or responsibility for the accuracy, completeness, or usefulness of any information, apparatus, product, or process disclosed, or represent that its use would not infringe privately owned rights. Reference herein to any specific commercial product, process, or service by trade name, trademark, manufacturer, or otherwise, does not necessarily constitute or imply its endorsement, recommendation, or favoring by the United States Government, any agency thereof, or any of their contractors or subcontractors. The views and opinions expressed herein do not necessarily state or reflect those of the United States Government, any agency thereof, or any of their contractors. Printed in the United States of America. This report has been reproduced directly from the best available copy. Available to DOE and DOE contractors from
U.S. Department of Energy Office of Scientific and Technical Information P.O. Box 62 Oak Ridge, TN 37831 Telephone: (865)576-8401 Facsimile: (865)576-5728 E-Mail: [email protected] Online ordering: http://www.doe.gov/bridge
Available to the public from
U.S. Department of Commerce National Technical Information Service 5285 Port Royal Rd Springfield, VA 22161 Telephone: (800)553-6847 Facsimile: (703)605-6900 E-Mail: [email protected] Online order: http://www.ntis.gov/ordering.htm

3
SAND2010-8703 Unlimited Release Printed December 2010
Soft X-ray Shock Loading and Momentum
Coupling in Meteorite and Planetary Materials
John L. Remo
Dept. of Astronomy, Dept. of Earth and Planetary Sciences, Harvard University, Cambridge, MA, and Harvard-Smithsonian Center for Astrophysics, 60 Garden St.
Mail Stop 16, Cambridge, MA 02138
Michael D. Furnish Solid Dynamics and Energetic Materials Department
R. Jeffery Lawrence
Lethality and Threat Department
Sandia National Laboratories P.O. Box 5800
Albuquerque NM 87185-1195
Abstract
Abstract: X-ray momentum coupling coefficients, CM, were determined by measuring stress waveforms in planetary materials subjected to impulsive radiation loading from the Sandia National Laboratories Z-machine. Results from the velocity interferometry (VISAR) diagnostic provided limited equation-of-state data as well. Targets were iron and stone meteorites, magnesium rich olivine (dunite) solid and powder (~5 – 300 µm), and Si, Al, and Fe calibration targets. All samples were ~1 mm thick and, except for Si, backed by LiF single-crystal windows. The x-ray spectrum included a combination of thermal radiation (blackbody 170 – 237 eV) and line emissions from the pinch material (Cu, Ni, Al, or stainless steel). Target fluences 0.4 – 1.7 kJ/cm2 at intensities 43 – 260 GW/cm2 produced front surface plasma pressures 2.6 – 12.4 GPa. Stress waves driven into the samples were attenuating due to the short (~5 ns) duration of the drive pulse. Attenuating wave impulse is constant allowing accurate CM measurements provided mechanical impedance mismatch between samples and the window are known. Impedance-corrected CM determined from rear-surface motion was 1.9 – 3.1 x 10⁻⁵ s/m for stony meteorites, 2.7 and 0.5 x 10⁻⁵ s/m for solid and powdered dunite, 0.8–1.4 x 10⁻⁵

4
s/m for iron meteorites, and 0.3, 1.8, and 2.7 x 10⁻⁵ s/m respectively for Si, Fe, and Al calibration targets. CTH hydrocode modeling of x-ray coupling to porous silica supported experimental measurements and extrapolations to other materials; CTH-modeled CM for porous materials was low, consistent with experimental results. Modeling of radiation coupling to selected target materials with analytic models for x-ray radiation-induced momentum coupling (BBAY) was also performed, and often produced higher CM values than the experimental results. Reasons for this are discussed and include turbulent mixing of heterogeneous phases, variances in heats of melt/vaporization, sample inhomogeneities, wave interactions at the sample/window boundary, and finite sample/window sizes. The measurements validate application of CM to (inhomogeneous) planetary materials from high intensity x-ray radiation.
5
Acknowledgments We thank R. G. Adams for his assistance in carrying out the dunite shot and J. L.
Porter for his hospitality at SNL. C. Coverdale and B. Jones welcomed these measurements as ride-along shots with their experiments on the Z facility. We thank M. I. Petaev for providing chemical abundances of the meteorite targets. Peter Hammerling provided a very helpful review. JLR was supported by the National Nuclear Security Administration under the Stewardship Science Academic Affairs Program through Department of Energy (DOE) grants #DE-FG52-66NA26215, #FG52-09NA29549, and under the High Energy Density Laboratory Plasmas program through DOE grant #FG52-09NA29457 with Harvard University. This research is solely the authors’ views and may not represent views of the DOE, Harvard University, or SNL. Sandia National Laboratories is a multi-program laboratory operated by Sandia Corporation, a wholly owned subsidiary of Lockheed Martin Company, for the U.S. Department of Energy's National Nuclear Security Administration under contract DE-AC04-94AL85000.

6

7
Table of Contents 1 Introduction ...........................................................................................................9 2 X-ray radiation source, absorption and momentum coupling coefficients CM ....10 3 Experimental Configuration ................................................................................11 4 Synthetic problem: Radiation incident on silica ...................................................13 5 Sample descriptions and loading states ................................................................16 6 Impedance matching corrections for CM ..............................................................18 7 Observed waveforms and derived momentum coupling ......................................20 8 Analytic impulse models (MBBAY calculations) ................................................25 9 X-ray spectra and blowoff impulse ......................................................................26 10 X-ray deposition code ..........................................................................................28 11 Impulse measurements .........................................................................................31 12 Discussion ............................................................................................................32 13 Conclusions ..........................................................................................................33 14 Future Research ...................................................................................................35 Appendix 1. Detailed petrographic descriptions of samples. ........................................35 Appendix 2. Brief explanation of front-surface spall and non-blowoff momentum .....37 References .................................................................................................................38 Distribution .................................................................................................................40
Figures 1 Experimental configuration ................................................................................12 2 Z-pinch radiation characteristics .........................................................................12 3 Calculations with CTH of pressure pulse (axial stress) from an X-ray energy deposition of 0.8 kJ/cm2 in 10 ns to a 4-mm thickness of material ...................14 4 Impulse imposed at various depths within the sample ........................................14 5 Calcs with CTH of material velocity histories for the problem of Fig. 3 ...........15 6 Comparison of loading wave in Fig. 3 problem with similar problem where energy is deposited to a 20 mm thickness of material ........................................16 7 CTH simulation of quartz momentum uptake ....................................................17 8 Correction to CM required by the use of a window such as LiF .........................19 9 Experimental result for momentum uptake in 1100 Al and chondrite ................21 10 Experimental results for momentum uptake in Armco iron and an octahedrite sample ...................................................................................21 11 Experimental results for momentum uptake in dunite ((Mg0.9Fe0.1)2SiO4), both monolithic and powdered/compressed .......................22 12 Experimental results for momentum uptake in an octahedrite, a chondrite, and a mesosiderite, and a refractory chondrite ............................................................23 13 Experimental results for momentum uptake in polycrystalline silicon ..............24 14 Source spectra for copper wire array ..................................................................27 15 Energy deposition in Allende due to copper wire-array spectrum .....................29

8
16 MBBAY model calculations for impulse versus fluence ...................................30 17 Impulse coupling coefficient as predicted by the MBBAY model for a copper-wire-array spectrum incident on Allende ...............................................31
Tables 1 Z-pinch shot matrix and conditions ....................................................................13 2 Elemental compositions of the meteorite materials used in the present study ...17 3 Z-pinch Hugoniot parameters for rear surfaces of sample ..................................18 4 CM correction factors ψ for different samples with LiF windows .....................19 5 CM calculation from impulse integration ............................................................24 6 Radiation environment and impulse data for samples ........................................27 7 Properties of target materials ..............................................................................28
9
Soft X-ray Shock Loading and Momentum Coupling in Meteorite and Planetary
Materials
1.0 Introduction This is an extension of previous work1,2 describing high energy density (HED) experiments measuring soft X-ray coupling to a variety of materials on the Sandia National Laboratories (SNL) Z-pinch facility. Here, soft X-rays were produced with a spectrum peak ~12.5 Å. On-target radiation intensities varied from 43 – 260 GW/cm2, with total fluences ranging from 0.3 – 1.7 kJ/cm2. The primary objective was to use soft X-rays to determine net momentum generation, pressure wave propagation, and momentum coupling coefficients, CM, from mechanical responses to radiation on natural materials with astrophysical, planetary science, and near-Earth object (NEO) mitigation applications. Targets included calibration metals (Fe and Al) and natural materials (iron and stony meteorites, and dunite). The inhomogeneous nature of meteorite materials and dunite and their complex mechanical responses suggest more homogeneous calibration materials be included to establish a basis of comparison.
In addition, a set of CTH hydrocode simulations of X-ray drive irradiation on silicate materials of various porosities was conducted allowing comparison with experimental CM values and verification of the methodology for determining CM. This provided insight into wave attenuation processes characterizing decreases in peak stress amplitude with position strongly influenced by porosity. Transmitted impulse remained constant with position in the target. Finally, an analytical deposition model (MBBAY) was applied to clarify trends and systematic behavior in materials responses to X-rays. The present experiments were found to all lie at fluence levels well above those corresponding to the maximum values for CM, the ratio of momentum to energy.
A brief summary of the experimental phenomenology follows. Z pinch radiation at ~200 eV is formed by the collapse of a cylindrical wire array under the Lorentz forces produced by a ~20 MA current pulse. This soft X-ray pulse (containing thermal and line components) irradiates sample surfaces. Diagnostic instrumentation characterizes fluence, time structure, and spectral properties of the x-ray pulse. At sample surfaces energy is deposited producing melt, vapor and ejection materials that impulse the sample with a time duration ~3 – 8 ns, producing a sharply peaked stress wave propagating that attenuates and broadens as it propagates due to dissipative compression processes such as hysteretic stress/strain loading loops, pore collapse and phase transitions. Axial stress in the sample, σzz, varies over time and axial position z. Momentum coupled to the sample at a given position z is given by the stress integral,
σ∞ z, t dt (1)
The observable is a velocity history, v(t, z = interface), at the interface between the

10
sample and the LiF window. Converting this into σzz requires correcting for relative mechanical properties of the sample and the window (see Section 9) allowing momentum per area to be calculated via Eq. 1. Dividing this quantity by the integrated energy from the x-ray source gives CM, which varies with material, X-ray intensity, and wavelength.
2.0 X-ray radiation source, absorption and momentum coupling coefficients CM
The Z-pinch hohlraum source radiation emission is composed of soft black-body (BB) and emission line components. The BB spectrum corresponds to a temperature ~200 eV (~2,320,800 K) and (using the Wien displacement law or the Planck distribution) a peak radiation wavelength of ~12.5 Å. From energy = h c/ λ , (2) where h is Planck’s constant and c is the speed of light, this corresponds to 1 keV photon energy. When derived in photon energy space (cf. Fig. 14), the peak is ~0.6 keV. X-ray line emissions from the wire array material are somewhat harder (Ni: 8.3 keV, Al: 1.6 keV, Cu: 8.9 keV or steel: 6.4 keV).
For X-ray absorption at energies <0.1 MeV photoelectric cross-sections dominate and Rosseland mean opacities, μ, may be used. For radiation ~200 eV, μ ranges from 170 to 1,370 cm2/g. Taking an average target density, ρ, to be 3 g/cm3 the soft X-ray penetration (skin) depth, δ = 1/(μ ρ), varies from 2.4 – 20 μm. For 1 keV radiation from the peak of the 200 eV BB source, μ varies from 170 – 10,000 cm2/g, yielding a line penetration δ from 0.33 – 2.8 µm. Finally, the more energetic X-ray line emissions penetrate significantly deeper into targets than BB radiation continuum. The relationship to ejecta momentum (hence to CM) is complex. More energy is required to vaporize a larger amount of material within a greater penetration depth, leaving less energy for material motion (jetting). X-ray ablation drive compression pressure in the subsonic deflagration regime may be expressed in the low drive limit3 by Pabl ≈ PPlasma = 2 ρ ct 2 . (3) The corresponding intensity is IRad = 4 ρ ct 3 , (4) where Pabl is the ablation pressure, ρ is the plasma density, and ct is the plasma isothermal speed of sound. For a stationary process Pabl = Pplasma. CM is measured in units of dyne-s/J or s/m x 10-5. Surface radiation driven plasmas provide surface plasma pressure, Pplasma, from IRad, the incident radiation intensity. CM = Pplasma / IRad ≈ 1/(2 ct) (5a)
11
HED x-ray radiation interactions convert a portion of the target front surface into a high pressure plasma, Pplasma , from IRad according to (2)4, Pplasma(TPa) = 17 (I( W/(cm2 1015 )))7/8 . (6) CM is also expressed as momentum per unit area divided by front surface fluence, Φ0, CM = (momentum/area) / Φ0 , (5b) where ρ∆ UP z dz (7)
In eq. (7), momentum transfer is expressed over a distance interval, Δ. Momentum per unit area is now calculated from observed values and is equivalent to (1). Using (5a) and (6), CM = 0.5 x 10⁻⁵ is ~1/3 the impedance corrected values for inhomogeneous targets listed later in Table 5. Stress history is measured by velocity history at the VISAR, using the known compression curve of the LiF window, and by a correction, ψ, for re-shock/release reflected into the sample as discussed in Section 7. Momentum transfer/area over time interval t1, substituting dz = us dt , with shock speed constant over dz, is ρ UPU dt (8)
P dt (9)
Integrating plasma pressure over the front surface energy (uniform) deposition over the plasma slab depth, δ, gives the radiative fluence, FRad, FR P dz P (10)
Although the functional form of up(z) is not known within the target, up is measured (by VISAR) at the rear surface allowing an estimated pressure gradient, dP/dr, computation from the front to rear surface measuring energy dissipation within the target, equivalent to internal energy absorption. Assuming target and material invariance (5b), ρ uP z dz P dz P
PCM (11)
3.0 Experimental Configuration The experimental configuration in Figure 12 uses samples ~1 mm thick, backed by transparent [100] LiF crystals that allow in-material optical access to VISAR diagnostics.

12
Without such a window, experience has shown that VISAR velocimetry would not be successful for many of these samples. Incident radiation generates pressures ranging from 2.6 to 12.4 GPa at surfaces exposed to Z-pinch radiation flux. These experiments were conducted under vacuum (~2 x 10⁻⁵ torr).
Figure 1. Experimental configuration. Wire array is cylindrical, with current through wires and returned through outer can (slotted hohlraum). Reproduced with permission from Int. J. Impact Engrg. Copyright 2008 Elsevier.
Properties of the radiation pulse are shown in Fig. 2. The radiation pulse is of short duration (4 – 10 ns; see Fig. 2b). The resulting pressure pulse is narrow relative to the sample thickness, rapidly attenuating as it propagates through the sample. Attenuation rate depends on dissipative mechanisms within the sample, including pore crushing, phase transitions (solid/solid or melting), as well as plastic deformation.
The targets were chosen to span a range of materials. In many cases it was possible to pair samples to allow comparisons of their behavior under identical drive conditions. This matrix is given in Table 1, together with radiation input parameters.
Figure 2. Z-pinch radiation characteristics (a) Per-bin and integrated energy (case of copper wire array in shot Z636), courtesy of B. Jones5. Approximately half of the energy is Planckian radiation at <1 kV and is not shown. (b) Time structure of radiation from pinch (case of shot Z1747).
Natural materials equation-of-state (EOS) determination is complicated by their
heterogeneous nature. VISAR diagnostics measure velocity at discrete points that are influenced by different phases of minerals within the sample, grain boundaries and voids.
0 5 10 15 20Energy (keV)
0
20
40
60
kJ
Spectrum from TI13A for shot Z636(Scaled per fit to PCDs and calorimeters)
Integrated Curve
Approximately half of the energy is < 1 kV, and is not shown.
Cu K lines
0 5 10 15 20 Energy (keV)
0
20
40
60
kJ
050
100150200250
300350400450500
50 100 150 200
Time (ns)
Pow
er (T
W) o
n In
tegr
ated
Pow
er (1
0
Power
Integrated Power
Pow
er (T
W) o
r In
tegr
ated
Pow
er (1
0 kJ
)
(a) (b)
Slotted Hohlraum
AnodePlate
Cathode
Wire Array 1 mm sample
LiF Window
Fiber Optic to VISAR
Fiber Optic from laser
X-ray drive
13
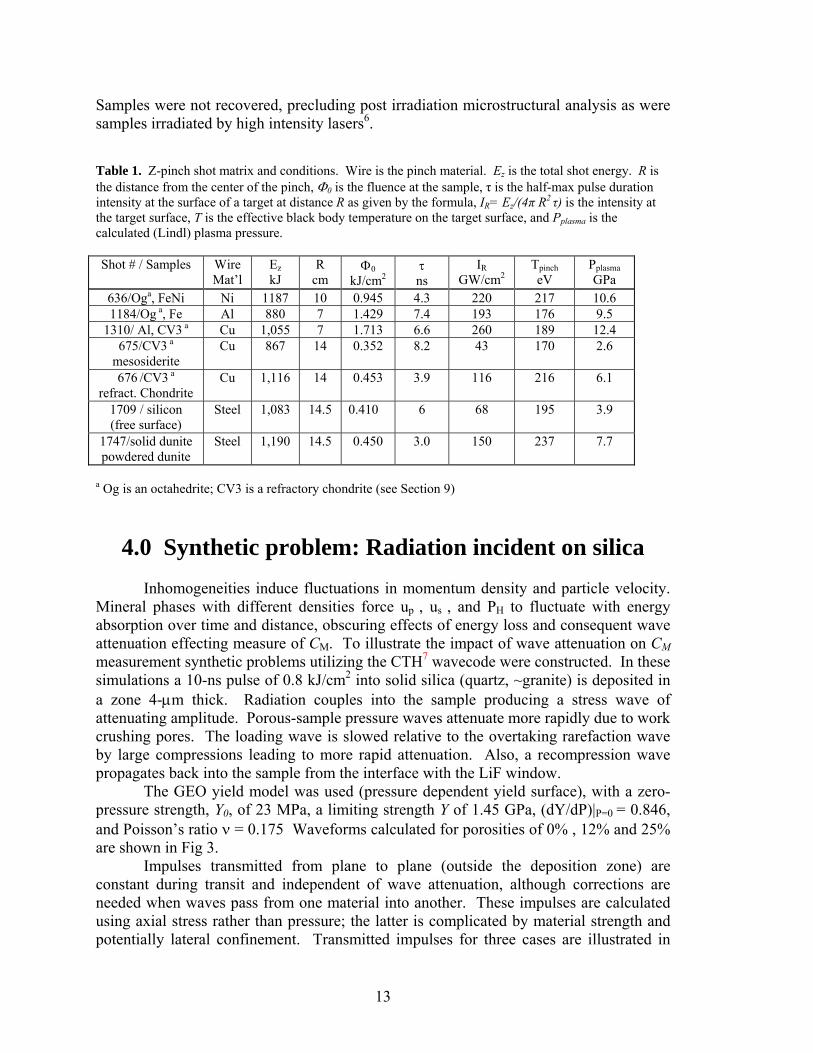
Samples were not recovered, precluding post irradiation microstructural analysis as were samples irradiated by high intensity lasers6. Table 1. Z-pinch shot matrix and conditions. Wire is the pinch material. Ez is the total shot energy. R is the distance from the center of the pinch, Φ0 is the fluence at the sample, τ is the half-max pulse duration intensity at the surface of a target at distance R as given by the formula, IR= Ez/(4π R2 τ) is the intensity at the target surface, T is the effective black body temperature on the target surface, and Pplasma is the calculated (Lindl) plasma pressure. Shot # / Samples Wire
Mat’l Ez kJ
R cm
Φ0 kJ/cm2
τ ns
IR GW/cm2
Tpinch eV
Pplasma GPa
636/Oga, FeNi Ni 1187 10 0.945 4.3 220 217 10.6 1184/Og a, Fe Al 880 7 1.429 7.4 193 176 9.5
1310/ Al, CV3 a Cu 1,055 7 1.713 6.6 260 189 12.4 675/CV3 a
mesosiderite Cu 867 14 0.352 8.2 43 170 2.6
676 /CV3 a refract. Chondrite
Cu 1,116 14 0.453 3.9 116 216 6.1
1709 / silicon (free surface)
Steel 1,083 14.5 0.410 6 68 195 3.9
1747/solid dunite powdered dunite
Steel 1,190 14.5 0.450 3.0 150 237 7.7
a Og is an octahedrite; CV3 is a refractory chondrite (see Section 9)
4.0 Synthetic problem: Radiation incident on silica
Inhomogeneities induce fluctuations in momentum density and particle velocity. Mineral phases with different densities force up , us , and PH to fluctuate with energy absorption over time and distance, obscuring effects of energy loss and consequent wave attenuation effecting measure of CM. To illustrate the impact of wave attenuation on CM measurement synthetic problems utilizing the CTH7 wavecode were constructed. In these simulations a 10-ns pulse of 0.8 kJ/cm2 into solid silica (quartz, ~granite) is deposited in a zone 4-μm thick. Radiation couples into the sample producing a stress wave of attenuating amplitude. Porous-sample pressure waves attenuate more rapidly due to work crushing pores. The loading wave is slowed relative to the overtaking rarefaction wave by large compressions leading to more rapid attenuation. Also, a recompression wave propagates back into the sample from the interface with the LiF window.
The GEO yield model was used (pressure dependent yield surface), with a zero-pressure strength, Y0, of 23 MPa, a limiting strength Y of 1.45 GPa, (dY/dP)|P=0 = 0.846, and Poisson’s ratio ν = 0.175 Waveforms calculated for porosities of 0% , 12% and 25% are shown in Fig 3.
Impulses transmitted from plane to plane (outside the deposition zone) are constant during transit and independent of wave attenuation, although corrections are needed when waves pass from one material into another. These impulses are calculated using axial stress rather than pressure; the latter is complicated by material strength and potentially lateral confinement. Transmitted impulses for three cases are illustrated in
14
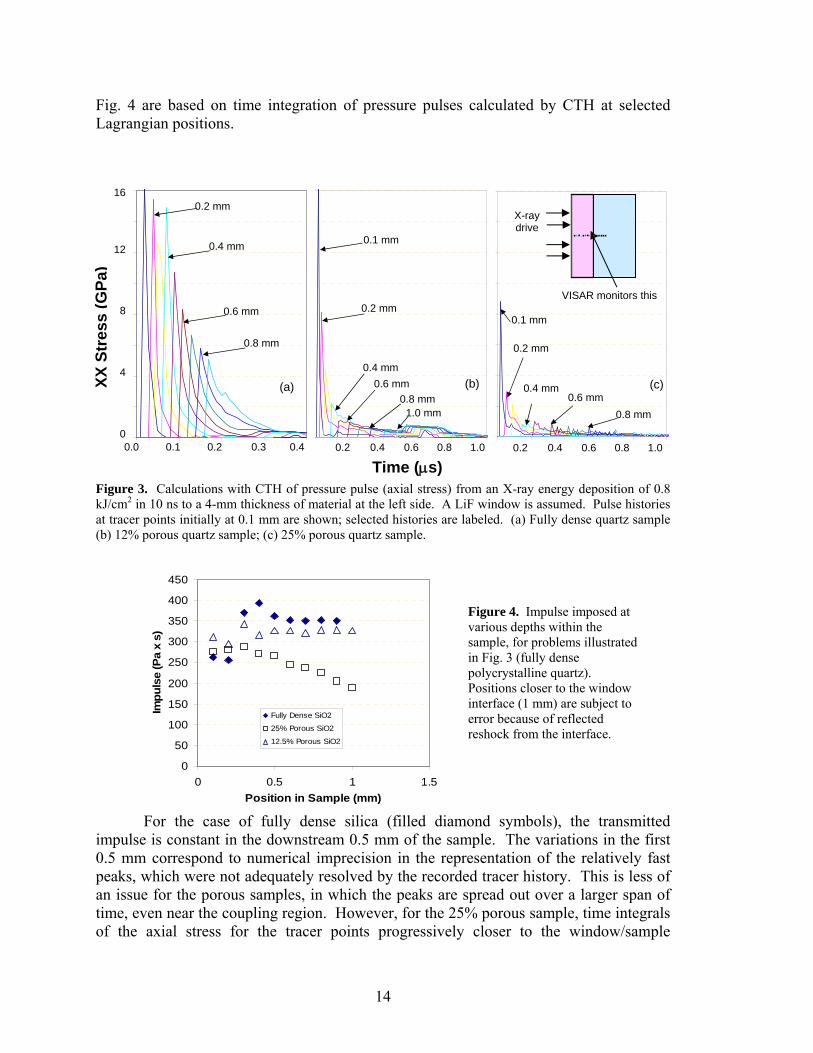
Fig. 4 are based on time integration of pressure pulses calculated by CTH at selected Lagrangian positions.
Figure 3. Calculations with CTH of pressure pulse (axial stress) from an X-ray energy deposition of 0.8 kJ/cm2 in 10 ns to a 4-mm thickness of material at the left side. A LiF window is assumed. Pulse histories at tracer points initially at 0.1 mm are shown; selected histories are labeled. (a) Fully dense quartz sample (b) 12% porous quartz sample; (c) 25% porous quartz sample.
For the case of fully dense silica (filled diamond symbols), the transmitted
impulse is constant in the downstream 0.5 mm of the sample. The variations in the first 0.5 mm correspond to numerical imprecision in the representation of the relatively fast peaks, which were not adequately resolved by the recorded tracer history. This is less of an issue for the porous samples, in which the peaks are spread out over a larger span of time, even near the coupling region. However, for the 25% porous sample, time integrals of the axial stress for the tracer points progressively closer to the window/sample
0
50
100
150
200
250
300
350
400
450
0 0.5 1 1.5Position in Sample (mm)
Impu
lse
(Pa
x s)
Fully Dense SiO2
25% Porous SiO2
12.5% Porous SiO2
0
2
4
6
8
10
12
14
16
0.0 0.2 0.4 0.6 0.8 1.0
Time (microseconds)
xx S
tress
(GP
a)
0
2
4
6
8
10
12
14
16
0.0 0.2 0.4 0.6 0.8 1.0
Time (microseconds)
xx S
tres
s (G
Pa)
0
2
4
6
8
10
12
14
16
0 0.1 0.2 0.3 0.4
Time (microseconds)
XX S
tress
(GPa
)
0.2 mm
0.4 mm
0.6 mm
0.8 mm
0.1 mm
0.4 mm0.6 mm
0.8 mm1.0 mm
0.2 mm0.1 mm
0.4 mm0.6 mm
0.8 mm
0.2 mm
Time (μs) 0.0 0.1 0.2 0.3 0.4 0.2 0.4 0.6 0.8 1.0 0.2 0.4 0.6 0.8 1.0
16
12
8
4
0
XX S
tres
s (G
Pa)
(c)
X-ray drive
VISAR monitors this
. . . . . . . . . . . . . . .
(b) (a)
Figure 4. Impulse imposed at various depths within the sample, for problems illustrated in Fig. 3 (fully dense polycrystalline quartz). Positions closer to the window interface (1 mm) are subject to error because of reflected reshock from the interface.
15
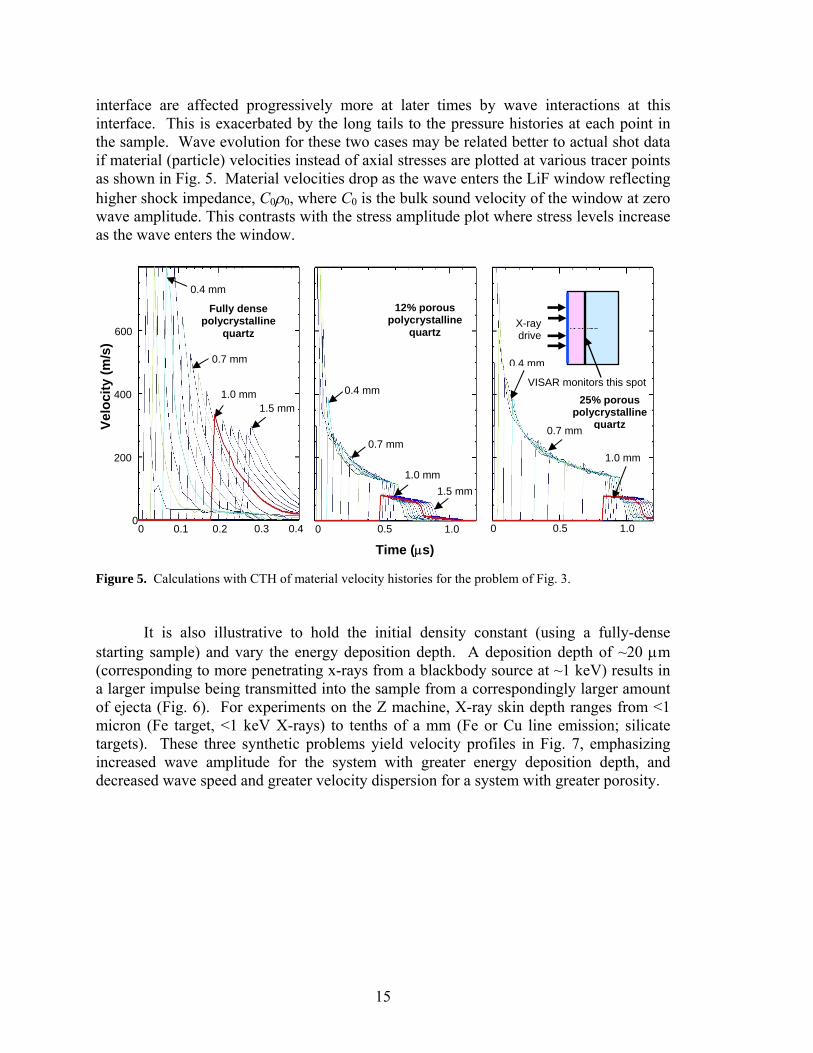
interface are affected progressively more at later times by wave interactions at this interface. This is exacerbated by the long tails to the pressure histories at each point in the sample. Wave evolution for these two cases may be related better to actual shot data if material (particle) velocities instead of axial stresses are plotted at various tracer points as shown in Fig. 5. Material velocities drop as the wave enters the LiF window reflecting higher shock impedance, C0ρ0, where C0 is the bulk sound velocity of the window at zero wave amplitude. This contrasts with the stress amplitude plot where stress levels increase as the wave enters the window.
Figure 5. Calculations with CTH of material velocity histories for the problem of Fig. 3.
It is also illustrative to hold the initial density constant (using a fully-dense
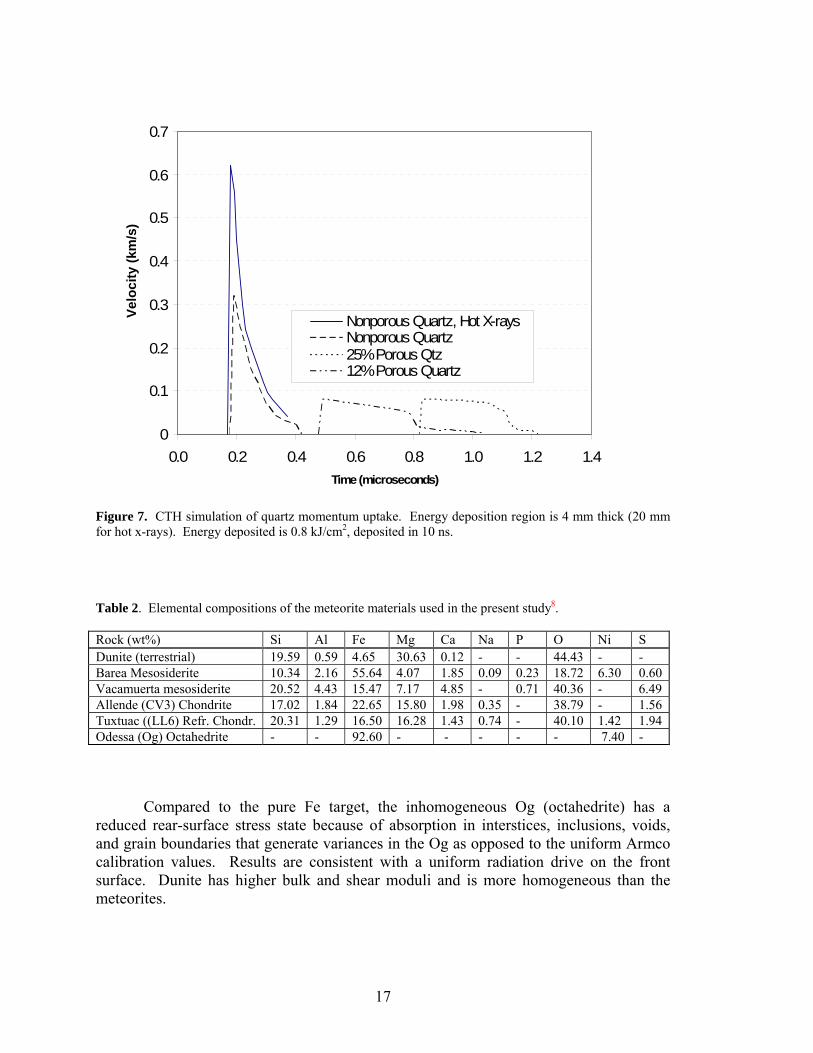
starting sample) and vary the energy deposition depth. A deposition depth of ~20 μm (corresponding to more penetrating x-rays from a blackbody source at ~1 keV) results in a larger impulse being transmitted into the sample from a correspondingly larger amount of ejecta (Fig. 6). For experiments on the Z machine, X-ray skin depth ranges from <1 micron (Fe target, <1 keV X-rays) to tenths of a mm (Fe or Cu line emission; silicate targets). These three synthetic problems yield velocity profiles in Fig. 7, emphasizing increased wave amplitude for the system with greater energy deposition depth, and decreased wave speed and greater velocity dispersion for a system with greater porosity.
Fully dense polycrystalline
quartz
25% porous polycrystalline
quartz
X-ray drive
VISAR monitors this spot
0.1 0.2 0.3 0.4 0 0.5 1.0
Time (μs)
600
400
200
0
Velo
city
(m/s
)
0
...............
1.0 mm
0.7 mm
0.4 mm
1.5 mm
12% porous polycrystalline
quartz
0 0.5 1.0
0.4 mm
0.7 mm
1.0 mm 1.5 mm
0.4 mm
0.7 mm
1.0 mm

16
Figure 6. Comparison of loading wave in Fig. 3 problem (left-hand panel; X-ray energy deposition of 0.8 kJ/cm2 in 10 ns to a 4-mm thickness of material at the left side) with similar problem where energy is deposited to a 20-mm thickness of material (right hand panel).
5.0 Sample descriptions and loading states
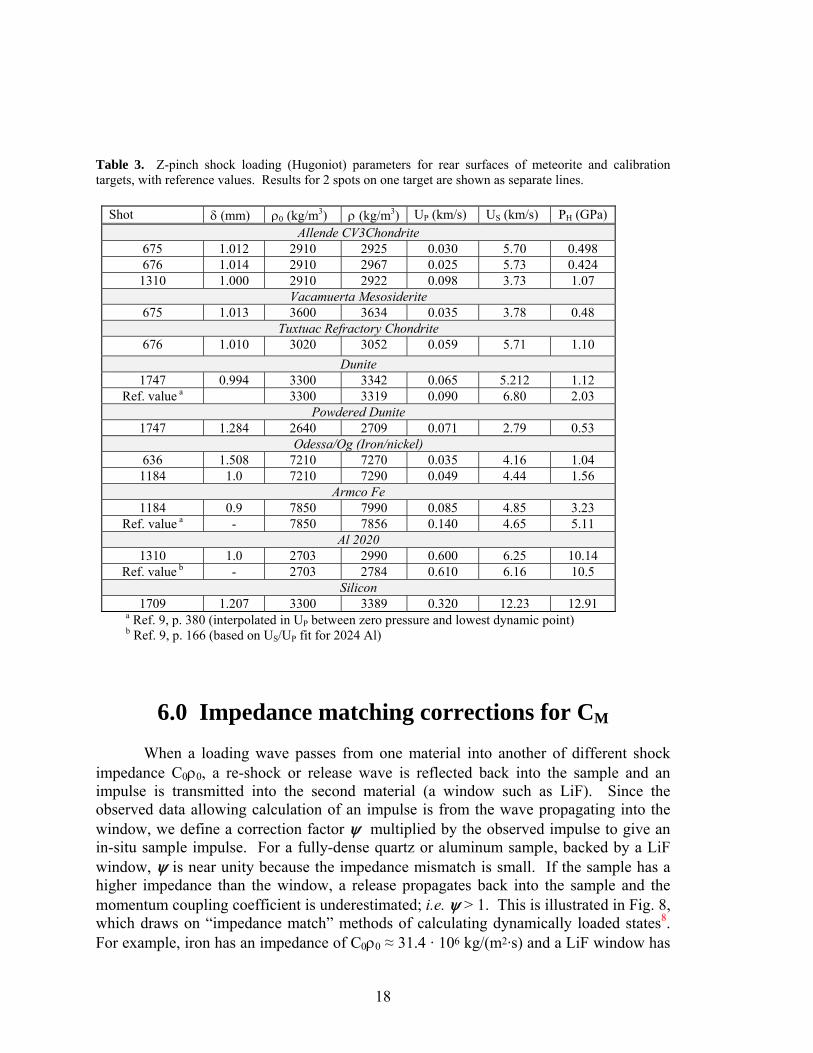
Materials irradiated in this study include selected iron and stony meteorites, magnesium rich olivine (dunite), and Al and Fe calibration materials. Compositions of the meteorites and dunite are in Table 2 and Appendix 1. Approximate Hugoniot values at the rear surface in Table 32 are calculated from observed maximum particle velocity at the sample/window interface and mean wavespeed. Particle velocity measurement was the dominant uncertainty, and are here reported corrected from the observed waveforms for impedance mismatch (see Section 6). Observed waveforms leading to these values are shown in Section 10.
Fully dense polycrystalline quartz
4 μm skin depth
1
Pres
sure
(GPa
) 1
5
0
1
8
0
6
4
2
0 0.1 0.2 0.3 0.4Time (μs)
0 0.1 0.2 0.3 0.4
Fully dense polycrystalline quartz
20 μm skin depth (“Hot” X-rays)
1.0 mm 0.7 mm
0.4 mm
1.5 mm
Pres
sure
(GPa
)
17
Figure 7. CTH simulation of quartz momentum uptake. Energy deposition region is 4 mm thick (20 mm for hot x-rays). Energy deposited is 0.8 kJ/cm2, deposited in 10 ns. Table 2. Elemental compositions of the meteorite materials used in the present study8. Rock (wt%) Si Al Fe Mg Ca Na P O Ni S Dunite (terrestrial) 19.59 0.59 4.65 30.63 0.12 - - 44.43 - - Barea Mesosiderite 10.34 2.16 55.64 4.07 1.85 0.09 0.23 18.72 6.30 0.60 Vacamuerta mesosiderite 20.52 4.43 15.47 7.17 4.85 - 0.71 40.36 - 6.49 Allende (CV3) Chondrite 17.02 1.84 22.65 15.80 1.98 0.35 - 38.79 - 1.56 Tuxtuac ((LL6) Refr. Chondr. 20.31 1.29 16.50 16.28 1.43 0.74 - 40.10 1.42 1.94 Odessa (Og) Octahedrite - - 92.60 - - - - - 7.40 -
Compared to the pure Fe target, the inhomogeneous Og (octahedrite) has a
reduced rear-surface stress state because of absorption in interstices, inclusions, voids, and grain boundaries that generate variances in the Og as opposed to the uniform Armco calibration values. Results are consistent with a uniform radiation drive on the front surface. Dunite has higher bulk and shear moduli and is more homogeneous than the meteorites.
0
0.1
0.2
0.3
0.4
0.5
0.6
0.7
0.0 0.2 0.4 0.6 0.8 1.0 1.2 1.4Time (microseconds)
Velo
city
(km
/
Nonporous Quartz, Hot X-raysNonporous Quartz25% Porous Qtz12% Porous Quartz
Velo
city
(km
/s)
18
Table 3. Z-pinch shock loading (Hugoniot) parameters for rear surfaces of meteorite and calibration targets, with reference values. Results for 2 spots on one target are shown as separate lines.
Shot δ (mm) ρ0 (kg/m3) ρ (kg/m3) UP (km/s) US (km/s) PH (GPa)
Allende CV3Chondrite 675 1.012 2910 2925 0.030 5.70 0.498 676 1.014 2910 2967 0.025 5.73 0.424 1310 1.000 2910 2922 0.098 3.73 1.07
Vacamuerta Mesosiderite 675 1.013 3600 3634 0.035 3.78 0.48
Tuxtuac Refractory Chondrite 676 1.010 3020 3052 0.059 5.71 1.10
Dunite 1747 0.994 3300 3342 0.065 5.212 1.12
Ref. value a 3300 3319 0.090 6.80 2.03 Powdered Dunite
1747 1.284 2640 2709 0.071 2.79 0.53 Odessa/Og (Iron/nickel)
636 1.508 7210 7270 0.035 4.16 1.04 1184 1.0 7210 7290 0.049 4.44 1.56
Armco Fe 1184 0.9 7850 7990 0.085 4.85 3.23
Ref. value a - 7850 7856 0.140 4.65 5.11 Al 2020
1310 1.0 2703 2990 0.600 6.25 10.14 Ref. value b - 2703 2784 0.610 6.16 10.5
Silicon 1709 1.207 3300 3389 0.320 12.23 12.91
a Ref. 9, p. 380 (interpolated in UP between zero pressure and lowest dynamic point) b Ref. 9, p. 166 (based on US/UP fit for 2024 Al)
6.0 Impedance matching corrections for CM When a loading wave passes from one material into another of different shock impedance C0ρ0, a re-shock or release wave is reflected back into the sample and an impulse is transmitted into the second material (a window such as LiF). Since the observed data allowing calculation of an impulse is from the wave propagating into the window, we define a correction factor ψ multiplied by the observed impulse to give an in-situ sample impulse. For a fully-dense quartz or aluminum sample, backed by a LiF window, ψ is near unity because the impedance mismatch is small. If the sample has a higher impedance than the window, a release propagates back into the sample and the momentum coupling coefficient is underestimated; i.e. ψ > 1. This is illustrated in Fig. 8, which draws on “impedance match” methods of calculating dynamically loaded states8. For example, iron has an impedance of C0ρ0 ≈ 31.4 · 106 kg/(m2·s) and a LiF window has

19
an impedance of C0ρ0 ≈ 13.6 x·106 kg/(m2·s), with C0 in km/s and ρ0 in g/cm3, giving an
underestimate of CM by ~2x and making it necessary to multiply the derived CM by: ψ = (M1+M2)/(2M2) , (12) correcting this effect. M1 is C0ρ0 for the sample and M2 is C0ρ0 for the window. Correction factors, ψ, together with pressure vs. particle velocity slopes, M, are given in Table 4. Figure 8. Illustrative correction to CM required by the use of a window such as LiF where stress levels in the window are lower than in the sample if the window has a lower shock impedance, ρoUs, than the sample. Table 4. CM correction factors ψ for different samples with LiF windows. The value of M1 = 13.6 ·106 kg/( m2·s) for LiF is also M2 for the LiF windows for all samples. The Si sample is not included because that test did not use a LiF window. Sample M1 106 kg/( m2·s) ψ LiF 13.6 1.0 Iron 31.4 1.65 Chondrite 16.3 1.1 Mesosiderite 16.3 1.1 Refractory Chondrite 16.3 1.1 Aluminum 14.3 1.025 Solid Dunite 22.1 1.31 Powdered Dunite 7.32 0.77 Z-Quartz (CTH) 17.0 1.12 12% porous quartz 4.3 0.66 25% porous quartz 3.2 0.62
P
UP
Sample: P = (ρoUS) UP = M1 UP
Window: P = (ρoUS) UP = M2 UP
Slope = -M1
(UP(Win), PWin)
(UP(Sam),
Time
x
Sample Window
(UP(Win), PWin)
(UP(Sam),
Deposition region
1 mm sample
1 mm LiF
Observation Point

20
7.0 Observed waveforms and derived momentum coupling
Although introduction of energy (and momentum) into the samples occurs over a
time-span of 3 – 8 ns, the properties of different samples give rise to different waveforms at the sample/window interface. In general, more porous samples exhibit more dispersive properties giving a slower waveform rise and longer pulse duration thereby imparting a smaller target acceleration. A key point of this analysis is to integrate the pressure pulse over the entire pulse duration to derive the actual total momentum uptake of the particular sample, depending on whether the target is solid, porous, or powder. It will also vary with the radiation cross-section with possible scabbing of a layer of material, heat of vaporization, and other properties. If there is no spallation, as in the present experiments where samples are backed (confined) by a window, net momentum transfer to the target depends only on front (initial) surface ejecta via conservation of momentum. The finite size of the LiF windows imposes limits on the time interval in which the observed waveform is useful. When wave propagation is highly dispersive (resulting in loading and release wave spread), the leading portion of the wave may reach the back of the LiF window before the entire wave has reached the sample/LiF interface. In this case, motion vs(t) of the LiF free surface must be considered. Dolan10 shows that the actual velocity v(t) of the reflecting surface is related to the apparent velocity v*(t) as:
v(t) = (1/a) [v*(t) + (a – 1) vs(t)], (13)
where a, the velocity correction due to the dynamic index of refraction, is 1.280 for LiF at 532 nm light. Since we did not explicitly measure vs(t), it must be approximated. For the first 189 ns after the sample/LiF interface moves vs(t) will be zero because the wave (propagating ~ 5.6 km/s) has not had time to traverse the 1 mm thick LiF. Following this time a zeroeth order approximation that vs(t)= 2· v*(t – 189 ns), is used, i.e., the wave is transmitted unmodified through the LiF. However, when the loading wave propagating through the window has had time to reflect from the back of the window and arrive again at the sample interface, the actual motion of the interface is affected. This occurs at a time (2 mm)/(5.3 mm/μs) = 377 ns after initial motion. Data are disregarded after this time.
Waveforms from chondrite and 1100 aluminum, acquired on test Z1310, are shown in Fig. 9. The aluminum waveform, with rapid loading and immediate pullback, indicates a classic attenuating wave. By contrast, the (polyphase) chondrite waveform is dispersed and irregular. Intervals of integration are indicated by shading (for the chondrite) and a dotted cutoff line (for the aluminum)

21
Figure 9. Experimental result for momentum uptake in 1100 Al and chondrite. Energy deposited is 1.73 kJ/cm2, deposited in ~5 ns FWHM (Experiment Z1310). Integration intervals are indicated. Octahedrite, composed of iron-nickel domains of kamacite and taenite, and
Armco iron samples on shot Z1184 show dispersed loading followed by a pullback (Fig. 10). Armco iron shows ~twice the amplitude of the octahedrite, a surprise in view of the similar densities and x-ray stopping powers of both materials. Like Z1310 natural samples with micro inclusions and grain boundaries show more irregular waveforms, energy absorption, and compression wavespeed reduction than uniform samples.
Figure 10. Experimental results for momentum uptake in Armco iron and an octahedrite sample. Energy deposited is 1.43 kJ/cm2, deposited in ~5 ns FWHM (Experiment Z1184). The below-zero portion at late
time is an artifact of the effect of the loading wave arriving at the rear surface of the LiF window.

S
targets inproblemsexhibitin
FiguremonoliPowde
W
octahedripeak sugwindow (Z675), ashows th
hot Z1747 ndicated a s discussed i
ng 2 sharp se
11. Experimeithic and powdered dunite has
Waveforms fite (Z636) is
ggests an expand is discouand are also is feature bu
used monoldecrease in
in Section 5 parate peaks
ental results aredered/compress
a lower waves
from other ss similar to pansion wavunted. Simidiscounted.
ut do not clea
2
lithic and pon compressio
(cf. Fig. 7).s, suggest yi
e shown for mosed. Energy despeed than doe
(Experime
samples areFig. 9, exce
ve corresponilar features Waveformanly indicate
22
owdered/comon wave sp Waveformelding pheno
omentum uptakeposited is 0.45s solid dunite,
ent Z1747).
shown in Fept for a secnding to a re
are shown fms for the refe where the r
mpressed dupeed analog
ms for monolomenon.
ke in dunite ((M5 kJ/cm2, deposresulting in a l
Fig. 12. Thond peak. Tflection from
for the chondfractory choreflected sho
unite targetsgous to the ithic dunite
Mg0.9Fe0.1)2SiOsited in ~5 ns Flater waveform
he waveformTiming of thm the back odrite and mendrite shot Zock effect be
. Porous synthetic (Fig. 11),
O4), both FWHM.
m arrival
m for the he second of the LiF esosiderite Z676 also egins.

23
Finally, a waveform was obtained for polycrystalline silicon. For this sample no
window was used, and the rear surface was therefore a free surface. The waveform, shown in Fig. 13, shows a much less dispersed wave than the other samples. This is probably due to the higher wavespeed of Si (~9 km/s), both for loading and release, as well as the high strength, causing most of the wave behavior to be elastic.
Calculation of CM proceeds by integrating the velocity curve over the time curve in the window with its bounds, and converting it into a pressure-impulse using the approximate relation for LiF, which is P = (ρ0·US)·UP ≈ 13.59 GPa, where UP is the observed velocity in the window. This value is corrected for impedance mismatch
Figure 12. Experimental results for momentum uptake in (a) an octahedrite (0.945 kJ/cm2; experiment Z636), (b) a chondrite and a mesosiderite (0.352 kJ/cm2; experiment Z675), and (c) a chondrite and a refractory chondrite (0.453 kJ/cm2; experiment Z676) are shown. Shaded areas indicate integration intervals for CM.

24
Figure 13. Experimental results for momentum uptake in polycrystalline silicon (0.410 kJ/cm2; experiment
Z1709). The shaded area indicates integration intervals for CM. between samples and windows by applying Table 2 correction factors. Corrected values for impedance matching CM are determined from
CM = (momentum/area) /FRad ψ , (14)
CM ρ UPU dt FR ψ (15)
Corrected CM are listed in Table 5, agreeing with earlier results11,12. Low CM for powdered samples are due to low velocity transfers. If energy density decreases below an ejection threshold, CM markedly decreases. Table 5. CM calculation from impulse integration using equations (10) and (14). The plasma pressure is generated on the target front surface by the Z-pinch radiation. Note, the quotient of the pressure divided by the fluence must be multiplied by the correction factor ψ to obtain CM (see Eqns. 6 and 9).
Shot #
Sample ρ0 gm/cm3
Fluence J/cm2
∫vdt μm
∫Pdt kPa·s
ψ (Table 4)
CM 10-5 s/m
PPlasma GPa
636 Octahedrite 7.21 945 5.97 0.0811 1.65 1.42 10.7 675 Mesosiderite 3.60 352 5.70 0.0774 1.1 2.42 2.6 675 CV3 Allende 2.91 352 5.30 0.0721 1.1 2.25 2.6 676 Refr Chondr. 3.02 453 5.66 0.0769 1.1 1.87 6.1 676 CV3 Allende 2.91 453 7.18 0.0976 1.1 2.37 6.1 1184 Octahedrite 7.21 1429 5.24 0.0712 1.65 0.82 9.6 1184 Armco Fe 7.85 1429 11.12 0.1512 1.65 1.75 9.6 1310 CV3 Allende 2.91 1713 35.70 0.4851 1.1 3.12 12.4 1310 Al 2100 2.70 1713 32.54 0.4423 1.025 2.65 12.4 1709 Silicon (Free Surf) 2.33 410 1.13 0.0118 2.0 0.29 3.9 1747 Dunite 3.30 450 6.75 0.0907 1.31 2.67 7.7 1747 Pwd Dunite 2.64 450 3.08 0.0419 0.9 0.49 7.7 CTH Quartz 2.64 800 22.46 0.3052 1.12 4.27 8.1 CTH 12% Porous
quartz 2.32 800 22.41 0.3046 0.66 2.51 8.1
CTH 25% Porous Qtz 2.00 800 22.55 0.3065 0.62 2.38 8.1 CTH Quartz (hot x rays) 2.64 800 42.78 0.5813 1.12 8.14 8.1?

25
8.0 Analytic impulse models (MBBAY calculations)
An analytic model is used to investigate blowoff impulse and late-time momenta without dealing with a multi-dimensional hydrocode analyses is the so-called modified BBAY (MBBAY) model by Bethe, Bade, Averell, and Yos in the 1960s and modified by McCloskey and Thompson in the 1970s13. Originally developed to study nuclear weapon effects, more recently it has been used to examine the interaction of nuclear explosions with comets or asteroids that might be on a trajectory with a high probability for impact with Earth14. The MBBAY model predicts the impulse, I, as
2/1
2
0 00
0 )(ln1)(2⎥⎥⎦
⎤
⎢⎢⎣
⎡
⎭⎬⎫
⎩⎨⎧
⎟⎟⎠
⎞⎜⎜⎝
⎛+−= ∫ dzz
EzEEzEI
z
ρα , (16)
where 21 ≤≤ α , generally taken as α = 1.2. E(z) is the energy deposition per unit mass as a function of depth, z, in the target, and 0E is the specific energy defining the extent of the material contributing to the blowoff impulse (i.e., where E(z0) = E0), and ρ is the target material density. 0E is the target melt or vaporization energy. Integration is from the front surface, 0=z , to the blowoff depth, 0zz = . If the energy-dependent absorption coefficients, μ(hν), can be approximated by a single effective value, μeff, then the energy deposition, E(z), can be expressed as
)exp()( 0 zzE effeff ρμμ −Φ= , (17) where 0Φ is the incident energy fluence. The MBBAY model is integrated to yield a relatively simple closed-form expression for the impulse. Representing the impulse in a nondimensional form, 2/1
0/* EII effμ= , as a function of the nondimensional fluence,
000 /* Eeff Φ=Φ μ , the result is15
( ) ( )2/1
30
2000 *ln
61*ln
21*ln1*2*
⎭⎬⎫
⎩⎨⎧
⎥⎦⎤
⎢⎣⎡ Φ+Φ+Φ+−Φ= αI . (18)
In the limit of high fluence, Φ0* >> 1 the logarithmic terms in the square brackets increase more slowly than the other terms, and the equation reduces to
*2* 0Φ= αI , Φ0* >> 1 . (19) Changing back to dimensional variables this becomes
eff
Iμ
α 02 Φ= , Φ0 >> E0/μeff , (20)

26
and at high fluences the impulse is asymptotically independent of all material properties but the absorption coefficient, and scales with the square-root of the incident fluence.
There are three important properties of this model that apply for the approximate forms described above or for full numerical integrations over depth into the target and over spectral intensities and absorption coefficients. First, there is a deposited energy below which there is no material decomposition and thus no generated blowoff impulse. This assumes deposited energy is a monotonic decreasing function of the depth in the target as suggested above. For a given x-ray spectrum and target material this leads to a specific threshold for the incident energy fluence located at 1*0 =Φ . Second, if the impulse coupling coefficient, CM, is defined as the impulse, I, divided by the energy fluence incident on the surface of the target, Φ0, then CM will have a maximum value at a fluence roughly a factor of ten greater than the threshold, i.e., at 10*0 ≈Φ . Finally, when the incident fluence is high—much greater than at the maximum coupling efficiency or the knee of the impulse curve—the impulse will scale with the square-root of the incident fluence, as shown above. For fluences at higher levels the impulse will be relatively insensitive both to the characteristics of the incident radiation, other than its absorption coefficient in target materials and to other target properties. For applications depending on impulse coupling, it may be important to choose, if possible, an incident x-ray spectrum that maximizes this coupling and/or its efficiency.
9.0 X-ray spectra and blowoff impulse
To calculate the blowoff impulse in the solid materials a description of the x-ray
spectra generated by the wire arrays constituting the magnetically driven Z pinch is necessary, including both x-ray spectra and fluences incident on target materials. Relevant fluences, as well as the measured impulses and coupling coefficients, are provided in Table 5 and excerpted in Table 6. Each of the wire array materials has its own line spectrum constituting ~ 5% of the fluence incident on the target. The bulk of the fluence—the remaining 95%—is thermal in nature, and is approximated as a blackbody or Planckian spectrum with a nominal temperature of 200 eV (1 eV = 11604 K). Note that the peak intensity for this thermal spectrum occurs at a photon energy of 0.56 keV (i.e., 2.82 times the temperature), and that 99% of its total energy is at photon energies below 2 keV (i.e., 10 times the temperature). The appropriately weighted line and thermal components of the spectrum are then summed to provide the source term for the target response. The process is illustrated using the copper-wire-array spectrum, which constitutes half of the shots examined. Figure 14 and its caption show the results. A similar process is repeated for the nickel, aluminum, and stainless-steel wire arrays.

27
Figure 14. Source spectra for copper wire array. The curve labeled “0.2 keV Planckian” represents the
thermal component of the fluence incident on the target, and is normalized to an integral of Φ = 0.95. The “Cu Line Spectrum,” normalized to Φ = 0.05, shows the spectrum directly from the copper material
constituting the wire array; it is a low-pass filtered version of the detailed experimental measurements. The circular points near the blackbody curve provide a numerical sum of the two source spectra; they are the data actually used in the x-ray deposition code. Labeled “Integral of ‘Sum’ Spectrum,” the final curve is the numerical integral of those latter points, and has a final value of Φtot = 0.999. In the x-ray deposition code this final “sum” spectrum is scaled to the desired fluence. Similar plots for each of the wire-array
materials were also generated
Table 6. Radiation environment and impulse data for samples. The shots with numbers followed by “a” and “b” contained two samples each—a meteorite material and a metal. The fluences are taken from Table 1. The MBBAY impulses and coupling coefficients were calculated using the MBBAY model as incorporated in the x-ray deposition code 12. The numbers before the slash employed the standard values for the decomposition energies, and the numbers after the slash used element-weighted values based on the constituent elements. The measured impulses and coupling coefficients were obtained from integrated particle velocity records, and were taken from Table 5. The measured coupling coefficients do not follow directly from the impulses and fluences but were obtained using the impedance-matching method. Calculated and measured results show differences that may be due to approximations used in the MBBAY model or in data reduction techniques; inhomogeneities in samples could also be an important contributing factor. One standard unit for impulse, dyne-s/cm2, is often called a “tap,” where 1 tap = 0.1 Pa-s. Coupling-coefficient units are (dyne-s/cm2)/(J/cm2) = dyne-s/J, where 1 s/m = 105 dyne-s/J.
Shot
Number Wire Array
Material Target
Material Fluence
on Target
(kJ/cm2)
MBBAY Impulse (Pa-s)
MBBAY Coupling
Coefficient (10-5 s/m)
Measured Impulse (Pa-s)
Measured Coupling
Coefficient (10-5 s/m)
636 Nickel Odessa 0.945 410/360 4.3/3.8 81 1.4 675 Copper Allende 0.352 190/170 5.4/4.8 72 2.6 676 Copper Allende 0.453 220/200 4.8/4.4 98 2.4
1184 a Aluminum Odessa 1.43 390/380 2.73/2.66 71 0.82 1184 b Aluminum Iron 1.43 390 2.7 150 1.8 1310 a Copper Allende 1.71 440/420 2.6/2.5 490 3.1 1310 b Copper Aluminum 1.71 700 4.1 440 2.7 1747 Stainless
Steel Dunite
(ALM-2) 0.450 240/220 5.3/4.9 91 2.7

28
Target material properties are listed in Table 7. To calculate the energy
deposition, the inputs required by the x-ray deposition code16 include the x-ray spectrum, the target composition, and the target densities, ρ0. Photoelectric absorption is dominant, but Compton scattering and emission of fluorescence radiation are also fully taken into account. Because energy deposition processes are all on an atomic basis, errors associated with this aspect of the analysis are very small. However, the target materials are inhomogeneous on a sub-millimeter scale, so on this spatial dimension the local deposited energy may have significant uncertainties. Averaged over the “homogenized” samples this error is ~ several percent. In addition, the MBBAY code requires the target melt, Em, and vaporization, Ev, energies to calculate blowoff. The decomposition energies used for target materials are an additional source of uncertainty in these calculations.
Table 7. Properties of target materials. Values of the vaporization (Ev) and melt (Ev) energies for the meteor materials are approximate and “homogenized” over the variable and inhomogeneous mineral and . The values for Ev and Em listed before the slash are those generally accepted by the community, with the latter approximated by Ev/10. The values after the slash are weighted by the elemental weight composition from the constituent elements. The elemental compositions may not add to 100 due to rounding.
Material ρ0
(g/ cm3)
Ev (kJ/g)
Em (kJ/g)
Elemental Weight Percent O
Z=8 Na
Z=11 Mg
Z=12 Al
Z=13 Si
Z=14 S
Z=16 Ca
Z=20 Cr
Z=24 Fe
Z=26 Ni
Z=28 Allende 2.91 6.0/
12.0 0.6/2.5
39 0.4 16 1.8 17 1.6 2.0 — 23 —
Dunite (ALM-2)
3.3 6.0/13.0
0.6/1.9
44 — 31 0.6 20 — 0.1 0.3 4.6 —
Odessa 7.21 6.4/7.4
0.64/1.3
— — — — — — — — 93 7.4
Aluminum 2.7 13.5 1.05 — — — 100 — — — — — —
Iron 7.85 7.39 1.29 — — — — — — — — 100 —
Table 7 includes two sets of values for Ev and Em, first for the standard values generally accepted for meteorite materials by the community, and second, derived here to indicate potential uncertainties in the calculated impulse from this source. For the first values Em, is assumed to be ~0.1 Ev, as is roughly the case for many elements. For the second values both Ev and Em are calculated from the better known properties for the constituent elements using the elemental weight percents given in the table. Em is important mainly at low fluences near the threshold, and Ev dominates at higher fluences. As the fluence gets larger, neither of these energies has much influence because they progressively become smaller and smaller parts of the total energy available for creating blowoff material as is evident in subsequent plots of impulses and coupling coefficients.
10.0 X-ray deposition code
The x-ray deposition code examines the target materials and input spectrum so
29
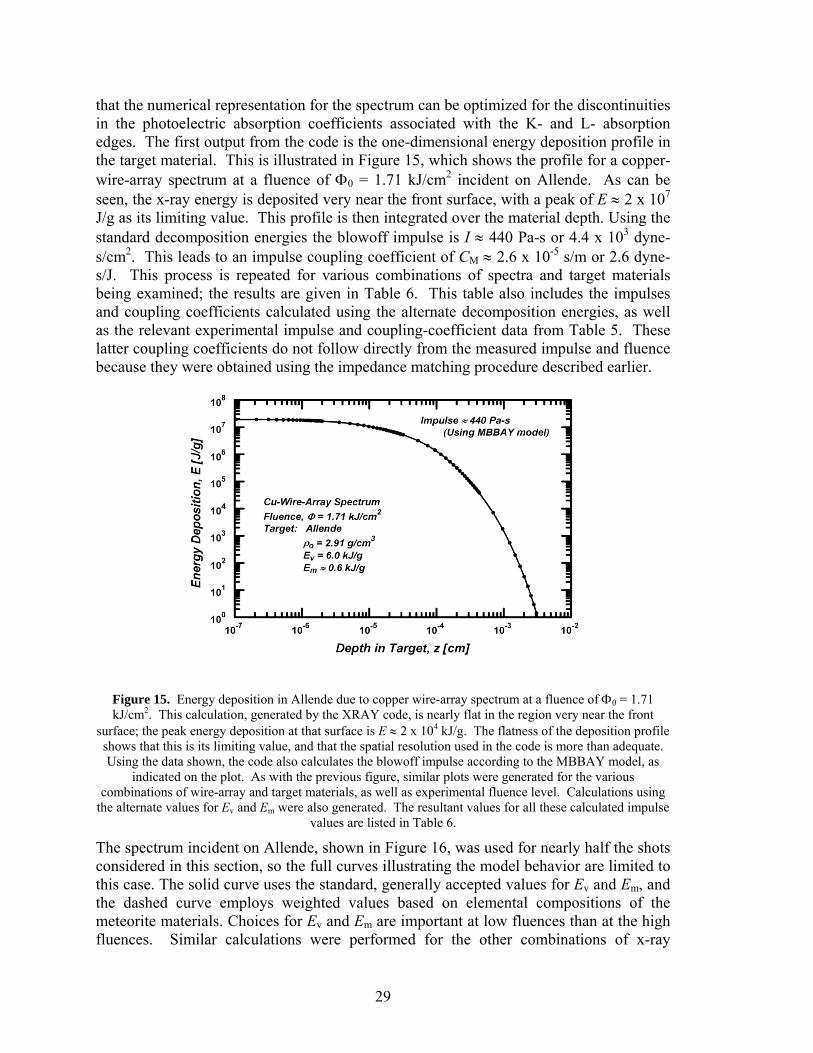
that the numerical representation for the spectrum can be optimized for the discontinuities in the photoelectric absorption coefficients associated with the K- and L- absorption edges. The first output from the code is the one-dimensional energy deposition profile in the target material. This is illustrated in Figure 15, which shows the profile for a copper-wire-array spectrum at a fluence of Φ0 = 1.71 kJ/cm2 incident on Allende. As can be seen, the x-ray energy is deposited very near the front surface, with a peak of E ≈ 2 x 10⁷ J/g as its limiting value. This profile is then integrated over the material depth. Using the standard decomposition energies the blowoff impulse is I ≈ 440 Pa-s or 4.4 x 10³ dyne-s/cm2. This leads to an impulse coupling coefficient of CM ≈ 2.6 x 10⁻⁵ s/m or 2.6 dyne-s/J. This process is repeated for various combinations of spectra and target materials being examined; the results are given in Table 6. This table also includes the impulses and coupling coefficients calculated using the alternate decomposition energies, as well as the relevant experimental impulse and coupling-coefficient data from Table 5. These latter coupling coefficients do not follow directly from the measured impulse and fluence because they were obtained using the impedance matching procedure described earlier.
Figure 15. Energy deposition in Allende due to copper wire-array spectrum at a fluence of Φ0 = 1.71 kJ/cm2. This calculation, generated by the XRAY code, is nearly flat in the region very near the front
surface; the peak energy deposition at that surface is E ≈ 2 x 10⁴ kJ/g. The flatness of the deposition profile shows that this is its limiting value, and that the spatial resolution used in the code is more than adequate. Using the data shown, the code also calculates the blowoff impulse according to the MBBAY model, as
indicated on the plot. As with the previous figure, similar plots were generated for the various combinations of wire-array and target materials, as well as experimental fluence level. Calculations using
the alternate values for Ev and Em were also generated. The resultant values for all these calculated impulse values are listed in Table 6.
The spectrum incident on Allende, shown in Figure 16, was used for nearly half the shots considered in this section, so the full curves illustrating the model behavior are limited to this case. The solid curve uses the standard, generally accepted values for Ev and Em, and the dashed curve employs weighted values based on elemental compositions of the meteorite materials. Choices for Ev and Em are important at low fluences than at the high fluences. Similar calculations were performed for the other combinations of x-ray

30
spectrum, fluence, and target material and the results are listed in Table 6. When impulse is plotted as a function of fluence, there is a threshold fluence below which blowoff impulse is not generated. In this case it is very low, at (Φ0)threshold ≈ 0.1 J/cm2 for the solid curve and (Φ0)threshold ≈ 0.3 J/cm2 for the dashed curve. Also, at fluences well above the knees of the curves, the curves coalesce and the impulse scales very with the square-root of the fluence. In addition to the model data for the three copper-wire-array shots and the Allende target material (circles), the figure includes the calculated impulse data for the other shots (Xs). For all the conditions examined here the MBBAY model predicts very similar impulse behavior. The only possible exception is the aluminum sample exposed to the copper-wire-array spectrum because decomposition energies and absorption coefficients are substantially different from other materials examined and will have a higher impulse/fluence curve, with the impulse threshold shifted toward greater incident fluences, i.e., the entire curve will be shifted generally up and to the right. All the other calculated impulses fall very close to the curves as plotted.
Figure 16. MBBAY model calculations for impulse versus fluence. These curves were generated for the x-ray spectrum from the Z-pinch copper wire array incident on Allende. The solid curve is for the standard
decomposition energies and the dashed curve is for the alternate values. The circles and Xs represent calculations for the experimental conditions described in this paper, where the circles are for the cases represented by the curve, and the Xs are for the other spectra and materials. However, all the model
calculations have very similar impulse/fluence curves because they are all at fluences well above the knee of the curve. For the standard decomposition energies the model predicts that the threshold energy fluence
for generating any blowoff impulse with the copper wire array and the Allende material is very low, at (Φ0)threshold ≈ 0.1 J/cm2. Using the alternate decomposition energies this threshold is (Φ0)threshold ≈ 0.3 J/cm2.
For comparison, the diamonds show the experimental measurements, which are mostly well below the calculated results, typically by factors of from 2 to 4. Note that 1 Pa-s = 10 “taps” = 10 dyne-s/cm2.
When the same calculated data are used to plot the impulse coupling coefficients,
as in Figure 17, a peak coupling or maximum efficiency occurs at an intermediate fluence

31
that is roughly ten times that of the impulse threshold (i.e., Φ0 ≈ 1 kJ/cm2 for the solid curve and Φ0 ≈ 3 kJ/cm2 for the dashed curve). Both curves (solid for the standard decomposition energies, and dashed for the element-weighted values) were calculated for the copper wire-array spectrum and the Allende target. As with the impulse, all the model data fall very close to the curve, with the exception of the one outlier aluminum point. As before this is due to its higher decomposition energies and other properties, which in turn shift the entire curve generally up and to the right. The existence of a peak impulse coupling coefficient has significant implications for optimizing application.
11.0 Impulse measurements
Both Figures 16 and 17 include the experimentally measured impulse and
coupling-coefficient data for these eight shots that mostly fall below model calculations and exhibit considerable scatter, although they do show the same general trends as the model results. The measured momenta are typically factors of two to four, and the
Figure 17. Impulse coupling coefficient as predicted by the MBBAY model for a copper-wire-array spectrum incident on Allende. The curves and the points are as with the previous figure. Note that the MBBAY model predicts a maximum coupling coefficient, CM, at intermediate fluences. In this case
(CM)max ≈ 4 x 10⁻⁴ s/m for the standard Allende decomposition energies, and (CM)max ≈ 2 x 10⁻⁴ s/m for the alternate values. The fluences for the CM peaks are both a factor of 10 above the threshold fluences. As with the impulse, the experimentally measured coupling coefficients (diamonds) are mostly below the
calculations by factors of about two. Note that 1 s/m = 105 (dyne-s/cm2)/(J/cm2) = 105 dyne-s/J.
coupling coefficients are up to a factor of two lower than model calculations. Some of the scatter in the data may be due to sample inhomogeneities or limitations in experimental reading times from finite lateral target dimensions. This might happen if the VISAR laser beam selectively measures response of either an inclusion or the matrix material which would likely have a velocity history different from “homogenized” material, or it may be due to the influence of lateral wave reflections on the VISAR records. Window material

32
helps to smooth out irregularities to some extent. Inhomogeneities also lead to variations in the blowoff process due to turbulent mixing at high fluences and decomposition energies at low fluences. Other phenomena such as “front-surface spall” or contributions from “non-blowoff impulse” (Appendix 2) could lead to uncertainties in either model calculations or the experimental results. Errors in incident x-ray spectrum or fluence are not thought to be important because of their relative insensitivity of impulses and coupling coefficients at high fluences.
12.0 Discussion
It is important to distinguish between processes of momentum transfer (which involve material in and near the mean free path (MFP) for x-ray absorption) and downstream wave processing involving the entire sample). The momentum transfer process is affected by the x-ray cross-section of the target material (which determines the MFP), the total energy deposited in the MFP (which governs heating), and phase changes (which may also strongly affect material ejection). High-strength materials must absorb more energy to generate near-surface particulate ejecta and spall scabbing. By contrast, downstream waveform evolution does not affect the net momentum transfer. CM is determined by near surface ejecta mechanisms operating during the initial x-ray interaction in the MFP.
Material EOSs are difficult to ascertain in an attenuating wave context such as in the present experiments. While some inferences can be made based on wave transit times (corresponding to mean wave speeds), these experiments are not nearly as good for measuring EOSs as are: (1) experiments with supported wave (i.e., non-attenuating), or (2) isentropic compression methods17,18. Attenuation of an impulsive pressure wave depends on target material properties and affects Hugoniot states at different target locations. Hence, Hugoniot states reached at the rear surface are a function of initial impulse at the front surface and waveform evolution during target transit. The wave carries a constant impulse until it interacts with the target boundaries. The high-energy-density dynamic responses of natural-material targets depend on inhomogeneous meso- and macro-structures that give rise to turbulent mixing. Modeling this interactive behavior is analogous to predicting the outcome of a single pebble scattering off a collection of pebbles where a myriad of trajectories is sensitive to boundary conditions, shapes, and sizes that cannot all be considered fully. Such phenomenology is difficult to model in hydrocodes that idealize particle agglomerations as a homogeneous medium Nonetheless, the normative results generated by this research are relevant to near-Earth object hazard mitigation, astrophysics and planetary science, and modeling of weapon effects and energy coupling for nuclear tests, thereby assisting in nuclear test ban monitoring and compliance.
The present explicit modeling treatment, the MBBAY model, was developed using only basic hydrodynamics theory and conservation of energy and momentum, and should provide an estimate of the overall physical processes connected with the generation of radiation-induced blowoff impulse. That involves deposition of pulsed radiation energy into a target and the turbulent-free conversion of that energy into a dynamic impulse. As anticipated, experimental CM values are generally lower than the model calculations. Individual contributing factors to these inconsistencies (e.g.,
33
decomposition energies and turbulence effects) have been discussed. From an experimental perspective the data reduction technique may have difficulties, possibly with regard to the impedance-matching approach that was employed. Front-surface spall and non-blowoff impulse may influence the measurements, and they are certainly not included explicitly in the present model calculations. Even larger sources of error are the material inhomogeneities, and the finite lateral dimensions of the samples; these are not in the calculations. Some of these effects may be treated explicitly in a complete time-dependent hydrodynamic analysis. If the input parameters are correct, the response phenomenology should also be correct especially at high fluences where impulse increases slowly and is insensitive to most of the input details. On the other hand inhomogeneities generate turbulence mixing uncertainties that are difficult to quantify, and may be ~ several 10s -100 %. .
Specifically, the measured CM values range from ~ 25 to 100% of values from the BBAY calculations presented in Section 11. Some further comments about experimental errors are in order. The direct quantities used to calculate CM from the experimental data are the time integral of the observed velocity history, the incident fluence, and the impedance correction. That the velocity history or the impedance correction are low by 2 – 4 x, or the fluence high by 2 – 4 x, is unlikely. An impedance change in the path of a pressure wave may slightly increase the duration of the wave at that impedance discontinuity and tend to increase the experimental CM. Other important sources of error are likely to be due to turbulent mixing and the finite sample and window size. As mentioned above, integration of the velocity history must be truncated when the pressure wave has reached the back of the window and returned to the sample. Ironically, this is most likely to be a major factor for the Allende chondrite sample in shot Z1310, where experimental data appear to agree more closely with the MBBAY calculations.
Although momentum uptake for these materials uniformly occurred in a short time (~5 ns), governed by incident pulse duration, mechanical wave dispersion varied greatly among samples. This dispersion caused slow loading (~100 ns) observed in the inhomogeneous or porous samples in contrast with the sharp wavefronts observed for the aluminum samples and the relatively rapid loading (~50 ns) for the iron and octahedrite samples. Combined with dispersive unloading, the truncation could seriously reduce the amount of the original pressure wave that actually contributes to the derived impulse. Thus, we must also consider physical errors that could affect the MBBAY calculations. The most important is likely to be the fluence to use for Φ0* = 1. Inhomogeneities are also important factors for enhancing turbulence mixing and scatter.
13.0 Conclusions Experiments using HED soft X-ray (~10 A) irradiation on meteorite and
planetary materials of astrophysical and geophysical interest indicate that consistent values can be obtained for impedance corrected CM. The reliability of EOS measurements depend on sample homogeneity, being greater for the low-porosity, kamacite-dominated metallic samples than for the more heterogeneous stony meteorite materials. Materials analyzed include representative iron and stony meteorites, magnesium rich olivine (solid and powder dunite), and Al and Fe calibration materials

34
~1-mm thick. Calculated front target surface radiation (plasma) pressures varied from 2.6 to 12.4 GPa. Based on computation, front surface (tenuous plasma) radiation CM was ~ 0.6 x 10⁻⁵ s/m. Rear surface Hugoniot pressures varied from 5.3 and 10.6 GPa for Fe and Al calibration targets, 1.7 GPa for iron meteorites, 0.5 – 1.9 GPa for stony meteorites, 0.8 GPa for Si, 1.6 - 1.9 GPa for solid dunite and 0.63 for powdered dunite. Calibration targets had much lower shock attenuation than inhomogeneous (stony) materials; 4.3 – 5.4 GPa/mm for Fe and 1.8 GPa/mm for Al. Attenuation varied from 7.9 – 9 GPa/mm in iron meteorites, 2 – 12 GPa/mm for stony meteorites, 6.1 – 5.8 GPa/mm for the solid dunite, and 7.1 GPa/mm for the powdered dunite.
Rear surface (mechanical) corrected CM based on momentum transfer varied from 1.9 – 3.1 x 10⁻⁵ s/m for stony meteorites, 2.67 x 10⁻⁵ for solid dunite, 0.49 x 10⁻⁵ for the powdered dunite, 0.82 – 1.42 x 10⁻⁵ s/m for iron meteorites, and 1.8 and 2.7 x 10⁻⁵ s/m respectively for Fe and Al calibration targets. These are consistent results with errors within the experimental measurement limitations on inhomogeneous materials used to model planetary interactions and NEO mitigation. Dunite powder had a reduced CM due to the low rate of momentum transfer from the loose material. A significant fraction of the wave arrived late enough in time that it could not be reliably measured because of the finite size of the LiF window (see Section 7). There is excellent agreement, ~1%, in CM values between the relatively homogeneous solid rock mesosiderite and equilibrated chondrite targets, but there is dispersion in CM among the three unequilibrated CV3 target samples thought to be due to the different chondrule to matrix ratios that affect the amount of momentum coupling jetting on the irradiated front surface. Also the location of the VISAR fiber optic probe will detect shock velocities ranging in value ~40% depending on where the probe is placed2, i.e. whether it is sampling the more rigid chondrule phases or the more friable and looser matrix phases. In terms of mechanical interactions solid dunite is similar to the mesosiderite and the equilibrated chondrite while powdered dunite may be thought of as an extreme case of an unequilibrated chondrite.
A key fluence level is approximately 10 Φ0, ~ 10 x the energy per area required to vaporize the target absorption depth. In this regime, CM ∝ Φ(1/2). At lower fluences, errors in Φ0 are due to material strength and phase change thermodynamics. At higher fluencies further increases in fluence are partitioned into additional kinetic energy T of the ejecta and turbulent mixing. Present studies are performed at Φ ≈ 1000 Φ0 where ejection modeling is less susceptible to errors from material heterogeneities or Φ0 than for the lower fluences used. It is thought the majority of the discrepancy is due to finite sample and window size, ablation-driven turbulent mixing and resulting limits on velocity integration time (requiring us to truncate an integration). Overall, the MBBAY calculations discussed are consistent with the theoretical analysis and comparable with the experimental values for CM(I) for the CV3 and octahedrite meteorites.
Theoretical results indicate an asymptotic slight (monotonic) decrease consistent with equations (5a) and (6); i.e. CM ∝ I-1/8 after a maximum CM(I) is achieved as shown in Hammerling and Remo10. At lower intensities phase transition energy of the ejected material dominates. As I increases, CM (I) also increases up to a maximum value. At higher intensities more radiation energy is partitioned into ejecta kinetic energy and total momentum transfer slowly increases. At very high intensities more energy is lost to re-radiation and related effects and CM (I) slowly decreases, but total momentum transfer

35
continues to increase10 with CM ∝ I-1/8 and specific impulse (momentum/area) ∝ FRad1/2.
The CM(I) for targets below or above the range of experimental values considered here and the MBBAY results agree within less than a factor of 2 in variation except for the two (heterogeneous) octahedrite meteorites. Similar dichotomies appear for the CV3 and octahedrite meteorites. Additional experiments at higher and lower intensities for the different targets will resolve the dichotomies.
14.0 Future Research Future experiments aspiring to characterize the response of inhomogeneous
materials to HED soft X-rays should use spatially resolved diagnostics such as line-imaging VISAR to allow more precise conclusions to be drawn on distinct material response to the X-ray flux. This can be achieved by using multipoint or line-imaging diagnostics. Alternatively, wave averaging methods such as a thin Al or Fe buffer could be used; however, this is less desirable due to the small sizes of samples and windows.
Sample recovery would allow post irradiation chemical and texture analysis on target microstructures to study phase transformation, zone melting, hydrodynamics, and turbulent mixing driven species migration. For example, similar experiments could be performed on thicker solid and powder dunite and stony meteorites and dunite/iron powders where the samples are recovered by using a fast electric shutter to seal off the target from the plasma pinch debris. If this is not possible post irradiation analysis may be able to distinguish between soft-x-ray and exploding plasma wire effects on very thick targets.
It would be worthwhile to separate the effects of line emissions and thermal radiation (perhaps through the use of thin Kapton windows). The deposition depths differ significantly for these two types of radiation, and consequently, the coupling physics differs as well. To further explore the enhanced momentum coupling and CM associated with finely powdered materials additional experiments on lunar soil simulants, powdered Fe, and powdered dunite should be carried out with the intention of sample recovery.
Appendix 1. Detailed petrographic descriptions of samples.
Fe-Ni meteorites The Fe-Ni (Odessa) iron meteorite samples used in these experiments are prepared from a fragment from an impact ~50,000 years ago (late Pleistocene) in Odessa, Texas. It is a typical coarse octahedrite (Og). The primary mineral phases are iron-nickel alloys, Ni-depleted bcc-phase kamacite (90%), and Ni-rich fcc phases, taenite, and plessite. Other common minerals are schriebersite ( (Fe,Ni)3P), troilite (iron sulfite) nodules mixed with graphite, graphite nodules, and cohenite (iron carbide). Acoustic P and S wave velocity profiles for Odessa indicate wave propagation speeds corresponding to different material phases2. The Fe-Ni meteorite Hugoniot response is dominated by a single crystal kamacite phase with bulk octahedral properties. Mechanical impacts over a stress range

36
2 – 20 GPa indicate loading strength, α to ε transition signatures similar to Armco iron and no evidence for ductile to brittle transition at extremely high loading rates (Furnish et al., 1994, 1995). Under Z-pinch x-radiation FeNi meteorites yielded relations between PH (Hugoniot pressure) vs. up (particle velocity) and us (wave speed) vs. up shown in table 4 and Figures 3 and 4. These values agree with those of the Hugoniot states for the Henbury medium Octahedrite19,20. The Odessa coarse octahedrites irradiated in the Z-pinch experiments had lower stress levels than did the Armco iron values due to mineral inclusions. Fe and Al calibration samples yielded consistent results compared with mechanical impact21 and had much lower pressure gradients, 9.5 to ~5.3 GPa for Fe and 12.4 to 10.6 GPa for Al over a 1 mm travel distance, than did Fe meteorites. Stony meteorites Tests were conducted with three stony meteorites: CV3 [Allende] chondrite, [Vacamuerta] mesosiderite, and [Tuxtuac] LL6 refractory chondrite. The CV3 sample was loose and friable, by contrast with the stronger (metamorphosed) LL6 refractory chondrite and mesosiderite. Their mineralogy is as follows22: 1. The CV3 has a density of 2.91 g/cm3 and is composed of large chondrules surrounded by lighter and darker matrices. The former matrix appears to be magnesium rich olivine while the latter appears to be composed of Ca-rich clino-pyroxene (Ca[Fe,Mg]2Si2O6) quenched from a melt with phenocrysts of olivine ([Fe~0.1Mg~0.9]2SiO4 in equilibrium. Fe-Ni, pyrite, troilite and pyrhotite were also observed. 2. The mesosiderite, with a density of 3.6 g/cm3, is a fine grained and irregular highly altered material via brecciation, and recrystallization is composed primarily of calcium feldspar anorthite (CaAl2Si2O8 ), but also appears to contain apatite (Ca3PO4), pyroxene, chromite, fine grained Fe-Ni, troilite, and pyrhotite. By contrast with the refractory chondrite, it is non-magnetic. 3. The refractory chondrite, with a density of 3.02 g/cm3, is a low metal chondrite with Ca-rich clinopyroxene refractory crystals and olivine phases with pyroxene in exosolution, and feldspar. The friability of the CV3 sample may have enhanced front surface jetting, affecting momentum transfer. Primitive CV3 meteorites also have steep, energy absorbing pressure gradients while the (stronger) metamorphosed targets have smaller pressure gradients. These materials and most natural terrestrial minerals are dominated by pores and grain boundaries that scatter shock wave fronts differently for each specimen, affecting the observed waveforms. The velocimetry diagnostic method used (point VISAR) unfortunately does not give information about the point-to-point variation in velocity history, or about where in that variation the observed point lies. Line-imaging VISAR may obviate this difficulty. In some cases such when many different phases and/or inhomogeneities are present it may be preferable to use simple rear surface (mechanical) gross displacement measurements23. Dunite Dunite is a dense polycrystalline igneous (plutonic) rock comprised mainly of olivine, a magnesium silicate. The present samples, from Almklovdalen, Norway, consist of >90% typically large (0.1 to 0.5 mm) olivine grains of forsterite composition (Fo 93.1 +/- 0.5, NiO ~0.4 wt. %), some large (0.1 to 0.5 mm) chlorite grains (a few percent), rare (<1%)

37
grains of orthopyroxene (~50 μm) and chromite (<10 μm), chemically and mechanically consistent except for occasional inhomogeneities. The dunite powder consisted of mostly relatively large olivine ( ~50 – 300 μm) and a few percent large (~100 – 300 μm) chlorite crystals derived from the same mineral source. This material was used both with an initial density of 3.30 g/cm3 and powdered and compressed form at a density 2.78 g/cm3 with ~20% porosity and a size range of 5 – 300 μm.
Appendix 2. Brief explanation of front-surface spall and non-blowoff momentum
“Front-surface spall” and “non-blowoff momentum” may be unfamiliar terms. When a very short-duration (relative to material shock response) pulsed radiation load deposits its energy in a solid target, the resultant energy deposition profile is usually a decreasing exponential with target depth. If the intensity is sufficient to vaporize the front surface, then that surface will be explosively blown off. In the remaining target material a compression wave will propagate in the downstream direction. Typically it will have a ramp loading, evolving into a shock wave, followed by a slow fall-off to a near-zero value. If the longitudinal stress of the wave profile is integrated with time at a specific position, the resultant value will be a momentum that is related to the “blowoff impulse” generated by the vaporized material. Now consider the case where the instantaneous exponential energy deposition profile is insufficient to vaporize the front surface. This could occur due to a low fluence, or a material absorption coefficient that spreads the exponential deposition profile over a much greater distance. A pressure or shock wave will still be generated due to thermal heating and expansion, and its integral will also yield a momentum. However, this momentum cannot be related to the blowoff impulse, because there is none. Its pressure profile will be somewhat analogous to a shock wave incident on a free surface, where a “phase reversal” in pressure occurs. That is, it will consist of a compressive portion followed by a mirror-like tensile portion. If the tensile amplitude is large enough, the front surface could fracture in a fashion similar 33399to the classic rear-surface spall. This is the origin of “front-surface spall.” The result of this is that any pressure-history integration to measure impulse must be examined carefully to ensure that reasonable account is taken for both blowoff and non-blowoff portions of the momentum. Most situations will consist of a mixture of the above two cases. However, in the limiting conditions of very high or very low energy fluences, one or the other of the above two situations may be safely neglected.

38
References
1J. L. Remo and M. D. Furnish, High intensity x-ray coupling to meteorite targets, in Shock Compression of Condensed Matter, M. D. Furnish, N.N. Thadni, and Y. Hories eds., J. Impact Engrg. , AIP Conf. Proc., vol 620, 1410-1413, 2002 2J. L. Remo and M. D. Furnish, M. D., 2008, Analysis of z-pinch shock wave experiments on meteorites and planetary materials, International Journal of Impact Engineering 35, 1516–1521, 2008. 3S. Atzeni and J. Meyer-ter-Vehn, The Physics of Inertial Fusion, Clarendon press, Oxford, 2004. 4J. Lindl, Physics of Plasmas, vol 11, # 2, 3933, 1995. 5B. Jones, personal communication, 2004. 6J. L. Remo, M. I. Petaev, and S. B. Jacobsen, Experimental simulation of high P-T planetary processes: physics of laser induced shocks in solid and powdered targets, Lunar and Planet. Sci, 39, #1420, 2008. 7Hertel, E. S. Jr.; Bell, R. L.; Elrick, M. G; Farnsworth, A. V.; Kerley, G. I.; McGlaun, J. M.; Petney, S. V.; Silling, S. A.; Taylor, P. A.; and Yarrington, L., CTH: A Software Family for Multi-Dimensional Shock Physics Analysis, Proceedings of the 19th International Symposium on ShockWaves, Volume 1, pages 377-382, Marseilles, France, 26-30 July 1993. 8M. L. Petaev, personal communication, 2010. 9R. G. McQueen, S. P. Marsh, J. W. Taylor, J. W., J. N. Fritz, and W. J. Carter, The equation of state of solids from shock wave studies, pp. 293 – 417 in R. Kinslow, High-Velocity Impact Phenomena, Academic Press, 1970. 10D. H. Dolan, Foundations of VISAR analysis, Sandia National Laboratories report, SAND2006-1950 (p. 54), 2006. 11B. P. Shafer, M. D. Garcia, R. A. Managan, J. L. Remo, C. E. Rosenkilde, R. J. Scammon, C. M. Snell, and R. F. Stellingwerf, The coupling of energy to asteroids and comets, pp. 955-1012 in Hazards Due to Comets and Asteroids, T. Gehrels ed., Univ. Arizona Press , Tucson Az, 955, 1994. 12B. P. Shafer, M. D. Garcia, R. A. Managan, J. L. Remo, C. E. Rosenkilde, R. J. Scammon, C. M. Snell, and R. F. Stellingwerf, Momentum coupling to NEOs, pp. 552-565 in Near-Earth Objects, The United Nations International Conference, J. L. Remo ed.,
39
Annals of the N. Y. Academy of Science, 822, N.Y. 1997. 13C. D. Newlander, et al., Nuclear Hardness Evaluation Procedures (NHEP) Program, Phase 1: Analytic Technique Survey, AFWL-TR-78-18, Air Force Weapons Laboratory, Kirtland AFB, NM, 1978. 14P. Hammerling and J. L. Remo, NEO interaction with nuclear radiation, Acta Astronautica, 36, 337-346, 1995. 15R. J. Lawrence, The Equivalence of Simple Models for Radiation-Induced Impulse, pp. 757-788 in Shock Compression of Condensed Matter 1991, S. C. Schmidt et al., Eds., Elsevier Science Publishers B.V., 1992. 16R. Lowen, et al., XRAY Radiation Transport Program (User’s Handbook), Horizons Technology, Inc., San Diego, CA, DNA-EH92-012-G-V1 (HTI-SDR-92-051), Defense Nuclear Agency, Alexandria, VA, 1993. 17C. A. Hall, J. R. Asay, M. D. Knudson, D.B. Hayes, R. L. Lemke, J. P. Davis and C. Deeney, Recent advances in quasi-isentropic compression experiments (ICE) on the Sandia Z accelerator, pp. 1163 – 1168 in M. D. Furnish, N. N. Thadhani and Y. Horie, Shock Compression of Condensed Matter – 2001, AIP Press, 2002. 18C. A. Hall, J. R. Asay, M. D. Knudson, W. A. Strygar, R. B. Speilman, T. D. Pointon, D. B. Reisman, A. Toor, R. C. Cauble, Experimental configuration for isentropic compression of solids using pulsed magnetic loading, Rev. Sci. Instr, 72, 3587-3595, 2001. 19M. D. Furnish, G. T. Gray III, and J. L. Remo, Dynamical behavior of octahedrite from the Henbury meteorite, pp. 819-822 in High Pressure Science and Technology, S.C. Schmidt, J. W. Shaner, G. A. Samara, and M. Ross (eds), AIP Press, 1994.
20M. D. Furnish, M. B. Boslough, G. T. Gray III, and J. L. Remo, Dynamic properties measurement for asteroids, comets, and meteorite material applicable to impact modeling and mitigation calculations, Int. J. Impact Engrg., 17, 341-352, 1995. 21M. A. Meyer, Dynamic Behavior of Materials, Wiley, NY, 1994. 22J. L. Remo, High-power-pulsed 1054-nm laser induced shock pressure and momentum, and energy coupling to iron-nickel and stony meteorites, Laser and Particle Beams, 17, 25-44, 1999. 23J. L. Remo and R. G. Adams, High energy density laser interactions with planetary and astrophysical materials: methodology and data, Proceedings of the SPIE – The International Society for Optical Engineering, 7005, 70052M-1-11, 2008.

40
Distribution Internal: 1 MS 0110 Dept. 1610 G. S. Heffelfinger 1 MS 0370 Dept. 1433 M. B. Boslough 1 MS 0378 Dept. 1431 M. E. Kipp 1 MS 1152 Dept. 1653 M. Caldwell 1 MS 1168 Dept. 1656 B. V. Oliver 1 MS 1178 Dept. 1613 M. L. Keifer 1 MS 1181 Dept. 1650 L. X. Schneider 5 MS 1185 Dept. 5417 R. J. Lawrence 1 MS 1186 Dept. 1640 M. Herrmann 1 MS 1189 Dept. 1641 D. G. Flicker 1 MS 1190 Dept. 1600 M. K. Matzen 1 MS 1191 Dept. 1670 J. L. Porter 1 MS 1192 Dept. 1678 F. W. Long 1 MS 1193 Dept. 1672 B.W. Atherton 1 MS 1193 Dept. 1643 M. E. Cuneo 1 MS 1193 Dept. 1672 M. Geissel 1 MS 1193 Dept. 1643 B. M. Jones 1 MS 1193 Dept. 1646 G. T. Leifeste 1 MS 1195 Dept. 1647 C. Scott Alexander 1 MS 1195 Dept. 1647 T. Ao 1 MS 1195 Dept. 1646 J. R. Asay 1 MS 1195 Dept. 1646 J.-P. Davis 1 MS 1195 Dept. 1646 D. H. Dolan III 10 MS 1195 Dept. 1646 M. D. Furnish 1 MS 1195 Dept. 1646 M. D. Knudson 1 MS 1195 Dept. 1646 S. Root 1 MS 1195 Dept. 1646 J. L. Wise 1 MS 1196 Dept. 1677 R. J. Leeper 1 MS 1196 Dept. 1675 G. A. Rochau 1 MS 1196 Dept. 1671 W. A. Stygar 1 MS 1202 Dept. 5935 C. A. Coverdale 1 MS 0899 Technical Library (electronic copy) External: 1 Greg Canavan, MS H847, Los Alamos National Laboratory, PO Box 1661, Los Alamos NM 87545 1 Todd Ditmire, Dept. of Physics, College of Natural Sci., UT Austin, 1 University Station, Austin TX 78712 1 Stein Jacobsen Harvard, FAS Earth & Planetary Sci., Hoffman Lab, 20 Oxford St, Cambridge MA 02138 1 M. I. Petaev, FAS-Harvard, Hoffman Lab 208, 20 Oxford St, Cambridge MA 02138 10 J. L. Remo, 9 Anasazi Trails Rd, Placitas NM 87043-8766 1 Barry P. Shafer, 13 Piedra Loop. Los Alamos NM 87544-3827


![SAND2010-0815 Energy Storage for the Electrical Grid[1]](https://img.pdfslide.net/doc/110x75/577cd8fa1a28ab9e78a265f4/sand2010-0815-energy-storage-for-the-electrical-grid1.jpg)

