Embed Size (px)
Citation preview
3
SAND2002-2916Unlimited Release
Printed September 2002
The Navruz Project: Monitoring for Radionuclides and Metalsin Central Asia Transboundary Rivers
End of Year One Reports
Bekhzad Yuldashev, Umar Salikhbaev, and Raisa Radyuk Institute of Nuclear Physics,
Tashkent, Uzbekistan
Akram Djuraev and Anwar DjuraevAtomic Energy Agency
Tajik Academy of SciencesDushanbe, Tajikistan
Ivan Vasiliev, Bajgabyl Tolongutov and Alekhina ValentinaInstitute of PhysicsBishkek, Kyrgystan
Vladimir Solodukhin and Victor PozniakInstitute of Nuclear Physics
Almaty, Kazakhstan
AbstractThe Navruz Project is a cooperative, transboundary, river monitoring project involving rivers andinstitutions in Kazakhstan, Kyrgyzstan, Tajikistan, and Uzbekistan facilitated by Sandia NationalLaboratories in the U.S. The Navruz Project focuses on waterborne radionuclides and metals because oftheir importance to public health and nuclear materials proliferation concerns in the region. Dataobtained in this project are shared among all participating countries and the public through an internetweb site and are available for use in further studies and in regional transboundary water resourcemanagement efforts. Overall, the project addresses three main goals: to help increase capabilities inCentral Asian nations for sustainable water resources management; to provide a scientific basis forsupporting nuclear transparency and non-proliferation in the region; and to help reduce the threat ofconflict in Central Asia over water resources, proliferation concerns, or other factors.
The Navruz project has a duration of three years. This document contains the reports from each of theparticipating institutions following the first year of data collection. While a majority of samples from theNavruz project are within normal limits, a preliminary anaylsis does indicate a high concentration ofselenium in the Kazakhstan samples. Uzbekistan samples contain high uranium and thoriumconcentrations, as well as elevated leves of chromium, antimony and cesium. Additionally, elevatedconcentrations of radioactive isotopes have been deteced at one Tajikistan sampling location. Furtheranaylsis will be published in a subsequent report.
4
Table of ContentsAcronyms & Abbreviations ..........................................................................................................7
Executive Summary .......................................................................................................................8
Kazakhstan .....................................................................................................................................9
1. Introduction..................................................................................................................................92. Sampling Locations......................................................................................................................93. Methods and facilities ................................................................................................................104. Results........................................................................................................................................145. Conclusion .................................................................................................................................15
Uzbekistan ....................................................................................................................................38
1. Introduction................................................................................................................................392. Sampling Locations....................................................................................................................403. Hydrolab Field Data Collection Log..........................................................................................434. Preliminary Results:...................................................................................................................455. Preliminary Conclusion: ............................................................................................................60
Tajikistan......................................................................................................................................61
1. Introduction................................................................................................................................612. Description of sampling locations .............................................................................................633. Experiment preparation and conduct .........................................................................................654. Technical developments.............................................................................................................655. Preliminary results .....................................................................................................................66Appendix 1. Observation Sites ......................................................................................................68Appendix 2: Average HMS Data ...................................................................................................75Appendix 3. "Floating laboratory" for the ship Narvuz .................................................................76
Kyrgyzstan....................................................................................................................................80
Distribution: .................................................................................................................................85
5
Figures
Figure 1. Distribution of natural radionuclides (238U and 232Th families) along the Syrdarya riverbed (a-soil, b-bottom sediments)............................................................................................14
Figure 2. Project Manager B.S.Yuldashev.....................................................................................39Figure 3. Project Supervisor R.I. Radyuk ......................................................................................39Figure 4. Sampling Locations ........................................................................................................41Figure 5. Water sampling on Chirchik River.................................................................................42Figure 6. Sampling of bottom sediment. Syr-Darya, Chinaz .........................................................42Figure 7. Chemical parameters determination using HYDROLAB. Chirchik River.....................42Figure 8. Flow discharge measurements using FLOWMETER. Chirchik River...........................44Figure 9. Flow discharge measurements using FLOWMETER. Chirchik River...........................45Figure 10. Water Specific beta-activity, Syr Darya River..............................................................45Figure 11. Salt Concentration, Syr Darya River ............................................................................46Figure 12. Water Specific alpha activity, Syr Darya River............................................................46Figure 13. Salt Concentration, Amu Darya River..........................................................................47Figure 14. Water specific beta-activity, Amu Darya River............................................................47Figure 15. Salt Concentration, Amu Darya River..........................................................................48Figure 16. Water specific alpha-activity, Amu Darya River..........................................................48Figure 17. Bottom Sediment specific activity, Syr Darya River, Bq/kg ........................................49Figure 18. Soil specific activity, Syr Darya River, Bq/kg..............................................................49Figure 19. Bottom sediments specific activity, Amu Darya River, Bq/kg.....................................50Figure 20. Soil specific activity, Amu Darya River, Bq/kg ...........................................................50Figure 21. U238 and Ra226 in bottom sediments, Syr Darya River, Bq/kg..................................51Figure 22. U238 and Ra226 in soil, Syr Darya River, Bq/kg.........................................................51Figure 23. U238 and Ra226 in bottom sediments, Amu Darya River, Bq/kg ...............................52Figure 24. U238 and Ra226 in bottom sediments, Amu Darya River, Bq/kg ...............................52Figure 25. K40 in bottom sediment and soil, Syr Darya River, Bq/kg ..........................................53Figure 26. Th232 in bottom sediment and soil, Syr Darya River, Bq/kg.......................................53Figure 27. K40 in bottom sediment and soil, Amy Darya River, Bq/kg........................................54Figure 28. Th232 in bottom sediment and soil, Amu Darya River, Bq/kg ....................................54Figure 29. Radioactivity of Uzbekistan vegetation, Bq/kg ............................................................55Figure 30. Content of Sediment .....................................................................................................55Figure 31. Alpha and beta radioactivity measurements using NRR-610. Analyst E.D. Vdovina .56Figure 32. Sampling expedition, V.S. Vasilieva, A. Rakhimbayev, E.D. Vdovina, O.A. Smolkova56Figure 33. Water sample preparation. Analyst S.I. Yatsenko .......................................................56Figure 34. Activation analysis of samples .....................................................................................57Figure 35. Neutron Activation analyst L.I. Zhuk..........................................................................58Figure 36. Neutron Activation analyst A.A. Kist..........................................................................58Figure 37. Neutron Activation analyst E.A. Danilova ...................................................................58Figure 38. Water dissolved Na., Syr Darya River, mg/L ...............................................................59Figure 39. Th concentrations in bottom sediment, SyrDarya, Autum, mg.kg ...............................59Figure 40. Deputy Director, Uzbekistan Institute of Nuclear Physics, U.S. Salikhbayev .............60
6
Tables
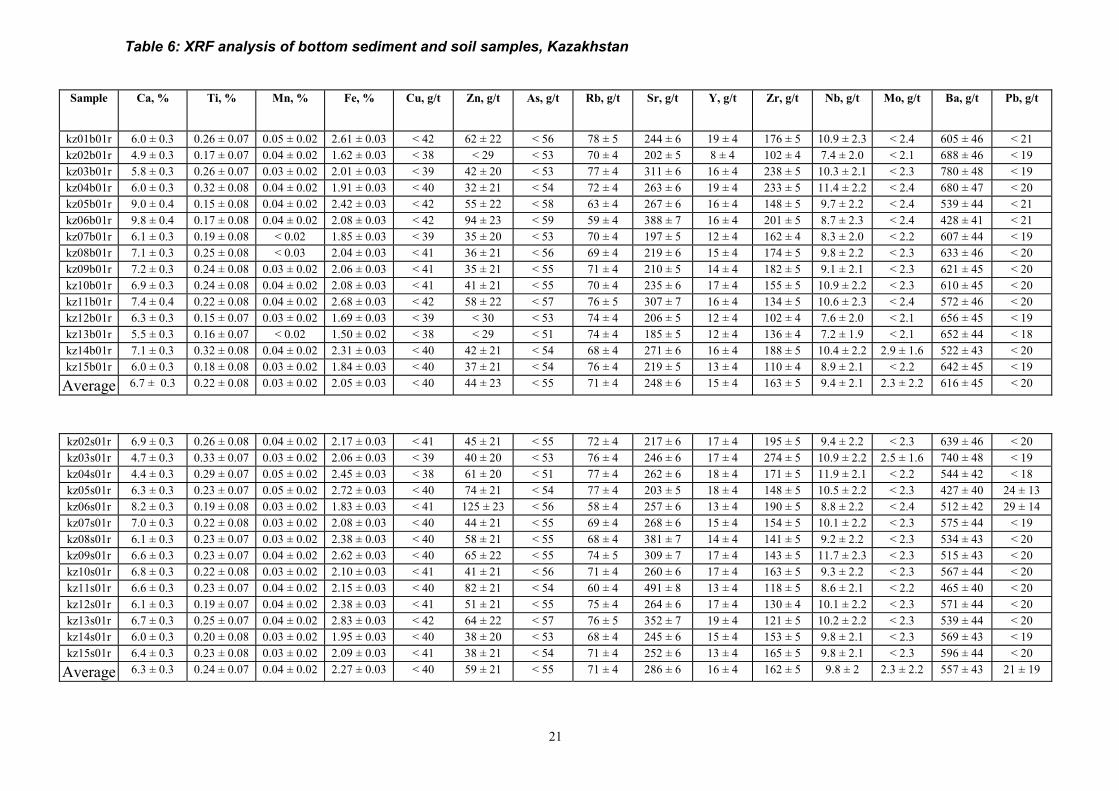
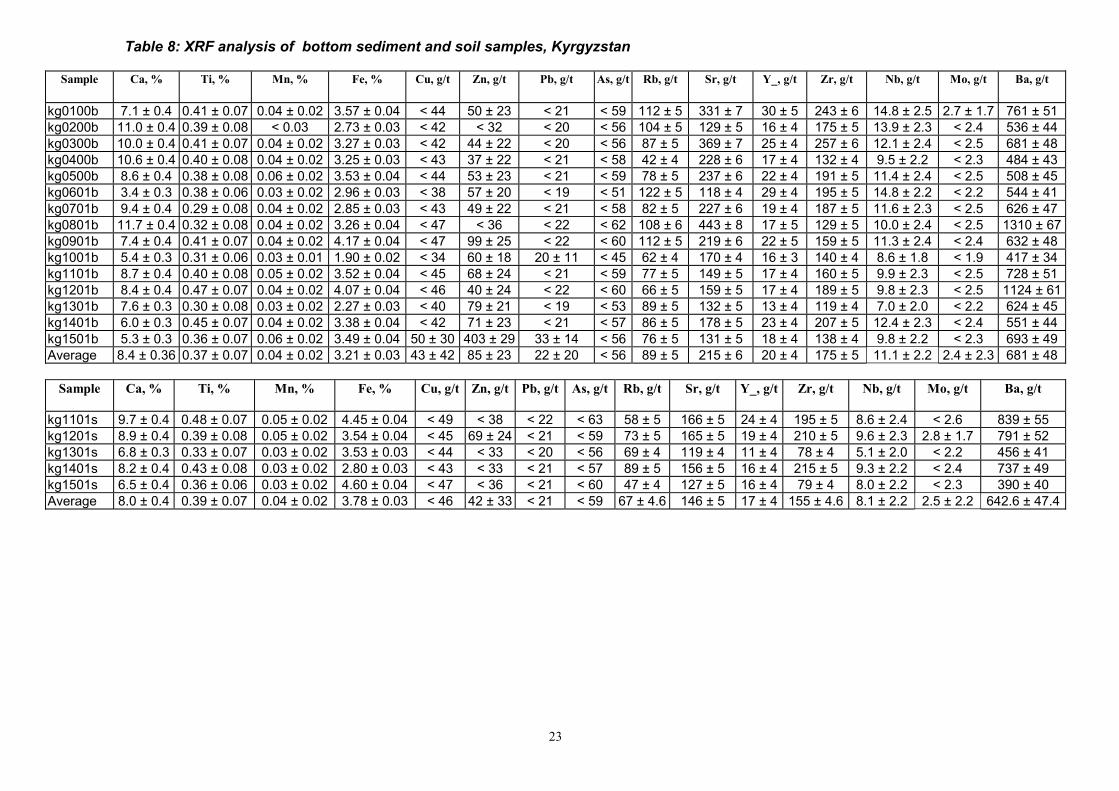
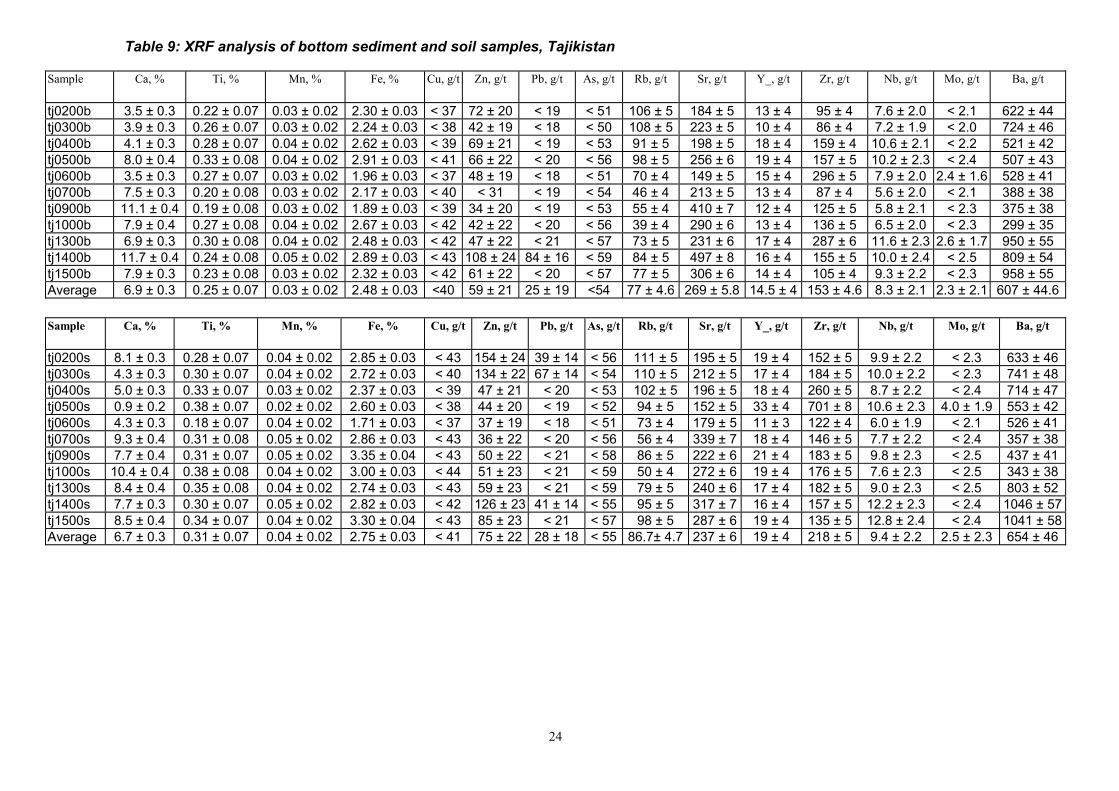
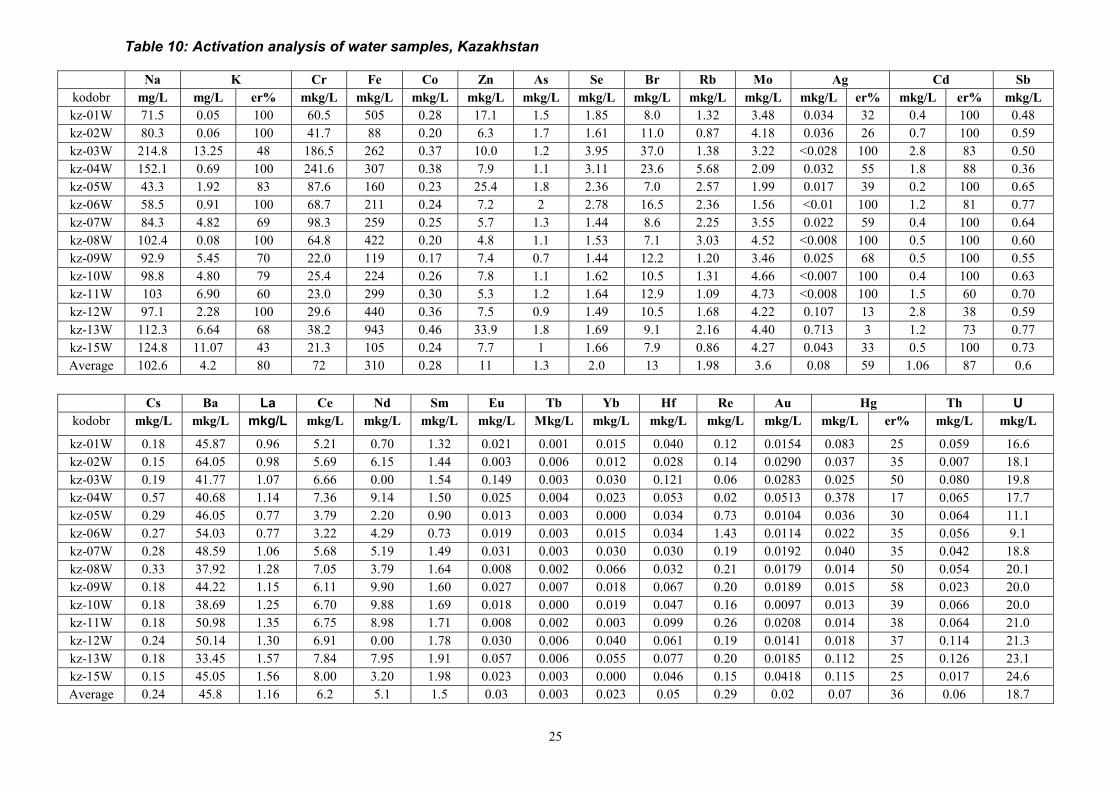
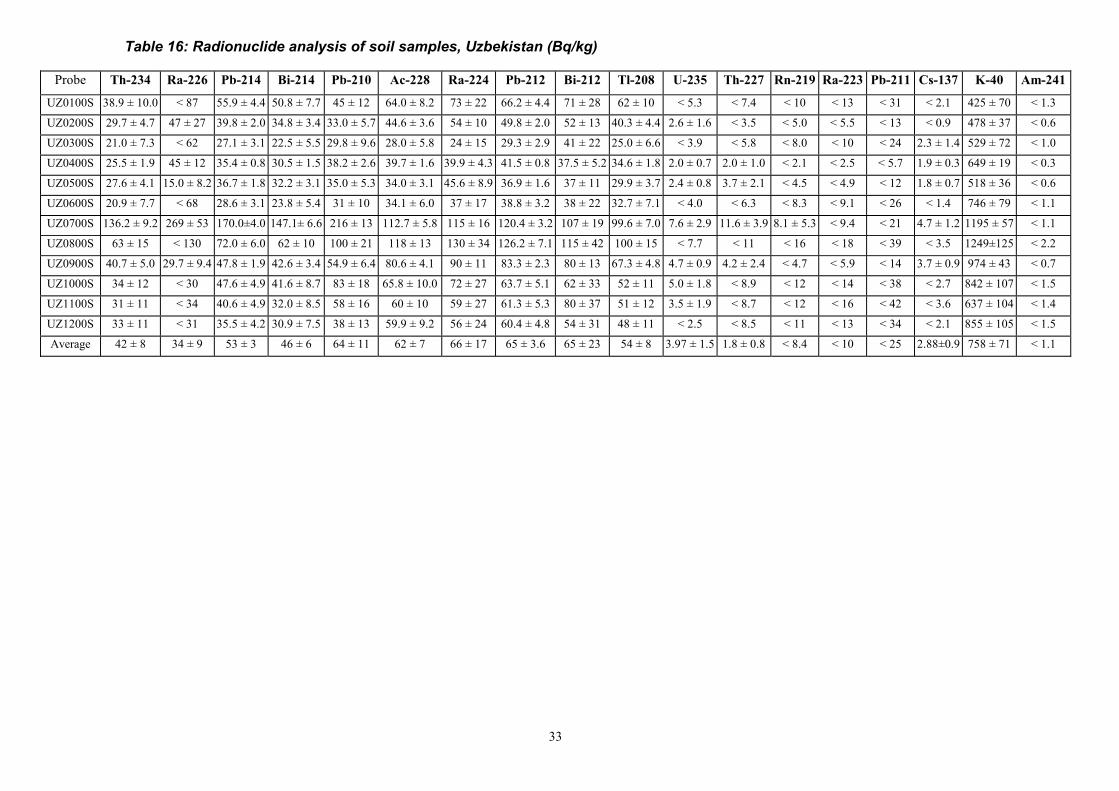
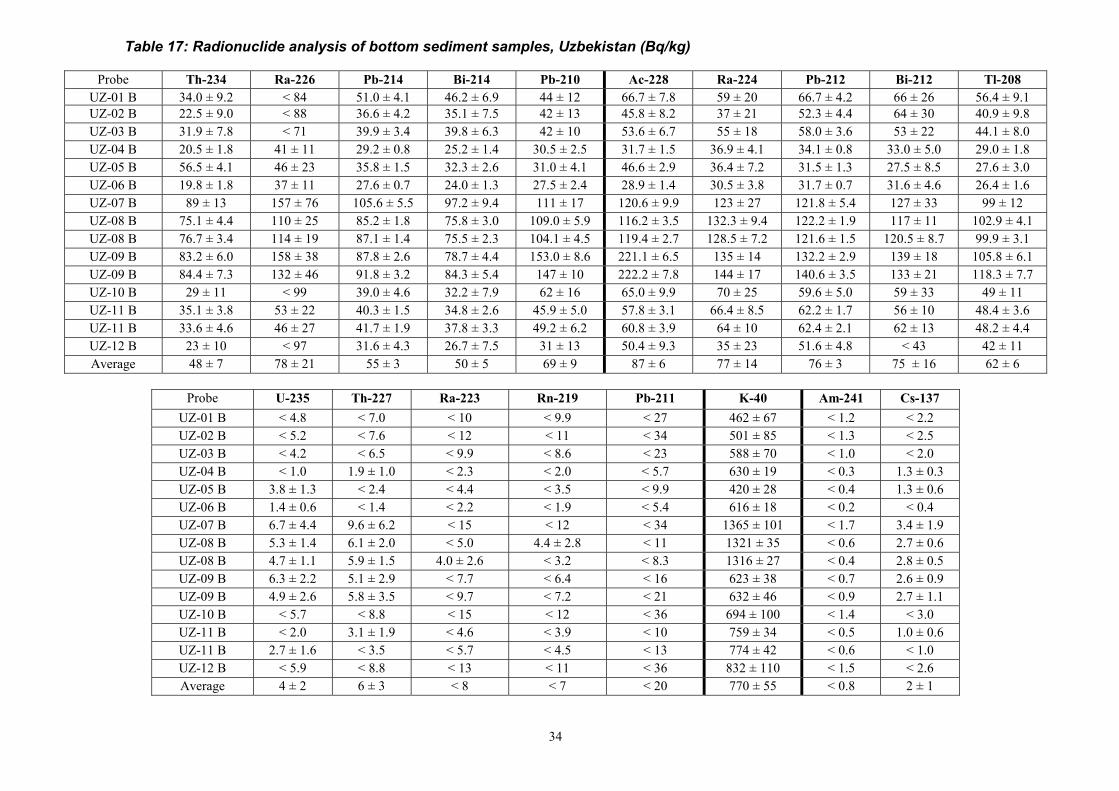
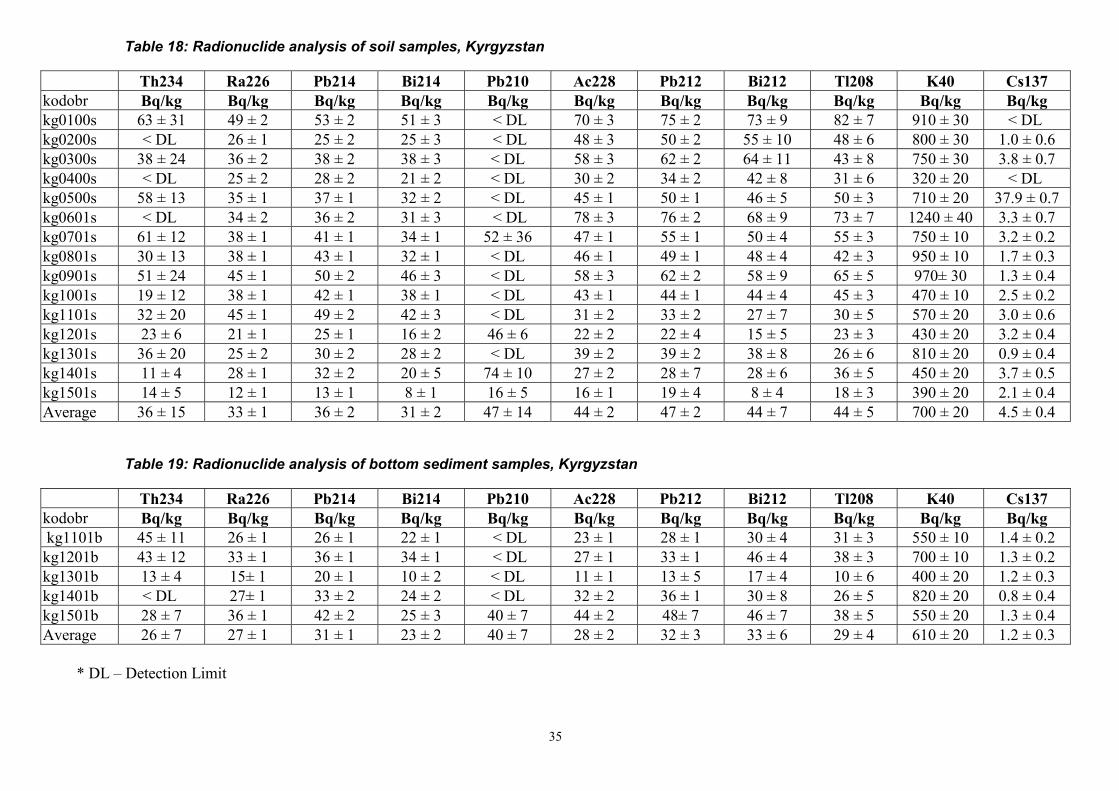
Table 1:Characteristics of spectrometric equipment used for analysis ..................................11Table 2: Characteristics of determinate nuclides and used gamma lines...............................12Table 3: Determination of macro- and microcomponents in water, Kazakhstan..................17Table 4: Determination of macro- and microcomponents in water , Kazakhstan.................18Table 5: XRF analysis of bottom sediment, soil, and vegetation samples, Kazakhstan ........19Table 6: XRF analysis of bottom sediment and soil samples, Kazakhstan.............................21Table 7: XRF analysis of bottom sediment and soil samples, Uzbekistan..............................22Table 8: XRF analysis of bottom sediment and soil samples, Kyrgyzstan ............................23Table 9: XRF analysis of bottom sediment and soil samples, Tajikistan ...............................24Table 10: Activation analysis of water samples, Kazakhstan ..................................................25Table 11: Activation analysis of bottom sediments, Kazakhstan ............................................26Table 12: Activation analysis of soils and vegetation, Kazakhstan.........................................28Table 13: Radionuclide analysis of water samples, Kazakhstan (mBq/l) ...............................30Table 14: Radionuclide content (Bq/kg) of soil samples, Kazakhstan ....................................31Table 15: Radionuclide content (Bq/kg) of bottom sediment samples, Kazakhstan .............32Table 16: Radionuclide analysis of soil samples, Uzbekistan (Bq/kg) ....................................33Table 17: Radionuclide analysis of bottom sediment samples, Uzbekistan (Bq/kg)..............34Table 18: Radionuclide analysis of soil samples, Kyrgyzstan..................................................35Table 19: Radionuclide analysis of bottom sediment samples, Kyrgyzstan ...........................35Table 20: Radionuclide analysis of water samples, Kyrgyzstan.............................................36Table 21: Radionuclide analysis of soil samples, Tajikistan....................................................37Table 22: Radionuclide analysis of bottom sediment samples, Tajikistan .............................37
7
Acronyms & Abbreviations
Bq/kg Becqerels per kilogram
DL Detection Limit
IAEA International Atomic Energy Agency
INP NNC RK Institute of Nuclear Physics, Kazakstan
g/t grams per ton
LNPAM laboratory of nuclear-physical analysis methods
mBq/l milli Becquerqels per liter
mkg/g microkilograms per gram
NAA Neutron activation analysis
XRF/XRFA X-ray-fluorescent analysis
8
Executive Summary
The experiment described in this report, named Navruz (meaning “new beginning”), monitorsbasic water quality parameters, radionuclides and metals in the Syrdarya and Amudarya riversand their major tributaries. These rivers are crucial for domestic, agricultural and industrial usethroughout Central Asia.
Participating countries, the Central Asian states of Kazakhstan, Uzbekistan, Kyrgyzstan andTajikistan, are collecting water, bottom sediment, vegetation, and soil samples from a total of 60stations along the rivers. These samples are then sent to laboratories in Kazakhstan, Uzbekistan,and the United States for analysis. Samples are also being collected at two locations along theRio Grande in central New Mexico.
Data from this project are being posted on an Internet site as they become available for use by theparticipants, scientists, and the public worldwide. The web address is:www.cmc.sandia.gov/Central/centralasia.html. The complete Sampling and Analysis Plan is alsoavailable at this address.
The Navruz experiment is aimed at serving three main objectives: � Understanding the severity and location of heavy metal, radionuclide,m and other
contaminates in the major rivers of Central Asia � Facilitating the development of scientific methodology for cooperation and understanding
of transboundary resource issues. This is a precursor to cooperative, transboundary,natural resource management.
� Facilitating regional scientific cooperation and collaboration in these newly independentrepublics of the former Soviet Union. This helps improve regional relationships andpromote cooperation on difficult issues that would enhance security and stability inCentral Asia.
The following is a report from the Institute of Nuclear Physics (INP), the Kazakhstan partner inthis project, for the first year of data collection. This report contains the results of analyticalinvestigations, obtained by the INP NNC RK during the first year of the Project realization. Alsopresented is a preliminary interpretation of these results. Final conclusions based on analysis ofenvironmental data within all four states will be presented by the end of the second year.
9
The Navruz Project: Monitoing for Radionuclides and Metalsin Central Asia Transbounday Rivers
End of Year One Report
Kazakhstan
1. IntroductionThe purpose of the international project "Navruz" is increasing nuclear transparency of theCentral Asian states of Kazakhstan, Uzbekistan, Kyrgyzstan and Tajikistan. Funding for the two-year project is through Sandia National Laboratories and the United States Department ofEnergy. The project representative on behalf of Kazakhstan is the Institute of Nuclear Physics,NNC.
The focus of the project is radiation and ecological monitoring of the Amudarya and Syrdaryarivers, whose water belongs to all the enumerated participant countries. Contamination of theserivers is a result of water pollution and radioactive contamination from uranium mining, industry,and other activities, and poses a threat to the environment and the health and safety of thoseliving nearby.
Each country determined 10-15 sampling locations. Twice in a year, in the spring and in theautumn, at each of the locations field investigations and sampling of environmental objects(water, soil, bottom sediments, and vegetation) for further laboratory investigation are conducted.Controlled parameters of the studied objects are natural and artificial radionuclides (226Ra, 228Th,210Pb, 137Cs, 90Sr, 239Pu, 241Am and etc.) and toxic dopes (U, Pb, Se, Sb, As, Be and etc.). Theanalysis is conducted by two organizations: The Institute of Nuclear Physics NNC RK(Kazakhstan, c. Almaty) and the Institute of Nuclear Physics SA UR (Uzbekistan, c. Tashkent).
2. Sampling LocationsThe Institute of Nuclear Physics NNC, as a result of thorough consideration of all geographical,geological, industrial and economical aspects related to Syrdarya river and its environment, aswell as discussion of specific geological matters with specialists on uranium exploring andmining (Industrial corporation "Volkovgeologiya") has offered the following 15 samplinglocations, for inclusion to the radiation monitoring project Navruz.
1. Syrdarya river, below junction with Keles river, abuilding bridge via Chardara reservoir.2. Syrdarya river, 1 km below Chardara reservoir dam.
Sites 1 and 2 measure the impact of economic and technogenic human activity on theenvironment (site 2) and provide a comparison with the impact of natural factors (site 1).Site 2 will also provide initial information for comparison with all other sites.
3. Keles inflow, Saryagash town (upper).4. Keles inflow, Saryagash town (lower).
10
Sites 3 and 4 will measure the environmental conditions in this resort zone (mineral watersprings).
5. Badam inflow, Shymkent town (higher), Sairam village.6. Junction Badam and Arys inflows, Shymkent town (lower).
Sites 5 and 6 measure the influence of the industrial center at Chymkent.7. Syrdarya river, opposite Turkestan town, Baltakol village
Site 7 measures the influence of agriculture activity and the status of the Turkestan canal.8. Syrdarya river, Shieli town (upper), Tomenaryk village.9. Syrdarya river, Shieli town (opposite), Bulanbaybauy village.10. Syrdarya river, Shieli town (lower), Zhuantobe village.
Sites 8,9, and 10 will measure the effect of several uranium deposits.11. Syrdarya river, Kyzylorda town (upper), Tasbuget village.12. Syrdarya river, Kyzylorda town (lower), Terenozek village.
Sites 11 and 12 will measure the impact of industrial activities in Kyzyl-Orda town.13. Syrdarya river, Dzhusaly town.
Site 13 will measure the joint influence of the towns Terenozek, Dzhalagat and Dzhusalyon the Karaozek tributary.
14. Syrdarya river, Kazalinsk town (upper), Baikozha village.Site 14 will measure the influence of activities at the Bajkonur space center.
15. Syrdarya river, Kazalinsk town (lower), Karlan village.Site 15 will provide a control on the total influence of all areas/sites and all activitiesrelated to Syrdarya River (in comparison with Site 2).
The proposed sampling locations were adopted at the project work meeting in the city ofTashkent (August 2000). In this meeting the main objects and top-priority tasks of the Projectwere viewed and approved.
This report presents the results of analytical investigations, obtained by INP NNC RK during thefirst year of the Project. Also presented is a preliminary interpretation of these results. Finalconclusions will be presented by the end of the second year.
3. Methods and facilitiesThe methods used for the analysis of samples include gamma-spectrometric radionuclide analysisand activation and X-ray-fluorescent elemental analysis. The following is a short description ofthese methods.
3.1 Radionuclide analysis
The determination of radionuclide compounds was made by gamma spectrometry, whichmeasures gamma radiation in investigated samples. The measurements were conducted usingthree types of detectors with different parameters and semiconductor detectors. Detectorcharacteristics are given in Table 1. The measurement time of each sample ranges from 3 to 30hours.
11
Table 1:Characteristics of spectrometric equipment used for analysis
Detector type and model Relativeregistration
efficiency, %
Energy resolution on1332 keV line
Coaxial GEM-2018 "PRTEC" 20 1.7Wide-range GX-1520 "CANBERRA" 15 1.9Planar "CANBERRA" BE-2020 15 1.5
Wide-range and planar detectors have thin intake windows made of soft low gamma radiationabsorbing material (beryllium and all-carbon composite respectively). This feature allowsefficient determination of radionuclides on their relative soft gamma lines, for example, 210Pb on46.5keV line and 234Th on 63.3keV line.
The soil and bottom sediments samples were dried and homogenized by milling to 150-200microns in a ball mill, and the milled sample is then quartered to obtain analytical sub sampleswith a 200gr mass. Prior to measuring, the sub samples are placed in 70mm Petri cups with abottom made of polyethylene film of 100 microns thickness. Water samples are evaporated toobtain dry radicals or strong brine and packed in 25 ml fluoroplastic with a bottom thickness of100 microns. All of the samples for analysis are placed directly on the detector intake window.The measured specters are treated by a software package for gamma spectrometric analysis,which was developed by the laboratory members and has been successfully used and testedduring last several years. This software package uses a treatment program of complex gammaand X-ray specters, using an algorithm based on the nonlinear method of the smallest squares andthe analytical description of the line apparatus form. This method, at present, assures thesmallest possible fault during determination of the full uptake peak area and consequently,maximum sensitivity in analysis. Another feature of the software package allows the calculationof gamma radiation registration total efficiency depending on geometrical sizes, detector samplematerial, and absorbents possible between them. After determination of evaporated water sampleactivities, amendments were introduced to the results, taking the concentration degree intoaccount.
Activities of radionuclides from three natural families – uranium, thorium and actinouranium –activities of the natural radionuclide 40K, and the artificial radionuclides 137Cs, and 241Am, havebeen calculated (accounting for global fall-outs after nuclear tests and Chernobyl accident). Thecharacteristics of determinate nuclides are presented in Table 2. As seen in the table, some of thenuclides had more than one sufficiently intense gamma line. In these cases, calculations werebased on a weight-average activity value – the weight of each value included in the calculationwas the reverse activity value of fault squares of activity determination.

12
Table 2: Characteristics of determinate nuclides and used gamma lines
Radionuclide Family Energy, keV Quantum yield, %234Th 238U – 206Pb 63.29 4.8226Ra 238U – 206Pb 186.211 3.59214Pb 238U – 206Pb 241.997
295.224351.932
7.4319.337.6
214Bi 238U – 206Pb 609.3121120.2871238.11
46.115.15.79
210Pb 238U – 206Pb 46.539 4.25228Ac 232Th – 208Pb 338.32
911.204968.971
11.2725.815.8
224Ra 232Th – 208Pb 240.986 4.1212Pb 232Th – 208Pb 238.632 43.3212Bi 232Th – 208Pb 727.33 6.58208Tl 232Th – 208Pb 583.191 30.42*235U 235U – 207Pb 163.33
185.72205.31
5.0857.25.01
227Th 235U – 207Pb 235.97 11.65223Ra 235U – 207Pb 269.46 13.6219Rn 235U – 207Pb 271.23
401.819.906.64
211Pb 235U – 207Pb 404.85832.01
3.833.80
211Bi 235U – 207Pb 351.06 12.7640K - 1460.75 10.67
137Cs - 661.657 85.1241Am - 59.541 35.9
*- value of 208Tl quantum yield is given by taking into account 36% branch forconvenient comparison of its activity with parent nuclide and daughter nuclide.
During the analysis of obtained results, each of natural radionuclide families was divided intoseveral subfamilies, inside of which determinate nuclides should be in the state of equilibriumeven at natural and man-caused redistribution, conditioned by physical-chemical processes in soiland water. This equilibrium is conditioned by little period of half-decay, not exceeding severalmonths or years. Examples of such groups are: 214Pb and 214Bi from uranium family; 212Pb, 212Biand 208Tl from thorium family; and 227Th, 223Ra, 219Rn, 211Pb and 211Bi from actinouraniumfamily. Activity parity of each of the radionuclide subfamilies should indicate on the one handthe correctness of the analysis, and on the other hand, provide a more objective bases forcomparison, for example of two progenitors of different subfamilies from the sight of theirequilibrium.
13
3.2 Neutron activation analysis
Elemental analysis of bottom sediments samples and water samples was conducted by neutronactivation analysis (NAA). Preliminary preparation of bottom sediment samples and waterconsisted of drying and abrasion of dry samples in a porcelain mortar. After quartering theprepared sample, analytical sub samples of 0.2 gr were selected. For NAA the selected subsamples were packed in double polyethylene packets and an aluminum container and irradiated inthe nuclear reactor. Nichrome comparators for determination of neutron fluence and specter atirradiation were placed in the same container. Irradiation of samples was conducted in theWWR-K reactor’s central channel heat rating of reactor made up 300kVt, at that the neutron fluxon the spot of irradiation made up n 1012 neutron cm-2 s-1. The irradiated samples, after a 4 day"cooling" and repacking period, were delivered for measuring.
Measurements were conducted on semiconducting gamma-spectrometers of LNPAM (laboratoryof nuclear-physical analysis methods) with a germanium detector GEM-20180 (certificate onState control #4-016/0-415 dated 26.01.99). During the first measurement the values of Na, K,Ca, As, Br, Cd, Sb, La, Sm, Au, and U were determined. The second reading was conducted in30-32 days. During the second measurement the values for Sc, Cr, Co, Fe, Zn, Se, Rb, Cs, Ba,Eu, Tb, Yb, Hf, Ta, Hg, and Th were determined. Measured simultaneously with work samplesthere were nichrom comparators and standard samples: SGD-1a, Sl-1, TM-2a, GXR-1, GXR-5,irradiated in the same container. Calculation of the element concentration was fulfilled on themeasured activities of analytical isotopes, nuclear-physical parameters (activation section, half-decay period, quantum yield of gamma-radiation) and flow data and neutrons specter, calculatedfrom results of comparators measurements.
3.3 X-ray fluorescent analysis
The X-ray-fluorescent analysis method (XRFA) was one of the methods use to characterizeelemental compounds. During the analysis of soil, bottom sediments and dry water remainderssamples after evaporation, XRFA with isotope excitation was used. As an excitation source theisotope 109Cd with activity of approximately 3mCi was used. To detect X-rays from theanalyzed elements and back scattering radiation of the excitation source, a Si(Li) detector with anactive surface of 80mm2 and resolution 180eV at 5,9keV was used. An intake detector windowwas made of beryllium with thickness of 25 micron. At the indicated characteristics ofspectrometric cluster and 30-minute exposure, the method allows simultaneous determination ofapproximately 15 elements with sensitivity from hundreds and tens to units and portions of �g/gr.Most of the elements were analyzed on K-series characteristic X-ray radiation lines, except lead,which was determined on L-series lines. Analysis samples passed standard preparation, includingdrying and homogenization and were placed in 10ml. ditches with bottom of polyethylene of100-micron thickness. The ditches for analysis were disposed on a special holder containing theexcitation source. The holder construction assured protection from direct source radiation andminimized distance between sample and detector intake window. A special program, developedby the laboratory members, treated the selected specters. For calculation of the matrix effect, aback scattering radiation of excitation source was used. For the calculation of selectiveabsorption by elements with significant concentrations (approximately 10000mkg/gr. and higher)special amendments were introduced. The correctness of the analysis tested many times on IAEAcomparison samples during several last years.
14
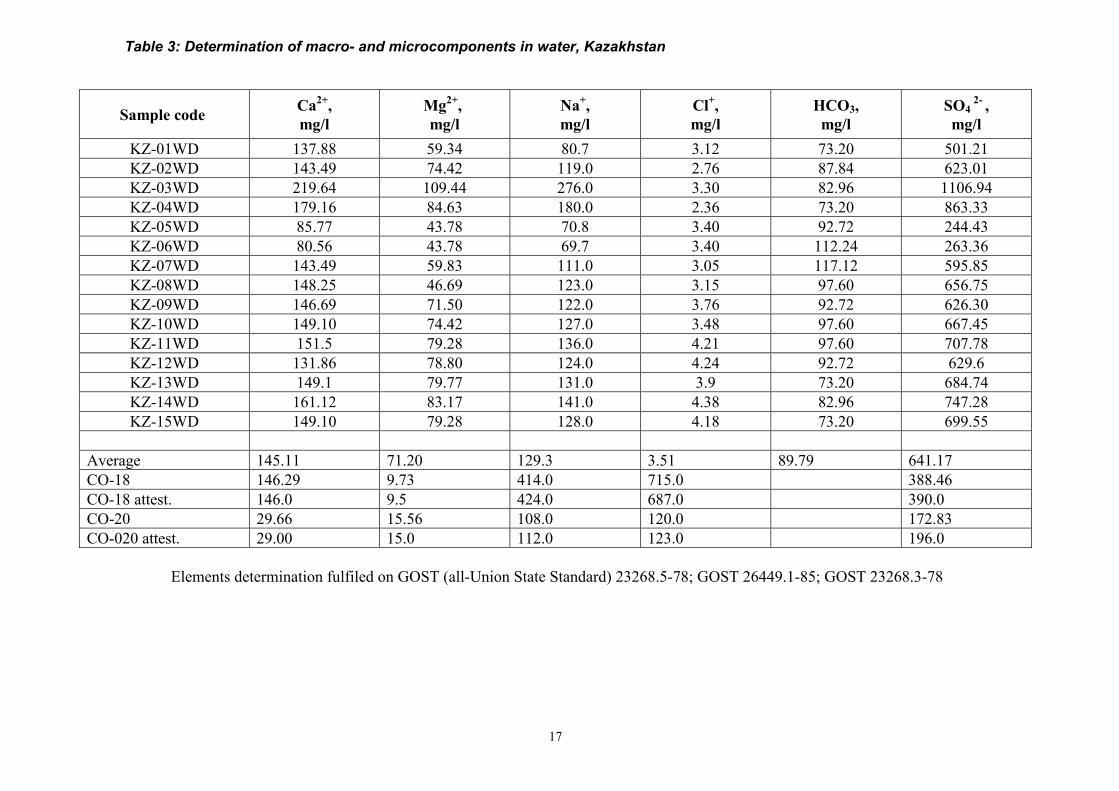
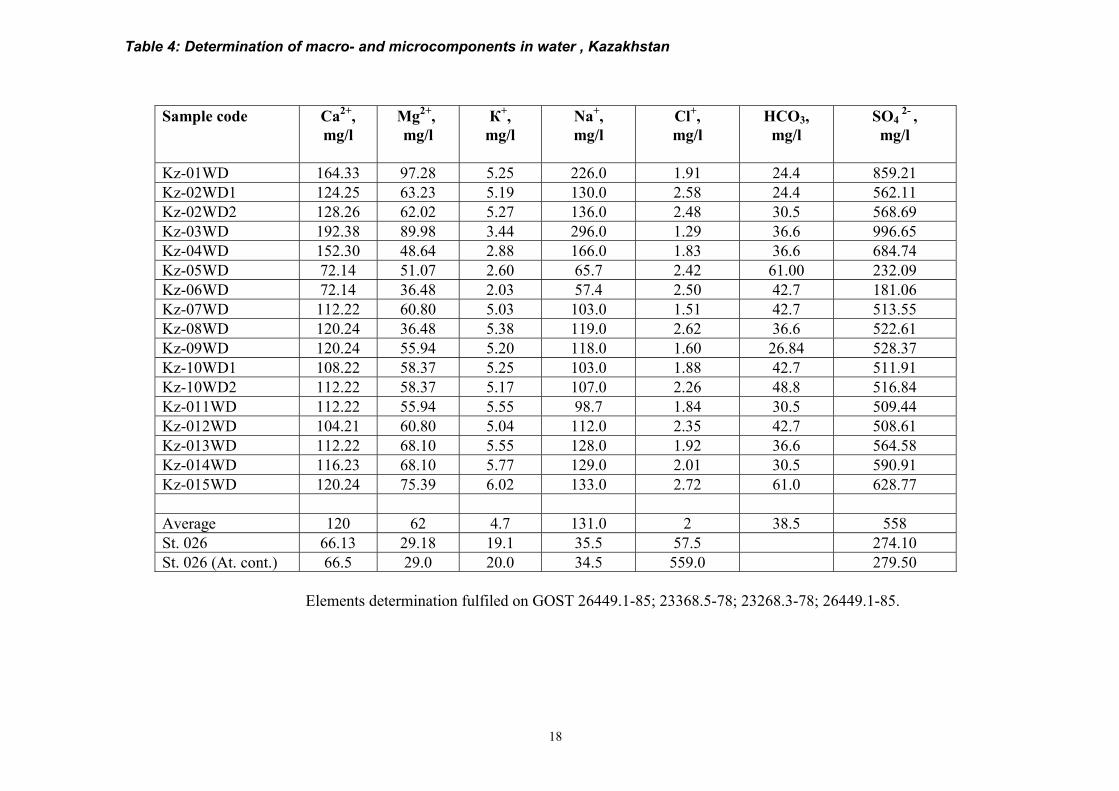
4. ResultsA potentiometric analysis (standard methods) was conducted to determine the minor and majorelements in the samples of water collected in Kazakhstan during the 1st (autumn) and 2nd (spring)sampling expeditions. The results are presented in tables 3 and 4, respectively. Comparison ofthe data indicated a higher concentration of water components in the winter than in the spring.The greatest water mineralization corresponds to Sites 3 and 4 (Sary-Agach resort).
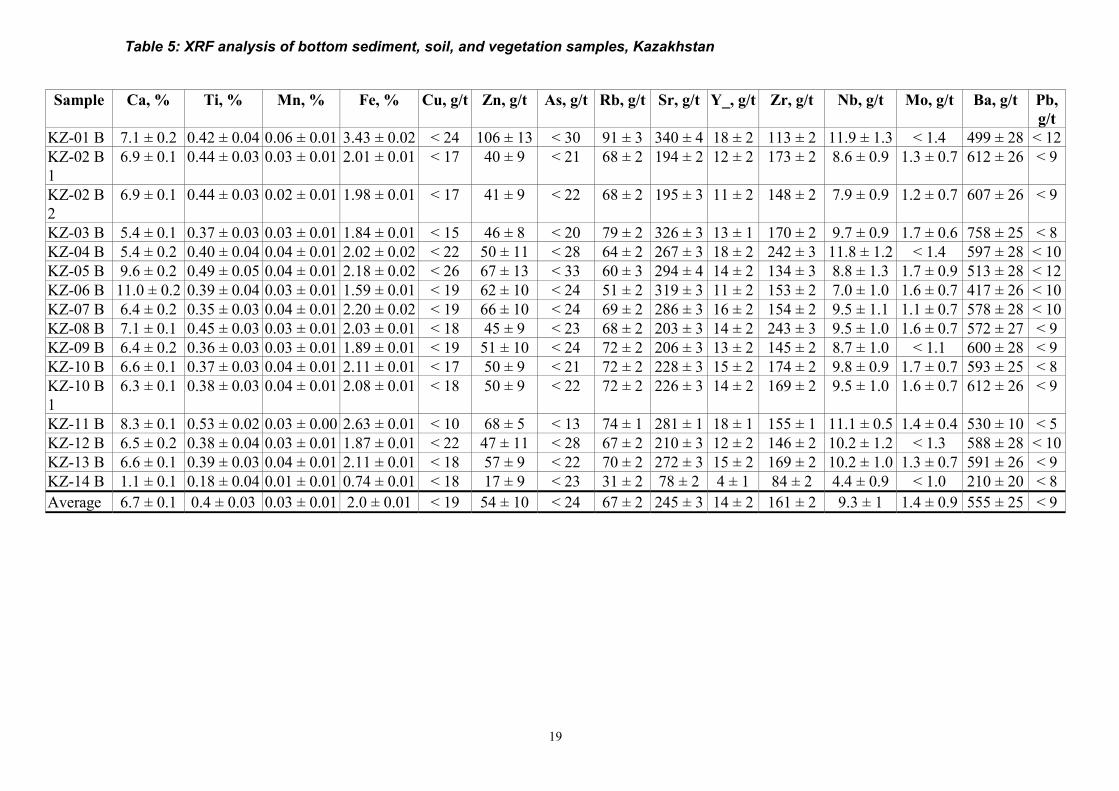
X-ray-fluorescent analysis was used analyze the bottom sediment and soil samples selected onKazakhstan territory (1st and 2nd expeditions), Uzbekistan (1st expedition), Kyrgyzstan (1st
expedition) and Tajikistan (1st expedition). The results are presented in tables 5-9, respectively.A comparison of the obtained values with values of "average concentrations for sediment rocks"indicates high concentrations of calcium in all of the studied samples of soil and sediments.
Neutron-activation analysis was used to determine compound of micro-dopes (and definitemicro-dopes) in samples of water, bottom sediments, soil and vegetation, selected on Kazakhstanterritory during the 1st expedition. The results are presented in tables10-12, respectively. Theobtained data indicated a very high content of selenium in all studied objects. The concentrationof this element in water arouses concern, as it exceeds health sanitary standards of maximaltolerant concentration (MTC-1mkg/l) for drinking water by 1.5-4 times. In some water sampleshigh concentrations of other elements are present:
� Site 13 – Fe (940 mkg/l), Ag (0,713mkg/l), Th (0.13 mkg/l);� Site 4 – Hg (0.4 mkg/l);� Sites 5 and 6 –Re (0.7-1.4 mkg/l).
The largest concentration of micro-dopes in bottom sediments corresponds to Site 1, which canbe attributed to their import with water from neighboring countries. Also, one can note asignificant concentration of As in bottom sediments and soil in the proximity of the industrialcenter of Shymkent town (Sites 4 and 5).
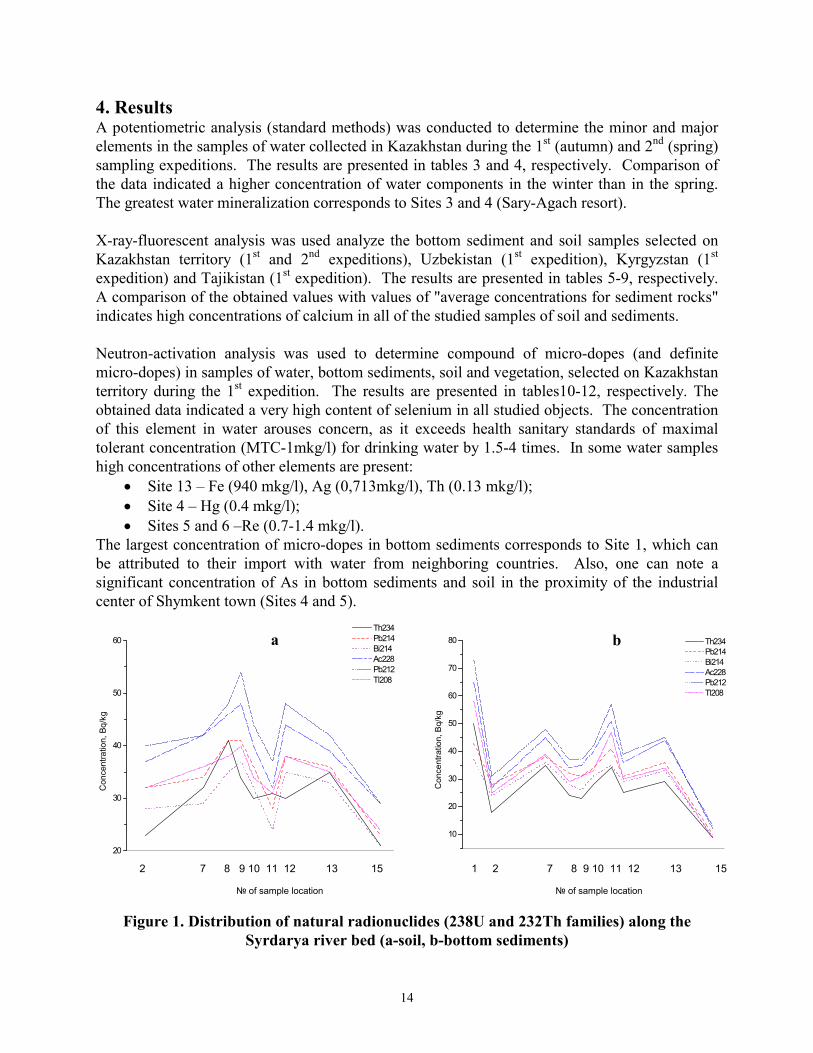
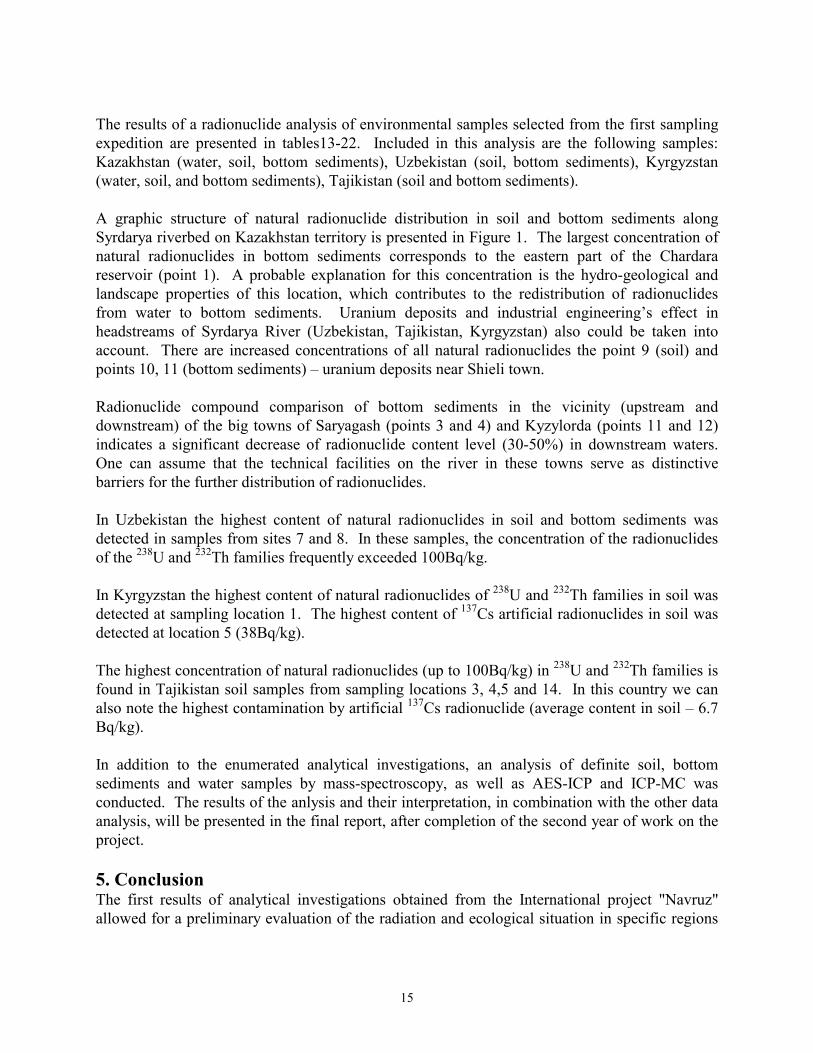
Figure 1. Distribution of natural radionuclides (238U and 232Th families) along theSyrdarya river bed (a-soil, b-bottom sediments)
1 2 7 8 9 10 11 12 13 15
10
20
30
40
50
60
70
80 Th234 Pb214 Bi214 Ac228 Pb212 Tl208
Con
cent
ratio
n, B
q/kg
№ of sample location
2 7 8 9 10 11 12 13 15
№ of sample location
20
30
40
50
60 Th234 Pb214 Bi214 Ac228 Pb212 Tl208
Con
cent
ratio
n, B
q/kg
bа
15
The results of a radionuclide analysis of environmental samples selected from the first samplingexpedition are presented in tables13-22. Included in this analysis are the following samples:Kazakhstan (water, soil, bottom sediments), Uzbekistan (soil, bottom sediments), Kyrgyzstan(water, soil, and bottom sediments), Tajikistan (soil and bottom sediments).
A graphic structure of natural radionuclide distribution in soil and bottom sediments alongSyrdarya riverbed on Kazakhstan territory is presented in Figure 1. The largest concentration ofnatural radionuclides in bottom sediments corresponds to the eastern part of the Chardarareservoir (point 1). A probable explanation for this concentration is the hydro-geological andlandscape properties of this location, which contributes to the redistribution of radionuclidesfrom water to bottom sediments. Uranium deposits and industrial engineering’s effect inheadstreams of Syrdarya River (Uzbekistan, Tajikistan, Kyrgyzstan) also could be taken intoaccount. There are increased concentrations of all natural radionuclides the point 9 (soil) andpoints 10, 11 (bottom sediments) – uranium deposits near Shieli town.
Radionuclide compound comparison of bottom sediments in the vicinity (upstream anddownstream) of the big towns of Saryagash (points 3 and 4) and Kyzylorda (points 11 and 12)indicates a significant decrease of radionuclide content level (30-50%) in downstream waters.One can assume that the technical facilities on the river in these towns serve as distinctivebarriers for the further distribution of radionuclides.
In Uzbekistan the highest content of natural radionuclides in soil and bottom sediments wasdetected in samples from sites 7 and 8. In these samples, the concentration of the radionuclidesof the 238U and 232Th families frequently exceeded 100Bq/kg.
In Kyrgyzstan the highest content of natural radionuclides of 238U and 232Th families in soil wasdetected at sampling location 1. The highest content of 137Cs artificial radionuclides in soil wasdetected at location 5 (38Bq/kg).
The highest concentration of natural radionuclides (up to 100Bq/kg) in 238U and 232Th families isfound in Tajikistan soil samples from sampling locations 3, 4,5 and 14. In this country we canalso note the highest contamination by artificial 137Cs radionuclide (average content in soil – 6.7Bq/kg).
In addition to the enumerated analytical investigations, an analysis of definite soil, bottomsediments and water samples by mass-spectroscopy, as well as AES-ICP and ICP-MC wasconducted. The results of the anlysis and their interpretation, in combination with the other dataanalysis, will be presented in the final report, after completion of the second year of work on theproject.
5. ConclusionThe first results of analytical investigations obtained from the International project "Navruz"allowed for a preliminary evaluation of the radiation and ecological situation in specific regions
16
of the participating countries. This preliminary evaluation reveals a number of peculiarities inthe distribution of radionuclides in the watershed of the Syrdarya and Amudarya rivers.
The results reveal a high concentration of selenium in the entire investigated region. The contentof this element in the Syrdarya river water notably exceeds the norm for the maximum allowableconcentration for drinking water.
Radionuclide analysis data revealed the most contaminated areas by natural radionuclides in eachparticipant country.
The remainder of the Project will further reveal the radiation situation dynamics in the Syrdaryaand Amudarya rivers watersheds.
17
Table 3: Determination of macro- and microcomponents in water, Kazakhstan
Sample code Ca2+,mg/l
Mg2+, mg/l
Na+,mg/l
Cl+,mg/l
HCO3,mg/l
SO4 2- ,
mg/lKZ-01WD 137.88 59.34 80.7 3.12 73.20 501.21KZ-02WD 143.49 74.42 119.0 2.76 87.84 623.01KZ-03WD 219.64 109.44 276.0 3.30 82.96 1106.94KZ-04WD 179.16 84.63 180.0 2.36 73.20 863.33KZ-05WD 85.77 43.78 70.8 3.40 92.72 244.43KZ-06WD 80.56 43.78 69.7 3.40 112.24 263.36KZ-07WD 143.49 59.83 111.0 3.05 117.12 595.85KZ-08WD 148.25 46.69 123.0 3.15 97.60 656.75KZ-09WD 146.69 71.50 122.0 3.76 92.72 626.30KZ-10WD 149.10 74.42 127.0 3.48 97.60 667.45KZ-11WD 151.5 79.28 136.0 4.21 97.60 707.78KZ-12WD 131.86 78.80 124.0 4.24 92.72 629.6KZ-13WD 149.1 79.77 131.0 3.9 73.20 684.74KZ-14WD 161.12 83.17 141.0 4.38 82.96 747.28KZ-15WD 149.10 79.28 128.0 4.18 73.20 699.55
Average 145.11 71.20 129.3 3.51 89.79 641.17СО-18 146.29 9.73 414.0 715.0 388.46СО-18 attest. 146.0 9.5 424.0 687.0 390.0СО-20 29.66 15.56 108.0 120.0 172.83СО-020 attest. 29.00 15.0 112.0 123.0 196.0
Elements determination fulfiled on GOST (all-Union State Standard) 23268.5-78; GOST 26449.1-85; GOST 23268.3-78
18
Table 4: Determination of macro- and microcomponents in water , Kazakhstan
Sample code Ca2+,mg/l
Mg2+, mg/l
К+,mg/l
Na+,mg/l
Cl+,mg/l
HCO3,mg/l
SO4 2- ,
mg/l
Kz-01WD 164.33 97.28 5.25 226.0 1.91 24.4 859.21Kz-02WD1 124.25 63.23 5.19 130.0 2.58 24.4 562.11Kz-02WD2 128.26 62.02 5.27 136.0 2.48 30.5 568.69Kz-03WD 192.38 89.98 3.44 296.0 1.29 36.6 996.65Kz-04WD 152.30 48.64 2.88 166.0 1.83 36.6 684.74Kz-05WD 72.14 51.07 2.60 65.7 2.42 61.00 232.09Kz-06WD 72.14 36.48 2.03 57.4 2.50 42.7 181.06Kz-07WD 112.22 60.80 5.03 103.0 1.51 42.7 513.55Kz-08WD 120.24 36.48 5.38 119.0 2.62 36.6 522.61Kz-09WD 120.24 55.94 5.20 118.0 1.60 26.84 528.37Kz-10WD1 108.22 58.37 5.25 103.0 1.88 42.7 511.91Kz-10WD2 112.22 58.37 5.17 107.0 2.26 48.8 516.84Kz-011WD 112.22 55.94 5.55 98.7 1.84 30.5 509.44Kz-012WD 104.21 60.80 5.04 112.0 2.35 42.7 508.61Kz-013WD 112.22 68.10 5.55 128.0 1.92 36.6 564.58Kz-014WD 116.23 68.10 5.77 129.0 2.01 30.5 590.91Kz-015WD 120.24 75.39 6.02 133.0 2.72 61.0 628.77
Average 120 62 4.7 131.0 2 38.5 558St. 026 66.13 29.18 19.1 35.5 57.5 274.10St. 026 (At. cont.) 66.5 29.0 20.0 34.5 559.0 279.50
Elements determination fulfiled on GOST 26449.1-85; 23368.5-78; 23268.3-78; 26449.1-85.
19
Table 5: XRF analysis of bottom sediment, soil, and vegetation samples, Kazakhstan
Sample Ca, % Ti, % Mn, % Fe, % Cu, g/t Zn, g/t As, g/t Rb, g/t Sr, g/t Y_, g/t Zr, g/t Nb, g/t Mo, g/t Ba, g/t Pb,g/t
KZ-01 B 7.1 ± 0.2 0.42 ± 0.04 0.06 ± 0.01 3.43 ± 0.02 < 24 106 ± 13 < 30 91 ± 3 340 ± 4 18 ± 2 113 ± 2 11.9 ± 1.3 < 1.4 499 ± 28 < 12KZ-02 B1
6.9 ± 0.1 0.44 ± 0.03 0.03 ± 0.01 2.01 ± 0.01 < 17 40 ± 9 < 21 68 ± 2 194 ± 2 12 ± 2 173 ± 2 8.6 ± 0.9 1.3 ± 0.7 612 ± 26 < 9
KZ-02 B2
6.9 ± 0.1 0.44 ± 0.03 0.02 ± 0.01 1.98 ± 0.01 < 17 41 ± 9 < 22 68 ± 2 195 ± 3 11 ± 2 148 ± 2 7.9 ± 0.9 1.2 ± 0.7 607 ± 26 < 9
KZ-03 B 5.4 ± 0.1 0.37 ± 0.03 0.03 ± 0.01 1.84 ± 0.01 < 15 46 ± 8 < 20 79 ± 2 326 ± 3 13 ± 1 170 ± 2 9.7 ± 0.9 1.7 ± 0.6 758 ± 25 < 8KZ-04 B 5.4 ± 0.2 0.40 ± 0.04 0.04 ± 0.01 2.02 ± 0.02 < 22 50 ± 11 < 28 64 ± 2 267 ± 3 18 ± 2 242 ± 3 11.8 ± 1.2 < 1.4 597 ± 28 < 10KZ-05 B 9.6 ± 0.2 0.49 ± 0.05 0.04 ± 0.01 2.18 ± 0.02 < 26 67 ± 13 < 33 60 ± 3 294 ± 4 14 ± 2 134 ± 3 8.8 ± 1.3 1.7 ± 0.9 513 ± 28 < 12KZ-06 B 11.0 ± 0.2 0.39 ± 0.04 0.03 ± 0.01 1.59 ± 0.01 < 19 62 ± 10 < 24 51 ± 2 319 ± 3 11 ± 2 153 ± 2 7.0 ± 1.0 1.6 ± 0.7 417 ± 26 < 10KZ-07 B 6.4 ± 0.2 0.35 ± 0.03 0.04 ± 0.01 2.20 ± 0.02 < 19 66 ± 10 < 24 69 ± 2 286 ± 3 16 ± 2 154 ± 2 9.5 ± 1.1 1.1 ± 0.7 578 ± 28 < 10KZ-08 B 7.1 ± 0.1 0.45 ± 0.03 0.03 ± 0.01 2.03 ± 0.01 < 18 45 ± 9 < 23 68 ± 2 203 ± 3 14 ± 2 243 ± 3 9.5 ± 1.0 1.6 ± 0.7 572 ± 27 < 9KZ-09 B 6.4 ± 0.2 0.36 ± 0.03 0.03 ± 0.01 1.89 ± 0.01 < 19 51 ± 10 < 24 72 ± 2 206 ± 3 13 ± 2 145 ± 2 8.7 ± 1.0 < 1.1 600 ± 28 < 9KZ-10 B 6.6 ± 0.1 0.37 ± 0.03 0.04 ± 0.01 2.11 ± 0.01 < 17 50 ± 9 < 21 72 ± 2 228 ± 3 15 ± 2 174 ± 2 9.8 ± 0.9 1.7 ± 0.7 593 ± 25 < 8KZ-10 B1
6.3 ± 0.1 0.38 ± 0.03 0.04 ± 0.01 2.08 ± 0.01 < 18 50 ± 9 < 22 72 ± 2 226 ± 3 14 ± 2 169 ± 2 9.5 ± 1.0 1.6 ± 0.7 612 ± 26 < 9
KZ-11 B 8.3 ± 0.1 0.53 ± 0.02 0.03 ± 0.00 2.63 ± 0.01 < 10 68 ± 5 < 13 74 ± 1 281 ± 1 18 ± 1 155 ± 1 11.1 ± 0.5 1.4 ± 0.4 530 ± 10 < 5KZ-12 B 6.5 ± 0.2 0.38 ± 0.04 0.03 ± 0.01 1.87 ± 0.01 < 22 47 ± 11 < 28 67 ± 2 210 ± 3 12 ± 2 146 ± 2 10.2 ± 1.2 < 1.3 588 ± 28 < 10KZ-13 B 6.6 ± 0.1 0.39 ± 0.03 0.04 ± 0.01 2.11 ± 0.01 < 18 57 ± 9 < 22 70 ± 2 272 ± 3 15 ± 2 169 ± 2 10.2 ± 1.0 1.3 ± 0.7 591 ± 26 < 9KZ-14 B 1.1 ± 0.1 0.18 ± 0.04 0.01 ± 0.01 0.74 ± 0.01 < 18 17 ± 9 < 23 31 ± 2 78 ± 2 4 ± 1 84 ± 2 4.4 ± 0.9 < 1.0 210 ± 20 < 8Average 6.7 ± 0.1 0.4 ± 0.03 0.03 ± 0.01 2.0 ± 0.01 < 19 54 ± 10 < 24 67 ± 2 245 ± 3 14 ± 2 161 ± 2 9.3 ± 1 1.4 ± 0.9 555 ± 25 < 9

20
Sample Ca, % Ti, % Mn, % Fe, % Cu,g/t
Zn, g/t As, g/t Rb, g/t Sr, g/t Y_, g/t Zr, g/t Nb, g/t Mo, g/t Ba, g/t Pb,g/t
KZ-02 S 7.6 ± 0.2 0.44 ± 0.03 0.04 ± 0.01 2.06 ± 0.01 < 19 53 ± 10 < 24 77 ± 2 204 ± 3 14 ± 2 158 ± 2 9.8 ± 1.0 1.8 ± 0.7 645 ± 28 < 9KZ-02 S1 6.2 ± 0.1 0.40 ± 0.03 0.03 ± 0.01 1.92 ± 0.01 < 18 47 ± 9 < 23 69 ± 2 189 ± 3 13 ± 2 163 ± 2 9.1 ± 1.0 1.2 ± 0.7 620 ± 27 < 9KZ-02 S2 6.5 ± 0.1 0.42 ± 0.03 0.03 ± 0.01 1.97 ± 0.01 < 18 48 ± 9 < 23 70 ± 2 192 ± 3 14 ± 2 163 ± 2 9.1 ± 1.0 1.2 ± 0.7 627 ± 27 < 9KZ-03 S 5.9 ± 0.1 0.49 ± 0.03 0.05 ± 0.01 2.16 ± 0.01 < 18 49 ± 9 < 23 81 ± 2 256 ± 3 18 ± 2 284 ± 3 11.8 ±
1.11.8 ± 0.8 772 ± 30 < 9
KZ-04 S 4.6 ± 0.1 0.38 ± 0.03 0.05 ± 0.01 2.27 ± 0.01 < 18 63 ± 9 < 22 76 ± 2 227 ± 3 18 ± 2 224 ± 3 10.9 ±1.0
1.5 ± 0.7 622 ± 27 < 9
KZ—05 S 6.6 ± 0.1 0.36 ± 0.03 0.05 ± 0.01 2.51 ± 0.02 < 18 93 ± 10 < 22 70 ± 2 208 ± 3 18 ± 2 150 ± 2 10.3 ±1.0
1.8 ± 0.7 466 ± 24 26 ± 6
KZ-06 S 8.8 ± 0.2 0.36 ± 0.04 0.03 ± 0.01 1.62 ± 0.01 < 19 53 ± 10 < 24 51 ± 2 247 ± 3 13 ± 2 159 ± 2 8.0 ± 1.0 1.8 ± 0.7 392 ± 25 < 9KZ-07 S 8.0 ± 0.2 0.43 ± 0.03 0.04 ± 0.01 2.41 ± 0.02 < 19 73 ± 10 < 24 73 ± 2 309 ± 3 17 ± 2 164 ± 2 10.1 ±
1.11.7 ± 0.8 574 ± 28 < 10
KZ-08 S 7.6 ± 0.2 0.46 ± 0.03 0.05 ± 0.01 2.72 ± 0.02 < 20 77 ± 10 < 25 79 ± 2 362 ± 4 19 ± 2 155 ± 2 11.4 ±1.1
1.6 ± 0.8 611 ± 28 < 10
KZ-09 S 6.6 ± 0.2 0.44 ± 0.05 0.04 ± 0.01 2.36 ± 0.02 < 26 75 ± 13 < 32 67 ± 3 312 ± 4 17 ± 2 151 ± 3 10.4 ±1.3
< 1.4 569 ± 29 < 12
KZ-10 S1 6.0 ± 0.1 0.36 ± 0.03 0.04 ± 0.01 2.44 ± 0.02 < 19 74 ± 10 < 24 72 ± 2 397 ± 4 15 ± 2 132 ± 2 9.8 ± 1.0 2.8 ± 0.7 560 ± 27 30 ± 7KZ-10 S2 6.0 ± 0.2 0.36 ± 0.03 0.04 ± 0.01 2.38 ± 0.02 < 19 82 ± 10 < 25 72 ± 2 392 ± 4 15 ± 2 135 ± 2 9.6 ± 1.1 2.6 ± 0.8 563 ± 28 32 ± 7KZ-11 S 7.0 ± 0.2 0.44 ± 0.05 0.04 ± 0.01 2.38 ± 0.02 < 25 74 ± 13 < 31 68 ± 3 288 ± 3 16 ± 2 149 ± 3 10.4 ±
1.31.5 ± 0.9 534 ± 28 < 11
KZ-12 S 7.0 ± 0.2 0.45 ± 0.05 0.05 ± 0.01 2.73 ± 0.02 < 28 104 ± 14 < 35 71 ± 3 452 ± 4 16 ± 3 113 ± 3 9.6 ± 1.3 2.1 ± 0.9 480 ± 28 53 ± 9KZ-13 S 6.7 ± 0.2 0.39 ± 0.04 0.04 ± 0.01 2.33 ± 0.02 < 23 73 ± 12 < 30 61 ± 2 461 ± 4 14 ± 2 116 ± 3 9.8 ± 1.2 < 1.3 393 ± 26 < 11KZ-15 S 3.0 ± 0.1 0.33 ± 0.04 0.02 ± 0.01 1.77 ± 0.01 < 20 40 ± 10 < 25 50 ± 2 157 ± 2 12 ± 2 144 ± 2 8.4 ± 1.1 < 1.2 345 ± 23 < 9Average 6.5 ± 0.16 0.4 ± 0.04 0.04 ± 0.01 2.25 ± 0.02 < 20 67 ± 11 < 26 69 ± 2 291 ± 3 16 ± 2 160 ± 2 9.9 ± 1.1 1.7 ± 0.9 548 ± 27 16 ± 9KZ-06 V 11.5 ± 0.2 0.52 ± 0.05 0.04 ± 0.01 2.06 ± 0.02 < 25 75 ± 13 < 32 51 ± 2 472 ± 4 14 ± 2 153 ± 3 8.9 ± 1.3 < 1.5 427 ± 27 < 12Av. conc.
forsediments
2.5 0.45 0.07 3.33 57 80 6.6 200 450 30 200 20 2.0 800 -
21
Table 6: XRF analysis of bottom sediment and soil samples, Kazakhstan
Sample Ca, % Ti, % Mn, % Fe, % Cu, g/t Zn, g/t As, g/t Rb, g/t Sr, g/t Y, g/t Zr, g/t Nb, g/t Mo, g/t Ba, g/t Pb, g/t
kz01b01r 6.0 ± 0.3 0.26 ± 0.07 0.05 ± 0.02 2.61 ± 0.03 < 42 62 ± 22 < 56 78 ± 5 244 ± 6 19 ± 4 176 ± 5 10.9 ± 2.3 < 2.4 605 ± 46 < 21kz02b01r 4.9 ± 0.3 0.17 ± 0.07 0.04 ± 0.02 1.62 ± 0.03 < 38 < 29 < 53 70 ± 4 202 ± 5 8 ± 4 102 ± 4 7.4 ± 2.0 < 2.1 688 ± 46 < 19kz03b01r 5.8 ± 0.3 0.26 ± 0.07 0.03 ± 0.02 2.01 ± 0.03 < 39 42 ± 20 < 53 77 ± 4 311 ± 6 16 ± 4 238 ± 5 10.3 ± 2.1 < 2.3 780 ± 48 < 19kz04b01r 6.0 ± 0.3 0.32 ± 0.08 0.04 ± 0.02 1.91 ± 0.03 < 40 32 ± 21 < 54 72 ± 4 263 ± 6 19 ± 4 233 ± 5 11.4 ± 2.2 < 2.4 680 ± 47 < 20kz05b01r 9.0 ± 0.4 0.15 ± 0.08 0.04 ± 0.02 2.42 ± 0.03 < 42 55 ± 22 < 58 63 ± 4 267 ± 6 16 ± 4 148 ± 5 9.7 ± 2.2 < 2.4 539 ± 44 < 21kz06b01r 9.8 ± 0.4 0.17 ± 0.08 0.04 ± 0.02 2.08 ± 0.03 < 42 94 ± 23 < 59 59 ± 4 388 ± 7 16 ± 4 201 ± 5 8.7 ± 2.3 < 2.4 428 ± 41 < 21kz07b01r 6.1 ± 0.3 0.19 ± 0.08 < 0.02 1.85 ± 0.03 < 39 35 ± 20 < 53 70 ± 4 197 ± 5 12 ± 4 162 ± 4 8.3 ± 2.0 < 2.2 607 ± 44 < 19kz08b01r 7.1 ± 0.3 0.25 ± 0.08 < 0.03 2.04 ± 0.03 < 41 36 ± 21 < 56 69 ± 4 219 ± 6 15 ± 4 174 ± 5 9.8 ± 2.2 < 2.3 633 ± 46 < 20kz09b01r 7.2 ± 0.3 0.24 ± 0.08 0.03 ± 0.02 2.06 ± 0.03 < 41 35 ± 21 < 55 71 ± 4 210 ± 5 14 ± 4 182 ± 5 9.1 ± 2.1 < 2.3 621 ± 45 < 20kz10b01r 6.9 ± 0.3 0.24 ± 0.08 0.04 ± 0.02 2.08 ± 0.03 < 41 41 ± 21 < 55 70 ± 4 235 ± 6 17 ± 4 155 ± 5 10.9 ± 2.2 < 2.3 610 ± 45 < 20kz11b01r 7.4 ± 0.4 0.22 ± 0.08 0.04 ± 0.02 2.68 ± 0.03 < 42 58 ± 22 < 57 76 ± 5 307 ± 7 16 ± 4 134 ± 5 10.6 ± 2.3 < 2.4 572 ± 46 < 20kz12b01r 6.3 ± 0.3 0.15 ± 0.07 0.03 ± 0.02 1.69 ± 0.03 < 39 < 30 < 53 74 ± 4 206 ± 5 12 ± 4 102 ± 4 7.6 ± 2.0 < 2.1 656 ± 45 < 19kz13b01r 5.5 ± 0.3 0.16 ± 0.07 < 0.02 1.50 ± 0.02 < 38 < 29 < 51 74 ± 4 185 ± 5 12 ± 4 136 ± 4 7.2 ± 1.9 < 2.1 652 ± 44 < 18kz14b01r 7.1 ± 0.3 0.32 ± 0.08 0.04 ± 0.02 2.31 ± 0.03 < 40 42 ± 21 < 54 68 ± 4 271 ± 6 16 ± 4 188 ± 5 10.4 ± 2.2 2.9 ± 1.6 522 ± 43 < 20kz15b01r 6.0 ± 0.3 0.18 ± 0.08 0.03 ± 0.02 1.84 ± 0.03 < 40 37 ± 21 < 54 76 ± 4 219 ± 5 13 ± 4 110 ± 4 8.9 ± 2.1 < 2.2 642 ± 45 < 19
Average 6.7 ± 0.3 0.22 ± 0.08 0.03 ± 0.02 2.05 ± 0.03 < 40 44 ± 23 < 55 71 ± 4 248 ± 6 15 ± 4 163 ± 5 9.4 ± 2.1 2.3 ± 2.2 616 ± 45 < 20
kz02s01r 6.9 ± 0.3 0.26 ± 0.08 0.04 ± 0.02 2.17 ± 0.03 < 41 45 ± 21 < 55 72 ± 4 217 ± 6 17 ± 4 195 ± 5 9.4 ± 2.2 < 2.3 639 ± 46 < 20kz03s01r 4.7 ± 0.3 0.33 ± 0.07 0.03 ± 0.02 2.06 ± 0.03 < 39 40 ± 20 < 53 76 ± 4 246 ± 6 17 ± 4 274 ± 5 10.9 ± 2.2 2.5 ± 1.6 740 ± 48 < 19kz04s01r 4.4 ± 0.3 0.29 ± 0.07 0.05 ± 0.02 2.45 ± 0.03 < 38 61 ± 20 < 51 77 ± 4 262 ± 6 18 ± 4 171 ± 5 11.9 ± 2.1 < 2.2 544 ± 42 < 18kz05s01r 6.3 ± 0.3 0.23 ± 0.07 0.05 ± 0.02 2.72 ± 0.03 < 40 74 ± 21 < 54 77 ± 4 203 ± 5 18 ± 4 148 ± 5 10.5 ± 2.2 < 2.3 427 ± 40 24 ± 13kz06s01r 8.2 ± 0.3 0.19 ± 0.08 0.03 ± 0.02 1.83 ± 0.03 < 41 125 ± 23 < 56 58 ± 4 257 ± 6 13 ± 4 190 ± 5 8.8 ± 2.2 < 2.4 512 ± 42 29 ± 14kz07s01r 7.0 ± 0.3 0.22 ± 0.08 0.03 ± 0.02 2.08 ± 0.03 < 40 44 ± 21 < 55 69 ± 4 268 ± 6 15 ± 4 154 ± 5 10.1 ± 2.2 < 2.3 575 ± 44 < 19kz08s01r 6.1 ± 0.3 0.23 ± 0.07 0.03 ± 0.02 2.38 ± 0.03 < 40 58 ± 21 < 55 68 ± 4 381 ± 7 14 ± 4 141 ± 5 9.2 ± 2.2 < 2.3 534 ± 43 < 20kz09s01r 6.6 ± 0.3 0.23 ± 0.07 0.04 ± 0.02 2.62 ± 0.03 < 40 65 ± 22 < 55 74 ± 5 309 ± 7 17 ± 4 143 ± 5 11.7 ± 2.3 < 2.3 515 ± 43 < 20kz10s01r 6.8 ± 0.3 0.22 ± 0.08 0.03 ± 0.02 2.10 ± 0.03 < 41 41 ± 21 < 56 71 ± 4 260 ± 6 17 ± 4 163 ± 5 9.3 ± 2.2 < 2.3 567 ± 44 < 20kz11s01r 6.6 ± 0.3 0.23 ± 0.07 0.04 ± 0.02 2.15 ± 0.03 < 40 82 ± 21 < 54 60 ± 4 491 ± 8 13 ± 4 118 ± 5 8.6 ± 2.1 < 2.2 465 ± 40 < 20kz12s01r 6.1 ± 0.3 0.19 ± 0.07 0.04 ± 0.02 2.38 ± 0.03 < 41 51 ± 21 < 55 75 ± 4 264 ± 6 17 ± 4 130 ± 4 10.1 ± 2.2 < 2.3 571 ± 44 < 20kz13s01r 6.7 ± 0.3 0.25 ± 0.07 0.04 ± 0.02 2.83 ± 0.03 < 42 64 ± 22 < 57 76 ± 5 352 ± 7 19 ± 4 121 ± 5 10.2 ± 2.2 < 2.3 539 ± 44 < 20kz14s01r 6.0 ± 0.3 0.20 ± 0.08 0.03 ± 0.02 1.95 ± 0.03 < 40 38 ± 20 < 53 68 ± 4 245 ± 6 15 ± 4 153 ± 5 9.8 ± 2.1 < 2.3 569 ± 43 < 19kz15s01r 6.4 ± 0.3 0.23 ± 0.08 0.03 ± 0.02 2.09 ± 0.03 < 41 38 ± 21 < 54 71 ± 4 252 ± 6 13 ± 4 165 ± 5 9.8 ± 2.1 < 2.3 596 ± 44 < 20
Average 6.3 ± 0.3 0.24 ± 0.07 0.04 ± 0.02 2.27 ± 0.03 < 40 59 ± 21 < 55 71 ± 4 286 ± 6 16 ± 4 162 ± 5 9.8 ± 2 2.3 ± 2.2 557 ± 43 21 ± 19

22
Table 7: XRF analysis of bottom sediment and soil samples, Uzbekistan
Sample Ca, % Ti, % Mn, % Fe, % Cu, g/t Zn, g/t As, g/t Rb, g/t Sr, g/t Y_, g/t Zr, g/t Nb, g/t Mo, g/t Ba, g/t Pb, g/t
UZ-01 B 8.6 ± 0.3 0.75 ± 0.06 0.04 ± 0.01 3.05 ± 0.02 < 30 55 ± 15 < 40 60 ± 3 274 ± 4 24 ± 3 349 ± 4 11.3 ± 1.6 2.7 ± 1.2 417 ± 28 < 14UZ-02 B 7.8 ± 0.3 0.55 ± 0.05 0.03 ± 0.01 3.08 ± 0.02 < 29 66 ± 15 < 39 70 ± 3 254 ± 4 18 ± 3 180 ± 3 9.7 ± 1.6 < 1.6 385 ± 27 < 14UZ-03 B 5.3 ± 0.2 0.46 ± 0.05 0.03 ± 0.01 2.92 ± 0.02 < 28 61 ± 14 < 36 68 ± 3 221 ± 4 20 ± 3 185 ± 3 11.5 ± 1.5 < 1.6 359 ± 25 < 13UZ-04 B 7.8 ± 0.2 0.50 ± 0.05 0.03 ± 0.01 2.11 ± 0.02 < 27 54 ± 14 < 37 72 ± 3 191 ± 4 13 ± 3 139 ± 3 8.7 ± 1.4 < 1.5 758 ± 33 < 13UZ-05 B 12.6 ± 0.2 0.49 ± 0.06 < 0.02 1.75 ± 0.02 < 27 77 ± 14 < 37 49 ± 3 507 ± 5 8 ± 2 92 ± 3 5.7 ± 1.4 3.4 ± 1.0 533 ± 29 < 14UZ-06 B 7.0 ± 0.2 0.47 ± 0.05 0.02 ± 0.01 1.92 ± 0.02 < 27 47 ± 14 < 36 76 ± 3 193 ± 3 11 ± 3 116 ± 3 8.5 ± 1.4 < 1.5 681 ± 31 < 13UZ-07 B 2.8 ± 0.2 0.40 ± 0.05 0.06 ± 0.01 2.38 ± 0.02 < 27 70 ± 14 < 36 181 ± 4 122 ± 3 24 ± 3 242 ± 3 23.8 ± 1.7 3.0 ± 1.1 747 ± 32 24 ± 9UZ-08 B 2.8 ± 0.2 0.42 ± 0.05 0.06 ± 0.01 2.70 ± 0.02 < 27 117 ± 15 < 37 157 ± 4 173 ± 3 24 ± 3 212 ± 3 20.9 ± 1.7 2.6 ± 1.1 808 ± 34 46 ± 10UZ-09 B 8.5 ± 0.2 0.39 ± 0.05 0.96 ± 0.02 2.49 ± 0.02 < 28 106 ± 15 < 37 76 ± 3 233 ± 4 15 ± 3 116 ± 3 8.5 ± 1.5 2.7 ± 1.1 577 ± 31 < 14UZ-10 B 7.7 ± 0.3 0.50 ± 0.05 0.13 ± 0.01 2.88 ± 0.02 < 29 169 ± 17 < 41 92 ± 3 266 ± 4 14 ± 3 140 ± 3 11.3 ± 1.5 < 1.6 1102 ± 40 31 ± 10UZ-11 B 6.6 ± 0.2 0.42 ± 0.05 0.03 ± 0.01 2.38 ± 0.02 59 ± 19 91 ± 14 < 36 74 ± 3 212 ± 4 10 ± 2 136 ± 3 10.1 ± 1.4 < 1.5 851 ± 34 < 13UZ-12 B 7.2 ± 0.2 0.44 ± 0.05 < 0.02 1.70 ± 0.02 < 26 45 ± 13 < 35 106 ± 3 231 ± 4 9 ± 3 91 ± 3 8.5 ± 1.4 < 1.4 833 ± 34 < 13Average 7.06 ± 0.2 0.48 ± 0.05 0.14 ± 0.01 2.45 ± 0.02 30 ± 27 80 ± 15 < 37 90 ± 3 240 ± 4 16 ±2 167 ± 3 12 ± 1.5 2.1 ± 1.4 670 ± 32 19 ± 13
Sample Ca, % Ti, % Mn, % Fe, % Cu, g/t Zn, g/t As, g/t Rb, g/t Sr, g/t Y_, g/t Zr, g/t Nb, g/t Mo, g/t Ba, g/t Pb, g/tUZ-01 S 6.1 ± 0.2 0.55 ± 0.05 0.03 ± 0.01 2.43 ± 0.02 < 27 45 ± 14 < 36 48 ± 3 247 ± 4 21 ± 3 388 ± 4 8.8 ± 1.5 2.5 ± 1.2 351 ± 25 < 13UZ-02 S 8.1 ± 0.2 0.66 ± 0.06 0.03 ± 0.01 2.53 ± 0.02 < 28 49 ± 15 < 38 56 ± 3 241 ± 4 18 ± 3 271 ± 4 7.8 ± 1.5 1.9 ± 1.1 411 ± 27 < 14UZ-03 S 5.3 ± 0.2 0.40 ± 0.05 0.02 ± 0.01 1.78 ± 0.02 < 25 49 ± 13 < 34 58 ± 3 195 ± 3 10 ± 2 109 ± 3 6.4 ± 1.3 < 1.4 483 ± 26 < 12UZ-04 S 8.8 ± 0.3 0.59 ± 0.06 0.02 ± 0.01 2.42 ± 0.02 < 29 62 ± 15 < 39 76 ± 3 231 ± 4 16 ± 3 172 ± 3 9.4 ± 1.5 < 1.6 822 ± 36 < 14UZ-05 S 9.1 ± 0.2 0.54 ± 0.06 0.03 ± 0.01 2.15 ± 0.02 < 27 74 ± 15 < 37 62 ± 3 220 ± 4 13 ± 3 159 ± 3 8.6 ± 1.4 2.1 ± 1.0 696 ± 32 19 ± 9UZ-06 S 6.8 ± 0.2 0.46 ± 0.05 0.03 ± 0.01 1.99 ± 0.02 < 26 86 ± 14 < 35 77 ± 3 196 ± 3 12 ± 2 105 ± 3 7.8 ± 1.3 < 1.4 698 ± 31 17 ± 9UZ-07 S 2.4 ± 0.2 0.42 ± 0.05 0.07 ± 0.01 2.89 ± 0.02 < 27 150 ± 15 < 37 160 ± 4 145 ± 3 26 ± 3 223 ± 3 21.1 ± 1.7 5.4 ± 1.1 666 ± 31 73 ± 10UZ-08 S 2.0 ± 0.2 0.40 ± 0.05 0.04 ± 0.01 2.68 ± 0.02 < 27 191 ± 16 < 37 177 ± 4 176 ± 3 26 ± 3 230 ± 3 19.9 ± 1.6 3.8 ± 1.1 868 ± 34 62 ± 10UZ-09 S 8.1 ± 0.2 0.47 ± 0.05 0.02 ± 0.01 2.33 ± 0.02 < 28 111 ± 15 < 38 116 ± 3 239 ± 4 20 ± 3 170 ± 3 13.9 ± 1.6 < 1.6 764 ± 34 27 ± 10UZ-10 S 6.3 ± 0.2 0.44 ± 0.05 0.04 ± 0.01 2.50 ± 0.02 < 27 93 ± 15 < 37 89 ± 3 228 ± 4 13 ± 3 116 ± 3 10.4 ± 1.4 < 1.5 696 ± 32 < 14UZ-11 S 7.6 ± 0.2 0.49 ± 0.05 0.04 ± 0.01 2.45 ± 0.02 < 28 74 ± 14 < 37 78 ± 3 210 ± 4 15 ± 3 149 ± 3 10.3 ± 1.5 1.9 ± 1.0 580 ± 30 < 13UZ-12 S 7.7 ± 0.2 0.51 ± 0.05 0.03 ± 0.01 2.04 ± 0.02 < 27 62 ± 14 < 37 102 ± 3 231 ± 4 14 ± 3 133 ± 3 11.4 ± 1.5 1.6 ± 1.0 785 ± 34 < 13Average 6.5 ± 0.2 0.5 ± 0.05 0.03 ± 0.01 2.35 ± 0.02 < 27 87 ± 15 < 37 92 ± 3 213 ± 4 17 ± 3 185 ± 3 11 ± 1.5 2.2 ± 1.3 652 ± 31 24 ± 12WSO < 0.2 0.20 ± 0.04 0.04 ± 0.01 3.22 ± 0.02 < 22 52 ± 11 < 29 66 ± 3 218 ± 4 20 ± 3 167 ± 3 12.7 ± 1.5 < 1.5 274 ± 22 < 11Av. conc.for sed. 2.5 0.45 0.07 3.33 57 80 6.6 200 450 30 200 20 2.0 800 -
23
Table 8: XRF analysis of bottom sediment and soil samples, Kyrgyzstan
Sample Ca, % Ti, % Mn, % Fe, % Cu, g/t Zn, g/t Pb, g/t As, g/t Rb, g/t Sr, g/t Y_, g/t Zr, g/t Nb, g/t Mo, g/t Ba, g/t
kg0100b 7.1 ± 0.4 0.41 ± 0.07 0.04 ± 0.02 3.57 ± 0.04 < 44 50 ± 23 < 21 < 59 112 ± 5 331 ± 7 30 ± 5 243 ± 6 14.8 ± 2.5 2.7 ± 1.7 761 ± 51kg0200b 11.0 ± 0.4 0.39 ± 0.08 < 0.03 2.73 ± 0.03 < 42 < 32 < 20 < 56 104 ± 5 129 ± 5 16 ± 4 175 ± 5 13.9 ± 2.3 < 2.4 536 ± 44kg0300b 10.0 ± 0.4 0.41 ± 0.07 0.04 ± 0.02 3.27 ± 0.03 < 42 44 ± 22 < 20 < 56 87 ± 5 369 ± 7 25 ± 4 257 ± 6 12.1 ± 2.4 < 2.5 681 ± 48kg0400b 10.6 ± 0.4 0.40 ± 0.08 0.04 ± 0.02 3.25 ± 0.03 < 43 37 ± 22 < 21 < 58 42 ± 4 228 ± 6 17 ± 4 132 ± 4 9.5 ± 2.2 < 2.3 484 ± 43kg0500b 8.6 ± 0.4 0.38 ± 0.08 0.06 ± 0.02 3.53 ± 0.04 < 44 53 ± 23 < 21 < 59 78 ± 5 237 ± 6 22 ± 4 191 ± 5 11.4 ± 2.4 < 2.5 508 ± 45kg0601b 3.4 ± 0.3 0.38 ± 0.06 0.03 ± 0.02 2.96 ± 0.03 < 38 57 ± 20 < 19 < 51 122 ± 5 118 ± 4 29 ± 4 195 ± 5 14.8 ± 2.2 < 2.2 544 ± 41kg0701b 9.4 ± 0.4 0.29 ± 0.08 0.04 ± 0.02 2.85 ± 0.03 < 43 49 ± 22 < 21 < 58 82 ± 5 227 ± 6 19 ± 4 187 ± 5 11.6 ± 2.3 < 2.5 626 ± 47kg0801b 11.7 ± 0.4 0.32 ± 0.08 0.04 ± 0.02 3.26 ± 0.04 < 47 < 36 < 22 < 62 108 ± 6 443 ± 8 17 ± 5 129 ± 5 10.0 ± 2.4 < 2.5 1310 ± 67kg0901b 7.4 ± 0.4 0.41 ± 0.07 0.04 ± 0.02 4.17 ± 0.04 < 47 99 ± 25 < 22 < 60 112 ± 5 219 ± 6 22 ± 5 159 ± 5 11.3 ± 2.4 < 2.4 632 ± 48kg1001b 5.4 ± 0.3 0.31 ± 0.06 0.03 ± 0.01 1.90 ± 0.02 < 34 60 ± 18 20 ± 11 < 45 62 ± 4 170 ± 4 16 ± 3 140 ± 4 8.6 ± 1.8 < 1.9 417 ± 34kg1101b 8.7 ± 0.4 0.40 ± 0.08 0.05 ± 0.02 3.52 ± 0.04 < 45 68 ± 24 < 21 < 59 77 ± 5 149 ± 5 17 ± 4 160 ± 5 9.9 ± 2.3 < 2.5 728 ± 51kg1201b 8.4 ± 0.4 0.47 ± 0.07 0.04 ± 0.02 4.07 ± 0.04 < 46 40 ± 24 < 22 < 60 66 ± 5 159 ± 5 17 ± 4 189 ± 5 9.8 ± 2.3 < 2.5 1124 ± 61kg1301b 7.6 ± 0.3 0.30 ± 0.08 0.03 ± 0.02 2.27 ± 0.03 < 40 79 ± 21 < 19 < 53 89 ± 5 132 ± 5 13 ± 4 119 ± 4 7.0 ± 2.0 < 2.2 624 ± 45kg1401b 6.0 ± 0.3 0.45 ± 0.07 0.04 ± 0.02 3.38 ± 0.04 < 42 71 ± 23 < 21 < 57 86 ± 5 178 ± 5 23 ± 4 207 ± 5 12.4 ± 2.3 < 2.4 551 ± 44kg1501b 5.3 ± 0.3 0.36 ± 0.07 0.06 ± 0.02 3.49 ± 0.04 50 ± 30 403 ± 29 33 ± 14 < 56 76 ± 5 131 ± 5 18 ± 4 138 ± 4 9.8 ± 2.2 < 2.3 693 ± 49Average 8.4 ± 0.36 0.37 ± 0.07 0.04 ± 0.02 3.21 ± 0.03 43 ± 42 85 ± 23 22 ± 20 < 56 89 ± 5 215 ± 6 20 ± 4 175 ± 5 11.1 ± 2.2 2.4 ± 2.3 681 ± 48
Sample Ca, % Ti, % Mn, % Fe, % Cu, g/t Zn, g/t Pb, g/t As, g/t Rb, g/t Sr, g/t Y_, g/t Zr, g/t Nb, g/t Mo, g/t Ba, g/t
kg1101s 9.7 ± 0.4 0.48 ± 0.07 0.05 ± 0.02 4.45 ± 0.04 < 49 < 38 < 22 < 63 58 ± 5 166 ± 5 24 ± 4 195 ± 5 8.6 ± 2.4 < 2.6 839 ± 55kg1201s 8.9 ± 0.4 0.39 ± 0.08 0.05 ± 0.02 3.54 ± 0.04 < 45 69 ± 24 < 21 < 59 73 ± 5 165 ± 5 19 ± 4 210 ± 5 9.6 ± 2.3 2.8 ± 1.7 791 ± 52kg1301s 6.8 ± 0.3 0.33 ± 0.07 0.03 ± 0.02 3.53 ± 0.03 < 44 < 33 < 20 < 56 69 ± 4 119 ± 4 11 ± 4 78 ± 4 5.1 ± 2.0 < 2.2 456 ± 41kg1401s 8.2 ± 0.4 0.43 ± 0.08 0.03 ± 0.02 2.80 ± 0.03 < 43 < 33 < 21 < 57 89 ± 5 156 ± 5 16 ± 4 215 ± 5 9.3 ± 2.2 < 2.4 737 ± 49kg1501s 6.5 ± 0.4 0.36 ± 0.06 0.03 ± 0.02 4.60 ± 0.04 < 47 < 36 < 21 < 60 47 ± 4 127 ± 5 16 ± 4 79 ± 4 8.0 ± 2.2 < 2.3 390 ± 40Average 8.0 ± 0.4 0.39 ± 0.07 0.04 ± 0.02 3.78 ± 0.03 < 46 42 ± 33 < 21 < 59 67 ± 4.6 146 ± 5 17 ± 4 155 ± 4.6 8.1 ± 2.2 2.5 ± 2.2 642.6 ± 47.4
24
Table 9: XRF analysis of bottom sediment and soil samples, Tajikistan
Sample Ca, % Ti, % Mn, % Fe, % Cu, g/t Zn, g/t Pb, g/t As, g/t Rb, g/t Sr, g/t Y_, g/t Zr, g/t Nb, g/t Mo, g/t Ba, g/t
tj0200b 3.5 ± 0.3 0.22 ± 0.07 0.03 ± 0.02 2.30 ± 0.03 < 37 72 ± 20 < 19 < 51 106 ± 5 184 ± 5 13 ± 4 95 ± 4 7.6 ± 2.0 < 2.1 622 ± 44tj0300b 3.9 ± 0.3 0.26 ± 0.07 0.03 ± 0.02 2.24 ± 0.03 < 38 42 ± 19 < 18 < 50 108 ± 5 223 ± 5 10 ± 4 86 ± 4 7.2 ± 1.9 < 2.0 724 ± 46tj0400b 4.1 ± 0.3 0.28 ± 0.07 0.04 ± 0.02 2.62 ± 0.03 < 39 69 ± 21 < 19 < 53 91 ± 5 198 ± 5 18 ± 4 159 ± 4 10.6 ± 2.1 < 2.2 521 ± 42tj0500b 8.0 ± 0.4 0.33 ± 0.08 0.04 ± 0.02 2.91 ± 0.03 < 41 66 ± 22 < 20 < 56 98 ± 5 256 ± 6 19 ± 4 157 ± 5 10.2 ± 2.3 < 2.4 507 ± 43tj0600b 3.5 ± 0.3 0.27 ± 0.07 0.03 ± 0.02 1.96 ± 0.03 < 37 48 ± 19 < 18 < 51 70 ± 4 149 ± 5 15 ± 4 296 ± 5 7.9 ± 2.0 2.4 ± 1.6 528 ± 41tj0700b 7.5 ± 0.3 0.20 ± 0.08 0.03 ± 0.02 2.17 ± 0.03 < 40 < 31 < 19 < 54 46 ± 4 213 ± 5 13 ± 4 87 ± 4 5.6 ± 2.0 < 2.1 388 ± 38tj0900b 11.1 ± 0.4 0.19 ± 0.08 0.03 ± 0.02 1.89 ± 0.03 < 39 34 ± 20 < 19 < 53 55 ± 4 410 ± 7 12 ± 4 125 ± 5 5.8 ± 2.1 < 2.3 375 ± 38tj1000b 7.9 ± 0.4 0.27 ± 0.08 0.04 ± 0.02 2.67 ± 0.03 < 42 42 ± 22 < 20 < 56 39 ± 4 290 ± 6 13 ± 4 136 ± 5 6.5 ± 2.0 < 2.3 299 ± 35tj1300b 6.9 ± 0.3 0.30 ± 0.08 0.04 ± 0.02 2.48 ± 0.03 < 42 47 ± 22 < 21 < 57 73 ± 5 231 ± 6 17 ± 4 287 ± 6 11.6 ± 2.3 2.6 ± 1.7 950 ± 55tj1400b 11.7 ± 0.4 0.24 ± 0.08 0.05 ± 0.02 2.89 ± 0.03 < 43 108 ± 24 84 ± 16 < 59 84 ± 5 497 ± 8 16 ± 4 155 ± 5 10.0 ± 2.4 < 2.5 809 ± 54tj1500b 7.9 ± 0.3 0.23 ± 0.08 0.03 ± 0.02 2.32 ± 0.03 < 42 61 ± 22 < 20 < 57 77 ± 5 306 ± 6 14 ± 4 105 ± 4 9.3 ± 2.2 < 2.3 958 ± 55Average 6.9 ± 0.3 0.25 ± 0.07 0.03 ± 0.02 2.48 ± 0.03 <40 59 ± 21 25 ± 19 <54 77 ± 4.6 269 ± 5.8 14.5 ± 4 153 ± 4.6 8.3 ± 2.1 2.3 ± 2.1 607 ± 44.6
Sample Ca, % Ti, % Mn, % Fe, % Cu, g/t Zn, g/t Pb, g/t As, g/t Rb, g/t Sr, g/t Y_, g/t Zr, g/t Nb, g/t Mo, g/t Ba, g/t
tj0200s 8.1 ± 0.3 0.28 ± 0.07 0.04 ± 0.02 2.85 ± 0.03 < 43 154 ± 24 39 ± 14 < 56 111 ± 5 195 ± 5 19 ± 4 152 ± 5 9.9 ± 2.2 < 2.3 633 ± 46tj0300s 4.3 ± 0.3 0.30 ± 0.07 0.04 ± 0.02 2.72 ± 0.03 < 40 134 ± 22 67 ± 14 < 54 110 ± 5 212 ± 5 17 ± 4 184 ± 5 10.0 ± 2.2 < 2.3 741 ± 48tj0400s 5.0 ± 0.3 0.33 ± 0.07 0.03 ± 0.02 2.37 ± 0.03 < 39 47 ± 21 < 20 < 53 102 ± 5 196 ± 5 18 ± 4 260 ± 5 8.7 ± 2.2 < 2.4 714 ± 47tj0500s 0.9 ± 0.2 0.38 ± 0.07 0.02 ± 0.02 2.60 ± 0.03 < 38 44 ± 20 < 19 < 52 94 ± 5 152 ± 5 33 ± 4 701 ± 8 10.6 ± 2.3 4.0 ± 1.9 553 ± 42tj0600s 4.3 ± 0.3 0.18 ± 0.07 0.04 ± 0.02 1.71 ± 0.03 < 37 37 ± 19 < 18 < 51 73 ± 4 179 ± 5 11 ± 3 122 ± 4 6.0 ± 1.9 < 2.1 526 ± 41tj0700s 9.3 ± 0.4 0.31 ± 0.08 0.05 ± 0.02 2.86 ± 0.03 < 43 36 ± 22 < 20 < 56 56 ± 4 339 ± 7 18 ± 4 146 ± 5 7.7 ± 2.2 < 2.4 357 ± 38tj0900s 7.7 ± 0.4 0.31 ± 0.07 0.05 ± 0.02 3.35 ± 0.04 < 43 50 ± 22 < 21 < 58 86 ± 5 222 ± 6 21 ± 4 183 ± 5 9.8 ± 2.3 < 2.5 437 ± 41tj1000s 10.4 ± 0.4 0.38 ± 0.08 0.04 ± 0.02 3.00 ± 0.03 < 44 51 ± 23 < 21 < 59 50 ± 4 272 ± 6 19 ± 4 176 ± 5 7.6 ± 2.3 < 2.5 343 ± 38tj1300s 8.4 ± 0.4 0.35 ± 0.08 0.04 ± 0.02 2.74 ± 0.03 < 43 59 ± 23 < 21 < 59 79 ± 5 240 ± 6 17 ± 4 182 ± 5 9.0 ± 2.3 < 2.5 803 ± 52tj1400s 7.7 ± 0.3 0.30 ± 0.07 0.05 ± 0.02 2.82 ± 0.03 < 42 126 ± 23 41 ± 14 < 55 95 ± 5 317 ± 7 16 ± 4 157 ± 5 12.2 ± 2.3 < 2.4 1046 ± 57tj1500s 8.5 ± 0.4 0.34 ± 0.07 0.04 ± 0.02 3.30 ± 0.04 < 43 85 ± 23 < 21 < 57 98 ± 5 287 ± 6 19 ± 4 135 ± 5 12.8 ± 2.4 < 2.4 1041 ± 58Average 6.7 ± 0.3 0.31 ± 0.07 0.04 ± 0.02 2.75 ± 0.03 < 41 75 ± 22 28 ± 18 < 55 86.7± 4.7 237 ± 6 19 ± 4 218 ± 5 9.4 ± 2.2 2.5 ± 2.3 654 ± 46
25
Table 10: Activation analysis of water samples, Kazakhstan
Na K Cr Fe Co Zn As Se Br Rb Mo Ag Cd Sbkodobr mg/L mg/L er% mkg/L mkg/L mkg/L mkg/L mkg/L mkg/L mkg/L mkg/L mkg/L mkg/L er% mkg/L er% mkg/Lkz-01W 71.5 0.05 100 60.5 505 0.28 17.1 1.5 1.85 8.0 1.32 3.48 0.034 32 0.4 100 0.48kz-02W 80.3 0.06 100 41.7 88 0.20 6.3 1.7 1.61 11.0 0.87 4.18 0.036 26 0.7 100 0.59kz-03W 214.8 13.25 48 186.5 262 0.37 10.0 1.2 3.95 37.0 1.38 3.22 <0.028 100 2.8 83 0.50kz-04W 152.1 0.69 100 241.6 307 0.38 7.9 1.1 3.11 23.6 5.68 2.09 0.032 55 1.8 88 0.36kz-05W 43.3 1.92 83 87.6 160 0.23 25.4 1.8 2.36 7.0 2.57 1.99 0.017 39 0.2 100 0.65kz-06W 58.5 0.91 100 68.7 211 0.24 7.2 2 2.78 16.5 2.36 1.56 <0.01 100 1.2 81 0.77kz-07W 84.3 4.82 69 98.3 259 0.25 5.7 1.3 1.44 8.6 2.25 3.55 0.022 59 0.4 100 0.64kz-08W 102.4 0.08 100 64.8 422 0.20 4.8 1.1 1.53 7.1 3.03 4.52 <0.008 100 0.5 100 0.60kz-09W 92.9 5.45 70 22.0 119 0.17 7.4 0.7 1.44 12.2 1.20 3.46 0.025 68 0.5 100 0.55kz-10W 98.8 4.80 79 25.4 224 0.26 7.8 1.1 1.62 10.5 1.31 4.66 <0.007 100 0.4 100 0.63kz-11W 103 6.90 60 23.0 299 0.30 5.3 1.2 1.64 12.9 1.09 4.73 <0.008 100 1.5 60 0.70kz-12W 97.1 2.28 100 29.6 440 0.36 7.5 0.9 1.49 10.5 1.68 4.22 0.107 13 2.8 38 0.59kz-13W 112.3 6.64 68 38.2 943 0.46 33.9 1.8 1.69 9.1 2.16 4.40 0.713 3 1.2 73 0.77kz-15W 124.8 11.07 43 21.3 105 0.24 7.7 1 1.66 7.9 0.86 4.27 0.043 33 0.5 100 0.73Average 102.6 4.2 80 72 310 0.28 11 1.3 2.0 13 1.98 3.6 0.08 59 1.06 87 0.6
Cs Ba La Ce Nd Sm Eu Tb Yb Hf Re Au Hg Th Ukodobr mkg/L mkg/L mkg/L mkg/L mkg/L mkg/L mkg/L Mkg/L mkg/L mkg/L mkg/L mkg/L mkg/L er% mkg/L mkg/L
kz-01W 0.18 45.87 0.96 5.21 0.70 1.32 0.021 0.001 0.015 0.040 0.12 0.0154 0.083 25 0.059 16.6kz-02W 0.15 64.05 0.98 5.69 6.15 1.44 0.003 0.006 0.012 0.028 0.14 0.0290 0.037 35 0.007 18.1kz-03W 0.19 41.77 1.07 6.66 0.00 1.54 0.149 0.003 0.030 0.121 0.06 0.0283 0.025 50 0.080 19.8kz-04W 0.57 40.68 1.14 7.36 9.14 1.50 0.025 0.004 0.023 0.053 0.02 0.0513 0.378 17 0.065 17.7kz-05W 0.29 46.05 0.77 3.79 2.20 0.90 0.013 0.003 0.000 0.034 0.73 0.0104 0.036 30 0.064 11.1kz-06W 0.27 54.03 0.77 3.22 4.29 0.73 0.019 0.003 0.015 0.034 1.43 0.0114 0.022 35 0.056 9.1kz-07W 0.28 48.59 1.06 5.68 5.19 1.49 0.031 0.003 0.030 0.030 0.19 0.0192 0.040 35 0.042 18.8kz-08W 0.33 37.92 1.28 7.05 3.79 1.64 0.008 0.002 0.066 0.032 0.21 0.0179 0.014 50 0.054 20.1kz-09W 0.18 44.22 1.15 6.11 9.90 1.60 0.027 0.007 0.018 0.067 0.20 0.0189 0.015 58 0.023 20.0kz-10W 0.18 38.69 1.25 6.70 9.88 1.69 0.018 0.000 0.019 0.047 0.16 0.0097 0.013 39 0.066 20.0kz-11W 0.18 50.98 1.35 6.75 8.98 1.71 0.008 0.002 0.003 0.099 0.26 0.0208 0.014 38 0.064 21.0kz-12W 0.24 50.14 1.30 6.91 0.00 1.78 0.030 0.006 0.040 0.061 0.19 0.0141 0.018 37 0.114 21.3kz-13W 0.18 33.45 1.57 7.84 7.95 1.91 0.057 0.006 0.055 0.077 0.20 0.0185 0.112 25 0.126 23.1kz-15W 0.15 45.05 1.56 8.00 3.20 1.98 0.023 0.003 0.000 0.046 0.15 0.0418 0.115 25 0.017 24.6Average 0.24 45.8 1.16 6.2 5.1 1.5 0.03 0.003 0.023 0.05 0.29 0.02 0.07 36 0.06 18.7

26
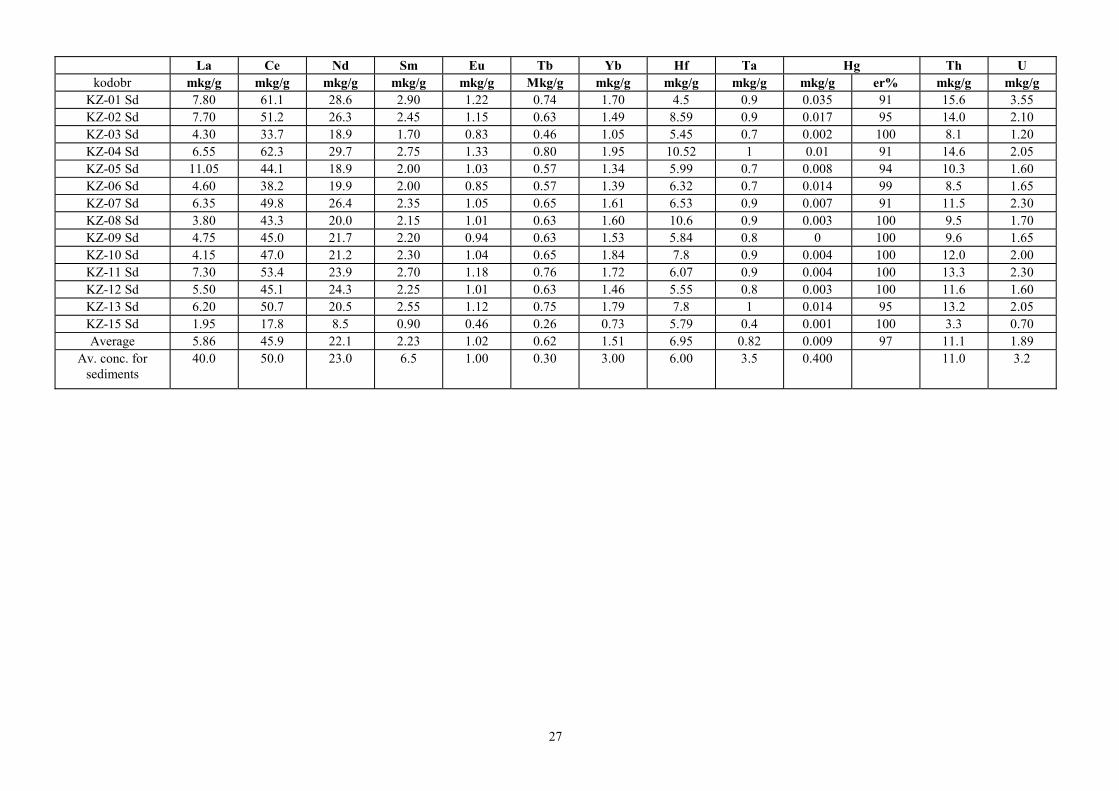
Table 11: Activation analysis of bottom sediments, Kazakhstan
Na Sc Cr Fe Co Ni Zn As Se Br Rb Sr Cd Sb Cs Bakodobr mg/g mkg/g mkg/g mg/g mkg/g mkg/g mkg/g Mkg/g mkg/g mkg/g mkg/g mg/g mkg/g er% mkg/g mkg/g mkg/g
KZ-01 Sd 4.77 15.5 100 41.5 16.9 26.6 155 7.80 2.25 4.85 146 457 0.55 100 1.55 9.0 569KZ-02 Sd 9.00 8.1 65 23 8.0 11.7 67 7.70 3.15 2.35 130 429 0.50 100 1.20 4.5 774KZ-03 Sd 9.51 7.1 77 20.1 7.4 12.9 57 4.30 1.66 0.35 105 244 0.40 100 0.80 2.9 545KZ-04 Sd 8.61 10.1 84 26.2 9.9 19.7 83 6.55 3.09 1.85 113 387 0.30 100 1.35 4.6 622KZ-05 Sd 4.29 8.7 66 26.3 10.0 13.2 88 11.05 2.44 2.50 97 394 0.35 100 1.90 4.4 487KZ-06 Sd 5.37 6.8 75 18 6.9 11.0 81 4.60 1.96 2.80 76 430 0.20 100 1.00 2.9 403KZ-07 Sd 7.97 10.3 86 27.3 11.1 17.1 93 6.35 1.87 2.65 107 387 1.20 90 0.90 4.7 549KZ-08 Sd 8.50 8.3 82 23.7 8.8 14.0 65 3.80 3.34 0.55 105 259 0.15 100 0.85 3.3 536KZ-09 Sd 8.77 8.2 67 22.4 9.0 17.2 68 4.75 1.68 1.10 114 286 0.15 100 0.90 3.9 566KZ-10 Sd 8.61 9.7 81 25.9 10.2 15.8 79 4.15 2.24 0.80 113 313 0.40 100 1.00 4.7 558KZ-11 Sd 7.44 11.7 81 30.6 12.5 20.6 100 7.30 2.46 1.40 117 354 0.50 100 1.10 5.9 542KZ-12 Sd 8.64 8.8 63 23.4 9.5 16.5 74 5.50 2.17 1.05 114 311 0.25 100 0.90 4.3 594KZ-13 Sd 9.59 10.1 72 26.2 10.7 20.6 83 6.20 2.16 2.35 118 409 0.75 100 1.05 5.1 619KZ-15 Sd 3.19 3.1 63 8.9 3.6 5.1 31 1.95 1.55 0.65 53 116 0.10 100 0.40 1.7 263Average 7.45 9.0 76 25 9.6 15.9 80 5.86 2.29 1.8 108 341 0.41 99 1.06 4.42 545
Av. conc. forsediments
6.60 10.0 100 33.3 20.0 95.0 80.0 6.60 0.60 6.00 200 450 0.30 2.00 12.0 800
27
La Ce Nd Sm Eu Tb Yb Hf Ta Hg Th Ukodobr mkg/g mkg/g mkg/g mkg/g mkg/g Mkg/g mkg/g mkg/g mkg/g mkg/g er% mkg/g mkg/g
KZ-01 Sd 7.80 61.1 28.6 2.90 1.22 0.74 1.70 4.5 0.9 0.035 91 15.6 3.55KZ-02 Sd 7.70 51.2 26.3 2.45 1.15 0.63 1.49 8.59 0.9 0.017 95 14.0 2.10KZ-03 Sd 4.30 33.7 18.9 1.70 0.83 0.46 1.05 5.45 0.7 0.002 100 8.1 1.20KZ-04 Sd 6.55 62.3 29.7 2.75 1.33 0.80 1.95 10.52 1 0.01 91 14.6 2.05KZ-05 Sd 11.05 44.1 18.9 2.00 1.03 0.57 1.34 5.99 0.7 0.008 94 10.3 1.60KZ-06 Sd 4.60 38.2 19.9 2.00 0.85 0.57 1.39 6.32 0.7 0.014 99 8.5 1.65KZ-07 Sd 6.35 49.8 26.4 2.35 1.05 0.65 1.61 6.53 0.9 0.007 91 11.5 2.30KZ-08 Sd 3.80 43.3 20.0 2.15 1.01 0.63 1.60 10.6 0.9 0.003 100 9.5 1.70KZ-09 Sd 4.75 45.0 21.7 2.20 0.94 0.63 1.53 5.84 0.8 0 100 9.6 1.65KZ-10 Sd 4.15 47.0 21.2 2.30 1.04 0.65 1.84 7.8 0.9 0.004 100 12.0 2.00KZ-11 Sd 7.30 53.4 23.9 2.70 1.18 0.76 1.72 6.07 0.9 0.004 100 13.3 2.30KZ-12 Sd 5.50 45.1 24.3 2.25 1.01 0.63 1.46 5.55 0.8 0.003 100 11.6 1.60KZ-13 Sd 6.20 50.7 20.5 2.55 1.12 0.75 1.79 7.8 1 0.014 95 13.2 2.05KZ-15 Sd 1.95 17.8 8.5 0.90 0.46 0.26 0.73 5.79 0.4 0.001 100 3.3 0.70Average 5.86 45.9 22.1 2.23 1.02 0.62 1.51 6.95 0.82 0.009 97 11.1 1.89
Av. conc. forsediments
40.0 50.0 23.0 6.5 1.00 0.30 3.00 6.00 3.5 0.400 11.0 3.2
28
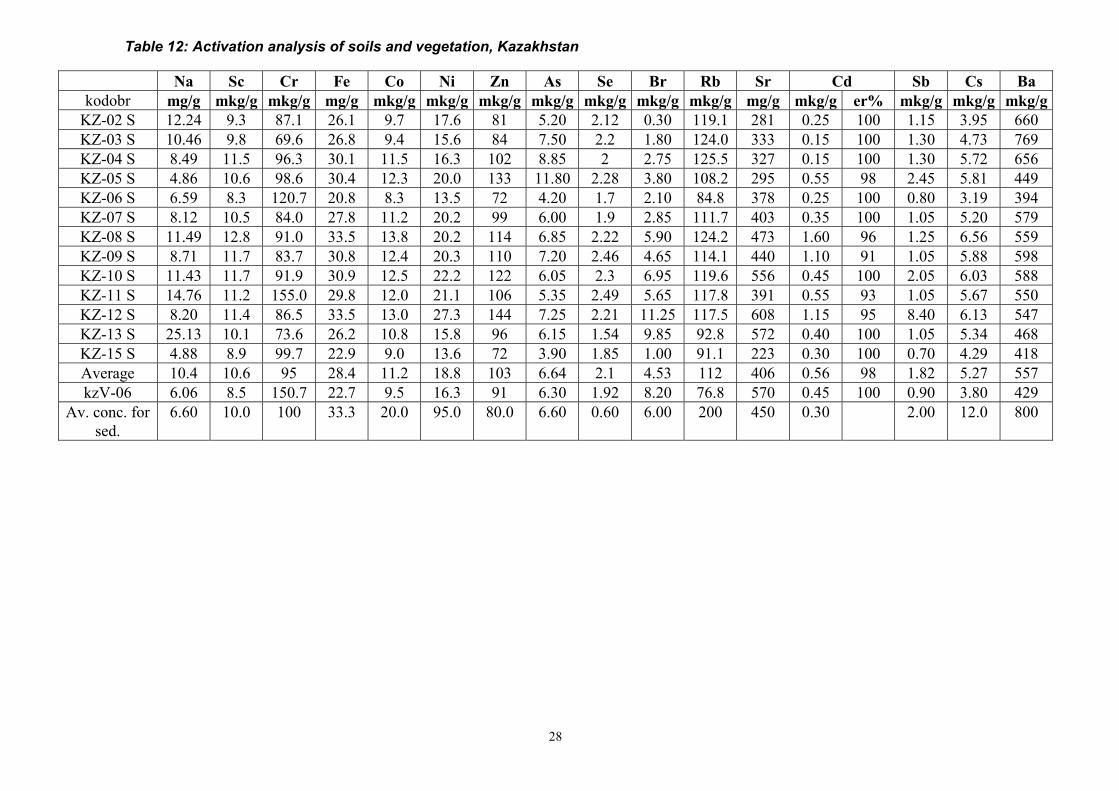
Table 12: Activation analysis of soils and vegetation, Kazakhstan
Na Sc Cr Fe Co Ni Zn As Se Br Rb Sr Cd Sb Cs Bakodobr mg/g mkg/g mkg/g mg/g mkg/g mkg/g mkg/g mkg/g mkg/g mkg/g mkg/g mg/g mkg/g er% mkg/g mkg/g mkg/g
KZ-02 S 12.24 9.3 87.1 26.1 9.7 17.6 81 5.20 2.12 0.30 119.1 281 0.25 100 1.15 3.95 660KZ-03 S 10.46 9.8 69.6 26.8 9.4 15.6 84 7.50 2.2 1.80 124.0 333 0.15 100 1.30 4.73 769KZ-04 S 8.49 11.5 96.3 30.1 11.5 16.3 102 8.85 2 2.75 125.5 327 0.15 100 1.30 5.72 656KZ-05 S 4.86 10.6 98.6 30.4 12.3 20.0 133 11.80 2.28 3.80 108.2 295 0.55 98 2.45 5.81 449KZ-06 S 6.59 8.3 120.7 20.8 8.3 13.5 72 4.20 1.7 2.10 84.8 378 0.25 100 0.80 3.19 394KZ-07 S 8.12 10.5 84.0 27.8 11.2 20.2 99 6.00 1.9 2.85 111.7 403 0.35 100 1.05 5.20 579KZ-08 S 11.49 12.8 91.0 33.5 13.8 20.2 114 6.85 2.22 5.90 124.2 473 1.60 96 1.25 6.56 559KZ-09 S 8.71 11.7 83.7 30.8 12.4 20.3 110 7.20 2.46 4.65 114.1 440 1.10 91 1.05 5.88 598KZ-10 S 11.43 11.7 91.9 30.9 12.5 22.2 122 6.05 2.3 6.95 119.6 556 0.45 100 2.05 6.03 588KZ-11 S 14.76 11.2 155.0 29.8 12.0 21.1 106 5.35 2.49 5.65 117.8 391 0.55 93 1.05 5.67 550KZ-12 S 8.20 11.4 86.5 33.5 13.0 27.3 144 7.25 2.21 11.25 117.5 608 1.15 95 8.40 6.13 547KZ-13 S 25.13 10.1 73.6 26.2 10.8 15.8 96 6.15 1.54 9.85 92.8 572 0.40 100 1.05 5.34 468KZ-15 S 4.88 8.9 99.7 22.9 9.0 13.6 72 3.90 1.85 1.00 91.1 223 0.30 100 0.70 4.29 418Average 10.4 10.6 95 28.4 11.2 18.8 103 6.64 2.1 4.53 112 406 0.56 98 1.82 5.27 557kzV-06 6.06 8.5 150.7 22.7 9.5 16.3 91 6.30 1.92 8.20 76.8 570 0.45 100 0.90 3.80 429
Av. conc. forsed.
6.60 10.0 100 33.3 20.0 95.0 80.0 6.60 0.60 6.00 200 450 0.30 2.00 12.0 800
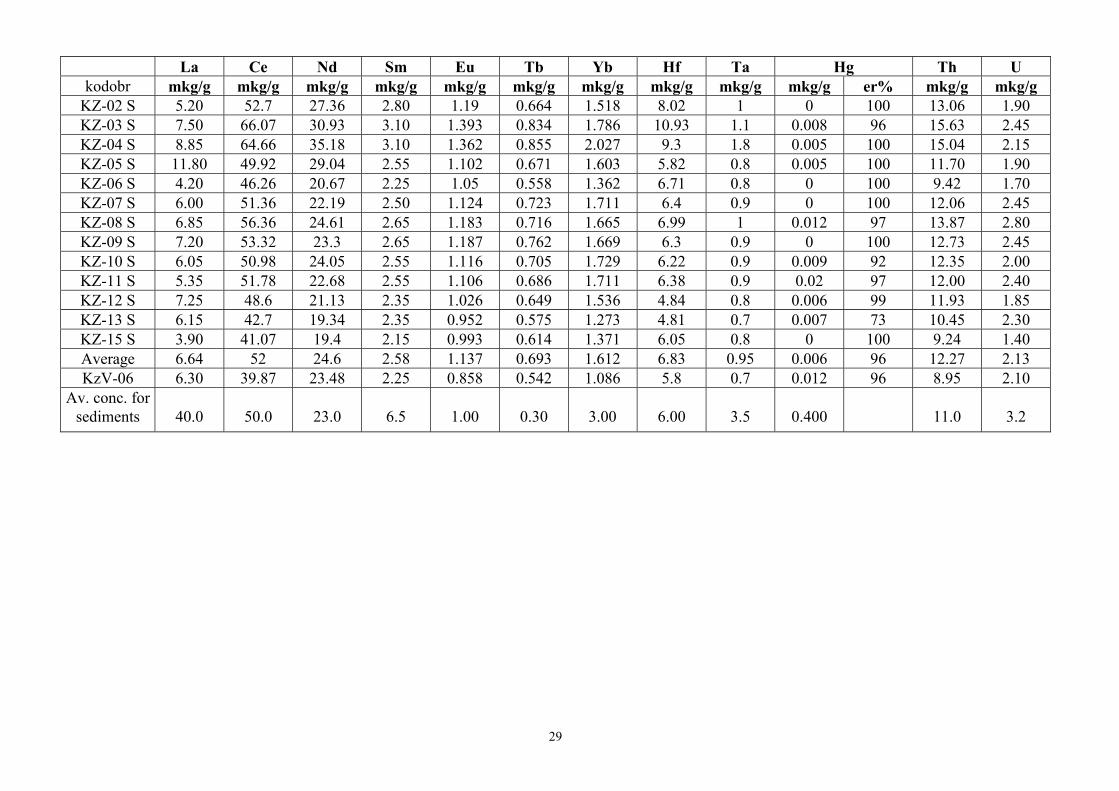
29
La Ce Nd Sm Eu Tb Yb Hf Ta Hg Th Ukodobr mkg/g mkg/g mkg/g mkg/g mkg/g mkg/g mkg/g mkg/g mkg/g mkg/g er% mkg/g mkg/g
KZ-02 S 5.20 52.7 27.36 2.80 1.19 0.664 1.518 8.02 1 0 100 13.06 1.90KZ-03 S 7.50 66.07 30.93 3.10 1.393 0.834 1.786 10.93 1.1 0.008 96 15.63 2.45KZ-04 S 8.85 64.66 35.18 3.10 1.362 0.855 2.027 9.3 1.8 0.005 100 15.04 2.15KZ-05 S 11.80 49.92 29.04 2.55 1.102 0.671 1.603 5.82 0.8 0.005 100 11.70 1.90KZ-06 S 4.20 46.26 20.67 2.25 1.05 0.558 1.362 6.71 0.8 0 100 9.42 1.70KZ-07 S 6.00 51.36 22.19 2.50 1.124 0.723 1.711 6.4 0.9 0 100 12.06 2.45KZ-08 S 6.85 56.36 24.61 2.65 1.183 0.716 1.665 6.99 1 0.012 97 13.87 2.80KZ-09 S 7.20 53.32 23.3 2.65 1.187 0.762 1.669 6.3 0.9 0 100 12.73 2.45KZ-10 S 6.05 50.98 24.05 2.55 1.116 0.705 1.729 6.22 0.9 0.009 92 12.35 2.00KZ-11 S 5.35 51.78 22.68 2.55 1.106 0.686 1.711 6.38 0.9 0.02 97 12.00 2.40KZ-12 S 7.25 48.6 21.13 2.35 1.026 0.649 1.536 4.84 0.8 0.006 99 11.93 1.85KZ-13 S 6.15 42.7 19.34 2.35 0.952 0.575 1.273 4.81 0.7 0.007 73 10.45 2.30KZ-15 S 3.90 41.07 19.4 2.15 0.993 0.614 1.371 6.05 0.8 0 100 9.24 1.40Average 6.64 52 24.6 2.58 1.137 0.693 1.612 6.83 0.95 0.006 96 12.27 2.13KzV-06 6.30 39.87 23.48 2.25 0.858 0.542 1.086 5.8 0.7 0.012 96 8.95 2.10
Av. conc. forsediments 40.0 50.0 23.0 6.5 1.00 0.30 3.00 6.00 3.5 0.400 11.0 3.2

30
Table 13: Radionuclide analysis of water samples, Kazakhstan (mBq/l)
Probe code Th-234 Ra-226 Pb-214 Bi-214 Pb-210 Ac-228 Ra-224 Pb-212 Bi-212 Tl-208 U-235 Th-227 Rn-219 Ra-223 Pb-211 K-40 Cs-137 Am-241
KZ-01WD 55 ± 29 < 121 < 18 < 33.2 < 31 < 42 < 119 < 12 < 203 < 43 < 12 < 38 < 55 < 54 < 199 < 515 < 14.0 < 4.1KZ-02WD 150 ± 15 < 49 24 ± 5 38 ± 11 < 12 25 ± 11 < 48 12 ± 4 < 70 17 ± 11 15 ± 4 < 15 < 21 < 23 < 66 < 214 < 4.9 < 1.6KZ-03WD 170 ± 27 < 94 17 ± 8 39 ± 17 < 24 < 30 < 86 16 ± 6 < 116 35 ± 21 17 ± 6 < 26 < 35 < 40 < 127 < 397 < 7.6 < 3.0KZ-04WD 93 ± 25 < 91 24 ± 10 40 ± 19 < 23 < 31 < 97 21 ± 7 < 118 < 35 11 ± 6 < 27 < 43 < 43 < 134 < 419 < 8.9 < 3.1KZ-05WD 76 ± 14 < 58 33 ± 6 39 ± 12 < 13 < 19 < 54 10 ± 4 < 78 < 21 10 ± 4 < 17 < 24 < 28 < 83 < 252 < 5.2 < 1.8KZ-06WD 62 ± 16 < 63 19 ± 7 20 ± 13 < 15 < 23 < 64 10 ± 5 < 100 31 ± 17 7 ± 5 < 20 < 28 < 31 < 100 < 300 < 6.9 < 2.3KZ-07WD 81 ± 16 < 60 26 ± 7 34 ± 13 < 14 < 22 < 60 9 ± 4 < 83 < 20 9 ± 4 < 19 < 27 < 30 < 88 < 269 < 5.6 < 2.0KZ-08WD 190 ± 25 < 81 16 ± 7 < 20 < 20 < 25 < 72 16 ± 5 < 110 < 26 18 ± 5 < 20 < 29 < 35 < 103 < 314 < 7.1 < 2.5KZ-09WD 196 ± 39 < 130 18 ± 12 < 36 < 31 < 42 < 129 16 ± 9 < 155 < 42 18 ± 9 < 34 < 49 < 51 < 179 < 548 < 13.5 < 4.2KZ-10WD 174 ± 30 < 98 < 13 < 27 < 21 < 33 < 91 19 ± 7 < 121 < 30 19 ± 7 < 29 < 41 < 43 < 117 < 411 < 9.0 < 3.0KZ-11WD 184 ± 40 < 138 < 18 40 ± 27 < 34 < 43 < 120 17 ± 9 < 167 < 50 17 ± 9 < 37 < 55 < 56 < 188 < 560 < 11.6 < 4.3KZ-12WD 177 ± 30 < 101 < 13 < 28 < 23 34 ± 22 < 87 12 ± 6 < 140 < 30 17 ± 7 < 25 < 40 < 37 < 127 < 420 < 8.9 < 3.3KZ-13WD 194 ± 25 < 84 27 ± 8 34 ± 15 < 21 < 28 < 74 13 ± 6 < 111 < 28 19 ± 6 < 22 < 34 < 37 < 118 < 351 < 7.4 < 3.1KZ-14WD 217 ± 24 < 71 12 ± 6 < 18 < 16 < 24 < 60 12 ± 5 < 94 < 23 19 ± 5 < 21 < 29 < 31 < 92 < 297 < 6.3 < 2.4Average 144 ± 25 < 88 19 ± 5 32 ± 9 < 21 < 30 < 82 14 ± 6 < 119 < 30 15 ± 6 < 25 < 36 < 39 < 123 < 376 < 8.3 < 3
31
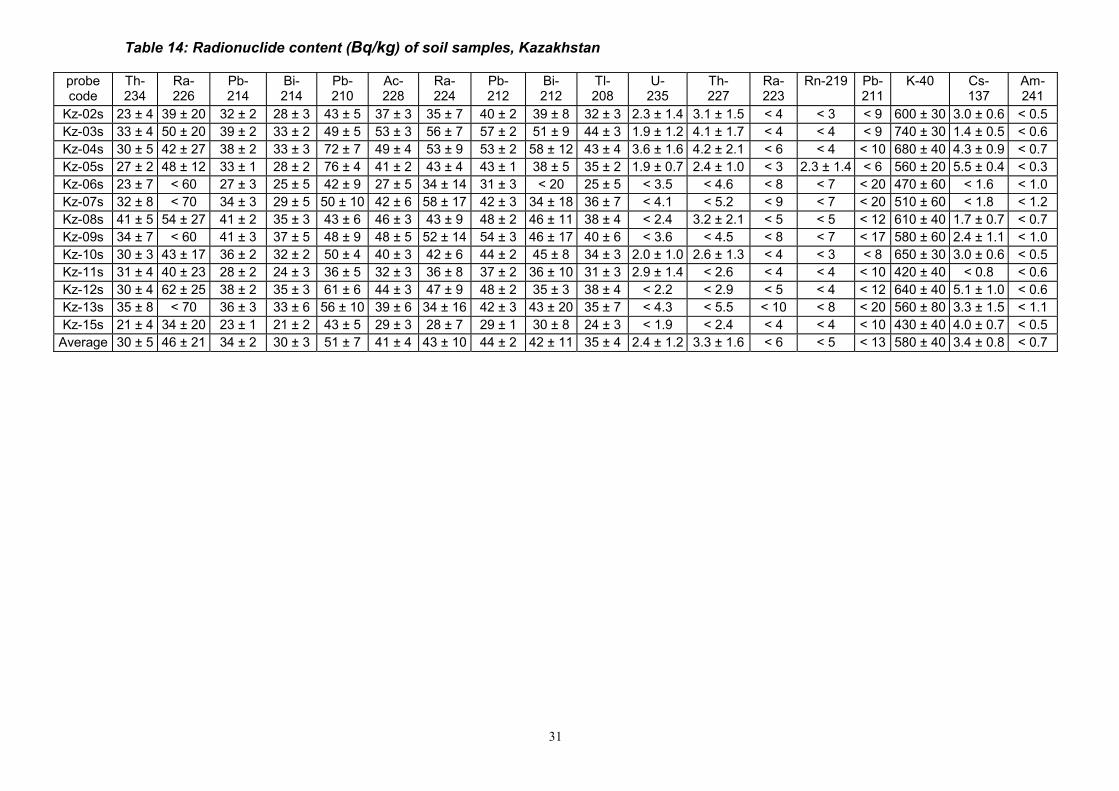
Table 14: Radionuclide content (Bq/kg) of soil samples, Kazakhstan
probecode
Th-234
Ra-226
Pb-214
Bi-214
Pb-210
Ac-228
Ra-224
Pb-212
Bi-212
Tl-208
U-235
Th-227
Ra-223
Rn-219 Pb-211
K-40 Cs-137
Am-241
Kz-02s 23 ± 4 39 ± 20 32 ± 2 28 ± 3 43 ± 5 37 ± 3 35 ± 7 40 ± 2 39 ± 8 32 ± 3 2.3 ± 1.4 3.1 ± 1.5 < 4 < 3 < 9 600 ± 30 3.0 ± 0.6 < 0.5Kz-03s 33 ± 4 50 ± 20 39 ± 2 33 ± 2 49 ± 5 53 ± 3 56 ± 7 57 ± 2 51 ± 9 44 ± 3 1.9 ± 1.2 4.1 ± 1.7 < 4 < 4 < 9 740 ± 30 1.4 ± 0.5 < 0.6Kz-04s 30 ± 5 42 ± 27 38 ± 2 33 ± 3 72 ± 7 49 ± 4 53 ± 9 53 ± 2 58 ± 12 43 ± 4 3.6 ± 1.6 4.2 ± 2.1 < 6 < 4 < 10 680 ± 40 4.3 ± 0.9 < 0.7Kz-05s 27 ± 2 48 ± 12 33 ± 1 28 ± 2 76 ± 4 41 ± 2 43 ± 4 43 ± 1 38 ± 5 35 ± 2 1.9 ± 0.7 2.4 ± 1.0 < 3 2.3 ± 1.4 < 6 560 ± 20 5.5 ± 0.4 < 0.3Kz-06s 23 ± 7 < 60 27 ± 3 25 ± 5 42 ± 9 27 ± 5 34 ± 14 31 ± 3 < 20 25 ± 5 < 3.5 < 4.6 < 8 < 7 < 20 470 ± 60 < 1.6 < 1.0Kz-07s 32 ± 8 < 70 34 ± 3 29 ± 5 50 ± 10 42 ± 6 58 ± 17 42 ± 3 34 ± 18 36 ± 7 < 4.1 < 5.2 < 9 < 7 < 20 510 ± 60 < 1.8 < 1.2Kz-08s 41 ± 5 54 ± 27 41 ± 2 35 ± 3 43 ± 6 46 ± 3 43 ± 9 48 ± 2 46 ± 11 38 ± 4 < 2.4 3.2 ± 2.1 < 5 < 5 < 12 610 ± 40 1.7 ± 0.7 < 0.7Kz-09s 34 ± 7 < 60 41 ± 3 37 ± 5 48 ± 9 48 ± 5 52 ± 14 54 ± 3 46 ± 17 40 ± 6 < 3.6 < 4.5 < 8 < 7 < 17 580 ± 60 2.4 ± 1.1 < 1.0Kz-10s 30 ± 3 43 ± 17 36 ± 2 32 ± 2 50 ± 4 40 ± 3 42 ± 6 44 ± 2 45 ± 8 34 ± 3 2.0 ± 1.0 2.6 ± 1.3 < 4 < 3 < 8 650 ± 30 3.0 ± 0.6 < 0.5Kz-11s 31 ± 4 40 ± 23 28 ± 2 24 ± 3 36 ± 5 32 ± 3 36 ± 8 37 ± 2 36 ± 10 31 ± 3 2.9 ± 1.4 < 2.6 < 4 < 4 < 10 420 ± 40 < 0.8 < 0.6Kz-12s 30 ± 4 62 ± 25 38 ± 2 35 ± 3 61 ± 6 44 ± 3 47 ± 9 48 ± 2 35 ± 3 38 ± 4 < 2.2 < 2.9 < 5 < 4 < 12 640 ± 40 5.1 ± 1.0 < 0.6Kz-13s 35 ± 8 < 70 36 ± 3 33 ± 6 56 ± 10 39 ± 6 34 ± 16 42 ± 3 43 ± 20 35 ± 7 < 4.3 < 5.5 < 10 < 8 < 20 560 ± 80 3.3 ± 1.5 < 1.1Kz-15s 21 ± 4 34 ± 20 23 ± 1 21 ± 2 43 ± 5 29 ± 3 28 ± 7 29 ± 1 30 ± 8 24 ± 3 < 1.9 < 2.4 < 4 < 4 < 10 430 ± 40 4.0 ± 0.7 < 0.5
Average 30 ± 5 46 ± 21 34 ± 2 30 ± 3 51 ± 7 41 ± 4 43 ± 10 44 ± 2 42 ± 11 35 ± 4 2.4 ± 1.2 3.3 ± 1.6 < 6 < 5 < 13 580 ± 40 3.4 ± 0.8 < 0.7

32
Table 15: Radionuclide content (Bq/kg) of bottom sediment samples, Kazakhstan
№ probe Th-234
Ra-226 Pb-214 Bi-214 Pb-210 Ac-228 Ra-224 Pb-212 Bi-212 Tl-208 U-235 Th-227 Ra-223
Rn-219
Pb-211
K-40 Cs-137 Am-241
Kz-01b 50 ± 4 63 ± 20 43 ± 1 37 ± 2 72 ± 5 65 ± 3 75 ± 7 73 ± 2 64 ± 8 58 ± 3 3. 3 ± 1. 2 5.4 ± 1.5 < 4 < 3 < 9 730 ± 30 3. 6 ± 0. 6 < 0. 5Kz-02b 18 ± 4 35 ± 10 28 ± 2 24 ± 3 25 ± 4 27 ± 3 30 ± 8 31 ± 2 26 ± 4 25 ± 3 2. 0 ± 1. 0 3.0 ± 1.0 < 3 < 2 < 5 590 ± 30 0. 4 ± 0. 2 < 0. 3Kz-03b 31 ± 4 38 ± 20 34 ± 1 30 ± 2 39 ± 5 48 ± 3 51 ± 8 50 ± 2 44 ± 9 40 ± 3 2. 1 ± 1. 3 3.5 ± 1.7 < 4 < 4 < 10 800 ± 30 1. 1 ± 0. 5 < 0. 6Kz-04b 33 ± 5 56 ± 30 40 ± 2 35 ± 3 42 ± 6 47 ± 3 47 ± 9 52 ± 2 50 ± 10 43 ± 4 < 2. 3 < 3 < 5 < 4 < 10 610 ± 30 1. 3 ± 0. 6 < 0. 7Kz-05b 31 ± 3 52 ± 15 35 ± 1 31 ± 2 40 ± 3 37 ± 2 40 ± 5 39 ± 1 36 ± 6 32 ± 2 1. 7 ± 0. 9 2.6 ± 1.1 < 3 < 3 < 7 550 ± 20 0. 9 ± 0. 3 < 0. 4Kz-06b 23 ± 2 39 ± 11 27 ± 1 23 ± 1 34 ± 2 30 ± 1 31 ± 4 32 ± 1 30 ± 4 25 ± 2 1. 7 ± 0. 6 2.8 ± 0.9 < 2 < 2 < 5 460 ± 20 2. 3 ± 0. 3 < 0. 3Kz-07b 35 ± 5 50 ± 25 38 ± 2 36 ± 3 43 ± 5 45 ± 3 46 ± 9 48 ± 2 50 ± 10 39 ± 4 2. 8 ± 1. 5 < 3 < 5 < 3 < 10 580 ± 40 < 0. 9 < 0. 6Kz-08b 24 ± 4 34 ± 20 32 ± 2 28 ± 2 30 ± 4 34 ± 3 36 ± 7 37 ± 1 25 ± 8 29 ± 3 < 1. 8 2.9 ± 1.6 < 4 < 3 < 10 560 ± 30 < 0. 6 < 0. 6Kz-09b 23 ± 6 65 ± 35 31 ± 2 26 ± 4 26 ± 7 35 ± 4 45 ± 10 37 ± 2 49 ± 17 31 ± 5 < 3. 2 < 4. 3 < 7 < 6 < 20 630 ± 50 < 1. 3 < 1Kz-10b 28 ± 5 45 ± 25 34 ± 2 31 ± 3 33 ± 5 40 ± 3 43 ± 9 42 ± 2 40 ± 10 33 ± 4 < 2. 5 3.5 ± 2.0 < 5 < 4 < 10 620 ± 30 < 0. 8 < 0. 6Kz-11b 34 ± 5 47 ± 27 41 ± 2 35 ± 3 37 ± 5 51 ± 4 58 ± 10 57 ± 2 50 ± 10 47 ± 4 2. 9 ± 1. 6 3.3 ± 2.0 < 5 < 5 < 12 580 ± 40 1. 3 ± 0. 6 < 0. 7Kz-12b 25 ± 3 44 ± 14 31 ± 1 29 ± 2 30 ± 3 36 ± 2 41 ± 5 39 ± 1 37 ± 6 30 ± 2 1. 4 ± 0. 8 2.7 ± 1.1 < 3 < 3 < 6 600 ± 30 < 0. 4 < 0. 4Kz-13b 29 ± 4 38 ± 20 36 ± 2 33 ± 3 37 ± 5 44 ± 3 48 ± 8 45 ± 2 42 ± 9 34 ± 3 < 1. 9 3.6 ± 1.7 < 5 < 4 < 10 570 ± 40 < 0. 7 < 0. 6Kz-15b 9 ± 5 < 42 10 ± 2 9 ± 3 17 ± 6 13 ± 3 < 13 12 ± 2 < 18 9 ± 3 < 2. 6 < 3. 4 < 6 < 6 < 16 330 ± 60 < 1. 1 < 0. 8
Average 28 ± 4 46 ± 20 33 ± 2 29 ± 3 36 ± 5 40 ± 3 43 ± 7 42 ± 2 40 ± 8 34 ± 3 2.3 ± 1.1 3.4 ± 0.9 < 4 < 4 < 10 590 ± 30 1.0 ± 0.5 < 0.6
33
Table 16: Radionuclide analysis of soil samples, Uzbekistan (Bq/kg)
Probe Th-234 Ra-226 Pb-214 Bi-214 Pb-210 Ac-228 Ra-224 Pb-212 Bi-212 Tl-208 U-235 Th-227 Rn-219 Ra-223 Pb-211 Cs-137 K-40 Am-241
UZ0100S 38.9 ± 10.0 < 87 55.9 ± 4.4 50.8 ± 7.7 45 ± 12 64.0 ± 8.2 73 ± 22 66.2 ± 4.4 71 ± 28 62 ± 10 < 5.3 < 7.4 < 10 < 13 < 31 < 2.1 425 ± 70 < 1.3
UZ0200S 29.7 ± 4.7 47 ± 27 39.8 ± 2.0 34.8 ± 3.4 33.0 ± 5.7 44.6 ± 3.6 54 ± 10 49.8 ± 2.0 52 ± 13 40.3 ± 4.4 2.6 ± 1.6 < 3.5 < 5.0 < 5.5 < 13 < 0.9 478 ± 37 < 0.6
UZ0300S 21.0 ± 7.3 < 62 27.1 ± 3.1 22.5 ± 5.5 29.8 ± 9.6 28.0 ± 5.8 24 ± 15 29.3 ± 2.9 41 ± 22 25.0 ± 6.6 < 3.9 < 5.8 < 8.0 < 10 < 24 2.3 ± 1.4 529 ± 72 < 1.0
UZ0400S 25.5 ± 1.9 45 ± 12 35.4 ± 0.8 30.5 ± 1.5 38.2 ± 2.6 39.7 ± 1.6 39.9 ± 4.3 41.5 ± 0.8 37.5 ± 5.2 34.6 ± 1.8 2.0 ± 0.7 2.0 ± 1.0 < 2.1 < 2.5 < 5.7 1.9 ± 0.3 649 ± 19 < 0.3
UZ0500S 27.6 ± 4.1 15.0 ± 8.2 36.7 ± 1.8 32.2 ± 3.1 35.0 ± 5.3 34.0 ± 3.1 45.6 ± 8.9 36.9 ± 1.6 37 ± 11 29.9 ± 3.7 2.4 ± 0.8 3.7 ± 2.1 < 4.5 < 4.9 < 12 1.8 ± 0.7 518 ± 36 < 0.6
UZ0600S 20.9 ± 7.7 < 68 28.6 ± 3.1 23.8 ± 5.4 31 ± 10 34.1 ± 6.0 37 ± 17 38.8 ± 3.2 38 ± 22 32.7 ± 7.1 < 4.0 < 6.3 < 8.3 < 9.1 < 26 < 1.4 746 ± 79 < 1.1
UZ0700S 136.2 ± 9.2 269 ± 53 170.0±4.0 147.1± 6.6 216 ± 13 112.7 ± 5.8 115 ± 16 120.4 ± 3.2 107 ± 19 99.6 ± 7.0 7.6 ± 2.9 11.6 ± 3.9 8.1 ± 5.3 < 9.4 < 21 4.7 ± 1.2 1195 ± 57 < 1.1
UZ0800S 63 ± 15 < 130 72.0 ± 6.0 62 ± 10 100 ± 21 118 ± 13 130 ± 34 126.2 ± 7.1 115 ± 42 100 ± 15 < 7.7 < 11 < 16 < 18 < 39 < 3.5 1249±125 < 2.2
UZ0900S 40.7 ± 5.0 29.7 ± 9.4 47.8 ± 1.9 42.6 ± 3.4 54.9 ± 6.4 80.6 ± 4.1 90 ± 11 83.3 ± 2.3 80 ± 13 67.3 ± 4.8 4.7 ± 0.9 4.2 ± 2.4 < 4.7 < 5.9 < 14 3.7 ± 0.9 974 ± 43 < 0.7
UZ1000S 34 ± 12 < 30 47.6 ± 4.9 41.6 ± 8.7 83 ± 18 65.8 ± 10.0 72 ± 27 63.7 ± 5.1 62 ± 33 52 ± 11 5.0 ± 1.8 < 8.9 < 12 < 14 < 38 < 2.7 842 ± 107 < 1.5
UZ1100S 31 ± 11 < 34 40.6 ± 4.9 32.0 ± 8.5 58 ± 16 60 ± 10 59 ± 27 61.3 ± 5.3 80 ± 37 51 ± 12 3.5 ± 1.9 < 8.7 < 12 < 16 < 42 < 3.6 637 ± 104 < 1.4
UZ1200S 33 ± 11 < 31 35.5 ± 4.2 30.9 ± 7.5 38 ± 13 59.9 ± 9.2 56 ± 24 60.4 ± 4.8 54 ± 31 48 ± 11 < 2.5 < 8.5 < 11 < 13 < 34 < 2.1 855 ± 105 < 1.5
Average 42 ± 8 34 ± 9 53 ± 3 46 ± 6 64 ± 11 62 ± 7 66 ± 17 65 ± 3.6 65 ± 23 54 ± 8 3.97 ± 1.5 1.8 ± 0.8 < 8.4 < 10 < 25 2.88±0.9 758 ± 71 < 1.1
34
Table 17: Radionuclide analysis of bottom sediment samples, Uzbekistan (Bq/kg)
Probe Th-234 Ra-226 Pb-214 Bi-214 Pb-210 Ac-228 Ra-224 Pb-212 Bi-212 Tl-208UZ-01 B 34.0 ± 9.2 < 84 51.0 ± 4.1 46.2 ± 6.9 44 ± 12 66.7 ± 7.8 59 ± 20 66.7 ± 4.2 66 ± 26 56.4 ± 9.1UZ-02 B 22.5 ± 9.0 < 88 36.6 ± 4.2 35.1 ± 7.5 42 ± 13 45.8 ± 8.2 37 ± 21 52.3 ± 4.4 64 ± 30 40.9 ± 9.8UZ-03 B 31.9 ± 7.8 < 71 39.9 ± 3.4 39.8 ± 6.3 42 ± 10 53.6 ± 6.7 55 ± 18 58.0 ± 3.6 53 ± 22 44.1 ± 8.0UZ-04 B 20.5 ± 1.8 41 ± 11 29.2 ± 0.8 25.2 ± 1.4 30.5 ± 2.5 31.7 ± 1.5 36.9 ± 4.1 34.1 ± 0.8 33.0 ± 5.0 29.0 ± 1.8UZ-05 B 56.5 ± 4.1 46 ± 23 35.8 ± 1.5 32.3 ± 2.6 31.0 ± 4.1 46.6 ± 2.9 36.4 ± 7.2 31.5 ± 1.3 27.5 ± 8.5 27.6 ± 3.0UZ-06 B 19.8 ± 1.8 37 ± 11 27.6 ± 0.7 24.0 ± 1.3 27.5 ± 2.4 28.9 ± 1.4 30.5 ± 3.8 31.7 ± 0.7 31.6 ± 4.6 26.4 ± 1.6UZ-07 B 89 ± 13 157 ± 76 105.6 ± 5.5 97.2 ± 9.4 111 ± 17 120.6 ± 9.9 123 ± 27 121.8 ± 5.4 127 ± 33 99 ± 12UZ-08 B 75.1 ± 4.4 110 ± 25 85.2 ± 1.8 75.8 ± 3.0 109.0 ± 5.9 116.2 ± 3.5 132.3 ± 9.4 122.2 ± 1.9 117 ± 11 102.9 ± 4.1UZ-08 B 76.7 ± 3.4 114 ± 19 87.1 ± 1.4 75.5 ± 2.3 104.1 ± 4.5 119.4 ± 2.7 128.5 ± 7.2 121.6 ± 1.5 120.5 ± 8.7 99.9 ± 3.1UZ-09 B 83.2 ± 6.0 158 ± 38 87.8 ± 2.6 78.7 ± 4.4 153.0 ± 8.6 221.1 ± 6.5 135 ± 14 132.2 ± 2.9 139 ± 18 105.8 ± 6.1UZ-09 B 84.4 ± 7.3 132 ± 46 91.8 ± 3.2 84.3 ± 5.4 147 ± 10 222.2 ± 7.8 144 ± 17 140.6 ± 3.5 133 ± 21 118.3 ± 7.7UZ-10 B 29 ± 11 < 99 39.0 ± 4.6 32.2 ± 7.9 62 ± 16 65.0 ± 9.9 70 ± 25 59.6 ± 5.0 59 ± 33 49 ± 11UZ-11 B 35.1 ± 3.8 53 ± 22 40.3 ± 1.5 34.8 ± 2.6 45.9 ± 5.0 57.8 ± 3.1 66.4 ± 8.5 62.2 ± 1.7 56 ± 10 48.4 ± 3.6UZ-11 B 33.6 ± 4.6 46 ± 27 41.7 ± 1.9 37.8 ± 3.3 49.2 ± 6.2 60.8 ± 3.9 64 ± 10 62.4 ± 2.1 62 ± 13 48.2 ± 4.4UZ-12 B 23 ± 10 < 97 31.6 ± 4.3 26.7 ± 7.5 31 ± 13 50.4 ± 9.3 35 ± 23 51.6 ± 4.8 < 43 42 ± 11Average 48 ± 7 78 ± 21 55 ± 3 50 ± 5 69 ± 9 87 ± 6 77 ± 14 76 ± 3 75 ± 16 62 ± 6
Probe U-235 Th-227 Ra-223 Rn-219 Pb-211 K-40 Am-241 Cs-137UZ-01 B < 4.8 < 7.0 < 10 < 9.9 < 27 462 ± 67 < 1.2 < 2.2UZ-02 B < 5.2 < 7.6 < 12 < 11 < 34 501 ± 85 < 1.3 < 2.5UZ-03 B < 4.2 < 6.5 < 9.9 < 8.6 < 23 588 ± 70 < 1.0 < 2.0UZ-04 B < 1.0 1.9 ± 1.0 < 2.3 < 2.0 < 5.7 630 ± 19 < 0.3 1.3 ± 0.3UZ-05 B 3.8 ± 1.3 < 2.4 < 4.4 < 3.5 < 9.9 420 ± 28 < 0.4 1.3 ± 0.6UZ-06 B 1.4 ± 0.6 < 1.4 < 2.2 < 1.9 < 5.4 616 ± 18 < 0.2 < 0.4UZ-07 B 6.7 ± 4.4 9.6 ± 6.2 < 15 < 12 < 34 1365 ± 101 < 1.7 3.4 ± 1.9UZ-08 B 5.3 ± 1.4 6.1 ± 2.0 < 5.0 4.4 ± 2.8 < 11 1321 ± 35 < 0.6 2.7 ± 0.6UZ-08 B 4.7 ± 1.1 5.9 ± 1.5 4.0 ± 2.6 < 3.2 < 8.3 1316 ± 27 < 0.4 2.8 ± 0.5UZ-09 B 6.3 ± 2.2 5.1 ± 2.9 < 7.7 < 6.4 < 16 623 ± 38 < 0.7 2.6 ± 0.9UZ-09 B 4.9 ± 2.6 5.8 ± 3.5 < 9.7 < 7.2 < 21 632 ± 46 < 0.9 2.7 ± 1.1UZ-10 B < 5.7 < 8.8 < 15 < 12 < 36 694 ± 100 < 1.4 < 3.0UZ-11 B < 2.0 3.1 ± 1.9 < 4.6 < 3.9 < 10 759 ± 34 < 0.5 1.0 ± 0.6UZ-11 B 2.7 ± 1.6 < 3.5 < 5.7 < 4.5 < 13 774 ± 42 < 0.6 < 1.0UZ-12 B < 5.9 < 8.8 < 13 < 11 < 36 832 ± 110 < 1.5 < 2.6Average 4 ± 2 6 ± 3 < 8 < 7 < 20 770 ± 55 < 0.8 2 ± 1
35
Table 18: Radionuclide analysis of soil samples, Kyrgyzstan
Th234 Ra226 Pb214 Bi214 Pb210 Ac228 Pb212 Bi212 Tl208 K40 Cs137kodobr Bq/kg Bq/kg Bq/kg Bq/kg Bq/kg Bq/kg Bq/kg Bq/kg Bq/kg Bq/kg Bq/kgkg0100s 63 ± 31 49 ± 2 53 ± 2 51 ± 3 < DL 70 ± 3 75 ± 2 73 ± 9 82 ± 7 910 ± 30 < DL kg0200s < DL 26 ± 1 25 ± 2 25 ± 3 < DL 48 ± 3 50 ± 2 55 ± 10 48 ± 6 800 ± 30 1.0 ± 0.6kg0300s 38 ± 24 36 ± 2 38 ± 2 38 ± 3 < DL 58 ± 3 62 ± 2 64 ± 11 43 ± 8 750 ± 30 3.8 ± 0.7kg0400s < DL 25 ± 2 28 ± 2 21 ± 2 < DL 30 ± 2 34 ± 2 42 ± 8 31 ± 6 320 ± 20 < DL kg0500s 58 ± 13 35 ± 1 37 ± 1 32 ± 2 < DL 45 ± 1 50 ± 1 46 ± 5 50 ± 3 710 ± 20 37.9 ± 0.7kg0601s < DL 34 ± 2 36 ± 2 31 ± 3 < DL 78 ± 3 76 ± 2 68 ± 9 73 ± 7 1240 ± 40 3.3 ± 0.7kg0701s 61 ± 12 38 ± 1 41 ± 1 34 ± 1 52 ± 36 47 ± 1 55 ± 1 50 ± 4 55 ± 3 750 ± 10 3.2 ± 0.2kg0801s 30 ± 13 38 ± 1 43 ± 1 32 ± 1 < DL 46 ± 1 49 ± 1 48 ± 4 42 ± 3 950 ± 10 1.7 ± 0.3kg0901s 51 ± 24 45 ± 1 50 ± 2 46 ± 3 < DL 58 ± 3 62 ± 2 58 ± 9 65 ± 5 970± 30 1.3 ± 0.4kg1001s 19 ± 12 38 ± 1 42 ± 1 38 ± 1 < DL 43 ± 1 44 ± 1 44 ± 4 45 ± 3 470 ± 10 2.5 ± 0.2kg1101s 32 ± 20 45 ± 1 49 ± 2 42 ± 3 < DL 31 ± 2 33 ± 2 27 ± 7 30 ± 5 570 ± 20 3.0 ± 0.6kg1201s 23 ± 6 21 ± 1 25 ± 1 16 ± 2 46 ± 6 22 ± 2 22 ± 4 15 ± 5 23 ± 3 430 ± 20 3.2 ± 0.4kg1301s 36 ± 20 25 ± 2 30 ± 2 28 ± 2 < DL 39 ± 2 39 ± 2 38 ± 8 26 ± 6 810 ± 20 0.9 ± 0.4kg1401s 11 ± 4 28 ± 1 32 ± 2 20 ± 5 74 ± 10 27 ± 2 28 ± 7 28 ± 6 36 ± 5 450 ± 20 3.7 ± 0.5kg1501s 14 ± 5 12 ± 1 13 ± 1 8 ± 1 16 ± 5 16 ± 1 19 ± 4 8 ± 4 18 ± 3 390 ± 20 2.1 ± 0.4Average 36 ± 15 33 ± 1 36 ± 2 31 ± 2 47 ± 14 44 ± 2 47 ± 2 44 ± 7 44 ± 5 700 ± 20 4.5 ± 0.4
Table 19: Radionuclide analysis of bottom sediment samples, Kyrgyzstan
Th234 Ra226 Pb214 Bi214 Pb210 Ac228 Pb212 Bi212 Tl208 K40 Cs137kodobr Bq/kg Bq/kg Bq/kg Bq/kg Bq/kg Bq/kg Bq/kg Bq/kg Bq/kg Bq/kg Bq/kg kg1101b 45 ± 11 26 ± 1 26 ± 1 22 ± 1 < DL 23 ± 1 28 ± 1 30 ± 4 31 ± 3 550 ± 10 1.4 ± 0.2kg1201b 43 ± 12 33 ± 1 36 ± 1 34 ± 1 < DL 27 ± 1 33 ± 1 46 ± 4 38 ± 3 700 ± 10 1.3 ± 0.2kg1301b 13 ± 4 15± 1 20 ± 1 10 ± 2 < DL 11 ± 1 13 ± 5 17 ± 4 10 ± 6 400 ± 20 1.2 ± 0.3kg1401b < DL 27± 1 33 ± 2 24 ± 2 < DL 32 ± 2 36 ± 1 30 ± 8 26 ± 5 820 ± 20 0.8 ± 0.4kg1501b 28 ± 7 36 ± 1 42 ± 2 25 ± 3 40 ± 7 44 ± 2 48± 7 46 ± 7 38 ± 5 550 ± 20 1.3 ± 0.4Average 26 ± 7 27 ± 1 31 ± 1 23 ± 2 40 ± 7 28 ± 2 32 ± 3 33 ± 6 29 ± 4 610 ± 20 1.2 ± 0.3
* DL – Detection Limit
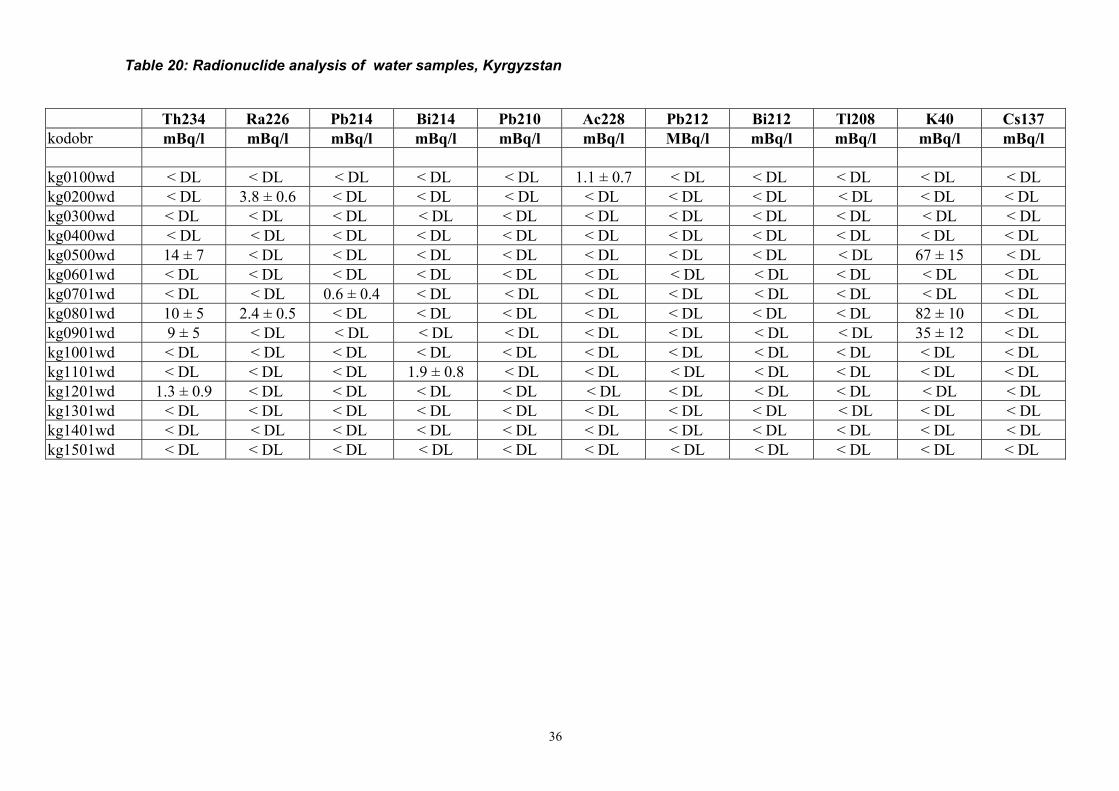
36
Table 20: Radionuclide analysis of water samples, Kyrgyzstan
Th234 Ra226 Pb214 Bi214 Pb210 Ac228 Pb212 Bi212 Tl208 K40 Cs137kodobr mBq/l mBq/l mBq/l mBq/l mBq/l mBq/l MBq/l mBq/l mBq/l mBq/l mBq/l
kg0100wd < DL < DL < DL < DL < DL 1.1 ± 0.7 < DL < DL < DL < DL < DLkg0200wd < DL 3.8 ± 0.6 < DL < DL < DL < DL < DL < DL < DL < DL < DL kg0300wd < DL < DL < DL < DL < DL < DL < DL < DL < DL < DL < DLkg0400wd < DL < DL < DL < DL < DL < DL < DL < DL < DL < DL < DL kg0500wd 14 ± 7 < DL < DL < DL < DL < DL < DL < DL < DL 67 ± 15 < DLkg0601wd < DL < DL < DL < DL < DL < DL < DL < DL < DL < DL < DL kg0701wd < DL < DL 0.6 ± 0.4 < DL < DL < DL < DL < DL < DL < DL < DL kg0801wd 10 ± 5 2.4 ± 0.5 < DL < DL < DL < DL < DL < DL < DL 82 ± 10 < DL kg0901wd 9 ± 5 < DL < DL < DL < DL < DL < DL < DL < DL 35 ± 12 < DL kg1001wd < DL < DL < DL < DL < DL < DL < DL < DL < DL < DL < DL kg1101wd < DL < DL < DL 1.9 ± 0.8 < DL < DL < DL < DL < DL < DL < DL kg1201wd 1.3 ± 0.9 < DL < DL < DL < DL < DL < DL < DL < DL < DL < DLkg1301wd < DL < DL < DL < DL < DL < DL < DL < DL < DL < DL < DLkg1401wd < DL < DL < DL < DL < DL < DL < DL < DL < DL < DL < DLkg1501wd < DL < DL < DL < DL < DL < DL < DL < DL < DL < DL < DL
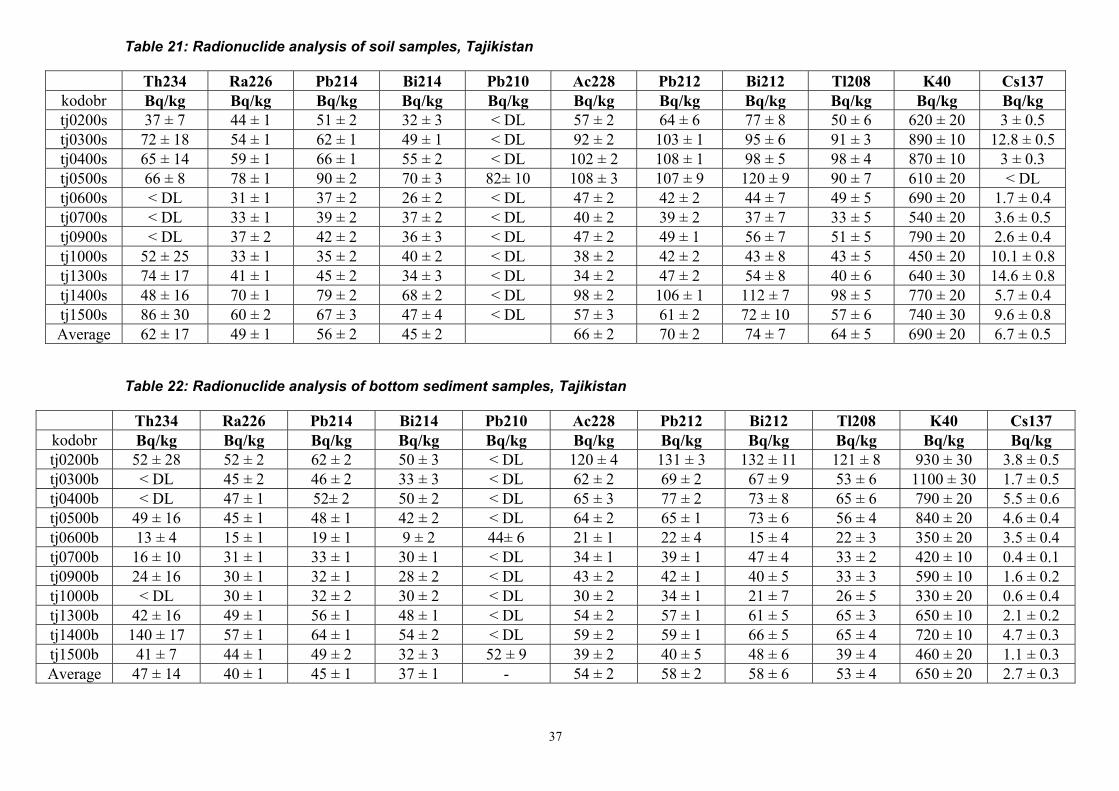
37
Table 21: Radionuclide analysis of soil samples, Tajikistan
Th234 Ra226 Pb214 Bi214 Pb210 Ac228 Pb212 Bi212 Tl208 K40 Cs137kodobr Bq/kg Bq/kg Bq/kg Bq/kg Bq/kg Bq/kg Bq/kg Bq/kg Bq/kg Bq/kg Bq/kgtj0200s 37 ± 7 44 ± 1 51 ± 2 32 ± 3 < DL 57 ± 2 64 ± 6 77 ± 8 50 ± 6 620 ± 20 3 ± 0.5tj0300s 72 ± 18 54 ± 1 62 ± 1 49 ± 1 < DL 92 ± 2 103 ± 1 95 ± 6 91 ± 3 890 ± 10 12.8 ± 0.5tj0400s 65 ± 14 59 ± 1 66 ± 1 55 ± 2 < DL 102 ± 2 108 ± 1 98 ± 5 98 ± 4 870 ± 10 3 ± 0.3tj0500s 66 ± 8 78 ± 1 90 ± 2 70 ± 3 82± 10 108 ± 3 107 ± 9 120 ± 9 90 ± 7 610 ± 20 < DLtj0600s < DL 31 ± 1 37 ± 2 26 ± 2 < DL 47 ± 2 42 ± 2 44 ± 7 49 ± 5 690 ± 20 1.7 ± 0.4tj0700s < DL 33 ± 1 39 ± 2 37 ± 2 < DL 40 ± 2 39 ± 2 37 ± 7 33 ± 5 540 ± 20 3.6 ± 0.5tj0900s < DL 37 ± 2 42 ± 2 36 ± 3 < DL 47 ± 2 49 ± 1 56 ± 7 51 ± 5 790 ± 20 2.6 ± 0.4tj1000s 52 ± 25 33 ± 1 35 ± 2 40 ± 2 < DL 38 ± 2 42 ± 2 43 ± 8 43 ± 5 450 ± 20 10.1 ± 0.8tj1300s 74 ± 17 41 ± 1 45 ± 2 34 ± 3 < DL 34 ± 2 47 ± 2 54 ± 8 40 ± 6 640 ± 30 14.6 ± 0.8tj1400s 48 ± 16 70 ± 1 79 ± 2 68 ± 2 < DL 98 ± 2 106 ± 1 112 ± 7 98 ± 5 770 ± 20 5.7 ± 0.4tj1500s 86 ± 30 60 ± 2 67 ± 3 47 ± 4 < DL 57 ± 3 61 ± 2 72 ± 10 57 ± 6 740 ± 30 9.6 ± 0.8Average 62 ± 17 49 ± 1 56 ± 2 45 ± 2 66 ± 2 70 ± 2 74 ± 7 64 ± 5 690 ± 20 6.7 ± 0.5
Table 22: Radionuclide analysis of bottom sediment samples, Tajikistan
Th234 Ra226 Pb214 Bi214 Pb210 Ac228 Pb212 Bi212 Tl208 K40 Cs137kodobr Bq/kg Bq/kg Bq/kg Bq/kg Bq/kg Bq/kg Bq/kg Bq/kg Bq/kg Bq/kg Bq/kgtj0200b 52 ± 28 52 ± 2 62 ± 2 50 ± 3 < DL 120 ± 4 131 ± 3 132 ± 11 121 ± 8 930 ± 30 3.8 ± 0.5tj0300b < DL 45 ± 2 46 ± 2 33 ± 3 < DL 62 ± 2 69 ± 2 67 ± 9 53 ± 6 1100 ± 30 1.7 ± 0.5tj0400b < DL 47 ± 1 52± 2 50 ± 2 < DL 65 ± 3 77 ± 2 73 ± 8 65 ± 6 790 ± 20 5.5 ± 0.6tj0500b 49 ± 16 45 ± 1 48 ± 1 42 ± 2 < DL 64 ± 2 65 ± 1 73 ± 6 56 ± 4 840 ± 20 4.6 ± 0.4tj0600b 13 ± 4 15 ± 1 19 ± 1 9 ± 2 44± 6 21 ± 1 22 ± 4 15 ± 4 22 ± 3 350 ± 20 3.5 ± 0.4tj0700b 16 ± 10 31 ± 1 33 ± 1 30 ± 1 < DL 34 ± 1 39 ± 1 47 ± 4 33 ± 2 420 ± 10 0.4 ± 0.1tj0900b 24 ± 16 30 ± 1 32 ± 1 28 ± 2 < DL 43 ± 2 42 ± 1 40 ± 5 33 ± 3 590 ± 10 1.6 ± 0.2tj1000b < DL 30 ± 1 32 ± 2 30 ± 2 < DL 30 ± 2 34 ± 1 21 ± 7 26 ± 5 330 ± 20 0.6 ± 0.4tj1300b 42 ± 16 49 ± 1 56 ± 1 48 ± 1 < DL 54 ± 2 57 ± 1 61 ± 5 65 ± 3 650 ± 10 2.1 ± 0.2tj1400b 140 ± 17 57 ± 1 64 ± 1 54 ± 2 < DL 59 ± 2 59 ± 1 66 ± 5 65 ± 4 720 ± 10 4.7 ± 0.3tj1500b 41 ± 7 44 ± 1 49 ± 2 32 ± 3 52 ± 9 39 ± 2 40 ± 5 48 ± 6 39 ± 4 460 ± 20 1.1 ± 0.3Average 47 ± 14 40 ± 1 45 ± 1 37 ± 1 - 54 ± 2 58 ± 2 58 ± 6 53 ± 4 650 ± 20 2.7 ± 0.3

38
This page left intentionally blank.
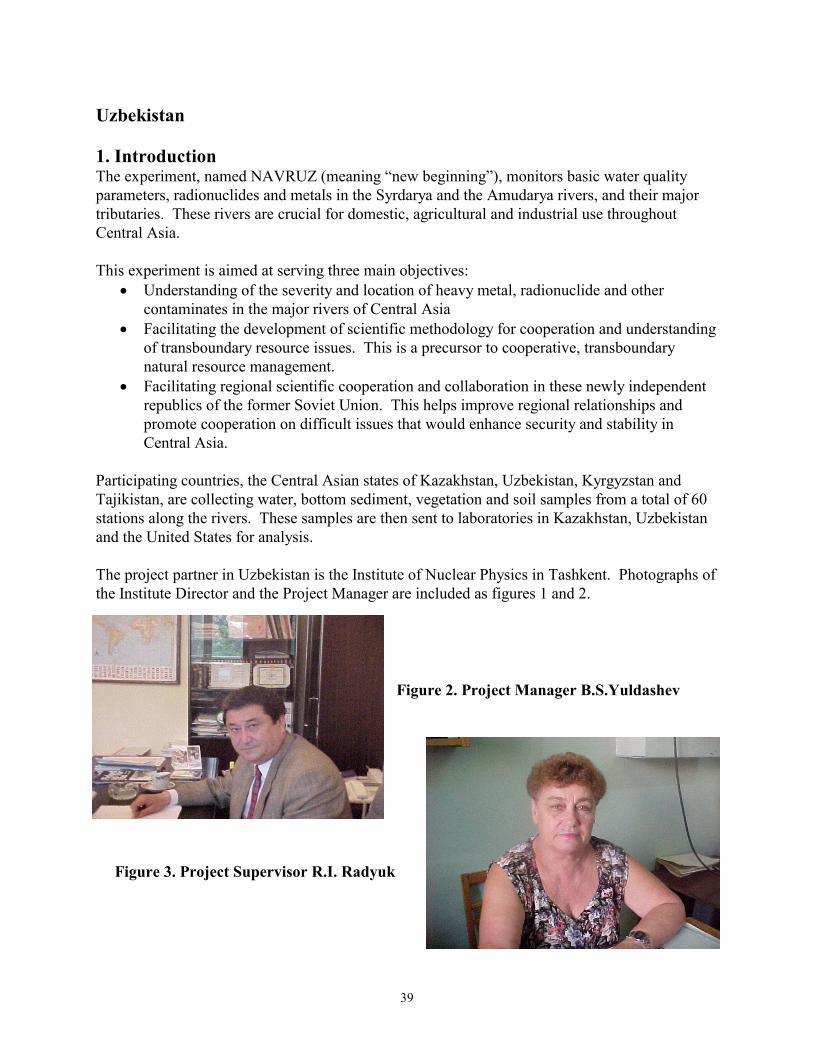
39
Uzbekistan
1. IntroductionThe experiment, named NAVRUZ (meaning “new beginning”), monitors basic water qualityparameters, radionuclides and metals in the Syrdarya and the Amudarya rivers, and their majortributaries. These rivers are crucial for domestic, agricultural and industrial use throughoutCentral Asia.
This experiment is aimed at serving three main objectives: � Understanding of the severity and location of heavy metal, radionuclide and other
contaminates in the major rivers of Central Asia � Facilitating the development of scientific methodology for cooperation and understanding
of transboundary resource issues. This is a precursor to cooperative, transboundarynatural resource management.
� Facilitating regional scientific cooperation and collaboration in these newly independentrepublics of the former Soviet Union. This helps improve regional relationships andpromote cooperation on difficult issues that would enhance security and stability inCentral Asia.
Participating countries, the Central Asian states of Kazakhstan, Uzbekistan, Kyrgyzstan andTajikistan, are collecting water, bottom sediment, vegetation and soil samples from a total of 60stations along the rivers. These samples are then sent to laboratories in Kazakhstan, Uzbekistanand the United States for analysis.
The project partner in Uzbekistan is the Institute of Nuclear Physics in Tashkent. Photographs ofthe Institute Director and the Project Manager are included as figures 1 and 2.
Figure 2. Project Manager B.S.Yuldashev
Figure 3. Project Supervisor R.I. Radyuk

40
2. Sampling Locations
Five major watersheds have been identified for sample collection sites in Uzbekistan. Eachwatershed is presented below with their corresponding sites for a total of 15 sites.
Amudarya River (Tuyamuyun, Kyzyldzhar and Kipchak – in Lower Amudarya) This site selection is due to the availability of various industrial activities including uraniummining. Water sampling will be conducted in the watershed of the Amudarya River. The uses ofthis river’s resources are multiple: irrigation, hydropower plants, industrial purposes, and as awater supply. The water system is polluted from the dumping of agriculture wastewater (mainlyfrom Turkmenistan), and drainage waters from the cities of Termez and Nukus.
Sampling sites at Amudarya river will be located at existing meteorological stations.Site 1: Kyzyldzhar village, Karakalpakstan, 1 km above the terminating range of the AmudaryaRiver (the nearest town is Kungrad). Site 2: Kipchak town, Karakalpakstan, 0.5 km above the town.Site 3: Tuyamuyun site, 8 km below the dam (Khorezm region).
Syrdarya River (Chinaz, Bekabad and Karadarya)The water uses of this river resource include, irrigation, industrial purposes, and a water supply.There are many industrial activities in this watershed and their resultant sewage effluent has animpact on water resources. Among these enterprises are Chirchik-“Elektrokhimprom,” theAltyaryk oil processing factory, fiber crops plants, sewage disposals and the factories of Angren,Almalyk, Gazalkent, Chirchik, Tashkent, and Chinaz.
Sampling sites at Syrdarya river will be at existing meteorological stations
Site 4: Karadarya River, Namangan region, 20 km southwest from Namangan, at Kol’ village.The meteorological post is below the merging point of Karadarya and Naryn rivers with SyrdaryaRiver.Site 5: Bekabad, Tashkent region, 0.9 km below the dump of drainage waters of “Vodokanal”enterprise.Site 6: Chinaz town, Tashkent region, 3.5 km SSW from Chinaz.
Akhangaran River (Tuyabuguz, Angren, Yangiabad)The basin of the Akhangaran River is a tributary of Syrdarya River. Sampling sites at theAkhangaran River will be located at existing meteorological stations.Site 7: Yangiabad town, Tashkent region, 5.5 km below Dukant village.Site 8: Angren town, Tashkent region, 5.5 km below the Angren dam.Site 9: Tuyabuguz, Tashkent region, Soldatskoe village, 0.5 km above the outfall of theAkhangaran River.
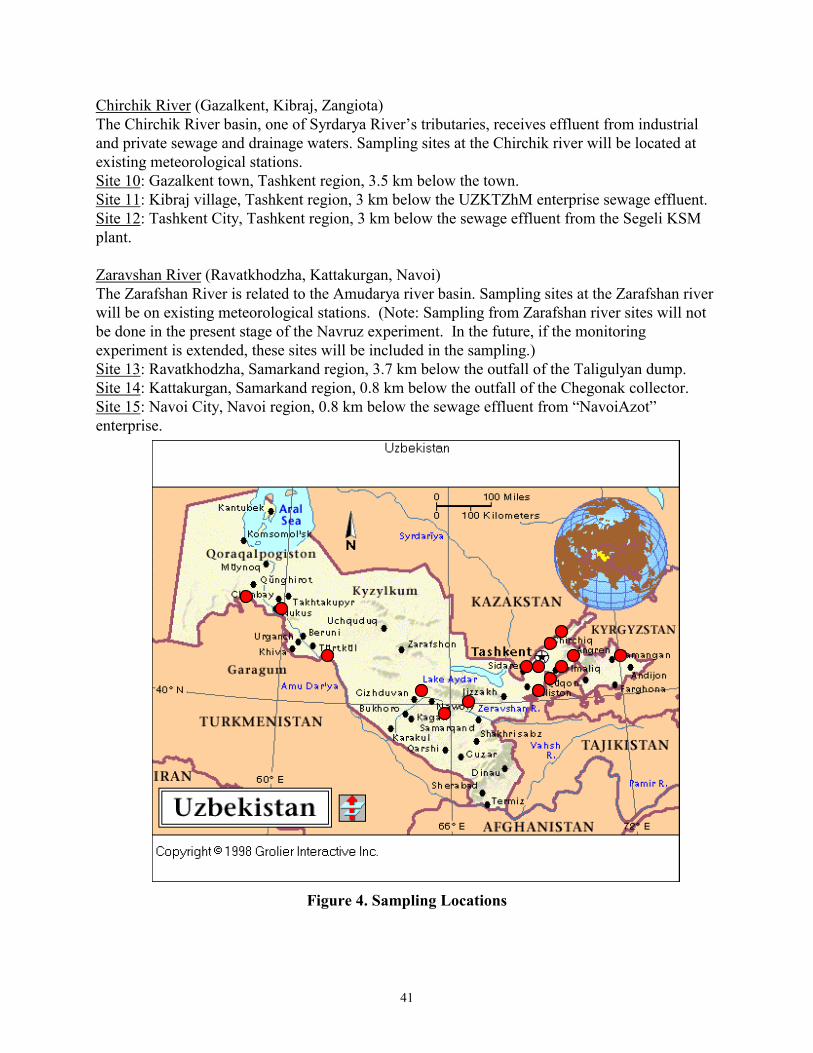
41
Chirchik River (Gazalkent, Kibraj, Zangiota)The Chirchik River basin, one of Syrdarya River’s tributaries, receives effluent from industrialand private sewage and drainage waters. Sampling sites at the Chirchik river will be located atexisting meteorological stations.Site 10: Gazalkent town, Tashkent region, 3.5 km below the town.Site 11: Kibraj village, Tashkent region, 3 km below the UZKTZhM enterprise sewage effluent.Site 12: Tashkent City, Tashkent region, 3 km below the sewage effluent from the Segeli KSMplant.
Zaravshan River (Ravatkhodzha, Kattakurgan, Navoi)The Zarafshan River is related to the Amudarya river basin. Sampling sites at the Zarafshan riverwill be on existing meteorological stations. (Note: Sampling from Zarafshan river sites will notbe done in the present stage of the Navruz experiment. In the future, if the monitoringexperiment is extended, these sites will be included in the sampling.)Site 13: Ravatkhodzha, Samarkand region, 3.7 km below the outfall of the Taligulyan dump.Site 14: Kattakurgan, Samarkand region, 0.8 km below the outfall of the Chegonak collector.Site 15: Navoi City, Navoi region, 0.8 km below the sewage effluent from “NavoiAzot”enterprise.
Figure 4. Sampling Locations
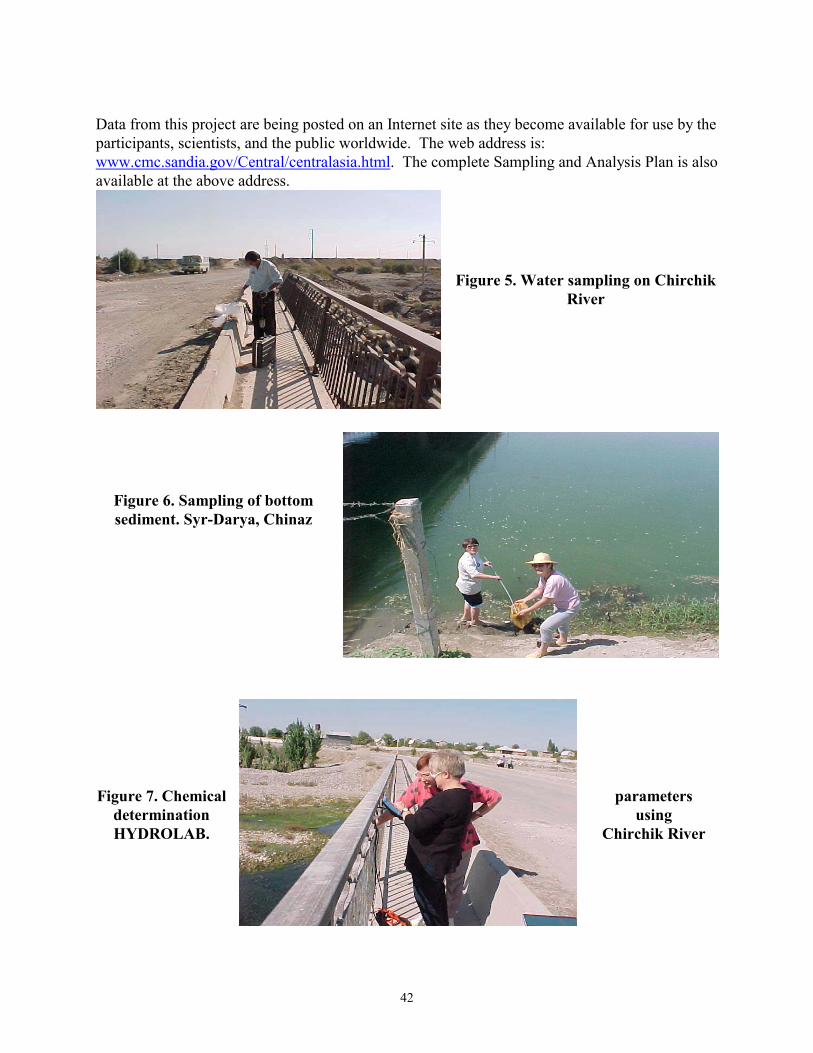
42
Data from this project are being posted on an Internet site as they become available for use by theparticipants, scientists, and the public worldwide. The web address is:www.cmc.sandia.gov/Central/centralasia.html. The complete Sampling and Analysis Plan is alsoavailable at the above address.
Figure 5. Water sampling on ChirchikRiver
Figure 6. Sampling of bottomsediment. Syr-Darya, Chinaz
Figure 7. Chemical parametersdetermination usingHYDROLAB. Chirchik River
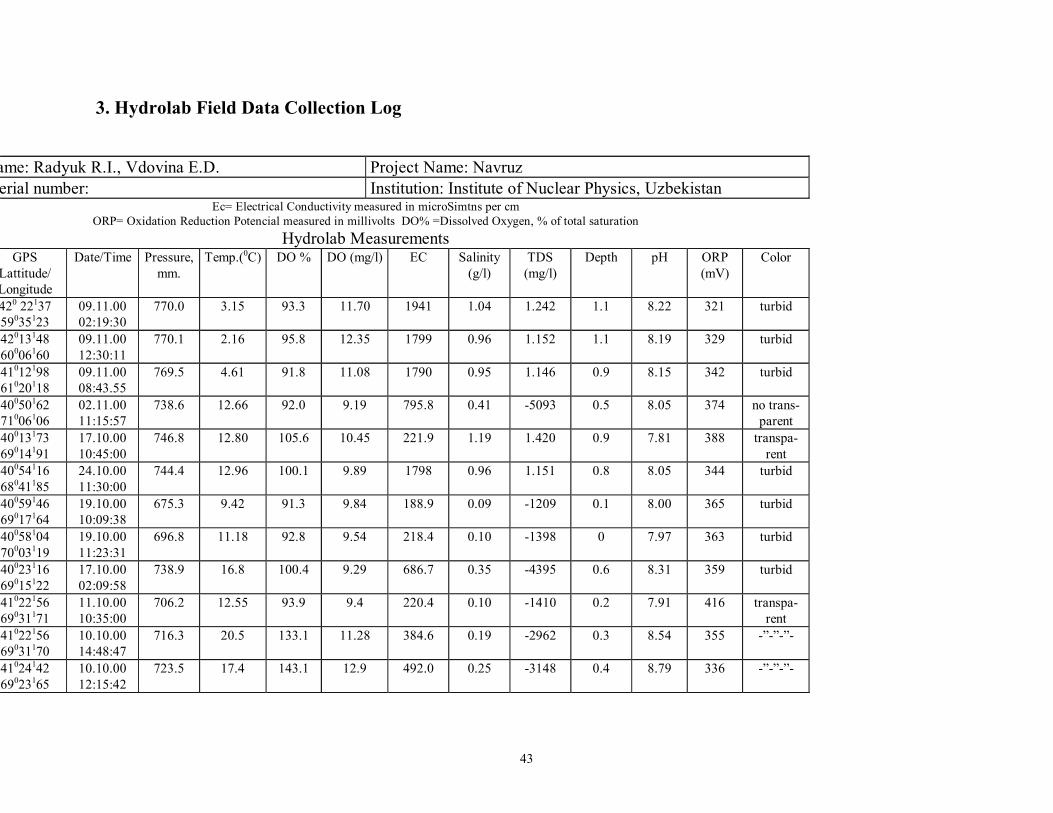
43
3. Hydrolab Field Data Collection Log
ame: Radyuk R.I., Vdovina E.D. Project Name: Navruz erial number: Institution: Institute of Nuclear Physics, Uzbekistan
Ec= Electrical Conductivity measured in microSimtns per cm ORP= Oxidation Reduction Potencial measured in millivolts DO% =Dissolved Oxygen, % of total saturation
Hydrolab Measurements GPS
Lattitude/ Longitude
Date/Time Pressure,mm.
Temp.(0C) DO % DO (mg/l) EC Salinity (g/l)
TDS (mg/l)
Depth pH ORP (mV)
Color
420 22137 59035123
09.11.00 02:19:30
770.0 3.15 93.3 11.70 1941 1.04 1.242 1.1 8.22 321 turbid
42013148 60006160
09.11.00 12:30:11
770.1 2.16 95.8 12.35 1799 0.96 1.152 1.1 8.19 329 turbid
41012198 61020118
09.11.00 08:43.55
769.5 4.61 91.8 11.08 1790 0.95 1.146 0.9 8.15 342 turbid
40050162 71006106
02.11.00 11:15:57
738.6 12.66 92.0 9.19 795.8 0.41 -5093 0.5 8.05 374 no trans- parent
40013173 69014191
17.10.00 10:45:00
746.8 12.80 105.6 10.45 221.9 1.19 1.420 0.9 7.81 388 transpa-rent
40054116 68041185
24.10.00 11:30:00
744.4 12.96 100.1 9.89 1798 0.96 1.151 0.8 8.05 344 turbid
40059146 69017164
19.10.00 10:09:38
675.3 9.42 91.3 9.84 188.9 0.09 -1209 0.1 8.00 365 turbid
40058104 70003119
19.10.00 11:23:31
696.8 11.18 92.8 9.54 218.4 0.10 -1398 0 7.97 363 turbid
40023116 69015122
17.10.00 02:09:58
738.9 16.8 100.4 9.29 686.7 0.35 -4395 0.6 8.31 359 turbid
41022156 69031171
11.10.00 10:35:00
706.2 12.55 93.9 9.4 220.4 0.10 -1410 0.2 7.91 416 transpa-rent
41022156 69031170
10.10.00 14:48:47
716.3 20.5 133.1 11.28 384.6 0.19 -2962 0.3 8.54 355 -”-”-”-
41024142 69023165
10.10.00 12:15:42
723.5 17.4 143.1 12.9 492.0 0.25 -3148 0.4 8.79 336 -”-”-”-
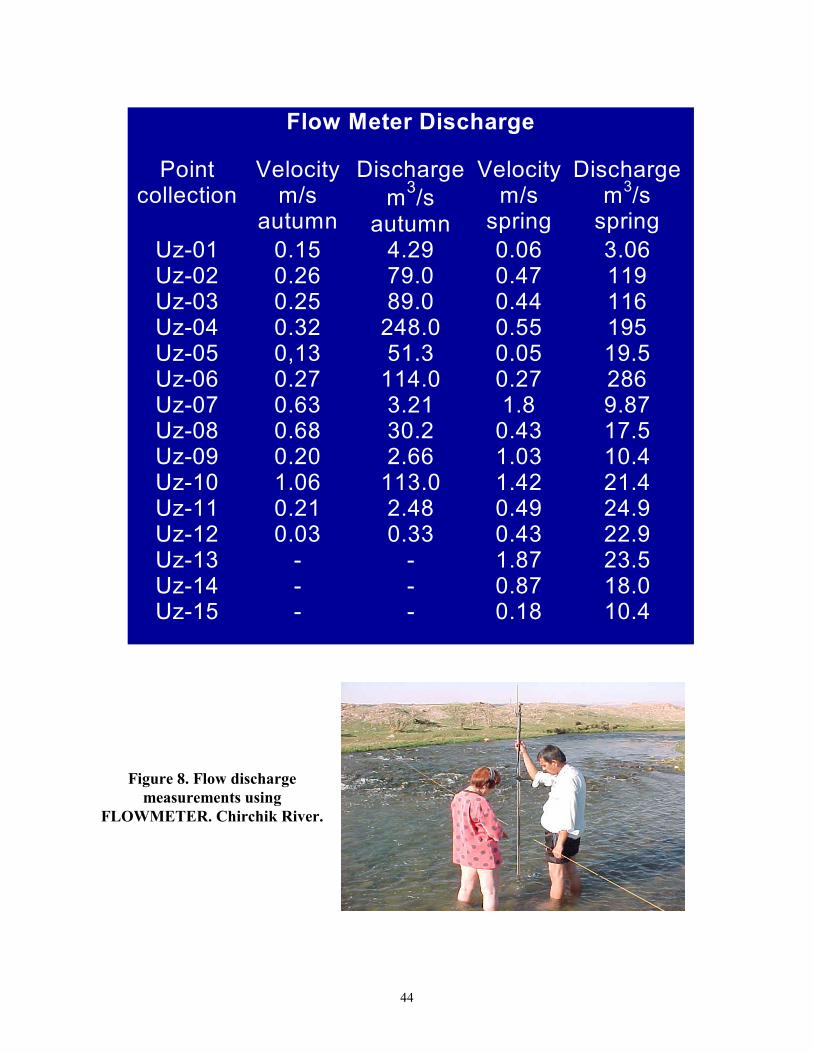
44
Figure 8. Flow dischargemeasurements using
FLOWMETER. Chirchik River.
Flow Meter Discharge
Point collection
Velocitym/s
autumn
Dischargem3/s
autumn
Velocitym/s
spring
Dischargem3/s
spring Uz-01 0.15 4.29 0.06 3.06 Uz-02 0.26 79.0 0.47 119 Uz-03 0.25 89.0 0.44 116 Uz-04 0.32 248.0 0.55 195 Uz-05 0,13 51.3 0.05 19.5 Uz-06 0.27 114.0 0.27 286 Uz-07 0.63 3.21 1.8 9.87 Uz-08 0.68 30.2 0.43 17.5 Uz-09 0.20 2.66 1.03 10.4 Uz-10 1.06 113.0 1.42 21.4 Uz-11 0.21 2.48 0.49 24.9 Uz-12 0.03 0.33 0.43 22.9 Uz-13 - - 1.87 23.5 Uz-14 - - 0.87 18.0 Uz-15 - - 0.18 10.4
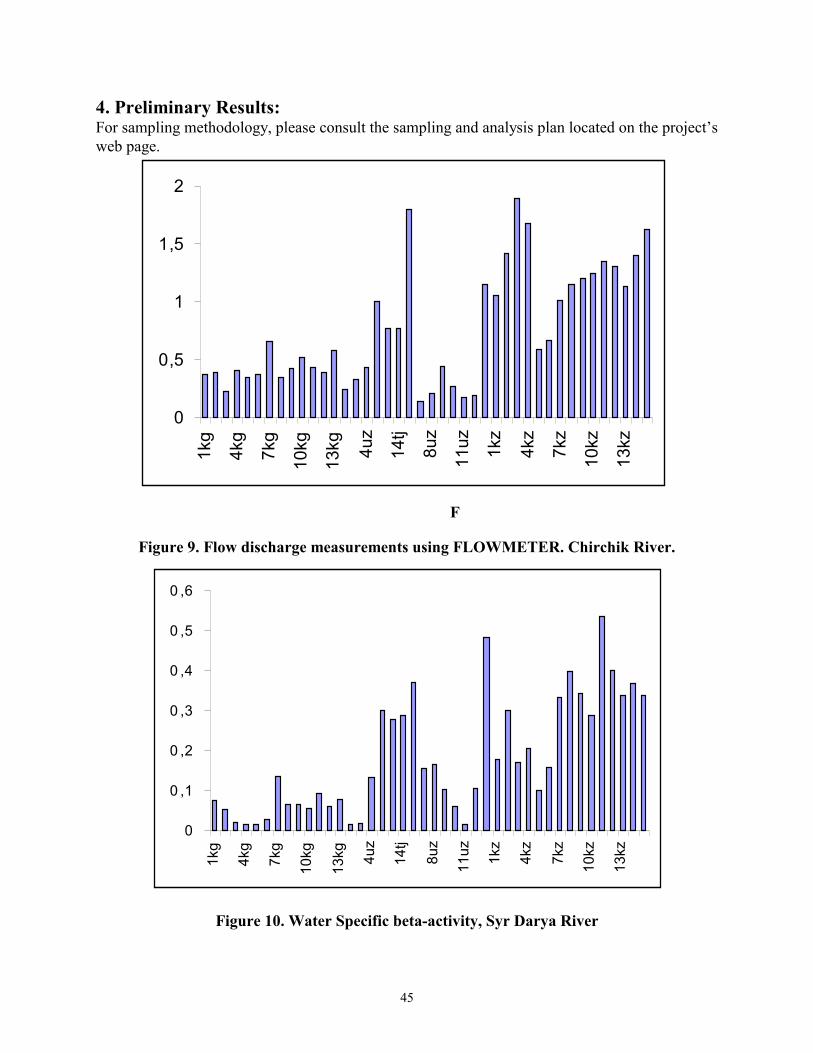
45
4. Preliminary Results:For sampling methodology, please consult the sampling and analysis plan located on the project’sweb page.
F
Figure 9. Flow discharge measurements using FLOWMETER. Chirchik River.
Figure 10. Water Specific beta-activity, Syr Darya River
0
0,5
1
1,5
21k
g
4kg
7kg
10kg
13kg 4u
z
14tj
8uz
11uz 1kz
4kz
7kz
10kz
13kz
0
0 ,1
0 ,2
0 ,3
0 ,4
0 ,5
0 ,6
1kg
4kg
7kg
10kg
13kg 4u
z
14tj
8uz
11uz 1kz
4kz
7kz
10kz
13kz
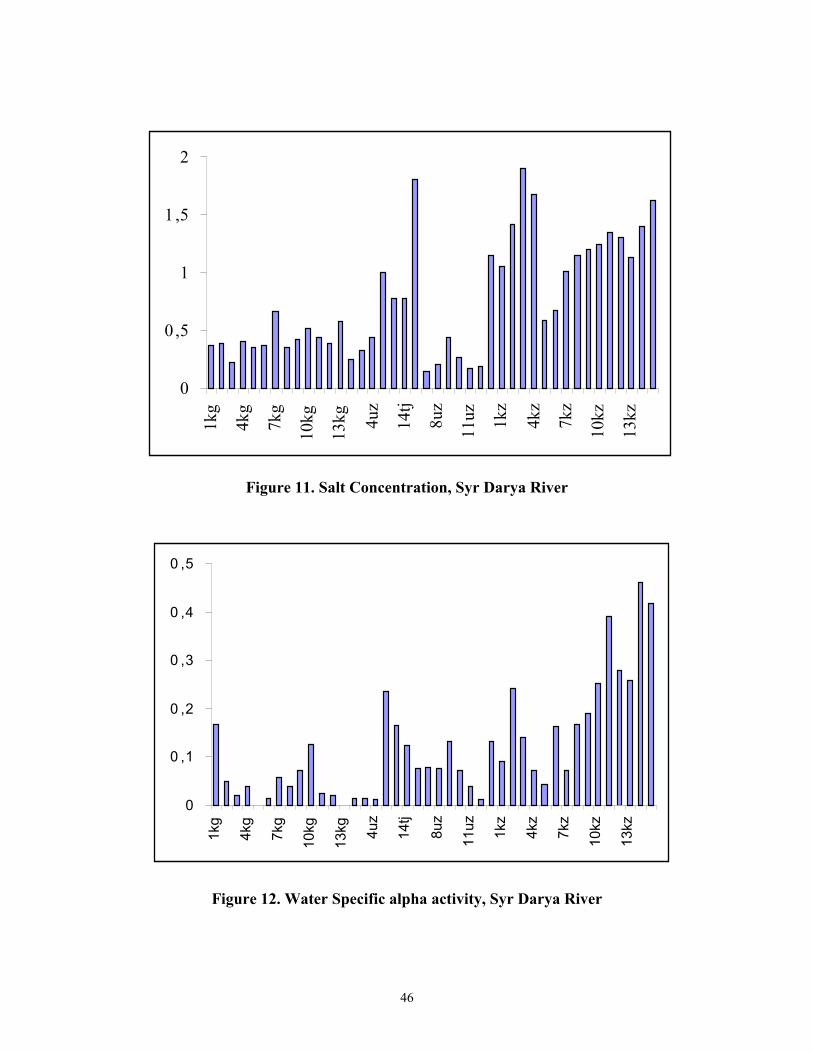
46
Figure 11. Salt Concentration, Syr Darya River
Figure 12. Water Specific alpha activity, Syr Darya River
0
0,5
1
1 ,5
2
1kg
4kg
7kg
10kg
13kg 4u
z
14tj
8uz
11uz 1k
z
4kz
7kz
10kz
13kz
0
0 ,1
0 ,2
0 ,3
0 ,4
0 ,5
1kg
4kg
7kg
10kg
13kg 4u
z
14tj
8uz
11uz 1kz
4kz
7kz
10kz
13kz
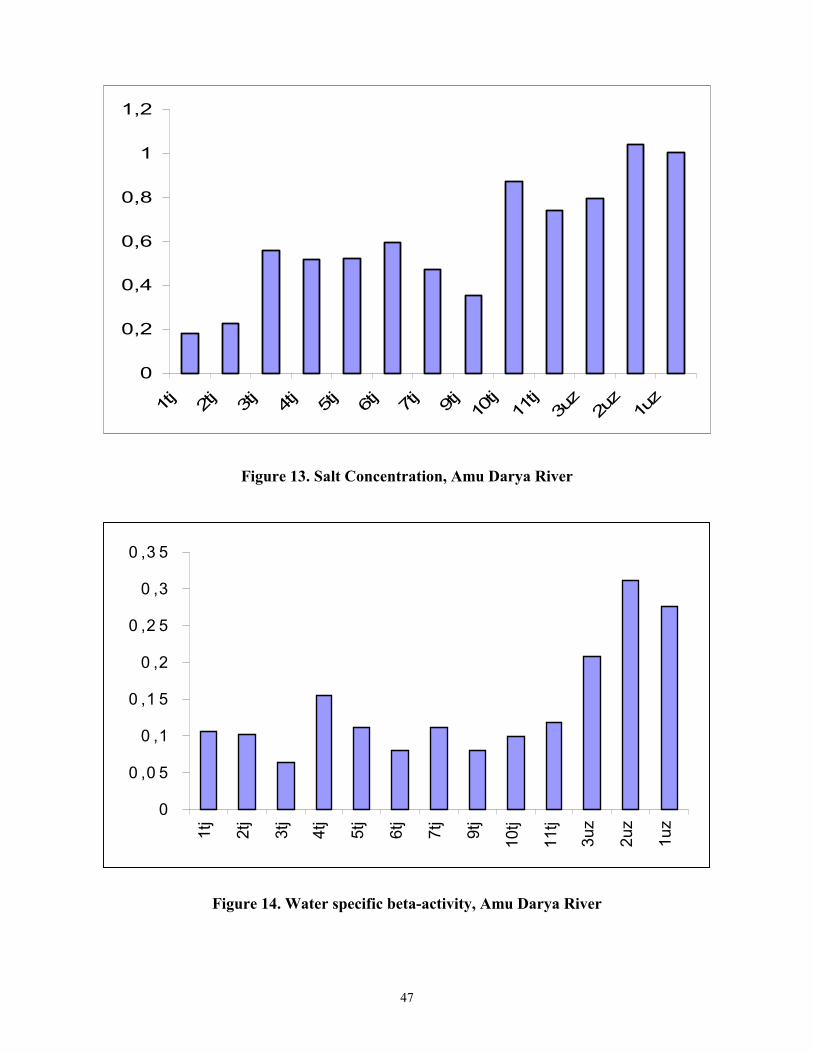
47
Figure 13. Salt Concentration, Amu Darya River
Figure 14. Water specific beta-activity, Amu Darya River
0
0,2
0,4
0,6
0,8
1
1,2
1tj 2tj 3tj 4tj 5tj 6tj 7tj 9tj 10tj
11tj
3uz
2uz
1uz
0
0 ,0 5
0 ,1
0 ,1 5
0 ,2
0 ,2 5
0 ,3
0 ,3 5
1tj
2tj
3tj
4tj
5tj
6tj
7tj
9tj
10tj
11tj
3uz
2uz
1uz
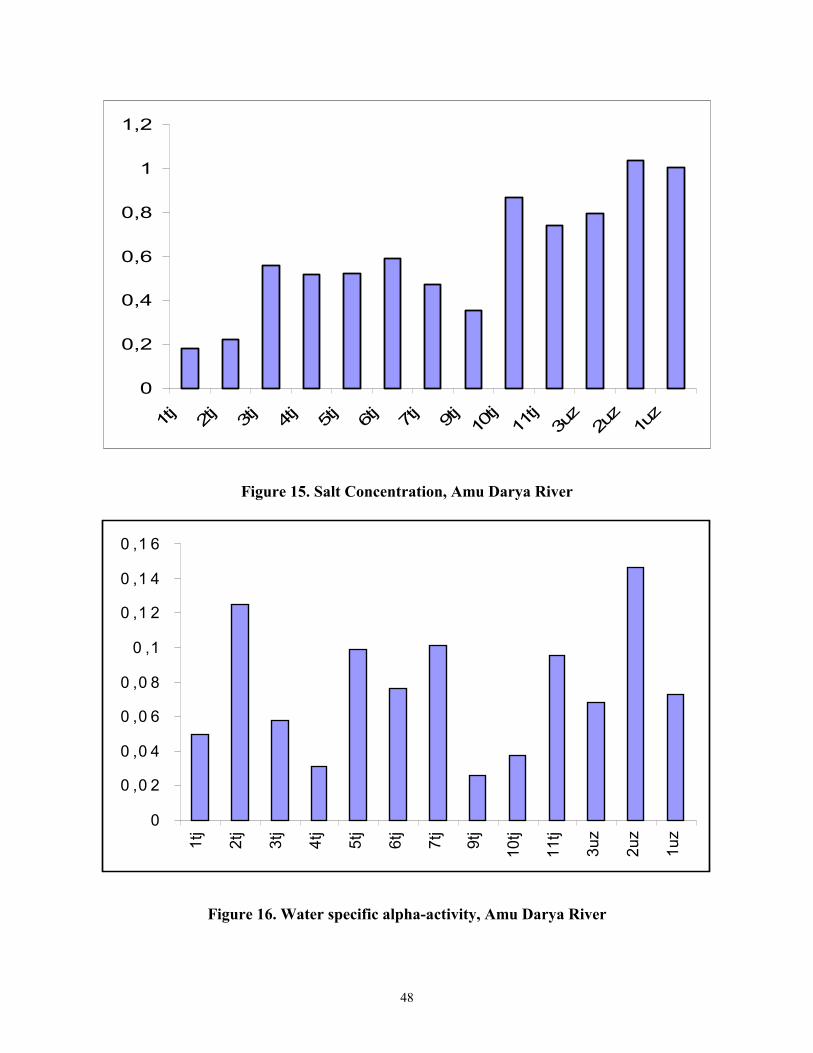
48
Figure 15. Salt Concentration, Amu Darya River
Figure 16. Water specific alpha-activity, Amu Darya River
0
0,2
0,4
0,6
0,8
1
1,2
1tj 2tj 3tj 4tj 5tj 6tj 7tj 9tj 10tj
11tj
3uz
2uz
1uz
0
0 ,0 2
0 ,0 4
0 ,0 6
0 ,0 8
0 ,1
0 ,1 2
0 ,1 4
0 ,1 6
1tj
2tj
3tj
4tj
5tj
6tj
7tj
9tj
10tj
11tj
3uz
2uz
1uz
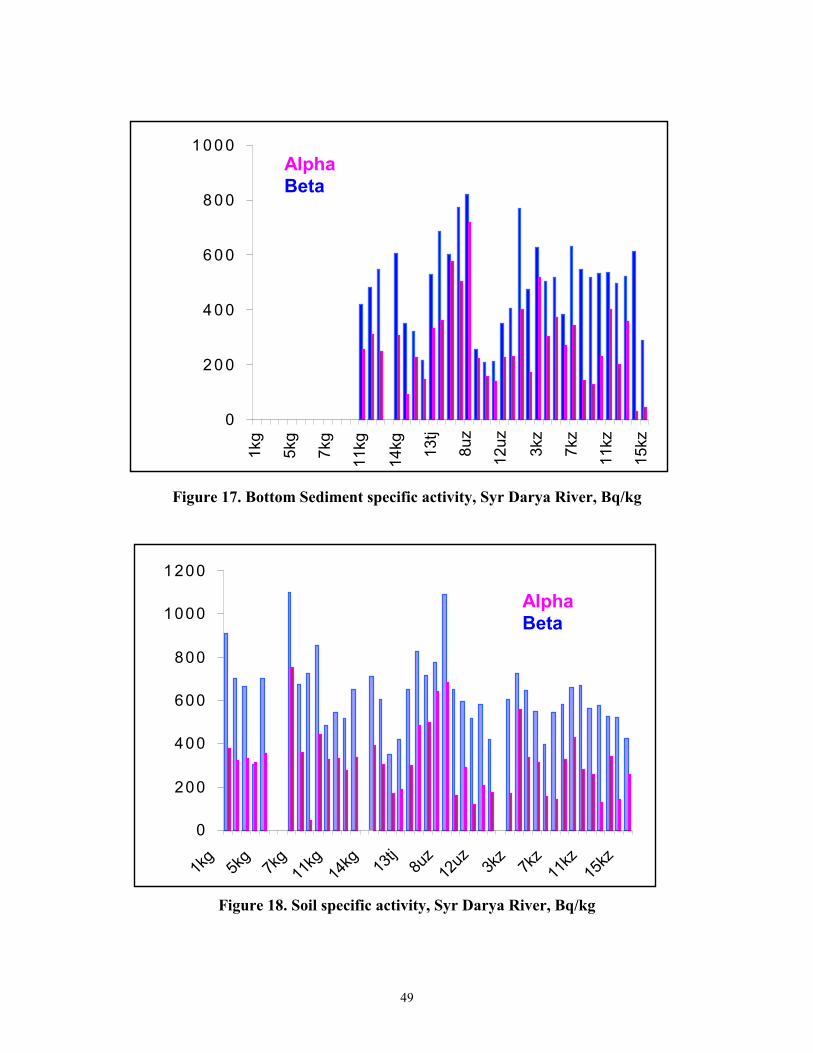
49
Figure 17. Bottom Sediment specific activity, Syr Darya River, Bq/kg
Figure 18. Soil specific activity, Syr Darya River, Bq/kg
0
2 0 0
4 0 0
6 0 0
8 0 0
1 0 0 0
1kg
5kg
7kg
11kg
14kg 13
tj
8uz
12uz 3kz
7kz
11kz
15kz
AlphaBeta
0
200
400
600
800
1000
1200
1kg
5kg
7kg
11kg
14kg 13
tj8u
z12
uz 3kz
7kz
11kz
15kz
AlphaBeta
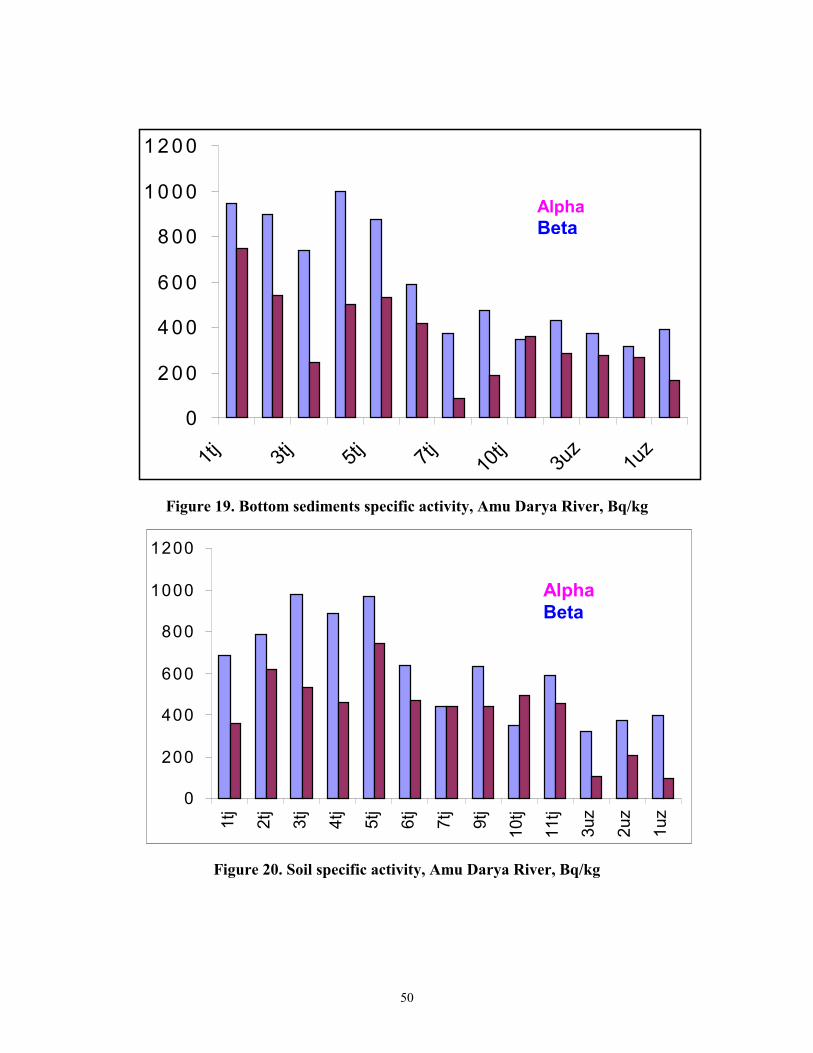
50
Figure 19. Bottom sediments specific activity, Amu Darya River, Bq/kg
Figure 20. Soil specific activity, Amu Darya River, Bq/kg
0
200
400
600
800
1000
1200
1tj
2tj
3tj
4tj
5tj
6tj
7tj
9tj
10tj
11tj
3uz
2uz
1uz
AlphaBeta
0
2 0 0
4 0 0
6 0 0
8 0 0
1 0 0 0
1 2 0 0
1tj 3tj 5tj 7tj 10tj 3u
z1u
z
AlphaBeta
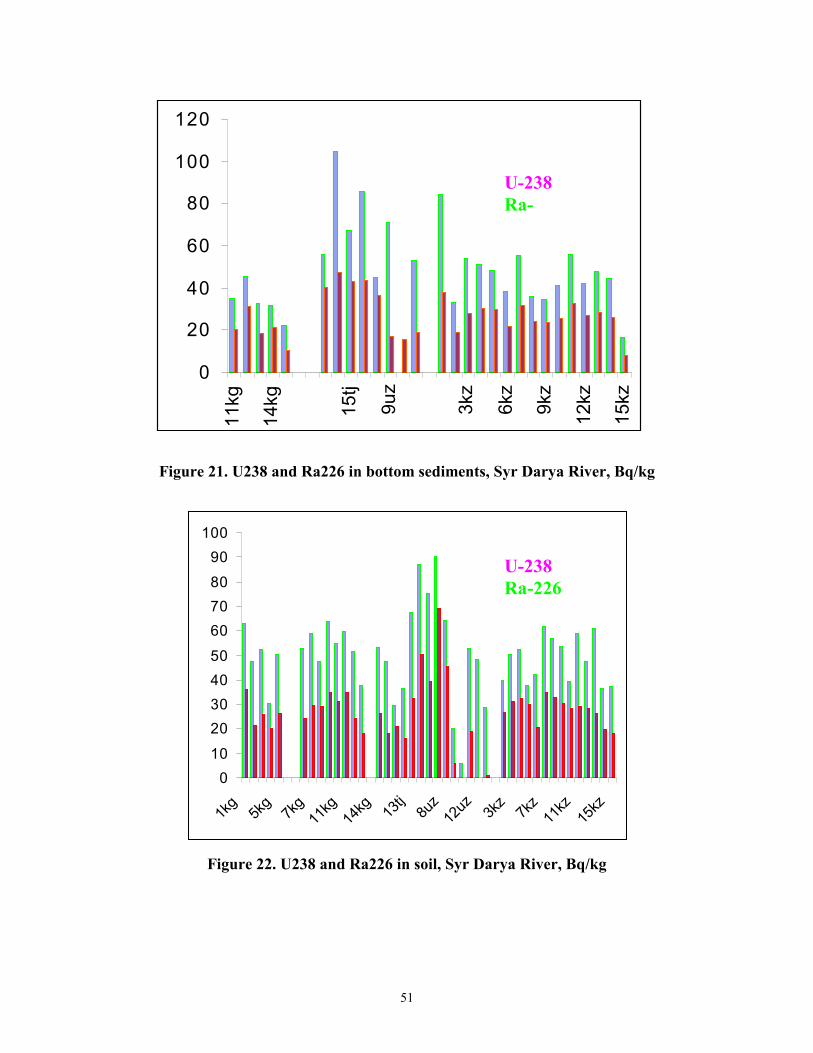
51
Figure 21. U238 and Ra226 in bottom sediments, Syr Darya River, Bq/kg
Figure 22. U238 and Ra226 in soil, Syr Darya River, Bq/kg
0
20
40
60
80
100
120
11kg
14kg 15tj
9uz
3kz
6kz
9kz
12kz
15kz
0102030405060708090
100
1kg
5kg
7kg
11kg
14kg 13
tj8u
z12
uz 3kz
7kz
11kz
15kz
U-238Ra-226
U-238Ra-

52
Figure 23. U238 and Ra226 in bottom sediments, Amu Darya River, Bq/kg
Figure 24. U238 and Ra226 in bottom sediments, Amu Darya River, Bq/kg
0
2 0
4 0
6 0
8 0
10 0
12 0
1tj 2tj 3tj 4tj 5tj 6tj 7tj 9tj 10tj
11tj
U-238Ra-226
020406080
100120140160
1tj 3tj 5tj 7tj 10tj
3uz
1uz
U-238Ra-226
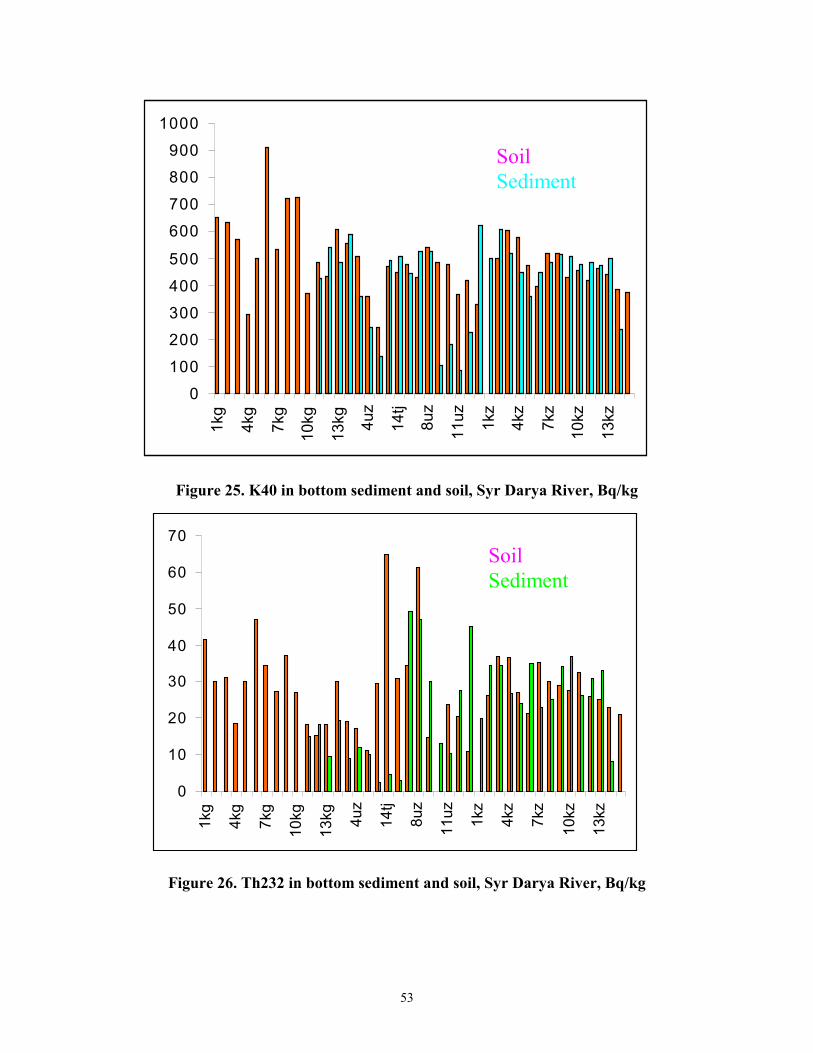
53
Figure 25. K40 in bottom sediment and soil, Syr Darya River, Bq/kg
Figure 26. Th232 in bottom sediment and soil, Syr Darya River, Bq/kg
0100200300400500
600700800900
1000
1kg
4kg
7kg
10kg
13kg 4u
z
14tj
8uz
11uz 1kz
4kz
7kz
10kz
13kz
SoilSediment
0
10
20
30
40
50
60
70
1kg
4kg
7kg
10kg
13kg 4u
z
14tj
8uz
11uz 1kz
4kz
7kz
10kz
13kz
SoilSediment
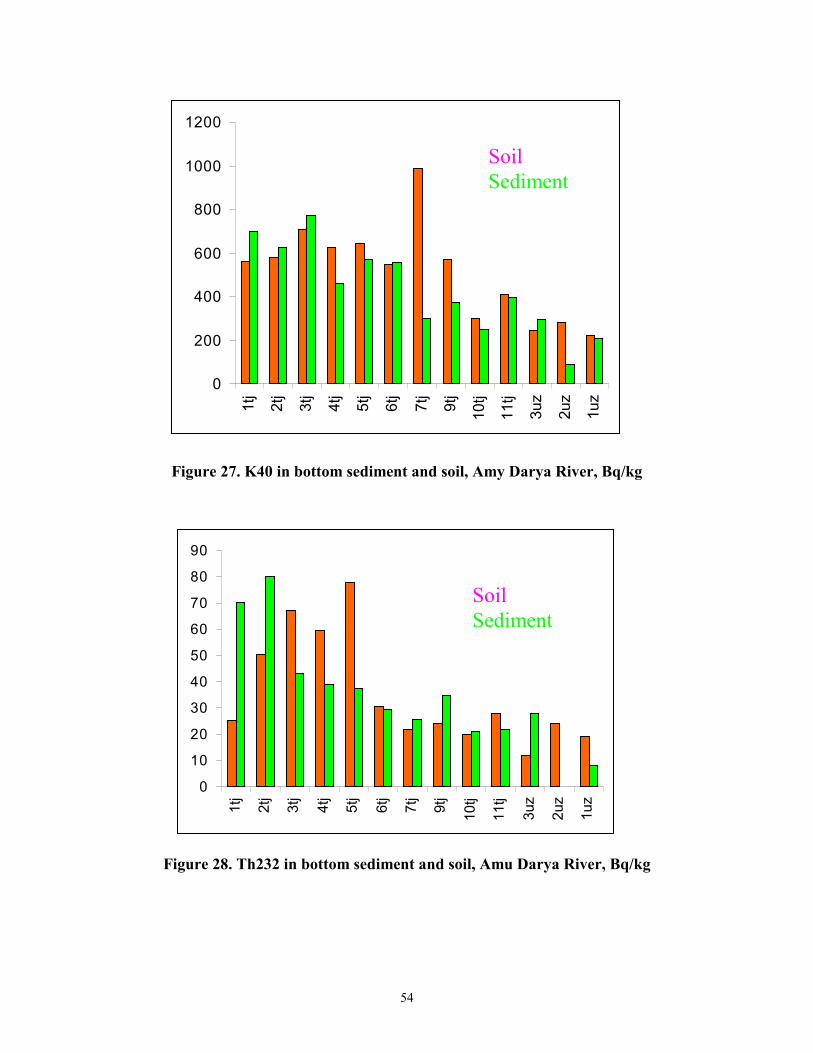
54
Figure 27. K40 in bottom sediment and soil, Amy Darya River, Bq/kg
Figure 28. Th232 in bottom sediment and soil, Amu Darya River, Bq/kg
0
200
400
600
800
1000
1200
1tj
2tj
3tj
4tj
5tj
6tj
7tj
9tj
10tj
11tj
3uz
2uz
1uz
SoilSediment
0
10
20
30
40
50
60
70
80
90
1tj
2tj
3tj
4tj
5tj
6tj
7tj
9tj
10tj
11tj
3uz
2uz
1uz
SoilSediment
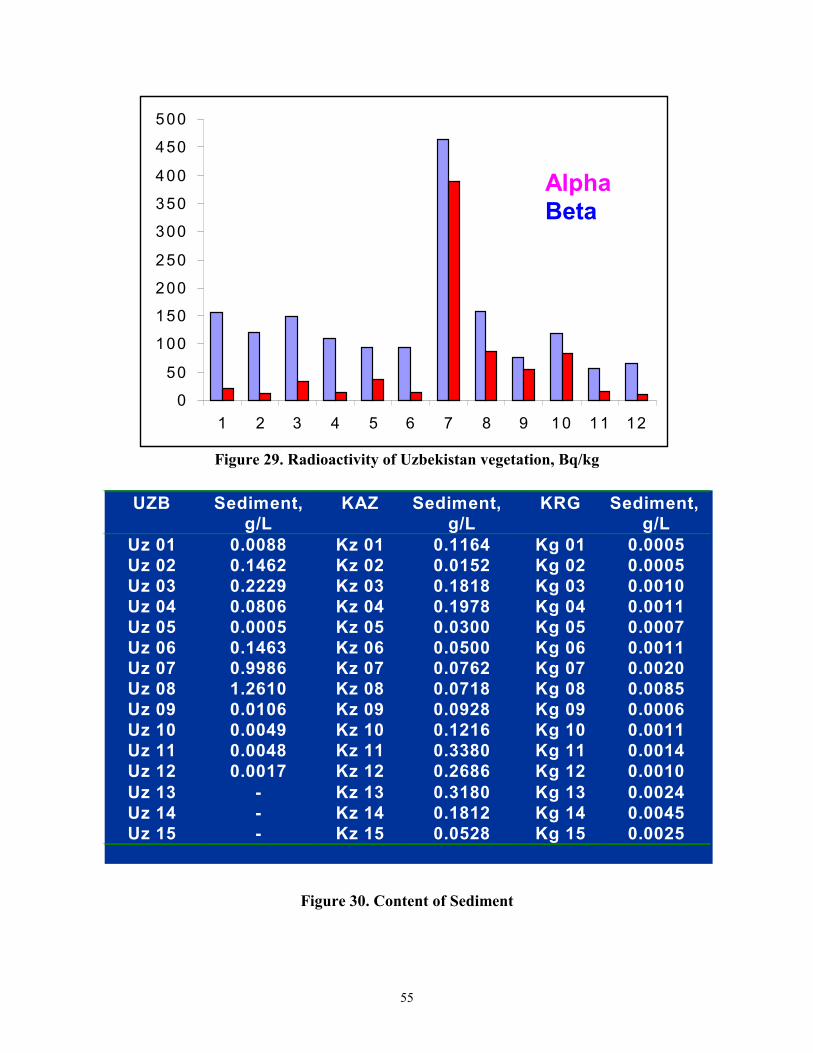
55
Figure 29. Radioactivity of Uzbekistan vegetation, Bq/kg
Figure 30. Content of Sediment
0
50
100
150
200
250
300
350
400
450
500
1 2 3 4 5 6 7 8 9 10 11 12
AlphaBeta
UZB Sediment, g/L
KAZ Sediment, g/L
KRG Sediment, g/L
Uz 01 0.0088 Kz 01 0.1164 Kg 01 0.0005 Uz 02 0.1462 Kz 02 0.0152 Kg 02 0.0005 Uz 03 0.2229 Kz 03 0.1818 Kg 03 0.0010 Uz 04 0.0806 Kz 04 0.1978 Kg 04 0.0011 Uz 05 0.0005 Kz 05 0.0300 Kg 05 0.0007 Uz 06 0.1463 Kz 06 0.0500 Kg 06 0.0011 Uz 07 0.9986 Kz 07 0.0762 Kg 07 0.0020 Uz 08 1.2610 Kz 08 0.0718 Kg 08 0.0085 Uz 09 0.0106 Kz 09 0.0928 Kg 09 0.0006 Uz 10 0.0049 Kz 10 0.1216 Kg 10 0.0011 Uz 11 0.0048 Kz 11 0.3380 Kg 11 0.0014 Uz 12 0.0017 Kz 12 0.2686 Kg 12 0.0010 Uz 13 - Kz 13 0.3180 Kg 13 0.0024 Uz 14 - Kz 14 0.1812 Kg 14 0.0045 Uz 15 - Kz 15 0.0528 Kg 15 0.0025

56
Figure 31. Alpha and betaradioactivity measurements usingNRR-610. Analyst E.D. Vdovina
Figure 32. Sampling expedition, V.S.Vasilieva, A. Rakhimbayev, E.D.
Vdovina, O.A. Smolkova
Figure 33. Water sample preparation.Analyst S.I. Yatsenko
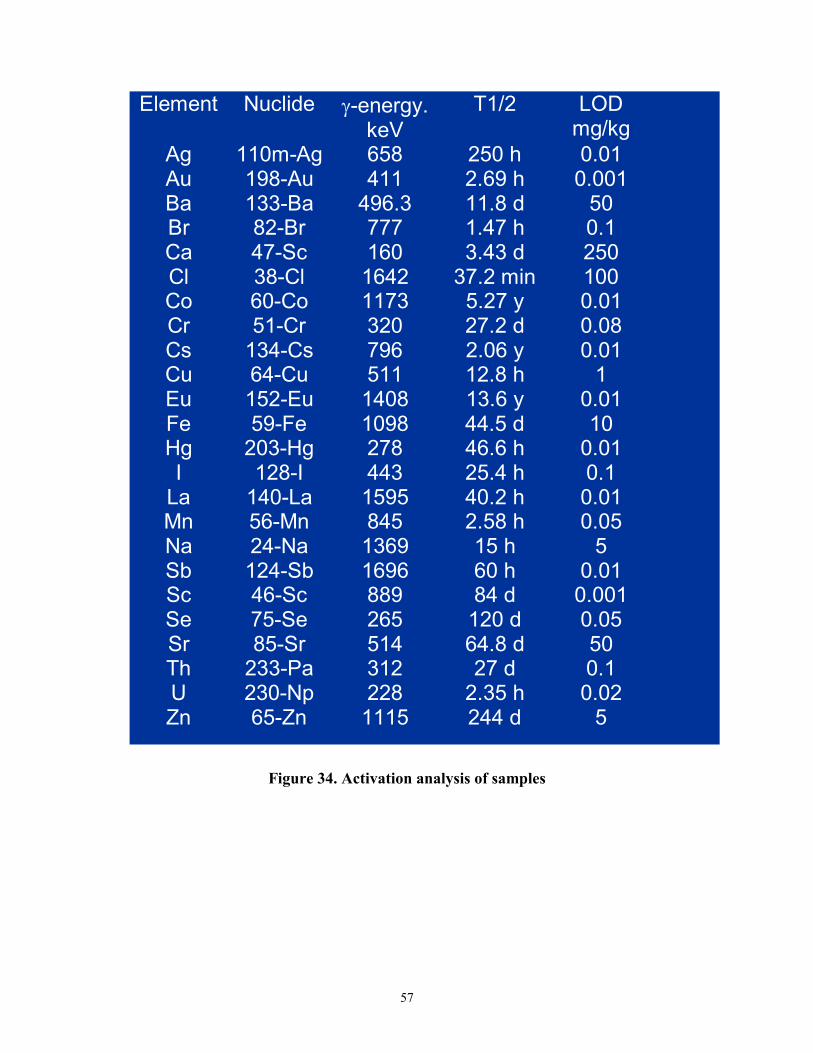
57
Figure 34. Activation analysis of samples
Element Nuclide �-energy.keV
T1/2 LOD mg/kg
Ag 110m-Ag 658 250 h 0.01 Au 198-Au 411 2.69 h 0.001 Ba 133-Ba 496.3 11.8 d 50 Br 82-Br 777 1.47 h 0.1 Ca 47-Sc 160 3.43 d 250 Cl 38-Cl 1642 37.2 min 100 Co 60-Co 1173 5.27 y 0.01 Cr 51-Cr 320 27.2 d 0.08 Cs 134-Cs 796 2.06 y 0.01 Cu 64-Cu 511 12.8 h 1 Eu 152-Eu 1408 13.6 y 0.01 Fe 59-Fe 1098 44.5 d 10 Hg 203-Hg 278 46.6 h 0.01 I 128-I 443 25.4 h 0.1
La 140-La 1595 40.2 h 0.01 Mn 56-Mn 845 2.58 h 0.05 Na 24-Na 1369 15 h 5 Sb 124-Sb 1696 60 h 0.01 Sc 46-Sc 889 84 d 0.001 Se 75-Se 265 120 d 0.05 Sr 85-Sr 514 64.8 d 50 Th 233-Pa 312 27 d 0.1 U 230-Np 228 2.35 h 0.02 Zn 65-Zn 1115 244 d 5
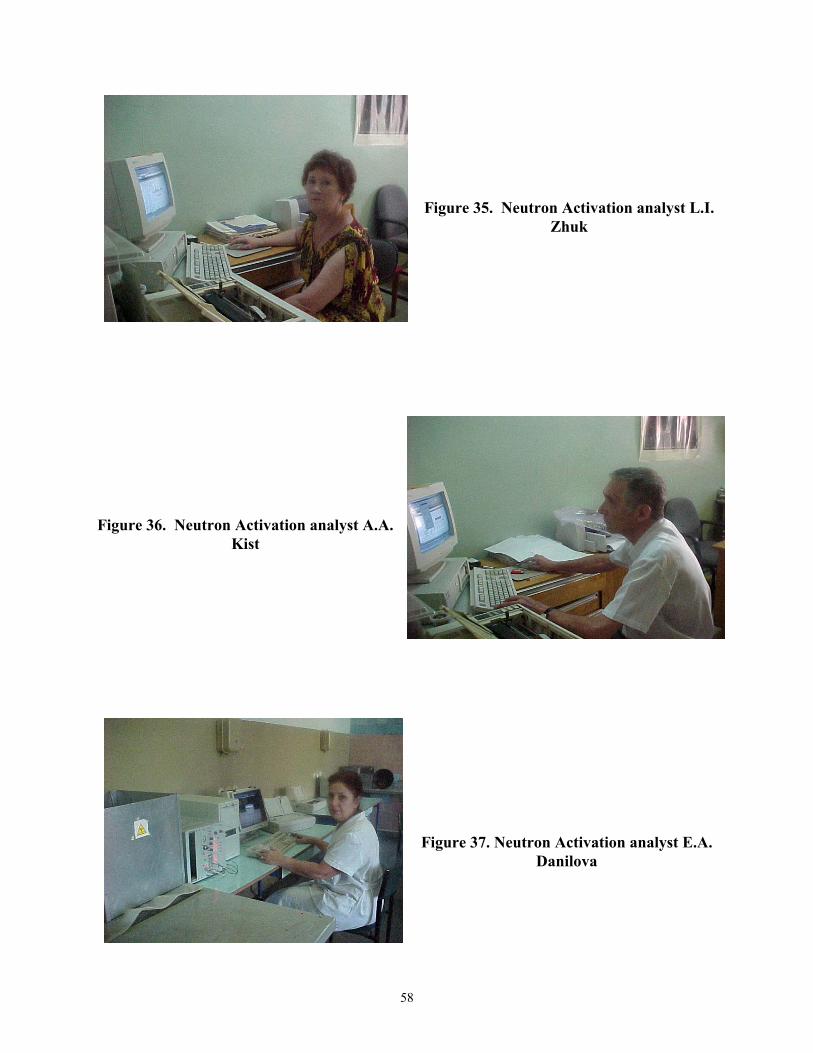
58
Figure 35. Neutron Activation analyst L.I.Zhuk
Figure 36. Neutron Activation analyst A.A.Kist
Figure 37. Neutron Activation analyst E.A.Danilova

59
Figure 38. Water dissolved Na., Syr Darya River, mg/L
Figure 39. Th concentrations in bottom sediment, SyrDarya, Autum, mg.kg
0
50
100
150
200
250
300
350
400
1 2 3 4 5 6 7 8 9 10 11 12
Aral-Sea Mountains
AUTUMNSPRING
0
5
1 0
1 5
2 0
2 5
3 0
1 4 7 10 13 16 19 22 25 28 31 34 37 40
No.Samples
Mountains Aral-Sea
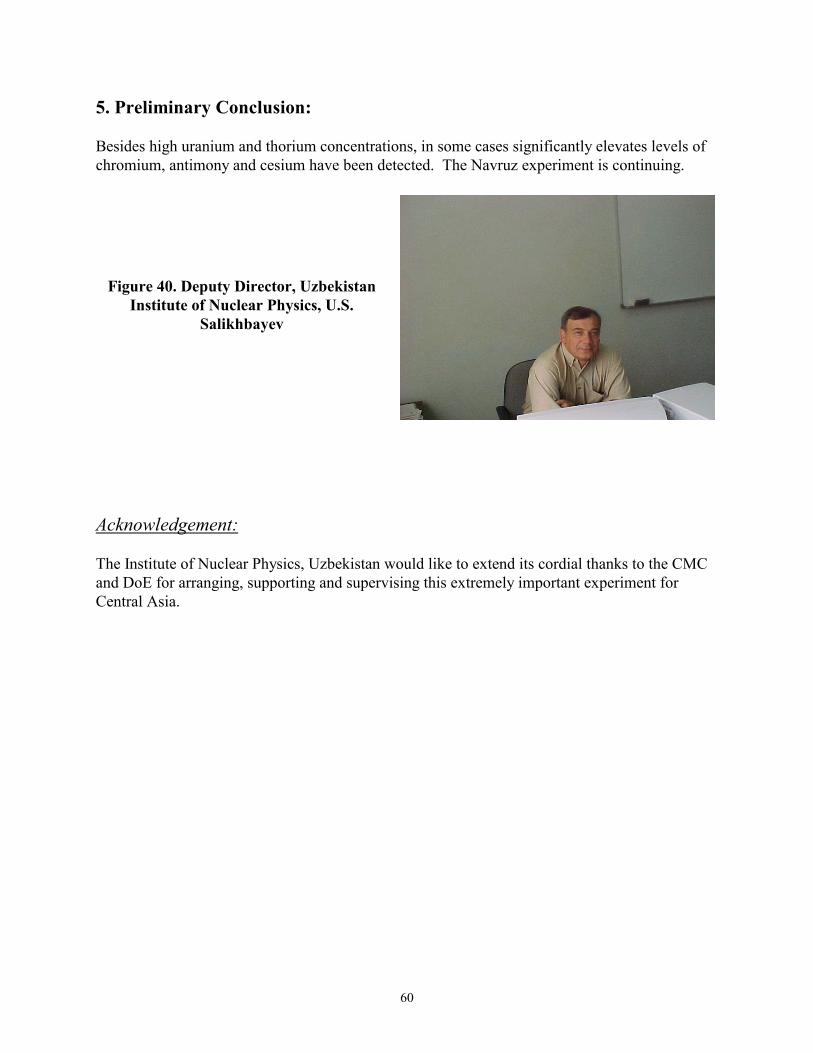
60
5. Preliminary Conclusion:
Besides high uranium and thorium concentrations, in some cases significantly elevates levels ofchromium, antimony and cesium have been detected. The Navruz experiment is continuing.
Figure 40. Deputy Director, UzbekistanInstitute of Nuclear Physics, U.S.
Salikhbayev
Acknowledgement:
The Institute of Nuclear Physics, Uzbekistan would like to extend its cordial thanks to the CMCand DoE for arranging, supporting and supervising this extremely important experiment forCentral Asia.
61
Tajikistan
1. Introduction
Water and life are inseparably linked. Once considered an infinitely renewable and abundantresource, today water defines and establishes human, social, and economic boundaries in almostall parts of the world.
Considering the important role water plays on the planet and in order to focus attention of theworld community on issues related to water resource utilization strategies, the year 2003 hasbeen declared to be the "International Year of Freshwater" by the 54th U.N. General Assembly,in response to a proposal by the President of Tajikistan E. Sh. Rakhmonov.
In countries that currently have adequate freshwater reserves, requirements with regard to watersystem pollution are being tightened, while in developing countries, the demand for freshwater isincreasing constantly owing to the rapid growth of agriculture and industry and the developmentof urban centers.
Considering the potential effects of global warming and climate changes on the Earth, futureavailability of freshwater seems more doubtful than at any previous time.
This challenge of nature is forcing people to unite and find possibilities for working together tofind specific solutions to the problem.
The problem of sound utilization of water resources to support the population of Central Asia isone of the constant subjects of discussion at the majority of regional forums. The scope ofproblems discussed at these forums, ranging from jurisprudence to agronomy, confirms theimportance of the water utilization problem.
An important feature of rivers in our region is that they cross national boundaries. This imposesa particular responsibility for preserving their purity and utilizing them soundly, and in turnproduces an insistent need to work out legal norms and international agreements regarding thejoint utilization of water, taking account of the interests of all regional governments. Theresolution of this problem must utilize international experience, and must involve theparticipation of various government and social agencies. The tragedy of the Aral sea alsocompels us to pursue this goal.
The Cooperative Monitoring Center of the Sandia National Laboratory and the Center forNonproliferation Studies at the Monterey Institute for International Studies have developed aproposal for the joint conduct of an experiment to perform radioecological monitoring in CentralAsia, involving scientists from countries of the Central Asian region.
62
Understanding that the solution of the problem is only possible on the basis of precise scientificdata and with the utilization of international experience, the scientists of Tajikistan take greatpleasure in agreeing to participate in the proposed experiment.
The basic goal of the experiment has been defined by us as follows: "The experiment to jointlymonitor radionuclides in Central Asian regional water systems will increase the level of mutualtrust among regional governments, who are preparing to sign a Nuclear-Weapons-Free ZoneAgreement. In addition, it will serve as an example to the entire world community of anotherscientifically based approach to establishing transparent observance of conditions related to theAgreement on Nonproliferation of Nuclear Weapons. In the Central Asian region, water is life,and any international cooperation between nations on this real, first-order issue that affects thislife-essential resource will serve to benefit all countries of the region."
Samples of water from various bodies of water in the region are very revealing from aninformation point of view and are sensitive to various industrial effects. A decision was made totake samples twice yearly for water, associated vegetation, bottom sediment, and adjacent soil ata number of specified points in the Syrdarya and Amudarya river basins. The data obtained in thecourse of radiation monitoring of water systems must be accessible for use in future research incountries of the region, in particular, those related to the problem of the Aral sea and otherecologically troubled areas.
It was decided to perform the experiment using the largest analytical laboratories at scientific-research centers of the participating countries. At the same time, exchanges of data and samplesis anticipated, in the spirit of cooperation.
In response to a proposal by a group of Tajikistan scientists, "NAVRUZ" was adopted as theabbreviated name of the experiment. The Navruz holiday is one of the springtime reawakening ofnature and is a holiday common to all peoples inhabiting the Central Asian region.
Colleagues from the International Center for the Study of Cosmic Rays at the PhysicotechnicalInstitute of the Academy of Sciences and from the radiochemical laboratory of the Ministry ofEmergency Situations were engaged in the experiment on behalf of the Republic of Tajikistan.
63
2. Description of sampling locations
"Moverounnakhr is the richest country in the Islamic world...." "Sogd is the most fertile ofAllah's countries. It has the best fruit; all dwellings have gardens, cisterns, and running water; itis rare for a street or house to not have a canal with running water. Moreover, the people here arethe most kind, generous, enlightened, and hospitable." The 10th century Arab traveler al-Istarkhidescribed the Central Asian region in this way."
Tajikistan is one of the most water-producing territories in the Central Asian region. The overallarea of Tajikistan is 14.31 million hectares, which comprises only 11.2% of the area of CentralAsia. Around 9.4 million hectares of the country's territory is situated at an altitude of 2000 mand higher above sea level. It is in this mountainous territory, which comprises only about 7.5%of the area of Central Asia, that more than 65% of the water resources of the Aral Sea basin arecreated. In accordance with scientific analyses, the dynamic water resources in Tajikistancomprise about 60 km3 per year, of which about 8 km3 are due to subsurface water that is formeddirectly in the runoff zone owing to the infiltration of atmospheric precipitation into strata ofecologically clean pebble–sand rock strata, while the rest, approximately 52 km3, trace theirorigin directly to atmospheric precipitation and melted snow and glaciers.
The rivers of Tajikistan, basically, find their source high in the mountains and are fed first bymelted water from seasonal snows and rain water (at altitudes of up to 3000 m) in March–June,and afterward, by melted water from high-mountain snow and glaciers, in July–August. At thistime, [when] the afternoon air temperature in the mountains rises above zero by one degree, theaverage thickness of melted water is 5.5 mm. Rivers, which collect the rain and melted waterfrom large and small drainage areas in the mountainous relief and at various altitudes, are mostoften characterized by mixed supplies: glacial–snow or snow–glacial. The fraction of rain waterin the annual flow in rivers is small, as is the purely glacial fraction. In terms of river watersupply, the year is divided into 3 periods. The first is the low water period, when the supply fromsnow and glaciers is very small or is absent altogether and rivers are fed by subsurface water(November–December). The second is a high-water snow and rain period (March–June), wherethe high-water snow period may start in February in years when winters are mild or humid. Thethird is the snow–glacier flood period (July–October).
The surface water created in the republic is of 1st and 2nd class purity. The concentration ofcontaminants in water does not attain high levels and, as a rule, does not exceed 10 MAC. Forexample, during the high-water period, the salinity of water in the Kafirnigan river near the cityof Kafirnigan is 0.1 g/L, while during the low-water period, when the fraction of subsurfacesupply is more significant, this level rises to 0.2 g/L. On the whole, salinity of river water in thecentral and southern territory of Tajikistan (the Zarafshan, Kafirnigan, Vakhsh, and Pyandzhrivers) is between 0.1–0.4 g/L, while in Northern Tajikistan, the average salinity of the Syrdaryariver above the Kayrakkum reservoir and below it is between 1.15–1.07 g/L.
The largest subwatershed area for one of the largest rivers of Central Asia - the Amudarya river -is found within the republic, and it comprises 199,350 thousand km2. There are more than athousand glaciers in its water basin, including the Fedchenko glacier, many snowfields, and

64
permanent snow cover. Its flow comprises 79 km3/yr, which is 3 times larger than the annualaverage flow of the Syrdarya or Don rivers, and its water content is not less than that of theDnepr. Most of the rivers in the Amudaryinsk basin are fed by glacier–snow water. The same istrue for its primary tributaries, the Pyandzh and Vakhsh, and most of the other tributaries of theserivers. The Kafirnigan, Kyzylsu, Yakhsu, and some others are fed by snow–glacier water. TheAmudarya is formed by the confluence of the Pyandzh and Vakhsh rivers. Somewhat to the west,at the Aivadzh settlement, the Kafirnigan river joins the Amudarya while still within Tajikistan.
In the north of the republic, the second longest river in Central Asia - the Syrdarya - flows fromeast to west. Basically, this river is also fed by snow–glacier water. There are about 750 glaciersin the Naryn river basin, which is the main component of the Syrdarya. Of these, more than 500are located on the northern slopes of the Alai and Turkestan mountain ridges, and more than 100on the southwest slopes of the Fergan mountain ridge. The area of the mountainous basin zone is150,100 km2 and at the exit of the Fergan valley, it is 142,000 km2. Within the republic ofTajikistan, the Syrdarya is fed primarily by its left bank tributaries, the Isfara, Isfana, Aksu, andKhodzha-kirgan rivers. Of the tributaries of the Syrdarya within Tajikistan, the one with thelargest water capacity is the Isfara river, which has a maximum flow of up to 42 m3/sec in June–August and a minimum flow of 3–5 m3/sec; the one with the smallest flow is the Isfana river,with a flood flow of 1.4-1.6 m3/sec (in March–April), resulting from rain and snow melt, and aminimum flow of 0.5 m3/sec the rest of the year. Of intermediate water capacity and identical interms of supply to the Isfara river are the Khodzha-bakirgansai and Aksu rivers, which arecharacterized by a maximum flow of 23 and 14 m3/sec, respectively, and a minimum flow of 5.2and 4.0 m3/sec. The waters of these rivers are almost completely employed for irrigation and onlysmall flows, made up of runoff from fields, reach the main arteries via surface flow andapparently, for the most part, via subsurface flow. In addition, during the flood and rainy periods,the Syrdarya is fed by a number of small ravines and from the right bank below the Kayrakkumreservoir.
In the central part of Tajikistan, known as "Kukhistan," a large portion of water enters theZeravshan river system. But since there is neither a surface nor subsurface outflow from theZeravshan to the Amudarya, the Zeravshan can be considered an independent, sufficiently localhydrogeological object and will not be examined by us in the course of the NAVRUSexperiment.
In selecting monitoring sites, particular attention was devoted to densely populated locations andindustrially developed areas (both present and former).
Maps showing the monitoring sites and photographs taken at those sites are presented inAppendix 1.
From the industrial point of view, among the areas with the greatest industrial load withinTajikistan is the Vakhsh river basin. The Southern Tajik Territorial Industrial Complex is locatedhere, which includes such large facilities and the Yavansk Electrochemical and VakhshskNitrogen Fertilizer plants. The Vakhsh river is also the primary source of electrical power inTajikistan. The Perepadnyi, Tsentralnyi, Golovnyi, and Nurek hydroelectric stations are situated
65
on this river. Nurek, Kurgan-tyube and Sarband should be noted among the largest cities. Thebasin of another tributary of the Amudarya, the Kafirnigan river, is also under a great industrialload. Mining facilities are located here, along with large cities such as Dushanbe, Kofaringon,and Gissar, which have various industries.The territory of the Syrdarya basin is a major industrial and mining region in northern Tajikistan.The cities of Khudzhant, Chkalovsk, Isfara, Kanibadam, and Kayrakkum are home to developedindustries. The Syrdarya river is regulated by two reservoirs within the republic, the Kayrakkum(since 1956) and the Farkhad (since 1947).
Weather data from hydrometeorological stations (HMS) are presented in Appendix 2 for severalrecent years for the sampling areas.
3. Experiment preparation and conductUnfortunately, our participation in the experiment began on a sour note when the device to beused for determining the qualitative characteristics of water, the Hydrolab, was received in aninoperative state.
The problem centered around the failure of a normal screen to appear when the device was turnedon. Instead, only a series of bouncing lines could be seen, similar to what is seen on a televisionset that has defective line frequency synchronization. Our efforts to repair the device by ourselvesdid not meet with success. It was necessary to send the device to the fabricating plant for repairor replacement.
Here, we encountered another complication. The device had been sent to us via the United StatesEmbassy as humanitarian aid, so that we did not have the funding documents required by theCustoms authorities for processing when shipping the device.
In overcoming all of these problems, we were aided only by the interest expressed in theexperiment by government agencies of the Republic of Tajikistan, by the Sandia NationalLaboratory, by Mr. Dennis Reisenweaver, who is a colleague at the International Atomic EnergyAgency, and, of course, by colleagues at the Hydrolab corporation and most of all by Mr. CooperPetterson. We received the repaired device at the end of May 2001, so our first expedition(October–November 2000) was undertaken without this remarkable tool.
4. Technical developments.Samples of water, bottom sediment, aquatic vegetation, and soil adjacent to the shore were takenfor analytic laboratory analysis. The water quality was determined at the sampling site using theHydrolab device.
Samples were taken at places where bridges crossed rivers. A floating contrivance based on aprocured inflatable rubber boat was assembled at the Physicotechnical Institute to permit takingintegrated measurements.
River flow rates were measured using a pitot tube that was built at the Phyicotechnical Institute.River depths were measured using measurement poles.
66
A water-pressure vacuum pump was developed at the Institute in order to filter water samplesunder vacuum at the sampling sites. The vacuum in the apparatus is created by a water column ina vertical tube that is filled with water. The tube is connected to a receiver. This developmentpermitted a sharp (approximately 10-fold) acceleration in the water sample filtration process andallowed filtration to be performed under strictly defined vacuum conditions.
A description and photographs related to these technical developments are presented in Appendix3.
5. Preliminary resultsPreliminary experiment results were assessed in September 2001 at the regular working seminarat Bishkek. At this seminar, our group's proposal to hold the 2003 seminar in Dushanbe at thesame time as the conference on problems of clean water utilization, with the presentation of aseries of papers on the Navruz experiment at the conference, was accepted.
Of the direct results, noteworthy are the detection of two spots of radioactive contamination ofbottom sediment within the territories of Uzbekistan and Kazakhstan (the Syrdarya river basin)and elevated concentrations of industrially produced radioactive isotopes in the Varzov river inTajikistan. The contamination of the Syrdarya river is related to the processing of uranium-containing materials. No such contamination has been found within Tajikistan, but investigationsmust be continued in connection with the presence of possible sources of contamination inTajikistan itself, and in the tributaries of the Syrdarya within Kyrgyzstan. The cause of thecontamination of the Varzob river with industrially produced isotopes remains to be identified insubsequent investigations.
In the summer - during July and August 2001 - flow rates were measured at eight sites on theVarzob, Elok, and Kafirnigan rivers above their confluence, on the Kafirnigan river in thevicinity of the railroad bridge in the city of Shaartuz, on the Yakhsu and Kyzylsu rivers abovetheir confluence and on the Kyzylsu river after its confluence with the Yakhsu in the vicinity ofthe city of Vose, and on the Isfara river at mid-channel.
The physical and chemical properties of water were measured at all fifteen observation sites. Forthe "Chiluchor chashma" spring, it was determined that in terms of oxidation–reduction potential,the sources are divided into three different types, given that all other measured parameters(temperature, conductivity, salinity, quantity of insoluble particles and pH) are equal.
The dispersion of parameter values among the observation sites was as follows: � for conductivity, from 0.12 mS/cm at mid-channel in the Varzob, to 5.83 mS/cm in the
Kyzylsu below its confluence with the Yakhsu;� for pH, from 7.24 at the "Chiluchor chashma," to 8.38 in the Yakhsu above its confluence
with the Kyzylsu;� for oxidation–reduction potential, from 230.2 mV for the Yakhsu above its confluence with
the Kyzylsu, up to 429.2 mV at mid-channel in the Varzob;
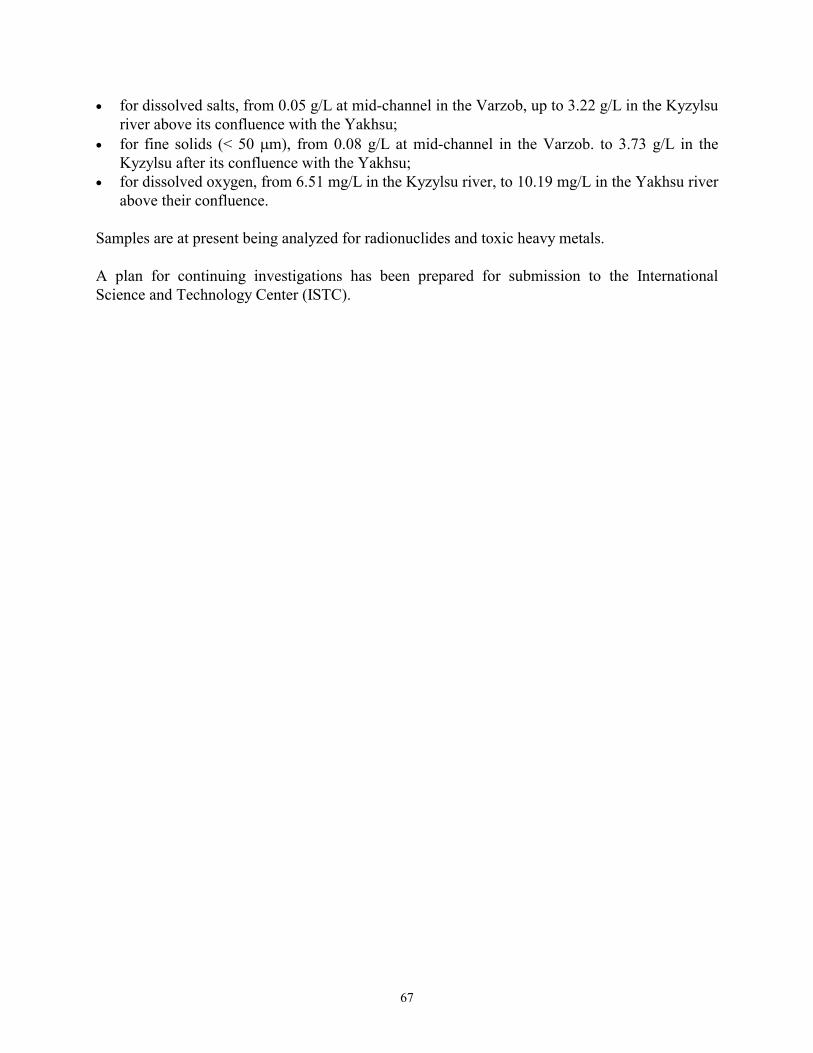
67
� for dissolved salts, from 0.05 g/L at mid-channel in the Varzob, up to 3.22 g/L in the Kyzylsuriver above its confluence with the Yakhsu;
� for fine solids (< 50 �m), from 0.08 g/L at mid-channel in the Varzob. to 3.73 g/L in theKyzylsu after its confluence with the Yakhsu;
� for dissolved oxygen, from 6.51 mg/L in the Kyzylsu river, to 10.19 mg/L in the Yakhsu riverabove their confluence.
Samples are at present being analyzed for radionuclides and toxic heavy metals.
A plan for continuing investigations has been prepared for submission to the InternationalScience and Technology Center (ISTC).

Appendix 1. Observation Sites
1. Varzob river above Dushanbe (near'Tekstilshchik' sanatorium); 38042' N.
Lat., 68047' E. Long.
2. Varzob river just belownbe(near the south bridge); 30031’
N. Lat., 68046’ E. Long.
firnigan river above the confluencehe Elok and Varzob rivers; 38030'
N. Lat., 68047' E. Long.
Dusha3. Kawith t68
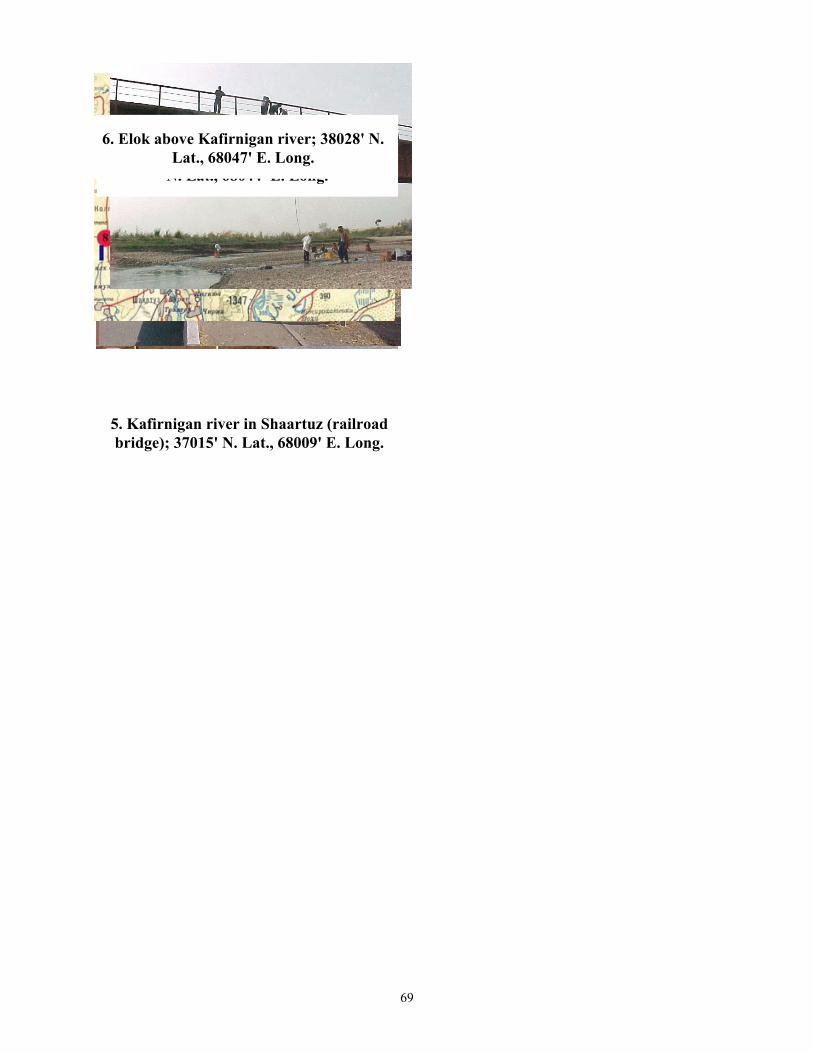
4. Kafirnigan river below the confluencewith the Elok and Varzob rivers; 38027'
N. Lat., 68044' E. Long.
6. Elok above Kafirnigan river; 38028' N.Lat., 68047' E. Long.
69
5. Kafirnigan river in Shaartuz (railroadbridge); 37015' N. Lat., 68009' E. Long.
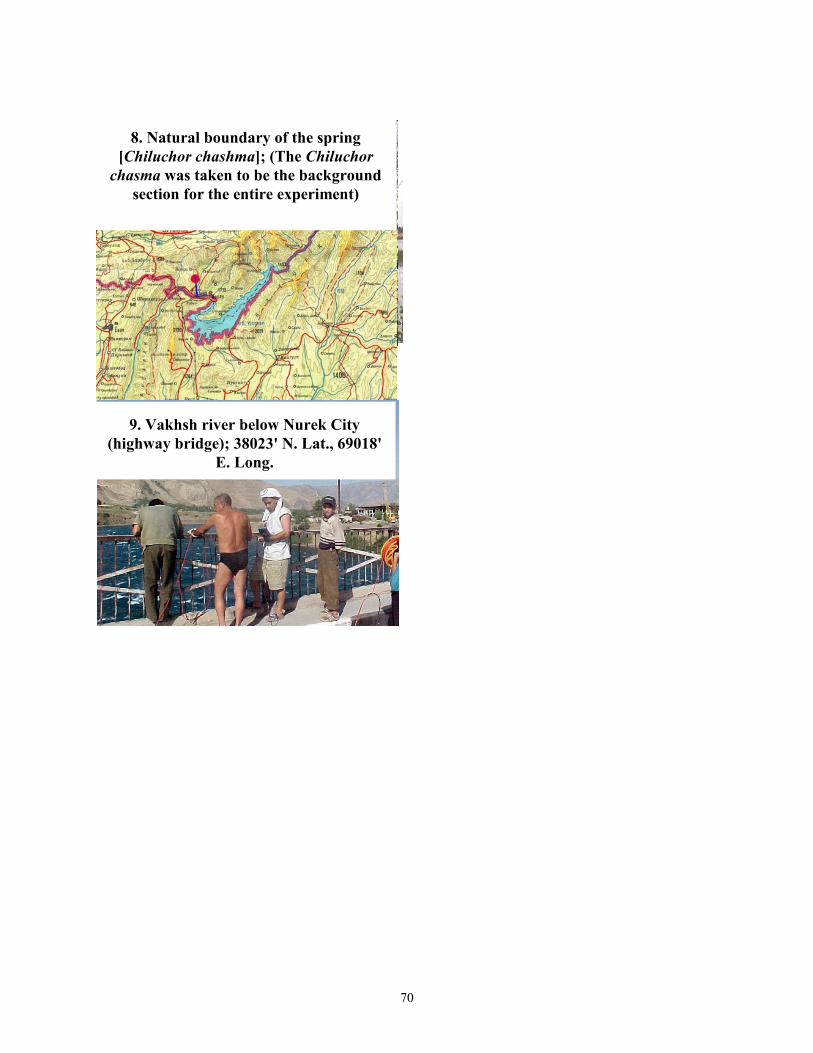
7. Vakhsh river at mid-channel (railroadbridge near Dzhilukulya) 37033' N. Lat.,
68031' E. Long.
8. Natural boundary of the spring[Chiluchor chashma]; (The Chiluchor
chasma was taken to be the backgroundsection for the entire experiment)
(h
9. Vakhsh river below Nurek Cityighway bridge); 38023' N. Lat., 69018'E. Long.
70
10. Yekhsu upstream of confluence withKyzylsu (highway bridge in Vose);
37048' N. Lat., 69039' E. Long.
w
11. Kyzylsu river above the confluencewith the Yekhsu (highway bridge);37047' N. Lat., 69034' E. Long.
12. Kyzylsu river below the confluenceith the Yekhsu (about 500 m below theconfluence); 37046' N. Lat., 69033' E.
71
Long.

72
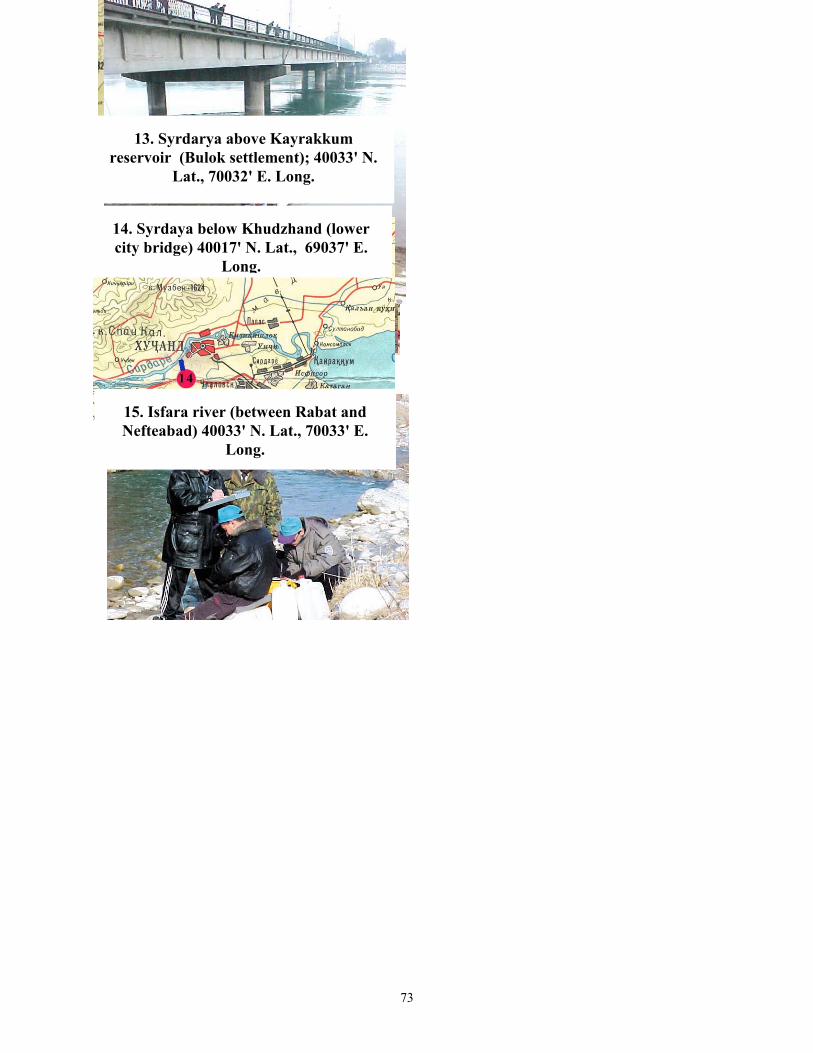
13. Syrdarya above Kayrakkumreservoir (Bulok settlement); 40033' N.
Lat., 70032' E. Long.
14. Syrdaya below Khudzhand (lowercity bridge) 40017' N. Lat., 69037' E.
Long.
15. Isfara river (between Rabat andNefteabad) 40033' N. Lat., 70033' E.
Long.
73

74
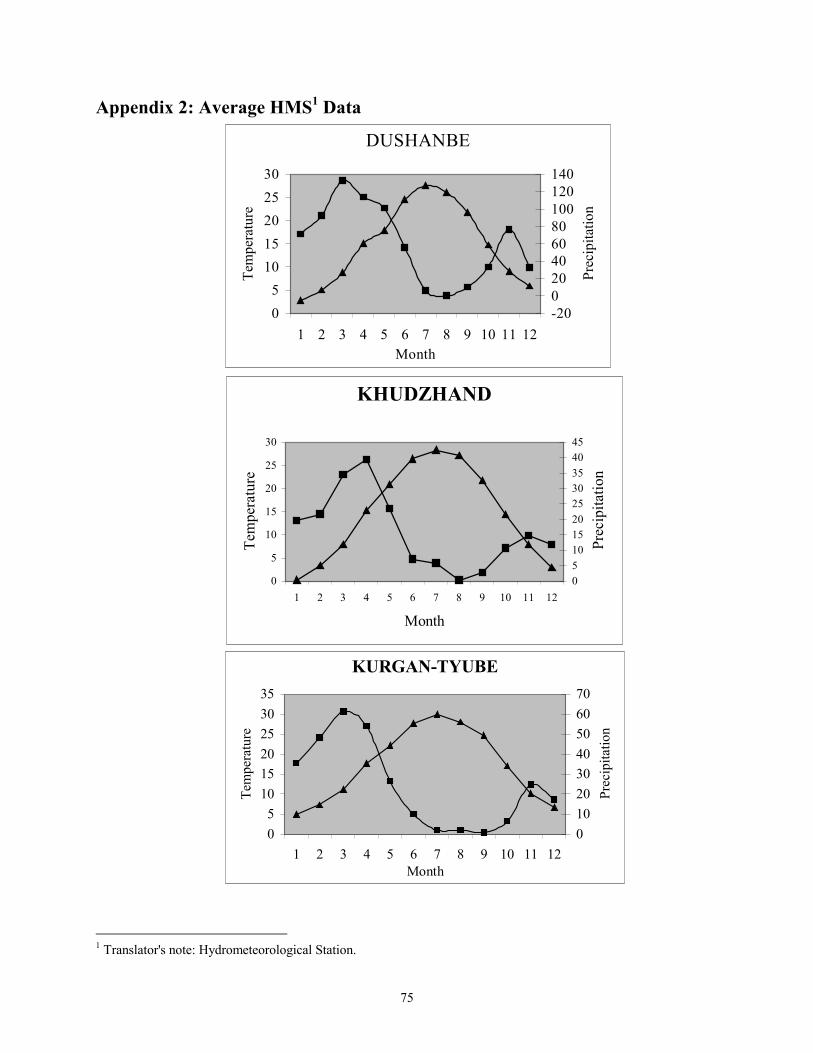
75
Appendix 2: Average HMS1 Data
1 Translator's note: Hydrometeorological Station.
KHUDZHAND
0
5
10
15
20
25
30
1 2 3 4 5 6 7 8 9 10 11 12
Month
Tem
pera
ture
051015202530354045
Prec
ipita
tion
KURGAN-TYUBE
05
101520253035
1 2 3 4 5 6 7 8 9 10 11 12Month
Tem
pera
ture
010203040506070
Prec
ipita
tion
DUSHANBE
05
1015202530
1 2 3 4 5 6 7 8 9 10 11 12Month
Tem
pera
ture
-20020406080100120140
Prec
ipita
tion
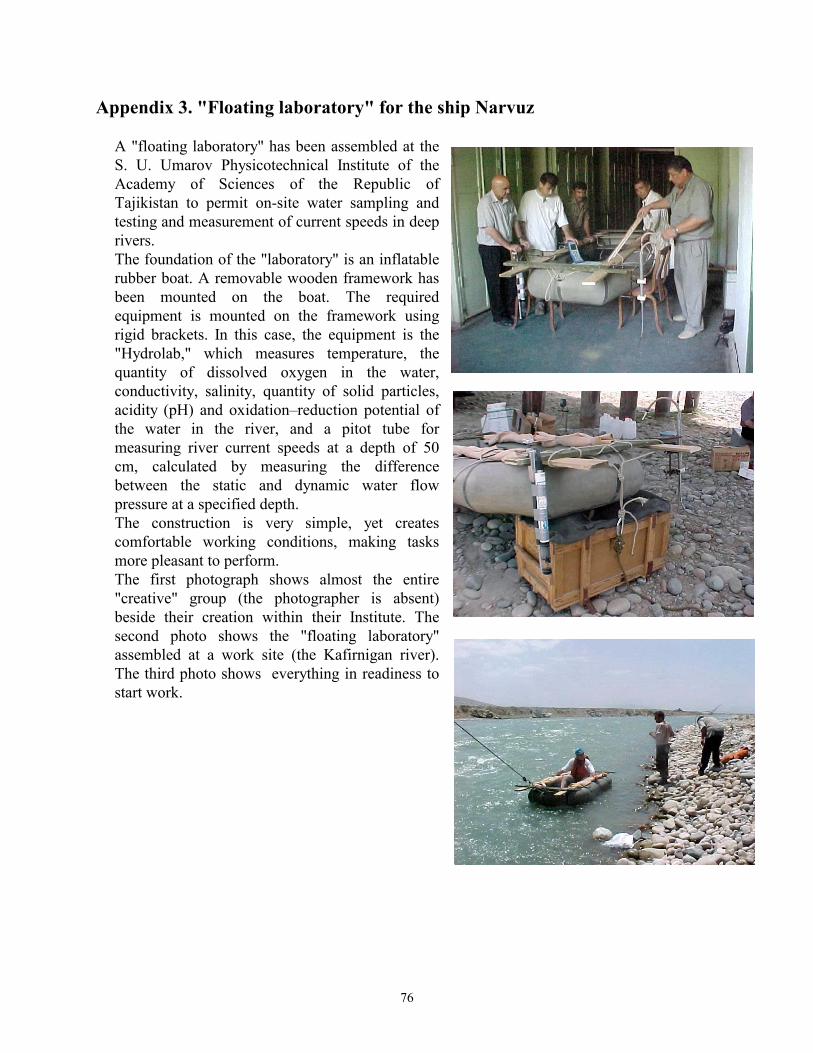
76
Appendix 3. "Floating laboratory" for the ship Narvuz
A "floating laboratory" has been assembled at theS. U. Umarov Physicotechnical Institute of theAcademy of Sciences of the Republic ofTajikistan to permit on-site water sampling andtesting and measurement of current speeds in deeprivers. The foundation of the "laboratory" is an inflatablerubber boat. A removable wooden framework hasbeen mounted on the boat. The requiredequipment is mounted on the framework usingrigid brackets. In this case, the equipment is the"Hydrolab," which measures temperature, thequantity of dissolved oxygen in the water,conductivity, salinity, quantity of solid particles,acidity (pH) and oxidation–reduction potential ofthe water in the river, and a pitot tube formeasuring river current speeds at a depth of 50cm, calculated by measuring the differencebetween the static and dynamic water flowpressure at a specified depth. The construction is very simple, yet createscomfortable working conditions, making tasksmore pleasant to perform.The first photograph shows almost the entire"creative" group (the photographer is absent)beside their creation within their Institute. Thesecond photo shows the "floating laboratory"assembled at a work site (the Kafirnigan river).The third photo shows everything in readiness tostart work.

77
The Pitot TubeThis device is used widely to measure speeds of bothliquid and gas flows. The pitot tube is, for example,a basic instrument for measuring aircraft air speeds.
The operating principle is based on the measurementof the difference between the static (p0) and dynamic(p) pressures. Over a rather broad range of flowspeeds, using Bernoulli's law for incompressiblefluids, we have V = A �(p –p0)
The device itself is shown in the first photograph.Two glass tubes are attached to a broad ruler. Theyare connected by a piece of rubber tubing at thebottom. The resulting U-shaped tube is filledhalfway with water. The upper ends of the glasstubes are connected using vacuum hoses to metaltubes used for measuring pressure. The straight tubemeasures the static pressure, while the tube bent at aright angle measures the dynamic pressure. Thelower ends of the metal tubes are at exactly the samelevel.
The described device was used by us to measure representative samples. A sample was taken at 5to 10 points along the section of a river, proportional to the current flow rate at the samplingpoints.
We were also able to calibrate the device (to obtain values for the coefficient A) downstream ofthe Nurek and Kayrakkum reservoirs. Thus, using this device we were able to meaure the flowsof shallow rivers (up to 2 m deep). Those measurements are shown in the two followingphotographs, which were taken on the Varzob and Kyzylsu rivers.
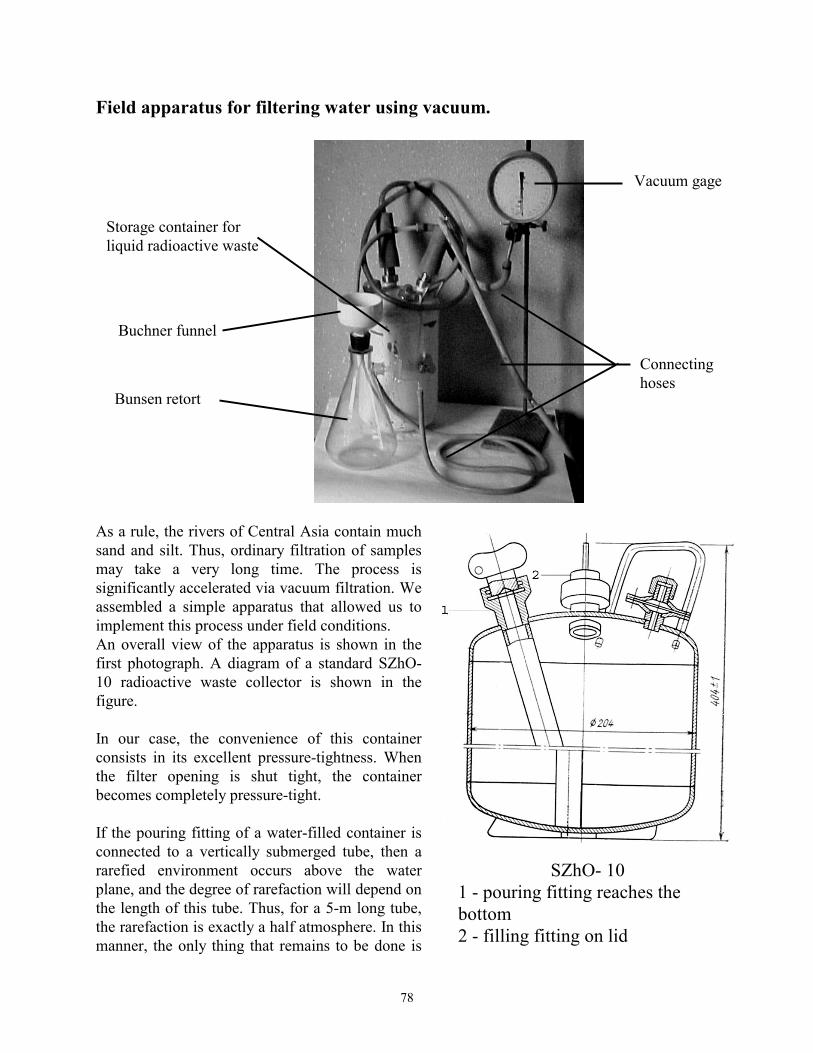
78
Field apparatus for filtering water using vacuum.
As a rule, the rivers of Central Asia contain muchsand and silt. Thus, ordinary filtration of samplesmay take a very long time. The process issignificantly accelerated via vacuum filtration. Weassembled a simple apparatus that allowed us toimplement this process under field conditions.An overall view of the apparatus is shown in thefirst photograph. A diagram of a standard SZhO-10 radioactive waste collector is shown in thefigure.
In our case, the convenience of this containerconsists in its excellent pressure-tightness. Whenthe filter opening is shut tight, the containerbecomes completely pressure-tight.
If the pouring fitting of a water-filled container isconnected to a vertically submerged tube, then ararefied environment occurs above the waterplane, and the degree of rarefaction will depend onthe length of this tube. Thus, for a 5-m long tube,the rarefaction is exactly a half atmosphere. In thismanner, the only thing that remains to be done is
SZhO- 101 - pouring fitting reaches thebottom2 - filling fitting on lid
Bunsen retort
Vacuum gage
Storage container forliquid radioactive waste
Buchner funnel
Connectinghoses
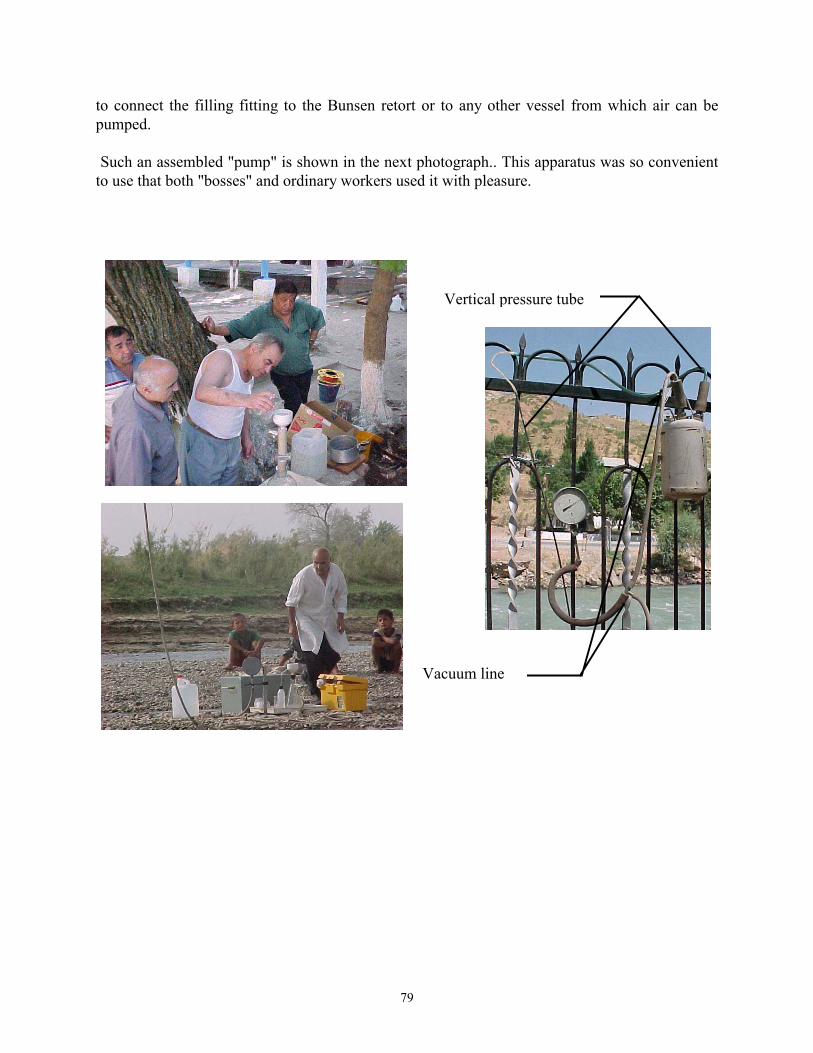
79
to connect the filling fitting to the Bunsen retort or to any other vessel from which air can bepumped.
Such an assembled "pump" is shown in the next photograph.. This apparatus was so convenientto use that both "bosses" and ordinary workers used it with pleasure.
Vacuum line
Vertical pressure tube
80
Kyrgyzstan
Kyrgyzstan is a country of high mountains. Average land elevation is 2,750 meters, with thehighest point reaching 7,439 meters in elevation. More than 94% of Kyrgyzstan’s area is higherthan 1,000 meters above sea level. The enormous ranges of absolute heights, the complex relief,the lengthy geological evolution of the country, and other factors are responsible for the diversityof natural conditions and the wealth of natural resources. All the natural zones typical of thenorthern hemisphere, with the exception of tropical zone, are found in Kyrgyzstan.
The natural features of Kyrgyzstan are defined by massive mountain ranges and broad closed andsemiclosed intermontane basins that vary dramatically in terms of landscape and economic use.The highest part of Kyrgyzstan is located on the country’s eastern margin. There, in themountains bordering China, are the highest points of the entire Tyan-Shan mountainsystem�Pobeda [Victory] Peak (7,439 m) and Khan-Tengri (6,995 m). From there, the rangesfan out to the west and southwest, creating distinct, parallel chains that run for up to 300�400km, mainly in a latitudinal direction. Elevations drop (to 1,000�2,000 m from 7,000 m) in thatdirection.
Vast intermontane basins and valleys, one of which is the Srednenaryn, are of greatsignificance in the relief of Tyan-Shan. Those depressions, which are megasynclines(intermontane troughs), are sloped, mildly undulating or flat alluvial�proluvial plains.
The mountain relief, in combination with other factors, exerts a substantial influence oneconomic activities and on the specialization of individual sectors of the economy. Most fullydeveloped are the piedmont plains and low-mountain and medium-high�mountain intermontanebasins. The greatest difficulties are encountered in the development of high-mountainareas�Kichi-Naryn and other areas that are distinguished by dry natural conditions.
The diversity of the climate of Kyrgyzstan�particularly its continentality and aridness�stemsfrom the comparatively southern location of the country, its remoteness from any oceans, the factthat it neighbors vast deserts, the degree of geomorphic contrast, and the fact that most of therepublic is orographically closed off. The Naryn Basin is a closed, medium-high�mountain,intermontane basin with a markedly continental climate.
The seasonal contrast of climatic conditions is appreciable in terms of temperature fluctuations.Summer everywhere is dry and hot, especially in the submontane valleys of the Fergana region.Winter is rather cold, particularly in the mountains and the intermontane basins, and temperaturesreach an absolute low of �53.6�C in upper Naryn.
Precipitation is unevenly distributed across Kyrgyzstan. More than anywhere else, precipitationfalls in the Fergana Region, Chu, and Talas valleys in the spring months (as much as1,500�2,000 mm). In the Naryn Basin, the greatest amount of rainfall is in the warm season(200�400 mm).
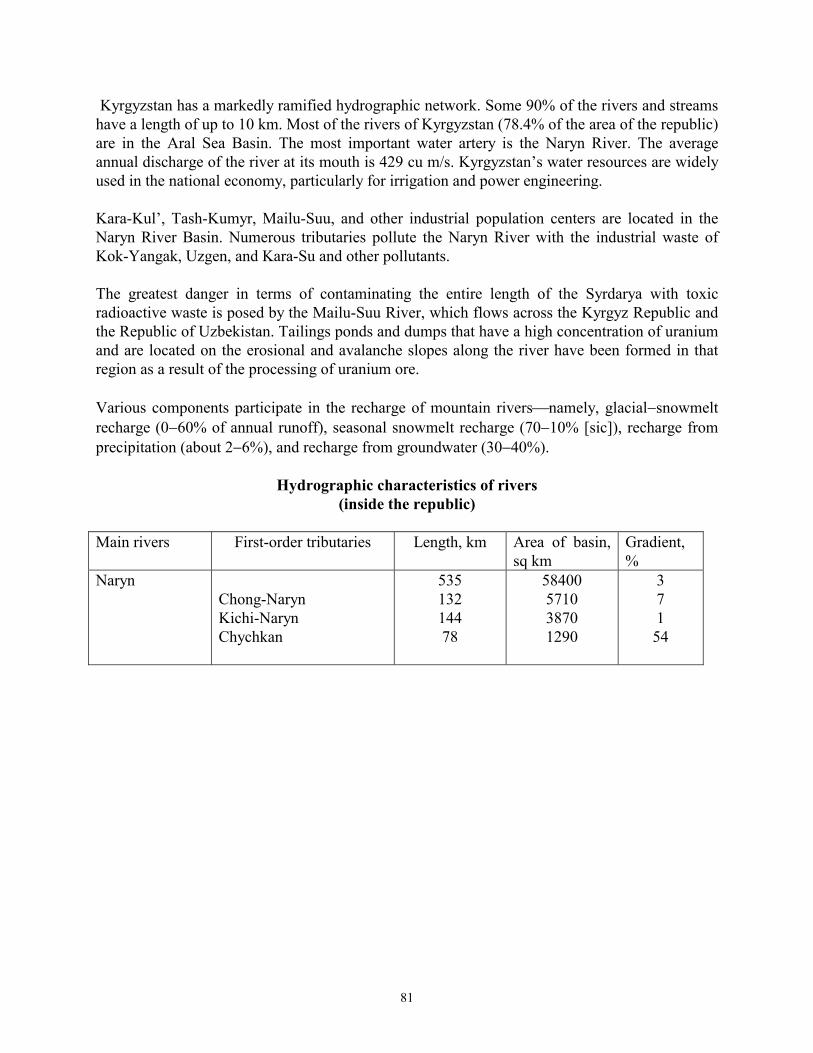
81
Kyrgyzstan has a markedly ramified hydrographic network. Some 90% of the rivers and streamshave a length of up to 10 km. Most of the rivers of Kyrgyzstan (78.4% of the area of the republic)are in the Aral Sea Basin. The most important water artery is the Naryn River. The averageannual discharge of the river at its mouth is 429 cu m/s. Kyrgyzstan’s water resources are widelyused in the national economy, particularly for irrigation and power engineering.
Kara-Kul’, Tash-Kumyr, Mailu-Suu, and other industrial population centers are located in theNaryn River Basin. Numerous tributaries pollute the Naryn River with the industrial waste ofKok-Yangak, Uzgen, and Kara-Su and other pollutants.
The greatest danger in terms of contaminating the entire length of the Syrdarya with toxicradioactive waste is posed by the Mailu-Suu River, which flows across the Kyrgyz Republic andthe Republic of Uzbekistan. Tailings ponds and dumps that have a high concentration of uraniumand are located on the erosional and avalanche slopes along the river have been formed in thatregion as a result of the processing of uranium ore.
Various components participate in the recharge of mountain rivers�namely, glacial�snowmeltrecharge (0�60% of annual runoff), seasonal snowmelt recharge (70�10% [sic]), recharge fromprecipitation (about 2�6%), and recharge from groundwater (30�40%).
Hydrographic characteristics of rivers(inside the republic)
Main rivers First-order tributaries Length, km Area of basin,sq km
Gradient,%
NarynChong-NarynKichi-Naryn Chychkan
53513214478
58400571038701290
37154
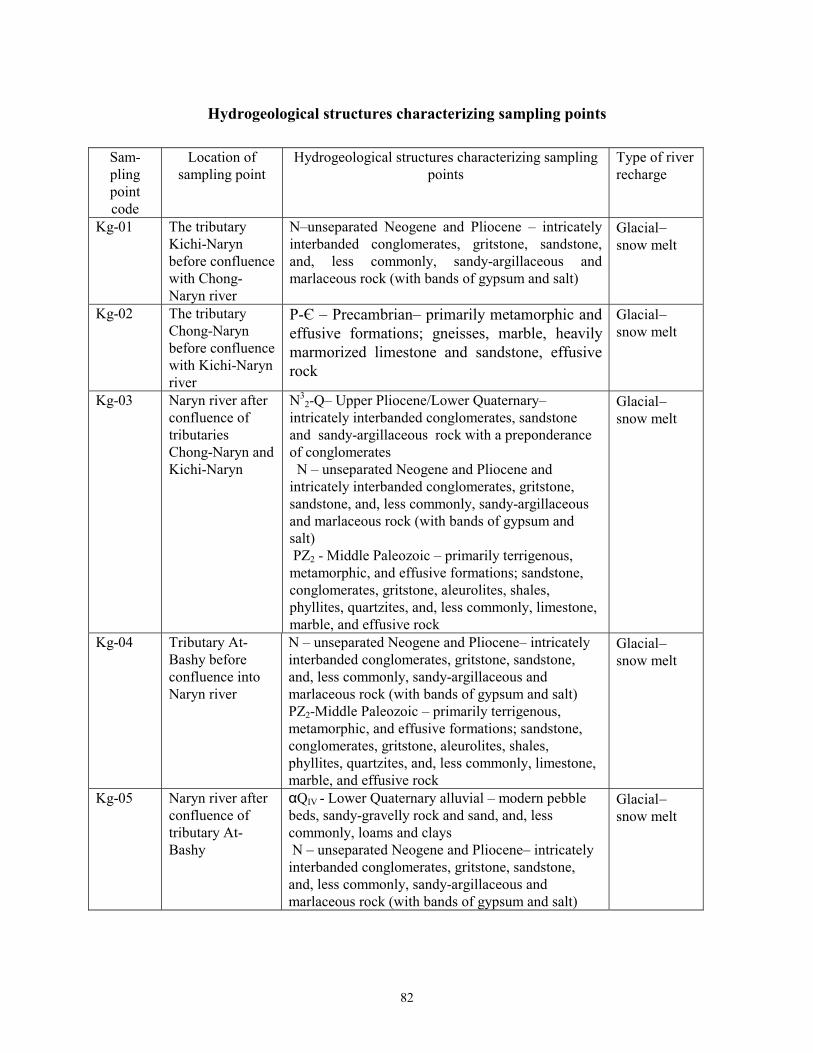
82
Hydrogeological structures characterizing sampling points
Sam-plingpointcode
Location ofsampling point
Hydrogeological structures characterizing samplingpoints
Type of riverrecharge
Kg-01 The tributaryKichi-Narynbefore confluencewith Chong-Naryn river
N–unseparated Neogene and Pliocene – intricatelyinterbanded conglomerates, gritstone, sandstone,and, less commonly, sandy-argillaceous andmarlaceous rock (with bands of gypsum and salt)
Glacial�snow melt
Kg-02 The tributaryChong-Narynbefore confluencewith Kichi-Narynriver
Р-Є – Precambrian– primarily metamorphic andeffusive formations; gneisses, marble, heavilymarmorized limestone and sandstone, effusiverock
Glacial�snow melt
Kg-03 Naryn river afterconfluence oftributariesChong-Naryn andKichi-Naryn
N32-Q– Upper Pliocene/Lower Quaternary–
intricately interbanded conglomerates, sandstoneand sandy-argillaceous rock with a preponderanceof conglomerates N – unseparated Neogene and Pliocene andintricately interbanded conglomerates, gritstone,sandstone, and, less commonly, sandy-argillaceousand marlaceous rock (with bands of gypsum andsalt) PZ2 - Middle Paleozoic – primarily terrigenous,metamorphic, and effusive formations; sandstone,conglomerates, gritstone, aleurolites, shales,phyllites, quartzites, and, less commonly, limestone,marble, and effusive rock
Glacial�snow melt
Kg-04 Tributary At-Bashy beforeconfluence intoNaryn river
N – unseparated Neogene and Pliocene– intricatelyinterbanded conglomerates, gritstone, sandstone,and, less commonly, sandy-argillaceous andmarlaceous rock (with bands of gypsum and salt)PZ2-Middle Paleozoic – primarily terrigenous,metamorphic, and effusive formations; sandstone,conglomerates, gritstone, aleurolites, shales,phyllites, quartzites, and, less commonly, limestone,marble, and effusive rock
Glacial�snow melt
Kg-05 Naryn river afterconfluence oftributary At-Bashy
αQIV - Lower Quaternary alluvial – modern pebblebeds, sandy-gravelly rock and sand, and, lesscommonly, loams and clays N – unseparated Neogene and Pliocene– intricatelyinterbanded conglomerates, gritstone, sandstone,and, less commonly, sandy-argillaceous andmarlaceous rock (with bands of gypsum and salt)
Glacial�snow melt
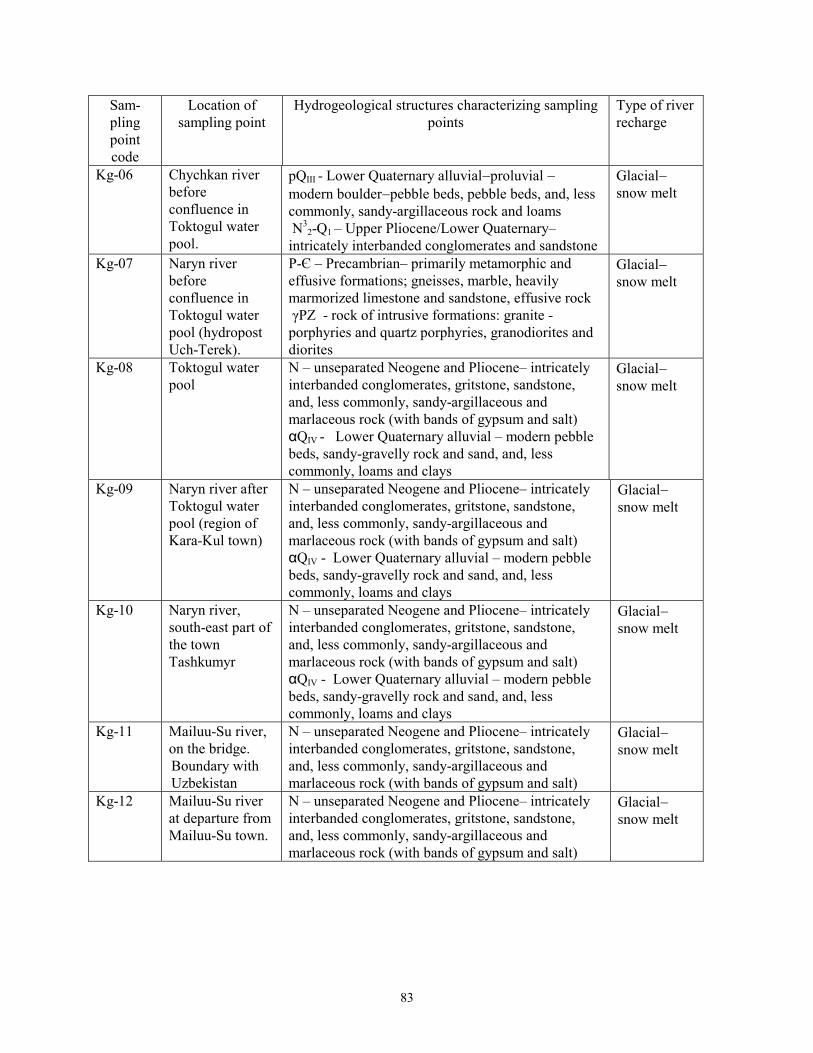
83
Sam-plingpointcode
Location ofsampling point
Hydrogeological structures characterizing samplingpoints
Type of riverrecharge
Kg-06 Chychkan riverbeforeconfluence inToktogul waterpool.
рQIII - Lower Quaternary alluvial�proluvial �modern boulder�pebble beds, pebble beds, and, lesscommonly, sandy-argillaceous rock and loams N3
2-Q1 – Upper Pliocene/Lower Quaternary–intricately interbanded conglomerates and sandstone
Glacial�snow melt
Kg-07 Naryn riverbeforeconfluence inToktogul waterpool (hydropostUch-Terek).
Р-Є – Precambrian– primarily metamorphic andeffusive formations; gneisses, marble, heavilymarmorized limestone and sandstone, effusive rock γPZ - rock of intrusive formations: granite -porphyries and quartz porphyries, granodiorites anddiorites
Glacial�snow melt
Kg-08 Toktogul waterpool
N – unseparated Neogene and Pliocene– intricatelyinterbanded conglomerates, gritstone, sandstone,and, less commonly, sandy-argillaceous andmarlaceous rock (with bands of gypsum and salt)αQIV - Lower Quaternary alluvial – modern pebblebeds, sandy-gravelly rock and sand, and, lesscommonly, loams and clays
Glacial�snow melt
Kg-09 Naryn river afterToktogul waterpool (region ofKara-Kul town)
N – unseparated Neogene and Pliocene– intricatelyinterbanded conglomerates, gritstone, sandstone,and, less commonly, sandy-argillaceous andmarlaceous rock (with bands of gypsum and salt)αQIV - Lower Quaternary alluvial – modern pebblebeds, sandy-gravelly rock and sand, and, lesscommonly, loams and clays
Glacial�snow melt
Kg-10 Naryn river,south-east part ofthe townTashkumyr
N – unseparated Neogene and Pliocene– intricatelyinterbanded conglomerates, gritstone, sandstone,and, less commonly, sandy-argillaceous andmarlaceous rock (with bands of gypsum and salt)αQIV - Lower Quaternary alluvial – modern pebblebeds, sandy-gravelly rock and sand, and, lesscommonly, loams and clays
Glacial�snow melt
Kg-11 Mailuu-Su river,on the bridge.Boundary withUzbekistan
N – unseparated Neogene and Pliocene– intricatelyinterbanded conglomerates, gritstone, sandstone,and, less commonly, sandy-argillaceous andmarlaceous rock (with bands of gypsum and salt)
Glacial�snow melt
Kg-12 Mailuu-Su riverat departure fromMailuu-Su town.
N – unseparated Neogene and Pliocene– intricatelyinterbanded conglomerates, gritstone, sandstone,and, less commonly, sandy-argillaceous andmarlaceous rock (with bands of gypsum and salt)
Glacial�snow melt
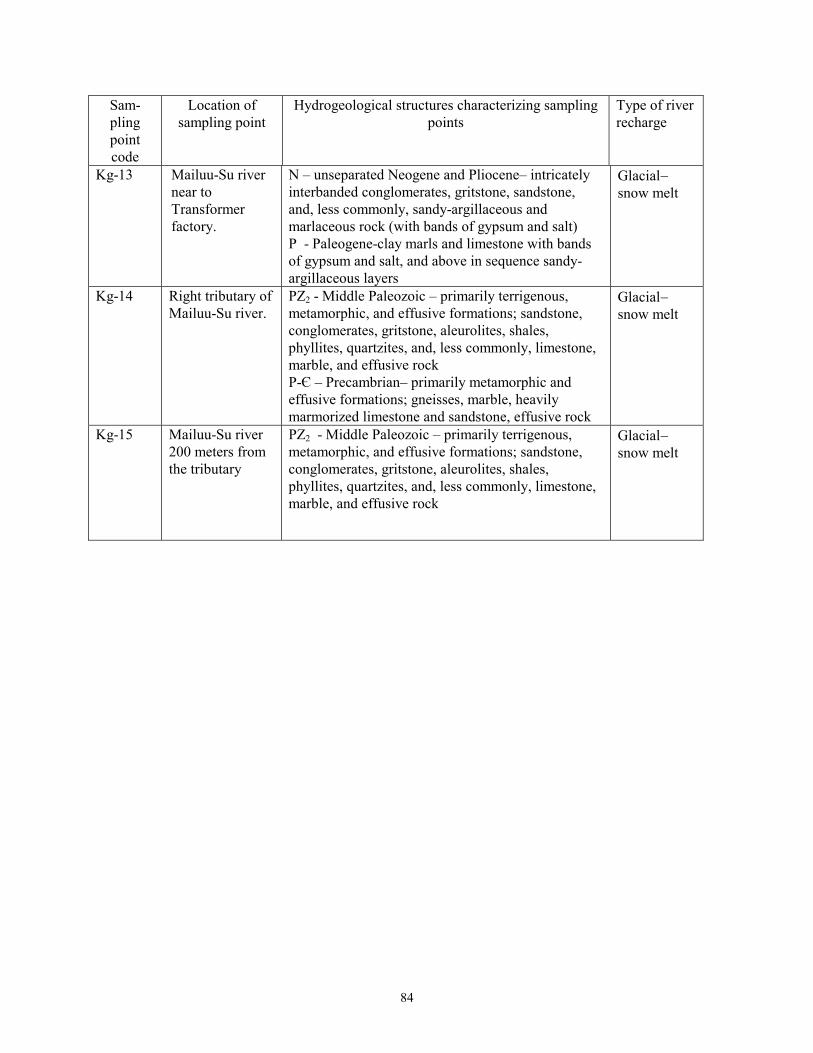
84
Sam-plingpointcode
Location ofsampling point
Hydrogeological structures characterizing samplingpoints
Type of riverrecharge
Kg-13 Mailuu-Su rivernear toTransformerfactory.
N – unseparated Neogene and Pliocene– intricatelyinterbanded conglomerates, gritstone, sandstone,and, less commonly, sandy-argillaceous andmarlaceous rock (with bands of gypsum and salt)Р - Paleogene-clay marls and limestone with bandsof gypsum and salt, and above in sequence sandy-argillaceous layers
Glacial�snow melt
Kg-14 Right tributary ofMailuu-Su river.
PZ2 - Middle Paleozoic – primarily terrigenous,metamorphic, and effusive formations; sandstone,conglomerates, gritstone, aleurolites, shales,phyllites, quartzites, and, less commonly, limestone,marble, and effusive rockР-Є – Precambrian– primarily metamorphic andeffusive formations; gneisses, marble, heavilymarmorized limestone and sandstone, effusive rock
Glacial�snow melt
Kg-15 Mailuu-Su river200 meters fromthe tributary
PZ2 - Middle Paleozoic – primarily terrigenous,metamorphic, and effusive formations; sandstone,conglomerates, gritstone, aleurolites, shales,phyllites, quartzites, and, less commonly, limestone,marble, and effusive rock
Glacial�snow melt
85
Distribution:
1 MS 1373 David Barber, 53241 MS 1373 Amir Mohagheghi, 53241 MS 1373 Howard Passell, 53241 MS 1373 Adriane Littlefield, 532410 MS 1373 CMC Library, 53411 MS 9018 Central Tech Files, 8945-12 MS 0899 Technical Library, 96161 MS 0612 Review & Approval Desk 9612 for DOE/OSTI