Embed Size (px)
Citation preview
SANIBEL GENERAL EMPLOYEES' RETIREMENT PLAN
INVESTMENT PERFORMANCEPERIOD ENDING
JUNE 30, 2013
315 East Robinson Street, Orlando, Florida 32801, 407-644-0111, [email protected] recent Form ADV which details pertinent businesss procedures, please contact:
NOTE: For a free copy of Part II (mailed w/i 5 bus. days from request receipt) of Burgess Chambers and Associates, Inc.'s
Sanibel General Employees’ Retirement Plan
BCA Market Perspective ©
Why Are Bonds A Risk?
July 2013
Since the sudden drop in bond prices in June, investors have been reminded of interest rate risk. While we are continually focused on
default risk, it is Fed’s zero interest rate policy in its fifth year that has investors worried. A shift by the Fed towards allowing interest
rates to rise will push down the value of bonds.
There are two major types of risk in the bond market. One is the risk that the bond issuer will default on the bond. Selecting higher quality
bonds with limited exposure to each issue and/or hiring a professional bond manager with a focus on quality will significantly reduce the
risk of a default in your portfolio.
The second major risk is interest rate risk – specifically the price depreciation of a bond during a rising interest rate environment. As
interest rates rise, the price (or market value) of a bond will decline. Let’s consider a simple example: Assume you own a fixed coupon
bond that pays 3% interest each year. If the market moves the yield of this bond to 6%, its price will have dropped by 50%.
As an individual investor, you may not be concerned that your bond has declined in value. You will continue to receive the 3% coupon
every year and your money (or par value) back at maturity. However, pension funds, endowments and foundations are required to report
the bonds at their current market value.
The threat of a rising interest rate environment from the current historical lows is the reason many investors view the asset class as
“risky”. Many believe there is a high probability that the market value decline of bonds will be more than the interest received if rates
begin to rise, resulting in a negative total return for the bond portion of your portfolio.
BCA has discussed the risk associated with bonds with its clients for the past two years and has offered several solutions. Shortening the
maturities (or the duration) of the portfolio is one way to lessen the impact of rising rates as bonds closer to maturity have less sensitivity
to interest rate movements. Other alternatives to consider include floating rate bonds which reset the coupon based on a spread above a
predetermined index. However, each strategy or asset class has its own individual risk characteristics and should be monitored closely to
ensure they are meeting your specific objectives.
2
Sanibel General Employees’ Retirement Plan
Total Fund
Investment Summary
June 30, 2013
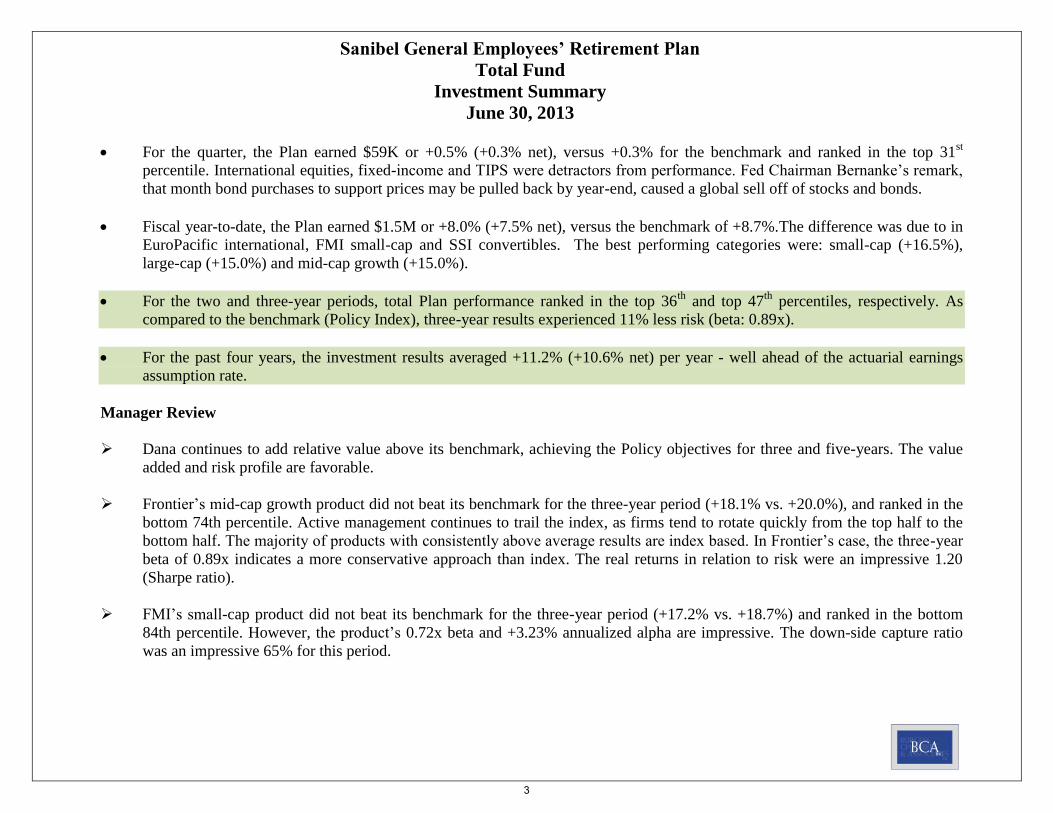
For the quarter, the Plan earned $59K or +0.5% (+0.3% net), versus +0.3% for the benchmark and ranked in the top 31st
percentile. International equities, fixed-income and TIPS were detractors from performance. Fed Chairman Bernanke’s remark,
that month bond purchases to support prices may be pulled back by year-end, caused a global sell off of stocks and bonds.
Fiscal year-to-date, the Plan earned $1.5M or +8.0% (+7.5% net), versus the benchmark of +8.7%.The difference was due to in
EuroPacific international, FMI small-cap and SSI convertibles. The best performing categories were: small-cap (+16.5%),
large-cap (+15.0%) and mid-cap growth (+15.0%).
For the two and three-year periods, total Plan performance ranked in the top 36th
and top 47th
percentiles, respectively. As
compared to the benchmark (Policy Index), three-year results experienced 11% less risk (beta: 0.89x).
For the past four years, the investment results averaged +11.2% (+10.6% net) per year - well ahead of the actuarial earnings
assumption rate.
Manager Review
Dana continues to add relative value above its benchmark, achieving the Policy objectives for three and five-years. The value
added and risk profile are favorable.
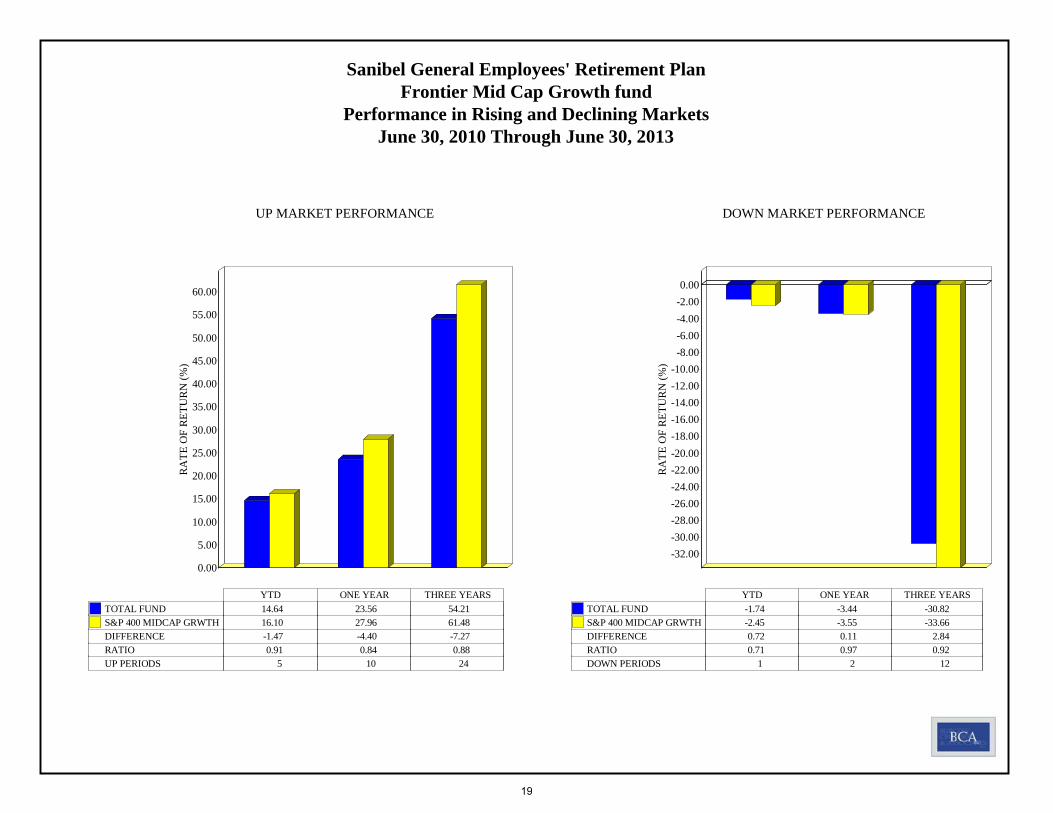
Frontier’s mid-cap growth product did not beat its benchmark for the three-year period (+18.1% vs. +20.0%), and ranked in the
bottom 74th percentile. Active management continues to trail the index, as firms tend to rotate quickly from the top half to the
bottom half. The majority of products with consistently above average results are index based. In Frontier’s case, the three-year
beta of 0.89x indicates a more conservative approach than index. The real returns in relation to risk were an impressive 1.20
(Sharpe ratio).
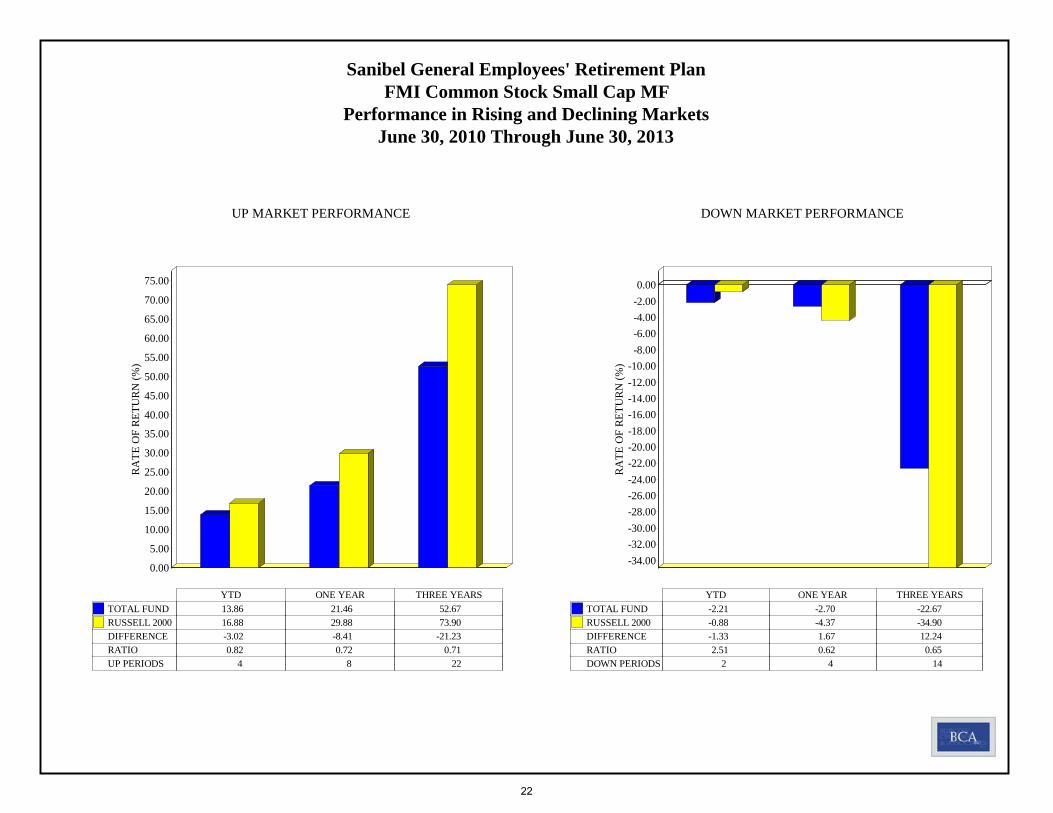
FMI’s small-cap product did not beat its benchmark for the three-year period (+17.2% vs. +18.7%) and ranked in the bottom
84th percentile. However, the product’s 0.72x beta and +3.23% annualized alpha are impressive. The down-side capture ratio
was an impressive 65% for this period.
3
Sanibel General Employees’ Retirement Plan
Total Fund
Investment Summary
June 30, 2013
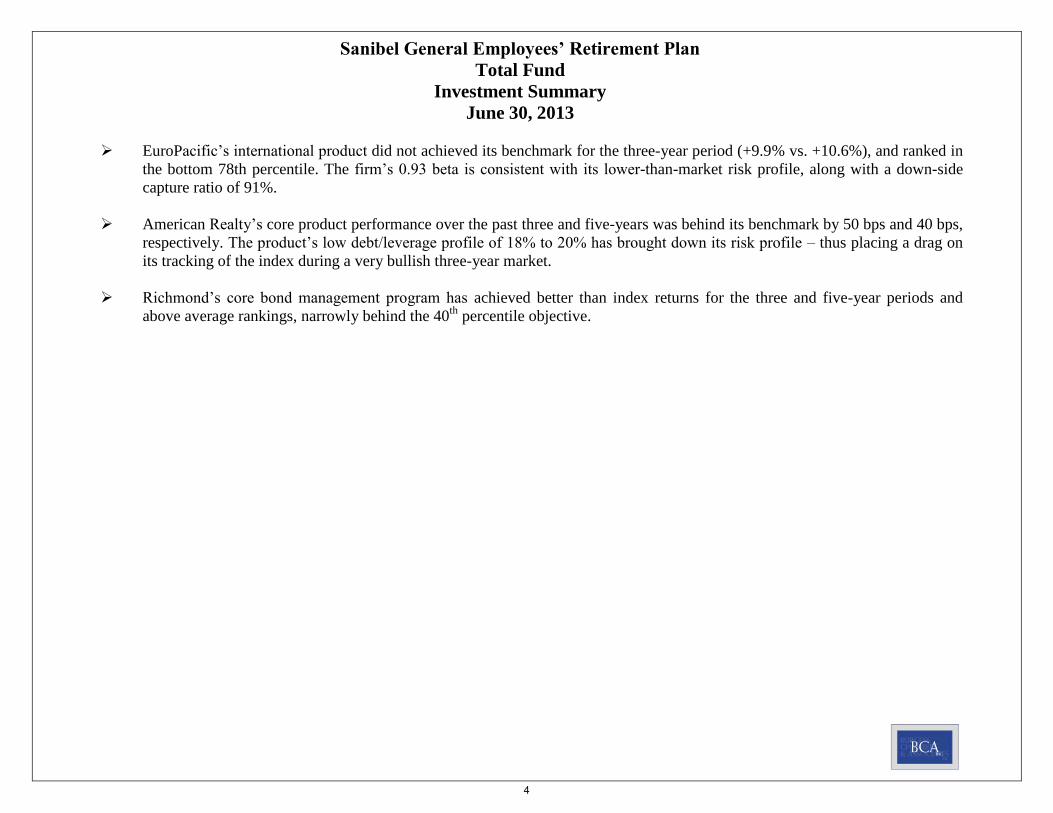
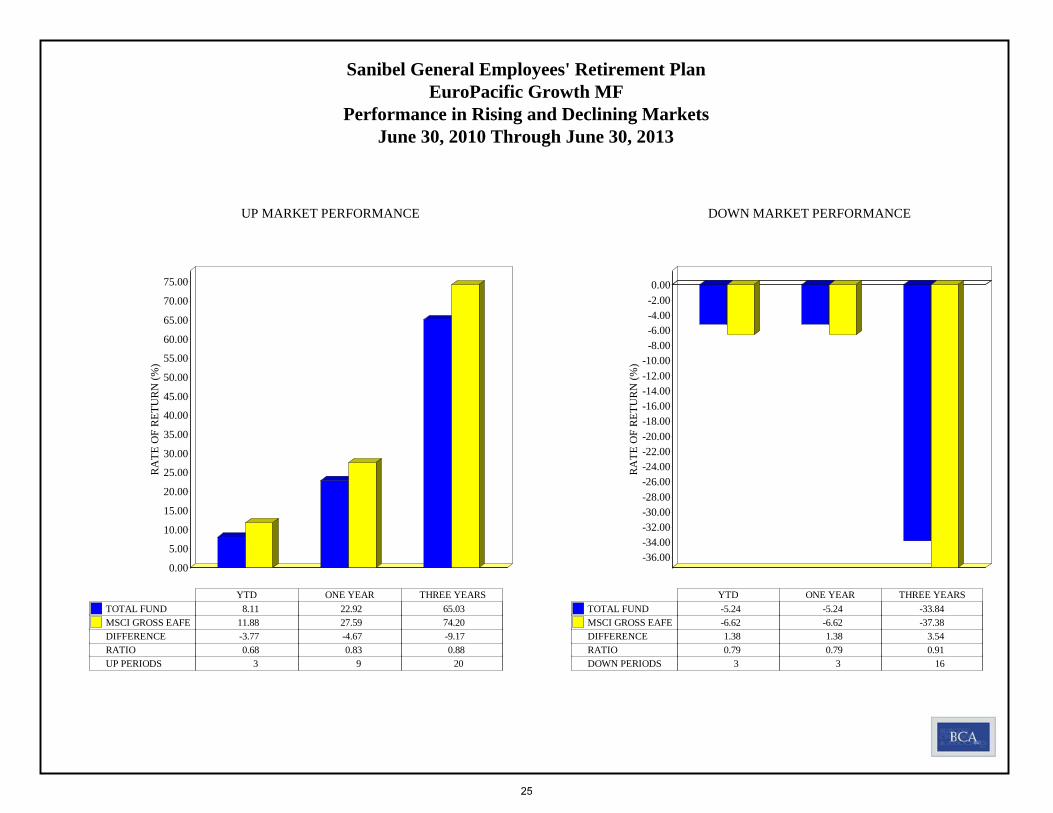
EuroPacific’s international product did not achieved its benchmark for the three-year period (+9.9% vs. +10.6%), and ranked in
the bottom 78th percentile. The firm’s 0.93 beta is consistent with its lower-than-market risk profile, along with a down-side
capture ratio of 91%.
American Realty’s core product performance over the past three and five-years was behind its benchmark by 50 bps and 40 bps,
respectively. The product’s low debt/leverage profile of 18% to 20% has brought down its risk profile – thus placing a drag on
its tracking of the index during a very bullish three-year market.
Richmond’s core bond management program has achieved better than index returns for the three and five-year periods and
above average rankings, narrowly behind the 40th
percentile objective.
4
Sanibel General Employees’ Retirement Plan
Total Fund
Investment Performance
June 30, 2013
Dollars
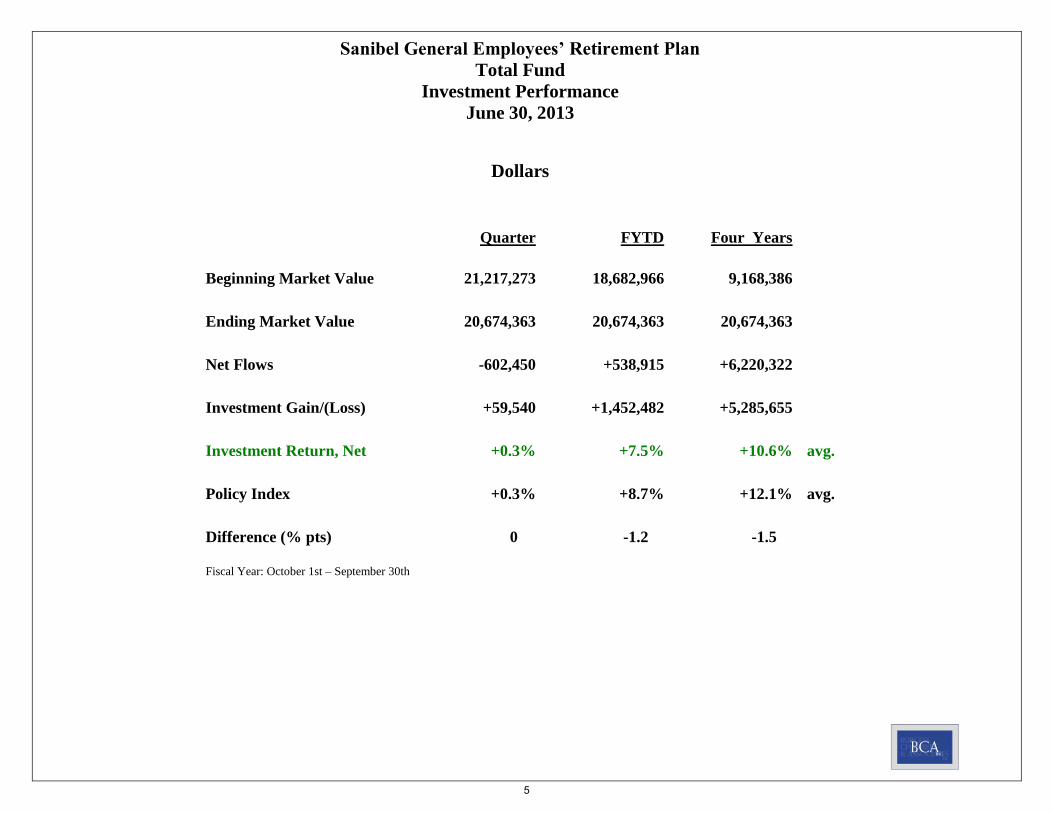
Quarter FYTD Four Years
Beginning Market Value 21,217,273 18,682,966 9,168,386
Ending Market Value 20,674,363 20,674,363 20,674,363
Net Flows -602,450 +538,915 +6,220,322
Investment Gain/(Loss) +59,540 +1,452,482 +5,285,655
Investment Return, Net +0.3% +7.5% +10.6% avg.
Policy Index +0.3% +8.7% +12.1% avg.
Difference (% pts) 0 -1.2 -1.5
Fiscal Year: October 1st – September 30th
5
Sanibel General Employees’ Retirement Plan
Total Fund
Investment Policy Review
June 30, 2013
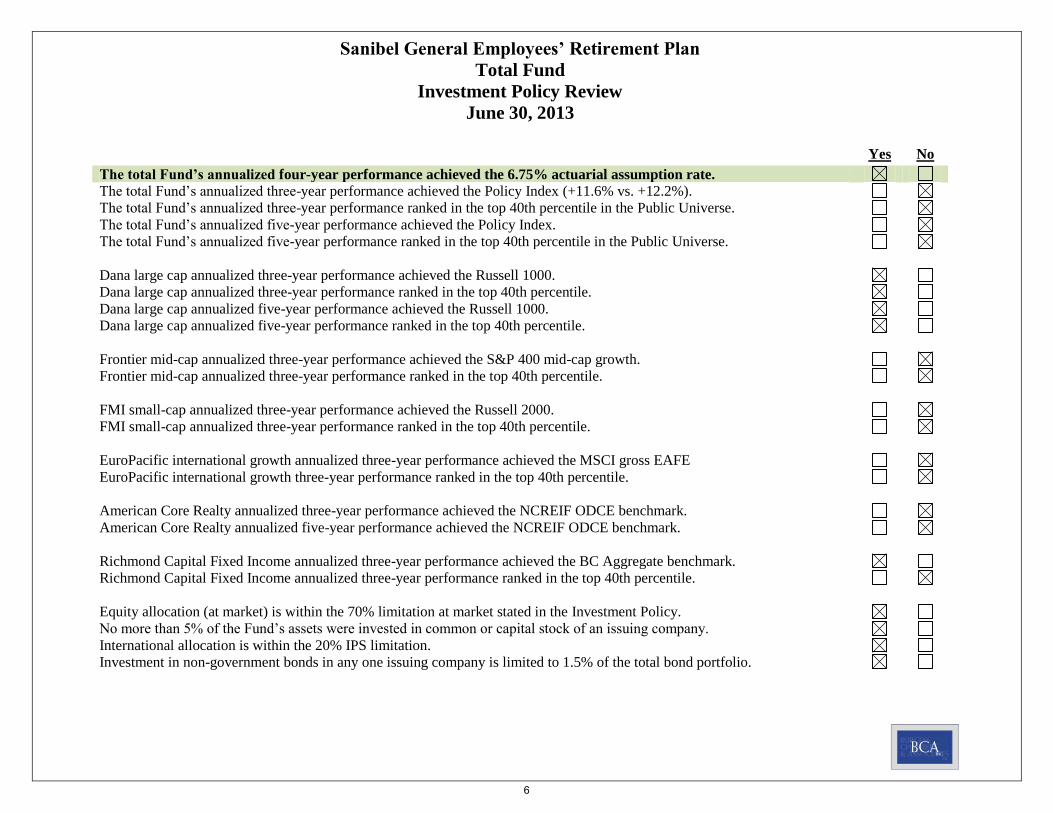
Yes No
The total Fund’s annualized four-year performance achieved the 6.75% actuarial assumption rate.
The total Fund’s annualized three-year performance achieved the Policy Index (+11.6% vs. +12.2%).
The total Fund’s annualized three-year performance ranked in the top 40th percentile in the Public Universe.
The total Fund’s annualized five-year performance achieved the Policy Index.
The total Fund’s annualized five-year performance ranked in the top 40th percentile in the Public Universe.
Dana large cap annualized three-year performance achieved the Russell 1000.
Dana large cap annualized three-year performance ranked in the top 40th percentile.
Dana large cap annualized five-year performance achieved the Russell 1000.
Dana large cap annualized five-year performance ranked in the top 40th percentile.
Frontier mid-cap annualized three-year performance achieved the S&P 400 mid-cap growth.
Frontier mid-cap annualized three-year performance ranked in the top 40th percentile.
FMI small-cap annualized three-year performance achieved the Russell 2000.
FMI small-cap annualized three-year performance ranked in the top 40th percentile.
EuroPacific international growth annualized three-year performance achieved the MSCI gross EAFE
EuroPacific international growth three-year performance ranked in the top 40th percentile.
American Core Realty annualized three-year performance achieved the NCREIF ODCE benchmark.
American Core Realty annualized five-year performance achieved the NCREIF ODCE benchmark.
Richmond Capital Fixed Income annualized three-year performance achieved the BC Aggregate benchmark.
Richmond Capital Fixed Income annualized three-year performance ranked in the top 40th percentile.
Equity allocation (at market) is within the 70% limitation at market stated in the Investment Policy.
No more than 5% of the Fund’s assets were invested in common or capital stock of an issuing company.
International allocation is within the 20% IPS limitation.
Investment in non-government bonds in any one issuing company is limited to 1.5% of the total bond portfolio.
6
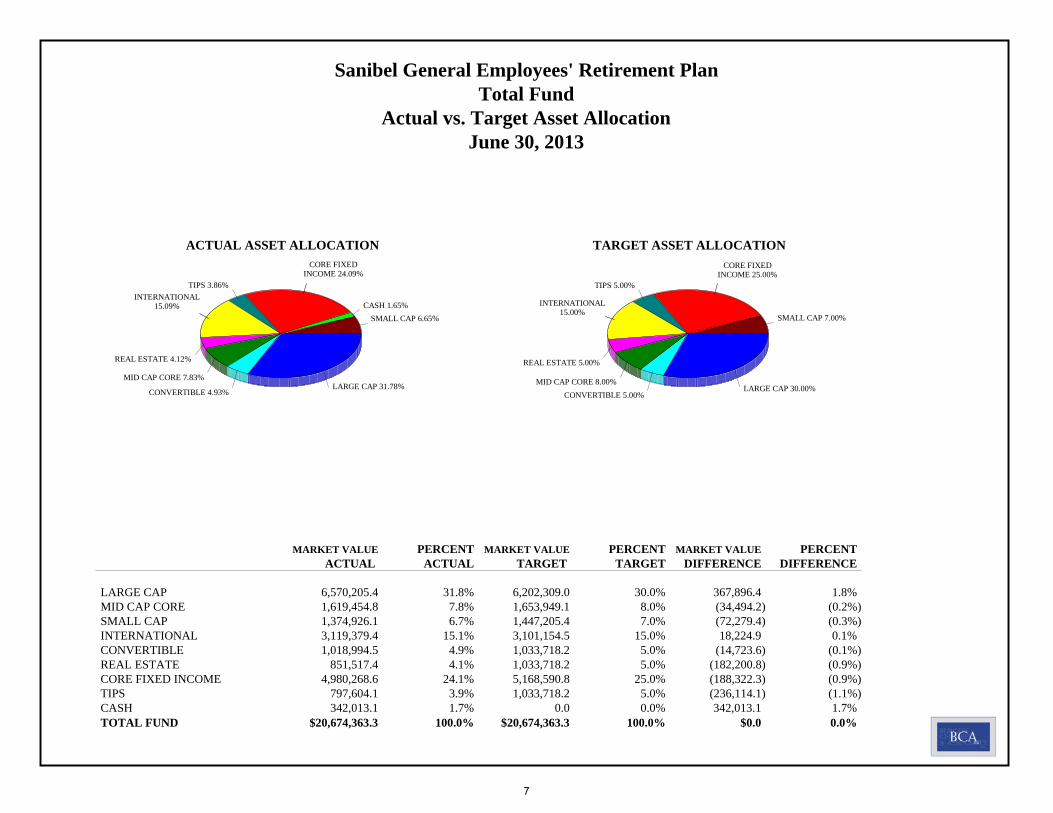
MARKET VALUE PERCENT MARKET VALUE PERCENT MARKET VALUE PERCENTACTUAL ACTUAL TARGET TARGET DIFFERENCE DIFFERENCE
LARGE CAP 6,570,205.4 31.8% 6,202,309.0 30.0% 367,896.4 1.8%MID CAP CORE 1,619,454.8 7.8% 1,653,949.1 8.0% (34,494.2) (0.2%)SMALL CAP 1,374,926.1 6.7% 1,447,205.4 7.0% (72,279.4) (0.3%)INTERNATIONAL 3,119,379.4 15.1% 3,101,154.5 15.0% 18,224.9 0.1%CONVERTIBLE 1,018,994.5 4.9% 1,033,718.2 5.0% (14,723.6) (0.1%)REAL ESTATE 851,517.4 4.1% 1,033,718.2 5.0% (182,200.8) (0.9%)CORE FIXED INCOME 4,980,268.6 24.1% 5,168,590.8 25.0% (188,322.3) (0.9%)TIPS 797,604.1 3.9% 1,033,718.2 5.0% (236,114.1) (1.1%)CASH 342,013.1 1.7% 0.0 0.0% 342,013.1 1.7%TOTAL FUND $20,674,363.3 100.0% $20,674,363.3 100.0% $0.0 0.0%
ACTUAL ASSET ALLOCATION
SMALL CAP 6.65%CASH 1.65%
CORE FIXEDINCOME 24.09%
TIPS 3.86%INTERNATIONAL
15.09%
REAL ESTATE 4.12%
MID CAP CORE 7.83%
CONVERTIBLE 4.93%LARGE CAP 31.78%
TARGET ASSET ALLOCATION
SMALL CAP 7.00%
CORE FIXEDINCOME 25.00%
TIPS 5.00%
INTERNATIONAL15.00%
REAL ESTATE 5.00%
MID CAP CORE 8.00%CONVERTIBLE 5.00%
LARGE CAP 30.00%
Sanibel General Employees' Retirement PlanTotal Fund
Actual vs. Target Asset AllocationJune 30, 2013
7
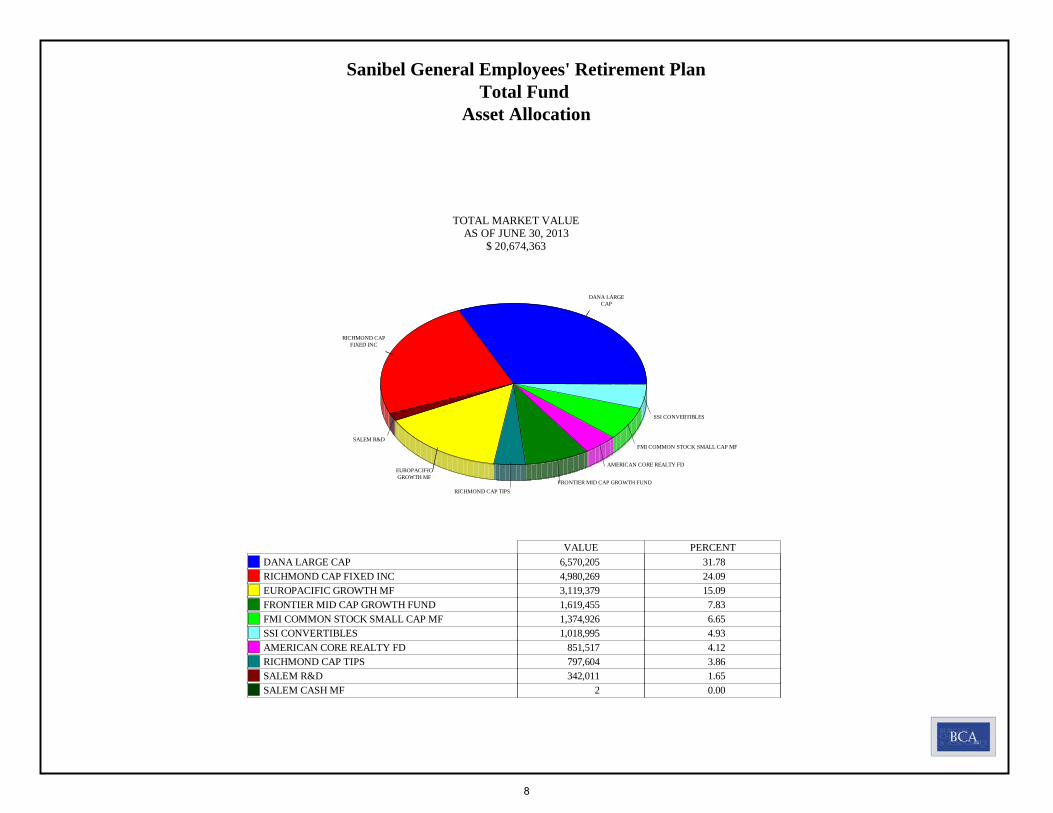
TOTAL MARKET VALUEAS OF JUNE 30, 2013
$ 20,674,363
DANA LARGECAP
RICHMOND CAPFIXED INC
SALEM R&D
EUROPACIFICGROWTH MF
RICHMOND CAP TIPSFRONTIER MID CAP GROWTH FUND
AMERICAN CORE REALTY FD
FMI COMMON STOCK SMALL CAP MF
SSI CONVERTIBLES
VALUE PERCENT DANA LARGE CAP 6,570,205 31.78 RICHMOND CAP FIXED INC 4,980,269 24.09 EUROPACIFIC GROWTH MF 3,119,379 15.09 FRONTIER MID CAP GROWTH FUND 1,619,455 7.83 FMI COMMON STOCK SMALL CAP MF 1,374,926 6.65 SSI CONVERTIBLES 1,018,995 4.93 AMERICAN CORE REALTY FD 851,517 4.12 RICHMOND CAP TIPS 797,604 3.86 SALEM R&D 342,011 1.65 SALEM CASH MF 2 0.00
Sanibel General Employees' Retirement PlanTotal Fund
Asset Allocation
8
Allo
catio
n Pe
rcen
t48.0046.0044.0042.0040.0038.0036.0034.0032.0030.0028.0026.0024.0022.0020.0018.0016.0014.0012.0010.00
8.006.004.002.000.00
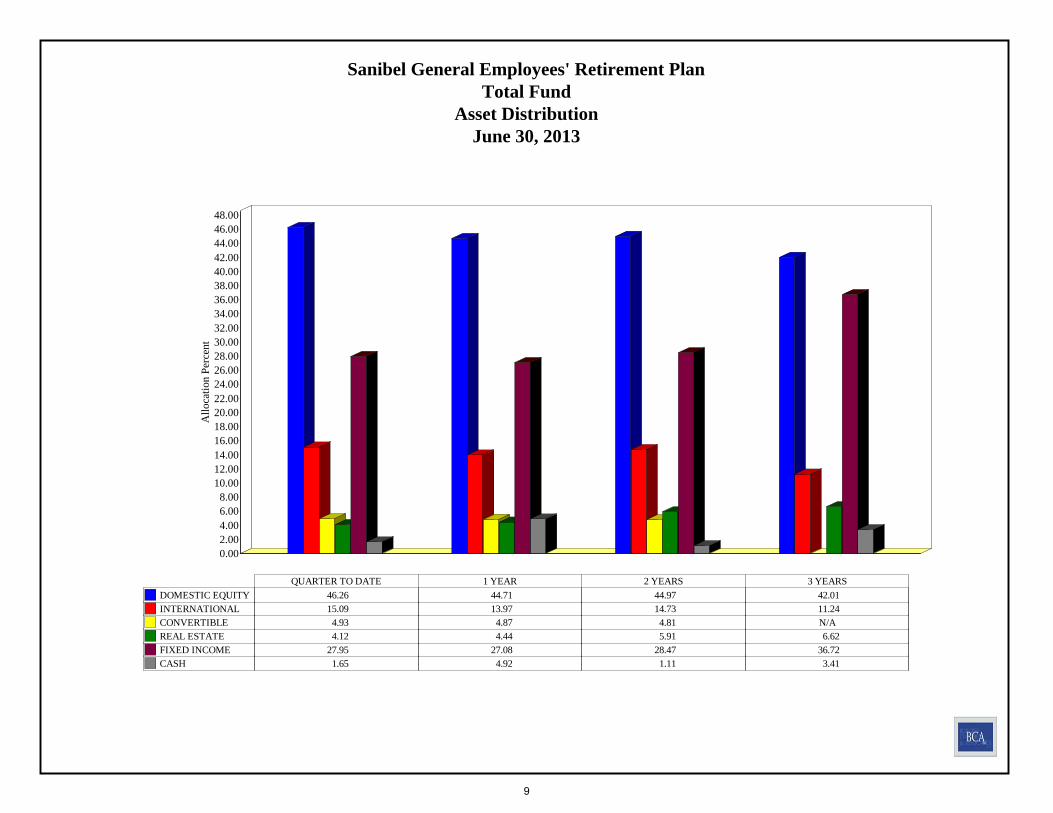
QUARTER TO DATE 1 YEAR 2 YEARS 3 YEARS DOMESTIC EQUITY 46.26 44.71 44.97 42.01 INTERNATIONAL 15.09 13.97 14.73 11.24 CONVERTIBLE 4.93 4.87 4.81 N/A REAL ESTATE 4.12 4.44 5.91 6.62 FIXED INCOME 27.95 27.08 28.47 36.72 CASH 1.65 4.92 1.11 3.41
Sanibel General Employees' Retirement PlanTotal Fund
Asset DistributionJune 30, 2013
9
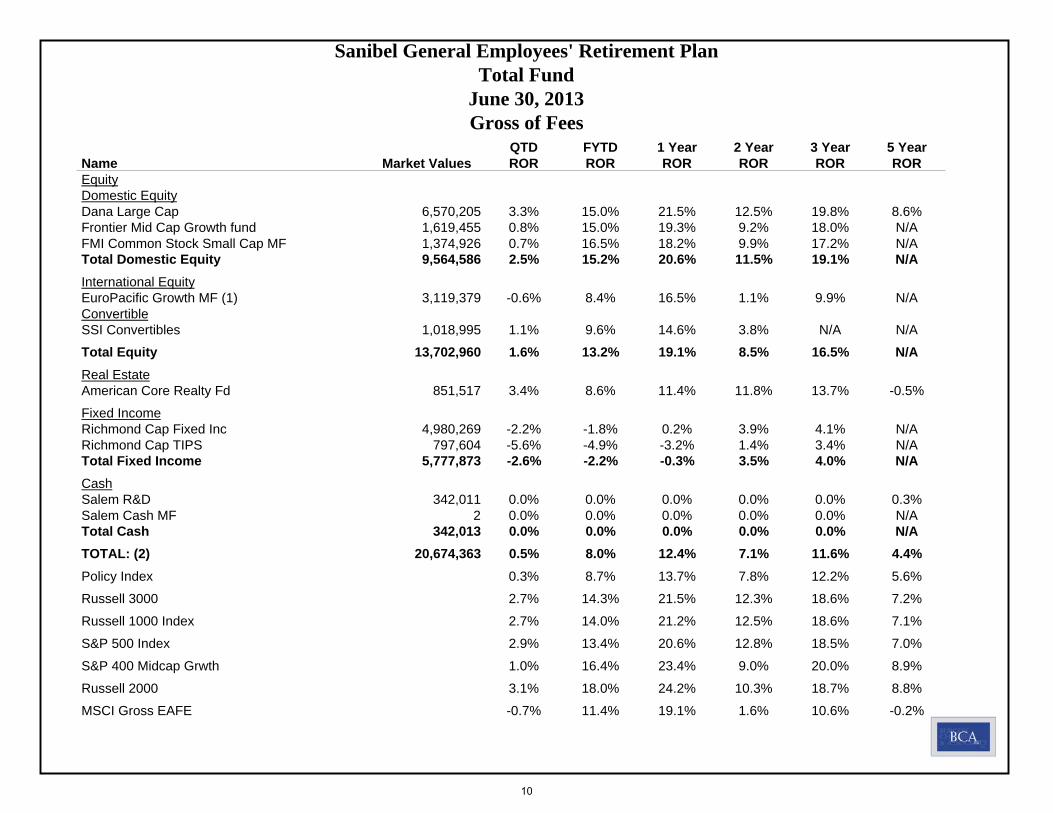
QTD FYTD 1 Year 2 Year 3 Year 5 YearName Market Values ROR ROR ROR ROR ROR ROREquityDomestic EquityDana Large Cap 6,570,205 3.3% 15.0% 21.5% 12.5% 19.8% 8.6%Frontier Mid Cap Growth fund 1,619,455 0.8% 15.0% 19.3% 9.2% 18.0% N/AFMI Common Stock Small Cap MF 1,374,926 0.7% 16.5% 18.2% 9.9% 17.2% N/ATotal Domestic Equity 9,564,586 2.5% 15.2% 20.6% 11.5% 19.1% N/AInternational EquityEuroPacific Growth MF (1) 3,119,379 -0.6% 8.4% 16.5% 1.1% 9.9% N/AConvertibleSSI Convertibles 1,018,995 1.1% 9.6% 14.6% 3.8% N/A N/A
Total Equity 13,702,960 1.6% 13.2% 19.1% 8.5% 16.5% N/AReal EstateAmerican Core Realty Fd 851,517 3.4% 8.6% 11.4% 11.8% 13.7% -0.5%
Fixed IncomeRichmond Cap Fixed Inc 4,980,269 -2.2% -1.8% 0.2% 3.9% 4.1% N/ARichmond Cap TIPS 797,604 -5.6% -4.9% -3.2% 1.4% 3.4% N/ATotal Fixed Income 5,777,873 -2.6% -2.2% -0.3% 3.5% 4.0% N/ACashSalem R&D 342,011 0.0% 0.0% 0.0% 0.0% 0.0% 0.3%Salem Cash MF 2 0.0% 0.0% 0.0% 0.0% 0.0% N/ATotal Cash 342,013 0.0% 0.0% 0.0% 0.0% 0.0% N/ATOTAL: (2) 20,674,363 0.5% 8.0% 12.4% 7.1% 11.6% 4.4%Policy Index 0.3% 8.7% 13.7% 7.8% 12.2% 5.6%
Russell 3000 2.7% 14.3% 21.5% 12.3% 18.6% 7.2%
Russell 1000 Index 2.7% 14.0% 21.2% 12.5% 18.6% 7.1%
S&P 500 Index 2.9% 13.4% 20.6% 12.8% 18.5% 7.0%
S&P 400 Midcap Grwth 1.0% 16.4% 23.4% 9.0% 20.0% 8.9%
Russell 2000 3.1% 18.0% 24.2% 10.3% 18.7% 8.8%
MSCI Gross EAFE -0.7% 11.4% 19.1% 1.6% 10.6% -0.2%
Sanibel General Employees' Retirement PlanTotal Fund
June 30, 2013Gross of Fees
10
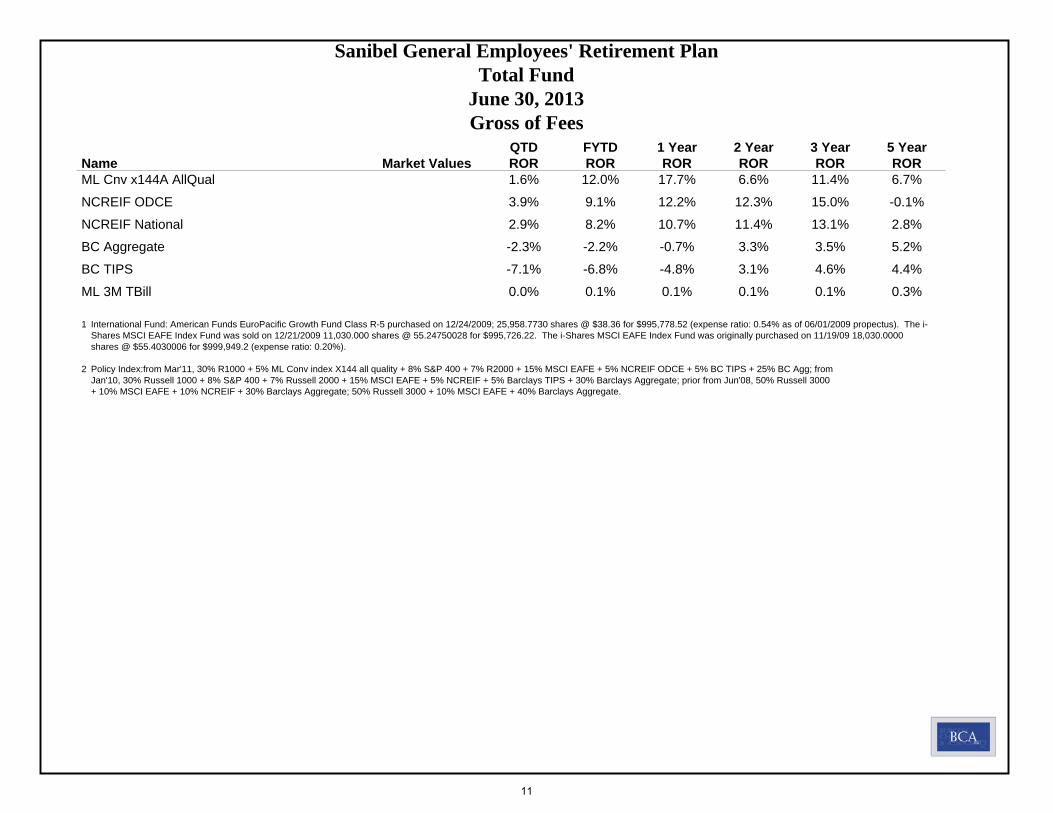
QTD FYTD 1 Year 2 Year 3 Year 5 YearName Market Values ROR ROR ROR ROR ROR RORML Cnv x144A AllQual 1.6% 12.0% 17.7% 6.6% 11.4% 6.7%
NCREIF ODCE 3.9% 9.1% 12.2% 12.3% 15.0% -0.1%
NCREIF National 2.9% 8.2% 10.7% 11.4% 13.1% 2.8%
BC Aggregate -2.3% -2.2% -0.7% 3.3% 3.5% 5.2%
BC TIPS -7.1% -6.8% -4.8% 3.1% 4.6% 4.4%
ML 3M TBill 0.0% 0.1% 0.1% 0.1% 0.1% 0.3%
1 International Fund: American Funds EuroPacific Growth Fund Class R-5 purchased on 12/24/2009; 25,958.7730 shares @ $38.36 for $995,778.52 (expense ratio: 0.54% as of 06/01/2009 propectus). The i-Shares MSCI EAFE Index Fund was sold on 12/21/2009 11,030.000 shares @ 55.24750028 for $995,726.22. The i-Shares MSCI EAFE Index Fund was originally purchased on 11/19/09 18,030.0000shares @ $55.4030006 for $999,949.2 (expense ratio: 0.20%).
2 Policy Index:from Mar'11, 30% R1000 + 5% ML Conv index X144 all quality + 8% S&P 400 + 7% R2000 + 15% MSCI EAFE + 5% NCREIF ODCE + 5% BC TIPS + 25% BC Agg; fromJan'10, 30% Russell 1000 + 8% S&P 400 + 7% Russell 2000 + 15% MSCI EAFE + 5% NCREIF + 5% Barclays TIPS + 30% Barclays Aggregate; prior from Jun'08, 50% Russell 3000+ 10% MSCI EAFE + 10% NCREIF + 30% Barclays Aggregate; 50% Russell 3000 + 10% MSCI EAFE + 40% Barclays Aggregate.
Sanibel General Employees' Retirement PlanTotal Fund
June 30, 2013Gross of Fees
11
RATE
OF
RETU
RN (%
)
18.00
16.00
14.00
12.00
10.00
8.00
6.00
4.00
2.00
0.00
-2.00
-4.00
-6.00
-8.00
-10.00
-12.00
-14.00
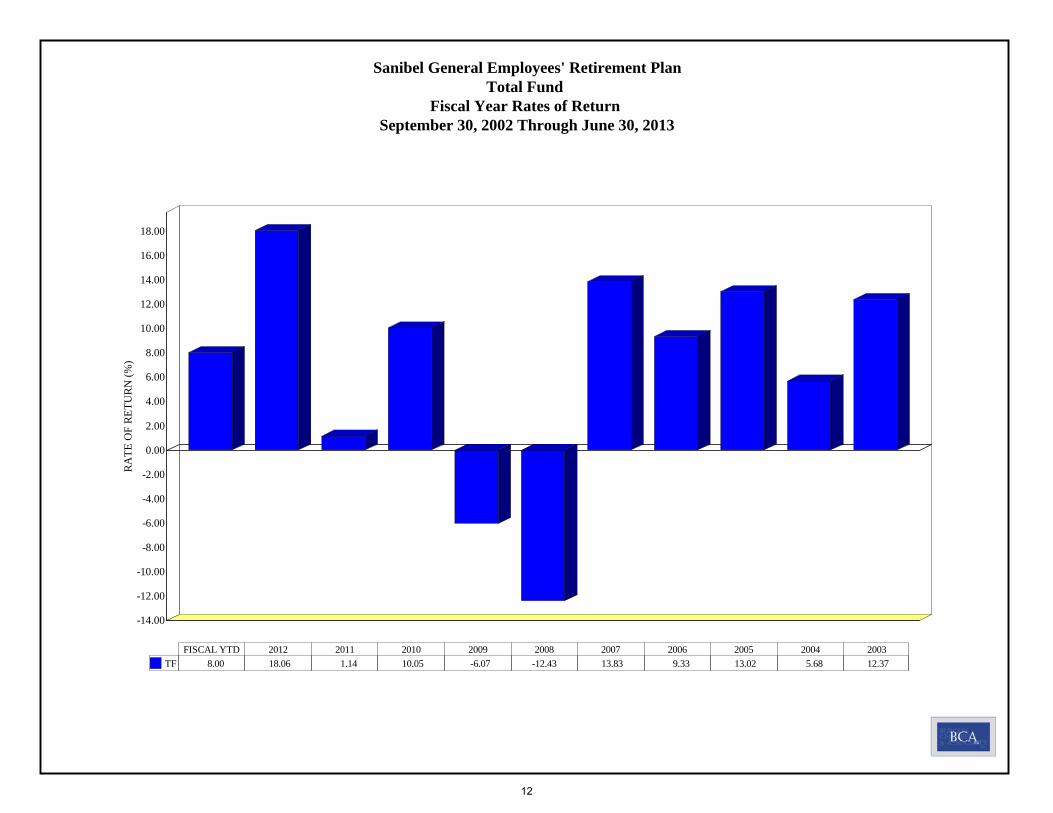
FISCAL YTD 2012 2011 2010 2009 2008 2007 2006 2005 2004 2003 TF 8.00 18.06 1.14 10.05 -6.07 -12.43 13.83 9.33 13.02 5.68 12.37
Sanibel General Employees' Retirement PlanTotal Fund
Fiscal Year Rates of Return September 30, 2002 Through June 30, 2013
12
RA
TE O
F R
ETU
RN
(%)
24.00
22.00
20.00
18.00
16.00
14.00
12.00
10.00
8.00
6.00
4.00
2.00
0.00
-2.00
-4.00
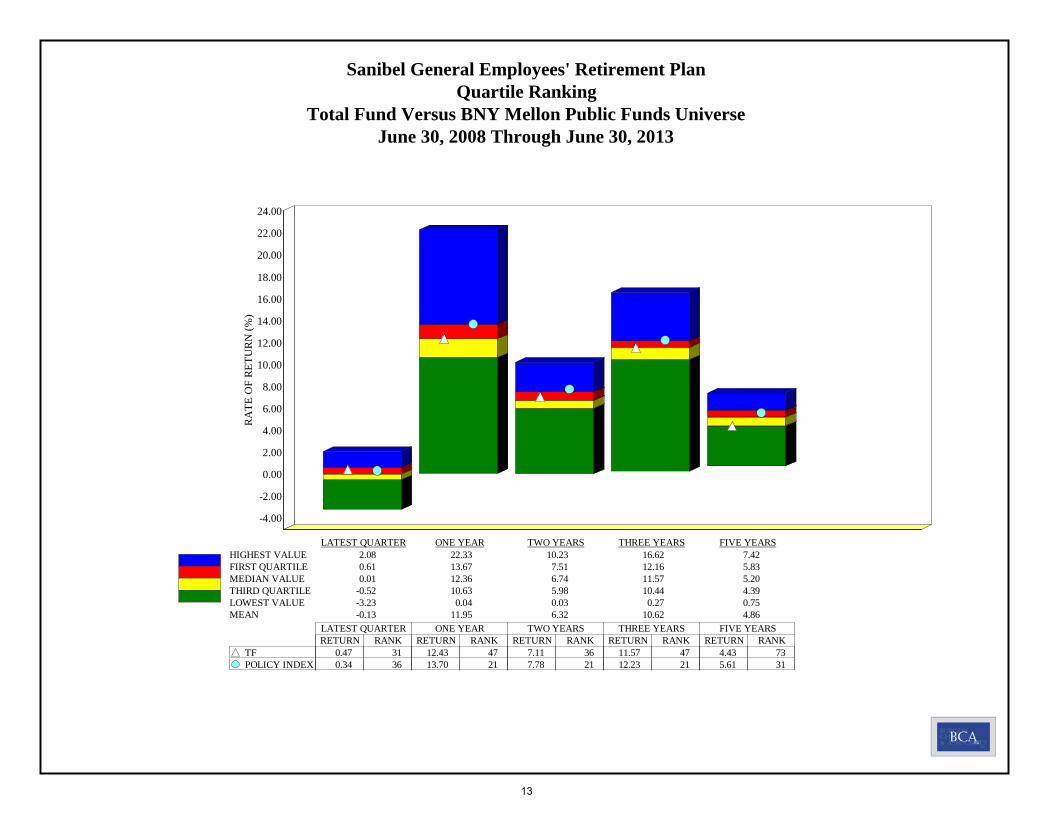
LATEST QUARTER ONE YEAR TWO YEARS THREE YEARS FIVE YEARS HIGHEST VALUE 2.08 22.33 10.23 16.62 7.42 FIRST QUARTILE 0.61 13.67 7.51 12.16 5.83 MEDIAN VALUE 0.01 12.36 6.74 11.57 5.20 THIRD QUARTILE -0.52 10.63 5.98 10.44 4.39 LOWEST VALUE -3.23 0.04 0.03 0.27 0.75 MEAN -0.13 11.95 6.32 10.62 4.86
LATEST QUARTER ONE YEAR TWO YEARS THREE YEARS FIVE YEARSRETURN RANK RETURN RANK RETURN RANK RETURN RANK RETURN RANK
TF 0.47 31 12.43 47 7.11 36 11.57 47 4.43 73 POLICY INDEX 0.34 36 13.70 21 7.78 21 12.23 21 5.61 31
Sanibel General Employees' Retirement PlanQuartile Ranking
Total Fund Versus BNY Mellon Public Funds UniverseJune 30, 2008 Through June 30, 2013
13
6/2008 6/2009 6/2010 6/2011 6/2012 6/2013
DO
LLA
RS
140.00
130.00
120.00
110.00
100.00
90.00
80.00
70.00
60.00
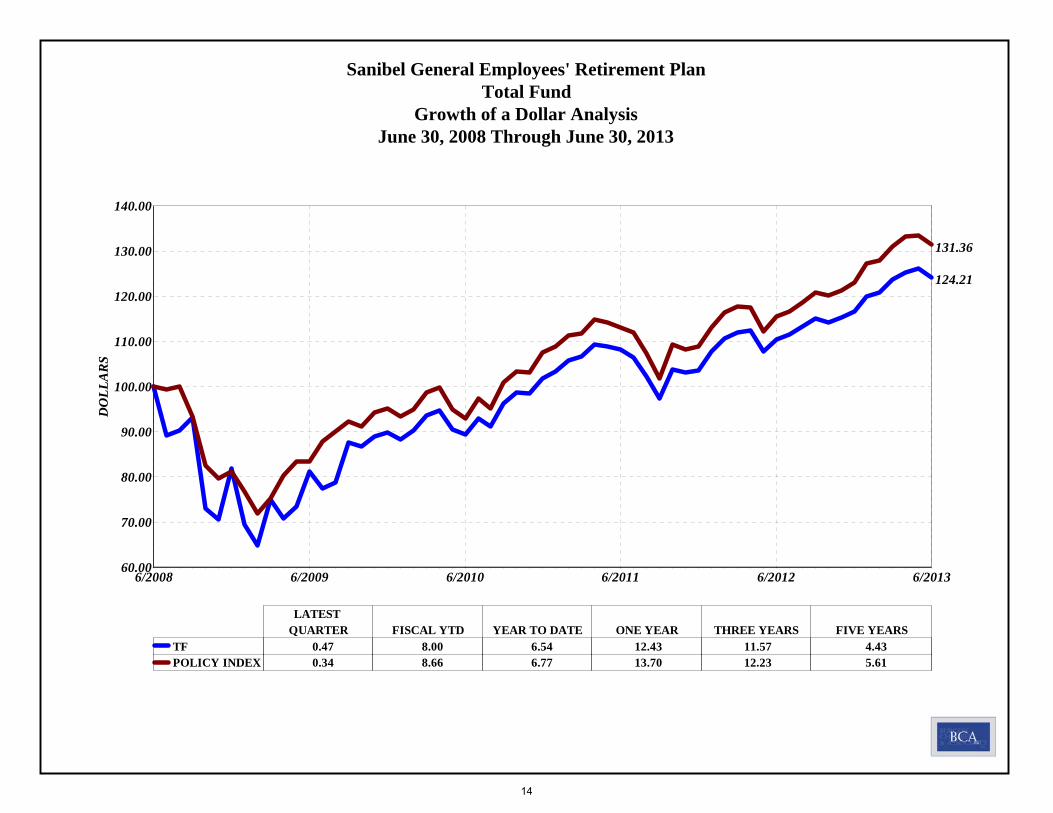
124.21
131.36
LATEST QUARTER FISCAL YTD YEAR TO DATE ONE YEAR THREE YEARS FIVE YEARS
TF 0.47 8.00 6.54 12.43 11.57 4.43 POLICY INDEX 0.34 8.66 6.77 13.70 12.23 5.61
Sanibel General Employees' Retirement PlanTotal Fund
Growth of a Dollar AnalysisJune 30, 2008 Through June 30, 2013
14
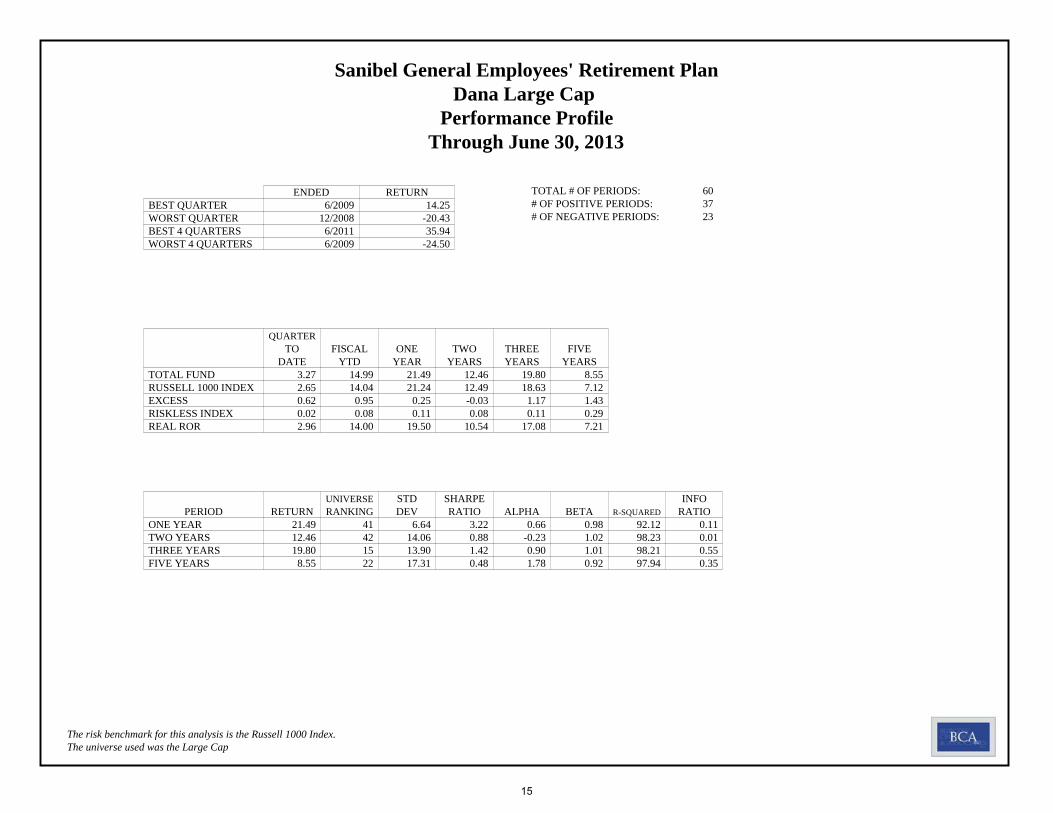
ENDED RETURNBEST QUARTER 6/2009 14.25WORST QUARTER 12/2008 -20.43BEST 4 QUARTERS 6/2011 35.94WORST 4 QUARTERS 6/2009 -24.50
TOTAL # OF PERIODS: 60# OF POSITIVE PERIODS: 37# OF NEGATIVE PERIODS: 23
QUARTERTO FISCAL ONE TWO THREE FIVE
DATE YTD YEAR YEARS YEARS YEARSTOTAL FUND 3.27 14.99 21.49 12.46 19.80 8.55RUSSELL 1000 INDEX 2.65 14.04 21.24 12.49 18.63 7.12EXCESS 0.62 0.95 0.25 -0.03 1.17 1.43RISKLESS INDEX 0.02 0.08 0.11 0.08 0.11 0.29REAL ROR 2.96 14.00 19.50 10.54 17.08 7.21
UNIVERSE STD SHARPE INFOPERIOD RETURN RANKING DEV RATIO ALPHA BETA R-SQUARED RATIO
ONE YEAR 21.49 41 6.64 3.22 0.66 0.98 92.12 0.11TWO YEARS 12.46 42 14.06 0.88 -0.23 1.02 98.23 0.01THREE YEARS 19.80 15 13.90 1.42 0.90 1.01 98.21 0.55FIVE YEARS 8.55 22 17.31 0.48 1.78 0.92 97.94 0.35
Sanibel General Employees' Retirement PlanDana Large Cap
Performance Profile Through June 30, 2013
The universe used was the Large CapThe risk benchmark for this analysis is the Russell 1000 Index.
15
UP MARKET PERFORMANCE
RA
TE O
F R
ETU
RN
(%)
55.00
50.00
45.00
40.00
35.00
30.00
25.00
20.00
15.00
10.00
5.00
0.00
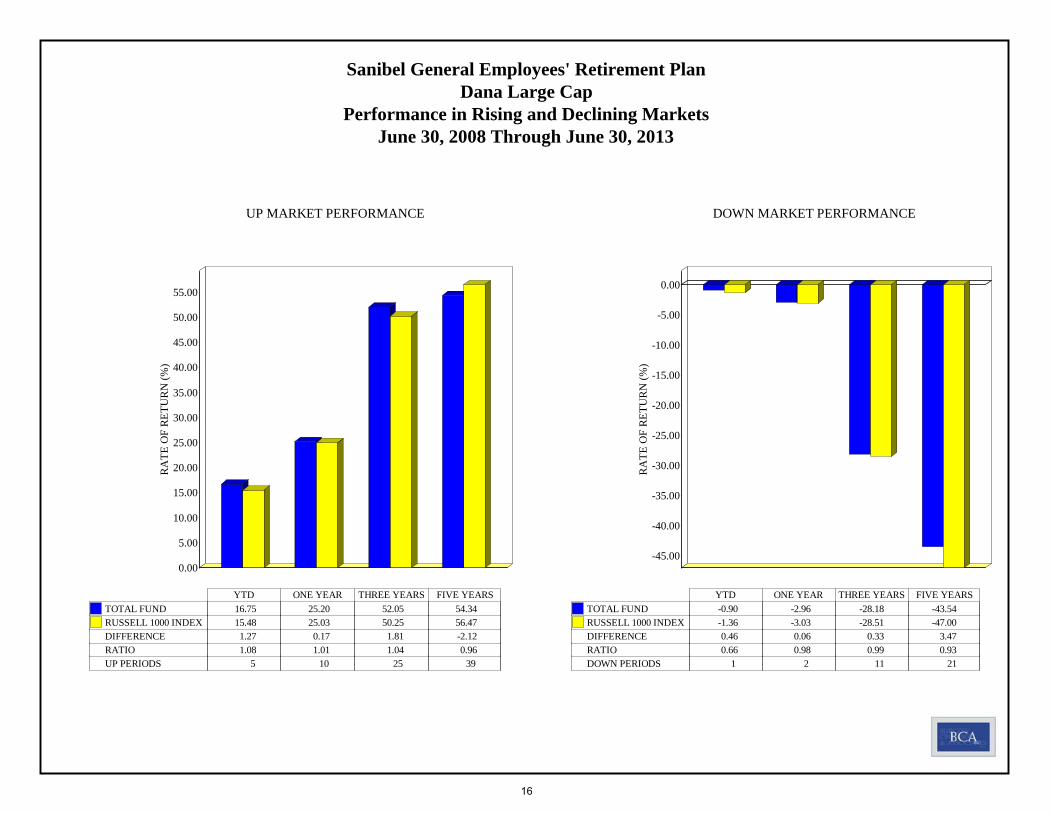
YTD ONE YEAR THREE YEARS FIVE YEARS TOTAL FUND 16.75 25.20 52.05 54.34 RUSSELL 1000 INDEX 15.48 25.03 50.25 56.47 DIFFERENCE 1.27 0.17 1.81 -2.12 RATIO 1.08 1.01 1.04 0.96 UP PERIODS 5 10 25 39
DOWN MARKET PERFORMANCE
RA
TE O
F R
ETU
RN
(%)
0.00
-5.00
-10.00
-15.00
-20.00
-25.00
-30.00
-35.00
-40.00
-45.00
YTD ONE YEAR THREE YEARS FIVE YEARS TOTAL FUND -0.90 -2.96 -28.18 -43.54 RUSSELL 1000 INDEX -1.36 -3.03 -28.51 -47.00 DIFFERENCE 0.46 0.06 0.33 3.47 RATIO 0.66 0.98 0.99 0.93 DOWN PERIODS 1 2 11 21
Sanibel General Employees' Retirement PlanDana Large Cap
Performance in Rising and Declining MarketsJune 30, 2008 Through June 30, 2013
16
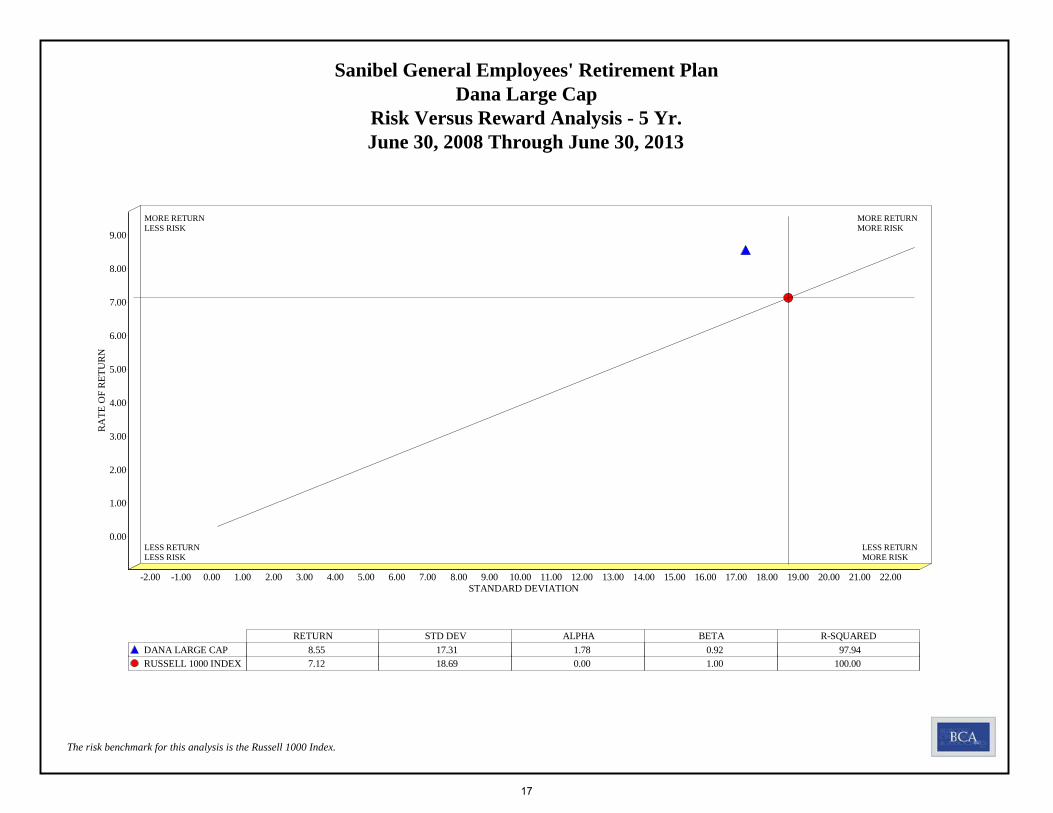
STANDARD DEVIATION22.0021.0020.0019.0018.0017.0016.0015.0014.0013.0012.0011.0010.009.008.007.006.005.004.003.002.001.000.00-1.00-2.00
RATE
OF
RET
UR
N
9.00
8.00
7.00
6.00
5.00
4.00
3.00
2.00
1.00
0.00
RETURN STD DEV ALPHA BETA R-SQUARED DANA LARGE CAP 8.55 17.31 1.78 0.92 97.94 RUSSELL 1000 INDEX 7.12 18.69 0.00 1.00 100.00
MORE RETURNLESS RISK
MORE RETURNMORE RISK
LESS RETURNLESS RISK
LESS RETURNMORE RISK
Sanibel General Employees' Retirement PlanDana Large Cap
Risk Versus Reward Analysis - 5 Yr.June 30, 2008 Through June 30, 2013
The risk benchmark for this analysis is the Russell 1000 Index.
17

ENDED RETURNBEST QUARTER 3/2012 14.96WORST QUARTER 9/2011 -17.71BEST 4 QUARTERS 6/2011 37.95WORST 4 QUARTERS 6/2012 -0.05
TOTAL # OF PERIODS: 36# OF POSITIVE PERIODS: 24# OF NEGATIVE PERIODS: 12
QUARTERTO FISCAL ONE TWO THREE
DATE YTD YEAR YEARS YEARSTOTAL FUND 0.82 14.96 19.31 9.20 18.05S&P 400 MIDCAP GRWTH 0.99 16.37 23.42 9.02 20.04EXCESS -0.18 -1.42 -4.11 0.18 -1.99RISKLESS INDEX 0.02 0.08 0.11 0.08 0.11REAL ROR 0.51 13.95 17.35 7.34 15.37
UNIVERSE STD SHARPE INFOPERIOD RETURN RANKING DEV RATIO ALPHA BETA R-SQUARED RATIO
ONE YEAR 19.31 64 7.76 2.48 -0.89 0.88 93.00 -1.51TWO YEARS 9.20 41 15.03 0.61 1.05 0.89 95.86 -0.04THREE YEARS 18.05 74 14.94 1.20 0.23 0.89 95.80 -0.55
Sanibel General Employees' Retirement PlanFrontier Mid Cap Growth fund
Performance Profile Through June 30, 2013
The universe used was the Mid Cap GrowthThe risk benchmark for this analysis is the S&P 400 Midcap Grwth.
18
UP MARKET PERFORMANCE
RA
TE O
F R
ETU
RN
(%)
60.00
55.00
50.00
45.00
40.00
35.00
30.00
25.00
20.00
15.00
10.00
5.00
0.00
YTD ONE YEAR THREE YEARS TOTAL FUND 14.64 23.56 54.21 S&P 400 MIDCAP GRWTH 16.10 27.96 61.48 DIFFERENCE -1.47 -4.40 -7.27 RATIO 0.91 0.84 0.88 UP PERIODS 5 10 24
DOWN MARKET PERFORMANCE
RA
TE O
F R
ETU
RN
(%)
0.00-2.00-4.00-6.00-8.00
-10.00-12.00-14.00-16.00-18.00-20.00-22.00-24.00-26.00-28.00-30.00-32.00
YTD ONE YEAR THREE YEARS TOTAL FUND -1.74 -3.44 -30.82 S&P 400 MIDCAP GRWTH -2.45 -3.55 -33.66 DIFFERENCE 0.72 0.11 2.84 RATIO 0.71 0.97 0.92 DOWN PERIODS 1 2 12
Sanibel General Employees' Retirement PlanFrontier Mid Cap Growth fund
Performance in Rising and Declining MarketsJune 30, 2010 Through June 30, 2013
19
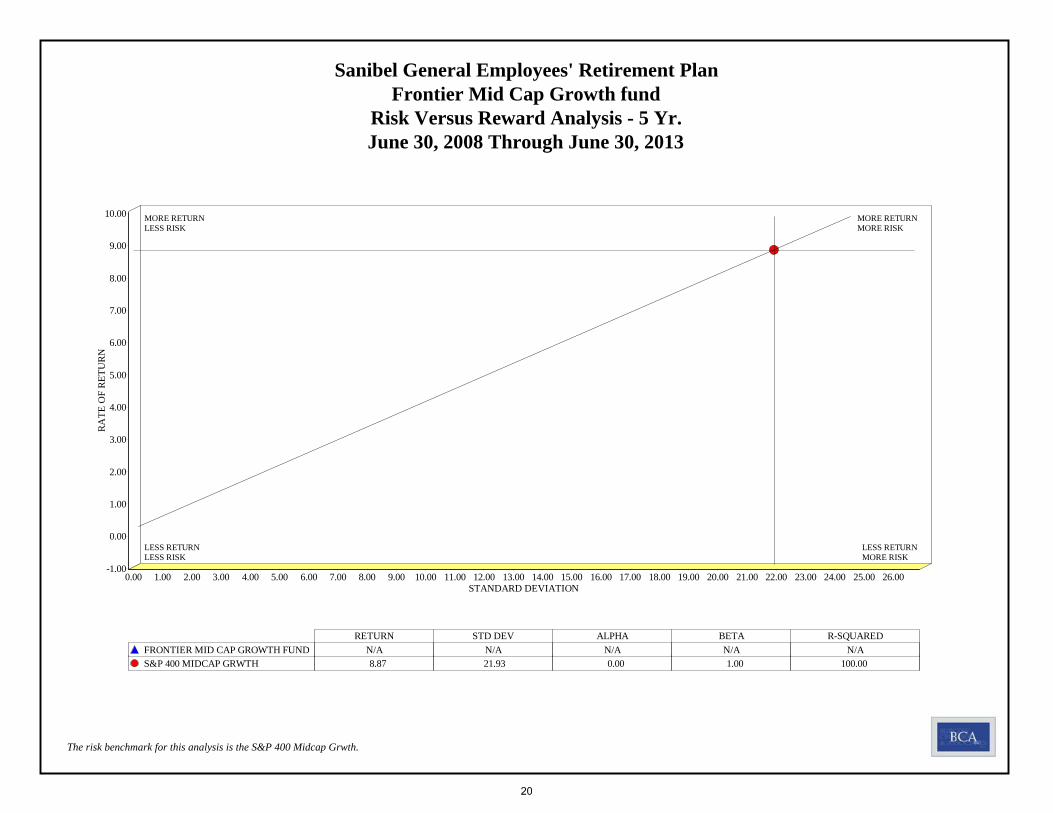
STANDARD DEVIATION26.0025.0024.0023.0022.0021.0020.0019.0018.0017.0016.0015.0014.0013.0012.0011.0010.009.008.007.006.005.004.003.002.001.000.00
RATE
OF
RET
UR
N
10.00
9.00
8.00
7.00
6.00
5.00
4.00
3.00
2.00
1.00
0.00
-1.00
RETURN STD DEV ALPHA BETA R-SQUARED FRONTIER MID CAP GROWTH FUND N/A N/A N/A N/A N/A S&P 400 MIDCAP GRWTH 8.87 21.93 0.00 1.00 100.00
MORE RETURNLESS RISK
MORE RETURNMORE RISK
LESS RETURNLESS RISK
LESS RETURNMORE RISK
Sanibel General Employees' Retirement PlanFrontier Mid Cap Growth fund
Risk Versus Reward Analysis - 5 Yr.June 30, 2008 Through June 30, 2013
The risk benchmark for this analysis is the S&P 400 Midcap Grwth.
20
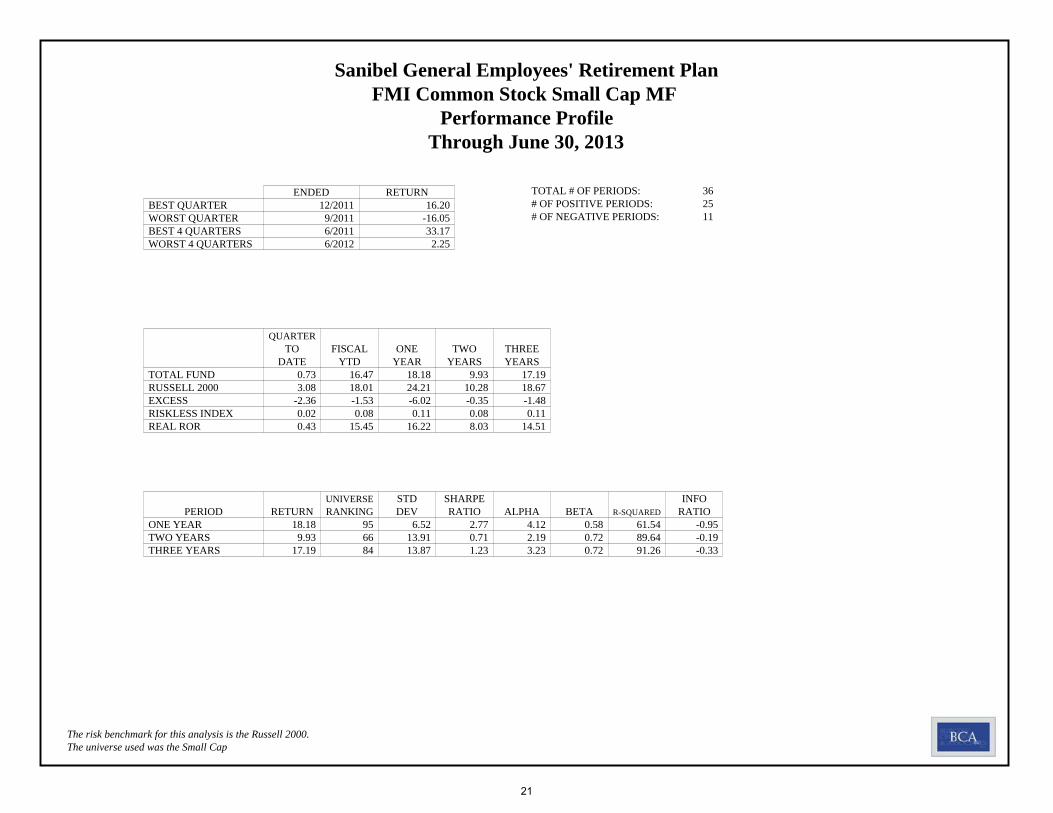
ENDED RETURNBEST QUARTER 12/2011 16.20WORST QUARTER 9/2011 -16.05BEST 4 QUARTERS 6/2011 33.17WORST 4 QUARTERS 6/2012 2.25
TOTAL # OF PERIODS: 36# OF POSITIVE PERIODS: 25# OF NEGATIVE PERIODS: 11
QUARTERTO FISCAL ONE TWO THREE
DATE YTD YEAR YEARS YEARSTOTAL FUND 0.73 16.47 18.18 9.93 17.19RUSSELL 2000 3.08 18.01 24.21 10.28 18.67EXCESS -2.36 -1.53 -6.02 -0.35 -1.48RISKLESS INDEX 0.02 0.08 0.11 0.08 0.11REAL ROR 0.43 15.45 16.22 8.03 14.51
UNIVERSE STD SHARPE INFOPERIOD RETURN RANKING DEV RATIO ALPHA BETA R-SQUARED RATIO
ONE YEAR 18.18 95 6.52 2.77 4.12 0.58 61.54 -0.95TWO YEARS 9.93 66 13.91 0.71 2.19 0.72 89.64 -0.19THREE YEARS 17.19 84 13.87 1.23 3.23 0.72 91.26 -0.33
Sanibel General Employees' Retirement PlanFMI Common Stock Small Cap MF
Performance Profile Through June 30, 2013
The universe used was the Small CapThe risk benchmark for this analysis is the Russell 2000.
21
UP MARKET PERFORMANCE
RA
TE O
F R
ETU
RN
(%)
75.00
70.00
65.00
60.00
55.00
50.00
45.00
40.00
35.00
30.00
25.00
20.00
15.00
10.00
5.00
0.00
YTD ONE YEAR THREE YEARS TOTAL FUND 13.86 21.46 52.67 RUSSELL 2000 16.88 29.88 73.90 DIFFERENCE -3.02 -8.41 -21.23 RATIO 0.82 0.72 0.71 UP PERIODS 4 8 22
DOWN MARKET PERFORMANCE
RA
TE O
F R
ETU
RN
(%)
0.00-2.00-4.00-6.00-8.00
-10.00-12.00-14.00-16.00-18.00-20.00-22.00-24.00-26.00-28.00-30.00-32.00-34.00
YTD ONE YEAR THREE YEARS TOTAL FUND -2.21 -2.70 -22.67 RUSSELL 2000 -0.88 -4.37 -34.90 DIFFERENCE -1.33 1.67 12.24 RATIO 2.51 0.62 0.65 DOWN PERIODS 2 4 14
Sanibel General Employees' Retirement PlanFMI Common Stock Small Cap MF
Performance in Rising and Declining MarketsJune 30, 2010 Through June 30, 2013
22
STANDARD DEVIATION29.0028.0027.0026.0025.0024.0023.0022.0021.0020.0019.0018.0017.0016.0015.0014.0013.0012.0011.0010.009.008.007.006.005.004.003.002.001.000.00
RATE
OF
RET
UR
N
9.00
8.00
7.00
6.00
5.00
4.00
3.00
2.00
1.00
0.00
-1.00
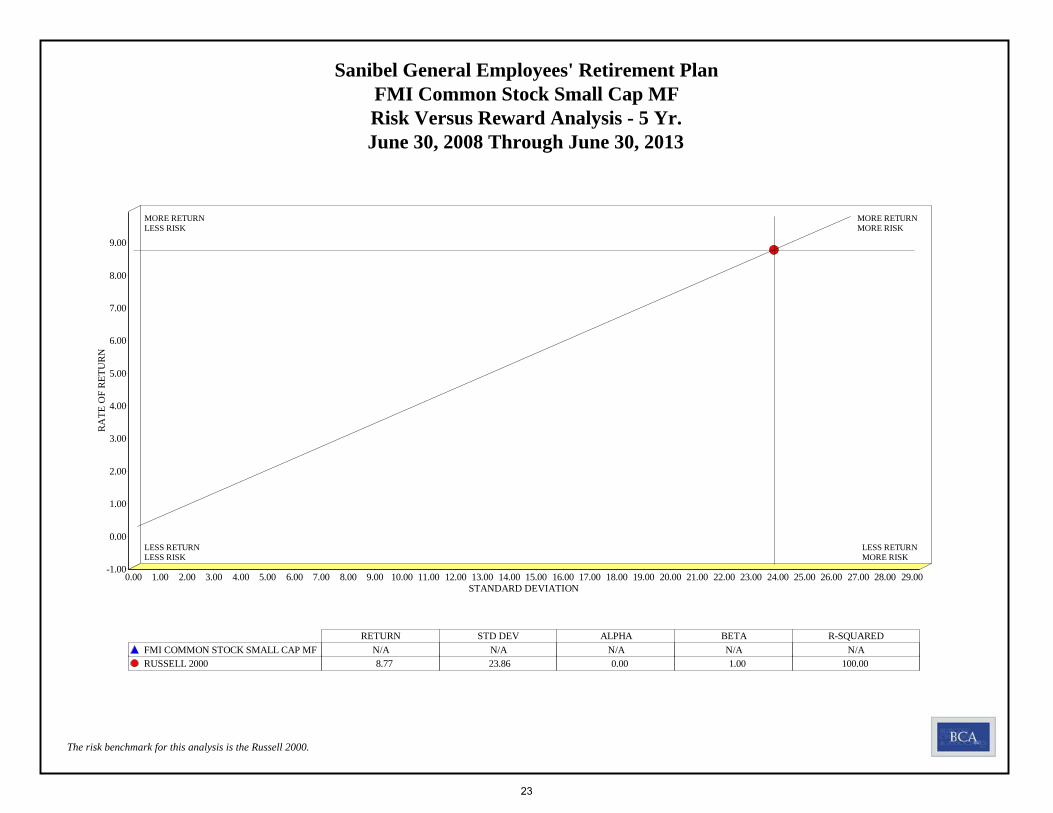
RETURN STD DEV ALPHA BETA R-SQUARED FMI COMMON STOCK SMALL CAP MF N/A N/A N/A N/A N/A RUSSELL 2000 8.77 23.86 0.00 1.00 100.00
MORE RETURNLESS RISK
MORE RETURNMORE RISK
LESS RETURNLESS RISK
LESS RETURNMORE RISK
Sanibel General Employees' Retirement PlanFMI Common Stock Small Cap MFRisk Versus Reward Analysis - 5 Yr.June 30, 2008 Through June 30, 2013
The risk benchmark for this analysis is the Russell 2000.
23

ENDED RETURNBEST QUARTER 9/2010 17.08WORST QUARTER 9/2011 -20.71BEST 4 QUARTERS 6/2011 29.95WORST 4 QUARTERS 6/2012 -12.22
TOTAL # OF PERIODS: 36# OF POSITIVE PERIODS: 22# OF NEGATIVE PERIODS: 14
QUARTERTO FISCAL ONE TWO THREE
DATE YTD YEAR YEARS YEARSTOTAL FUND -0.61 8.38 16.48 1.11 9.93MSCI GROSS EAFE -0.73 11.36 19.14 1.58 10.55EXCESS 0.12 -2.99 -2.66 -0.47 -0.62RISKLESS INDEX 0.02 0.08 0.11 0.08 0.11REAL ROR -0.92 7.37 14.49 -0.66 7.40
UNIVERSE STD SHARPE INFOPERIOD RETURN RANKING DEV RATIO ALPHA BETA R-SQUARED RATIO
ONE YEAR 16.48 75 7.43 2.20 1.71 0.77 89.16 -0.76TWO YEARS 1.11 72 17.27 0.06 -0.39 0.94 95.57 -0.17THREE YEARS 9.93 78 17.17 0.57 0.09 0.93 95.69 -0.21
Sanibel General Employees' Retirement PlanEuroPacific Growth MF
Performance Profile Through June 30, 2013
The universe used was the EAFEThe risk benchmark for this analysis is the MSCI Gross EAFE.
24
UP MARKET PERFORMANCE
RA
TE O
F R
ETU
RN
(%)
75.00
70.00
65.00
60.00
55.00
50.00
45.00
40.00
35.00
30.00
25.00
20.00
15.00
10.00
5.00
0.00
YTD ONE YEAR THREE YEARS TOTAL FUND 8.11 22.92 65.03 MSCI GROSS EAFE 11.88 27.59 74.20 DIFFERENCE -3.77 -4.67 -9.17 RATIO 0.68 0.83 0.88 UP PERIODS 3 9 20
DOWN MARKET PERFORMANCE
RA
TE O
F R
ETU
RN
(%)
0.00-2.00-4.00-6.00-8.00
-10.00-12.00-14.00-16.00-18.00-20.00-22.00-24.00-26.00-28.00-30.00-32.00-34.00-36.00
YTD ONE YEAR THREE YEARS TOTAL FUND -5.24 -5.24 -33.84 MSCI GROSS EAFE -6.62 -6.62 -37.38 DIFFERENCE 1.38 1.38 3.54 RATIO 0.79 0.79 0.91 DOWN PERIODS 3 3 16
Sanibel General Employees' Retirement PlanEuroPacific Growth MF
Performance in Rising and Declining MarketsJune 30, 2010 Through June 30, 2013
25
STANDARD DEVIATION27.0026.0025.0024.0023.0022.0021.0020.0019.0018.0017.0016.0015.0014.0013.0012.0011.0010.009.008.007.006.005.004.003.002.001.000.00
RATE
OF
RET
UR
N
2.00
1.00
0.00
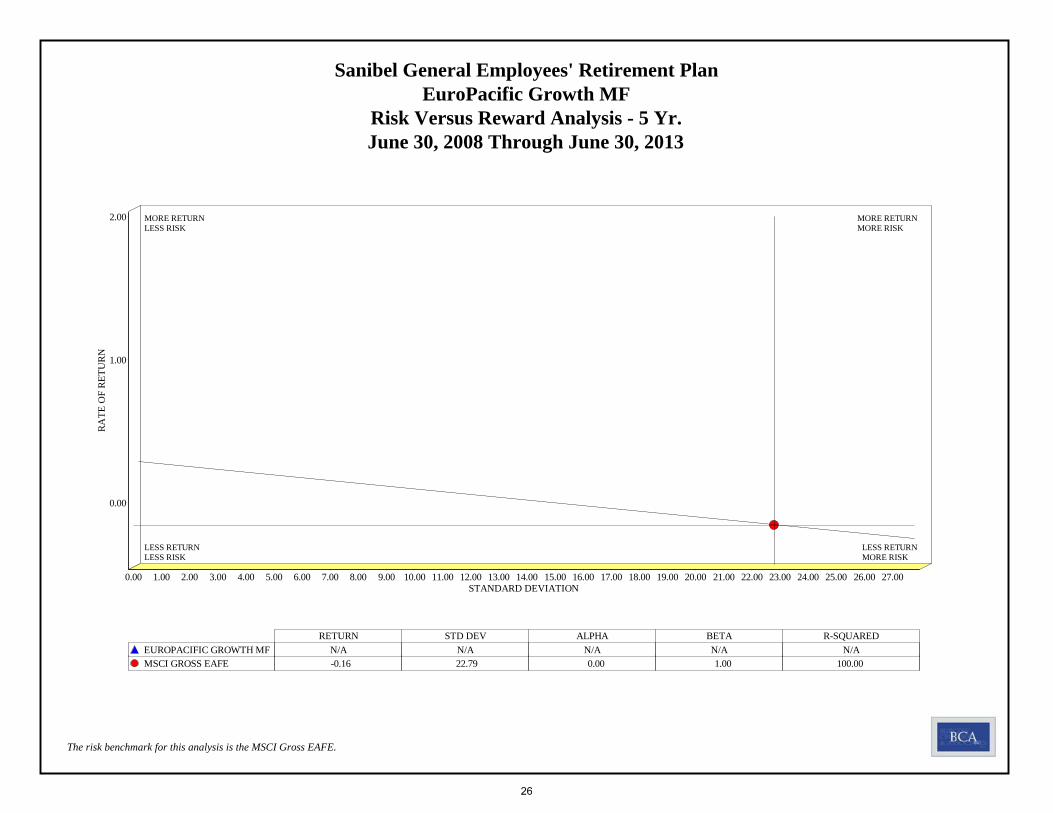
RETURN STD DEV ALPHA BETA R-SQUARED EUROPACIFIC GROWTH MF N/A N/A N/A N/A N/A MSCI GROSS EAFE -0.16 22.79 0.00 1.00 100.00
MORE RETURNLESS RISK
MORE RETURNMORE RISK
LESS RETURNLESS RISK
LESS RETURNMORE RISK
Sanibel General Employees' Retirement PlanEuroPacific Growth MF
Risk Versus Reward Analysis - 5 Yr.June 30, 2008 Through June 30, 2013
The risk benchmark for this analysis is the MSCI Gross EAFE.
26
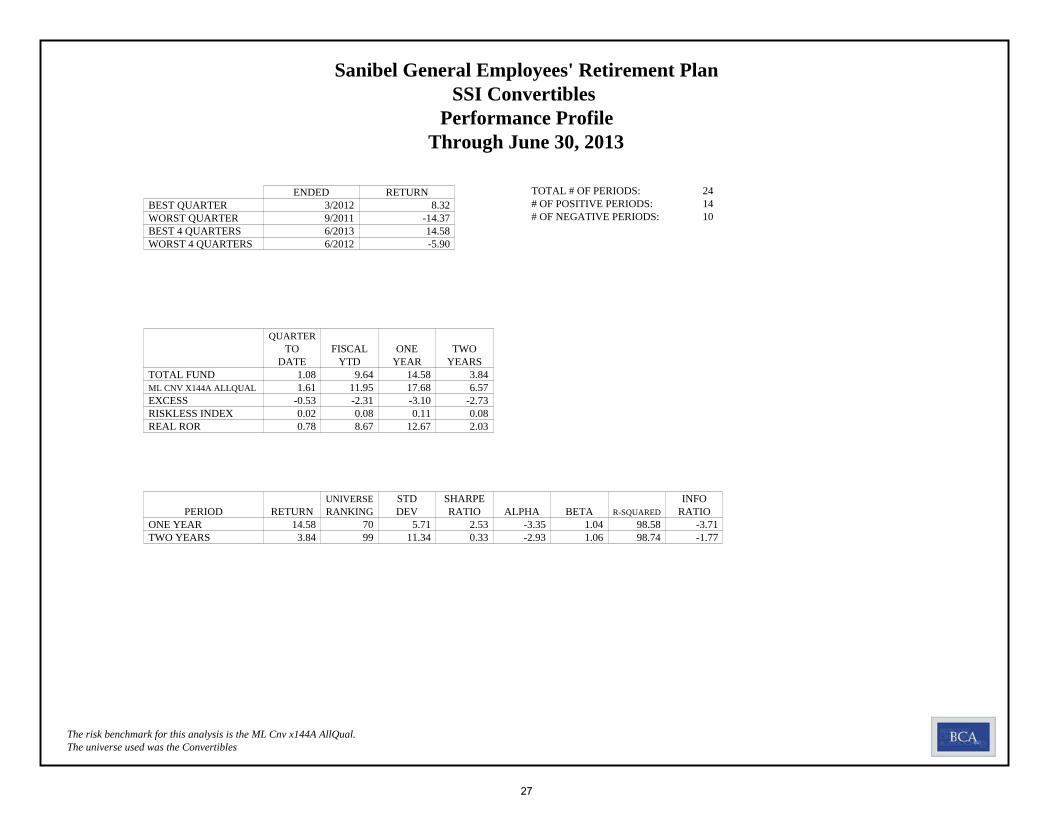
ENDED RETURNBEST QUARTER 3/2012 8.32WORST QUARTER 9/2011 -14.37BEST 4 QUARTERS 6/2013 14.58WORST 4 QUARTERS 6/2012 -5.90
TOTAL # OF PERIODS: 24# OF POSITIVE PERIODS: 14# OF NEGATIVE PERIODS: 10
QUARTERTO FISCAL ONE TWO
DATE YTD YEAR YEARSTOTAL FUND 1.08 9.64 14.58 3.84ML CNV X144A ALLQUAL 1.61 11.95 17.68 6.57EXCESS -0.53 -2.31 -3.10 -2.73RISKLESS INDEX 0.02 0.08 0.11 0.08REAL ROR 0.78 8.67 12.67 2.03
UNIVERSE STD SHARPE INFOPERIOD RETURN RANKING DEV RATIO ALPHA BETA R-SQUARED RATIO
ONE YEAR 14.58 70 5.71 2.53 -3.35 1.04 98.58 -3.71TWO YEARS 3.84 99 11.34 0.33 -2.93 1.06 98.74 -1.77
Sanibel General Employees' Retirement PlanSSI Convertibles
Performance Profile Through June 30, 2013
The universe used was the ConvertiblesThe risk benchmark for this analysis is the ML Cnv x144A AllQual.
27
UP MARKET PERFORMANCER
ATE
OF
RET
UR
N (%
)
21.0020.0019.0018.0017.0016.0015.0014.0013.0012.0011.0010.00
9.008.007.006.005.004.003.002.001.000.00
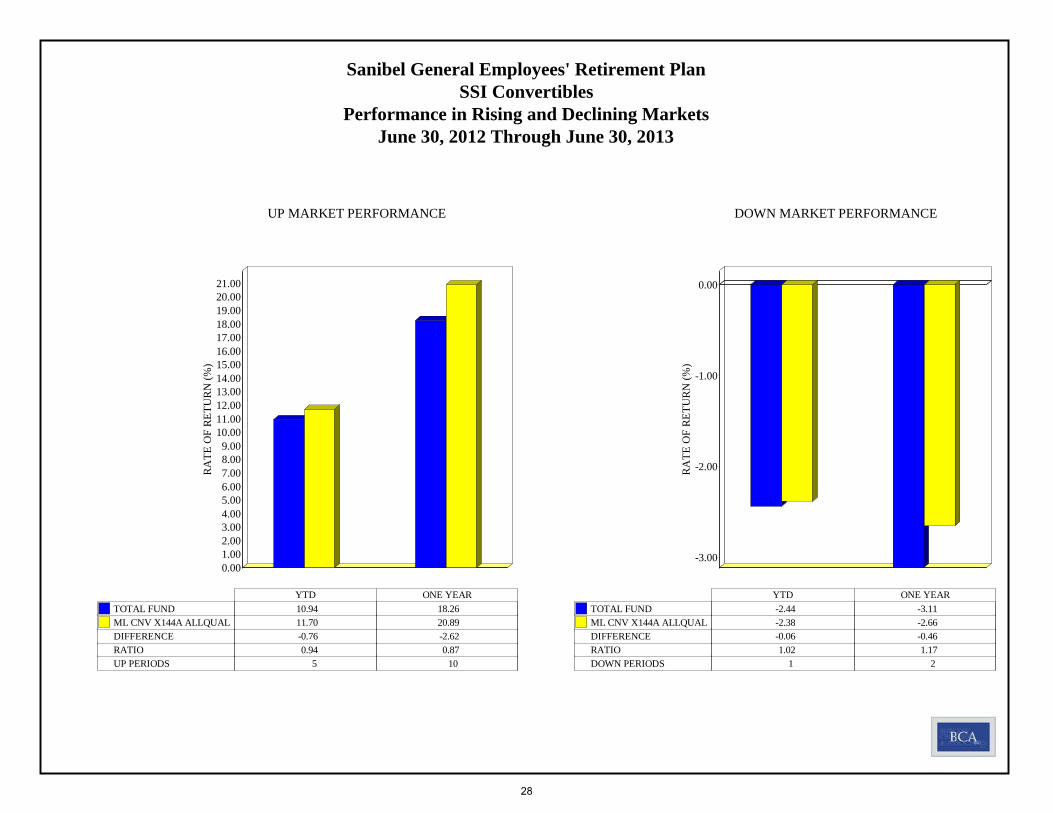
YTD ONE YEAR TOTAL FUND 10.94 18.26 ML CNV X144A ALLQUAL 11.70 20.89 DIFFERENCE -0.76 -2.62 RATIO 0.94 0.87 UP PERIODS 5 10
DOWN MARKET PERFORMANCE
RA
TE O
F R
ETU
RN
(%)
0.00
-1.00
-2.00
-3.00
YTD ONE YEAR TOTAL FUND -2.44 -3.11 ML CNV X144A ALLQUAL -2.38 -2.66 DIFFERENCE -0.06 -0.46 RATIO 1.02 1.17 DOWN PERIODS 1 2
Sanibel General Employees' Retirement PlanSSI Convertibles
Performance in Rising and Declining MarketsJune 30, 2012 Through June 30, 2013
28

STANDARD DEVIATION19.0018.0017.0016.0015.0014.0013.0012.0011.0010.009.008.007.006.005.004.003.002.001.000.00
RATE
OF
RET
UR
N
7.00
6.00
5.00
4.00
3.00
2.00
1.00
0.00
RETURN STD DEV ALPHA BETA R-SQUARED SSI CONVERTIBLES N/A N/A N/A N/A N/A ML CNV X144A ALLQUAL 6.65 15.56 0.00 1.00 100.00
MORE RETURNLESS RISK
MORE RETURNMORE RISK
LESS RETURNLESS RISK
LESS RETURNMORE RISK
Sanibel General Employees' Retirement PlanSSI Convertibles
Risk Versus Reward Analysis - 5 Yr.June 30, 2008 Through June 30, 2013
The risk benchmark for this analysis is the ML Cnv x144A AllQual.
29
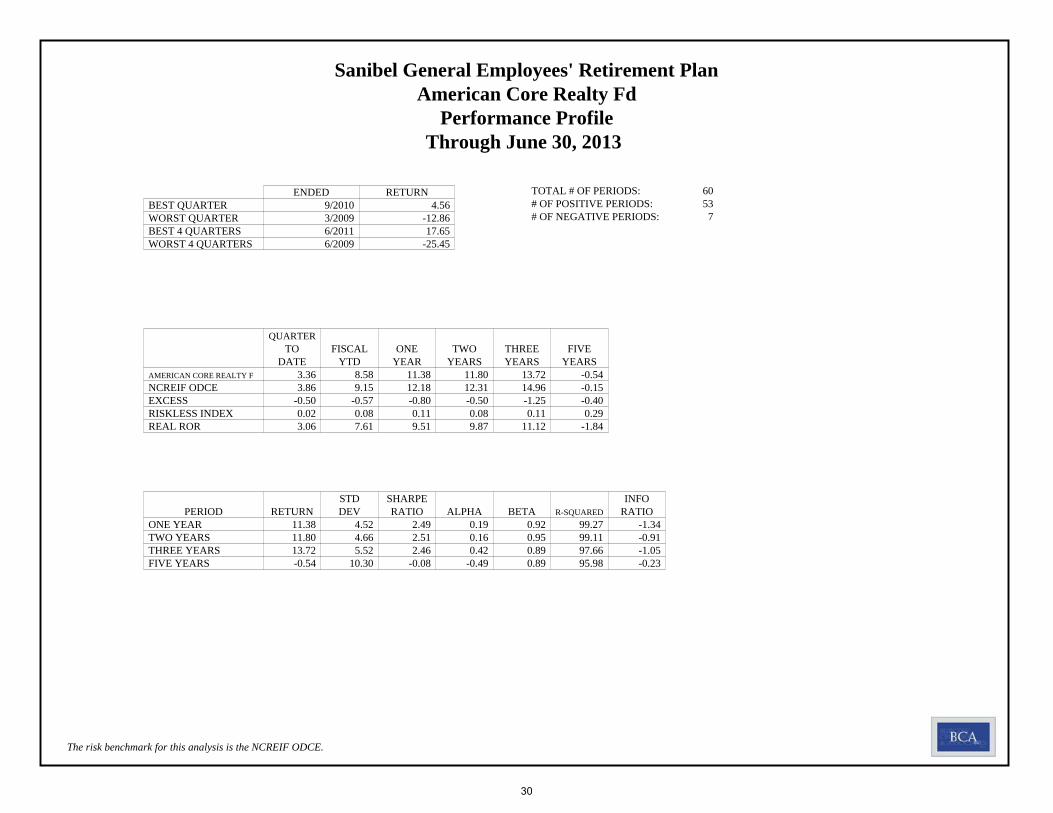
ENDED RETURNBEST QUARTER 9/2010 4.56WORST QUARTER 3/2009 -12.86BEST 4 QUARTERS 6/2011 17.65WORST 4 QUARTERS 6/2009 -25.45
TOTAL # OF PERIODS: 60# OF POSITIVE PERIODS: 53# OF NEGATIVE PERIODS: 7
QUARTERTO FISCAL ONE TWO THREE FIVE
DATE YTD YEAR YEARS YEARS YEARSAMERICAN CORE REALTY F 3.36 8.58 11.38 11.80 13.72 -0.54NCREIF ODCE 3.86 9.15 12.18 12.31 14.96 -0.15EXCESS -0.50 -0.57 -0.80 -0.50 -1.25 -0.40RISKLESS INDEX 0.02 0.08 0.11 0.08 0.11 0.29REAL ROR 3.06 7.61 9.51 9.87 11.12 -1.84
STD SHARPE INFOPERIOD RETURN DEV RATIO ALPHA BETA R-SQUARED RATIO
ONE YEAR 11.38 4.52 2.49 0.19 0.92 99.27 -1.34TWO YEARS 11.80 4.66 2.51 0.16 0.95 99.11 -0.91THREE YEARS 13.72 5.52 2.46 0.42 0.89 97.66 -1.05FIVE YEARS -0.54 10.30 -0.08 -0.49 0.89 95.98 -0.23
Sanibel General Employees' Retirement PlanAmerican Core Realty Fd
Performance ProfileThrough June 30, 2013
The risk benchmark for this analysis is the NCREIF ODCE.
30
UP MARKET PERFORMANCE
RA
TE O
F R
ETU
RN
(%)
15.00
14.00
13.00
12.00
11.00
10.00
9.00
8.00
7.00
6.00
5.00
4.00
3.00
2.00
1.00
0.00
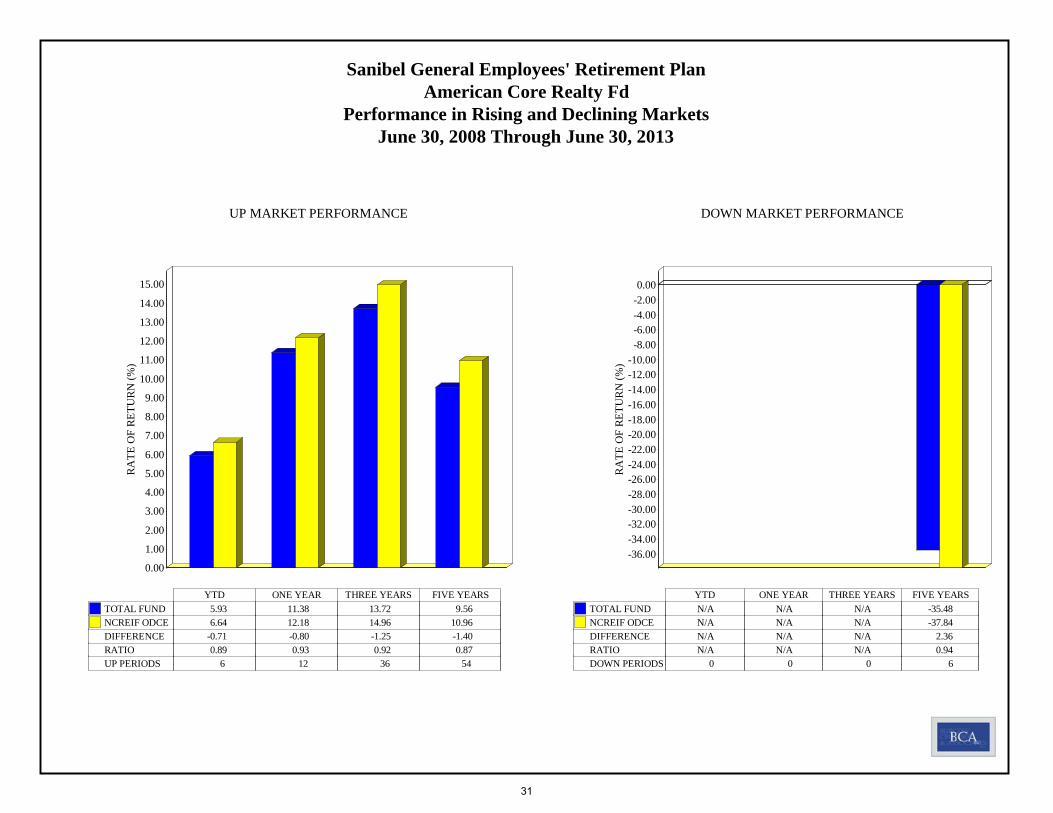
YTD ONE YEAR THREE YEARS FIVE YEARS TOTAL FUND 5.93 11.38 13.72 9.56 NCREIF ODCE 6.64 12.18 14.96 10.96 DIFFERENCE -0.71 -0.80 -1.25 -1.40 RATIO 0.89 0.93 0.92 0.87 UP PERIODS 6 12 36 54
DOWN MARKET PERFORMANCE
RA
TE O
F R
ETU
RN
(%)
0.00-2.00-4.00-6.00-8.00
-10.00-12.00-14.00-16.00-18.00-20.00-22.00-24.00-26.00-28.00-30.00-32.00-34.00-36.00
YTD ONE YEAR THREE YEARS FIVE YEARS TOTAL FUND N/A N/A N/A -35.48 NCREIF ODCE N/A N/A N/A -37.84 DIFFERENCE N/A N/A N/A 2.36 RATIO N/A N/A N/A 0.94 DOWN PERIODS 0 0 0 6
Sanibel General Employees' Retirement PlanAmerican Core Realty Fd
Performance in Rising and Declining MarketsJune 30, 2008 Through June 30, 2013
31
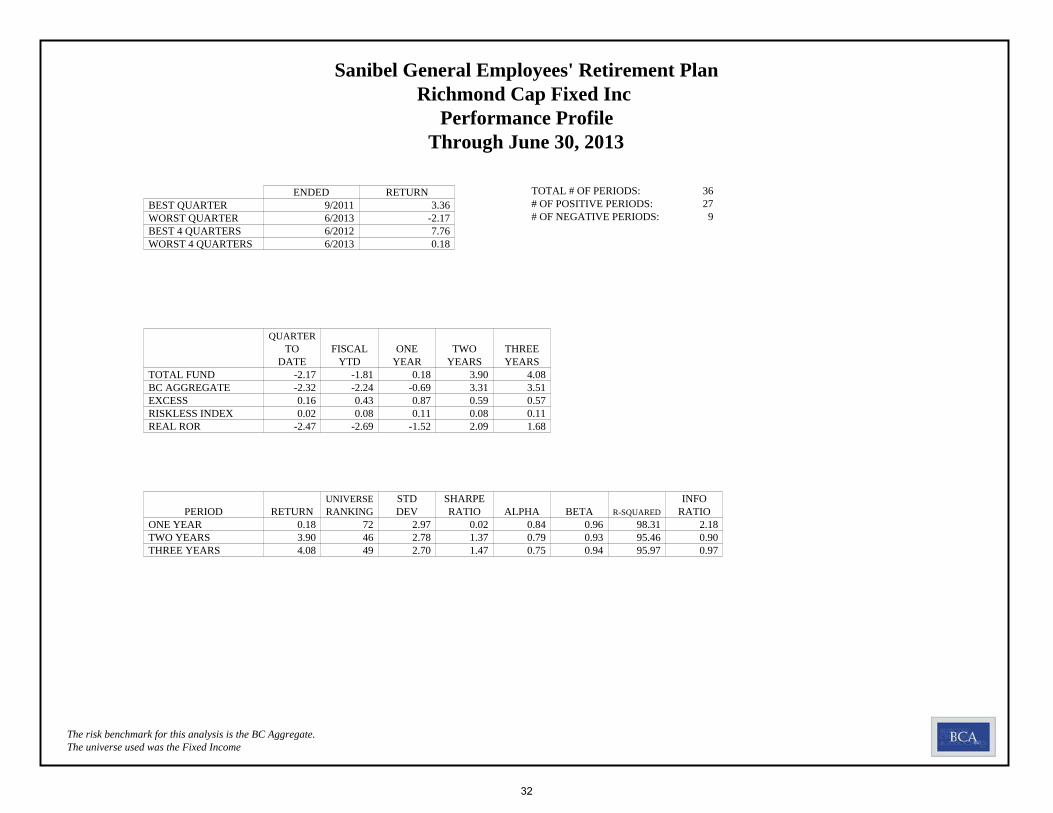
ENDED RETURNBEST QUARTER 9/2011 3.36WORST QUARTER 6/2013 -2.17BEST 4 QUARTERS 6/2012 7.76WORST 4 QUARTERS 6/2013 0.18
TOTAL # OF PERIODS: 36# OF POSITIVE PERIODS: 27# OF NEGATIVE PERIODS: 9
QUARTERTO FISCAL ONE TWO THREE
DATE YTD YEAR YEARS YEARSTOTAL FUND -2.17 -1.81 0.18 3.90 4.08BC AGGREGATE -2.32 -2.24 -0.69 3.31 3.51EXCESS 0.16 0.43 0.87 0.59 0.57RISKLESS INDEX 0.02 0.08 0.11 0.08 0.11REAL ROR -2.47 -2.69 -1.52 2.09 1.68
UNIVERSE STD SHARPE INFOPERIOD RETURN RANKING DEV RATIO ALPHA BETA R-SQUARED RATIO
ONE YEAR 0.18 72 2.97 0.02 0.84 0.96 98.31 2.18TWO YEARS 3.90 46 2.78 1.37 0.79 0.93 95.46 0.90THREE YEARS 4.08 49 2.70 1.47 0.75 0.94 95.97 0.97
Sanibel General Employees' Retirement PlanRichmond Cap Fixed Inc
Performance Profile Through June 30, 2013
The universe used was the Fixed IncomeThe risk benchmark for this analysis is the BC Aggregate.
32
UP MARKET PERFORMANCE
RA
TE O
F R
ETU
RN
(%)
9.00
8.00
7.00
6.00
5.00
4.00
3.00
2.00
1.00
0.00
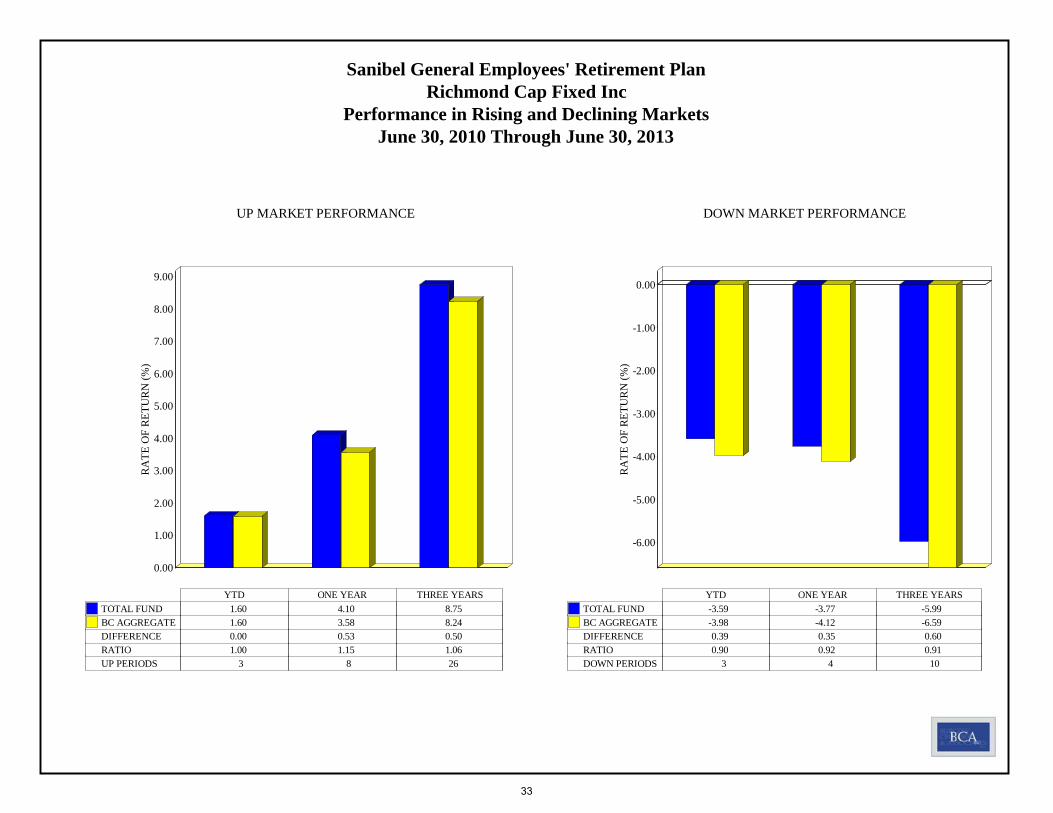
YTD ONE YEAR THREE YEARS TOTAL FUND 1.60 4.10 8.75 BC AGGREGATE 1.60 3.58 8.24 DIFFERENCE 0.00 0.53 0.50 RATIO 1.00 1.15 1.06 UP PERIODS 3 8 26
DOWN MARKET PERFORMANCE
RA
TE O
F R
ETU
RN
(%)
0.00
-1.00
-2.00
-3.00
-4.00
-5.00
-6.00
YTD ONE YEAR THREE YEARS TOTAL FUND -3.59 -3.77 -5.99 BC AGGREGATE -3.98 -4.12 -6.59 DIFFERENCE 0.39 0.35 0.60 RATIO 0.90 0.92 0.91 DOWN PERIODS 3 4 10
Sanibel General Employees' Retirement PlanRichmond Cap Fixed Inc
Performance in Rising and Declining MarketsJune 30, 2010 Through June 30, 2013
33
STANDARD DEVIATION4.003.002.001.000.00
RATE
OF
RET
UR
N
5.00
4.00
3.00
2.00
1.00
0.00
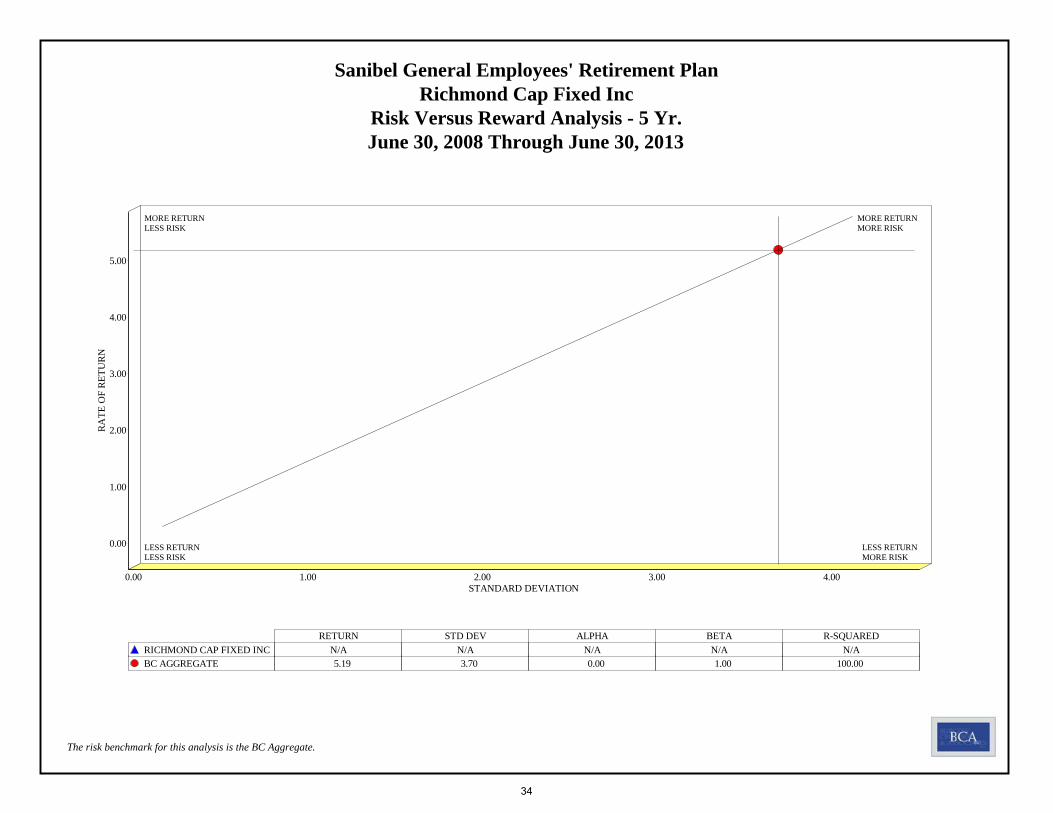
RETURN STD DEV ALPHA BETA R-SQUARED RICHMOND CAP FIXED INC N/A N/A N/A N/A N/A BC AGGREGATE 5.19 3.70 0.00 1.00 100.00
MORE RETURNLESS RISK
MORE RETURNMORE RISK
LESS RETURNLESS RISK
LESS RETURNMORE RISK
Sanibel General Employees' Retirement PlanRichmond Cap Fixed Inc
Risk Versus Reward Analysis - 5 Yr.June 30, 2008 Through June 30, 2013
The risk benchmark for this analysis is the BC Aggregate.
34
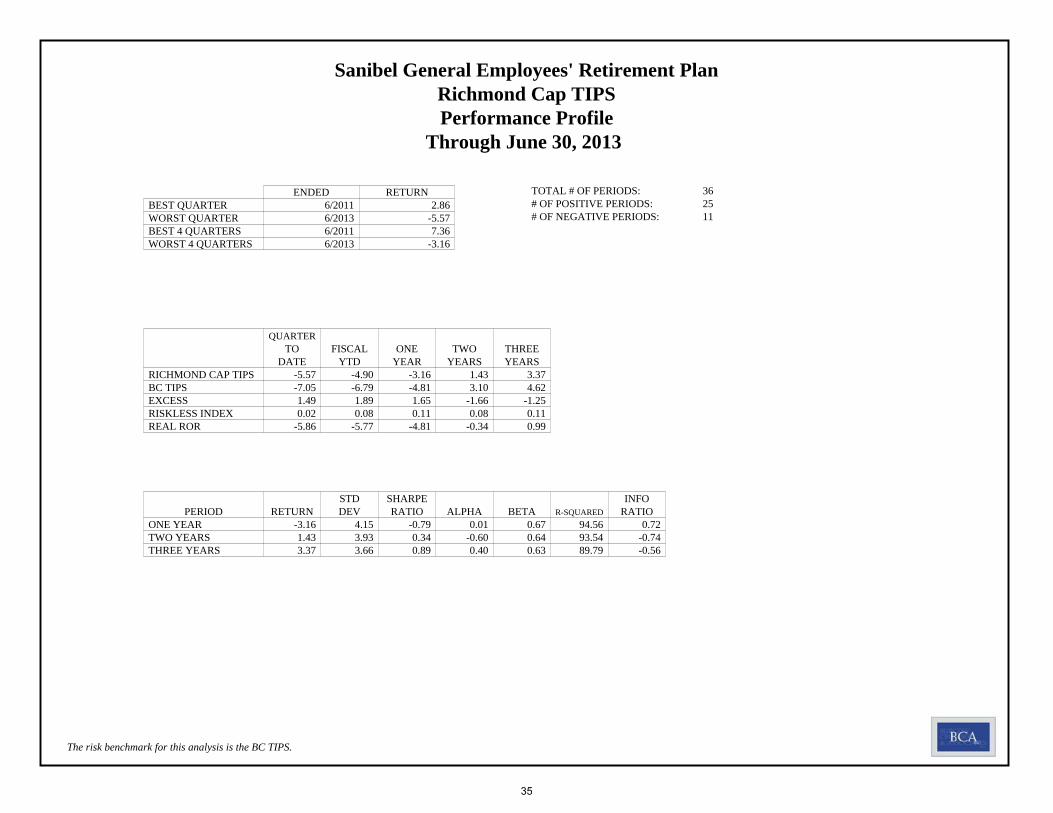
ENDED RETURNBEST QUARTER 6/2011 2.86WORST QUARTER 6/2013 -5.57BEST 4 QUARTERS 6/2011 7.36WORST 4 QUARTERS 6/2013 -3.16
TOTAL # OF PERIODS: 36# OF POSITIVE PERIODS: 25# OF NEGATIVE PERIODS: 11
QUARTERTO FISCAL ONE TWO THREE
DATE YTD YEAR YEARS YEARSRICHMOND CAP TIPS -5.57 -4.90 -3.16 1.43 3.37BC TIPS -7.05 -6.79 -4.81 3.10 4.62EXCESS 1.49 1.89 1.65 -1.66 -1.25RISKLESS INDEX 0.02 0.08 0.11 0.08 0.11REAL ROR -5.86 -5.77 -4.81 -0.34 0.99
STD SHARPE INFOPERIOD RETURN DEV RATIO ALPHA BETA R-SQUARED RATIO
ONE YEAR -3.16 4.15 -0.79 0.01 0.67 94.56 0.72TWO YEARS 1.43 3.93 0.34 -0.60 0.64 93.54 -0.74THREE YEARS 3.37 3.66 0.89 0.40 0.63 89.79 -0.56
Sanibel General Employees' Retirement PlanRichmond Cap TIPSPerformance Profile
Through June 30, 2013
The risk benchmark for this analysis is the BC TIPS.
35
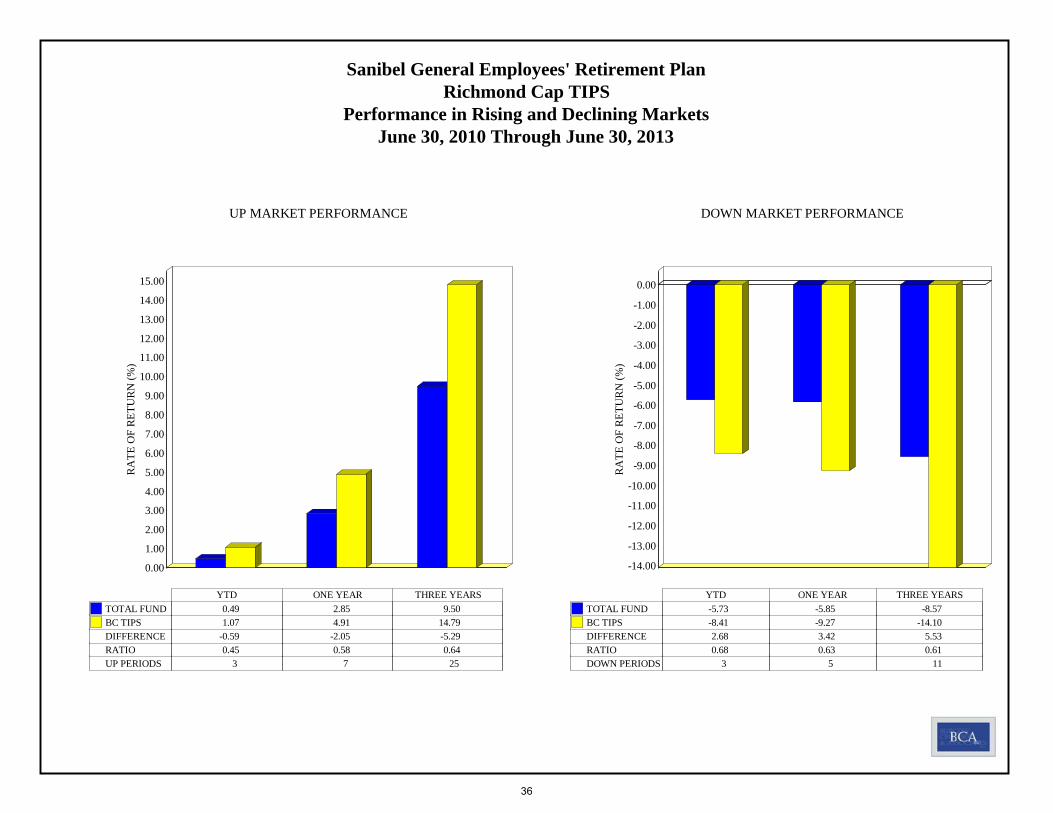
UP MARKET PERFORMANCE
RA
TE O
F R
ETU
RN
(%)
15.00
14.00
13.00
12.00
11.00
10.00
9.00
8.00
7.00
6.00
5.00
4.00
3.00
2.00
1.00
0.00
YTD ONE YEAR THREE YEARS TOTAL FUND 0.49 2.85 9.50 BC TIPS 1.07 4.91 14.79 DIFFERENCE -0.59 -2.05 -5.29 RATIO 0.45 0.58 0.64 UP PERIODS 3 7 25
DOWN MARKET PERFORMANCE
RA
TE O
F R
ETU
RN
(%)
0.00
-1.00
-2.00
-3.00
-4.00
-5.00
-6.00
-7.00
-8.00
-9.00
-10.00
-11.00
-12.00
-13.00
-14.00
YTD ONE YEAR THREE YEARS TOTAL FUND -5.73 -5.85 -8.57 BC TIPS -8.41 -9.27 -14.10 DIFFERENCE 2.68 3.42 5.53 RATIO 0.68 0.63 0.61 DOWN PERIODS 3 5 11
Sanibel General Employees' Retirement PlanRichmond Cap TIPS
Performance in Rising and Declining MarketsJune 30, 2010 Through June 30, 2013
36
VARIABILITY OF RETURNS (RISK)22.0021.0020.0019.0018.0017.0016.0015.0014.0013.0012.0011.0010.009.008.007.006.005.004.003.002.001.000.00-1.00-2.00
AN
NU
ALI
ZED
RA
TE O
F RE
TURN
%
22.00
20.00
18.00
16.00
14.00
12.00
10.00
8.00
6.00
4.00
2.00
0.00
-2.00
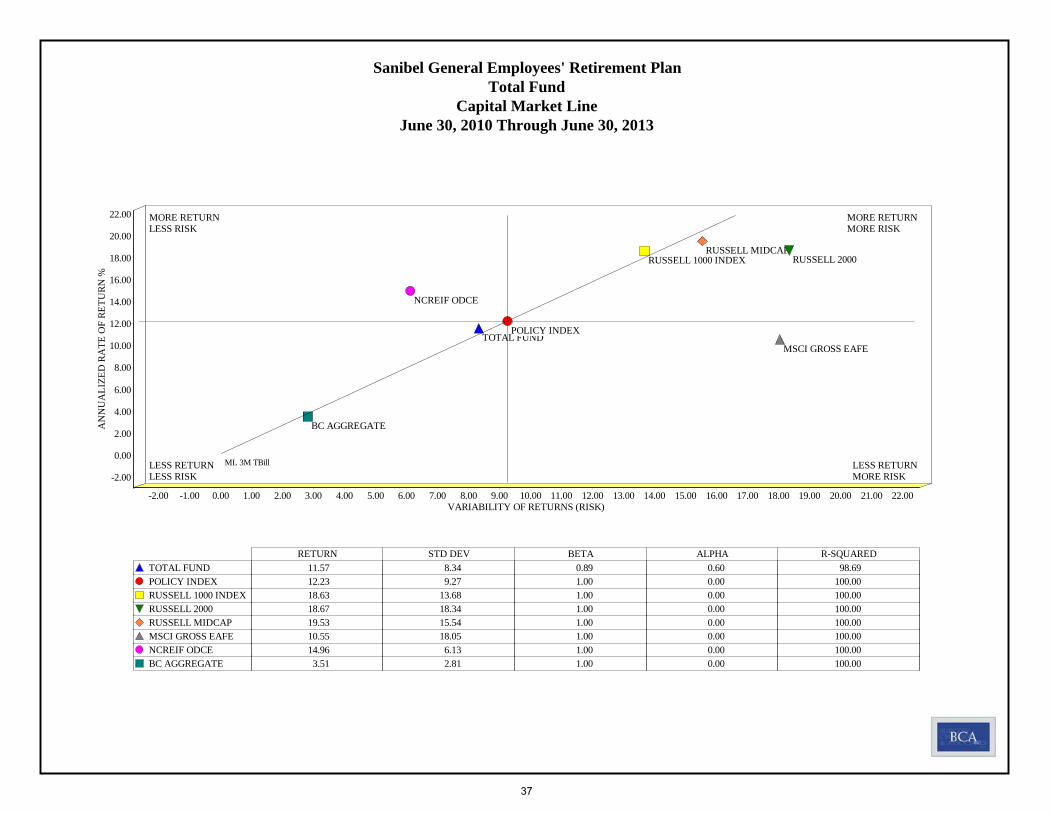
RETURN STD DEV BETA ALPHA R-SQUARED TOTAL FUND 11.57 8.34 0.89 0.60 98.69 POLICY INDEX 12.23 9.27 1.00 0.00 100.00 RUSSELL 1000 INDEX 18.63 13.68 1.00 0.00 100.00 RUSSELL 2000 18.67 18.34 1.00 0.00 100.00 RUSSELL MIDCAP 19.53 15.54 1.00 0.00 100.00 MSCI GROSS EAFE 10.55 18.05 1.00 0.00 100.00 NCREIF ODCE 14.96 6.13 1.00 0.00 100.00 BC AGGREGATE 3.51 2.81 1.00 0.00 100.00
Policy Index
ML 3M TBill
TOTAL FUNDPOLICY INDEX
RUSSELL 1000 INDEX RUSSELL 2000RUSSELL MIDCAP
MSCI GROSS EAFE
NCREIF ODCE
BC AGGREGATE
MORE RETURNLESS RISK
MORE RETURNMORE RISK
LESS RETURNLESS RISK
LESS RETURNMORE RISK
Sanibel General Employees' Retirement PlanTotal Fund
Capital Market LineJune 30, 2010 Through June 30, 2013
37
VARIABILITY OF RETURNS (RISK)29.0028.0027.0026.0025.0024.0023.0022.0021.0020.0019.0018.0017.0016.0015.0014.0013.0012.0011.0010.009.008.007.006.005.004.003.002.001.000.00-1.00-2.00-3.00
AN
NU
ALI
ZED
RA
TE O
F RE
TURN
%
10.00
9.00
8.00
7.00
6.00
5.00
4.00
3.00
2.00
1.00
0.00
-1.00
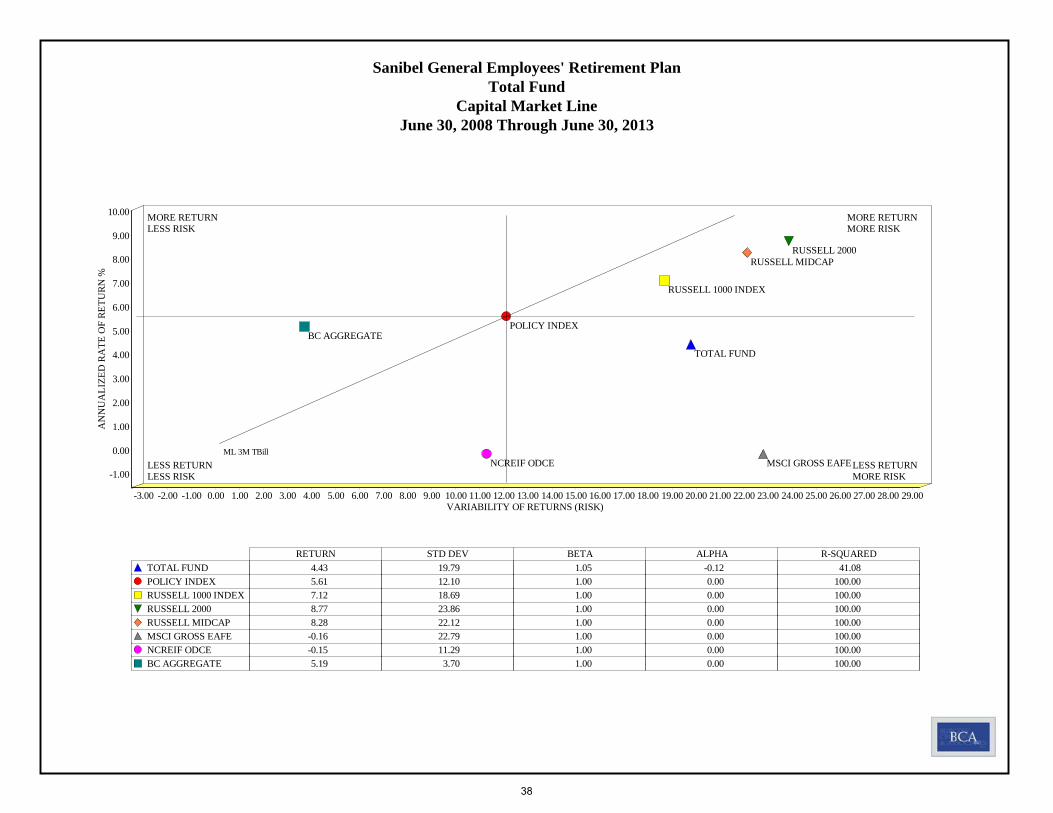
RETURN STD DEV BETA ALPHA R-SQUARED TOTAL FUND 4.43 19.79 1.05 -0.12 41.08 POLICY INDEX 5.61 12.10 1.00 0.00 100.00 RUSSELL 1000 INDEX 7.12 18.69 1.00 0.00 100.00 RUSSELL 2000 8.77 23.86 1.00 0.00 100.00 RUSSELL MIDCAP 8.28 22.12 1.00 0.00 100.00 MSCI GROSS EAFE -0.16 22.79 1.00 0.00 100.00 NCREIF ODCE -0.15 11.29 1.00 0.00 100.00 BC AGGREGATE 5.19 3.70 1.00 0.00 100.00
Policy Index
ML 3M TBill
TOTAL FUND
POLICY INDEX
RUSSELL 1000 INDEX
RUSSELL 2000RUSSELL MIDCAP
MSCI GROSS EAFENCREIF ODCE
BC AGGREGATE
MORE RETURNLESS RISK
MORE RETURNMORE RISK
LESS RETURNLESS RISK
LESS RETURNMORE RISK
Sanibel General Employees' Retirement PlanTotal Fund
Capital Market LineJune 30, 2008 Through June 30, 2013
38
UP MARKET PERFORMANCE
RA
TE O
F R
ETU
RN
(%)
40.0038.0036.0034.0032.0030.0028.0026.0024.0022.0020.0018.0016.0014.0012.0010.00
8.006.004.002.000.00
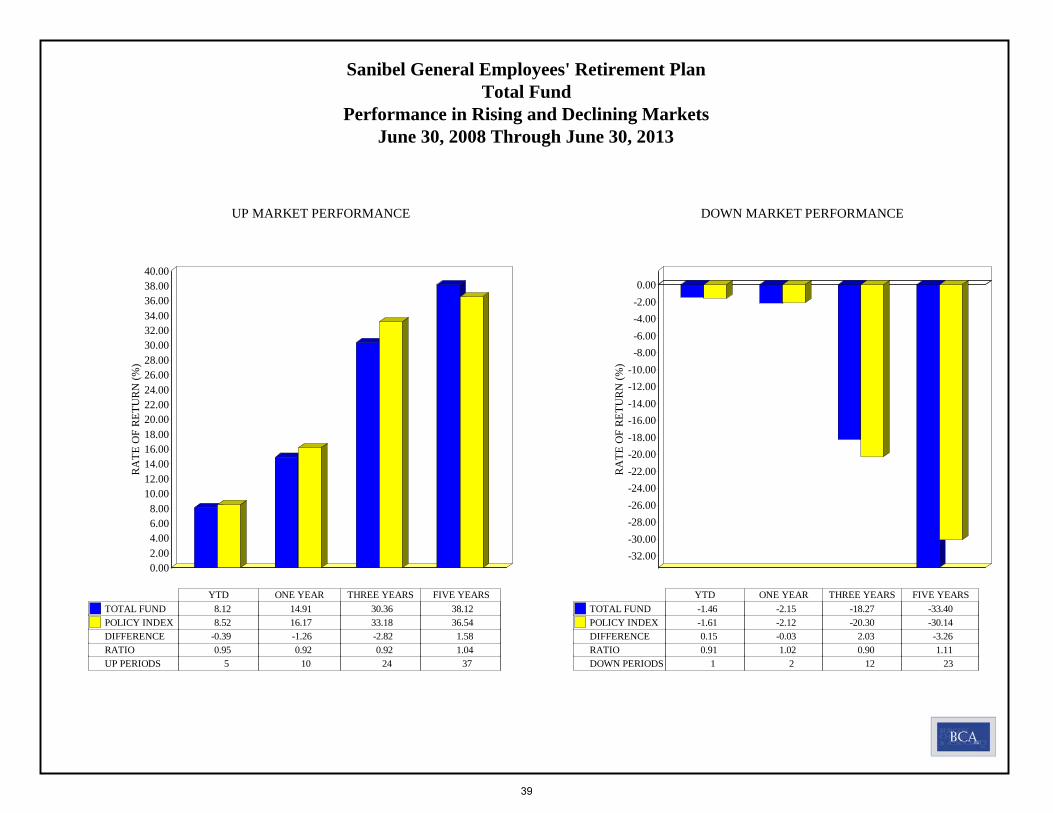
YTD ONE YEAR THREE YEARS FIVE YEARS TOTAL FUND 8.12 14.91 30.36 38.12 POLICY INDEX 8.52 16.17 33.18 36.54 DIFFERENCE -0.39 -1.26 -2.82 1.58 RATIO 0.95 0.92 0.92 1.04 UP PERIODS 5 10 24 37
DOWN MARKET PERFORMANCE
RA
TE O
F R
ETU
RN
(%)
0.00-2.00-4.00-6.00-8.00
-10.00-12.00-14.00-16.00-18.00-20.00-22.00-24.00-26.00-28.00-30.00-32.00
YTD ONE YEAR THREE YEARS FIVE YEARS TOTAL FUND -1.46 -2.15 -18.27 -33.40 POLICY INDEX -1.61 -2.12 -20.30 -30.14 DIFFERENCE 0.15 -0.03 2.03 -3.26 RATIO 0.91 1.02 0.90 1.11 DOWN PERIODS 1 2 12 23
Sanibel General Employees' Retirement PlanTotal Fund
Performance in Rising and Declining MarketsJune 30, 2008 Through June 30, 2013
39
-ACCRUED INTEREST- Bond interest earned since the last interest payment, but not yet received.
-ALPHA- A linear regressive constant that measures expected return independent of Beta.
-ASSET ALLOCATION- The division of portfolio asset classes in order to achieve an expected investment objective.
-BALANCED UNIVERSES - BNY Mellon Public Funds, Endowments & Foundations, Corporate peer groups, and PSN peer groups.
-BETA- A measure of portfolio sensitivity (volatility) in relation to the market, based upon past experience.
-BOND DURATION- A measure of portfolio sensitivity to interest rate risk.
-COMMINGLED FUND- An investment fund which is similar to a mutual fund in that investors are permitted to purchase and redeem units that representownership in a pool of securities.
-CONVERTIBLE BONDS - Hybrid securities' that offer equity returns during rising equity markets and improved down-market protection.
-CORE- An equal weighting in both growth and value stocks.
-CORRELATION COEFFICIENT- A measure of how two assets move together. The measure is bounded by +1 and -1; +1 means that the two assets movetogether positively, while a measure of -1 means that the assets are perfectly negatively correlated.
-GROWTH MANAGER- Generally invests in companies that have either experienced above-average growth rates and/or are expected to experienceabove-average growth rates in the future. Growth portfolios tend to have high price/earnings ratios and generally pay little to no dividends.
-INDEXES- Indexes are used as "independent representations of markets" (e.g., S&P 500).
-INFORMATION RATIO- Annualized excess return above the benchmark relative to the annualized tracking error.
-LARGE CAP- Generally, the term refers to a company that has a market capitalization that exceeds $10 billion.
-MANAGER UNIVERSE- A collection of quarterly investment returns from various investment management firms that may be subdivided by style (e.g. growth,value, core).
-MID CAP- Generally, the term refers to a company that has a market capitalization between $2 and $10 billion.
-NCREIF - A quarterly time series composite total rate of return measure of investment performance of a large pool of individual commercial real estateproperties acquired in the private market for investment purposes only.
-NCREIF ODCE - Open End Diversified Core Equity index which consists of historical and current returns from 26 open-end commingled funds pursuing corestategy. This index is capitalization weighted, time weighted and gross of fees.
Sanibel General Employees' Retirement PlanGlossary of Terms
40
-NET- Investment return accounts only for manager fees. -PROTECTING FLORIDA INVESTMENT ACT (PFIA) - SBA publishes a list of prohibited investments (scruntinized companies).
-RATE OF RETURN- The percentage change in the value of an investment in a portfolio over a specified time period, excluding contributions.
-RISK MEASURES- Measures of the investment risk level, including beta, credit, duration, standard deviation, and others that are based on current andhistorical data.
-R-SQUARED- Measures how closely portfolio returns and those of the market are correlated, or how much variation in the portfolio returns may be explainedby the market. An R2 of 40 means that 40% of the variation in a fund’s price changes could be attributed to changes in the market index over the time period.
-SHARPE RATIO- The ratio of the rate of return earned above the risk-free rate to the standard deviation of the portfolio. It measures the number of units ofreturn per unit of risk.
-SMALL CAP- Generally refers to a company with a market capitilation $300 million to $2 billion.
-STANDARD DEVIATION- Measure of the variability (dispersion) of historical returns around the mean. It measures how much exposure to volatility wasexperienced by the implementation of an investment strategy.
-SYSTEMATIC RISK- Measured by beta, it is the risk that cannot be diversified away (market risk).
- TIME WEIGHTED (TW) RETURN - A measure of the investments versus the investor. When there are no flows the TW & DOLLAR weighted (DW) returnsare the same and vice versa.
-TRACKING ERROR- A measure of how closely a manager’s performance tracks an index; it is the annualized standard deviation of the differences between thequarterly returns for the manager and the benchmark.
-TREYNOR RATIO- A measure of reward per unit of risk. (excess return divided by beta)
-UP AND DOWN-MARKET CAPTURE RATIO- Ratio that illustrates how a manager performed relative to the market during rising and declining marketperiods.
-VALUE MANAGER- Generally invests in companies that have low price-to-earnings and price-to-book ratios and/or above-average dividend yields.
Sanibel General Employees' Retirement PlanGlossary of Terms
41
Advisory services are offered through or by Burgess Chambers and Associates, Inc., a registered SEC investment advisor.Performance Reporting:1.Changes in portfolio valuations due to capital gains or losses, dividends, interest, income and management fees are included in thecalculation of returns. All calculations are made in accordance with generally accepted industry standards.2.Transaction costs, such as commissions, are included in the purchase cost or deducted from the proceeds or sale of a security.Differences in transaction costs may affect comparisons.3.Individual client returns may vary due to a variety of factors, including differences in investment objectives, asset allocating andtiming of investment decisions.4.BCA does not have discretion or decision making authority over any investments. All decisions regarding investment managerselection and retention, asset allocation, and other investment policies were made by the client. While BCA providesrecommendations and choices regarding suitable investments, not all clients take these recommendations or select from the choicesoffered.5.Performance reports are generated from information supplied by the client, custodian, and/or investment managers. BCA relies uponthe accuracy of this data when preparing reports.6.The market indexes do not include transaction costs, and an investment in a product similar to the index would have lowerperformance dependent upon costs, fees, dividend reinvestments, and timing. Benchmarks and indexes are for comparison purposesonly, and there is no assurance or guarantee that such performance will be achieved.7.Performance information prepared by third party sources may differ from that shown by BCA. These differences may be due todifferent methods of analysis, different time periods being evaluated, different pricing sources for securities, treatment of accruedincome, treatment of cash, and different accounting procedures.8.Certain valuations, such as alternative assets, ETF, and mutual funds, are prepared based on information from third party sources,the accuracy of such information cannot be guaranteed by BCA. Such data may include estimates and maybe subject to revision.9.BCA has not reviewed the risks of individual security holdings. The firm's ADV, Part II, is available upon request.10.BCA investment reports are not indicative of future results.
Sanibel General Employees' Retirement PlanDisclosure
42