Embed Size (px)
Citation preview

Sanitation for allan assessment of Sanitation Services
muzaffarpur, Bihar


Sanitation for allan assessment of Sanitation Services
muzaffarpur, Bihar

© 2018 PRIA
We gratefully acknowledge Saroj Sahu for the photographs used in this report.
This report is published under a Creative Commons License, Attribution – Non-commercial – Share Alike. See www.creativecommons.org/licenses.
The text may be reproduced for non-commercial purposes, provided credit is given to PRIA.
To obtain permission for uses beyond those outlined in the Creative Commons license, please contact PRIA Library at [email protected]
Design by Macro Graphics Pvt. Ltd. | www.macrographics.com

: Preface iii
Preface
Urbanisation is rapidly increasing in India. According to Census figures, in 1991, 220 million people or about one-quarter of the population lived in Indian cities. By 2011, this number increased to 377 million or one-third of the country’s population. The urban population is projected to grow to about 600 million (40 per cent) by 2031 and 850 million (50 per cent) by 2051. While it is very difficult to get authentic, consistent and valid data on the extent of urban poverty in India, it is estimated that in 2014-15 approximately 140 million (nearly 35 per cent) of the urban population were considered to be poor. In 2012, an estimated 33,510 slums existed in urban India with approximately 8.8 million households.
Rapid urbanisation has led to a strain on civic services, in particular sanitation services. The abysmal lack of sanitation services is omnipresent in Indian cities and poses an extraordinary threat to the health and hygiene of the urban population, particularly the poor who live in informal settlements within cities. Census 2011 shows that close to 8 million, or 12 per cent, urban households do not have access to toilets and defecate in the open. Another 8 per cent use public and shared toiled facilities which are unclean and unhygienic. At the all-India level, 31 per cent of slums had no access to any kind of latrine, 71 per cent had no access to underground sewerage system, 31 per cent slums had no drainage system, 27 per cent had no arrangement for garbage disposal and 46 per cent slums faced water logging (due to rainfall) of either the slum, or the approach road to the slum. Open defecation in urban settings with higher population densities and untreated sewerage is one of the biggest sources of water resource pollution in India. Lack of safe spaces poses further challenges, as it affords little dignity and grave security risks for women.
In order to reverse this situation, the Ministry of Urban Development (MoUD), Government of India introduced the National Urban Sanitation Policy (NUSP) in 2008. It was the first policy specifically addressing urban sanitation and recommended preparation of city sanitation plans on the lines of the national policy. In 2014, the Government of India launched one of its most ambitious programmes, Swachh Bharat Mission (SBM). SBM (Urban) targets all 4,041 Statutory Towns (STs). It aims to eliminate Open Defecation (OD), eradicate manual scavenging, and ensure modern and scientific municipal solid waste management.
In 2016, the MoUD launched Swachh Survekshan in which 73 cities were ranked. In 2017 the Swachh Suvekshan was expanded to 500 cities in which 434 participated. While this effort provided gradation across various metrics related to sanitation services, it provided very little usable data and analysis to city authorities which would help them to plan for service improvements.

Sanitation for All: An Assessment of Sanitation Services in Muzaffarpur, Bihariv
The study, “Sanitation for All: An Assessment of Sanitation Services in Muzaffarpur, Bihar” was undertaken by Participatory Research in Asia (PRIA) under the project “Engaged Citizens, Responsive City”. The project is supported by the European Union and is implemented in three Indian cities – Ajmer in Rajasthan, Jhansi in Uttar Pradesh, and Muzaffarpur in Bihar. The project aims to strengthen participation of the urban poor in city-wide planning and monitoring of urban sanitation services. One of the bottlenecks in city-wide planning of urban sanitation services is lack of authentic data. Municipalities often do not have the necessary capacities to generate updated data for realistic planning. This study is expected to fill this data gap in city-wide planning, with particular focus on the informal settlements of a city.
Dr. Kaustuv Kanti Bandyopadhyay Director
Participatory Research in Asia


: Acknowledgements vii
acKnowleDgements
Rapid urbanisation has led to a severe strain on civic services and providers of these services, mainly municipalities or Urban Local Bodies (ULBs). It is estimated that by 2051, more than half of India’s population will be living in cities, which will make the job of municipalities an even harder task.
The approach of ‘development through people’s participation’ is not widely utilised by municipalities in India. The absence of any institutional obligation to involve citizens in planning, implementation and monitoring of development programmes leads to lack of ownership among people towards their cities and the areas they live in.
The Society for Participatory Research in Asia (PRIA) uses citizen centric approaches to address this situation through the ‘Engaged Citizens, Responsive City’ (ECRC) project supported by the European Union. PRIA’s focus on people’s participation is pivotal given the prevailing situation in India’s cities.
Data is a critical requirement to effectively seek interventions from municipalities, but is usually inadequately available at the granular level. Data sources like the Census of India are difficult to utilise for planning because collection is decennial, and information at the level of the ward, colony, and slum is not always provided. Such limitations deter citizen participation as lack of access to data prevents understanding or monitoring real situations at local, state and national level. For cities to develop, a critical requirement is that of close coordination between the poor, the middle class, municipality and other State stakeholders. PRIA believes that one of the first steps towards participatory planning and decision-making is to empower communities with critical data.
To meet this goal, PRIA designed a mobile based survey and systematically sampled 50 households from each of the 49 wards in Muzaffarpur. A mix of colonies and slums were selected to ensure proportionate representations.
The current study was undertaken by PRIA in Muzaffarpur. We acknowledge the support of our field team in Muzaffarpur consisting of Anjaney Kumar, Rashmi Ranjan, Vikas Singh as well as Tripurari, Satyanshu, Jahanvi. We are grateful to our dedicated data collection team which includes Rakesh, Kamaljeet, Ajay, Sourav, Rubina, Anuradha, Jane Alam, Madhu, Sudha, Shabana, Nasreen and Irfan This process was supervised by Tripurari, Satyanshu and Jahanvi. Nikhil Desai, as the technical consultant, has provided valuable technical support to mobile based survey and handling of data. We
Sanitation for All: An Assessment of Sanitation Services in Muzaffarpur, Biharviii
sincerely acknowledge his contribution. The team at Dimagi enabled us to effectively manage our data and provided useful support. Kaustuv Kanti Bandyopadhyay, Director, PRIA provided the direction, and leadership for which we are sincerely grateful. Sumitra and Seetha have helped edit this report and make sure that it is free of errors. Shri Sanjay Dubey, Commissioner, Muzaffarpur Municipal Corporation (MMC) has kindly granted us his time. We acknowledge the support of then city manager Shri Ravish Chandra Verma.
Lastly, this report would not have been possible without the direction provided by Dr. Rajesh Tandon, President, PRIA. We sincerely acknowledge his contribution.
nilanjana Bhattacharjee Programme Officer, PRIA
anjaney Kumar Senior Programme Officer, PRIA
Dr. anshuman Karol Senior Programme Manager, PRIA

ix Contents
contents
Preface iiiMessage from the Commissioner vAcknowledgements viiList of Acronyms xiiHighlights of The Findings xiii
Section 1: Introduction 1City profile 1Slum profile of the city 1The sanitation survey 2
Section 2: Methodology 5Objectives 5Designing the questionnaire 5Selecting and orienting the survey team 5Sampling process 7Survey monitoring 7
Section 3: Survey Findings 9Demographic and Socio-Economic Background 9
Respondents 9
House ownership 9
Years of stay 10
Land ownership 10
Religion and caste 11
Ration card and income 11
Solid Waste Management 12Segregation of waste 12
Collection of waste 13
Payments for waste collection 14
Amount Paid for waste collection 14
Road sweeping services 14
Payments for road sweeping 15
Complaints about waste collection, street and road sweeping 16
Mode of complaint about waste disposal 17
Resolution of complaints about waste disposal 17

Sanitation for All: An Assessment of Sanitation Services in Muzaffarpur, Biharx
Toilet Facilities 17Type of toilets 18
Source of funds for individual or shared toilets 18
Inlet of water 20
Knowledge on pit cleaning 20
Open Defecation and Desire for Toilets 22Water Outlets and Drainage 23
Water outlets 24
Drainage 25Construction, maintenance and payments 25
Water Supply 27Bathing Facilities 31
Type of bathing facility 31
Structure of the facility 32
Section 4 – Conclusion, Recommendations and Way Forward 35Demographic and Socio-Economic aspects 35Solid waste management 35Provision of toilets 36Faecal sludge and septage management 36Waste water management 36Water supply 37Redressal of grievances 37
References 39
Annex 1 41Designing the mobile application 41Procuring handsets and sim cards 42Training programme 42
Annex 2 44Sample plan for ward 45 (Muzaffarpur) 44
List of ChartsChart 1: Ownership of house 9Chart 2: Type of house 10Chart 3: Availability of land patta 10Chart 4: Religion of the households 11Chart 5: Type of ration card 11Chart 6: Type of waste generated in household 12Chart 7: Segregation of various wastes into separate dustbins 13Chart 8: Availability of household waste collection facility 13Chart 9: Frequency of door to door waste collection service 14Chart 10: Disposal of waste, if household collection is unavailable 15Chart 11: Distance of dustbin / waste collection / dumping site from household 15

: Contents xi
Chart 12: Frequency of sweeping 16Chart 13: Toilet facility available to household 18Chart 14: Type of toilet (applicable for individual/shared toilet) 19Chart 15: Age of personal or shared toilet 19Chart 16: Source / inlet of water for individual or shared toilet 20Chart 17: Last instance of pit / septic tank cleaning 21Chart 18: Provider of service for pit/septic tank cleaning 21Chart 19: Amount spent on cleaning of pit/septic tank 22Chart 20: Application given to municipality for toilet construction 22Chart 21: Acceptance of application by municipality 23Chart 22: Water outlet in household 23Chart 23: Type of water outlet 23Chart 24: Outlet for waste water from kitchen 24Chart 25: Outlet for waste water from bathroom 24Chart 26: Who constructed drainage system 25Chart 27: Who maintains drainage system 26Chart 28: Cost incurred by households on maintenance of water outlets and drainage systems 27Chart 29: Primary sources for drinking water 28Chart 30: Primary sources of water for other purposes 29Chart 31: Number of days of water supply received in a week 30Chart 32: Duration for which water is made available in a day 30Chart 33: Reasons for not using water provided by government sources/phed 31Chart 34: Type of bathing facility available 32Chart 35: Structure of bathing facility in household 32Chart 36: Primary source of water for bathing 33
List of Tables and FiguresTable 1: Type of complaints made about waste collection, street and road sweeping 16Table 2: Mode of complaints made about waste collection, street and road sweeping 17 Table 3: Source of funds for individual or shared toilet 20 Table 4: Method of cleaning 21 Table 5: Type of complaints raised about water outlets and drainage systems 26 Table 6: Whether complaint about water outlet and drainage system was attended to 27 Table 7: Usage of water for various household activities 31
Figure 1: Various sections in the survey questionnaire 6Figure 2: Survey implementation and monitoring 8

Sanitation for All: An Assessment of Sanitation Services in Muzaffarpur, Biharxii
list of acronymsAMRUT Atal Mission for Rejuvenation and Urban Transformation
APL Above Poverty Line
BPL Below Poverty Line
CSE Centre for Science and Environment
CPHEEO Central Public Health and Environmental Engineering Organisation
DUDA District Urban Development Authority
ECRC Engaged Citizens Responsive City
EU European Union
EWC Economically Weaker Sections
GoI Government of India
HRIDAY Heritage City Development and Augmentation Yojana
IHSDP Integrated Housing and Slum Development Programme
ITC Ltd. Imperial Tobacco Company Limited
km Kilometre
sq. km Square Kilometre
MMC Muzaffarpur Municipal Corporation
MoUD Ministry of Urban Development
NGO Non-Government Organisation
NOCs No Objection Certificates
OBC Other Backward Classes
ODF Open Defecation Free
PHED Public Health Engineering Department
PRIA Society for Participatory Research in Asia
PMAY Pradhan Mantri Awas Yojana, Urban
RAY Rajiv Awas Yojana
Rs. Rupees
SBM Swachh Bharat Mission
SBM-U Swachh Bharat Mission-Urban
SWM Solid Waste Management
SC Scheduled Caste
ST Scheduled Tribe
SIC Settlement Improvement Committee
SLB Service Level Benchmark
ST Scheduled Tribe
ULB Urban Local Bodies

1. According to Census 2011.2. The word ‘Households’ has been abbreviated and written as HHs. Representation is at the level of colony, slum, and city – which is a
combination of colonies and slums.
city Profile1
Population 3,54,462HHs 65,870slum HHs 11,715wards 49
samPle2
total HHs 2,725
colony HHs 2,170 (80%)
slum HHs 555 (20%)
female respondents 35%
religion 81% 19%
Duration of survey March – June, 2018
city coverage 49 wards, with a minimum sample of
50 HHs from each ward
Hindu Muslim
key Findings xiii
Key finDings
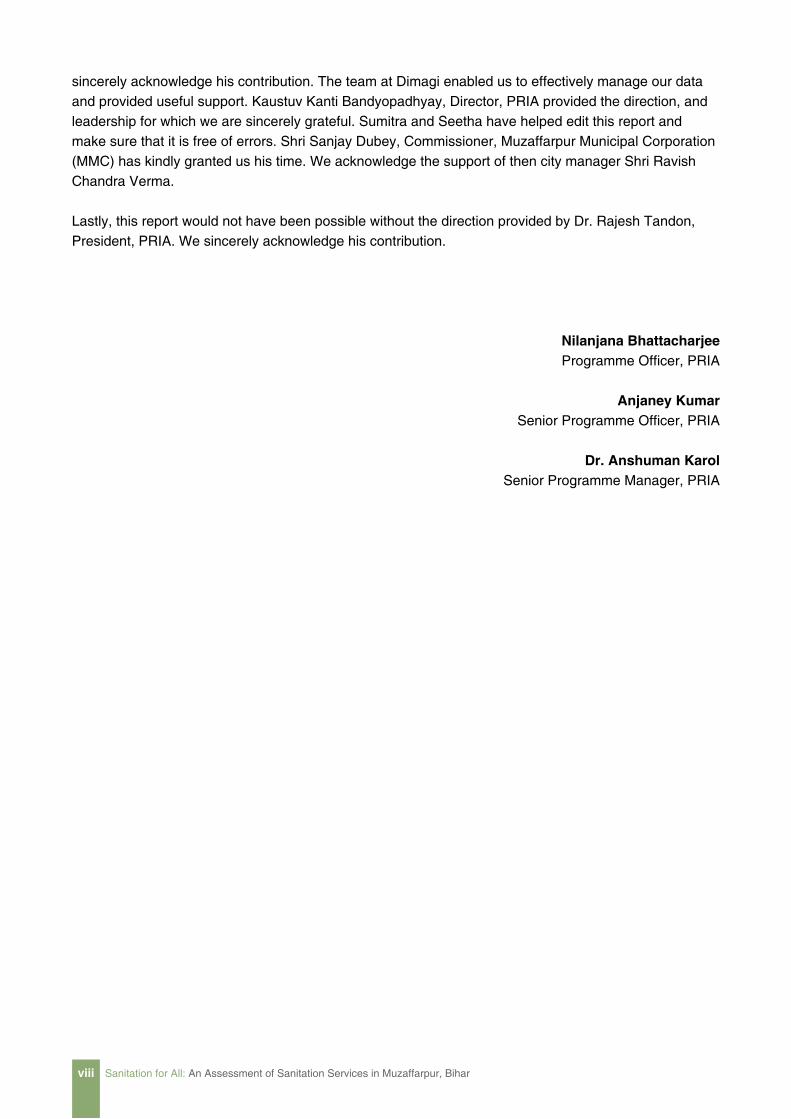
toilet facilitiesaccess to iHHl
Colonies 99% Slums 89%
reasons for lack of iHHl
Insufficient funds 70% Lack of awareness about procedure 29% Insufficient space 18% Insufficient water 25%
HHs where septic tank has never been cleaned
Colony 59% Slum 61%
city HHs with toilet outlets connected to nallahs outside house 2%
acceptance rate of applications received from city HHs by municipality 9%
city HHs where cleaning was carried out using manual methods 10%
open defecation in slum HHs 11%
socio-economic BacKgroUnDHH ownership
Owned 88% Rented 11%
xiv
city HHs with toilet outlets connected to septic tank 90%
Sanitation for All: An Assessment of Sanitation Services in Muzaffarpur, Bihar
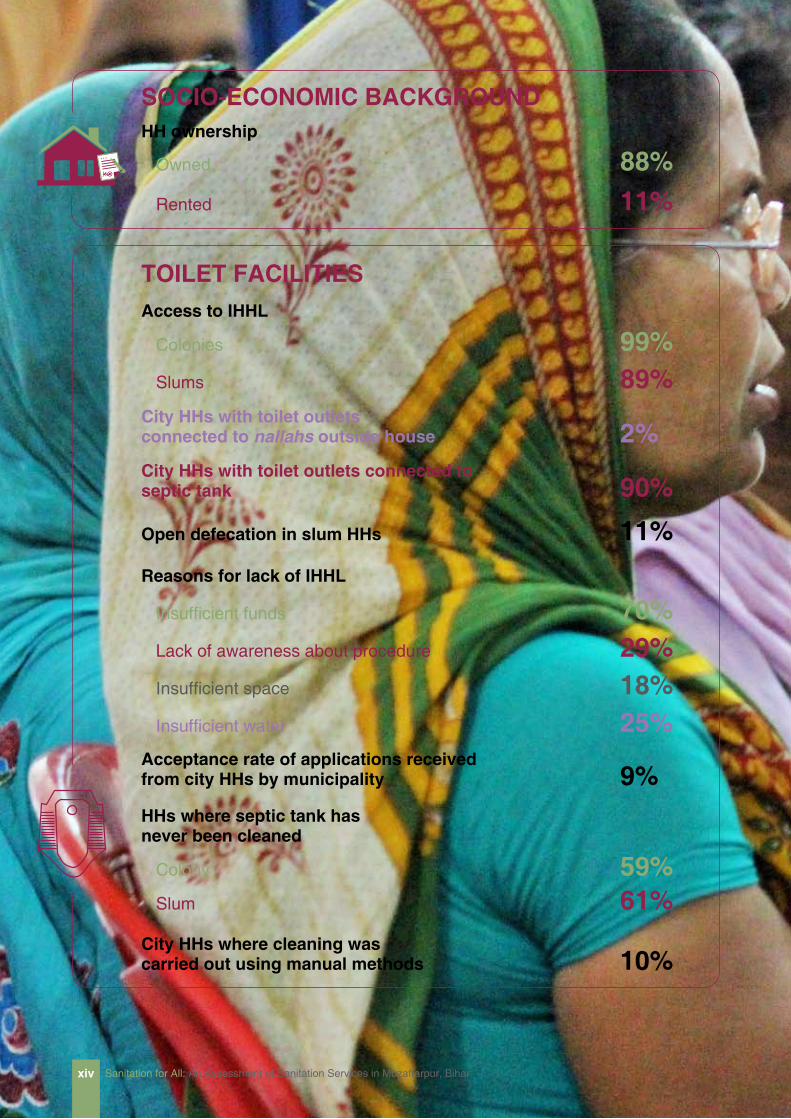
muzaffarpur municipal corporation (mmc), Bihar is implementing a decentralized solid waste management programme “swachhta swasthya samridhi’’ since December 2016
Drainagewaste water from kitchen and bathrooms flowing into open areas outside city HHs
maintenance of drainage connections in city HHs by municipality
16% and 15% respectively
97%
water sUPPlycity households accessing government household piped connections 27%
satisfaction with availability
Colony 54% Slum 38%
top three uses of water in city HHs Washing clothes 90% Bathing purposes 92% Washing utensils 62%
availability of supply to city HHs 7 days
2-4 hours per day
BatHing facilitiesavailability in HHs
Colony 98% Slum 85%
soliD waste management
type of waste generated in city HHs Hazardous 82% Sanitary 92%
waste segregation at source done by 36% of city populationDoor to door waste collection in HHs Colony 79% Slum 65%
city HHs making payments for waste collection no payment
key Findings xv
3. While the full sample of 2,725 was asked questions pertaining to SWM complaint redressal, only 2,180 HHs were asked questions about complaints regarding drainage and water outlets. 2,180 is the number of HHs whose maintenance is managed by State agencies including the municipality.
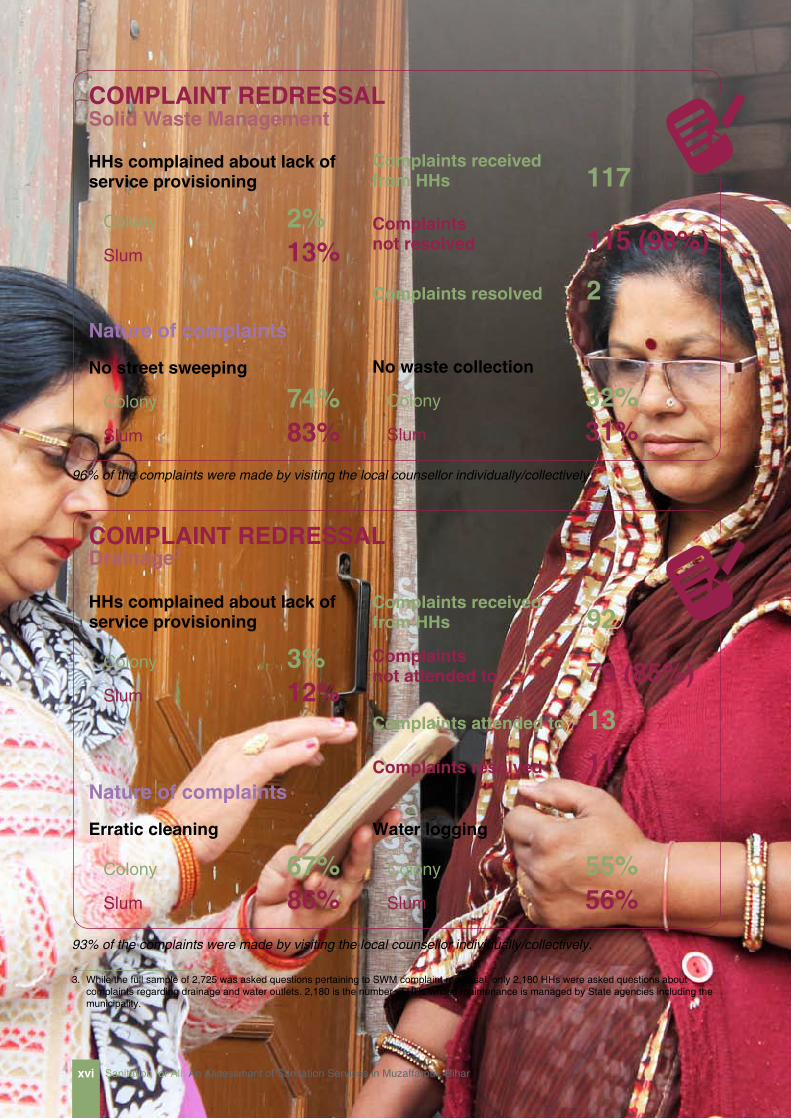
comPlaint reDressal
HHs complained about lack of service provisioning
Colony 2% Slum 13%
no street sweeping
Colony 74% Slum 83%
no waste collection
Colony 32% Slum 31%
solid waste management
nature of complaints
complaints received from HHs 117complaints not resolved 115 (98%)
complaints resolved 2
96% of the complaints were made by visiting the local counsellor individually/collectively.
comPlaint reDressal
HHs complained about lack of service provisioning
Colony 3% Slum 12%
erratic cleaning
Colony 67% Slum 86%
water logging
Colony 55% Slum 56%
Drainage3
nature of complaints
complaints received from HHs 92complaints not attended to 79 (85%)
complaints attended to 13
complaints resolved 11
93% of the complaints were made by visiting the local counsellor individually/collectively.
xvi Sanitation for All: An Assessment of Sanitation Services in Muzaffarpur, Bihar

Section 1: Introduction 1
introDUctionSection 1
City Profile
Muzaffarpur is the administrative headquarters of Muzaffarpur District and is located in the north-central part of Bihar, about 70 kms north of the state capital Patna. This district is famous for its production of ‘Shahi Litchi’ and is equally popular for its ‘Laah Bangles’. The city is also the trade hub of North Bihar and is one of the many gateways to Nepal. The renowned temple of Lord Shiva called Baba Garibnath Mandir is situated at Chata Bazar.
Muzaffarpur’s municipal boundary covers 26.43 sq. kms and comprises 49 wards. The population in 2011 as per District Census Handbook of Muzaffarpur District (Censusindia.gov.in, 2018) is 3,54,462; of which males and females are 1,87,564 and 1,66,898 respectively. The total number of households in Muzaffarpur is 65,870 (Census, 2011) and the average household size is about 5.
There are 105 notified slums in Muzaffarpur with a total population of 50,967, which is 14% of the city population. As per the Census 2011, the number of households in these slums are 9,256 (Census 2011.co.in, 2018).
The average density of the city is 13,312 persons per square kilometre. There are some high-density areas in the inner-city areas that include Saraiyaaganj, Kalyani, Juran chapra, Railway station road, Motijheel. Increasing population has led to development in the outer areas of the city. The newer areas of the city include Bhagwanpur, Bela, Bairiya and Ramdayalau.
The sex ratio of Muzaffarpur city is 890 per 1000 males. Child sex ratio of girls is 902 per 1000 boys. Total literates in Muzaffarpur city are 2,57,663 of which 1,41,980 are males while 1,15,683 are females. Average literacy rate of Muzaffarpur city is 83.07% of which male and female literacy was 86.42 and 79.29% (ibid).
Slum Profile of the City
Bihar State Slum Policy, 2011, defines a slum as “a compact settlement of at least 20 households
with a collection of poorly built tenements, mostly
of temporary nature, crowded together usually with
inadequate sanitary and drinking water facilities in
unhygienic conditions”.
Muzaffarpur city has more than 130 slums, which are mostly located within the city centre and some of which are more than thirty years old. The settlers are engaged in construction and other daily wage work. With more than 14% population living in slums, urban housing deficit is a huge

Sanitation for All: An Assessment of Sanitation Services in Muzaffarpur, Bihar2
problem in town. Seventy percent slums are situated on private land and others on government land. Slum upgradation is planned under the
Integrated Housing and Slum Development Programme (IHSDP) and Pradhan Mantri Awas Yojana, Urban (PMAY) under the Ministry of Housing and Urban Affairs.
The Sanitation Survey
The current survey on prevailing sanitation facilities in Muzaffarpur city was undertaken by the Society for Participatory Research in Asia (PRIA), New Delhi under the European Union (EU)- supported project “Engaged Citizens, Responsive City” (ECRC). This activity was carried out between March and June, 2018.
The objective of the ECRC project is to enhance capacities of the urban poor to enable and increase their participation in planning and monitoring of sanitation services in three Indian cities – Ajmer in Rajasthan, Jhansi in Uttar Pradesh, and Muzaffarpur in Bihar. The capacities of the urban poor to engage with municipalities for enforcing accountability and ensuring their participation in city planning are significantly affected by two major constraints: (i) lack of information and (ii) access to organisation. The fragmentation of civil societies of the urban poor across caste, gender, age, and political affiliations severely affect their ability to demand quality services from the institutions of governance.
Rapid and unplanned urbanisation has led to a severe strain on civic services. Municipalities are often unable to cope with the increasing population, which is expected to further increase in the future.
In the absence of appropriate capacities, resources, and any institutional obligation, municipalities often do not engage citizens in planning, implementation and monitoring of development programmes. This often leads to lack of ownership by the citizens towards their cities and the areas they live in. Further, citizens, particularly the urban poor, lack basic knowledge
which would allow them to better understand entitlements at the individual, household, and community levels. This is witnessed most starkly in the state of sanitation services in Indian cities.City-wide improvement of sanitation services preparing a solid plan based on authentic data. Lack of reliable data is a perpetual problem for preparing appropriate plans by municipalities in India.
The ECRC project makes conscious efforts to strengthen citizen participation in development planning and monitoring of cities. The project uses sanitation services as an entry point to build organisational capacities of the urban poor in informal settlements. The residents in informal settlements are encouraged to form Settlement Improvement Committees (SICs) with leadership from youth and women. The project engages multiple stakeholders including the Resident Welfare Associations (RWAs) in colonies, market committees, professional associations, media and academia to collectively explore solutions to problems of urban sanitations services. It aims at creating a common forum for engagement among various stakeholders, especially between Urban Local Bodies (ULBs) and the residents.
As mentioned earlier, reliable data is a critical requirement in effectively seeking interventions from municipalities. However, such data is usually scarce, especially for informal settlements.
In addition to a comprehensive household listing and participatory enumeration of informal settlements, the ECRC project undertook a sample survey covering all the wards in Muzaffarpur. This has allowed for a holistic understanding of the

Section 1: Introduction 3
city. Through this survey, deficiencies in sanitation services have been highlighted, solutions to which can stem from a coordinated effort between municipalities and residents. The dissemination of findings of the survey could help establish a platform for residents of the ward to congregate and pursue a common interest that furthers that of the city as well.
The survey initiative is also in line with the objectives of the Swachh Bharat Mission-Urban
(SBM-U) and acts as an assessment of the ground realities in Muzaffarpur city. It can provide critical feedback and play an essential role in monitoring and evaluation of government schemes as well as implementation of plans.
PRIA has previously been involved with the Water and Sanitation Program of the World Bank, which was commissioned for this purpose. Lessons from that project have found their way into the current survey as well.

Section 2: Methodology 5
metHoDologySection 2
Objectives
The objective of the survey was to assess the status of sanitation services in Muzaffarpur city, with specific focus on toilets (individual, shared and community), sewerage and waste water management, bathing facilities, and solid waste management. This information is available at the level of the city, ward, and settlement, including colonies and slums. Since water supply is an integral part of the overall sanitation situation in a
city, the survey included the key sources of water supply for drinking and other purposes. Provisions for street sweeping and complaint redressal were covered as well. The findings of the survey generated reliable data and provided critical analysis to the Muzaffarpur Municipal Corporation (MMC). It is envisaged that such data and analysis would provide a sound basis for ongoing and future sanitation planning in Muzaffarpur city.
in the city, it has also captured basic information about households, which is often important for correlation analysis.
Designing the Questionnaire
The survey used a structured questionnaire divided into the sections presented in Figure 1. While the thrust of the questionnaire was to gauge the level of sanitation facilities
Selecting and Orienting the Survey Team
Twenty-four participants were shortlisted from various informal settlements and other forums in which PRIA engages. Many of these participants were well versed with PRIA’s work in the city. They were divided into two categories – enumerators and supervisors – depending on
their skill sets, which were assessed over the course of the workshop that was organised to orient them on survey objectives and methods. Separately, one survey administrator, supported by an animator, assigned from PRIA oversaw the process.

Sanitation for All: An Assessment of Sanitation Services in Muzaffarpur, Bihar6
The training workshop was an intensive four-day long event. It focussed on two major areas: (i) building a strong conceptual understanding of sanitation, drinking water sources, wastewater outlets, street sweeping and solid waste management; (ii) developing conceptual understanding and skills on survey methodology and the corresponding approach to be applied on the field. This was followed by a discussion on how to approach respondents and introduce the organisation, as well as the objectives of the survey. The workshop employed a mix of pedagogies including presentations, interactions,
open discussions, simulations and fieldwork, during which enumerators could utilise the application on smart phones. Surveys were conducted using a mobile-based technology called CommCare, designed by Dimagi. CommCare is an open source mobile data collection platform that allows users to code a questionnaire into the application, which is accessed and filled using android mobile phones. The application can be used offline (in areas where internet is not easily available) and is compatible with various languages, including Hindi. There are many benefits of using a tech-enabled solution which are detailed in Annex 1.
registration form Ward selection• Classification of settlement• Basic details including name of respondent, head of household, address•
Basic household information
Type of house • Ownership and registration of land• Family income • Religion and caste • Distance from basic facilities including primary health centre, anganwadi centre, ration-shop, • and primary and secondary schools
Drainage Availability of drainage facility and its type • Maintenance of drainage facility and associated costs • Grievance redressal mechanism •
solid waste management
Types of solid waste generated and segregation • Mechanisms for waste collection, disposal, and associated costs • Street sweeping facilities • Grievance redressal mechanism•
water related facilities
Availability of water and sources • Utilisation of water in various activities •
Bathing and washing
Type of bathing facility available and its utilisation • Maintenance of bathing facility and associated costs • Grievance redressal mechanism•
toilet and sewerage Type of toilet facility available and its utilisation • Maintenance of toilet facility and associated costs • Grievance redressal mechanism •
conclusion Suggestions on improvement of municipal services • Photo capture • Enumerator comments • GPS coordinates •
figure 1: Various sections in the survey Questionnaire

Section 2: Methodology 7
Sampling Process
The implementation of a large-scale survey requires rigorous monitoring and quality assurance. One of the first steps spelt out in detail to all the team members was the sampling process. A stratified sampling technique was used. A sample of 50 households was selected from each ward, with a buffer of 10 per cent. The buffer allowed discarding of records that contained errors which could not be addressed easily. Sample households would be spread across neighbourhoods such as authorised colonies (including resettlement colonies) and slums (both notified and non-notified). A good sample ensures that the survey is representative and captures data that the survey aims to study. A critical point here was to ensure that the sample ratio of colonies to slums be maintained across the wards. To do this, a list of colonies and slums in each ward was prepared with approximate number of households.
The next crucial step was to calculate the skip interval. This is dependent on the number of
households in a ward, divided by the sample (fixed at 55). For example, if the total number of households in a ward is 1,105, and the required sample is 55, then the skip interval is calculated as 1,105/55, which is equal to 20. A sampling plan is provided in Annex 2. Household selection utilises the right-hand technique, in which the first house is selected randomly. Beginning from a particular corner of the sampling unit, the skip interval is followed by moving right, with every twentieth house in the direction being selected. For example, if one lane was being surveyed, then households on the right would be sampled first. Once the entire right-hand side has been completed, enumerators would start covering households from the end of the left side of the lane, which now lies on their right-hand side. In case a particular house cannot be surveyed, the next house is selected. This process is simple to follow, and allows for a systematic sampling method, irrespective of the topology and spatial spread found in a city.
Survey Monitoring
The survey team comprised of enumerators, field supervisors, survey administrators and a survey manager. The monitoring process was divided into various stages. Each supervisor was allotted a team of enumerators. The supervisor accompanied the team and ensured that the surveys were being done in an orderly manner and that the sample plan was being adhered to. Supervisors were also well versed with the questionnaire and were available to solve any doubts raised by enumerators or respondents.
As stated above, two individuals from PRIA (a survey administrator and one person for support) took responsibility for validating the data on the basis of a monitoring protocol designed based
on common errors and discrepancies. Data was validated for each ward and records, which were inconsistent or incomplete, were flagged for removal or remedy. Data for each ward was then accessed by a survey manager, where logical consistency of answers would be checked. All inconsistencies were reported back to the field and an immediate verification carried out either by revisiting the respondent’s home or by calling them. This task was carried out by supervisors and enumerators. Any suggested changes were made by the enumerator on the mobile. To do this, survey administrators would grant access to the particular record so that it could be edited. A diagrammatic representation of this process is available in Figure 2.

Sanitation for All: An Assessment of Sanitation Services in Muzaffarpur, Bihar8
The next step after implementation and monitoring was interpretation of survey findings. The ECRC analytical framework has been designed in Microsoft Excel and has been used to analyse the survey findings and the inferences outlined in this report.
After multiple rounds of verification, 2,725 household surveys, spread across 49 wards were included in the analysis, out of which 79.6 per cent (2,170) households belonged to colonies, while 20.3 per cent (555) belonged to slums. Of the latter, 97 per cent (541) of households lived in notified slums while 3 per cent (14 households) lived in non-notified slums.
Follow up verification at the level of survey manager
Identified errors reported to supervisor
Supervisor and enumerator conduct field verification
Changes (if any) communicated to survey
administrator
Access to surveys with errors granted to
enumerator
Changes finalised
Supervisor prepares sample plan
Enumerators conducts survey as per plan
Information verification at the survey
administrator level
figure 2: survey implementation and monitoring
Section 3: Survey Findings 9
sUrVey finDingsSection 3
Percentag
e
0
20
40
60
80
100
Yes, Owned House No, Rented House No, Government House
87%93%
88%
13%6%
11%
0% 1.1% 0%
Colony (N=2,170) Slum (N=555) City (N=2,725)
4 Households using concrete and/or other materials of solid nature have been combined, but are separately depicted in the chart.
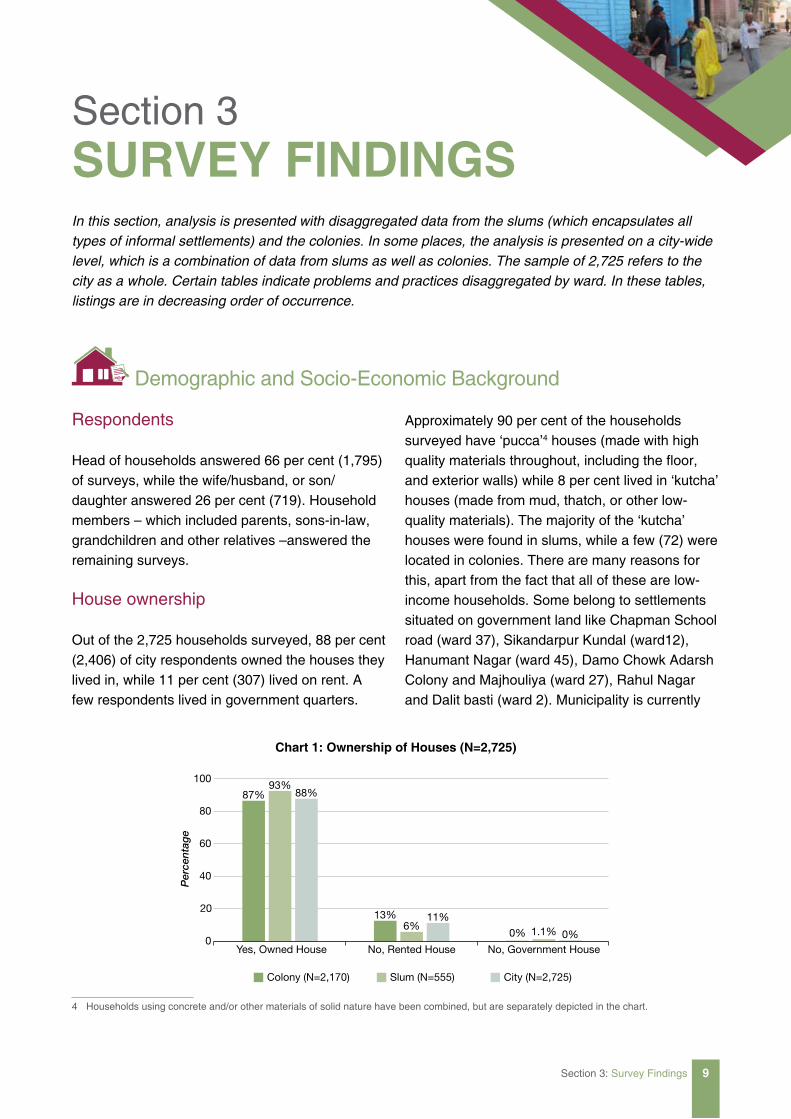
Demographic and Socio-Economic Background
Respondents
Head of households answered 66 per cent (1,795) of surveys, while the wife/husband, or son/daughter answered 26 per cent (719). Household members – which included parents, sons-in-law, grandchildren and other relatives –answered the remaining surveys.
House ownership
Out of the 2,725 households surveyed, 88 per cent (2,406) of city respondents owned the houses they lived in, while 11 per cent (307) lived on rent. A few respondents lived in government quarters.
Approximately 90 per cent of the households surveyed have ‘pucca’4 houses (made with high quality materials throughout, including the floor, and exterior walls) while 8 per cent lived in ‘kutcha’ houses (made from mud, thatch, or other low-quality materials). The majority of the ‘kutcha’ houses were found in slums, while a few (72) were located in colonies. There are many reasons for this, apart from the fact that all of these are low-income households. Some belong to settlements situated on government land like Chapman School road (ward 37), Sikandarpur Kundal (ward12), Hanumant Nagar (ward 45), Damo Chowk Adarsh Colony and Majhouliya (ward 27), Rahul Nagar and Dalit basti (ward 2). Municipality is currently
chart 1: ownership of Houses (n=2,725)
In this section, analysis is presented with disaggregated data from the slums (which encapsulates all
types of informal settlements) and the colonies. In some places, the analysis is presented on a city-wide
level, which is a combination of data from slums as well as colonies. The sample of 2,725 refers to the
city as a whole. Certain tables indicate problems and practices disaggregated by ward. In these tables,
listings are in decreasing order of occurrence.

Sanitation for All: An Assessment of Sanitation Services in Muzaffarpur, Bihar10
not providing houses to the homeless people situated on government land and therefore these areas typically witness slower development. In the future municipality will provide flats to the homeless family in apartments.
Years of stay
Across slums and colonies, 16 per cent (444) of households had inhabited their place of residence for less than ten years. 46 per cent households (1,242) reported that they had occupied their dwellings between 10 and 49 years. The remaining 38 per cent (1,039) had been staying in their localities for over fifty years.
Land Ownership
As elaborated earlier, amongst the slum households (555), 93 per cent households (517) respondents owned the houses they lived in. However, when they were asked about land ownership, a small percentage of respondents (13) did not have clarity about the ownership of land, and this brought the number of respondents who owned their houses down to 504.
Within this sample, 32 per cent (159) have registered lands, while 36 per cent (183) have khatiyani, 2 per cent (11) have authority letters. A significantly large percentage – 30 per cent (151) – of slum households did not have any documents
that helped secure tenure rights. Assigning property rights is a critical step in empowering people and helping them live better lives. Without these rights, residents are hesitant to invest in better standards of living since they fear the risk of displacement. Allotting property rights to the urban poor, however, is difficult to implement since slums often come up on disputed land. An interim solution could be granting ‘use rights’ that could enhance a feeling of security of tenure. ULBs could guarantee a hold on eviction even as they extend basic services to the area, which would make people interested in investing in their houses.
Of those who had land authority letters (11), all respondents said that they received these from other sources, the Wakf Board under the Ministry of Minority in these cases.
Percentag
e82%
42%
74%
12%
32%
16%
3.3%
25%
8%3% 0.7% 2.8%
0
20
40
60
80
100
Pucca house with concrete roof
Pucca house with any other kind of roof
Kutcha house Flat in a multi-story apartment
Colony (N=2,170) Slum (N=555) City (N=2,725)
chart 2: type of house (n=2,725)
chart 3: availability of land Patta (n=504)
No Yes, registry Yes, authority letter Yes, khatiyani
151 (30%)
159 (32%)
11 (2%)
183 (36%)

Section 3: Survey Findings 11
Religion and caste
Similar to the findings of the 2011 Census (77.65 per cent Hindu and 21.07 per cent Muslim), the survey respondents in the colonies were predominantly Hindus (83 per cent or 1,804 households). In slums, 26 per cent (147) of the respondents were Muslim, which is higher than the 17 per cent recorded in colonies.
While 44 per cent (1,202) of the surveyed city population belonged to the general category, households surveyed in colonies significantly influenced this figure. This is evident from the fact that colonies have 50 per cent (1,092) general category respondents while the number is significantly lower for slum respondents – 20 per cent (110).
chart 4: religion of family (n=2,725)
chart 5: type of ration card (n=2,725)
As per Census 2011, Scheduled Caste (SC) constitutes 7.78 per cent of the city’s population, which is close to the number the survey analysis has generated as well. While 10 per cent (273) of the surveyed population fall in the SC category, this number is highly influenced by the higher SC slum households which stand at 21 per cent (115). In comparison, only 7 per cent (158) of the population in the colonies belong to the SC category. A significant 45 per cent (1,230) of the survey population belongs to the Other Backward Classes (OBC); 57 per cent (318) in slums and 42% (912) in colonies. The population of ST population as well as Mahadalits is less than 1 per cent.
Ration card and income
42 per cent (1,157) of the households surveyed had ration cards. In colonies, 14 per cent (299)
83%
73%81%
17%26%
19%
0% 0% 0% 0% 0.2% 0% 0% 0.0% 0%
Percentag
e
0
20
40
60
80
100
Hindu Muslim Sikh Christian Jain
Colony (N=2,170) Slum (N=555) City (N=2,725)
Percentag
e
14%
5%
12%
21%
47%
26%
2.1%
12%
4.2%
63%
36%
58%
0
20
40
60
80
APLBPL AntyodayaNo card
Colony (N=2,170) Slum (N=555) City (N=2,725)

Sanitation for All: An Assessment of Sanitation Services in Muzaffarpur, Bihar12
chart 6: type of waste generated in household (n=2,725)
Percentag
e
100% 100% 100% 100% 100% 100%
83%77%
82%
93%87%
92%
0
20
40
60
80
100
Dry waste Wet waste Hazardous waste Sanitary napkins /diapers etc.
Colony (N=2,170) Slum (N=555) City (N=2,725)
households had Above Poverty Line (APL) cards, while 21 per cent (455) has Below Poverty Line (BPL) cards. In the slums, only 5 per cent (25) had
Solid Waste Management
MMC undertook a decentralised solid waste management programme “Swachhta Swasthya Samridhi” since December, 2016 based on segregation at source. This is a tripartite partnership for solid waste management between MMC, Centre for Science and Environment (CSE) and ITC Ltd. Within this, blue and green dustbins have also been distributed in 27 wards across the city.
Survey findings indicate that all households in the city generate both dry and wet waste. About 77 per cent (430) households in slums generate dangerous hazardous waste. In colonies, the percentage is higher at 83 per cent (1,797) of households. The possible reasons could be higher use of electronic equipment (resulting in disposal of used batteries), toys, syringes, etc. as compared to slum areas. In both slums and colonies, bundling of hazardous waste with other types of waste is a dangerous practice that should be addressed.
APL, whereas a dominant 47 per cent (263) had BPL cards.
A question was also posed regarding sanitary waste. In slums, 87 per cent (483) households said sanitary waste was generated, while in colonies, the figure was slightly higher at 93 per cent (2,013). It is important to keep in mind that this does not necessarily mean usage of sanitary pads. Sanitary waste can refer to the usage of diapers as well as cloth-based solutions for both women and children. Similar to dangerous waste, initiatives are required for segregation of sanitary waste which will make disposal easier for those handling it.
Segregation of waste
38 per cent (820) of the surveyed households in the colonies and 29 per cent (162) households in slums segregate waste at source – this may be a positive result of the distribution of blue and green dustbins by MMC, emphasising on the need for households to segregate waste at source.

Section 3: Survey Findings 13
Segregation does not necessarily mean that waste is collected in a segregated manner, or that composting is practised. Segregation may also not necessarily mean separating wet and dry waste, in these cases. Many households said that they segregate plastics, paper and cardboard for reutilisation as well as to sell to trash collectors (kabadiwala).
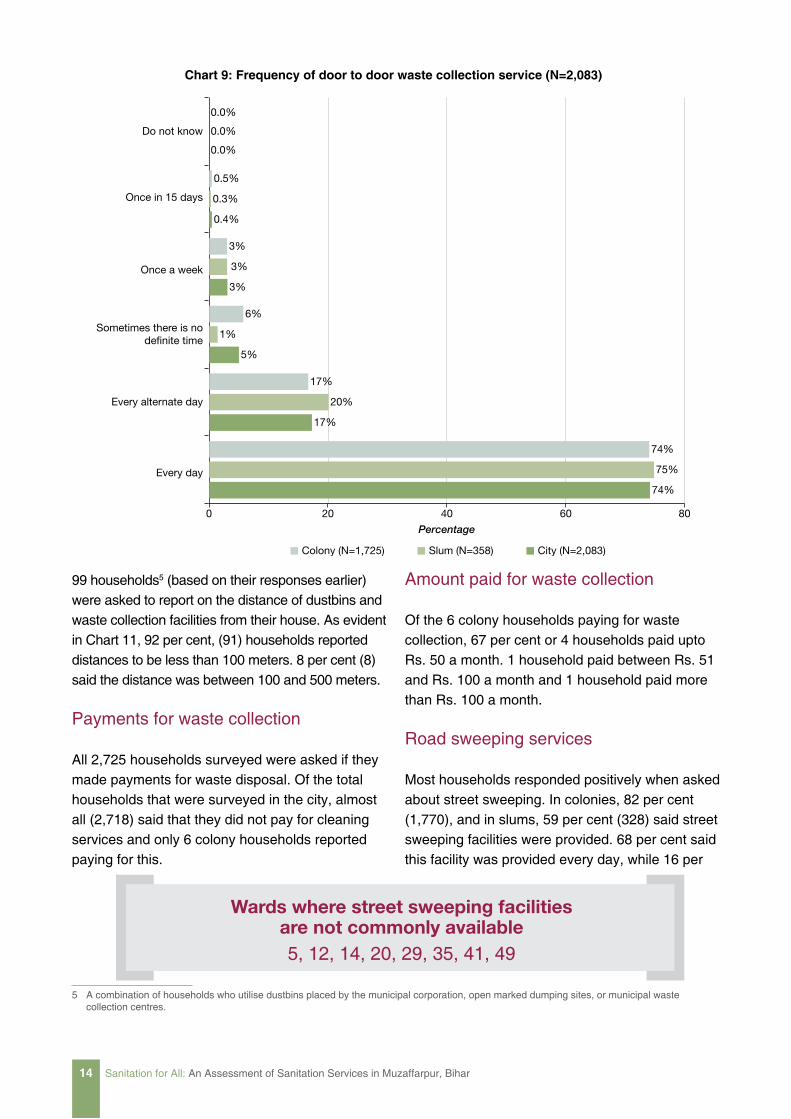
Collection of waste
In the colonies that were surveyed, 76 per cent (2,083) of households have some kind of arrangement for collection of waste from households. In the case of slums, this figure falls to 65 per cent (358). Out of 2,083 households which had some arrangement for collection of waste, nearly all households in colonies (1,723) and slums (357) said that this was done by the municipal corporation.
Of these households, 74 per cent (1,278) households in colonies and 75 per cent (268) in slums reported waste collection on a daily basis. About 17 per cent (288) households in colonies and 20 per cent (72) said that waste was collected on alternate days, while the rest said that waste was collected once a week. 5 per cent households complained that there was no fixed schedule. Furthermore, as highlighted above, during the survey, many households said that while they segregate waste in separate dustbins provided by MMC, sanitation workers do not collect dry and wet waste in a segregated way during waste collection.
A total of 642 households surveyed did not receive household waste collection services from the municipality. These households used other options as given in Chart 10. Since responses were recorded as multiple choice, the total percentage
chart 7: segregation of various wastes into separate dustbins (n=2,725)
Percentag
e
0
20
40
60
80
38%
29%
36%
No
62%
71%64%
Yes
Colony (N=2,170) Slum (N=555) City (N=2,725)
Wards where households commonly segregate waste 1, 3, 4, 5, 11, 13, 14, 16, 17, 18, 40
chart 8: Household waste collection facility available (n=2,725)
20
40
60
80
Percentag
e
100
Yes No
Colony (N=2,170) Slum (N=555) City (N=2,725)
0
79%
65%
76%
21%
35%
24%
of responses exceeds 100 per cent. About 7 per cent (33) of colony households and 10 per cent (19) slum households said that they dispose waste in dustbins installed by the MMC. Another 8 per cent either utilised dumping sites marked by the municipality or threw waste at nearby waste collection centres. Shockingly, 95 per cent households reported some form of unsanitary waste disposal practice which include disposal in open spaces, in ponds or nallahs, in streets, as well as burning of waste. Chart 10 shows that while these practices are unexpectedly and more common in colonies, slums too are not very far behind. Such improper waste disposal can lead to massive hygiene problems.
Sanitation for All: An Assessment of Sanitation Services in Muzaffarpur, Bihar14
Amount paid for waste collection
Of the 6 colony households paying for waste collection, 67 per cent or 4 households paid upto Rs. 50 a month. 1 household paid between Rs. 51 and Rs. 100 a month and 1 household paid more than Rs. 100 a month.
Road sweeping services
Most households responded positively when asked about street sweeping. In colonies, 82 per cent (1,770), and in slums, 59 per cent (328) said street sweeping facilities were provided. 68 per cent said this facility was provided every day, while 16 per
99 households5 (based on their responses earlier) were asked to report on the distance of dustbins and waste collection facilities from their house. As evident in Chart 11, 92 per cent, (91) households reported distances to be less than 100 meters. 8 per cent (8) said the distance was between 100 and 500 meters.
Payments for waste collection
All 2,725 households surveyed were asked if they made payments for waste disposal. Of the total households that were surveyed in the city, almost all (2,718) said that they did not pay for cleaning services and only 6 colony households reported paying for this.
Wards where street sweeping facilities are not commonly available5, 12, 14, 20, 29, 35, 41, 49
chart 9: frequency of door to door waste collection service (n=2,083)
Percentage
0 20 40 60 80
City (N=2,083)Slum (N=358)Colony (N=1,725)
17%
20%
17%
Every alternate day
74%
75%
74%
Every day
3%
3%
3%
Once a week
0.0%
0.0%
0.0%
Do not know
Once in 15 days
0.5%
0.3%
0.4%
6%
1%
5%
Sometimes there is node�nite time
5 A combination of households who utilise dustbins placed by the municipal corporation, open marked dumping sites, or municipal waste collection centres.

Section 3: Survey Findings 15
cent said sweeping was done every alternate day. Of the 2,098 households who reported that street sweeping was being done, 100 per cent said that the MMC provided the facility.
Payments for road sweeping
Much like the responses received for payments with respect to waste collection, 99.9 per cent (2,095) households said they did not make any payments for road and street sweeping. There were a few cases (3) who did not know
chart 10: Disposal of waste, if household collection unavailable (n=642)
71%
68%
70%
Throw in the open space in the basti / mohalla
22%
11%
19%
Throw in street / outside the house
In dustbin placed by the municipal corporation
7%
10%
8%
Percentage
0 20 40 60 80
Colony (N=445) Slum (N=197) City (N=642)
7%
7%
7%
Open dumping site marked by municipal corporation
0%
2%
1%
Municipal waste collection centre
1%
8%
3%
Throw in pond or nallah
3%
4%
3%
Burn waste
0.7%
1%
0.8%
Give to the kabadi
Others
0%
0%
0%
chart 11: Distance of dustbin/waste collection centre/dumping site (n=99)
20
40
60
80
Percentag
e
100
Less than 100 meters 100-500 meters
Colony (N=64) Slum (N=35) City (N=99)
0
95%86%
92%
5%14%
8%

Sanitation for All: An Assessment of Sanitation Services in Muzaffarpur, Bihar16
if their households paid or did not pay anything separately.
Complaints about waste collection, street and road sweeping
Most of the sampled households never made any complaints about either waste collection or street sweeping to the appropriate authorities. Only 13 per cent (70) of slum households and 2 per cent (47) of colony households had complained at
table 1: Type of complaints made about waste collection, street and road sweeping (N=117)
colony slum citycolony (n=47)
slum (n=70)
city (n=117)
No waste collection 15 22 37 32% 31% 32%
No street sweeping facility 35 58 93 74% 83% 79%
No dustbins nearby 28 43 71 60% 61% 61%
Others 3 4 7 6% 6% 6%
chart 12: frequency of sweeping (n=2,098)
least once. This is very significant because it is clear that slum dwellers account for a higher number of complaints because service quality is abysmally lower in their settlements. Besides, lower number of complaints does not mean that the quality of service is good. The main reason is lack of knowledge of systems of complaint registration. As a result, most people either do not complain or use informal channels. A total of 117 responses were received for complaints lodged which is presented in Table 1.
69%
63%
68%
Everyday
16%
17%
16%
Every alternate day
8%
9%
8%
Sometimes, no de�nite schedule
6%
8%
6%
Once a week
1%
3%
1%
Once in 15 days
Percentage
0 20 40 60 80
Colony (N=1,770) Slum (N=328) City (N=2,098)

Section 3: Survey Findings 17
discuss and take up issues with councillors in a group.
Resolution of complaints about waste disposal
Out of the total households that complained about waste collection and disposal, 96 per cent (45) in colonies and 100 per cent (70) in slums reported that their complaints were not resolved. Inability to attend to the complaints of the residents also leads to reduced interest in filing complaints, resulting in fewer number of complaints being registered. Even among those who said complaints had been attended to, a follow up question regarding days taken for resolution yielded unsatisfactory results. 67 per cent of these complaints were resolved within 9 days.
Mode of complaint about waste disposal
The most common mode of complaining was to visit the ward councillor in a group or individually.
Of the total responses received, 69 per cent (48) in slums and 49 per cent (23) in colonies reported having complained to the local ward councillor collectively. 31 per cent (22) households in slums and 40 per cent (19) households in colonies complained to the local ward councillor individually. Many slums now have Settlement Improvement Committees (SICs) formed through PRIA intervention and are in contact with their councillors, which explains the higher percentage figures in the survey findings. Through the committee, households in slums come together to
table 2: mode of complaints made about waste collection, street and road sweeping (n=117)
colony slum citycolony (n=47)
slum (n=70)
city (n=117)
Personal visit to municipal office 0 0 0 0% 0% 0%
Group visit to municipal office 2 1 3 4% 1% 3%
Visiting the local councilor individually 19 22 41 40% 31% 35%
Collectively going to the local councilor 23 48 71 49% 69% 61%
Personal visit at the helpdesk 2 0 2 4% 0% 2%
Group visit at the helpdesk 0 0 0 0% 0% 0.0%
Individually through city / faculty engineer / plumber / sanitary inspector / ward jamadar
0 0 0 0% 0% 0%
Going collectively through the city / faculty engineer / plumber / sanitary inspector / ward jamadar
0 0 0 0% 0% 0%
Called helpline/telephone 0 0 0 0% 0% 0%
Through SMS 0 0 0 0% 0% 0%
Through website 0 0 0 0% 0% 0%
During public hearing 0 0 0 0% 0% 0%
Others 1 0 1 2% 0% 1%
Toilet FacilitiesAccess to a secure toilet facility is a basic right that goes a long way in building hygiene, as well as ensuring safety and security. In the city of Muzaffarpur, 93 per cent (2,528) households have a toilet at home, but this figure is pointedly
lower when slum households are analysed separately. While 97 per cent (2,106) households in colonies have individual household toilets, only 76 per cent (422) households in slums have one. Approximately 2 per cent (43) of colony

Sanitation for All: An Assessment of Sanitation Services in Muzaffarpur, Bihar18
households and 5 per cent (30) slum households utilise shared toilets with family members who live close by. The remaining 46 households utilise community toilets.6
In slums, 11 per cent (61), and in colonies, 1 per cent (17) household members defecate in the open exposing themselves to huge risks, both in
terms of disease as well as safety. News reports show how vulnerable adolescent girls and women are to molestation and rape, when practising open defecation. PRIA has been working closely with Settlement Improvement Committees (SICs) that help advocate the interests of the community, and pitch for toilets for residents. Chart 13 highlights the findings.
6 Owing to the small sample size, this section has not been analysed. As part of a separate study with the municipality, PRIA is mapping public and community toilets in Muzaffarpur.
Wards where open defecation is common5, 6, 12, 13, 14, 39
chart 13: toilet facility available to household (n=2,725)
Percentag
e
Colony (N=2,170) Slum (N=555) City (N=2,725)
0
20
40
60
80
100
Yes, Own toiletat home
Yes, Public/community toilet
97%
76%
93%
Yes, Shared toilet
2% 5% 3%0.2%8%
2%
Open defecation1%
11%3%
Type of toilets
Respondents from households who use individual or shared toilet facilities were asked about the outlets these toilets were connected to. Across the city, a large majority of households use flush/pour flush toilets connected to septic tanks. This is because sewerage connections are not available in Muzaffarpur. This has been explored later in the report. As Chart 14 shows 94 per cent of colony and 73 per cent slum households utilise septic tanks. However, there is a difference in that colony residents use automated flush systems, while slum residents resort to primitive pour flush methods. A few households (180) across the city also use slab, single-pit toilets. The chart also shows that 1
per cent of toilets are connected directly to nallah soutside the houses. This is a major hygiene issue and one that the municipality must immediately address.
Source of funds for individual or shared toilets
Across the city, approximately 90 per cent of toilets have been constructed using own funding. Only 4 per cent of toilets across the city have been constructed using funding from Swachh Bharat Mission (SBM). These 106 toilets are a subset of the 17 per cent of toilets that the city households have constructed in the last five years (Chart 15).

Section 3: Survey Findings 19
chart 14: type of toilet (applicable for personal/shared toilet) (n=2,601)
Percentage0 20 40 60 10080
Colony (N=2,149) Slum (N=452) City (N=2,601)
3%
0%
3%
Flush toilets connectedto septic tank
91%
73%
88%
Pour �ush toilet connectedto septic tank
1%
4%
1%
Pour �ush toilets connectedto naali outside house
4.1%
20.4%
6.9%
Slab, single-pit toilet
0.14%
1%
0.23%
Without slab/opensingle pit toilet
0.74%
2%
0.92%
Slab, double improvedpit toilet
Wards where maximum toilets are connected to nallah1, 4, 11, 13, 25, 34, 37, 39
chart 15: age of personal or shared toilet (n=2,601)
Percentag
e
0
20
40
Colony (N=2,149) Slum (N=452) City (N=2,601)
Less than 5 years
13%
35%
17%
For more than 5years and upto
10 years
17%
22%
18%
For more than 10years and upto
20 years
35%
26%
33%
For more than 20years and upto
50 years
24%
10%
21%
Over 50 years
2% 1% 2%
Do not know
9%6%
9%
The municipality should endeavour to raise awareness about the process of applying for toilets and encourage the utilisation of the subsidy
provided under SBM – especially for the 11 per cent households in the slums that still defecate in the open.

Sanitation for All: An Assessment of Sanitation Services in Muzaffarpur, Bihar20
Inlet of water
As elaborated earlier, 2,601 households utilise individual or shared toilets. 71 per cent of colony households have taps for water supply inside toilets, while 29 per cent make other arrangements that include carrying water or storing it in buckets. Because of size of toilets as well as availability of infrastructural resources, only 21 per cent of slum households have taps inside the toilet, while the others make alternate arrangements similar to what colony residents do.
Knowledge on pit cleaning
The households whose toilets are connected to septic tanks or soak pits were asked about their knowledge of cleaning and maintenance of these types of decentralised systems. 99 per cent of users knew that these systems required regular cleaning; residents of slums and colonies fared equally on such awareness.
chart 16: source/inlet of water for personal or shared toilet (n=2,601)
Percentag
e
2%7%
3%0
20
40
60
8071%
21%
62%
Tap inside the toilet Stored inside the toilet
Colony (N=2,149) Slum (N=452) City (N=2,601)
27%
73%
35%
Carry by hand
table 3: Source of funds for personal or shared toilet (N=2,601)
colony slum citycolony
(n=2149)slum
(n=452)city
(n=2601)
No scheme (used own money) 1960 368 2328 91% 81% 90%
Rajiv Awas Yojana (RAY) 12 3 15 0.6% 0.7% 0.6%
Swachh Bharat Abhiyan (SBM) 39 67 106 1.8% 15% 4%
Others 7 4 11 0% 1% 0%
Do not know 131 10 141 6% 2% 5%
The same users were also asked when they had last got these systems cleaned. As Chart 17 shows, 59 per cent (1,253) of colony and 61 per cent (261) of slum households said their systems had never been cleaned. When cross-tabulated with age of toilets, it appeared that only approximately one-third of these households had toilets that were less than five years old and probably not requiring immediate cleaning. A significant section of the population has septic tanks and pits that need to be cleaned urgently.
Additionally, a substantial number of respondents were also unaware of when this process had been carried out for their systems, and it is likely that in many cases, their systems too had never been cleaned. A total of 574 households had got their decentralised systems cleaned at least once. They were then asked about the services they used for this. Households reported employing a diverse set of service providers for cleaning of tanks and

Section 3: Survey Findings 21
pits – the municipality, private contractors, and labourers.
Despite a plethora of policy changes, and a push from the SBM, it appears that a crucial part of the cleaning process is still being carried out by hand. Only 86 per cent (492) of city respondents said that machines were utilised exclusively, while others said that cleaning was either carried out completely using manual processes, or
through a mix of machine and hand. For obvious reasons, slum households show results that are much worse than those in colonies. When method of cleaning is cross-tabulated with the agency in charge, it is clear that the municipality is responsible for a miniscule number of manual scavenging cases; 3 cases of using completely manual methods and 14 cases of using a mix of manual and machine methods. This, however, is still a serious offence that the municipality must
chart 17: last instance of pit/septic tank cleaning (n=2,550)
Percentag
e
0
20
40
80
60
12% 12% 12%
59% 61% 59%
19%15%
18%
Colony (N=2,123) Slum (N=427) City (N=2,550)
6%9%
6%
Within a year
4% 3% 4%
2 years agoMore than 2 yearsNever cleaned Do not know
table 4: method of cleaning used for pit/septic tank (n=574)
colony slum citycolony (n=470)
slum (n=104)
city (n=574)
Completely cleaned with hands 31 27 58 7% 26% 10%
Machine utilisation 423 69 492 90% 66% 86%
Machine is used but to some extent, it is cleaned with hands
16 8 24 3% 8% 4%
chart 18: Provider of service for pit/septic tank cleaning (n=574)
69%
60%67%
25%17%
24%
6%
21%
9%1% 1% 1%
Percentag
e
Colony (N=467) Slum (N=103) City (N=574)
0
20
40
60
80
Municipality service Private contractor Local labour Do not know
Sanitation for All: An Assessment of Sanitation Services in Muzaffarpur, Bihar22
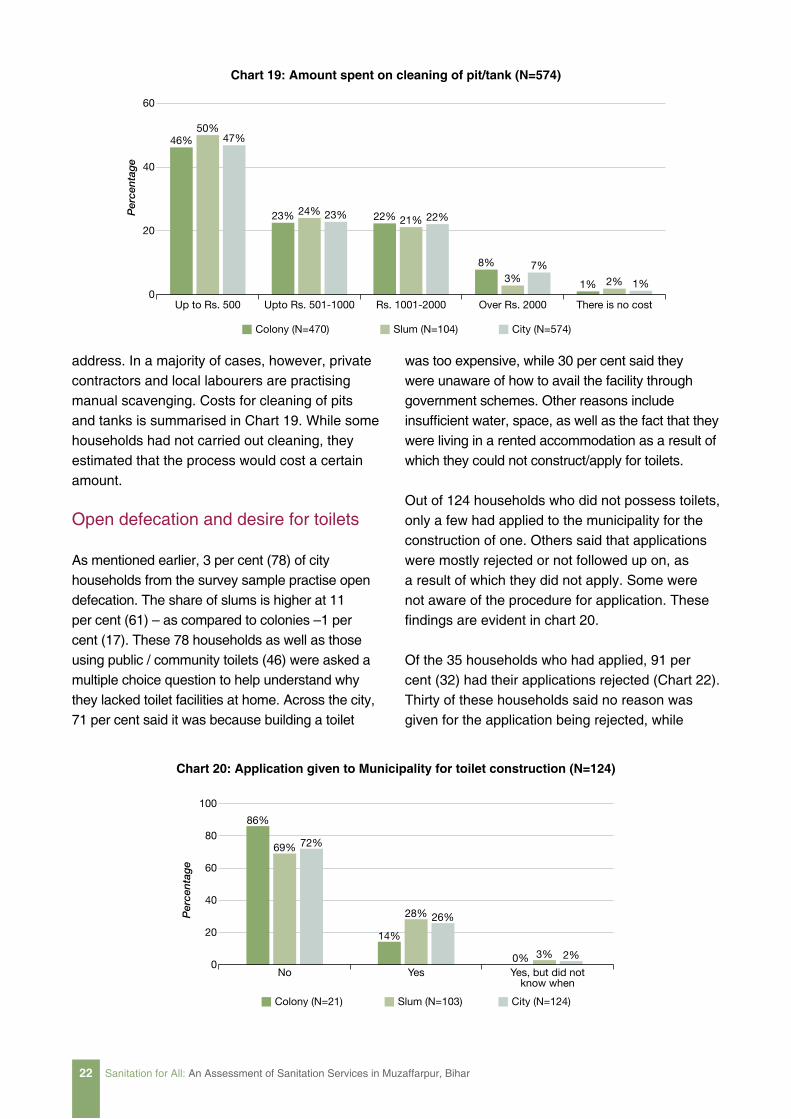
address. In a majority of cases, however, private contractors and local labourers are practising manual scavenging. Costs for cleaning of pits and tanks is summarised in Chart 19. While some households had not carried out cleaning, they estimated that the process would cost a certain amount.
Open defecation and desire for toilets
As mentioned earlier, 3 per cent (78) of city households from the survey sample practise open defecation. The share of slums is higher at 11 per cent (61) – as compared to colonies –1 per cent (17). These 78 households as well as those using public / community toilets (46) were asked a multiple choice question to help understand why they lacked toilet facilities at home. Across the city, 71 per cent said it was because building a toilet
was too expensive, while 30 per cent said they were unaware of how to avail the facility through government schemes. Other reasons include insufficient water, space, as well as the fact that they were living in a rented accommodation as a result of which they could not construct/apply for toilets.
Out of 124 households who did not possess toilets, only a few had applied to the municipality for the construction of one. Others said that applications were mostly rejected or not followed up on, as a result of which they did not apply. Some were not aware of the procedure for application. These findings are evident in chart 20.
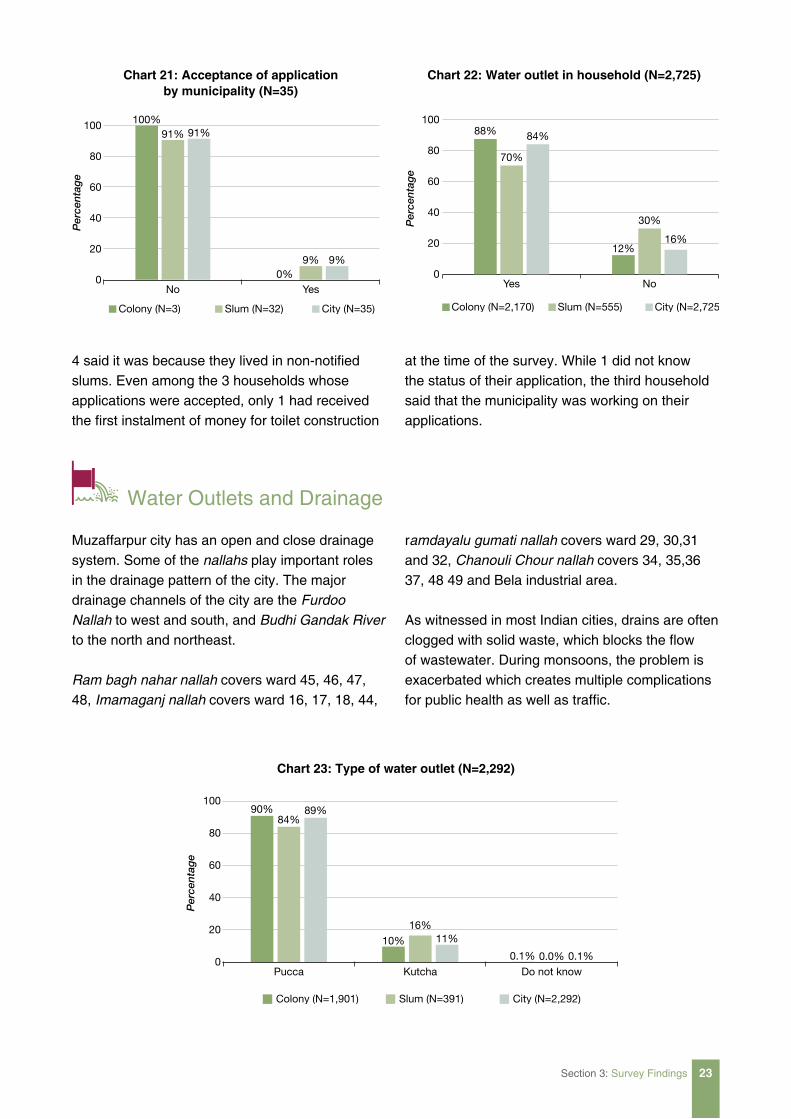
Of the 35 households who had applied, 91 per cent (32) had their applications rejected (Chart 22). Thirty of these households said no reason was given for the application being rejected, while
chart 19: amount spent on cleaning of pit/tank (n=574)
Percentag
e
0
20
40
60
Colony (N=470) Slum (N=104) City (N=574)
Up to Rs. 500 Over Rs. 2000 There is no costUpto Rs. 501-1000 Rs. 1001-2000
46%50%
47%
23% 24% 23% 22% 21% 22%
8%
3%7%
1% 2% 1%
chart 20: application given to municipality for toilet construction (n=124)
Percentag
e
0
20
40
60
80
100
14%
28% 26%
86%
69% 72%
0% 3% 2%
Colony (N=21) Slum (N=103) City (N=124)
No Yes Yes, but did notknow when
Section 3: Survey Findings 23
chart 21: acceptance of application by municipality (n=35)
chart 22: water outlet in household (n=2,725)
20
40
60
80
Percentag
e
100
No Yes
Colony (N=3) Slum (N=32) City (N=35)
0%9% 9%
100%91%
0
91%
20
40
60
80
Percentag
e
100
Yes No
Colony (N=2,170) Slum (N=555) City (N=2,725)
0
88%
70%
84%
12%
30%
16%
4 said it was because they lived in non-notified slums. Even among the 3 households whose applications were accepted, only 1 had received the first instalment of money for toilet construction
at the time of the survey. While 1 did not know the status of their application, the third household said that the municipality was working on their applications.
Water Outlets and Drainage
Muzaffarpur city has an open and close drainage system. Some of the nallahs play important roles in the drainage pattern of the city. The major drainage channels of the city are the Furdoo
Nallah to west and south, and Budhi Gandak River to the north and northeast.
Ram bagh nahar nallah covers ward 45, 46, 47, 48, Imamaganj nallah covers ward 16, 17, 18, 44,
ramdayalu gumati nallah covers ward 29, 30,31 and 32, Chanouli Chour nallah covers 34, 35,36 37, 48 49 and Bela industrial area.
As witnessed in most Indian cities, drains are often clogged with solid waste, which blocks the flow of wastewater. During monsoons, the problem is exacerbated which creates multiple complications for public health as well as traffic.
chart 23: type of water outlet (n=2,292)
Percentag
e
0
20
40
60
80
100
Pucca Kutcha Do not know
Colony (N=1,901) Slum (N=391) City (N=2,292)
10%
16%11%
90%84%
89%
0.0%0.1% 0.1%

Sanitation for All: An Assessment of Sanitation Services in Muzaffarpur, Bihar24
Water outlets
Out of 2,725 households surveyed in the city, 84 per cent (2,292) had water outlets (a section that allows water to exit from the house) in their homes. In slums, 70 per cent (391) households had water outlets, while the percentage was higher in colonies at 88 per cent (1,901).
While most water outlets in colonies were of a ‘pucca’ nature, in slums, 16 per cent (64) reported that their water outlets were ‘kutcha’. Spillage of wastewater is a common occurrence in these households. These outlets are also prone to breakage when subject to higher load.
chart 24: outlet for waste water from Kitchen (n=2,725)
chart 25: outlet for waste water from Bathroom (n=2,725)
85%
62%
80%
Naala, connectedto drainage system
1%
4%
2%
Naala, not connectedto drainage system
11%
32%
16%
Open area outside house
2%
2.5%
2%
Soak Pit speci�cally forkitchen and bathroom
Percentage
Colony (N=2,170) Slum (N=555) City (N=2,725)
0 20 40 60 10080
85%
62%
80%
Naala, connectedto drainage system
1%
3%
2%
Naala, not connectedto drainage system
11%
32%
15%
Open area outside house
2%
2.5%
2%
Soak Pit speci�cally forkitchen and bathroom
Percentage
Colony (N=2,170) Slum (N=555) City (N=2,725)
0 20 40 60 10080

Section 3: Survey Findings 25
Drainage
In terms of kitchen and bathroom outlets, approximately 80 per cent of city households said that wastewater flowed into nallahs that were connected to main drainage facilities for both the cases. As Chart 24 and 25 show, approximately 62 per cent households in slums and 85 per cent households in colonies had this facility. In slums, 32 per cent said that wastewater collects in open areas outside their homes.
Apart from this, respondents were also asked about other outlets and their connection points for waste water. A majority of respondents indicated that water flowed into nallah connected to the drainage system, but a large number (especially in slums – 68 per cent) of respondents stated that waste water accumulated in the open spaces outside the house. Stagnant water can lead to a plethora of problems including mosquito borne diseases as well as many forms of infection.
Wards where kitchen and bathroom are not connected to proper outlets
11, 12, 13, 46, 47, 49
Construction, maintenance and payments
The 2,239 respondents who had said water flowed into nallah were asked about construction, maintenance and payments. In most cases, the municipality constructed drainage systems – 97.4 per cent (1,826) in colonies and 95 per cent (347) in slums. In the case of maintenance, the percentage is similar. In colonies, 97.8 per cent (1,832) reported that municipalities carried out the task while in slums it was 95 per cent (348). A few households (59) said that they had to carry out cleaning themselves or use other services. This, however, is more common in slums than colonies.
Among 2,180 households (a subset of those households whose maintenance is carried out either by the municipality or others) in the city, only 92 complaints were made about these services. These complaints were mainly regarding water logging, poor construction of drainage, quality concerns, erratic cleaning and dumping of waste.
An important aspect of complaint redressal is the mode of making complaints. Complaints can be made either through formal or informal channels and this influences the readiness of agencies to respond. Formal complaints are understood as those that are provided with a receipt or acknowledgement.
chart 26: who constructed drainage system (n=2,239)
Percentag
e
0
20
40
60
80
100
Municipality Self Community
Colony (N=1,866) Slum (N=365) City (N=2,239)
97.4% 95% 97%
1.1% 4% 2% 1.0% 1% 1%

Sanitation for All: An Assessment of Sanitation Services in Muzaffarpur, Bihar26
This is made possible through visiting the municipality, utilising the website or helpline or utilising SMS services. While councillors too can
chart 27: who maintains drainage system (n=2,239)
Percentag
e
0
20
40
60
80
100
Colony (N=1,874) Slum (N=365) City (N=2,239)
97.8% 95% 97.4%
1% 4% 1.7% 0.9%1.1%0.9%
Municipality Self Community
table 5: type of complaints raised about water outlets and drainage systems (n=92)
colony slum citycolony (n=49)
slum (n=43)
city (n=92)
Water logging 27 24 51 55% 56% 55%
Poor quality 8 1 9 16% 2% 10%
Poor construction of the drainage 22 28 50 45% 65% 54%
Erratic cleaning 33 37 70 67% 86% 76%
All the waste is dumped in the drainage 10 12 22 20% 28% 24%
Different kind of connections are made in the drainage
1 1 2 2% 2% 2%
Others 2 2 4 4% 5% 4%
lodge complaints, it is highly dependent on the individual’s desire and motivation to address issues.
wards where complaints are rampant
type of complaint ward no.Water logging 4, 30, 35,39Poor construction of drainage 2, 7, 20, 30, 35Erratic cleaning 7, 8, 16, 30, 35
Survey results revealed that the 39% per cent of the 92 complaints were made largely through visiting the local councillor individually and 54 per cent respondents said they visited the councillor collectively, though this is more
common in slums than colonies. Only 5 per cent respondents said they had individually visited the municipal office to complain, while 7 per cent visited the municipal office collectively to register complaints.
Section 3: Survey Findings 27
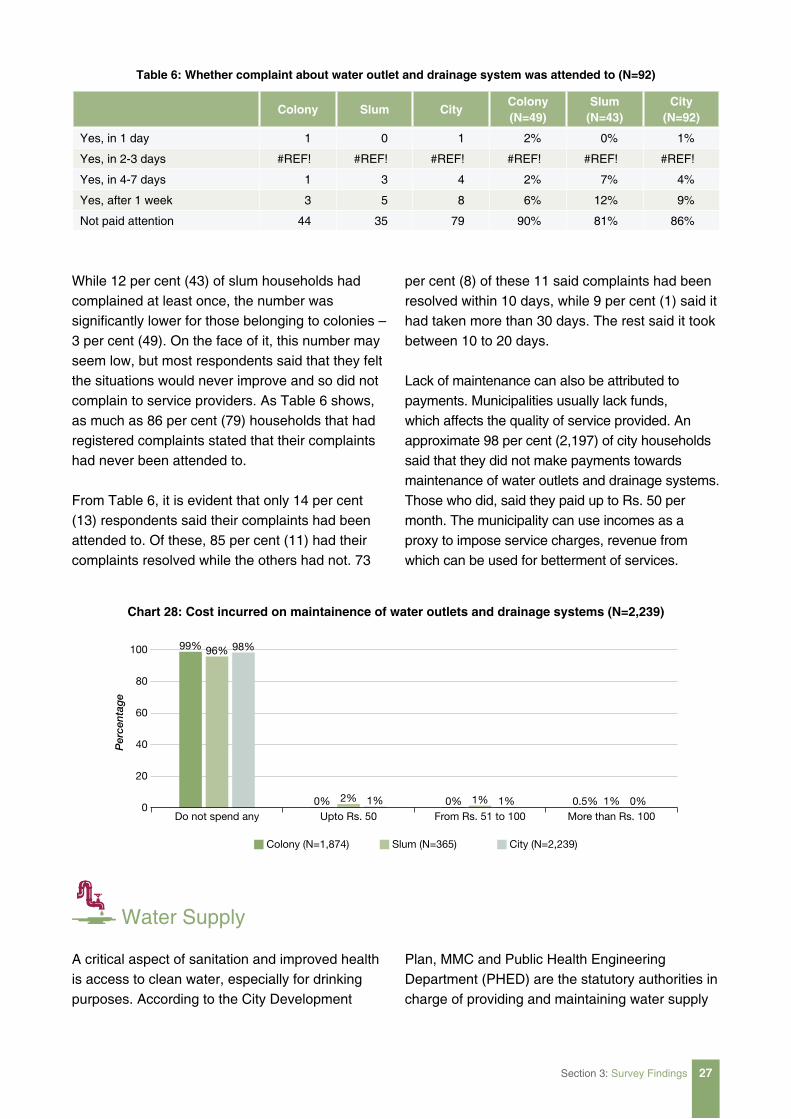
While 12 per cent (43) of slum households had complained at least once, the number was significantly lower for those belonging to colonies – 3 per cent (49). On the face of it, this number may seem low, but most respondents said that they felt the situations would never improve and so did not complain to service providers. As Table 6 shows, as much as 86 per cent (79) households that had registered complaints stated that their complaints had never been attended to.
From Table 6, it is evident that only 14 per cent (13) respondents said their complaints had been attended to. Of these, 85 per cent (11) had their complaints resolved while the others had not. 73
per cent (8) of these 11 said complaints had been resolved within 10 days, while 9 per cent (1) said it had taken more than 30 days. The rest said it took between 10 to 20 days.
Lack of maintenance can also be attributed to payments. Municipalities usually lack funds, which affects the quality of service provided. An approximate 98 per cent (2,197) of city households said that they did not make payments towards maintenance of water outlets and drainage systems. Those who did, said they paid up to Rs. 50 per month. The municipality can use incomes as a proxy to impose service charges, revenue from which can be used for betterment of services.
table 6: whether complaint about water outlet and drainage system was attended to (n=92)
colony slum citycolony (n=49)
slum (n=43)
city (n=92)
Yes, in 1 day 1 0 1 2% 0% 1%
Yes, in 2-3 days #REF! #REF! #REF! #REF! #REF! #REF!
Yes, in 4-7 days 1 3 4 2% 7% 4%
Yes, after 1 week 3 5 8 6% 12% 9%
Not paid attention 44 35 79 90% 81% 86%
chart 28: cost incurred on maintainence of water outlets and drainage systems (n=2,239)
Percentag
e
0
20
40
60
80
100
0% 2% 1% 0% 1% 1% 0.5% 1% 0%
99% 96% 98%
Colony (N=1,874) Slum (N=365) City (N=2,239)
Do not spend any Upto Rs. 50 From Rs. 51 to 100 More than Rs. 100
Water Supply
A critical aspect of sanitation and improved health is access to clean water, especially for drinking purposes. According to the City Development
Plan, MMC and Public Health Engineering Department (PHED) are the statutory authorities in charge of providing and maintaining water supply

Sanitation for All: An Assessment of Sanitation Services in Muzaffarpur, Bihar28
services in the municipal area. In colonies, 23 per cent (494) of households said that they are dependent on the government household piped connection as primary source of drinking water. In slums, this figure fell to 21 per cent (118). In the survey sample, 15 per cent (82) slum households relied largely on government stand posts as primary source of water.
What is locally significant in Muzaffarpur is that a dominant 62.3 per cent (1,697) city households; 49.2 per cent (273) slum households and 65.6 per cent (1,424) colony households relied on private covered sources such as hand pumps, wells, bore wells, submersibles, etc as primary source of drinking water. Some households also relied on neighbours.
Considering the high dependency on ground water, the department should do better to make piped water connection more accessible and ensure the water is treated and be free from common forms of infection. It is likely that many families do not filter the water before consumption.
When asked about primary sources of water for other purposes, the share of government-provided piped connection rose to 27 per cent (744) across the city while the dependence on private covered sources also slightly rose to 64 per cent (1,751).
Across the city, an approximate 84 per cent relied only on primary sources (for water and other purposes) such as government household piped connection and private covered sources, as charts
chart 29: Primary source for drinking water (n=2,725)
Percentage
0 20 40 60 80
Colony (N=2,170) Slum (N=555) City (N=2,725)
23%
21%
22%
2%
15%
5%
0%
5%
1%
0%
0.4%
0.07%
8%
5%
8%
1%
4%
2%
65.6%
49.2%
62.3%
Government householdpiped connection
Government stand post
Government hand pump
Government open well
Bottled mineral water
From neighbours
Private covered sources(For example, hand pumps, wells,
bore wells, submersibles, etc)

Section 3: Survey Findings 29
chart 30: Primary sources of water for other purposes (n=2,725)
Percentage
0 20 40 60 80
Colony (N=2,170) Slum (N=555) City (N=2,725)
Government Householdpiped connection
28%
25%
27%
Government stand post
2%
14%
4%
Government hand pump
1%
8%
2%
Government open well
0.05%
0.4%
0.11%
From neighbours
1%
4%
2%
Private covered sources (For example, hand pumps, wells,
bore wells, submersibles, etc)
68%
48.3%
64%
Open source(for example individual
open well/pond/lake)
0.00%
0.9%
0.18%
29 and 30 show. The remaining 16 per cent (424) utilised secondary sources as well, mainly hand pumps, stand posts, and tankers (both private covered sources and government).
In Muzaffarpur, the survey findings showed that dominantly, water was provided 7 days a week in 71 per cent (691) households which availed government services. The findings also show that 45 per cent (436) of the households receive water between 2 to 4 hours on these days. Keeping these factors in mind, 51 per cent (1,387) respondents said that they were satisfied with the availability of water for their needs. However, when slums household responses were analysed separately, satisfaction levels reduced to 38 per cent. The department should strive to ensure water is available on a daily basis. In slums, storage is difficult and water is easily prone to contamination.
Respondents that utilised only private sources such as private tankers, bottled water, private wells/bore wells, submersibles or those that availed water from lakes, ponds or open wells were asked why they did not avail of government water services. Most responded that supply of municipal water was unavailable, or of poor quality. Others stated that supply was irregular or insufficient. The municipality can seek information regarding wards where this problem occurs and provide solutions.
Finally, the sample of 2,725 households also ranked the top three activities (from a list of ten options) for which they consumed water. The maximum use of water was for bathing purposes, followed by washing clothes and washing utensils, as evident in Table 7.

Sanitation for All: An Assessment of Sanitation Services in Muzaffarpur, Bihar30
chart 32: Duration for which water is made available in a day (n=968)
Percentage
Colony (N=718) Slum (N=250) City (N=968)
Up to 15 minutes
More than 15 minutesand 30 minutes
More than 30 minutesand up to 1 hour
More than 1 hourand up to 2 hours
0.8%
2.8%
1.3%
4%
6%
5%
7%
6%
7%
10%
19%
12%
More than 2 hoursand 4 hours
45%
45%
45%
More than 4 hours
32.6%
21.2%
29.6%
0 20 40 60
2.5%
0.0%
1.9%
1%
1%
1%
2%
5%
3%
3.8%
20%
8.1%
16.43%
11%
14.98%
74%
63%
71%
Percentage0 20 40 60 80
Colony (N=718) Slum (N=250) City (N=968)
1 day
3 days
4 days
5 days
6 days
7 days
chart 31: number of days of water supply in a week (n=968)

Section 3: Survey Findings 31
chart 33: reasons for not using water provided by government sources like municipality/PHeD (n=2,001)
20
40
80
60
Percentag
e
100
Municipalwater is not
available
Poor quality Insuf�cientsupply
Supply is notregular
Other reason
Colony (N=1,664) Slum (N=337) City (N=2,001)
0
16%13%
16%
11%7% 10%14%
15%14%
75%
85%76%
9% 6% 8%
Table 7: Usage of water for various household activities (top 3) (N=2,725)
colony slum citycolony
(n=2,170)slum
(n=555)city
(n=2,725)
For drinking purposes 824 165 989 38% 30% 36%
For washing clothes 1933 520 2453 89% 94% 90%
For utensil washing 1330 357 1687 61% 64% 62%
For toilet usage 304 72 376 14% 13% 14%
For bathing purposes 2003 504 2507 92% 91% 92%
For cooking purposes 83 39 122 4% 7% 4%
For cleaning of household 29 4 33 1% 1% 1%
For gardening 1 0 1 0% 0% 0%
For animals 2 4 6 0% 1% 0%
For washing car 1 0 1 0.0% 0.0% 0.0%
Bathing Facilities
Type of bathing facility
Out of 2,725 households, 2 per cent (37) of colony households and 15 per cent (83) slum households reported an absence of bathing facility inside their households. In the sample, respondents without access to a bathing facility bathe using hand pumps and stand posts, although some utilise water from ponds and wells too. 88 per cent (1,901) of colony households had a bathroom inside their house,
while 11 per cent (228) had a bathroom outside the house, but within the premises. Within slums, owing to the smaller sizes of houses, only 42 per cent (231) had bathing facilities inside the household, while 43 per cent (239) had bathrooms outside the house but located within their premises. Many of these are also makeshift arrangements. In addition, a few houses also shared bathing spaces with their relatives and neighbours, while two houses utilised community bathing facilities.7
7 Considering the small sample, these have not been analysed separately.
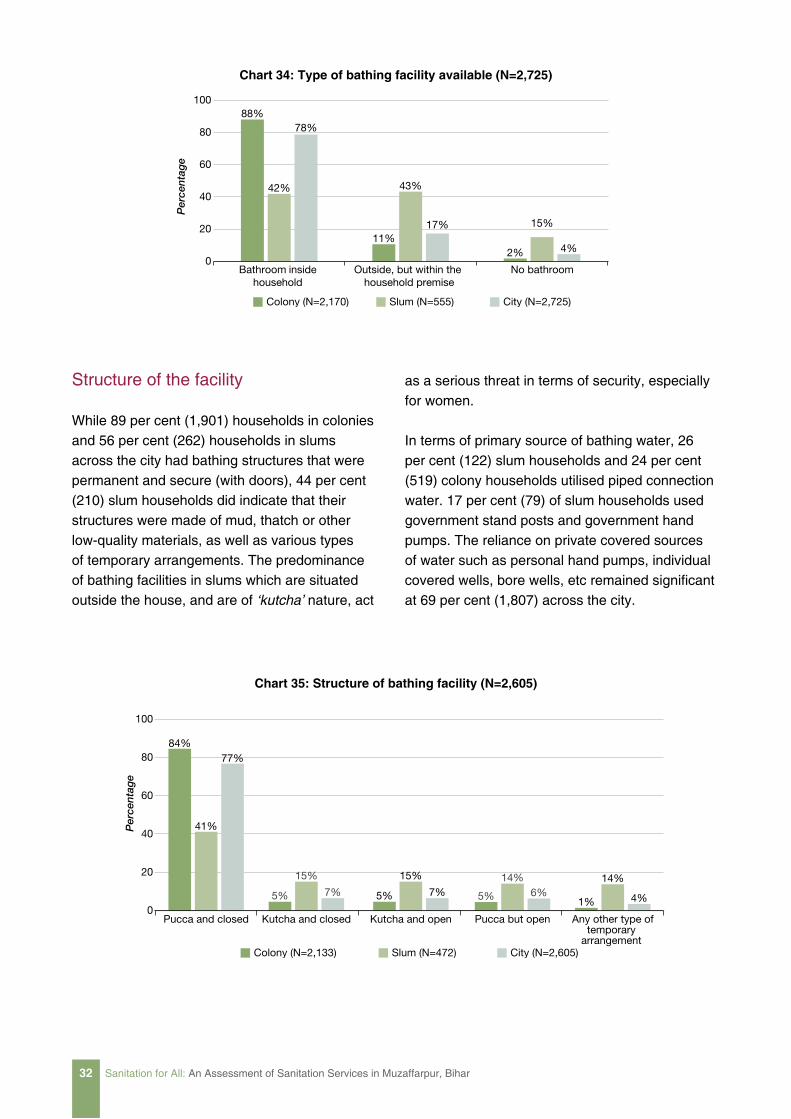
Sanitation for All: An Assessment of Sanitation Services in Muzaffarpur, Bihar32
Structure of the facility
While 89 per cent (1,901) households in colonies and 56 per cent (262) households in slums across the city had bathing structures that were permanent and secure (with doors), 44 per cent (210) slum households did indicate that their structures were made of mud, thatch or other low-quality materials, as well as various types of temporary arrangements. The predominance of bathing facilities in slums which are situated outside the house, and are of ‘kutcha’ nature, act
as a serious threat in terms of security, especially for women.
In terms of primary source of bathing water, 26 per cent (122) slum households and 24 per cent (519) colony households utilised piped connection water. 17 per cent (79) of slum households used government stand posts and government hand pumps. The reliance on private covered sources of water such as personal hand pumps, individual covered wells, bore wells, etc remained significant at 69 per cent (1,807) across the city.
chart 34: type of bathing facility available (n=2,725)
Percentag
e
0
20
40
60
80
100
Colony (N=2,170) Slum (N=555) City (N=2,725)
2%
15%
4%
88%
42%
78%
11%
43%
17%
Bathroom inside household
Outside, but within the household premise
No bathroom
chart 35: structure of bathing facility (n=2,605)
20
40
100
80
60
Percentag
e
Pucca and closed Kutcha and closed Pucca but openKutcha and open Any other type oftemporary
arrangement Colony (N=2,133) Slum (N=472) City (N=2,605)
84%
41%
77%
7%5%
15%
1%
14%
4%5%
15%
7% 5%
14%6%
0

Section 3: Survey Findings 33
chart 36: Primary source of water for bathing (n=2,605)
Percentage
0 20 40 60 80
Colony (N=2,133) Slum (N=472) City (N=2,605)
24%
26%
25%
Government householdpiped connection
Private covered sources (for example,personal hand pump / individual
covered wells / personal borewells / individual
submersible / water...
1%
10%
3%
Government stand post
1%
7%
2%
Government hand pump
1%
3%
1%
From neighbours
73%
54%
69%


Section 4: Conclusion, Recommendations and Way Forward 35
conclUsion, recommenDations anD way forwarD
Section 4
Demographic and Socio-Economic aspects
policy, there is a good opportunity of formulating projects for improving supply of good quality housing and improving housing conditions in informal settlements of the city. The Settlement Improvement Committees (SICs), initiated through PRIA’s intervention under the ongoing ECRC project can play an important role in formulating and implementing the programs for housing and aspects of land title.
Housing is a major component of urban fabric and often termed as a ‘basic need’ with food and clothing. In Muzaffarpur, during the survey, it was found that 74 percent of households live in concrete roofed houses, while 42 percent of informal settlement dwellers live in pucca houses with concrete roofs. Among the informal settlement households, 30 percent did not possess any documents related to secure tenure rights. Under provisions of PMAY (Urban) and Bihar slum
Based on the findings of the survey illustrated in the previous chapters, issues and challenges towards
achieving ‘sanitation for all’ in Muzaffarpur are summarized below:
Solid Waste Management
During the survey, many important facts emerged about the status of solid waste management in the city. It was observed that a moderate portion of households are segregating waste at source, which may be seen as a starting point for an organised system of waste processing. However segregation and safe disposal of hazardous and sanitary waste need specific attention of MMC and other stakeholders.Coverage of only 76 percent of households through collection of waste indicates towards the need to improve waste collection facilities. Frequency of collection and street
sweeping also needs improvement at places that are poor, especially in informal settlements. MMC’s program ‘Swachhta Swasthya Samridhi’ in partnership with CSE and ITC Ltd has been operational since December 2016 and has been implementing decentralised solid waste management system. If found effective and feasible after evaluation in the wards covered initially, it should be expanded to cover all wards of the city.
One of the key observations during the study was lack of community participation and engagement

Sanitation for All: An Assessment of Sanitation Services in Muzaffarpur, Bihar36
for solid waste management. This implies the need of citizen awareness and mobilization at a large scale and in effective manner for better
management of solid waste generated in the city. The provisions of Solid Waste Management By-laws 2017 should be enforced effectively.
Provision of Toilets
Survey findings reflect a significant number of city households (24% in informal settlements) that still do not have their own household toilets. In informal settlements, 11 percent and in colonies, 1 percent households defecate in the open. It was revealed through another question that only 4 percent of toilets across the city have been constructed using the subsidy from Swachh Bharat Mission (Urban). These findings very clearly establish the need of extensive
efforts to improve uptake of SBM (Urban) and Mukhyamantri Sat Nischay Yojana. The data on the high ODF wards and other insights captured during survey, such as reasons for toilet construction not getting completed, may be very useful for strategizing a robust implementation mechanism. Lack of water inside toilets of 29 percent households may be co-related with the low proportion of households connected through municipal water supply.
Faecal Sludge and Septage Management
The city, while currently dependent upon on-site systems clearly needs a sewerage system in thelong run. The wards with high presence of pit latrines and other insanitary latrines would require specific attention, so that their adverse impacts on the environment is restrained. Fifty nine percent aware households with septic tanks that have never been cleaned
before emphasises the need to investigate the reasons in depth. Some of the reasons could be high prevalence of inappropriately designed collection tanks, lack of septage cleaning service providers, high cost etc. Another critical aspect about cleaning of septic tanks, which deserves immediate policy and enforcement intervention, is manual scavenging.
Waste Water Management
Disposal of wastewater i.e. grey water is mainly dependent upon open drains in Muzaffarpur. Around 80 percent of the households rely on open drains for disposal of wastewater generated from bathing and kitchen, while waste water from 15 percent households is disposed in open
areas. In informal settlements, wastewater of 32 percent households flows out in the open. City authorities should plan and implement a system of settled sewers or conventional sewerage system, taking into account the financial and technical feasibility.

Section 4: Conclusion, Recommendations and Way Forward 37
Water Supply
Only 27 percent of the households were found using piped water connection for drinking purpose during the survey. Major concerns about the municipal water emerged as poor quality and insufficiency of supplied water. There are concerns
about the quality of water from hand pumps as well, which are extensively used by households. The authorities should regularly check the quality of water supplied and endeavour to improve the coverage and increase the duration of water supply.
Redressal of Grievances
During the survey, the number of people registering complaints about different services was found to be very low. No instances of people using electronic media e.g. internet or mobile based SMS for registering complaints were found. The Government of Bihar passed Bihar Lok
Shikayat Nivaran Adhiniyamin 2016. Complaints regarding drinking water, sanitation, housing schemes, land encroachment, healthcare, social welfares schemes can be addressed under this act through online web portal, email, call canter and postal communication. There is a need to create awareness about this act.
The survey findings, summarized above enunciate a plethora of issues and challenges. However, for addressing these challenges with a planned approach, a much deeper dive into the facts, frameworks, constraints, best practices etc. is required in the future. Some of the points that may be taken forward by MMC and other stakeholders are given below:
Way Ahead
Community participation
Developing a framework to bring community yand citizen engagement at the centre of service delivery for all sanitation services at city and state level
Some of the ways in which MMC and yother program implementing agencies can enhance the community participation are described below:
Promoting citizen groups to play key �role in service provisioning and program implementation.
Developing a deep understanding �of demand side aspects through participatory surveys before rolling out the programs.
Awareness through multi-platform �communication on new schemes, policies, rules, eligibility parameters and application modalities etc.
Continued communication to �comprehend concerns in case of low buy-in from the community.
Taking feedback on effectiveness of �programs to inform policy at different levels of governance.
Partnering community based �groups and organization for maintenance of infrastructure assets like toilets.
Sanitation for All: An Assessment of Sanitation Services in Muzaffarpur, Bihar38
Implementing provisions of Bihar yNagarpalika Ward Samiti (Samudaik Bhagidari) Niymawali 2013 to improve community participation in governance in accordance with the spirit of 74th Constitutional Amendment Act.
Use of citizen centric data in program implementation
The present study lays down a strong yfoundation of community-generated data in the city that may be used to build an ecosystem of evidence based planning and implementation of development programs. Regular communication with the citizens is key to success of development programs. The citizen centric data should be brought into mainstream to completely change the existing paradigm of program implementation at city and state level. The data captured in a participatory manner should be shared with the community and validated before put in use.
Planning and implementation to fulfil infrastructure provisioning gaps
A comprehensive planning to augment yhousing with adequate facilities for all households of the city especially households of informal settlements.
Formulating and implementing housing yprojects under all 4 verticals of Pradhan Mantri Awas Yojana (Urban) and state level policy for housing.
Setting up systems and infrastructure for ysafe disposal of hazardous waste and sanitary waste
Strengthening solid waste collection and yroad sweeping facilities.
Understanding reasons and acting yaccordingly for IHHL construction under SBM (Urban) and Saat Nishchay program. Mobilising resources from high-net worth individuals and facilitating loan options for individual toilets should be explored. The mechanism of IHHT application, acceptance and disbursement etc. should be made robust with provisions of checking status of application.
Use of awareness campaigns to prevent yODF and encouragement for having own toilets in ODF prone areas will be very useful.
Detailed study to understand containment ytypes of household and public toilets. The environmental impact of improper collection tanks or septic tanks may be further studied for a long term planning of sewerage system for the city.
Planning and implementing an integrated yFSSM system, which addresses human aspect as well.
Planning a proper system for conveyance yand safe disposal of waste water (grey water) considering a long-term sustainability.
Strengthening the existing network of piped ywater supply to improve quality and quantity of water supplied.
Developing a robust system of addressing ycomplains, communicating status and resolution for all urban basic services.

d: References 39
references
Census of India (2011). Office of the Registrar General and Census Commissioner, India www.censusindia.gov.in/. ; accessed on 1 December, 2017.
Census of India (2011). Bihar Religion Census 2011. http://www.census2011.co.in/data/religion/state/10-bihar.html ; accessed on 28 August, 2018.
Census of India (2013). Primary Census Abstract
for Slums. www.censusindia.gov.in/2011-Documents/Slum-26-09-13.pdf.; accessed on 1 December, 2017.
Censusindia.gov.in. (2018). [online] Available at: http://censusindia.gov.in/2011census/dchb/1014_PART_B_DCHB_MUZAFFARPUR.pdf [Accessed 19 Sep. 2018].
Census 2011.co.in. (2018). Muzaffarpur City Population Census 2011 | Bihar. [online] Available at: https://www.census2011.co.in/census/city/165-muzaffarpur.html [Accessed 19 Sep. 2018].
Land Reforms | Welcome To Muzaffarpur District. Muzaffarpur.Nic.In, 2018, https://muzaffarpur.nic.in/departments/land-reforms/. Accessed 28 Aug 2018.
Ministry of Urban Development (2016). Primer on Faecal Sludge and Septage Management, Ministry of Urban Development, Government of India. http://
www.swachhbharaturban.in:8080/sbm/content/writereaddata/Primer%20on%20Faecal%20Sludge%20&%20Septage%20Management.pdf ; accessed on 1 December, 2017.
Ministry of Urban Development (2014). Guidelines for Swachh Bharat Mission (SBM), Ministry of Urban Development, Government of India, http://www.swachhbharaturban.in:8080/sbm/content/writereaddata/SBM_Guideline.pdf ; accessed on 1 December, 2017.
Gopalakrishnan, Seetha (2016). ‘Revised Septage Management Rules to be Implemented Across Bhubaneswar’, published in India Water Portal, May, 2016; http://sanitation.indiawaterportal.org/english/node/4616 ; accessed on 1 December 2017.
Alexander et. al, (2016). ‘Ending Open Defecation in India: Insights on Implementation and Behavioural Change for Swachh Bharat Abhiyan’; Princeton University; https://wws.princeton.edu/sites/default/files/content/India%20Workshop%20Report_FINAL_2.25.2016.pdf; accessed on 1 December, 2017.
Agarwal, Mayank (2016). ‘Forest land diversion for building community toilets gets green light’, published in Livemint on 15th November, 2016; http://www.livemint.com/Politics/arl4fn0UAV2kUHZAiYKfbI/Forest-land-diversion-

Sanitation for All: An Assessment of Sanitation Services in Muzaffarpur, Bihar40
for-building-community-toilets-gets-gr.html; accessed on 1 December, 2017.
Urban Development Department, Government of Maharashtra. ‘Making Cities Open Defecation Free: Systematic Approach in Maharashtra’; https://swachh.maharashtra.gov.in/Site/Upload/Pdf/SMUU.pdf; accessed on 1 December.
Gopalakrishnan, Seetha (2016). ‘Swachhta Status: Keeping Latrines Clean and Functional’, published
in India Water Portal, April, 2016; http://sanitation.indiawaterportal.org/english/node/4585 ; accessed on 1 December.
Manohari, Mayant (2016), ‘S-Corporation embarks on making best of waste’, published in Times of India on 16th June, 2016; https://timesofindia.indiatimes.com/City/Delhi/S-Corporation-embarks-on-making-best-of-waste/articleshow/52773672.cms ; accessed on 1 December, 2017.
Annex 1: Sample Survey Preparations and Training Programme 41
samPle sUrVey PreParations anD training Programme
Annex 1
10 https://www.dimagi.com/products/
Designing the Mobile Application
The sample survey is undertaken by our enumerators who visit specified (a section on sampling follows) sample houses, seek the required information and enter it into the application on their mobiles. Data is collected on CommCare10, an application designed and supported by Dimagi. CommCare allows users to code a questionnaire into the application, which is accessed and filled using android mobile phones. The application can be used offline (in areas where internet is not easily available) and is compatible with various languages, including Hindi. There are many advantages to using a smartphone and the CommCare software, some of which are detailed below:
(i) The process is resource and time efficient since no transcribing is required to be done. Data is immediately synced to a server, which makes remote access possible. Conducting the survey on mobiles allowed us to save huge quantities of paper helping with costs as well as efficiency. Data collected for the sample survey is accessed in Microsoft Excel using connections between excel and the server hosted by CommCare, and updated at the press of a button after which connected pivots and charts automatically refresh. Updated data can thus be accessed anywhere.
(ii) Certain validations, conditions, and skip logic can be built into the application, which prevent various types of mistakes and errors. This is an advancement over the use of paper-based surveys in numerous ways. For example, mobile numbers less than ten digits are not accepted by the application. Enumerators are also unable to skip questions that are considered compulsory. Deeply embedded skip logic is also present which presents different sets of questions depending on whether slums are being surveyed, or colonies.
(iii) In case of mistakes or errors being detected at later stages, the platform allowed for editing surveys at the back end.
(iv) All enumerators have unique user names and surveys are geo-tagged, which ensures proper monitoring, as well as the ability to represent information spatially. Other aspects monitored include the version of application used to ensure that no newer additions to the questionnaire are missed out, as well as the time taken to finish the survey, along with the actual time in which it was conducted. Any entries that do not fall within defined parameters are automatically flagged by the system for follow up.

Sanitation for All: An Assessment of Sanitation Services in Muzaffarpur, Bihar42
(v) The use of mobiles allows for photo capture, which our enumerators use to show ground realities as well as corroborate data they have filled.
(vi) Images are also used as part of questions which help enumerators and respondents achieve clarity. In our application, images include different types of toilets, water sources as well as outlets.
(vii) Questions and options can be updated at any time without effecting the analysis template or data filled earlier.
Most importantly, both enumerators and respondents found the process exciting and new. Many of them had never utilised a smartphone before and thus found this to be a form of personal development as well.
Procuring Handsets and SIM Cards
PRIA procured 15 smartphones for each city, ensuring the following minimum standards:
Smart phone operating at least Android yV.6.0 (Marshmallow)
Five-inch touch screen y
Battery size of 2800mah and above y
Multilingual support y
8 MP primary camera with autofocus and yflash
Equipped with Global Position System y(GPS) technology
Ram of 2GB or above y
Enumerators were to procure their own SIM cards before undertaking surveys. A 500mb plan per
user per month would allow for data syncing and GPS capture.
All users were given instructions on management and maintenance of instruments. Before handing them over to the supervisors and enumerators, all mobile sets were equipped with screen guards and a pouch. Users were also advised to ensure that the mobile sets are fully charged before they start the survey.
Letter of consent from municipality
Municipalities were briefed about the surveys and informed that the data would be shared with them. A letter of consent was also issued by the municipality, a copy of which was provided to all the enumerators and supervisors.
Training Programme
The questionnaire is part of a separate file which is a part of this folder.
A brief of the points covered in the training follow:
a) Introduction to the ECRC
The participants were introduced to the objective, process, methodology and the intended outcomes of the project.
b) Understanding water and sanitation services,
from the city’s perspective
The project being largely sanitation oriented, participants were given intensive education modules, which helped them understand the broader picture of water and sanitation services from the city’s perspective which then governed the shape of our research.

Annex 1: Sample Survey Preparations and Training Programme 43
c) Understanding the survey questionnaire The survey questionnaire was discussed in detail with the participants. Each section of the questionnaire was explained along with the logic behind the questions for the participants to understand clearly.
d) Introduction to smartphones Participants were introduced to the basics of using smartphones through which the surveys were to be undertaken. The smartphones were provided by PRIA, and were chosen based on predefined parameters. This training was necessary as many participants had not used a smart phone before. The training also focussed on the use of GPS, and how to ensure reliable and accurate readings.
e) Understanding the CommCare application The second stage of introduction to smartphones involved the participants exploring and running the CommCare app to understand its features and how to use it.
f) Understanding survey etiquette The workshop then moved to the ethics of data collection where participants were explained the etiquettes of survey collection and the importance of undertaking data with honesty.
g) Understanding sampling The following session explained the sampling methodology and the way in which households should be selected. Participants were introduced to the right-hand technique and skip-interval. Challenges in following the selection methodology were also outlined along with alternate solutions.
h) Field work simulation The participants were then acquainted with aspects of logistics, targets, expectations, selection of household, etcetera for field work. This was done through a group exercise, which aimed at familiarising the teams with nuances of the survey methodology.
i) Pilot testing Following this, participants were asked to go to their allocated field sites and practically try out the survey on field.
j) Experience sharing Experiential learning through the field was the basis of the next module, which was meant to discuss their learnings and observations. They were encouraged to speak about their experiences with the application, the level of comfort of the respondents and their attitudes, their use or misuse of rules of sampling and more.
k) Feedback session The sharing was then followed by one of the PRIA facilitators transferring all the data onto an excel sheet and explaining the possible mistakes or errors in the data collected. This session explained why it was important to understand the logic of questions and answers.
l) Mock interviews In this session, mock interviews were conducted to improve the participants’ interviewing skills. All the participants participated in ‘one to one’ interviews. Pairs were made and an observer sat through every interview. All the observers gave their feedback on each enumerator and highlighted areas of improvements.
m) Monitoring protocol and structure This session explained the levels of checks and balances kept at place to monitor the quality of surveys. The supervisors and survey administrators were introduced to the way the different components and stages of monitoring were to be done, the automated as well as the physical checks necessary and the consequent monitoring and approval required at each stage to ensure the quality of surveys.
n) Participant feedback This session concluded the workshop with some participants giving their feedbacks and overall experiences from the workshop.

Sanitation for All: An Assessment of Sanitation Services in Muzaffarpur, Bihar44
Most importantly, both enumerators and respondents found the process exciting and new. Many of them had never utilised a smartphone before and thus found this to be a form of personal development as well.
Procuring Handsets and SIM CardsPRIA procured 15 smartphones for each city,
samPle Plan for warD 45 (mUzaffarPUr)
Annex 2
sl. no.
name of area status Householdssample
size
1 Chuna Bhatthi Lane towards Durga Sthan, Mali Ghat Chowk Colony 150 6
2 Durga Sthan Mali Ghat chowk towards Bharat Mata Chowk Colony 85 3
3 Shivpuri Saiyed Colony Colony 115 5
4 Faiz Colony towards Murali Manohar Temple Lane Colony 135 5
5 Jail Campus towards Amarud Bagan Colony 175 7
6 Shishu Vatika and Shiv Shanker Prasad Lane Colony 110 4
7 Panikal Chowk Road; Halasa Kothi Lane Colony 195 8
8 Charch Road Colony 58 2
9 Dusadh Toli, Amarud Bagan Notified slum 41 2
10 Chandwara, Soda Godam Notified slum 138 6
11 Chandwara Panikal Road, Dhobi dom Basti Notified slum 20 1
12 Lakadidahi Anadbag Colony Notified slum 93 4
13 Hanumant Nagar Non-Notified Slum 56 2
total Households 1371 55
skip interval 1371/55=25


For more information contact PRIA 42, Tughlakabad Institutional Area New Delhi- 110062 Phone Nos.: +91-011-29960931/32/33 Email: [email protected]
This project is funded by the European Union
This project is implemented by PRIA
The contents of this publication are the sole responsibility of PRIA and can in no way be taken to reflect the views of the European Union
connect with us: www.pria.org pria.india PRIA_India
The sanitation survey in Muzaffarpur was undertaken by PRIA to generate citizen-led
data, with a focus on informal settlements (slums) and colonies in the city.
Data collection was undertaken as part of the Engaged Citizens, Responsive City project
supported by the European Union, which strengthens participation of the urban poor in
citywide planning and monitoring. In our efforts to establish a platform that allows all
residents to voice grievances, issues and aspirations and collectively develop strategies,
authentic and lucid data emerged as a crucial piece of the puzzle. The ward-level,
disaggregated data available in this report meets this need and provides information that
supports participatory planning.
The survey results will be of use to municipalities, parastatals, civil society organisations,
development agencies and engaged citizens working together to make Indian cities
responsive, inclusive and sustainable.
aBoUt tHe rePort


![Dainik Bhaskar Group Consolidates Presence In Bihar Launches 2nd Edition From Bhagalpur And Soon Launching Muzaffarpur And Gaya [Company Update]](https://img.pdfslide.net/doc/110x75/577cb3f51a28aba7118c3f06/dainik-bhaskar-group-consolidates-presence-in-bihar-launches-2nd-edition-from.jpg)