Embed Size (px)
Citation preview

(IJACSA) International Journal of Advanced Computer Science and Applications,
Vol. 10, No. 10, 2019
61 | P a g e
www.ijacsa.thesai.org
Scalable Data Analytics Market Basket Model for
Transactional Data Streams
Aaron A. Izang1, Nicolae Goga
2, Shade O. Kuyoro
3, Olujimi D. Alao
4, Ayokunle A. Omotunde
5, Adesina K. Adio
6
Department of Computer Science, School of Computing & Engineering Sciences, Babcock University, Ogun State, Nigeria1,2,3,4,5
Department of Basic Science, School of Science and Technology, Babcock University, Ogun State, Nigeria6
Abstract—Transactional data streams (TDS) are incremental
in nature thus, the process of mining is complicated. Such
complications arise from challenges such as infinite length,
feature evolution, concept evolution and concept drift. Tracking
concept drift challenge is very difficult, thus very important for
Market Basket Analysis (MBA) applications. Hence, the need for
a strategy to accurately determine the suitability of item pairs
within the available billions of pairs to solve concept drift
chalenge of TDS in MBA. In this work, a Scalable Data Analytics
Market Basket Model (SDAMBM) that handles concept drift
issues in MBA was developed. Transactional data of 1,112,000
were extracted from a grocery store using Extraction,
Transformation and Loading approach and 556,000 instances of
the data were simulated from a cloud database. Calibev function
was used to caliberate the data nodes. Lugui 7.2.9 and
Comprehensive R Archive Network were used for table pivoting
between the simulated data and the data collected. The
SDAMBM was developed using a combination of components
from elixir big data architecture, the research conceptual model
and consumer behavior theories. Toad Modeler was then used to
assemble the model. The SDAMBM was implemented using
Monarch and Tableau to generate insights and data visualization
of the transactions. Intelligent interpreters for auto decision grid,
selectivity mechanism and customer insights were used as metrics
to evaluate the model. The result showed that 79% of the
customers from the customers’ consumption pattern of the
SDAMBM preferred buying snacks and drink as shown in the
visualization report through the SDAMBM visualization
dashboard. Finally, this study provided a data analytics
approach for managing concept drift challenge in customers’
buying pattern. Furthermore, a distinctive model for managing
concept drift was also achieved. It is therefore recommended that
the SDAMBM should be adopted for the enhancement of
customers buying and consumption pattern by business ventures,
organizations and retailers.
Keywords—Association rule mining; big data analytics; concept
drift; market basket analysis; transactional data streams
I. INTRODUCTION
The exponential growth in the traditional transactional data made it imperative for businesses to take the lead in harnessing data in order to derive new insights for competitive advantage. In a bid to turn these insights into opportunities, business organizations are being challenged to review respective information management practices, break down organizational and data silos, and improve business collaboration which has led to the existence of sizably voluminous transactional data [1].
The process of classifying this voluminous transactional data has been a major challenge to the data mining community. This is due to the sreaming nature of transactional data thus, suffer from the same challenges associated with data streams such as concept drift, infinite length, feature evolution and, concept-evolution [2]. The infinite length refers to the continuous nature of transactional data streams whereby the amount of data has no bounds while concept-evolution is said to occur when new class evolves in a data stream. Feature-evolution is a recurrent process occurring in numerous streams as such as in mining text streams, where newer features (e.g. phrases or words) appear as the data stream increases and concept drift is a common phenomenon in data streams which occurs when the underlying concepts change [3].
Market basket analysis (MBA) is a data mining technique for analyzing the association of items that frequently occurs simultaneously from everyday buying and selling through the use of a transactional dataset. In order to promote the purchase of specific items together by controlling the stocks concurrently, and increasing the probability of purchasing, managers in a superstore can place item pair that are associated to the shelf beside them; thus, giving business organizations a better chance of profit-making by controlling the order of goods and marketing control. The rudimental conception in MBA helps to discover the item pairs associated in the store.
Concept drift in relation to the market basket is an attempt to study a customer‟s buying behavior by utilizing the exponential quantity of data stored by businesses to determine when there will be a change in the buyer‟s preference [4]. The aim of studying this is to allow the business organizations prepare for such occurrences thereby satisfying the customers and also help the business organization improve their revenue. In order to achieve this, a crude approach would have been to generate all item pairs from the transactional data streams in each market basket; store periodically and execute a suitable algorithm to find the most frequent item pairs. However, such a solution will be unrealistic in an environment where millions of market baskets contain billions of different item pairs. Static assumptions by training and testing Association Rule Mining (ARM) algorithms on a transactional dataset from the same population have been proposed. However, such an approach does not encourage the adaptiveness required in handling concept drift characteristics.
The focus of this work is on developing a scalable data analytics market basket model for a transactional data stream that can handle any size of data as well as provide real-time

(IJACSA) International Journal of Advanced Computer Science and Applications,
Vol. 10, No. 10, 2019
62 | P a g e
www.ijacsa.thesai.org
visualization of different transactions thereby presenting the trend in concept drift. The specific objectives are to (1) develop a Scalable Data Analytics Market Basket Model (SDAMBM) for Transactional Data Streams; (2) implement and evaluate the developed model.
II. RELATED WORKS
Author in [5] surveyed data mining algorithm for Market Basket Analysis in a bid to provide existing data mining algorithms for MBA. The research reveals that among the existing data mining algorithms surveyed Apriori algorithm was discovered to outperform others for association rule mining. Some of the drawbacks include the length of time taken to scan the database, and the multiplicity of scans creates additional work for the database search.
Author in [6] examined “Market basket analysis for a supermarket based on frequent item-set mining.” The study aimed to conduct an association rule mining for a superstore. Data were obtained from the transactional database of the store in Microsoft Excel spreadsheets and Microsoft Access databases. The K-Apriori algorithm was used on the database to pull out rules. The frequent item-sets and association rules were generated for those categories separately. The K-Apriori algorithm tries to find consumer behaviors in groups in other to selectively satisfy the specific group.
Author in [7] examined frequent pattern mining using Apriori ARM algorithm from an inventory database. The authors sought to identify the challenges of mining association rules among items in a large database that contains sales transactions used in understanding customer-buying behavior in other to improve the sales in a business venture. Apriori ARM algorithm was used to generate strong association rules from the inventory database. The algorithm was implemented using PHP and MySQL. Hence, due to the robustness of the system because of the large number of transactional datasets, there is a need for a hybrid ARM algorithm to be used for generating the strong association rule.
Author in [8] developed an Android Application for Searching and Shopping Based on Cloud. The objective was to design and develop an Android shopping application for Amravati city. The app helps to show offers and deals of a particular shopping mall and market locally within. The app was created as a three-tier architecture which has a backend, middleware, and frontend. The front end houses the Android mobile app which connects to the backend where the relational databased houses all the products through the middleware. The study made it possible for mobile users to be able to access shopping malls on their mobile phones through an android mobile app. The Application displays offer and also provide analytics to the seller to know the breakdown of all the products they are purchasing.
Author in [9] examined Market Basket Analysis in other to identify customer behaviors through the use of Transaction Data. The study actually examined the sales transactions of a particular company to better understand their customers. Furthermore the research implemented the apirori algorithm which had a support value of 1.78% and confidence interval of 46.69% as a desktop application which is capable of re-
logging the existing transactions to make predictions. The flaw of this work is that it considered only 30 rules which is not enough to create association rules.
It was however observed from the related works that most of the work did not consider the influence of using the amount of data in a transactional database usually have on the outcome. This, therefore, highlighted the need to use a large amount of data stored in the data store, in order to discover hidden associations as well as boost the confidence and support of association rules identified by influencing the outcome of the recommendations that will be given to customers thus the choice of big data analytics for this study. Also, the concept drift problem inherent with the transactional data in concert with Market basket analysis was not directly considered by any of the previous research. Hence this study tends to tackle the concept drift problem in data streams for market basket analysis by applying big data analytics to critical study each customer and provide a visualization of the transactions thereby solving the concept drift challenge.
III. METHODOLOGY
In this work, a semi-experimental methodological approach by way of software development and big data analytics technique was adopted to develop the required market basket analysis model for the transactional data stream. This method best suite this research which involved not only implementing a data analytics technique towards solving concept drift problem inherent in transactional data stream used for market basket analysis, but also performing some association rule mining as well as developing a scalable data analytics market basket model for transactional data streams. In other to achieve this, the following methodology was followed to build a data analytics market basket model for transactional data stream which is in line with the study objective.
In developing the SDAMBM for transactional data stream, the Elixir big data model, components of the conceptual model as well as the theoretical framework, were adopted to develop the model for this study, which helps to create measures and dimensions that are relevant for the proposed model. Calibev function algorithm was used to calibrate data nodes, and Toad Modeler was then used to assemble the model.
The data used for this study was collected from a University Superstore which comprises of One million, one hundered and twele thousand (1,112,000) transactions. Five hundred and fifty-six thousand (556,000) instances of the data was then uploded to Amazon RedShift Database online and simulated to represent the real time data stream of the transactions known as new transactions.
The data collection process for this study was done using the ETL approach (Data Extraction, Data Transformation, and Data Loading). At the extraction phase, only items like the snacks (bread and chips), drinks and bread spread item sets were exacted from the superstore transactional data. The data transformation was done using two methods; data cleaning which involves removing unwanted item pairs from the data and data blending which involves putting the data in a way it will be suitable to work with on the data mining tool used for the study.
(IJACSA) International Journal of Advanced Computer Science and Applications,
Vol. 10, No. 10, 2019
63 | P a g e
www.ijacsa.thesai.org
The implementation of the developed model was done following these procedures.
The simulated University superstore data on Amazon Redshift was streamed using the Tableau data analytics visualisation tool which was used to create the measures and dimensions for the customers transactions against the frequent items set generated (previous transactions) in methodology one to show the data visualization of the frequent items bought by the customer thereby determining if there will be a drift in the buying concept of the customers in feature.
Tableau was used to match the previous transactions with the new transactions coming from Amazon Redshift database online to show the drift in buying concept of the customers. The R stat feature in Tableau was used to generate statistical insights of the results visualization. This was evident in the visualization report for iViews, Concept Drift, extended effects and restock level of the itemsets analyzed.
Luigi, and CRAN were used to enhance table pivoting between the two datasets used for this study.
The outcome of the visualization which shows the iViews, Concept Drift, extended effects and restock level was exported to an HTML 5 enabled environment in, other to view the statistical report.
The data analytics visualization was evaluated using the following metrics: intelligent interpreters for Auto decision grid in restock level, consumption summary, concept drift, and extended effects. The selectivity mechanism was used to map specific customer profile against item_sets and descriptions. Evaluation of customer insights was viewed based on the overall consumption pattern summary embedded in the Hadoop panel on Tableau to select the appropriate attributes in the data that convene the required result.
A. Data Collection and Description
The dataset used for this research is the transactional data gotten from a university superstore. The data is compatible with both .csv, xlx, and .xlxs file formats. The data set contains 1,112,000 instances which is a representation of each transaction for the period of 24 months being January 01, 2017 to December 31, 2018. The dataset has labels for the training data that includes Invoice number, quantity of the items, the items sets, unit price, and transaction date. For the purpose of this work, the invoice number, unit price, and items label were used from the dataset that addresses market basket analysis which helps reflect the concept drift of each customer considering the instances of the transactions over time.
Furthermore, a domain dataset was gotten by simulating the University superstore online. A total of 556,000 instances of transactions was gotten from the simulation done and the dataset generated which helps this research study the customer buying behaviors. The simulated superstore transactional dataset were stored in the amazon redshift cloud database linked with the tableau big data visualization tool. Tableau was used in analyzing the concept drift of customers transactions, by studying the buying pattern from the
numerous items generated from the transactional data by matching the previous and new transactions together.
1) Identification of data sources variables: The study
adopted two primary data sources making use of the
selectivity mechanism of big data analytics which helps in
ensuring data protection. The sources are:
a) Domain Sources: these are the data source that comes
in streaming form, as customers are buying items stored in the
superstore.
b) Nominal Sources: this source of data variables
contains non-numerical values such as gender, occupation
among others. The nominal sources used for this data was
adapted from customer data profile gotten from the student
transactions performed through the simulated online
superstore in other to generate the online transactional data
streams. The variables used include students‟ transaction ID,
item set ID same with the items sets for the superstore data,
price, and transaction date.
2) Application of calibev and hovritz-thompson estimator:
Calibev and Hovritz-Thompson Estimator were both applied
to calibrate the simulated transaction data stream on the
simple random sampling without replacement (srswor)
distribution. This calibration was carried out through the use
of the Hadoop data panel on tableau visualizer as the data
analytic tool which helps to ensure that only accurate data is
processed. The Horvitz-Thompson estimator was applied to
help compute the simulated University store data streamed
online to run a predictive analysis.
a) Calibev Function: The Calibve function is a standard
method used to ensure the measurement produce accurate
results. The variable data used for calibration is customer
transactional data and the simulated customer data which were
used to create the indicators. Probability and the response
probabilities were computed.
The class size data frame (customers transactions is N = 556,000)
The variables are: Bread, Drinks, and Spread
The Element variables are: Unit tags as a,b,c,d,e,f and the price range variables that following the tags respectively are 100-600, 700-1200, 1300-1900, 2000-3500, 3600-5000, and above 5000. The selected bread, drink, spread and customer school profile variable (Transaction ID, Item sets ID, Price) are generated randomly using the uniform distribution. The stratification variables are the element variables. 150 was used as the sample stratum size, using the „srswor‟ (simple random sampling without replacement) method.
b) Horvitz-Thompson Estimator: The Horvitz-
Thompson estimator variant was used to compute customer
profile and compare the result with the calibration prediction
process. In other to obtain accurate result recommendation on
the conceptual drift of customer‟s transaction, the predictive
analysis was run
(IJACSA) International Journal of Advanced Computer Science and Applications,
Vol. 10, No. 10, 2019
64 | P a g e
www.ijacsa.thesai.org
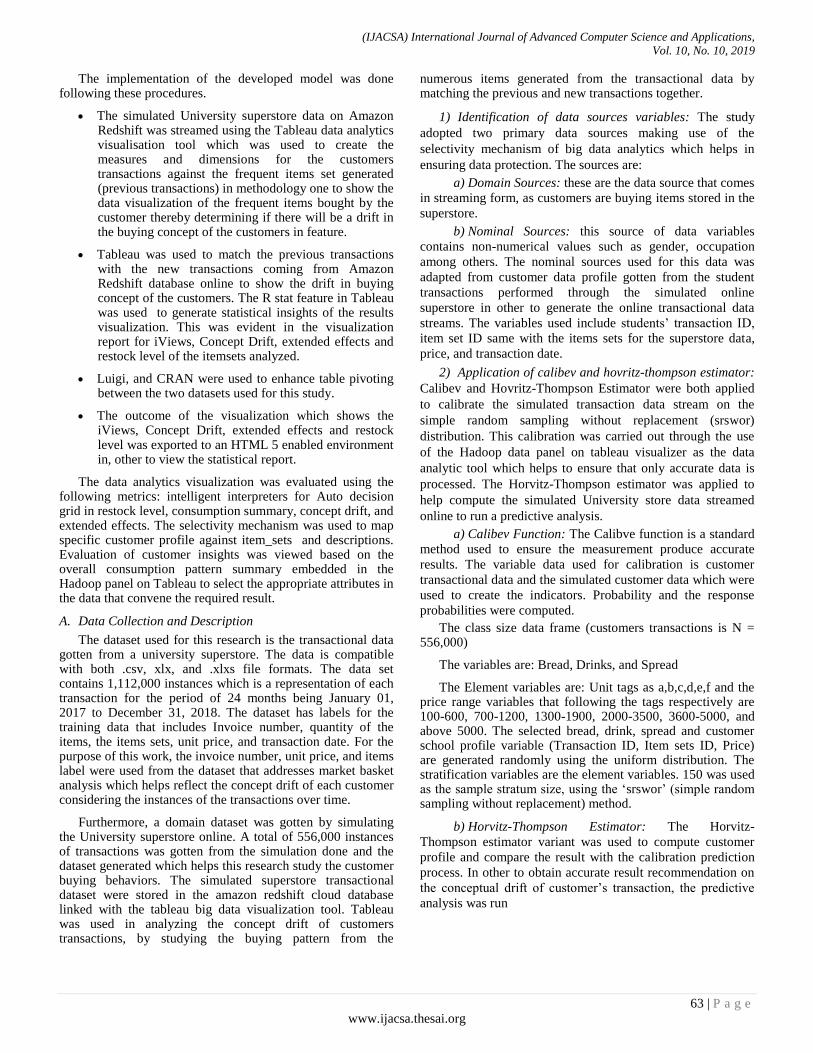
B. The Elixir Big Data Architectural Framework
This study adopted a modified layered Elixir big data analytics Architecture towards solving the concept drift problem of transactional data in Market Basket Analysis. There are six layered that were adapted from the elixir architecture as against the seven layers present in the architecture. The layers incorporated are as follows: Data Ingestion layer, Data collection layer, Data processing layer, and Data storage layer. The data ingestion layer and data collection layer combined to form the data Pipelining layer as seen in Fig. 1.
1) Data ingestion layer: The data coming in from various
data source are being prioritized in the database. This data
come in both batches for example, the one residing in the
database and the stream data (customer profile, and spending
behaviors) that comes in as customers perform transactions.
Both data come in the .xlxs format of Microsoft Excel which
is an acceptable data format in Hadoop data panel feature
found in Tabluea.
2) Data pipelining layer: After ingesting the data, the
collector layer will collect the data and creates data pipelines
that will orchestrate the transformation and movement of data
from the various sources till it gets to the final destination for
processing. Each step in this study made use of a separate
solution software. Luigi version 3.7 was used as the pipeline
scheduler to build a complex batch of data pipelines. It is also
used for table pivoting, management of workflows, handling
filed processes and visualization.
3) Data processing layer: The pipelined data were routed
to different destinations, and the respective data flows were
classified using the data model from the semantic library. For
example, the different transactional data gotten from the
superstore are used to predict the customer‟s concept drift by
appending it to the customer profile data streams at various
levels. This routing is meant to interface with big data
analytics visualization of each instance of the transactions
towards predicting customer concept drift in market basket
analysis.
4) Data storage layer: In this layer, the University
superstore transactional data stream which was collected that
comprises of 1,112,000 instances of the transaction which was
too lager to store in external storage hence the need to employ
a cloud database. The cloud platform used in this layer is
Amazon Redshift and Amazon Kinesis which store the data in
the MySQL relational database. The data stored in the
database also include streamed data of customer‟s profile of
over 556,000 instances which contains their buying pattern
simulated online.
C. The Scalable Data Analytics Market Basket Model
(SDAMBM) for Transactional Data Stream
The data analytics model for modelling customer behavior was modelled by adopting some components of the Elixir layered big data model and some components of the research conceptual model is as shown in Fig. 2. The model helps in defining the dimensions and measures used in the design of
the Scalable Data Analytics Market Basket Model (SDAMBM) for processing transactional data streams. The design was done by curating the different dimensions adapted from the Elixir and the research conceptual model. The curation process involves adding filters to the chosen dimension which form part of the Business management visualization layer. The SDAMBM for transactional data streams was designed using a combination of Toad Modeler, Corel Draw and CRAN for customer management towards solving concept drift problem of transactional data streams in market basket analysis.
1) Business management visualization: this section
curates intelligent visualization method adopted from Elixir
model and some features of the adopted consumer behavior
theorems. This therefore gives business organizations the
ability to use big data analytics method to boost customer
retention in market basket analysis thus solving concept drift
problems.
2) Interoperability: helps improve analytics processing of
transactional data streams data in retail marketers. Luigi
version 3.7 an interoperation software was used in monitoring
concept drift of customers by studying their buying pattern in
market basket analysis across a variety of analytics
processing.
3) Big data analytics: this platform was designed to allow
the University superstore utilize big data processes in studying
their customer's buying pattern. The platform creates a
customer management results thereby helping top
management to support decision making in managing the
relationship that exists between their customers. Big data
analytics inventory tools were used to analyze transactional
data stream to produce reports thereby help in taking
improved business decisions.
4) Customer management strategies: This platform helps
in improving the relationship between the customers and the
business ventures by studying the buying pattern in the
concept drift of the customer‟s transactions, help institutional
research by accreting the extent a customer‟s consumption
affects his academics and health which is known as extended
effects of concept drift, solved using big data analytics.
Fig. 1. Remodified Elixir Big Data Architecture Framework for the
Transactional Data Stream Adapted from (Source: [10]).
(IJACSA) International Journal of Advanced Computer Science and Applications,
Vol. 10, No. 10, 2019
65 | P a g e
www.ijacsa.thesai.org
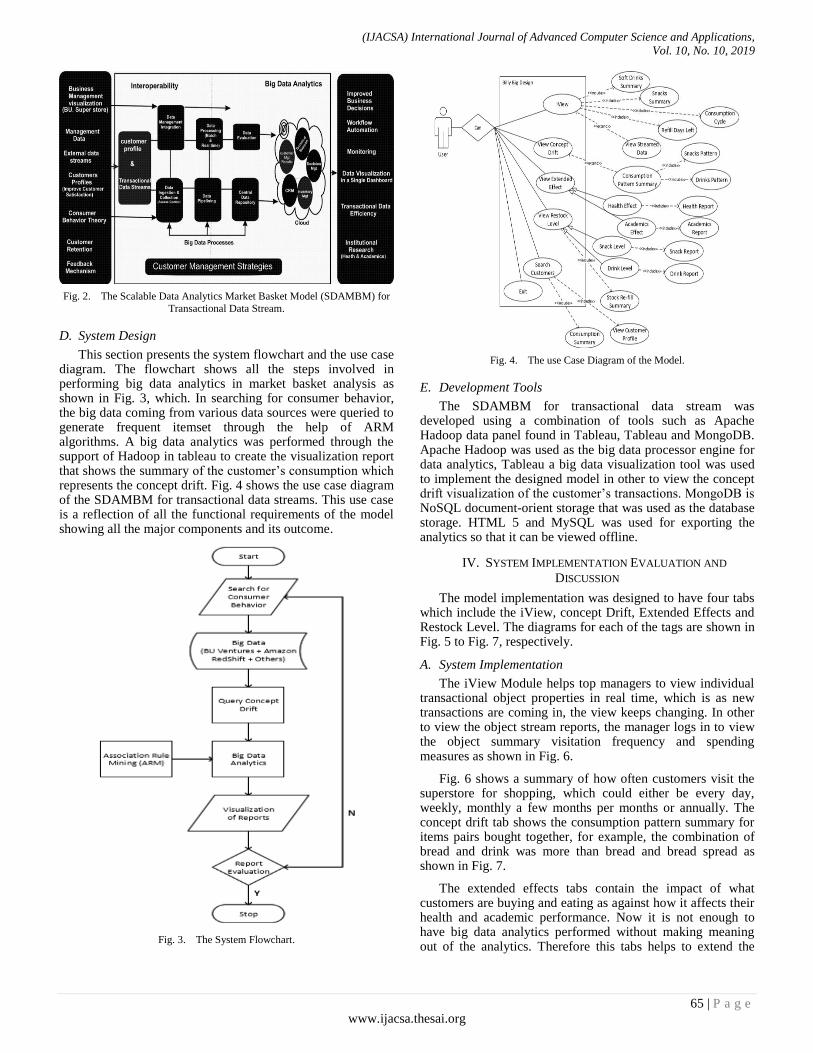
Fig. 2. The Scalable Data Analytics Market Basket Model (SDAMBM) for
Transactional Data Stream.
D. System Design
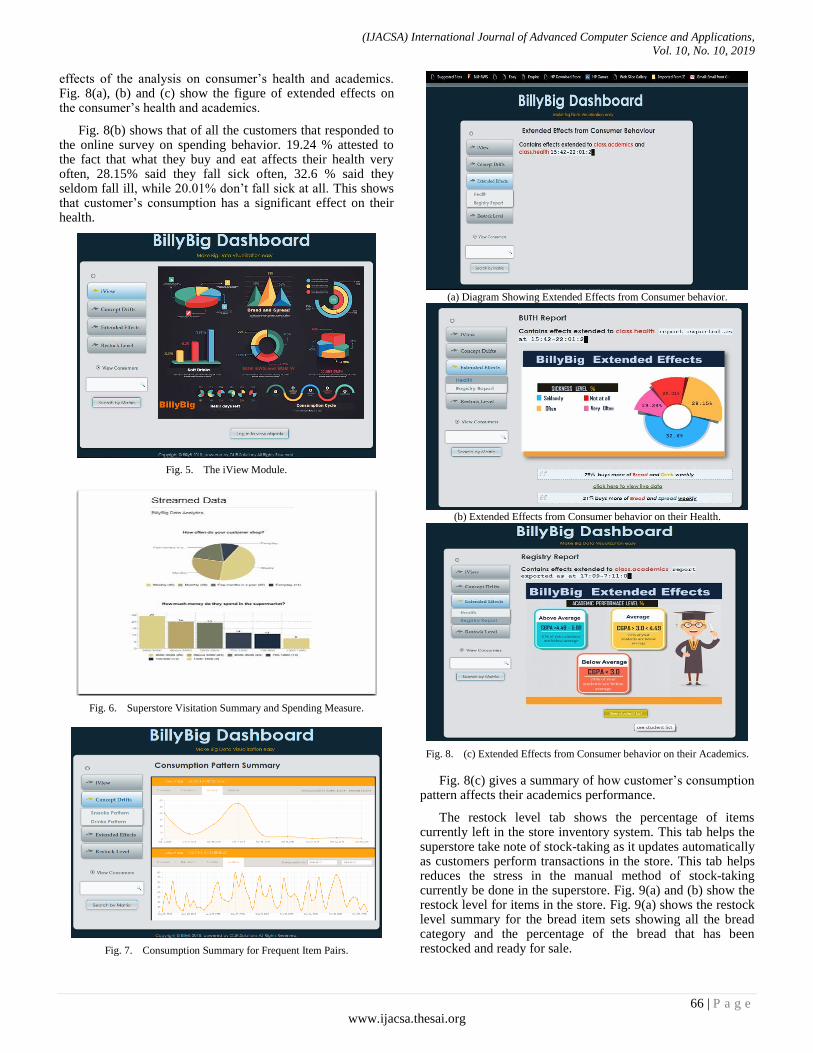
This section presents the system flowchart and the use case diagram. The flowchart shows all the steps involved in performing big data analytics in market basket analysis as shown in Fig. 3, which. In searching for consumer behavior, the big data coming from various data sources were queried to generate frequent itemset through the help of ARM algorithms. A big data analytics was performed through the support of Hadoop in tableau to create the visualization report that shows the summary of the customer‟s consumption which represents the concept drift. Fig. 4 shows the use case diagram of the SDAMBM for transactional data streams. This use case is a reflection of all the functional requirements of the model showing all the major components and its outcome.
Fig. 3. The System Flowchart.
Fig. 4. The use Case Diagram of the Model.
E. Development Tools
The SDAMBM for transactional data stream was developed using a combination of tools such as Apache Hadoop data panel found in Tableau, Tableau and MongoDB. Apache Hadoop was used as the big data processor engine for data analytics, Tableau a big data visualization tool was used to implement the designed model in other to view the concept drift visualization of the customer‟s transactions. MongoDB is NoSQL document-orient storage that was used as the database storage. HTML 5 and MySQL was used for exporting the analytics so that it can be viewed offline.
IV. SYSTEM IMPLEMENTATION EVALUATION AND
DISCUSSION
The model implementation was designed to have four tabs which include the iView, concept Drift, Extended Effects and Restock Level. The diagrams for each of the tags are shown in Fig. 5 to Fig. 7, respectively.
A. System Implementation
The iView Module helps top managers to view individual transactional object properties in real time, which is as new transactions are coming in, the view keeps changing. In other to view the object stream reports, the manager logs in to view the object summary visitation frequency and spending measures as shown in Fig. 6.
Fig. 6 shows a summary of how often customers visit the superstore for shopping, which could either be every day, weekly, monthly a few months per months or annually. The concept drift tab shows the consumption pattern summary for items pairs bought together, for example, the combination of bread and drink was more than bread and bread spread as shown in Fig. 7.
The extended effects tabs contain the impact of what customers are buying and eating as against how it affects their health and academic performance. Now it is not enough to have big data analytics performed without making meaning out of the analytics. Therefore this tabs helps to extend the
(IJACSA) International Journal of Advanced Computer Science and Applications,
Vol. 10, No. 10, 2019
66 | P a g e
www.ijacsa.thesai.org
effects of the analysis on consumer‟s health and academics. Fig. 8(a), (b) and (c) show the figure of extended effects on the consumer‟s health and academics.
Fig. 8(b) shows that of all the customers that responded to the online survey on spending behavior. 19.24 % attested to the fact that what they buy and eat affects their health very often, 28.15% said they fall sick often, 32.6 % said they seldom fall ill, while 20.01% don‟t fall sick at all. This shows that customer‟s consumption has a significant effect on their health.
Fig. 5. The iView Module.
Fig. 6. Superstore Visitation Summary and Spending Measure.
Fig. 7. Consumption Summary for Frequent Item Pairs.
(a) Diagram Showing Extended Effects from Consumer behavior.
(b) Extended Effects from Consumer behavior on their Health.
Fig. 8. (c) Extended Effects from Consumer behavior on their Academics.
Fig. 8(c) gives a summary of how customer‟s consumption pattern affects their academics performance.
The restock level tab shows the percentage of items currently left in the store inventory system. This tab helps the superstore take note of stock-taking as it updates automatically as customers perform transactions in the store. This tab helps reduces the stress in the manual method of stock-taking currently be done in the superstore. Fig. 9(a) and (b) show the restock level for items in the store. Fig. 9(a) shows the restock level summary for the bread item sets showing all the bread category and the percentage of the bread that has been restocked and ready for sale.

(IJACSA) International Journal of Advanced Computer Science and Applications,
Vol. 10, No. 10, 2019
67 | P a g e
www.ijacsa.thesai.org
Fig. 9(b) shows the percentage of each bread category been sold as at the time of this analysis. Doing this help the inventory officer knows at what time they need to restock a particular item.
Fig. 10 shows the summary of an individual consumer consumption pattern, indicating which items pairs were frequently bought by the consumer and how much the consumer contributes to the revenue of the superstore in percentage. This analysis also shows how much an individual customer spends on the average per month.
(a) Showing the Restock Level Summary for Bread.
Fig. 9. (b) The Percentage of Bread Sold.
Fig. 10. Individual Consumer‟s Consumption Summary.
B. Evaluation of the Scalable Data Analytics Market Basket
Model
In evaluating the designed model, three standard evaluation matrices; intelegent interpreters for Auto decision grid, The selectivity mechanism and customer insights available in tableau were used as the evaluation method.
The intelligent interpreters for Auto decision grid was evaluated in restock level, and extended effects on academic performace and extended effects on health status as shown in Fig. 9(a) and (b), and Fig. 8(a), (b) and (c). The selectivity mechanism was used to map specific customer _sets IDs profile agaisnt item and descriptions as shown in Fig. 10. Evaluation of customer insigts was viewed based on the overall consumption pattern summary embedded in Hadoop platforms to select the appropriate attributes in the data that convene the required result as shown in Fig. 7. Also Customer insights can be evaluated by querying the analysis with questions not directly linked to the transactional data. This helps to display thing such as major drink bought by males, the effect of customer‟s consumption on their health, how the customer consumes what they buy. These are the primary evaluation done on the scalable data analytics market basket model designed.
C. Discussion of Findings
The results from the model implementation done using Tableau shows that the SDAMBM for transactional data streams, was able to accurately study the customer consumption pattern over time. These was done towards solving the concept drift problem inherent in the transactional data stream. This study verifies the submission of [9]. Regarding considering consumer behavior theories, which recognize four factors that contribute to the reason why customers purchase the items in a particular shop. This study verified the four-factor and expanded on things that can cause a changed of behavior by a consumer using two main consumer behavior theories (reasoned action and the planned behavior theories) which were not used in [9] study. Previous studies such as [4] and [2] that tried to handle concept drift problems, did not attribute it to market basket analysis; instead, they only decided to solve the problem in stream mining applications. However, this study solved the concept drift problem in concert to MBA which deals with understanding customer‟s behavior concerning their purchase. Therefore the study discovered that in other to solve concept drift problems in MBA, it is imperative to use an enormous amount of transactional data stream of customers over a very long period. The data will help in predicting the customers buying pattern whether there will be a drift or it will remain the same. This study also agrees with [11] which insist on increasing the number of transactions in other to be able to predict customers buying behaviors. The study of [12] also corroborates with this study by using big data analytics tools such as spark to study customer‟s behaviors in MBA but did not consider visualization of the transactions.
In solving this concept drift issue in MBA, multiple sources of data were used to feed the data analytics market basket model to be able to visualize the concept drift of customers transactions throughout a period of two year. The

(IJACSA) International Journal of Advanced Computer Science and Applications,
Vol. 10, No. 10, 2019
68 | P a g e
www.ijacsa.thesai.org
BillyBig data visualizer showed not only the customer's consumption pattern, but also the effects of the consumption on the health and academics status of the consumers through the customer profile data stream streamed online. These data served as new transaction stored on Amazon RedShift, the previous transactional data stored on MySQL and other data sources used in this study.
V. CONCLUSION AND RECOMMENDATION FOR FURTHER
STUDY
This study, in general, provided a data analytics strategy for managing drift in the buying concept of customers, hence help improve the customers shopping experience as well as help the superstore retain their customers. This is enhances monitoring the buying pattern of the customers. The study focused on implementing a scalable data analytics market basket model for transactional data Streams through the use of big data analytics. The study looked critically into the problems inherent in transactional data streams and solved the concept drift problems in MBA. This was done by studying customers buying pattern, and making predictions to determine if there will be a drift in the buying concept or they will continue to purchase the same item set as the case may be.
Furthermore, in solving the concept drift problem, transactional data was gotten from the University superstore that covers the period of two years (January 2, 2017, to December 31, 2018), and simulated University store streamed data from customer‟s transactions online was also used. However, in monitoring the concept drift of consumers, the selectivity mechanism was applied to aggregate the data source for the sake of data protection. Also, the data sets were calibrated, using the calibration function algorithm before the data analysis an evaluation process was done.
A Scalable data Analytics Market Basket model (SDAMBM) for transactional data streams were designed to interact and interface with the University superstore through the management of the superstore. The model provides a generalized view of customer transactions as well as a personalized view through the BillyBig data visualization dashboard designed using Tableau analytics tool. A consumption pattern summary of all customers can be viewed as well as the extended effects of what customers consume on their health and academic performance. This helps in giving the big data analysis meaning. The analysis also has a restock level which tells the University super stock the level of goods remaining in the inventory system so as for them to know when to restock a particular item.
The customer management model was designed in other to harness the concept drift of customers from their consumption pattern generated from the data gathered and analyzed. Thereby helping to strengthen the relationship between the customers and the University superstore.
This research contributed to the existing body of knowledge by providing a scalable data analytics market basket model for transactional data stream and a more efficient method for effective concept drift management of customer‟s transactional data streams in market basket
analysis. These thereby contributes to the methodological discourse on the development of big data analytics platforms for predicting concept drift of transactional data in market basket analysis using previous and current transactions.
Future research can investigate the possibility of providing big data analytics from other data sources such as monitoring health history from customer‟s consumption pattern and inform the customers through a Hospital to take note of the consumption behaviors. Also, the research can link what the customers buy from other stores within the University campus, such as the cafeteria and hall of residence. Forecasting and predictions can also be done using future dimensions from the dataset provided.
REFERENCES
[1] Rick F. van der Lans, (2012) in Data Virtualization for Business Intelligence Systems, A volume in MKSeries on Business Intelligence Published by Elsevier, retrieved fromhttps://www.sciencedirect .com/book/978012394425data virtualization-for-business intelligence-systems.217-229, ISBN: 978-0-12-394425-2 DOI:https://doi.org/10. 1016/C2011-0-07129-6.
[2] Gajbhiye, P. R., & Vaidya, S. G. (2016). Classification and Adaptive Novel Class Detection of Feature-Evolving Data Streams. International Journal of Engineering Research and General Science, 4(3), 616-622.
[3] Masud, M. M., Chen, Q., Khan, L., Aggarwal, C. C., Gao, J., Han, J., Oza, N. C. (2013). Classification and Adaptive Novel Class Detection of Feature-Evolving Data Streams. IEEE Transactions on Knowledge and Data Engineering, 25(7), 1484-1497.
[4] Ojugo, A.A, & Eboka, A.O (2018). Modeling the Computational Solution of Market Basket Associative Rule Mining Approaches using Deep Neural Network. Digital Technologies, 3(1), 1-8.
[5] Dhanabhakyam, M., & Punithavalli, M. (2011). A Survey on Data Mining Algorithm for Market Basket Analysis. Global Journal of Computer Science and Technology, XI(11), 13-21. Retrieved Feburary 8, 2017.
[6] Annie, L., & Kumar, A. (2012). Market Basket Analysis for a Supermaket Based on Frequent item Mining. International Journal of Computer Science, 6(5), 34-43. Retrieved January 10, 2017
[7] Adewole, K., Akintola, A., Ajiboye, A., & Abdulsalam, S. (2014). Frequent pattern and association rule mining from inventory database using apriori algorithm. African Journal of Computing & ICT, VII(3), 35-42.
[8] Deshmukh, H., Ankit, R., Lalit, V., Dhiraj, G., & Rahil, K. (2016). Android Application for Searching and Shopping Based on Cloud. International Journal Of Pure And Applied Research In Engineering And Technology, 4(9), 1368-1374.
[9] Kurniawan, F.; Umayah, B.; Hammad, J.; Mardi, S.;Nugroho, S.; & Hariadi, M. (2018) Market Basket Analysis to Identify Customer Behaviors by Way of Transaction Data, Knowledge Engineering and Data Science (KEDS), Vol 1, No 1, pp. 20–25, ISSN 2597-4602.
[10] Gill, N.S., (2017), Data Ingestion, Processing and Architecture layers for Big Data and IoT, retrieved from https://www.xenonstack .com/blog/big-dataengineering/ingestion processing-big-data-iot stream/, accessed 12/10/2018.
[11] Phani, P., & Murlidher, M. (2013). A Study on Market Basket Analysis Using a Data Mining Algorithm. International Journal of Emerging Technology and Advanced Engineering, III(6), 361-363. Retrieved from www.ijetea.com.
[12] Woo, J. (2015). Market Basket Analysis using Spark. ARPN Journal of Science and Technology, V(4), 207 209.


![Discovering Spatial Weighted Frequent Itemsets in … · 2020. 4. 1. · applications of WFIM include market-basket analytics [5], spectral signature analytics in astronomical databases](https://img.pdfslide.net/doc/110x75/603e3a13d2627b4a7243b247/discovering-spatial-weighted-frequent-itemsets-in-2020-4-1-applications-of.jpg)