Embed Size (px)
DESCRIPTION
More good news for QR codes!
Citation preview
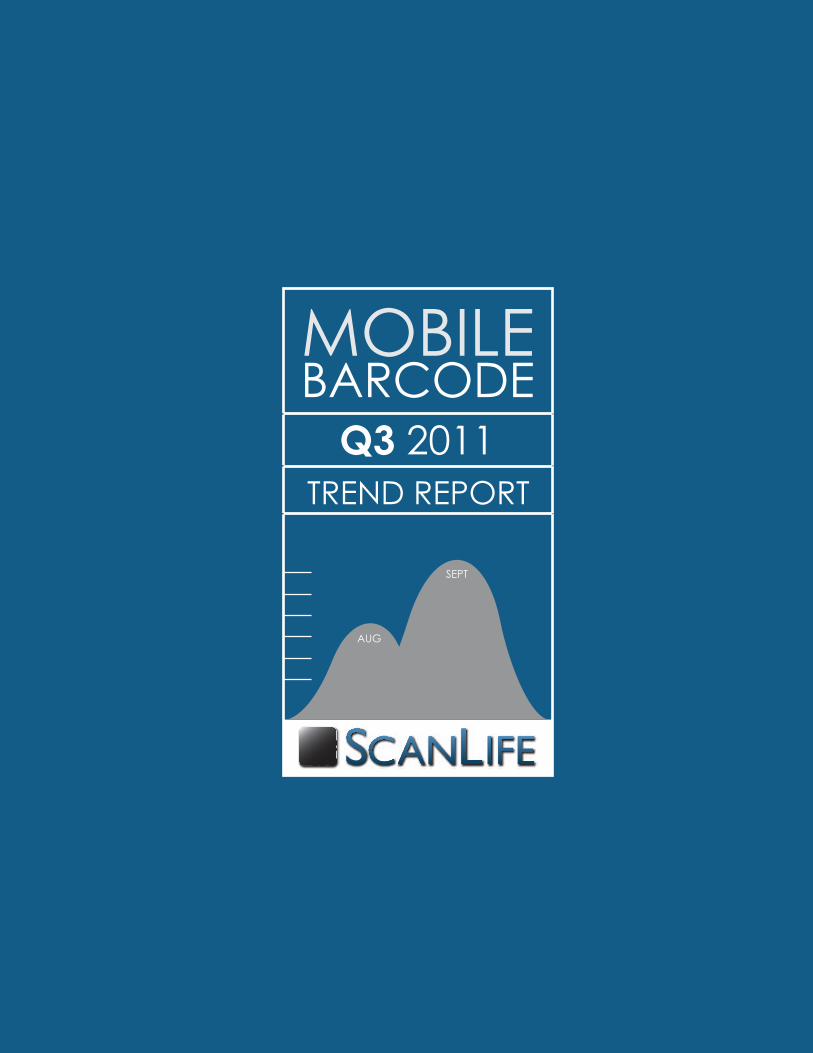
MOBILE
Q3 2011TREND REPORT
BARCODE
AUG
SEPT
p2
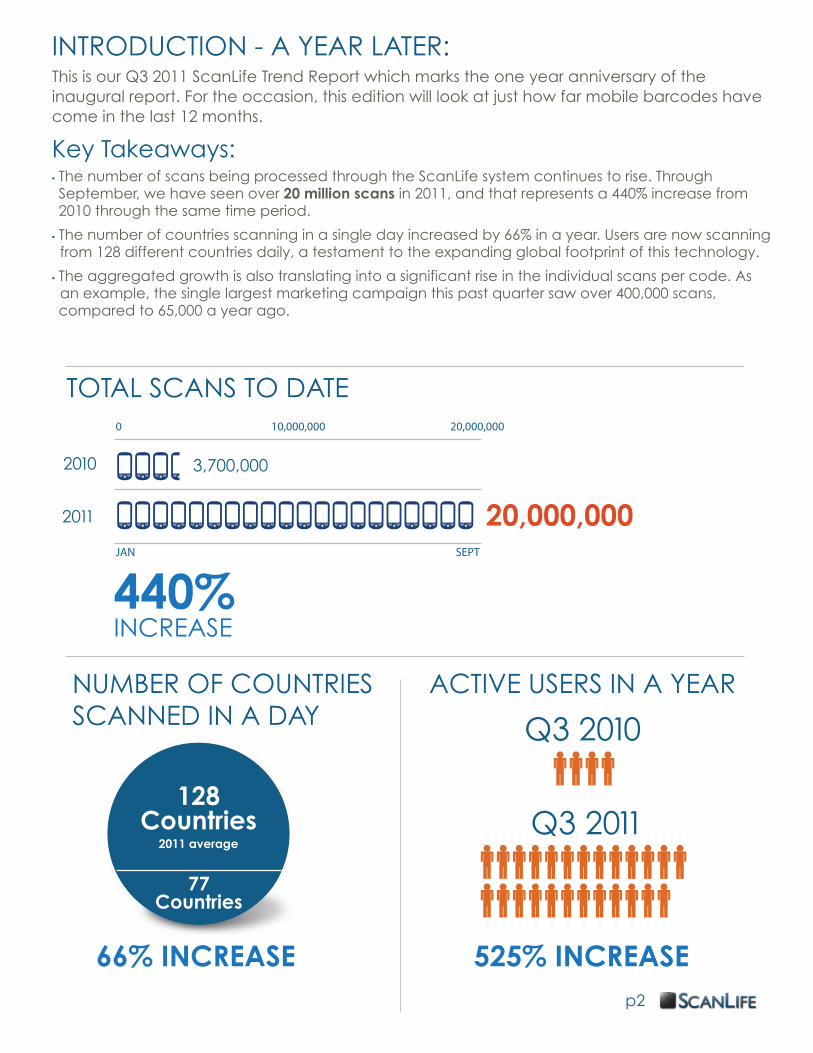
NUMBER OF COUNTRIES SCANNED IN A DAY
ACTIVE USERS IN A YEAR
66% INCREASE 525% INCREASE
128 Countries
2011 average
77 Countries
Q3 2010
Q3 2011
INTRODUCTION - A YEAR LATER:This is our Q3 2011 ScanLife Trend Report which marks the one year anniversary of the inaugural report. For the occasion, this edition will look at just how far mobile barcodes have come in the last 12 months.
Key Takeaways:• The number of scans being processed through the ScanLife system continues to rise. Through September, we have seen over 20 million scans in 2011, and that represents a 440% increase from 2010 through the same time period.
• The number of countries scanning in a single day increased by 66% in a year. Users are now scanning from 128 different countries daily, a testament to the expanding global footprint of this technology.
• The aggregated growth is also translating into a significant rise in the individual scans per code. As an example, the single largest marketing campaign this past quarter saw over 400,000 scans, compared to 65,000 a year ago.
Q3 2010:
Q3 2011:
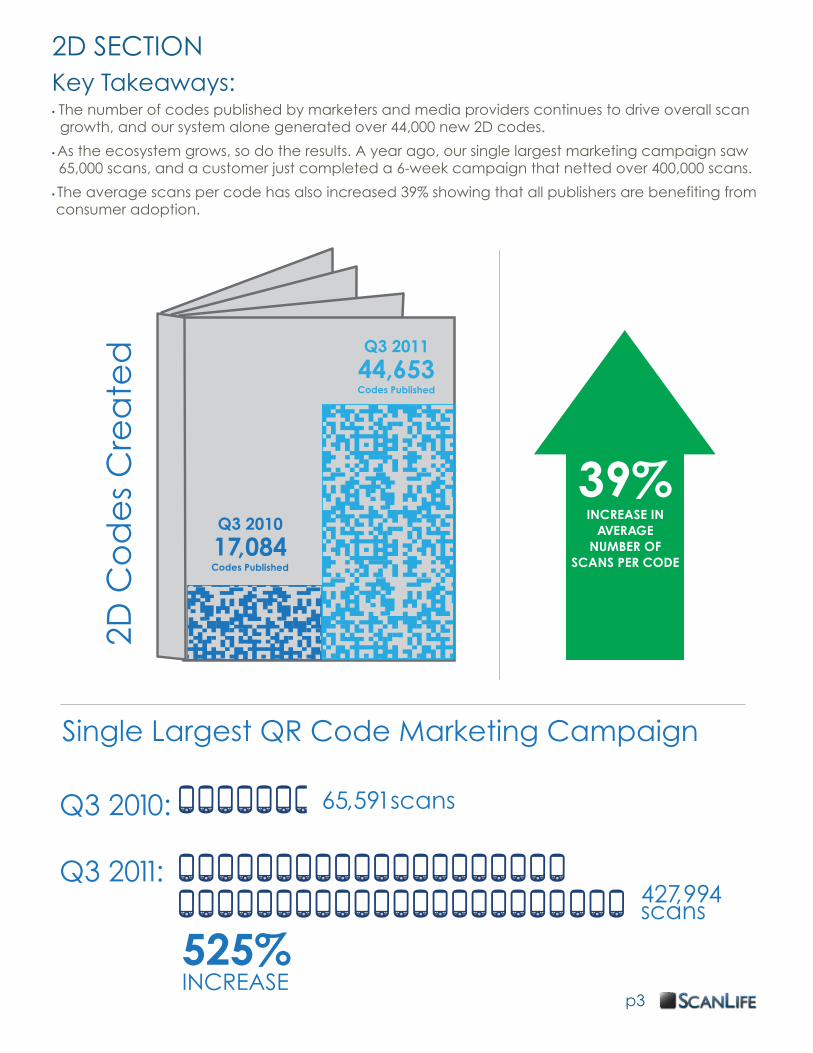
39%INCREASE IN
AVERAGENUMBER OF
SCANS PER CODE
Q3 2010
17,084Codes Published
Q3 2011
44,653Codes Published
427,994scans
65,591scans
Single Largest QR Code Marketing Campaign
2D C
od
es
Cre
ate
d
525% INCREASE
2D SECTIONKey Takeaways:• The number of codes published by marketers and media providers continues to drive overall scan growth, and our system alone generated over 44,000 new 2D codes.
• As the ecosystem grows, so do the results. A year ago, our single largest marketing campaign saw 65,000 scans, and a customer just completed a 6-week campaign that netted over 400,000 scans.
• The average scans per code has also increased 39% showing that all publishers are benefiting from consumer adoption.
p3
Grocery
0 500,000 1,000,000
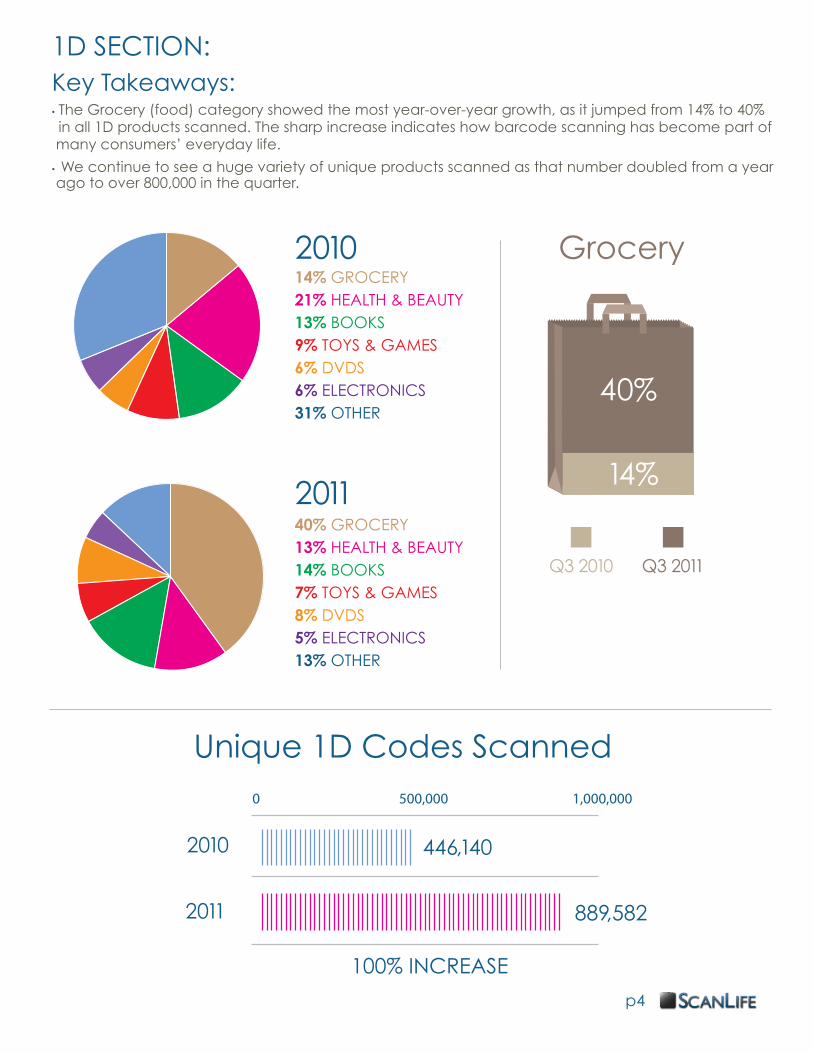
Unique 1D Codes Scanned
2010
2011
100% INCREASE
889,582
446,140
Q3 2010 Q3 2011
40%
14%
p4
2010
2011
14% GROCERY21% HEALTH & BEAUTY13% BOOKS9% TOYS & GAMES6% DVDS6% ELECTRONICS31% OTHER
40% GROCERY13% HEALTH & BEAUTY14% BOOKS7% TOYS & GAMES8% DVDS5% ELECTRONICS13% OTHER
1D SECTION:Key Takeaways:• The Grocery (food) category showed the most year-over-year growth, as it jumped from 14% to 40% in all 1D products scanned. The sharp increase indicates how barcode scanning has become part of many consumers’ everyday life.
• We continue to see a huge variety of unique products scanned as that number doubled from a year ago to over 800,000 in the quarter.
p5
+5%
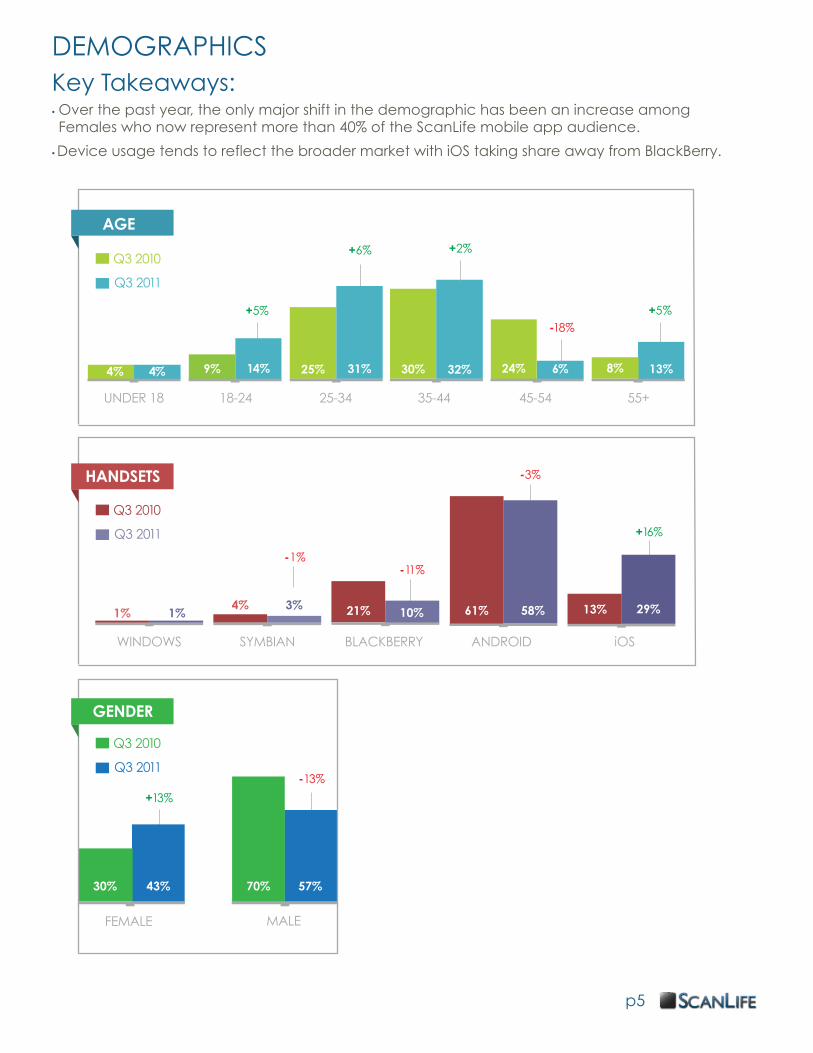
70% 57%30% 43%
8%
-1%
+13%
+16%
+6%
-3%
-11%
-13%
+2%
-18%
AGE
FEMALE
Q3 2010
Q3 2011
MALE
HANDSETS
GENDER
BLACKBERRYWINDOWS ANDROIDSYMBIAN
29%13%
Q3 2010
Q3 2011
Q3 2010
Q3 2011
1%
UNDER 18 18-24 25-34 35-44 45-54 55+
1%4% 3%
10%21% 61% 58%
iOS
4% 9% 25% 24%31% 32%30%4% 14% 6% 13%
+5%
DEMOGRAPHICSKey Takeaways:• Over the past year, the only major shift in the demographic has been an increase among Females who now represent more than 40% of the ScanLife mobile app audience.
• Device usage tends to reflect the broader market with iOS taking share away from BlackBerry.
p6
NOTES ON THE DATAThe data in this report was pulled from the ScanLife Reporting Platform. It represents traffic from both two-dimensional (2D) barcodes and UPC barcodes. The 2D barcodes scanned may have been generated on the ScanLife Platform, or from 3rd party generators.
Contact Us: Create your own account at www.scanlife.com or contact us with questions at [email protected]
Scan our Custom Menu code to connect with ScanLife.