Embed Size (px)
Citation preview
Scheduli~ng Guide&For Program Managers
_DTIC- LECT EUG 25,1
426984 MOQ~ ~
94 8 24 060Defense Systems Management College Press
Fort Belvoir, Virginia 22060-5565
SCHEDULINGGUIDE
FORPROGRAM
MANAGERS
May 1994
PUBLISHED BY THEDEFENSE SYSTEMS MANAGEMENT COLLEGE PRESS
FORT BELVOIR, VA 22060-5565
PREFACE
This guide provides an introduction to scheduling. It is the second version of a 1986publication prepared by Mr. David D. Acker, Mr. J. Stanley Baumgartner and Mr. MichaelB. Patterson. The 1994 revision was developed by Mr. William W. Bahnmaier and Mr. PaulT. McMahon. Ms. Christine Royer retyped the manuscript, and Mr. Gregory Caruth andMs. Deborah Gonzalez provided the charts and graphs. Editing was performed by Mrs.Esther M. Farria and Ms. Alberta Ladymon and printing by Mr. Robert W. Ball of theDefense Systems Management College (DSMC) Press.
Aooes.siOn For
D•iO TAB0u una nou nc ed 0
Distribution/ .. •
Availability Codes
Iveil azd/orMast Speoila
iii
TABLE OF CONTENTSPAGE
Preface .......................................................................................................................................... iii
Chapter 1 - Introd,. ..................................................................................................... 1-1
Chapter 2 - Schedule Planning
2.1 Scheduling Process .......................................................................................... 2-12.2 Schedule Steps ................................................................................................. 2-12.3 Near-term and Far-term (Rolling Wave) Scheduling ................................ 2-12.4 Trade-offs ......................................................................................................... 2-12.5 D uration Estim ation M pthods ....................................................................... 2-22.6 Sources of Schedulir .- vi tion .............................................................. 2-22.7 Schedule A djustm ents ................................................................................... 2-22.8 Sum m ary ............................ .......................................................................... 2-2
Chapter 3 - Gantt Charts
3.1 Scheduling w ith G antt C harts ...................................................................... 3-13.2 Sum m ary .......................................................................................................... 3-2
Chapter 4 - Milestone Charts
4.1 M ilestone Scheduling ...................................................................................... 4-14.2 Strengths ........................................................................................................... 4-34.3 Lim itations ....................................................................................................... 4-34.4 Sum m ary .......................................................................................................... 4-3
Chapter 5 - Network Scheduling
5.1 Program Evaluation and Review Technique .............................................. 5-15.2 Critical Path M ethod ....................................................................................... 5-35.3 D eveloping a N etw ork ................................................................................... 5-35.4 Converting an Ugly Duckling to a Swan ..................................................... 5-45.5 D eveloping a Sw an N etw ork ........................................................................ 5- 75.6 N etw ork Scheduling Problem ....................................................................... 5-75.7 Network Scheduling When Resources are Limited ................................... 5-85.8 M ultiprogram Considerations ..................................................................... 5-105.9 Sum m ary ........................................................................................................ 5- 12
iv
Chapter 6 - Line-of-Balance Technique
6.1 Line-of-Balance Technique ............................................................................ 6-16.2 O bjective Chart ................................................................................................ 6-16.3 Production Plan Chart .............................................................................. 6-16.4 Program Status Chart ..................................................................................... 6-36.5 Line-of-Balance C harting ............................................................................... 6-36.6 A nalysis ............................................................................................................ 6-46.7 Sum m ary .......................................................................................................... 6-4
Chapter 7 - Time Management
7.1 Program M anager's Tim e Reserve ................................................................ 7-17.2 "N ow " Schedule ........................................................................................... 7-17.3 Value of Tim e ................................................................................................... 7-27.4 Sum m ary .......................................................................................................... 7-3
Chapter 8 - Automated Planning, Scheduling and Control
8.1 Background ...................................................................................................... 8 -18.2 Requirem ents D efinition ......................................................................... 8 -I8.3 N ature of Program s/Projects ........................................................................ 8 -28.4 Size of the Program /Project .......................................................................... 8 -28.5 A dvanced Features ......................................................................................... 8 -28.6 Cost .................................................................................................................... 8-38.7 Reports and D isplays ...................................................................................... 8-38.8 O ther Considerations .................................................................................. 8-48.9 Sum m ary .................................................................................................... 8&4
Chapter 9 - Recapitulation
9.1 Principal Points ................................................................................................ 9-1
APPENDICES
Appendix A - Integrated Master Schedule ................................................................ A-1
Appendix B - Network Scheduling Problem ............................................................. B-1
A ppendix C - G lossary .................................................................................................. C-1
Appendix D - DSMC 95 Network & Gantt Chart ...................................................... D-1
A ppendix E - Endnotes .................................................................................................. E-1
V
LIST OF FIGURES
FIGURE TITLE PAGE
Figure 3-1 Gantt (Bar) Chart .............................................................................................. 3-1
Figure 3-2 Gantt Chart Showing Dependency ................................................................ 3-2
Figure 4-1 Milestone Symbols ........................................................................................... 4-1
Figure 4-2 Milestone Chart ................................................................................................ 4-2
Figure 5-1 Beta Distribution with Symbols Indicating Time Estimates ...................... 5-2
Figure 5-2 CPM Time-Cost Curve .................................................................................... 5-3
Figure 5-3 Network Diagram for Computer Installation Program .............................. 5-5
Figure 5-4a The Ugly Duckling ........................................................................................... 5-6
Figure 5-4b The Swan ........................................................................................................... 5-6
Figure 5-5 Network Illustrating Problem When Resources Are Limited ................... 5-9
Figure 5-6 Limited Resources Network Plotted on Schedule Graph .......................... 5-9
Figure 5-7 Personnel Loading Chart for Schedule Graph ........................................... 5-10
Figure 5-8 Revised Schedule Graph ............................................................................... 5-10
Figure 5-9 A Multiprogram Network ............................................................................ 5-11
Figure 6-1 Line-of-Balance Charting ................................................................................ 6-2
Figure 7-1 Total Cost Analysis for Selecting "Optimum" Program Duration ............ 7-2
Figure 8-1 Gantt Chart ........................................................................................................ 8-3
Figure 8-2 Standard Display, PERT/CPM Network ...................................................... 8-4
vi
LIST OF TABLES
TABLE TITLE PAGE
Table 3-1 Pros and Cons of Gantt Chart ......................................................................... 3-2
Table 5-1 Activities, Dependencies, Times and Costs .................................................. 5-8
Table 5-2 Activity Time/Cost Relationships ................................................................. 5-8
Table 5-3 Pros and Cons of Networking ...................................................................... 5-13
Table 6-1 Pros and Cons of Line of Balance ................................................................... 6-5
vii
1INTRODUCTION
In its simplest form, a schedule is nothing adjustments are necessary to keep the pro-more than a listing of activities and events, gram on schedule once it's back on track.organized by time. In its more complexform, it is a process that examines all pro- Why does a program manager (PM)gram activities in terms of realistic con- schedule? The simple answer is that he/straints of time, funds and people; i.e., she needs a road map for all program play-resources. In program management prac- ers. In reality, scheduling accomplishes fartice, the schedule is one of the most power- more than the production of "wall paper"ful planning, control and communications network charts. Scheduling supports keytools. Properly executed, scheduling sup- program management objectives such asports time and cost estimates, opens com- developing and fielding cost-effectivemunications between personnel involved systems. As the scheduling process is ex-in program activities, and establishes a plored, the objectives and the means bycommitment to program activities, which they can be achieved will be ad-
dressed.Scheduling is one of the most importantaspects of the program management func- This guide is an introduction to schedul-tion - planning. This is readily appar- ing. It is meant for people who alreadyent when the program structure or sched- have some experience in program man-ule is prepared as part of a program's ac- agement and for those enrolled in coursesquisition strategy and in the development at the Defense Systems Management Col-of risk, financial and technical manage- lege (DSMC).ment plans.
The following chapters will explain andIn addition, scheduling is a key element in illustrate scheduling concepts and tech-accomplishing the othermanagement func- niques. Specifically, they will show howtions - controlling, organizing, staffing to plan schedules, use Gantt and milestoneand leading. For example, controlling is charts, develop and interpret network andwhat is done to keep abreast of program line-of-balance charts, manage time as aexecution. To achieve the goals, it is neces- resource, and use commercial and govern-sary to know whether the program is be- ment software scheduling packages.hind, on or ahead of schedule, and what
1-1
2
SCHEDULE PLANNING
2.1 SCHEDULING PROCESS 2.2 SCHEDULE STEPS
One of the first steps in defining a project or e Create a rough master schedule basedprogram is to create a Work Breakdown on cost, schedule and performance risk;
Structure (WBS). Guidance on creating aWBS is provided in MILSTD-881B of 25 * Create rough detailed implementing
March 1993. The contract WBS goes to lev- schedules; again, based on program risk;
els below the third level and includes pro- and
cess/work activities at the lowest levels.These activities are the basis for the work * Iterate master and detailed sched-packages for cost accounting and the Cost ules until proper balance is achieved.
Schedule Control System Criteria. Thework packages show the clear link be- 2.3 NEAR-TERM AND FAR-TERMtween the organizational structure and the (ROLLING WAVE) SCHEDULINGWBS. They also contain the tasks or activi- Near-term scheduling can and should beties which are depicted on the schedule accomplished in sufficient detail to sup-charts described in this guidebook. port management at each level. Far-term,
or rolling-wave, scheduling will be lessUsing a WBS as the starting point for iden- precise, accounting for the alternative pathstifying activities for constructing a network which the program may take.
or Gantt chart is an efficient approach;
however, a WBS is not always available. In As the program approaches each phase,these cases, more planning must be done in the schedule for that phase will be fleshedorder to identify project activities clearly, out with more detailed schedule informa-
tion. The schedule for the out-year phasesResources to perform a project are most will be adjusted based on the most currentinterchangeable before the project begins. information. However, this should not beOnce resources have been locked into bud- taken as a license to make easy changes ingets, with organization and manpower al- the schedule. Every effort should be madelocations, trading them off can be very to maintain the original schedule.expensive. A schedule should not be ap-proved until resources have been initially 2.4 TRADE-OFFSallocated to the tasks at hand, analyzed andleveled to their most efficient use. Coin- There is always a trade-off between cost,puter software tools, which will be dis- schedule and performance, and withincussed later in Chapter 8, help to level each of these, there is also the risk factor.resources. Cost includes all resources: people, money,
2-1
equipment and facilities. Performance 2.7 SCHEDULE ADJUSTMENTSincludes quality and the supportabilityparameters. e Crashing a Network - Reducing ac-
tivity times by spending more money forThe best schedule is the one that supports resources.the best trade-off between these competingdemands. * Resource Adjustments - Changes in
2.5 DURATION ESTIMATION resource funding and/or personnel levels;2.5 ODU O ECongressional, Office of the Secretary ofMETHODS Defense, component generated.
* Analogy - Based on experience of 9 New Information - Technology,similar programs. Ne Inomtn-Tchlgythreat changes, test failures and successes.
* Parametric Estimating - Based ondevelopment of an estimating relationship, 2.8 SUMMARYi.e., formula.
The roots of successful scheduling lie in the* Bottoms-up Aggregation - Zero- WBS. The WBS represents the project and
based build of schedule requirements. its parts. It is divided into a sufficient num-ber oi levels to allow each task to be speci-
2.6 SOURCES OF SCHEDULING fled in terms of resources - such as per-INFORMATION sonnel, equipment, facilities - and time.
In addition, the precedence relationships• Previous Experience - Lessons between the tasks are specified, as mile-
learned from own successes and failures. stones, or deliverables such as tests, reports
Functional and Technical Experts - and receipt of equipment needed for the• Fuctioal nd Tchnial xpers - project to proceed.
Advice from successful practitioners.
e Other System Requirements The network can be created on a computer
or by the use of labels or batches of paper
- PPBS is Calendar Year driven posted on a whiteboard. Although the lat-
events. ter method may appear overly simple, the
SRequirements Generation Sys- payoff is that all team members who are
tem is user/customer input on when prod- contributing to the project plan can easily
uct or system required. see the growth of the plan and the taskinterrelationships.
* Other Programs - Relatetoanalogymethod of estimating duration. With this information in place, one can
schedule the project. Schedules with ap-* Regulations, Directives and Guid- propriate detail are then developed for the
ance - Required reviews and milestones. different levels of management.
2-2
3GANTT CHARTS
3.1 SCHEDULING WITH GANTT * Effective communication;CHARTS
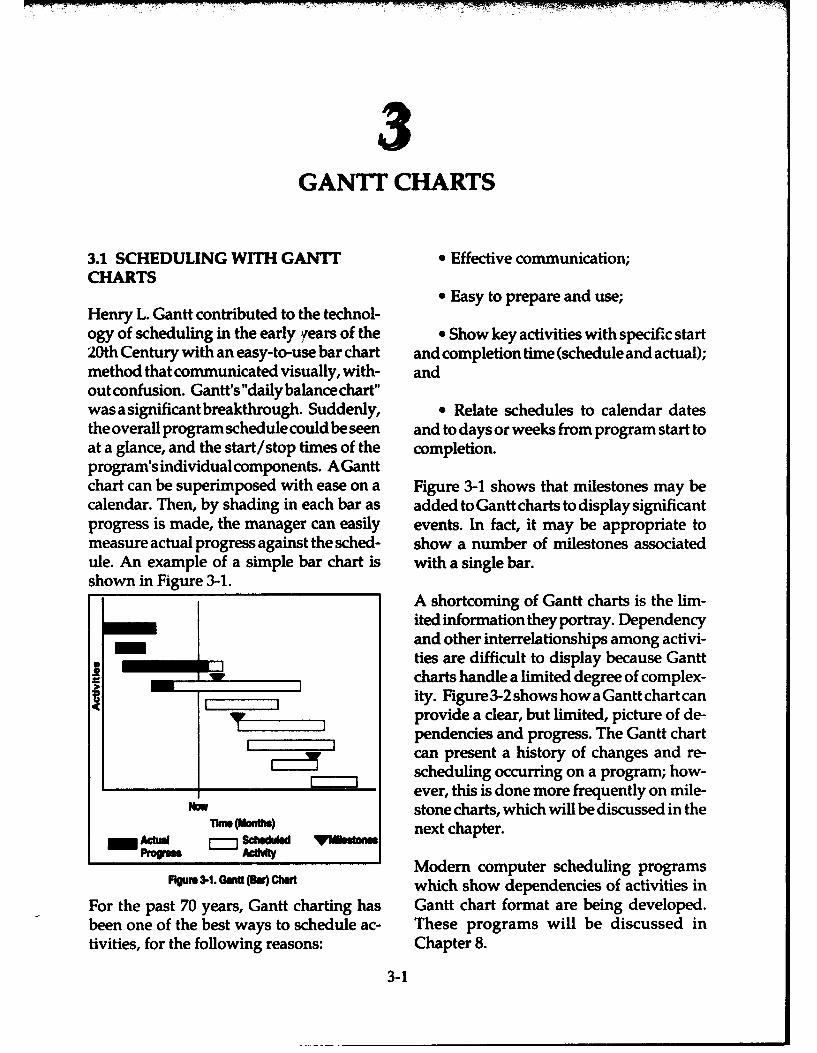
* Easy to prepare and use;Henry L. Gantt contributed to the technol-ogy of scheduling in the early years of the * Show key activities with specific start20th Century with an easy-to-use bar chart and completion time (schedule and actual);method that communicated visually, with- andout confusion. Gantt's "daily balance chart"was a significantbreakthrough. Suddenly, * Relate schedules to calendar datesthe overall program schedule could be seen and to days or weeks from program start toat a glance, and the start/stop times of the completion.program's individual components. AGanttchart can be superimposed with ease on a Figure 3-1 shows that milestones may becalendar. Then, by shading in each bar as added to Gantt charts to display significantprogress is made, the manager can easily events. In fact, it may be appropriate tomeasure actual progress against the sched- show a number of milestones associatedule. An example of a simple bar chart is with a single bar.shown in Figure 3-1.
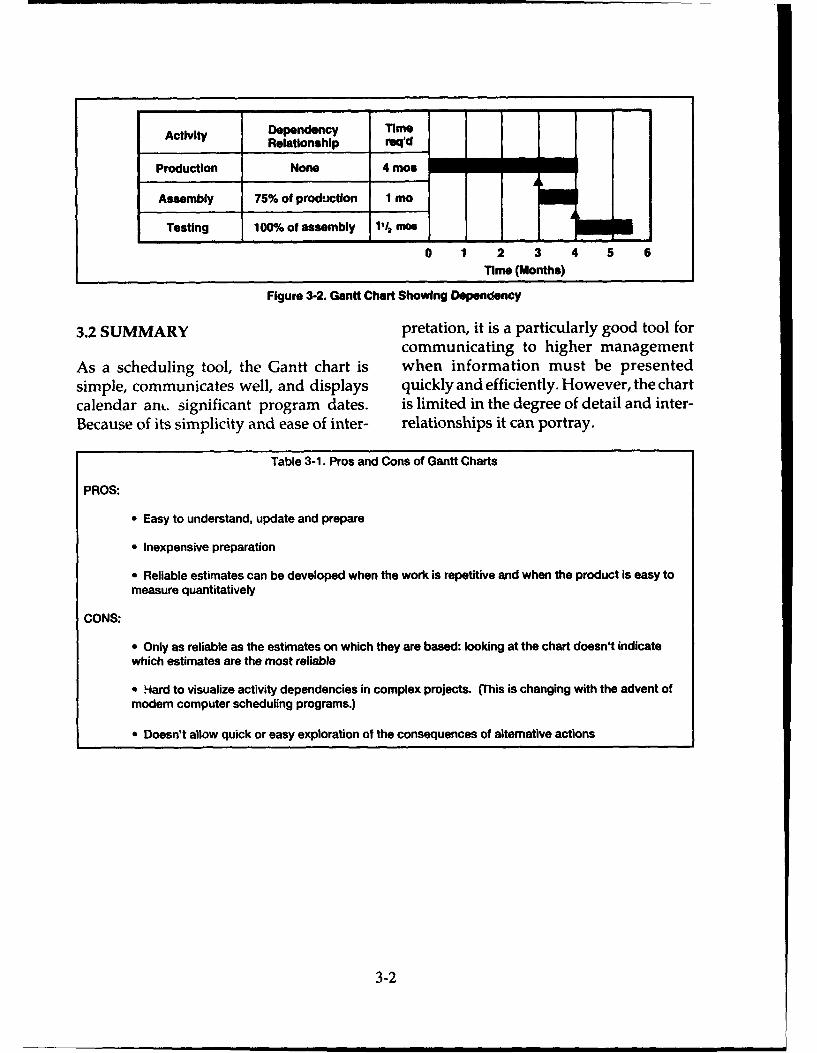
A shortcoming of Gantt charts is the lim-ited information they portray. Dependencyand other interrelationships among activi-'- ties are difficult to display because Gantt
_ _ _charts handle a limited degree of complex-__l, I ity. Figure3-2 shows how a Gantt chart can
provide a clear, but limited, picture of de-_ _ _ pendencies and progress. The Gantt chart
can present a history of changes and re-scheduling occurring on a program; how-ever, this is done more frequently on mile-
NMw stone charts, which will be discussed in theTh- Pm'- next chapter.
Modern computer scheduling programsRg=34*.U@,(-N. dt which show dependencies of activities in
For the past 70 years, Gantt charting has Gantt chart format are being developed.been one of the best ways to schedule ac- These programs will be discussed intivities, for the following reasons: Chapter 8.
3-1
Activity Dependency TimeRelationship rq'd
Production None 4 mos
Assembly 75% of production 1 mo
Testing 100% of assembly 11/ na rim
0 1 2 3 4 5 6Time (Months)
Figure 3-2. Gantt Chart Showing Dependency
3.2 SUMMARY pretation, it is a particularly good tool forcommunicating to higher management
As a scheduling tool, the Gantt chart is when information must be presentedsimple, communicates well, and displays quickly and efficiently. However, the chartcalendar anL. significant program dates. is limited in the degree of detail and inter-Because of its simplicity and ease of inter- relationships it can portray.
Table 3-1. Pros and Cons of Gantt Charts
PROS:
"* Easy to understand, update and prepare
"* Inexpensive preparation
"* Reliable estimates can be developed when the work is repetitive and when the product is easy tomeasure quantitatively
CONS:
. Only as reliable as the estimates on which they are based: looking at the chart doesn't indicatewhich estimates are the most reliable
* Hard to visualize activity dependencies in complex projects. (This is changing with the advent ofmodem computer scheduling programs.)
* Doesn't allow quick or easy exploration of the consequences of alternative actions
3-2
4MILESTONE CHARTS
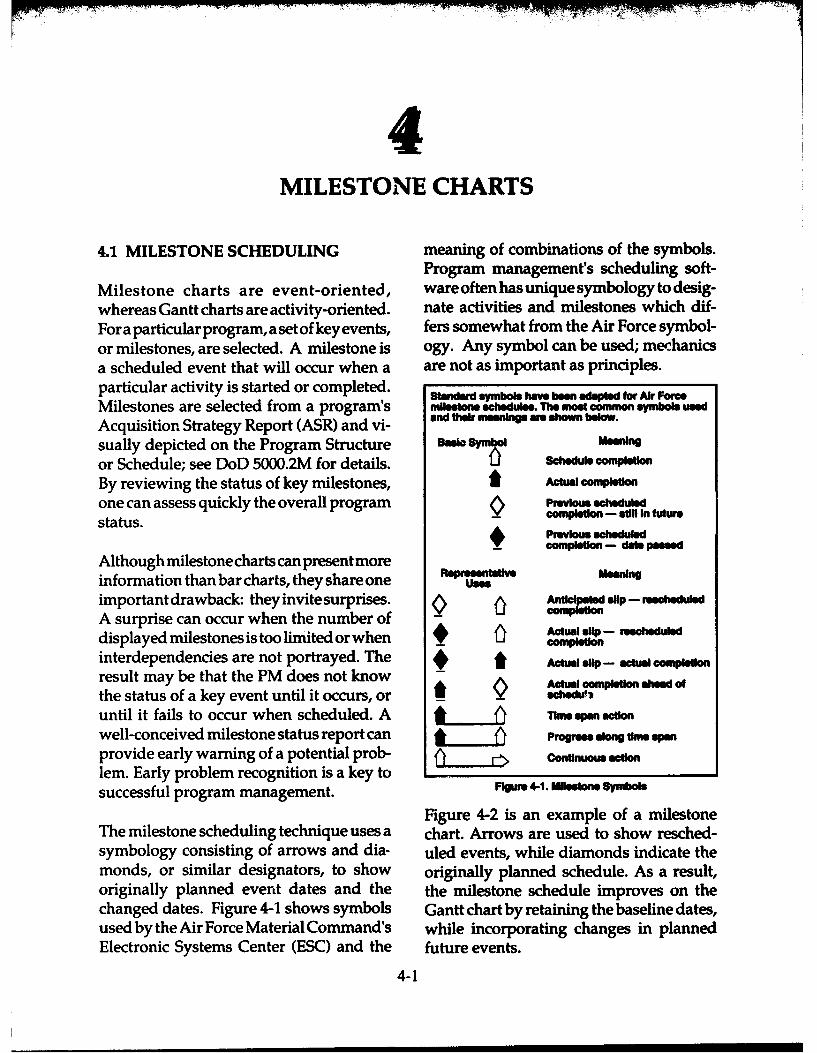
4.1 MILESTONE SCHEDULING meaning of combinations of the symbols.Program management's scheduling soft-
Milestone charts are event-oriented, ware often has unique symbology to desig-whereas Gantt charts are activity-oriented. nate activities and milestones which dif-For a particular program, a set of key events, fers somewhat from the Air Force symbol-or milestones, are selected. A milestone is ogy. Any symbol can be used; mechanicsa scheduled event that will occur when a are not as important as principles.particular activity is started or completed. an Mbols have been adeped for Air FocMilestones are selected from a program's milestone scwdules. The moet common symbols used
Acquisition Strategy Report (ASR) and vi- and their nmanseln am shown bslow.
sually depicted on the Program Structure BasicMeior Schedule; see DoD 5000.2M for details. Scheule compli
By reviewing the status of key milestones, Actual completion
one can assess quickly the overall program_ -schedutue
status. completion - sil In future
Psrevous scheduledcomnpletion - def assed
Although milestone charts can present moreinformation than bar charts, they share one Uses ennimportant drawback: theyinvite surprises. Anticd dOp -reeuled
A surprise can occur when the number of -
displayed milestones is too limited or when _ 0 - rescheduled
interdependencies are not portrayed. The At Aual dip - actual pletionresult may be that the PM does not knowthe status of a key event until it occurs, or A c>tua _e_
until it fails to occur when scheduled. A 7J maen action
well-conceived milestone status report can Progress along time spanprovide early warning of a potential prob- cotnuous action
lem. Early problem recognition is a key tosuccessful program management. F'gur 4.1. ietem
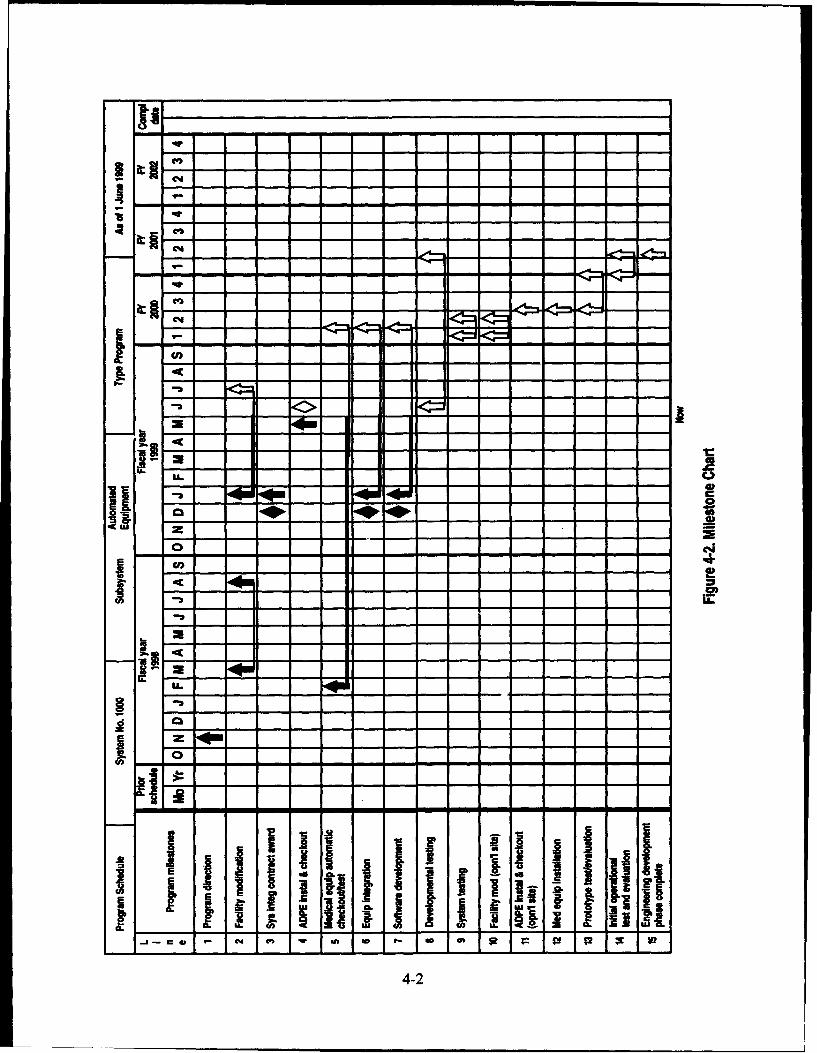
Figure 4-2 is an example of a milestoneThe milestone scheduling technique uses a chart. Arrows are used to show resched-symbology consisting of arrows and dia- uled events, while diamonds indicate themonds, or similar designators, to show originally planned schedule. As a result,originally planned event dates and the the milestone schedule improves on thechanged dates. Figure 4-1 shows symbols Gantt chart by retaining the baseline dates,used by the Air Force Material Command's while incorporating changes in plannedElectronic Systems Center (ESC) and the future events.
4-1
('4
ca
f-b
H C..
-L- I- - --- --- 1 0
a -4-2
The milestone chart records the manager's 4.3 LIMITATIONSassessment. For example, a manager mightreasonably predict that a one-month slip in As with bar charting, a major weakness ofthe start of software development willprob- milestone charting is the inability of theably result in a several-month slip in com- chart to clearly show interdependenciespleting the engineering and manufactur- and the interaction among activities. Thising development phase. The milestone may be especially true if the chart is pre-chart does not provide the assessment; the pared manually. If a PM focuses on a rela-manager's experience does. This is the key tively simple milestone format, he/she mayto understanding the use of milestone lose sight of the complexity of the relation-charts. Unless the activity and interrela- ships among various program tasks.tionships of milestones are understood, the When milestone charts are used on com-chart tells only what has happened and plex programs, they are usually the prod-what is yet to happen. However, by cou- uct of network analysis. If the milestonepling the information on what has hap- chart is provided by a computer softwarepened with the manager's experience and application and the use of network analy-knowledge, the PM can predict more accu- sis, it may also show activity dependency.rately what will occur in the future. Milestone chart preparation is relatively
simple, but developing and analyzing theThe milestone scheduling technique shows information going into the charts can bewhat is scheduled, what has happened time-consuming. A controlled flow of ac-and changes in plans. The technique is not curate, timely and appropriate informa-as useful for forecasting schedule changes tion to assist in constructing milestoneas are the network and line-of-balance tech- charts is important.niques discussed in later chapters.
4.4 SUMMARY4.2 STRENGTHS Milestone charting represents a simple andLike the Gantt chart, the milestone chart is effective means for displaying the actual
versus the planned progress of a program,an effective method of communication. and for showing schedule changes that
The symbology is relatively standard and have occurred. These charts emphaste
simple to use. The chart presents actual start and completion dates rather than the
progress against a baseline plan and dis- activities that take place between these
plays changes in plans. The mechanics of dates.
constructing a milestone chart are relatively
easy. Many defense contractors use mile- Milestone charts generated manually dis-stone charts extensively, and the charts play very limited dependency information,have become a mainstay of program man- However, dependencies may be depictedagement. in some software scheduling applications.
4-3
5NETWORK SCHEDULING
"Network scheduling is a prime exampleof Project Office. The Navy wanted PERT asthe value of graphic art to management. a management tool for scheduling and con-The visual display has obvious worth in trolling the Polaris missile program, whichdirect communication between program involved 250 prime contractors and moremanagers, supervisors, and workers; all of than 9,000 subcontractors. The PM had tothem see the same picture of anticipated keep track of hundreds of thousands ofaction and they can discuss it in the well- tasks.defined terms associated with networks."- James L. Riggs and A. James Kalbaughl PERT helps the PM answer the following
questions:The shortcomings of Gantt and milestonecharts gave rise to network scheduling in • When is each segment of the pro-the 1950s. The network techniques pro- gram scheduled to begin and end?vide a method of graphically displayinginformation that cannot be presented with • Considering all of the program seg-bars or milestones. ments, which segments must be finished
on time to avoid missing the scheduledTo analyze a program, it is separated into program completion date?activities. Each activity is based on a par-ticular undertaking and is defined by a • Can resources be shifted to criticaldistinct start and completion point. Net- parts of the program (those that must beworkscheduling provides a method of find- completed on time) from noncritical partsing the longest, most time-consuming path. (those that can be delayed) without affect-This gives the PM two important tools. ing the overall scheduled completion dateFirst, he/she is able to estimate more accu- for the program?rately the total time from program start tocompletion. Second, by being able to iden- • Among the myriad of program tasks,tify items on the critical (or longest) path, as where should management efforts be con-opposed to less critical tasks, the PM is able centrated at any particular time?to analyze and prioritize problems as theyarise. Most activities in a PERT network take a
long time to accomplish; therefore, time is5.1 PROGRAM EVALUATION AND usually expressed in days or weeks.REVIEW TECHNIQUE
Because PERT was intended to increase aThe Program Evaluation and Review Tech- PM's control in situations where time esti-nique (PERT) was developed in 1957 under mates were difficult to make with confi-the sponsorship of the U.S. Navy Special dence, time estimates were calculated from
5-1
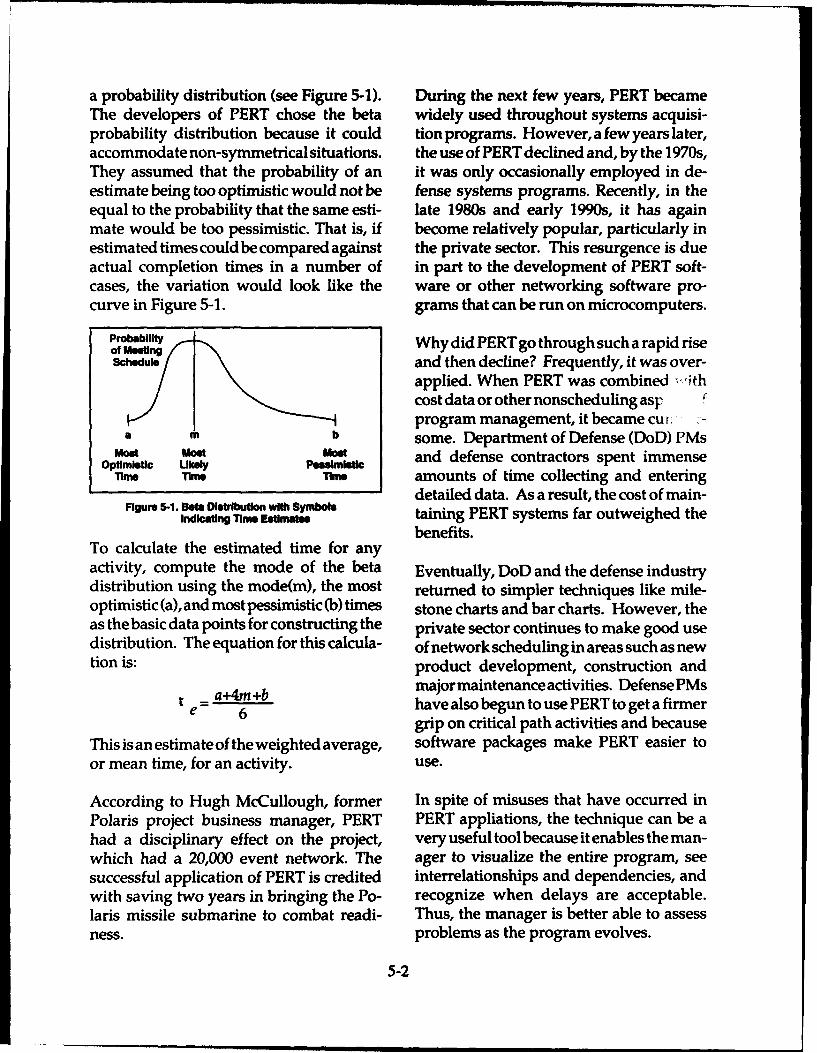
a probability distribution (see Figure 5-1). During the next few years, PERT becameThe developers of PERT chose the beta widely used throughout systems acquisi-probability distribution because it could tionprograms. However, a few years later,accommodate non-symmetrical situations. the use of PERT declined and, by the 1970s,They assumed that the probability of an it was only occasionally employed in de-estimate being too optimistic would not be fense systems programs. Recently, in theequal to the probability that the same esti- late 1980s and early 1990s, it has againmate would be too pessimistic. That is, if become relatively popular, particularly inestimated times could be compared against the private sector. This resurgence is dueactual completion times in a number of in part to the development of PERT soft-cases, the variation would look like the ware or other networking software pro-curve in Figure 5-1. grams that can be run on microcomputers.
Probalbility Why did PERT go through such a rapid riseShl and then decline? Frequently, it was over-
applied. When PERT was combined .ithcost data or other nonscheduling asp fprogram management, it became cui. --
a m b some. Department of Defense (DoD) PMsmod most and defense contractors spent immense
Optimic BUkey PessmisticOirnc n Thne amounts of time collecting and entering
detailed data. As a result, the cost of main-Figure 5-1. Beta Distrbution with Symbote
Indlatingl1 T mF. taining PERT systems far outweighed thebenefits.
To calculate the estimated time for anyactivity, compute the mode of the beta Eventually, DoD and the defense industrydistribution using the mode(m), the most returned to simpler techniques like mile-optimistic (a), and most pessimistic (b) times stone charts and bar charts. However, theas the basic data points for constructing the private sector continues to make good usedistribution. The equation for this calcula- of network scheduling in areas such as newtion is: product development, construction and
a+4m+b major maintenance activities. DefensePMs4e +6 have also begun to use PERT to get a firmer
grip on critical path activities and becauseThis is an estimate of the weighted average, software packages make PERT easier toor mean time, for an activity, use.
According to Hugh McCullough, former In spite of misuses that have occurred inPolaris project business manager, PERT PERT appliations, the technique can be ahad a disciplinary effect on the project, very useful tool because it enables the man-which had a 20,000 event network. The ager to visualize the entire program, seesuccessful application of PERT is credited interrelationships and dependencies, andwith saving two years in bringing the Po- recognize when delays are acceptable.laris missile submarine to combat readi- Thus, the manager is better able to assessness. problems as the program evolves.
5-2
In order to apply PERT and similar net- quite accurately early in a program, theworking techniques, it is important that CPM technique is superior to PERT. Whenfollowing conditions exist: there is much uncertainty and when con-
trol over time outweighs control over1. The program must consist of clearly costs, PERT is a better technique to use.
defined activities, each with identifiable However, the basic networking principlesstart and completion points. in PERT and CPM are similar.
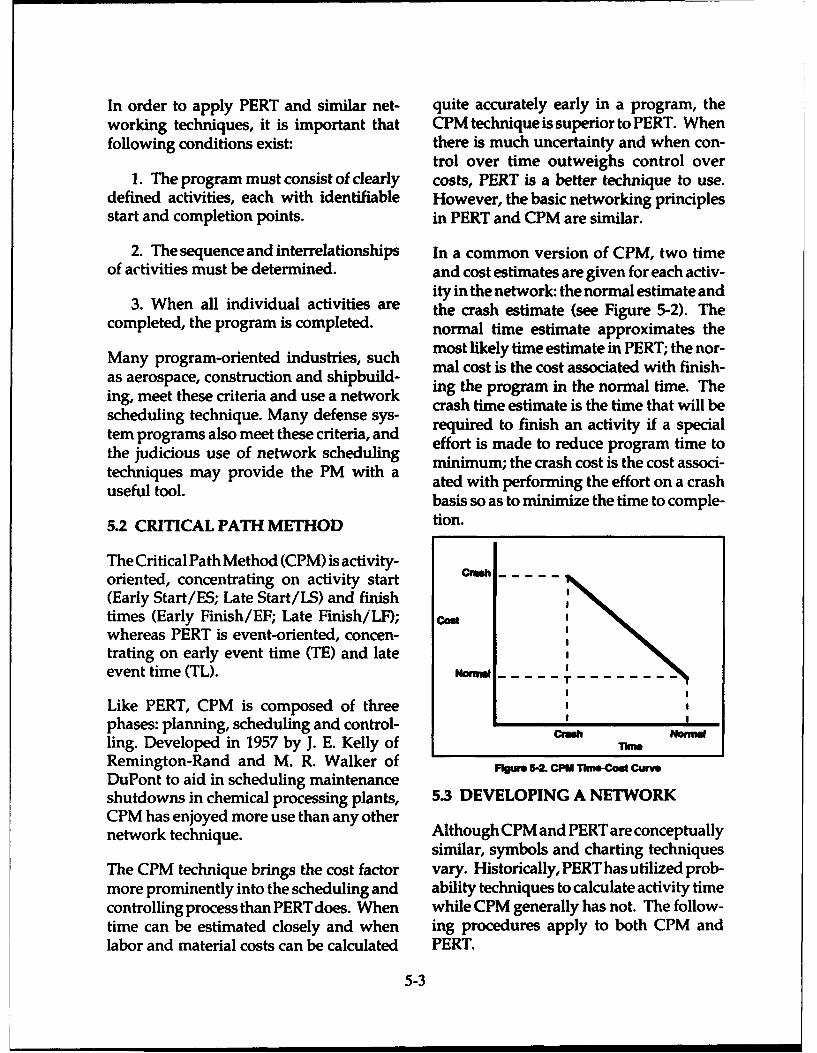
2. The sequence and interrelationships In a common version of CPM, two timeof activities must be determined, and cost estimates are given for each activ-
ity in the network: the normal estimate and3. When all individual activities d the crash estimate (see Figure 5-2). The
completed, the program is completed. normal time estimate approximates themost likely time estimate in PERT; the nor-
Many program-oriented industries, such mal cost is the cost associated with finish-as aerospace, construction and shipbuild- min the ost noial tinish-
ing, meet these criteria and use a network cag the program in the normal time. Thescheulig tehniue. anydefese ys- crash time estimate is the time that will bescheduling technique. Many defense sys- required to finish an activity if a special
tem programs also meet these criteria, and effort is made to reduce program time tothe judicious use of network scheduling minimum; the crash cost is the cost associ-techniques may provide the PM with a ated with performing the effort on a crash
basis so as to minimize the time to comple-
5.2 CRITICAL PATH METHOD tion.
The Critical Path Method (CPM) is activity-oriented, concentrating on activity start(Early Start/ES; Late Start/LS) and finishtimes (Early Finish/EF; Late Finish/LF); cadtwhereas PERT is event-oriented, concen-trating on early event time (TE) and lateevent time (TL). No - - - -
I I
Like PERT, CPM is composed of threephases: planning, scheduling and control- Iling. Developed in 1957 by J. E. Kelly of h Ml
Remington-Rand and M. R. Walker of 1 s- caTinw.cow Cw
DuPont to aid in scheduling maintenanceshutdowns in chemical processing plants, 5.3 DEVELOPING A NETWORKCPM has enjoyed more use than any othernetwork technique. Although CPM and PERT are conceptually
similar, symbols and charting techniquesThe CPM technique brings the cost factor vary. Historically, PERT has utilized prob-more prominently into the scheduling and ability techniques to calculate activity timecontrolling process than PERT does. When while CPM generally has not. The follow-time can be estimated closely and when ing procedures apply to both CPM andlabor and material costs can be calculated PERT.
5-3
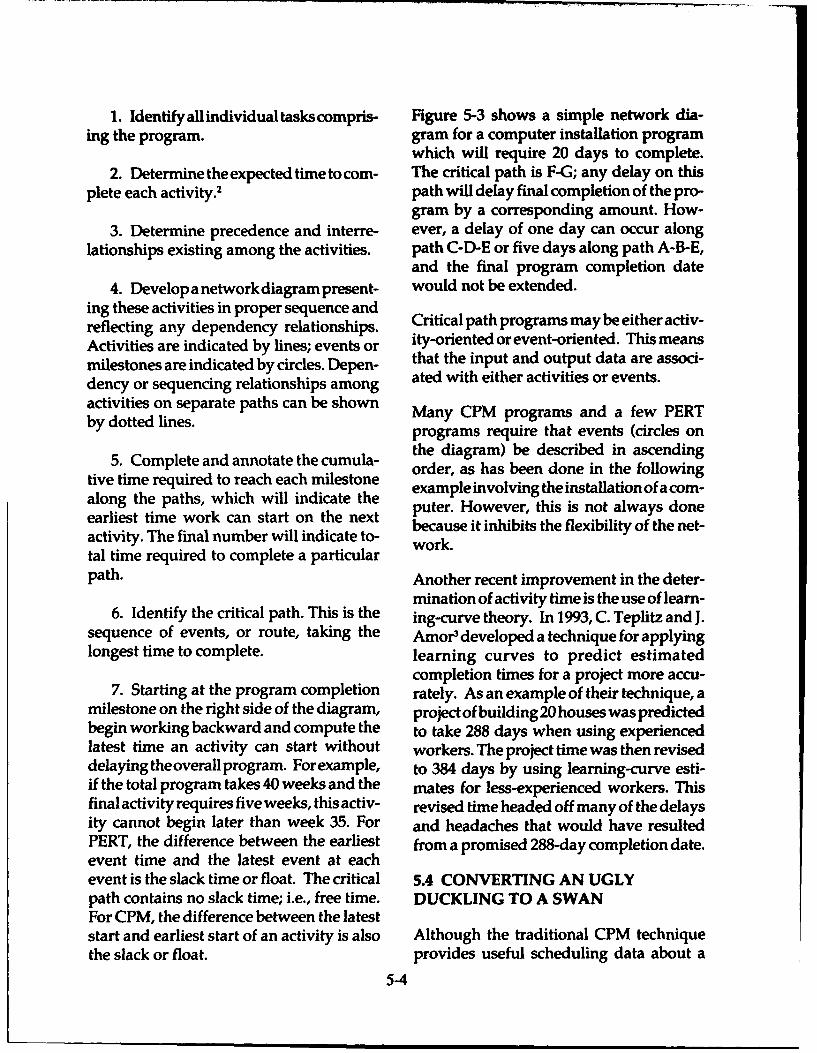
1. Identify aU individual tasks compris- Figure 5-3 shows a simple network dia-ing the program. gram for a computer installation program
which will require 20 days to complete.2. Determine the expected time to com- The critical path is F-G; any delay on this
plete each activity.' path will delay final completion of the pro-gram by a corresponding amount. How-
3. Determine precedence and interre- ever, a delay of one day can occur alonglationships existing among the activities, path C-D-E or five days along path A-B-E,
and the final program completion date4. Develop a network diagram present- would not be extended.
ing these activities in proper sequence andreflecting any dependency relationships. Critical path programs may be either activ-Activities are indicated by lines; events or ity-oriented or event-oriented. This meansmilestones are indicated by circles. Depen- that the input and output data are associ-miletons ar inicaed b cicles Deen- ated with either activities or events.dency or sequencing relationships amongactivities on separate paths can be shown Many CPM programs and a few PERTby dotted lines. programs require that events (circles on
5. Complete and annotate the cumula- the diagram) be described in ascending
tive time required to reach each milestone order, as has been done in the following
along the paths, which will indicate the example involving the installation ofacom-
earliest time work can start on the next puter. However, this is not always done
activity. The final number will indicate to- because it inhibits the flexibility of the net-
tal time required to complete a particular work.
path. Another recent improvement in the deter-
mination of activity time is the use of learn-6. Identify the critical path. This is the ing-curve theory. In 1993, C. Teplitz and J.
sequence of events, or route, taking the Amor3 developed a technique for applyinglongest time to complete. learning curves to predict estimated
completion times for a project more accu-7. Starting at the program completion rately. As an example of their technique, a
milestone on the right side of the diagram, project of building 20 houses was predictedbegin working backward and compute the to take 288 days when using experiencedlatest time an activity can start without workers. The project time was then reviseddelaying theoverall program. For example, to 384 days by using learning-curve esti-if the total program takes 40 weeks and the mates for less-experienced workers. Thisfinal activity requires five weeks, this activ- revised time headed off many of the delaysity cannot begin later than week 35. For and headaches that would have resultedPERT, the difference between the earliest from a promised 288-day completion date.event time and the latest event at eachevent is the slack time or float. The critical 5.4 CONVERTING AN UGLYpath contains no slack time; i.e., free time. DUCKLING TO A SWANFor CPM, the difference between the lateststart and earliest start of an activity is also Although the traditional CPM techniquethe slack or float. provides useful scheduling data about a
5-4
(F) 14dmo (a)Sdy0
.- 4
¢ -mm -~m•'A . Build raised floor13 . Build alrcndlanlng ventsC - Bring specimi powI'merource to comuerroomnD . IMtall wiring end cnnect to power soueE . Inm air -ndMonnF . Awat delivery of computerQ - hutel computer
Fgure -: Networ Diagmrm for ComWuter Insht~alson Progo
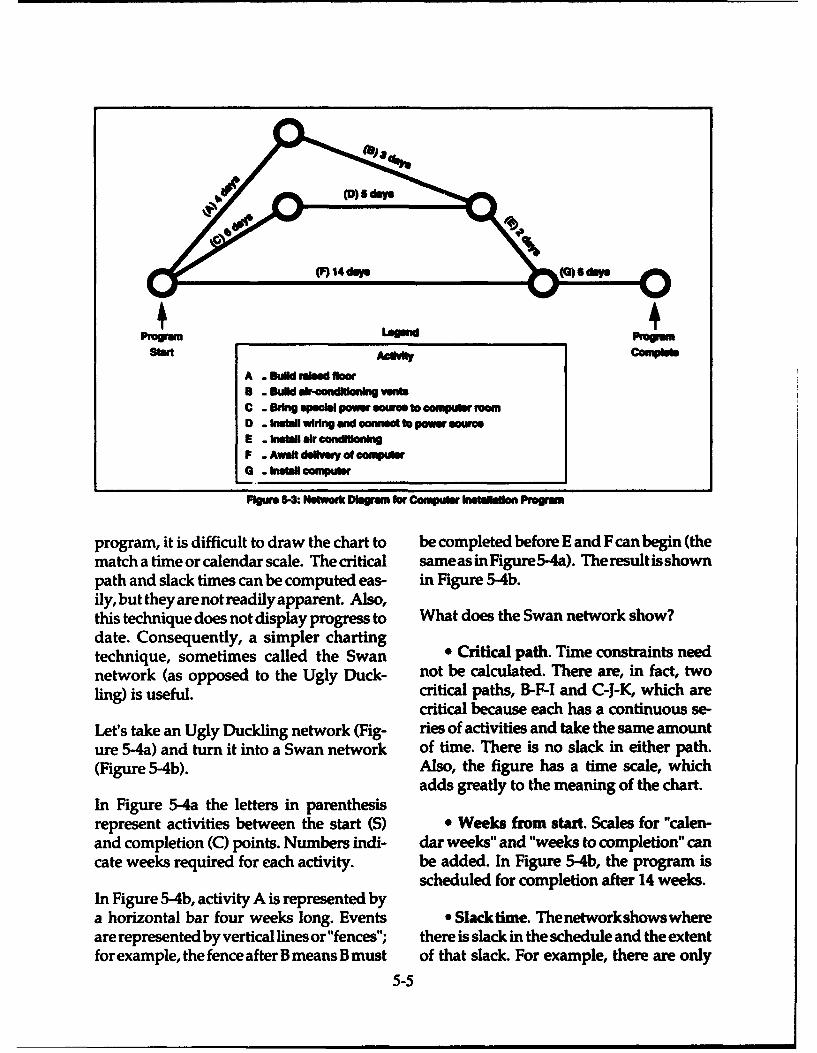
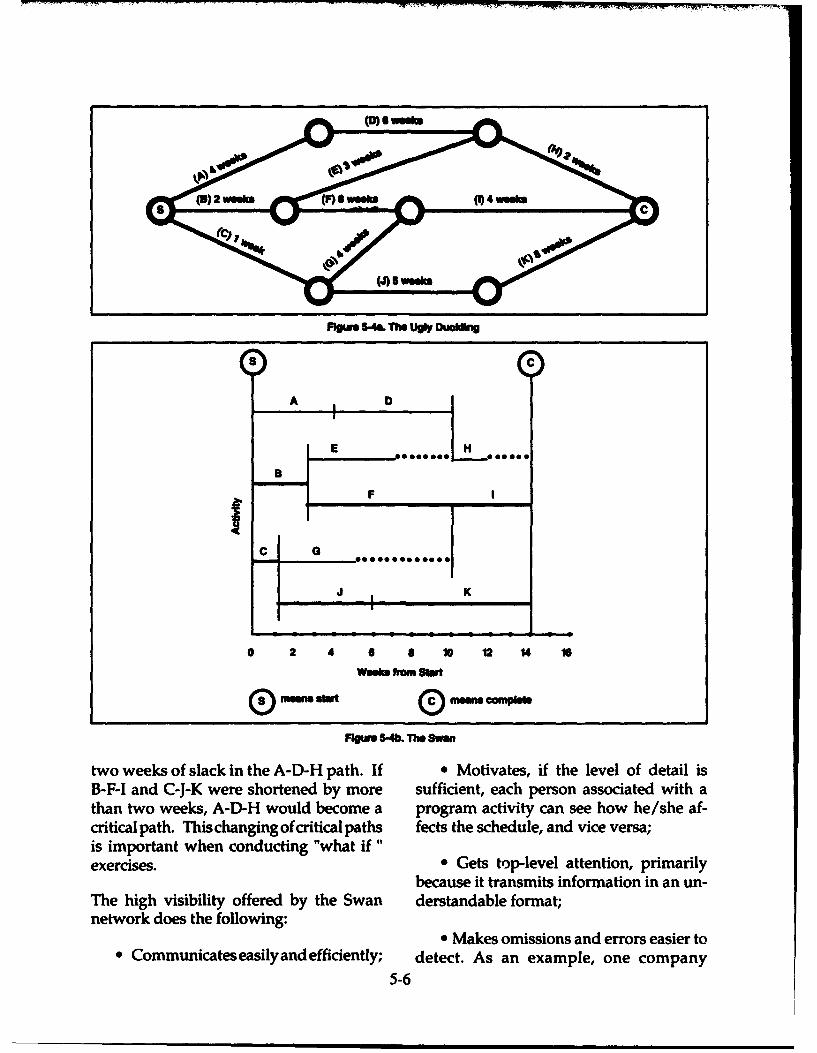
program, it is difficult to draw the chart to be completed before E and F can begin (thematch a time or calendar scale. The critical same as in Figure 5-4a). The result is shownpath and slack times can be computed eas- in Figure 5-4b.ily, but they are not readily apparent. Also,this technique does not display progress to What does the Swan network show?date. Consequently, a simpler chartingtechnique, sometimes called the Swan * Critical path. Time constraints neednetwork (as opposed to the Ugly Duck- not be calculated. There are, in fact, twoling) is useful. critical paths, B-F-I and C-J-K, which are
critical because each has a continuous se-Let's take an Ugly Duckling network (Fig- ries of activities and take the same amounture 5-4a) and turn it into a Swan network of time. There is no slack in either path.(Figure 5-4b). Also, the figure has a time scale, which
adds greatly to the meaning of the chart.In Figure 5-4a the letters in parenthesisrepresent activities between the start (S) e Weeks from start. Scales for "calen-and completion (C) points. Numbers indi- dar weeks" and "weeks to completion" cancate weeks required for each activity, be added. In Figure 5-4b, the program is
scheduled for completion after 14 weeks.In Figure 5-4b, activity A is represented bya horizontal bar four weeks long. Events e Slack time. The network shows whereare represented by vertical lines or "fences"; there is slack in the schedule and the extentfor example, the fence after B means B must of that slack. For example, there are only
5-5
ROgM 5-41L The Ugly Duddbig
S C
A t D
E H-0 000000 m•_m 00
SF I
K
O 2 4 6 8 10 12 14 16
WSWc from Srit
0- -ý* 0®mmmcm OPNM
ftum 54b. Th Swan
two weeks of slack in the A-D-H path. If * Motivates, if the level of detail isB-F-I and C-J-K were shortened by more sufficient, each person associated with athan two weeks, A-D-H would become a program activity can see how he/she af-criticalpath. Thischangingofcriticalpaths fects the schedule, and vice versa;is important when conducting "what if"exercises. * Gets top-level attention, primarily
because it transmits information in an un-The high visibility offered by the Swan derstandable format;network does the following:
* Makes omissions and errors easier to* Communicates easily and efficiently; detect. As an example, one company
5-6
discovered by using the Swan network that 5.6 NETWORK SCHEDULINGtwo test activities on the critical path had PROBLEMbeen omitted. This was not apparent in theUgly Duckling network; Assume you are a PM. Your objective is to
schedule the activities on your program so* Shows early start, early finish, late that one lot of missiles will be assembled
start and late finish; and and shipped to the test site within 56 daysat the least cost. Use any technique with
o Avoids reams of tab runs and print- which you feel comfortable. If you're notouts, usually provided (but not used) for comfortable with some other technique,the Ugly Duckling technique. use the Swan network.
5.5 DEVELOPING A SWAN NETWORK Proceed in the following manner, using
The Swan network can be developed by the Tables 5-1 and 5-2 provided.
following: * Using lined tablet paper, lay out the
network schedule. This will show the criti-s Translating from another network, as cal path and total number of days required.
shown in the preceding example;
* From a list of the preceding and fol- e Identify the initial critical path (num-
lowing events or activities, as in the net- ber of days).
working problem that follows; * Using Table 5-2, crash the network
* From scratch, with the sequencing by selecting the final critical path and re-
and time estimating required in originat- lated costs that will ensure completion ofing any network; and the program in 56 days at the least cost.
9 From milestones. Some key points:
A "fence" in the Swan network is usually a * Crash only along the critical path.
milestone, such as a review or a major * When an activity is shortened, one orevent, regardless of how the network isdeveloped, more new critical paths may emerge. Par-
allel critical paths increase risk dramati-
Actual progress can be shown in the same cally.way as on a Gantt chart. Shading on eachbar indicates progress made. A vertical * Generally, least additional cost is the"now" line shows whether activities are on, criterion used to select which task to crash,
ahead of or behind schedule, and by how but other considerations (e.g., personnelmuch. hours) could be used.
Now, let's go through an exercise involv- It will probably take about 20 minutes foring network scheduling. Take time to work you to determine the solution. Two "school"the problem shown in the following para- solutions are at the back of this book (Ap-graphs. pendix B).
5-7
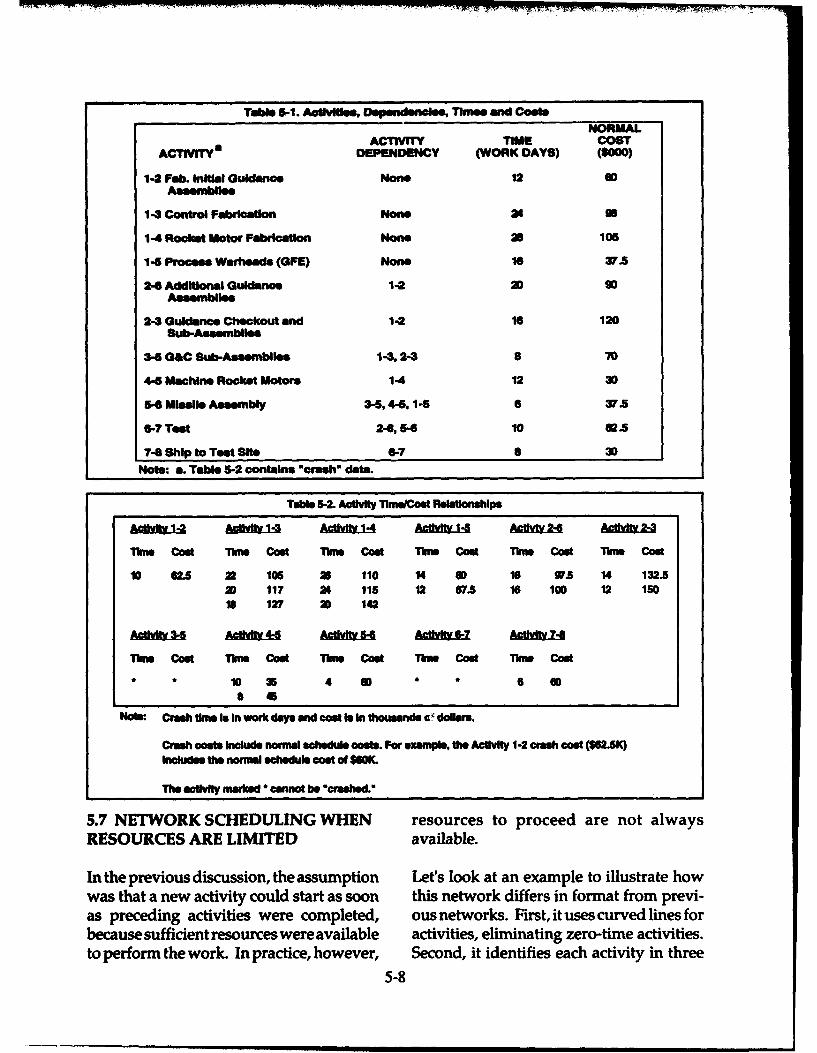
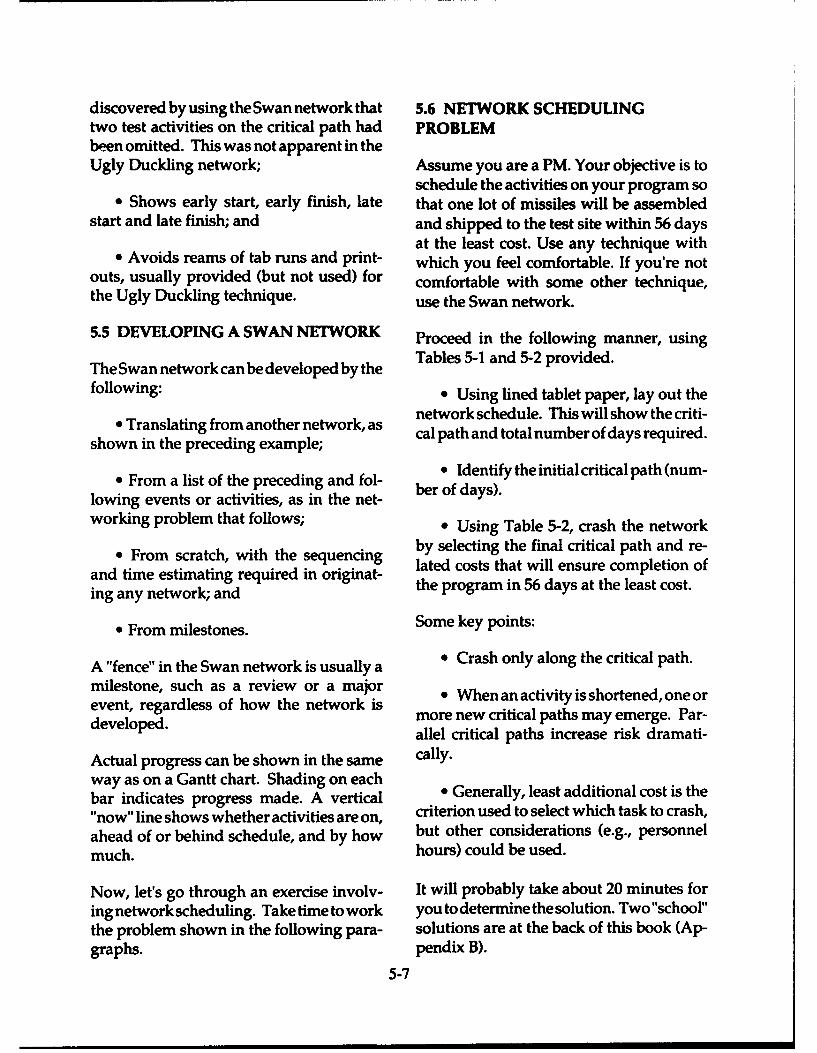
Table 5-1. Acivitis, OeeTnle,1mm and CostsNORMAL
ACTIVITY TIME COSTACTIVITY DEPENDENCY (WORK DAYS) ($000)
1-2 Feb. Initial Guidance None 12 s0
Aseanblies
1-3 Control Fabrication None as so
1-4 Rocket Motor FabricaUon None 2B 105
1-6 Procese Warheads (GFE) None 10 375
2-6 Additional Guidance 1-2 20 90Assemblies
2-3 Guidance Checkout and 1-2 16 120Sub-Asambllea
3-4 G&C Sub-Assemblies 1-3,2-3 8 0
4-4 Machine Rocket Motor* 1-4 12 30
5-6 Missile Assembly 3-5,445, 14- 6 37.5
6-7 Tet 2-6,5-6 10 12.5
7- Shlp to Test She 6-7 8 30
Note: a. Table 5-2 contains "crash" data.
Table 5-2. Act"ty ThnsCost Relat•onshps
Time Cast Thme Cost Time Cost Thm Cost Time Cost Time Cost
10 62 22 105 as 110 14 60 18 S7.5 14 132.52D 117 26 115 12 67.5 16 100 12 15016 127 2) 142
Thls Cast Time Cost Tihe Cost Time Cost Thme Cost
* 10 X5 4 so * 6 60& 45
NO: Crash time Is In work days and cost Is In thousands c I doUars.
Crash costs Include normal schedule costs. For example, the Acy 1-2 crash cost (12.5K)Includes the normal schedule cost of 16M
The ac/tiy marked * cannot be "crashed."
5.7 NETWORK SCHEDULING WHEN resources to proceed are not alwaysRESOURCES ARE LIMITED available.
In the previous discussion, the assumption Let's look at an example to illustrate howwas that a new activity could start as soon this network differs in format from previ-as preceding activities were completed, ousnetworks. First, it uses curved lines forbecause sufficient resources were available activities, eliminating zero-time activities.to perform the work. In practice, however, Second, it identifies each activity in three
5-8
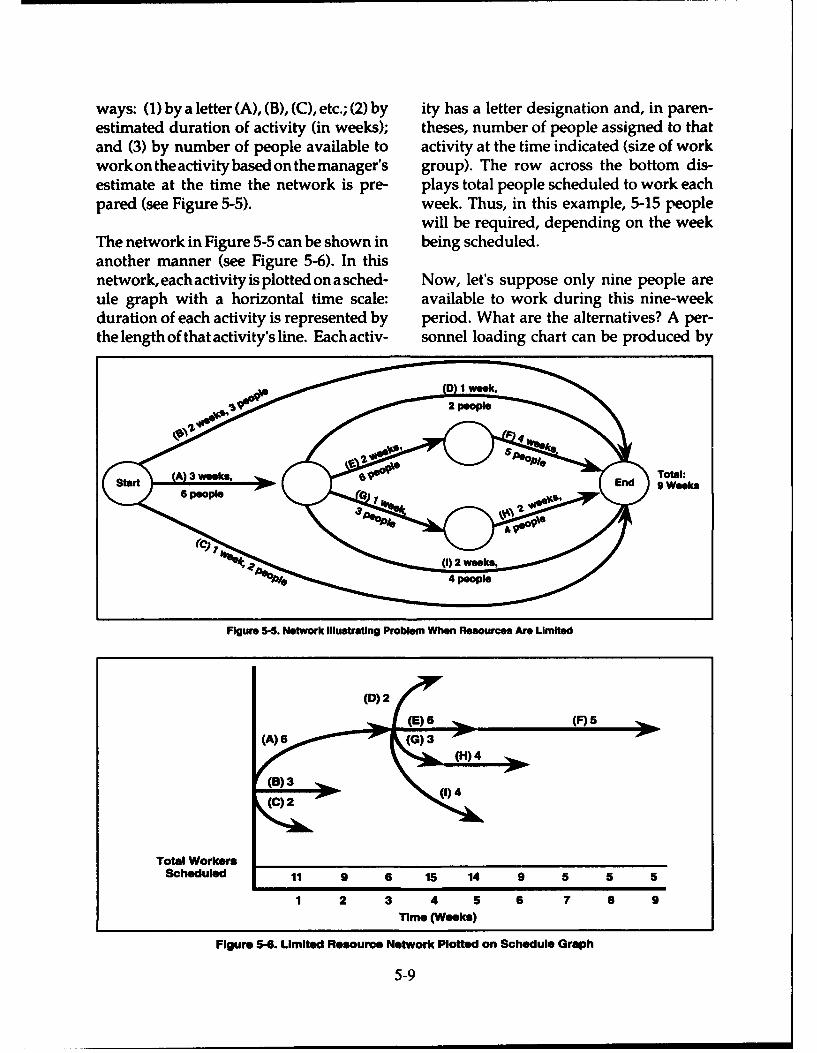
ways: (1) by a letter (A), (B), (C), etc.; (2) by ity has a letter designation and, in paren-estimated duration of activity (in weeks); theses, number of people assigned to thatand (3) by number of people available to activity at the time indicated (size of workwork on the activity based on the manager's group). The row across the bottom dis-estimate at the time the network is pre- plays total people scheduled to work eachpared (see Figure 5-5). week. Thus, in this example, 5-15 people
will be required, depending on the weekThe network in Figure 5-5 can be shown in being scheduled.another manner (see Figure 5-6). In thisnetwork, each activity is plotted on a sched- Now, let's suppose only nine people areule graph with a horizontal time scale: available to work during this nine-weekduration of each activity is represented by period. What are the alternatives? A per-the length of that activity's line. Each activ- sonnel loading chart can be produced by
(D) 1 weeks
2 peopleStan A 3 eeks End Total:
Figure 5-5. Network Illustrating Problem When Resources Are Limited
S/(E) 6 • (F) 5(A 6(G) 3 A -'
(B)) 4
Total WorkersScheduled 11 9 6 15 14 9 5 5 5
1 2 3 4 5 6 7 8 9
Time (Weeks)
Figure 5-6. Limited Resource Network Plotted on Schedule Graph
5-9
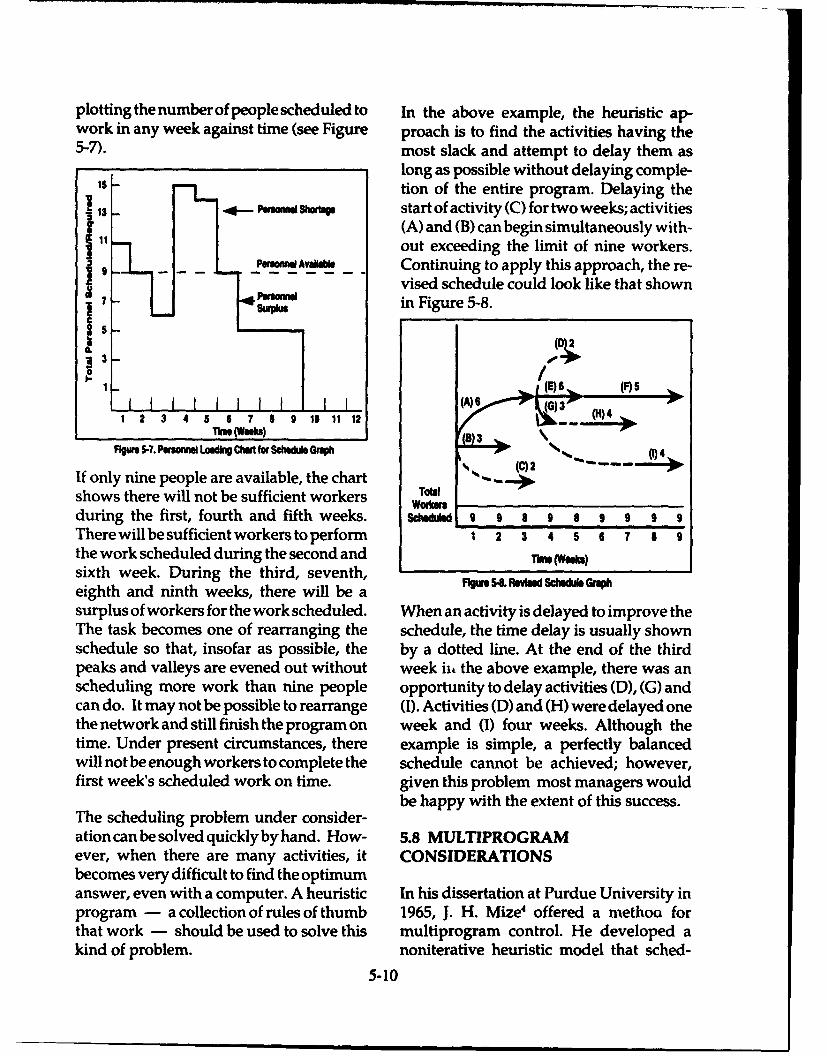
plotting the number of people scheduled to In the above example, the heuristic ap-work in any week against time (see Figure proach is to find the activities having the5-7). most slack and attempt to delay them as
long as possible without delaying comple-15 tion of the entire program. Delaying the
13 ...-- h a we start of activity (C) for two weeks; activitiesS11(A) and (B) can begin simultaneously with-
out exceeding the limit of nine workers.9-Peronl AvaIa Continuing to apply this approach, the re-
vised schedule could look like that shownP7 -won in Figure 5-8.
Am B(D
11 2 13 14 15 16 7 S 9 110 11 12 ( 630 (H4Thw MOM)
Figure 7. Pesonnel Loing Cwt for Schedule Graph ()4
If only nine people are available, the chart (C)
shows there will not be sufficient workers TOWWorkers
during the first, fourth and fifth weeks. Sce•dld 9 9 8 9 8 9 9 9 9There will be sufficient workers to perform 1 2 3 4 5 6 7 8 9the work scheduled during the second and Thu (Week)sixth week. During the third, seventh,eighth and ninth weeks, there will be asurplus of workers for the work scheduled. When an activity is delayed to improve theThe task becomes one of rearranging the schedule, the time delay is usually shownschedule so that, insofar as possible, the by a dotted line. At the end of the thirdpeaks and valleys are evened out without week ii, the above example, there was anscheduling more work than nine people opportunity to delay activities (D), (G) andcan do. It may not be possible to rearrange (I). Activities (D) and (H) were delayed onethe network and still finish the program on week and (I) four weeks. Although thetime. Under present circumstances, there example is simple, a perfectly balancedwill not be enough workers to complete the schedule cannot be achieved; however,first week's scheduled work on time. given this problem most managers would
be happy with the extent of this success.The scheduling problem under consider-
ation can be solved quickly by hand. How- 5.8 MULTIPROGRAMever, when there are many activities, it CONSIDERATIONSbecomes very difficult to find the optimumanswer, even with a computer. A heuristic In his dissertation at Purdue University inprogram - a collection of rules of thumb 1965, J. H. Mize' offered a methoa forthat work - should be used to solve this multiprogram control. He developed akind of problem. noniterative heuristic model that sched-
5-10
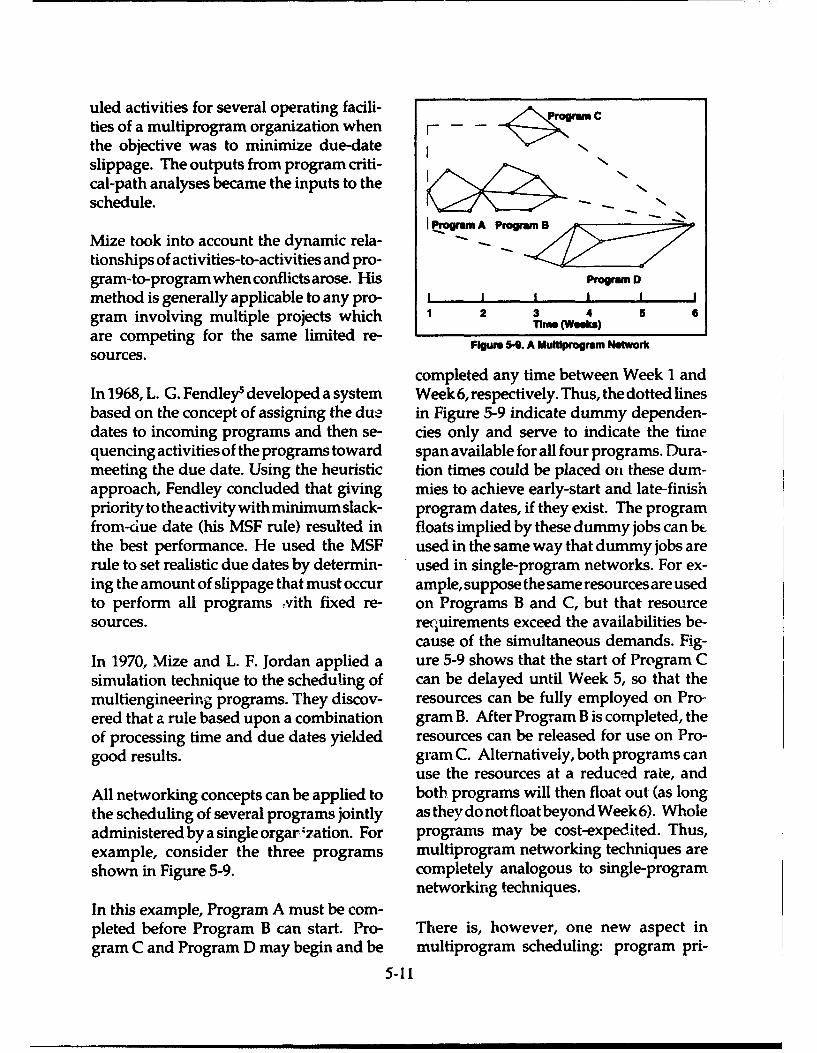
uled activities for several operating facili- cties of a multiprogram organization when Fthe objective was to minimize due-date 1slippage. The outputs from program criti-cal-path analyses became the inputs to theschedule. IC-- N. -.
I t~ogram A Program 8Mize took into account the dynamic rela-tionships of activities-to-activities and pro-gram-to-program when conflicts arose. His Program Dmethod is generally applicable to any pro- I I I I I I
gram involving multiple projects which 1 2 3 4 5 6Time (Weeks)
are competing for the same limited re- Fiu 54. A Muwprognm Networksources.
completed any time between Week 1 andIn 1968, L. G. Fendleys developed a system Week 6, respectively. Thus, the dotted linesbased on the concept of assigning the due in Figure 5-9 indicate dummy dependen-dates to incoming programs and then se- cies only and serve to indicate the timequencing activities of the programs toward span available for all four programs. Dura-meeting the due date. Using the heuristic tion times could be placed on these dum-approach, Fendley concluded that giving mies to achieve early-start and late-finishpriority to the activity with minimum slack- program dates, if they exist. The programfrom-due date (his MSF rule) resulted in floats implied by these dummy jobs can btthe best performance. He used the MSF used in the same way that dummy jobs arerule to set realistic due dates by determin- used in single-program networks. For ex-ing the amount of slippage that must occur ample, suppose the same resources are usedto perform all programs -vith fixed re- on Programs B and C, but that resourcesources. requirements exceed the availabilities be-
cause of the simultaneous demands. Fig-In 1970, Mize and L. F. Jordan applied a ure 5-9 shows that the start of Program Csimulation technique to the scheduling of can be delayed until Week 5, so that themultiengineering programs. They discov- resources can be fully employed on Pro-ered that a rule based upon a combination gram B. After Program B is completed, theof processing time and due dates yielded resources can be released for use on Pro-good results. gram C. Alternatively, both programs can
use the resources at a reduced rate, andAll networking concepts can be applied to both programs will then float out (as longthe scheduling of several programs jointly as they do not float beyond Week 6). Wholeadministered by a single orgar.zation. For programs may be cost-expedited. Thus,example, consider the three programs multiprogram networking techniques areshown in Figure 5-9. completely analogous to single-program
networking techniques.In this example, Program A must be com-pleted before Program B can start. Pro- There is, however, one new aspect ingram C and Program D may begin and be multiprogram scheduling: program pri-
5-11
orities. Suppose that Program C (Figure 5- Network scheduling techniques such as9) is deemed to be the most important PERT and CPM are much alike in provid-program and management wishes to have ing interdependencies, depth of detail, ait start before any other program. In the critical path and slack. The SWAN tech-Resource Allocation and Multi-Project nique provides simplicity and visibilityScheduling (RAMPS) computer algorithm through the time scales that have beendeveloped in 1963 at C-E-I-R, Inc. by used for many years in bar charts.Moshman, Johnson and Larsen,6 the pro-gram priority is used as a weighting factor The choice between PERT and CPM de-in scheduling and allocating resources pends primarily on the type of programamong competing alternative uses in the and managerial objectives. The PERTmultiprogram network. method is particularly appropriate if there
is considerable uncertainty in program ac-In general, the iterative use of tivity times and if it is important to controlmultiprogram-level and program-level the program schedule effectively. On thenetwork methods provides a medium other hand, CPM is particularly appropri-through which PMs and department-level ate when activity times can be adjustedmanagers may devise integrated total readily and when it is important to plan anplans. In 1975, Woodworth and Dane7 appropriate trade-off between programfound that multiple networks, submitted time and cost.by individual PMs, could be merged intoa multiprogram network. Several multi- In reality, differences between current ver-program network schedules may be de- sionsofPERTandCPMarenotpronounced.veloped, using various assumptions about Most versions of PERT now allow only apriorities and resources. These alternative single (most likely) estimate of each activ-schedules may then be examined in staff ity time.meetings attended by each PM and themultiprogram manager. The best multi- When several small programs are to beprogram schedule may then be selected scheduled, a multiprogram network mightbased on discussions and criticisms by ev- be considered. In this situation, each pro-eryone involved- Of course, several itera- gram can be treated as a separate entity andtions of the schedule may be required be- the entire set of programs diagrammedtween the program and multiprogram level and handled as one large network. Thebefore an acceptable plan is developed.8 RAMPS computer program is convenient
to apply in this case. Each program in the5.9 SUMMARY multiprogram network should be impor-
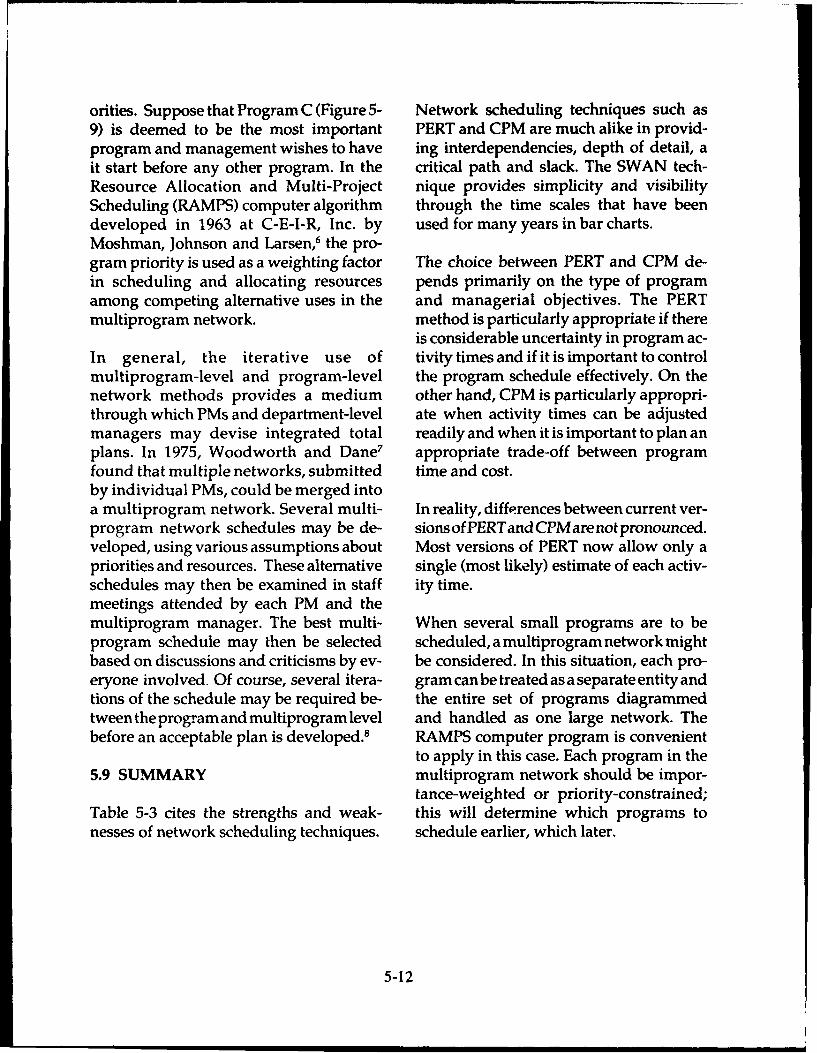
tance-weighted or priority-constrained;Table 5-3 cites the strengths and weak- this will determine which programs tonesses of network scheduling techniques. schedule earlier, which later.
5-12
Table 5-3. Pros and Cons of Networking
PROS
* Organize what would otherwise be confusing, thereby allowing managers to make tbde-offs anddevelop alternative plans.
* Essential for activities such as ship overhauls, ship construction and the manufacturing of verycomplex systems.
"* Allow managers to predict shortages and act on them early.
"* Once prepared, easy to update and rework.
"* Give managers more control over events and schedules.
CONS
"* Only as sound as the estimates they are based on.
"* Sometimes very hard to portray - too many lines and intersections.
* Complex networks, once sketched out on a large wall chart, tend to become the focus of manage-ment attention when, in fact, there may be factors not on the chart that a manager ought to be payingattention to, such as management/labor relations.
5-13
6LINE-OF-BALANCE-TECHNIQUE
'To get understanding and agreement in 6.2 OBJECTIVE CHARTless time, draw a diagram."
-James T. McCay' The first step in preparing the LOB is todraw the contract delivery schedule on the
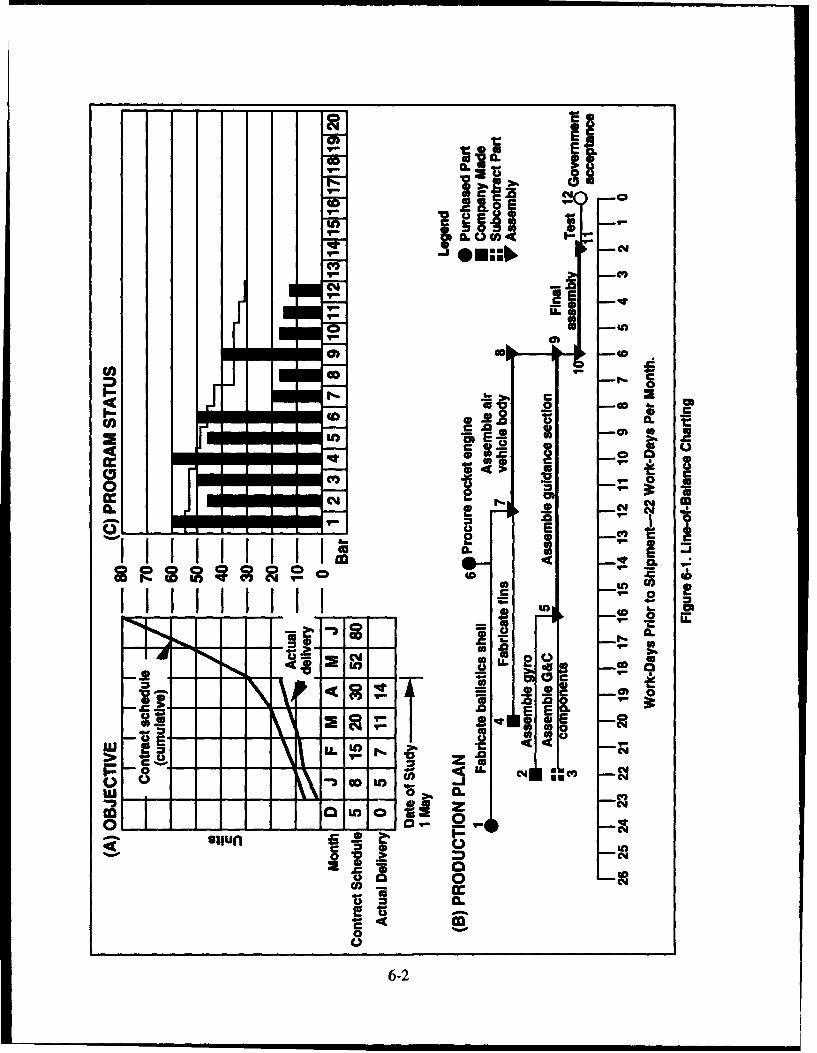
6.1 LINE-OF-BALANCE TECHNIQUE objective chart (Figure 6-1(A)), which showscumulative units on the vertical scale and
Network scheduling techniques are used dates of delivery along the horizontal scale.primarily in development and other one- The contract schedule line shows the cu-time programs. The line-of-balance (LOB) mulative units which the contractor is com-technique is used in repetitive activities mitted to deliver over the life of the pro-such as production. In production pro- gram:2 actual deliveries to date (cumula-grams, LOB charts are particularly useful tive) are also shown.to balance inventory acquisition with theproduction process and delivery require- 6.3 PRODUCTION PLAN CHARTments.
The second step is to chart the productionA LOB chart shows which control points (or assembly) plan (Figure 6-1(B)). The
need attention now to maintain future de-
livery schedules. Using the LOB technique, production plan is a lead-time chart: select
reporting to customers or top management only the most meaningful events as control
is quick, inexpensive and graphic. Charts points in developing this chart.
used for analysis and troubleshooting aresuitable for at-a-glance status reporting. These meaningful events can be given sym-bols that show whether they involve pur-
Without a computer-controlled productionprocess, the LOB technique doesn't lend chased items, subcontracted parts, or parts
itself readilytoday-to-dayupdating. How- and assemblies produced in-house. As-
ever, a monthly or weekly check usually semblies break down into subassemblies,
keeps the process on schedule. which break down into parts or operations.Thus, one can develop a production plan
A LOB technique consists of four elements: for any part or level of assembly.(1) objectives of the program, i.e., contractschedule and actual deliveries; (2) pro- The more steps monitored, the more sensi-duction plan in leadtime format; (3) cur- tive and more complicated the chart be-rent program status or inventory; and (4) comes. Generally, control points on a singlea comparison between where the pro- chart should be limited to 50. If there aregram is and where it's supposed to be, more than 50, subsidiary production plansthat is, program inventories versus the can be used to feed the top plan. Thus, eachLOB. These four elements are shown in chart can be kept simple and easy to under-Figure 6-1 and described in this chapter. stand. The shipping date of subsidiary
6-1
I- a
95'CW ,) 1 Cl
U... I CoCCl' 2 a'
C*2 0 *1*fllffll _ _4w
c o_c..
W'S
V.0
S-
Iic*
o 0
> .. 0.
I U
w 0L
CL,E u00
6-2
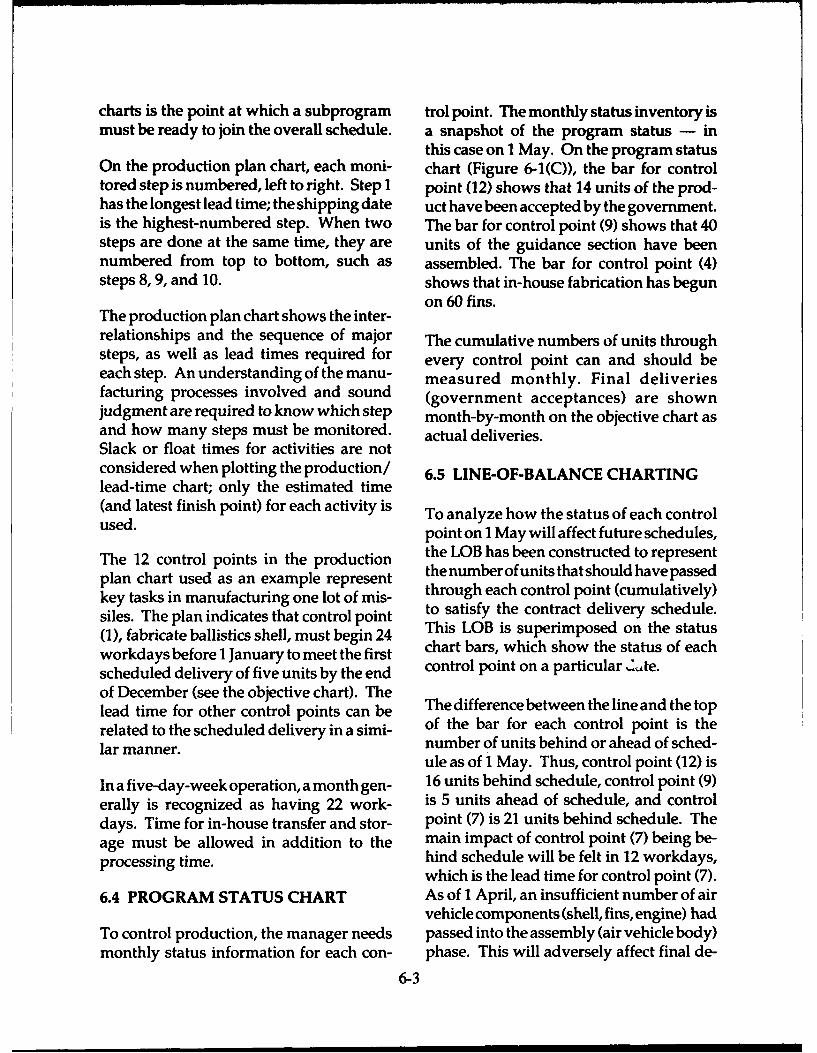
charts is the point at which a subprogram trol point. The monthly status inventory ismust be ready to join the overall schedule. a snapshot of the program status - in
this case on 1 May. On the program statusOn the production plan chart, each moni- chart (Figure 6-1(C)), the bar for controltored step is numbered, left to right. Step 1 point (12) shows that 14 units of the prod-has the longest lead time; the shipping date uct have been accepted by the government.is the highest-numbered step. When two The bar for control point (9) shows that 40steps are done at the same time, they are units of the guidance section have beennumbered from top to bottom, such as assembled. The bar for control point (4)steps 8, 9, and 10. shows that in-house fabrication has begun
on 60 fins.The production plan chart shows the inter-relationships and the sequence of major The cumulative numbers of units throughsteps, as well as lead times required for every control point can and should beeach step. An understanding of the manu- measured monthly. Final deliveriesfacturing processes involved and sound (government acceptances) are shownjudgment are required to know which step month-by-month on the objective chart asand how many steps must be monitored. actual deliveries.Slack or float times for activities are notconsidered when plotting the production/ 6.5 LINE-OF-BALANCE CHARTINGlead-time chart; only the estimated time(and latest finish point) for each activity is To analyze how the status of each controlused. point on 1 May will affect future schedules,
The 12 control points in the production the LOB has been constructed to represent
plan chart used as an example represent the numberof units that should have passed
key tasks in manufacturing one lot of mis- through each control point (cumulatively)siles. The plan indicates that control point to satisfy the contract delivery schedule.
(1), fabricate ballistics shell, must begin 24 This LOB is superimposed on the status
workdays before 1 January to meet the first chart bars, which show the status of each
scheduled delivery of five units by the end control point on a particular ,2•,te.
of December (see the objective chart). Thelead time for other control points can be The difference between the line and the toprelated to the scheduled delivery in a simi- of the bar for each control point is the
lar manner. number of units behind or ahead of sched-ule as of 1 May. Thus, control point (12) is
In a five-day-week operation, a month gen- 16 units behind schedule, control point (9)erally is recognized as having 22 work- is 5 units ahead of schedule, and controldays. Time for in-house transfer and stor- point (7) is 21 units behind schedule. Theage must be allowed in addition to the main impact of control point (7) being be-processing time. hind schedule will be felt in 12 workdays,
which is the lead time for control point (7).6.4 PROGRAM STATUS CHART As of 1 April, an insufficient number of air
vehicle components (shell, fins, engine) hadTo control production, the manager needs passed into the assembly (air vehicle body)monthly status information for each con- phase. This will adversely affect final de-
6-3
liveries 12 workdays hence. All other con- progress compares with planned progress.trol points can be analyzed in the same Analysis of the charts can pinpoint prob-way. lem areas. Delays at control point (7) in the
example may have been causing final de-To recap, the LOB is constructed in the livery problems throughout the contract.following manner: However, the purpose of LOB analysis is
not to show what caused the slippage in the"* Select a control point; for example, shipping date, but to detect potential fu-
(7). ture problems.
"* From the production plan/lead-time In the example, the government acceptancechart (Figure 6-1(B)), determine the lead point is control point (12). The bar doesn'ttime - the time from the control point to reach the LOB; therefore, deliveries areshipment point (12 workdays). behind schedule. Control points (10) and
* Using this number, determine the (11) are short. However, point (9) is on
date that the unit now at the control point schedule. Since point (10) depends on
should be completed. (May 1 plus 12 work- points (8) and (9), we know control pointdayshouakes youmjustoved r halfay tough 12 w(8) is the offender. Both points (7) and (8)days takes you just over halfway through a arshtbtheeremetannog
22-wrkda monh.)are short, but there are more than enough22-workday month.) purchased items (engines) at control point
* Find the point corresponding to this (6).
date on the contract schedule line and de-termine how many units scheduled for What's the problem with control point (8)?completion this represents by moving hori- Trace it back to control point (7), which iszontally from the objective chart to the seriously short. It is obvious that not hay-program status chart (they share the same ing enough completed fins is holding up
vertical scale). the whole process. Control points (2), (3)and (5) are short, but are not directly re-
* Draw a line on the program status sponsible for the failure to meet the deliv-chart (Figure 6-1(C)) at the level (41 units) ery schedule since (9) is ahead of schedule.over control point (7). Nevertheless shortages at (2), (3), and (5)
could soon cause problems at (9). The prob-* Repeat the above for each control lem with the fins (7) should be addressed
point and connect the horizontal lines over before management attention is devoted tothe control points. The resulting line is the other short operations. The overages atLOB, indicating the quantities of units that control points (1) and (6) may be examinedshould have passed through each control from the point of view of inventory control.point on the date of the study or inventory Updating the charts requires a good status-(1 May) if the contract delivery schedule reporting system, which can be mecha-were being met. nized if the program is large and complex.
6.6 ANALYSIS 6.7 SUMMARY
Using the LOB charts in Figure 6-1, man- The LOB is a monitoring technique thatagement can tell at a glance how actual gives prior warning of problems within a
6-4
continuous production process. Thekeyis To do LOB, the following is needed: (1) ato catch problems in a production process contract schedule, or objective chart; (2) aearly; otherwise, the schedule is lose. The production plan or lead-time chart for theLOB technique provides that warning, production process itself; (3) control points
cumulative inventories; and (4) a programThink of the production process as a natu- status chart on which you will plot yourral gas pipeline. If a bubble of air gets into LOB and the cumulative quantities of unitsthe pipeline, it will eventually be carried to that have passed through the control pointsthe gas users, and the users will find their oftheassembly/production process. If theburners extinguished as the nonflammable objective and program status charts areair reaches them. The manager of the pipe- given the same vertical scale, the LOB canline company or the natural gas utility, be plotted graphically from the former todoesn't want their clients to suffer blow- the latter.outs from air bubbles in their lines. Thesame holds true for the managers of a con- Remember that the shape of the LOB willtinuous production process. Waiting for change over time, especially if the produc-problems to show up at the end of the line tion process has a beginning and an end.is a mistake. Problems need to be detected Remember, too, that LOB charts showwhen they begin so corrections are faster, where a problem is, but not necessarilybefore too much damage (to cost, perfor- why the problem exists or what the solu-mance or schedule) is done: and produc- tion is.tion schedules fall too far off contract.
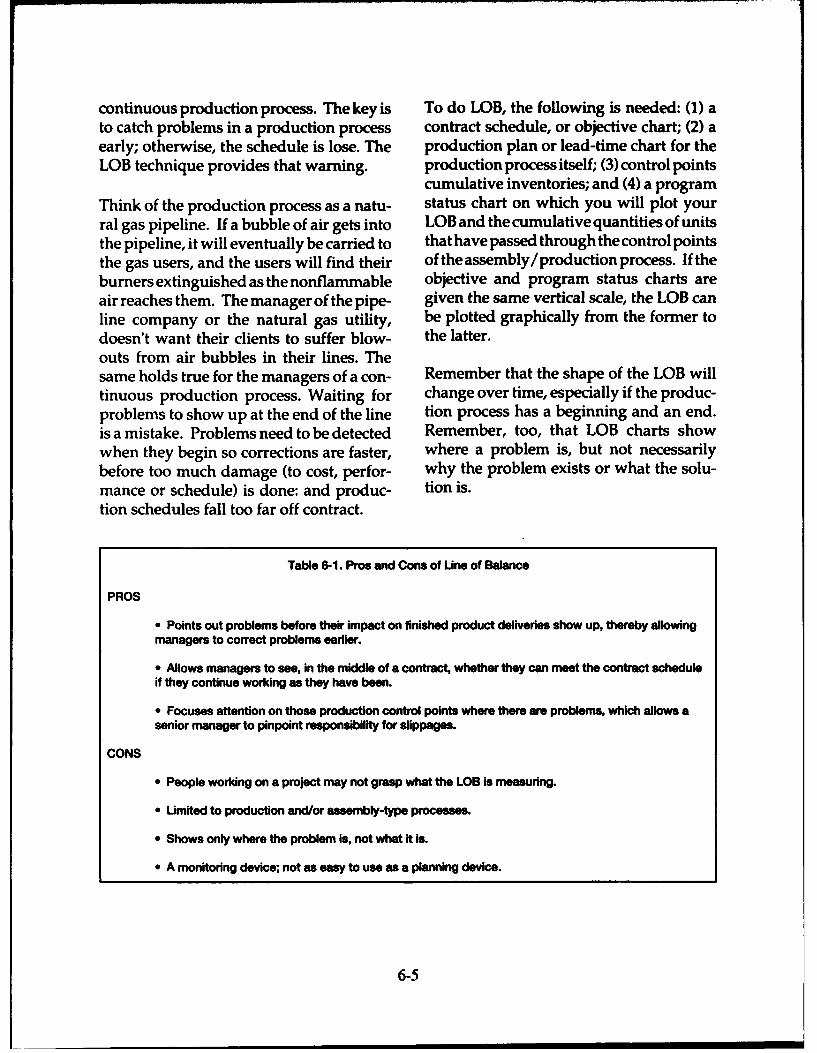
Table 6-1. Pros and Cons of Une of Balance
PROS
* Points out problems before their impact on finished product deliveries show up, thereby allowingmanagers to correct problems earlier.
* Allows managers to see, in the middle of a contract, whether they can meet the contract scheduleif they continue working as they have been.
* Focuses attention on those production control points where there are problems, which allows asenior manager to pinpoint responsibility for slippages.
CONS
"* People working on a project may not grasp what the LOB is measuring.
" ULmited to production and/or assembly-type processes.
"* Shows only where the problem is, not what it is.
"* A monitoring device; not as easy to use as a planning device.
6-5
7TIME MANAGEMENT
It is important that PMs manage time well. for example, a 4-month time reserve wouldPMs are busy people, particularly those in be established.the DoD and defense-related industry.Some managers could be more productive, * The time reserve must be held closelyperhaps as much as 20-40 percent, by ap- by the PM. Otherwise, every manager onplying effective approaches. his/her program may think"I know there's
a time reserve; therefore, I don't really haveThis chapter concerns three aspects of time to meet my schedule". The PM may placemanagement related to programs: this reserve under "additional system tests"
"or another downstream activity. The point* PM's time reserve; is, it shouldn't be visible. (A built-in safety
"* "Now" schedule; and factor between the manufacturing sched-ule and the delivery schedule is often used.)
"* Value of time. & A tough and disciplined approach to
7.1 PROGRAM MANAGER'S meeting the published schedule is requiredTIME RESERVE from the start of a program in order to
maintain the reserve and, consequently, toIn contractor performance measurement, meet the program schedule in spite of slip-much emphasis is placed on "management pages caused by the unknown unknownsreserve," the reserve budget controlled by (unk unks) that inevitably arise.the industry PM. What isn't always recog-nized is that a time reserve is also needed in 7.2 "NOW' SCHEDULEorder to accommodate unknowns the PMwill encounter. However, use of a time There is a direct relationship between timereserve should be approached with cau- and cost for any activity. This relationshiption, because members of a program office takes into account the people, resourcesteam may be tempted to fall back on it and method used. It also considers theprematurely- efficiency achieved. Generally, the least
costly schedule is the current one. Speed-Literature describing a PM's time reserve is ing up the schedule costs more; stretchingscarce. Howeverbased on discussions with out the schedule also costs more.a sampling of managers of both large andsmall programs, the main aspects of a time The sum of the direct and indirect costsreserve are clear. gives a U-shaped total program cost curve.
The optimum schedule for implementing* Most PMs establish a time reserve of the program is the schedule corresponding
about 10percent. Ona 40-month program, to the minimum point on this curve. The
7-1
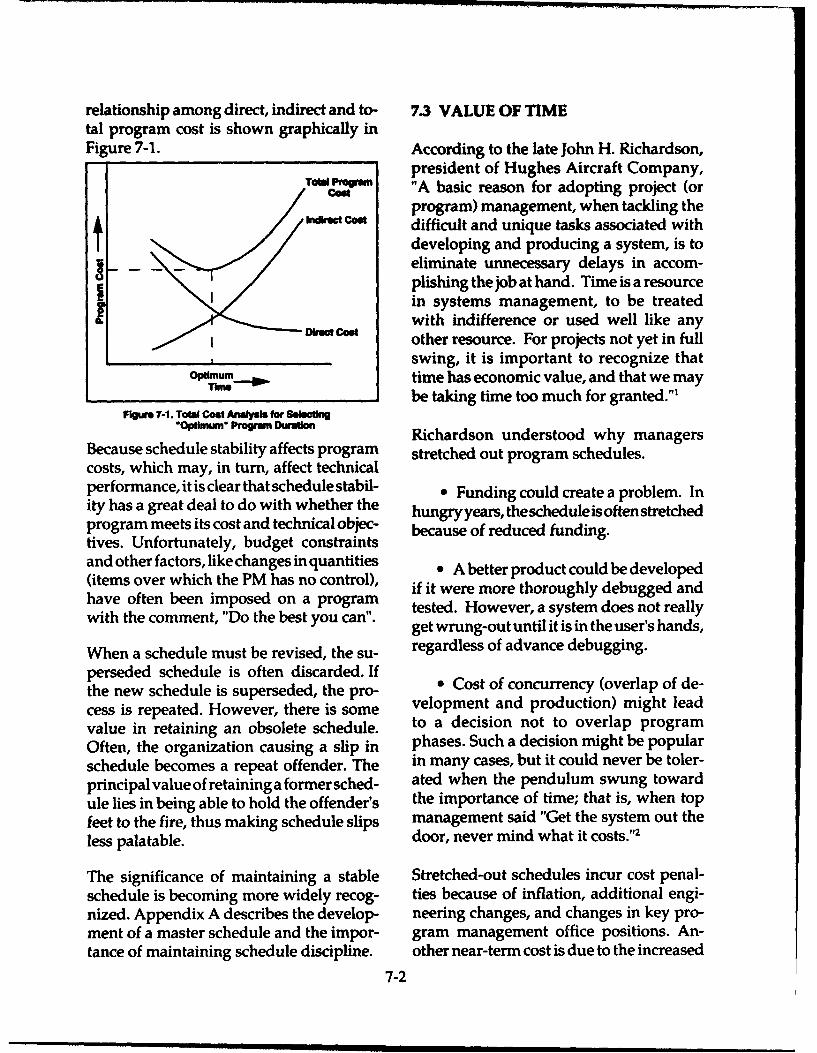
relationship among direct, indirect and to- 7.3 VALUE OF TIMEtal program cost is shown graphically inFigure 7-1. According to the late John H. Richardson,
president of Hughes Aircraft Company,
CON "A basic reason for adopting project (ort coot program) management, when tackling the
difficult and unique tasks associated withdeveloping and producing a system, is toeliminate unnecessary delays in accom-plishing the job at hand. Time is a resourcein systems management, to be treated
SCON with indifference or used well like anyother resource. For projects not yet in fullswing, it is important to recognize that
oP .... time has economic value, and that we maybe taking time too much for granted."'
FIguro 7-1. Tftal Cost Anl•sl for S•elcting.optu Prolirm Duratio Richardson understood why managersBecause schedule stability affects program stretched out program schedules.costs, which may, in turn, affect technicalperformance, it is clear that schedule stabil- * Funding could create a problem. Inity has a great deal to do with whether the hungry years, the schedule is often stretchedprogram meets its cost and technical objec- because of reduced funding.tives. Unfortunately, budget constraintsand other factors, like changes in quantities 9 A better product could be developed(items over which the PM has no control), if it were more thoroughly debugged andhave often been imposed on a program tested. However, a system does not reallywith the comment, "Do the best you can". get wrung-out until it is in the user's hands,
When a schedule must be revised, the su- regardless of advance debugging.
perseded schedule is often discarded. If * Cost of concurrency (overlap of de-the new schedule is superseded, the pro-cess is repeated. However, there is some velopment and production) might leadvalue in retaining an obsolete schedule. to a decision not to overlap programOften, the organization causing a slip in phases. Such a decision might be popular
schedule becomes a repeat offender. The in many cases, but it could never be toler-principal value of retaining a former sched- ated when the pendulum swung toward
ule lies in being able to hold the offender's the importance of time; that is, when top
feet to the fire, thus making schedule slips management said "Get the system out theless palatable. door, never mind what it costs."2
The significance of maintaining a stable Stretched-out schedules incur cost penal-schedule is becoming more widely recog- ties because of inflation, additional engi-nized. Appendix A describes the develop- neering changes, and changes in key pro-ment of a master schedule and the impor- gram management office positions. An-tance of maintaining schedule discipline, other near-term cost is due to the increased
7-2
chance that a program will be canceled compared to orderly but stretched-outbecause of obsolescence or competing scheduling), the resulting longer opera-technology. Stretch-outs invite cancella- tional life may provide greater economiction. Also, long schedules with no oppor- value. This is looking at time only from thetunities for incorporation of improve- viewpoint of economics; i.e., acquisitionments are a negative factor when consider- cost per year of operational availability.ing a new start. Another way of looking at time is that
defense system availability is survival in-Delayed decisions increase costs. Accord- surance.ing to R. W. Peterson, former DuPont ex-ecutive, "All businessmen are concerned, Consideration of alternative plans andand properly so, about the long time it schedules will also help; e.g., if event so-takes to move a new development from and-so occurs, proceed with plan "A"; ifits inception to a profit status. But fre- event such-and-such occurs, proceed withquently forgotten is the fact that a month's plan "B" and soon. Anticipation and prepa-delay in the early stages of development ration for most-likely events, along withis exactly as long as a month's delay in the the tools described, and coupled with ef-later stages. While it may seem innocuous fective communication of the plans, canto put off a decision for a month or two in change the management style from crisisthe early years of a project (or program) management to skillful management.with an uncertain future, that delay mayturn out to be just as costly as is procrasti- 7.4 SUMMARYnation when the final decisions are made.In short, a sense of urgency is essential to Planning and scheduling can do much todecision making in all stages of a new prevent running out of time and having toventure, not just the later stages."'3 make the least desirable decision because
of lack of time. Establishing a time reserveThe useful life of a defense system must be and a "now" schedule, and recognizing thetaken into consideration. Concentration value of time in decision making all con-on the system or product often overlooks tribute to the manager's repertoire of gooda key point; whether the buyer obtains tools.value upon delivery. The most costlyproduct is one that appears when it no Sir Jeffrey Quill, manager of the Britishlonger fulfills a useful purpose, even Spitfire Development Program, com-though it has been produced at minimum mented during a visit to DSMC that; "Aftercost. Each month added to the develop- 1935, costs weren't particularly important.ment and production of a new high- What mattered was time. We worked threetechnology system or product tends to shifts a day. Everything was time. Quan-reduce by one month the operational life of tity and time. It turned out that we prob-the system or product. ably produced at the lowest cost, too; but
the emphasis was on time."In spite of the 10-20 percent cost premiumthat may be paid for tight scheduling (as
"7-3
8AUTOMATED PLANNING, SCHEDULING
AND CONTROLA PM must be successful in managing all are able to provide PMs with automatedaspects of the program. Projects must be scheduling tools and project managementdefined: human resources, materials and capabilities. Most of these applications arebudgets must be scheduled to complete the commercial packages that can be purchasedprojects. Work in progress must be tracked. off-the-shelf at most computer stores orStatus reports of progress and variances to from the General Services Administrationthe plan must be developed in order to (GSA) approved contract schedules. Therevise schedules, budgets and work as- services have also developed, in-house orsignments. Today, there are numerous au- through support contractors, numeroustomated applications available to assist with applications tailored to acquisitionthe chores of achieving system performance management. Some have shells or tem-in a timely manner within budget. plates to organize projects, while others
may serve as automated listings of perti-8.1 BACKGROUND nent tasks to be completed over the life
cycle of the program or project.
Managers of the Navy Polaris SubmarineProgram during the 1950s, using main- 8.2 REQUIREMENTS DEFINITIONframe computers, first proved to the DoDthat automation would play a major role in The decision about which project man-program management. These PMs recog- agement software applications(s) to buynized the benefits of automation when ap- should only be made following a carefulplied to the decision-making process and understanding of the need for such a dy-as a planning and control tool. However, it namic product. The PM must review thewas a very costly process, involving sig- types of projects to be managed and thenificant time for implementation. At that functional people who will interface withtime, automation was used as a project the acquisition environment and use themanagement tool only on very large pro- software. An accurate analysis of the needgrams. will provide a stronger foundation for suc-
cessful selection of the "right" program toToday, as predicted by the late Admiral meet that need. A clear definition of theGrace Hopper on her many visits to DSMC, requirement will assist in narrowing downautomation has made a profound impact the software alternatives, which vary sig-on the processes of program manage- nificantly in price and capability. Variousment. The microcomputer has multiplied criteria must be established to measure thethe capabilities and productivity of each impact upon cost, schedule, performancemember of the program management and suitability when deciding which soft-team. Hundreds of software applications ware to buy.
8-1
8.3 NATURE OF PROGRAMS/ ware packages have strong resource fea-PROJECTS tures while others lack this advantage.
The fundamental goal of program man- When choosing a software package, atten-agement is to achieve success in develop- tion should also be given to whether or noting and fielding a system that meets the the agencies or organization associated withperformance requirements of the user, the project are already using a project man-when needed and within affordable cost agement package and if compatibility withlimits. This is accomplished through the that software would be necessary. A cost-optimization of resource constraints, time benefit analysis of compatibility is a usefuland relationships among tasks. Some pro- approach to addressing this issue.grams or projects may be categorized asresource-constrained, where the schedule 8.4 SIZE OF THE PROGRAM/depends more on the availability of re- PROJECTsources, while others may be event-driven,where the schedule depends more on the The size and complexity of the program/tasks and their interdependencies. Sched- project is another major criterion thatule risk can be optimized through the con- should be used in selecting a software pack-current scheduling of activities that have age. How many tasks are required to com-less dependency upon sequenced comple- plete the project? There may be fewer thantion. Schedule risk can also be traded off a hundred, or perhaps thousands must bewith cost by reducing the time required tracked. Some commercial packages canto complete those activities on the critical track only several hundred activities, whilepath, thus accelerating completion of the others may be unlimited except for yourentire project. disk memory. Some packages will allow
assignment of many resources to a projectAccording to Danek Bienkowski,1 author or task while others may not.of "Selecting and Implementing ProjectManagement Software", Journal of Informa- Similar importance should be placed upontion Systems Management, Fall 1988, re- consideration of time scales. Many pack-source-constrained and time-constrained ages will not allow you to schedule lessprojects should be managed differently, than a day while others will let you breaksince each requires different tools. down the program structure to the hourBienkowski said that resource-con- level. Other time concerns may be consid-strained projects require the Gantt chart ered, such as the maximum duration al-for primary emphasis, with the PERT net- lowed for a task and the maximum projectwork used as support, whereas time-con- length in time; e.g., 100 years.strained projects are effectively managedusing PERT networks primarily, with 8.5 ADVANCED FEATURESGantt charts in the support role. He alsopointed out that it is important to remem- Today, project management software pro-ber this distinction when selecting project grams are able to offer open database con-management software, because some nectivity, which allows users to link theirpackages are Gantt-oriented while others projects with other databases. This per-are PERT-oriented. Some commercial soft- mits rapid updates of project data, such as
8-2
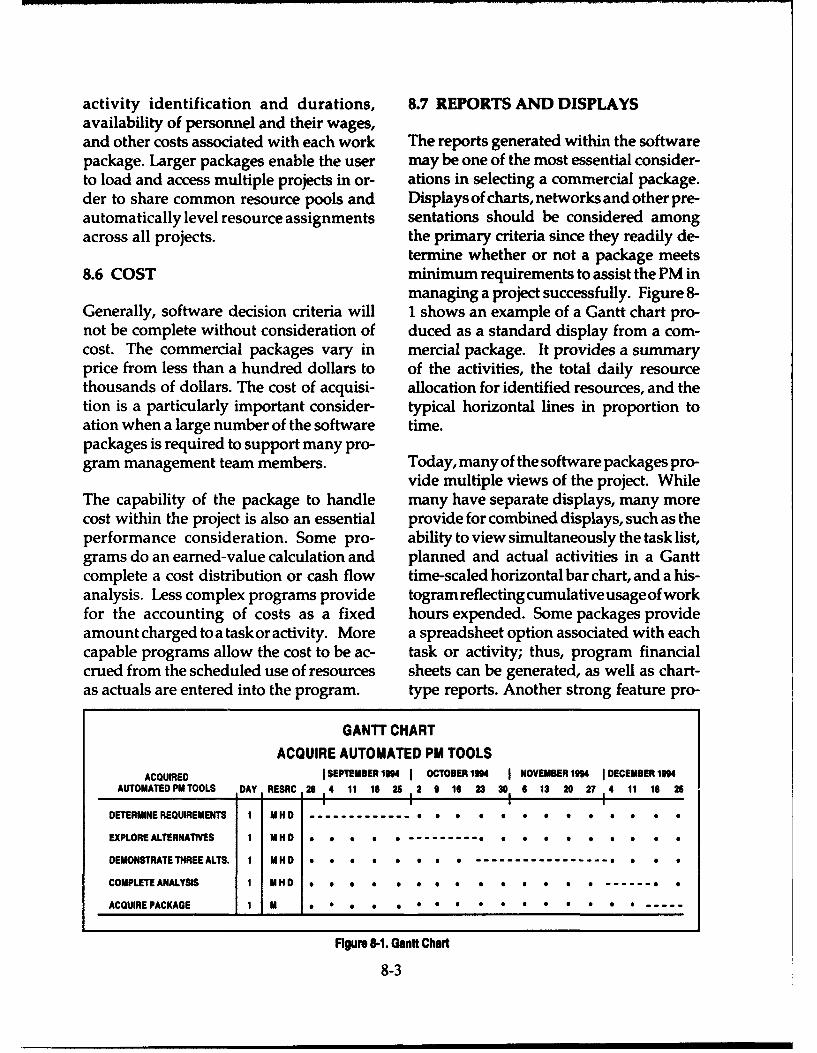
activity identification and durations, 8.7 REPORTS AND DISPLAYSavailability of personnel and their wages,and other costs associated with each work The reports generated within the softwarepackage. Larger packages enable the user may be one of the most essential consider-to load and access multiple projects in or- ations in selecting a commercial package.der to share common resource pools and Displays of charts, networks and other pre-automatically level resource assignments sentations should be considered amongacross all projects. the primary criteria since they readily de-
termine whether or not a package meets8.6 COST minimum requirements to assist the PM in
managing a project successfully. Figure 8-Generally, software decision criteria will 1 shows an example of a Gantt chart pro-not be complete without consideration of duced as a standard display from a com-cost. The commercial packages vary in mercial package. It provides a summaryprice from less than a hundred dollars to of the activities, the total daily resourcethousands of dollars. The cost of acquisi- allocation for identified resources, and thetion is a particularly important consider- typical horizontal lines in proportion toation when a large number of the software time.packages is required to support many pro-gram management team members. Today, many of the software packages pro-
vide multiple views of the project. WhileThe capability of the package to handle many have separate displays, many morecost within the project is also an essential provide for combined displays, such as theperformance consideration. Some pro- ability to view simultaneously the task list,grams do an earned-value calculation and planned and actual activities in a Ganttcomplete a cost distribution or cash flow time-scaled horizontal bar chart, and a his-analysis. Less complex programs provide togram reflecting cumulative usage of workfor the accounting of costs as a fixed hours expended. Some packages provideamount charged to a task or activity. More a spreadsheet option associated with eachcapable programs allow the cost to be ac- task or activity; thus, program financialcrued from the scheduled use of resources sheets can be generated, as well as chart-as actuals are entered into the program. type reports. Another strong feature pro-
GANTT CHARTACQUIRE AUTOMATED PM TOOLS
ACQUIRED I SEPTEMBER 1904 OCTOBER 1994 NOVEMBER 1994 DECEMBER 1114AUTOMATED PM TOOLS DAY RESRC 28 4 11 18 25 2 9 16 23 30 6 13 20 27 I4 11 18 25
DETERMINE REQUIREMENTS 1 MHD -------------------- *. e s o...... •.
EXPLORE ALTERNATIVES I MHD * e * . • ---- • o
DEMONSTRATE THREE ALTS. I MMHD. * , * -e * .........----------------- so
COMPLETE ANALYSIS 1 MHD H O * 9 e. . * ,------------------..
ACQUIRE PACKAGE 1 M 0 . .5.. ***e * 0 e
Figure 8-1. Gantt Chart
8-3
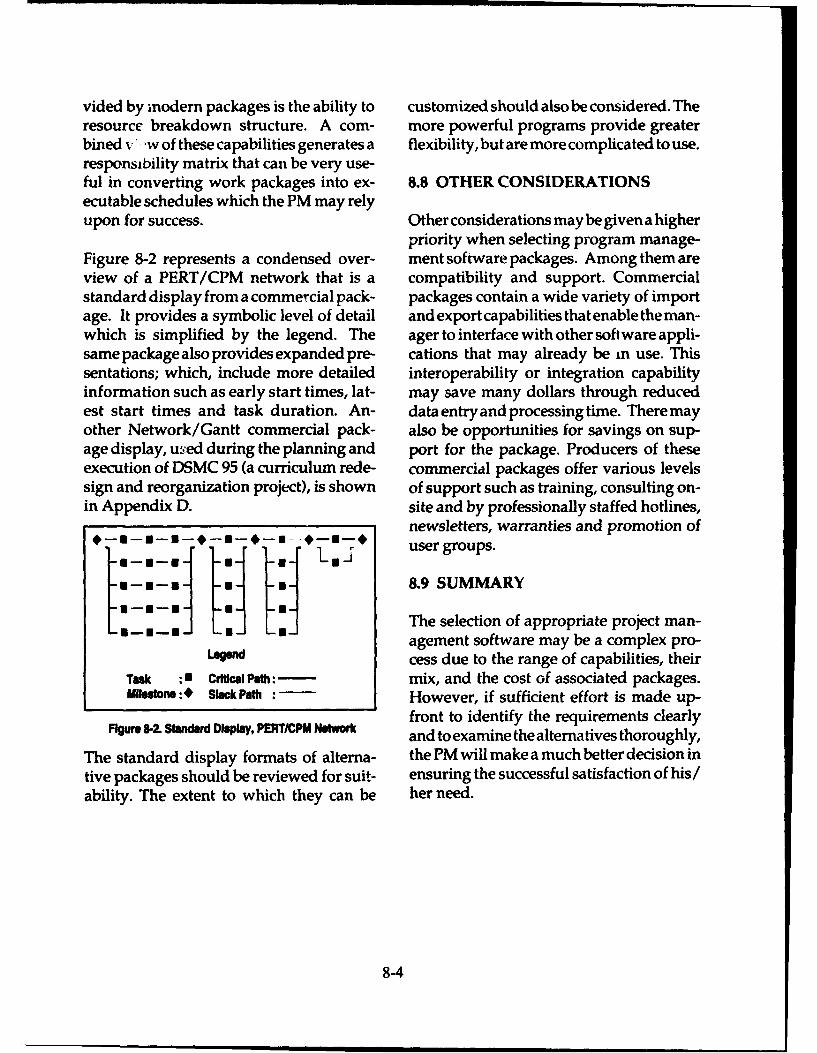
vided by modern packages is the ability to customized should also be considered. Theresource breakdown structure. A corn- more powerful programs provide greaterbined v` w of these capabilities generates a flexibility, but are more complicated to use.responsibility matrix that can be very use-ful in converting work packages into ex- 8.8 OTHER CONSIDERATIONSecutable schedules which the PM may relyupon for success. Other considerations may be given a higher
priority when selecting program manage-Figure 8-2 represents a condensed over- ment software packages. Among them areview of a PERT/CPM network that is a compatibility and support. Commercialstandard display from a commercial pack- packages contain a wide variety of importage. It provides a symbolic level of detail and export capabilities that enable the man-which is simplified by the legend. The ager to interface with other software appli-same package also provides expanded pre- cations that may already be in use. Thissentations; which, include more detailed interoperability or integration capabilityinformation such as early start times, lat- may save many dollars through reducedest start times and task duration. An- data entry and processing time. Theremayother Network/Gantt commercial pack- also be opportunities for savings on sup-age display, used during the planning and port for the package. Producers of theseexecution of DSMC 95 (a curriculum rede- commercial packages offer various levelssign and reorganization project), is shown of support such as training, consulting on-in Appendix D. site and by professionally staffed hotlines,
newsletters, warranties and promotion ofmU user groups.
8.9 SUMMARY
tU_ n4 .Le I -g-The selection of appropriate project man-agement software may be a complex pro-
Legend cess due to the range of capabilities, their
Task ,i Critical Path: - mix, and the cost of associated packages.Milestone :* Slack Path However, if sufficient effort is made up-
front to identify the requirements clearlyFigure 8-2. Standard Display, PERT/M Network and to examine the alternatives thoroughly,
The standard display formats of alterna- the PM will make a much better decision intive packages should be reviewed for suit- ensuring the successful satisfaction of his/ability. The extent to which they can be her need.
8-4
4 -'
9RECAPITULATION
The PM is responsible to top management time, cost and performance have to be mea-for getting the job done on schedule and sured. Necessary corrections have to bewithin the allowable cost. Today, network- made to ensure achievement of the pro-based systems assist the PM in planning, gram objectives.scheduling and controlling the work to beaccomplished - often by people in sepa- * The activity-oriented Gantt charts arerate organizations not under the manager's useful when activities are not closely re-direct control. The PM needs a plan that lated and the program is relatively small.will provide a constant and up-to-date pic- The chart's value is its ease of preparationture that is understood by all. and use, along with its ability to show key
activities with specific start and comple-Scheduling, cost and performance are ma- tion times.jor elements of concern to the PM, whoshould be able to blend them to meet pro- * The milestone charts, which aregram objectives. When selecting a sched- event-oriented, will indicate progress byuling method, the PM can make a con- displaying start and completion dates, butscious trade-off between the sophisticated may invite surprises because the PM maymethods available and cost. not know the program status until an event
9.1 PRINCIPAL POINTS occurs, or fails to occur.
The principal points to be derived from this * The network displays how a pro-guide are the following: gram can be done by depicting activities
and their relationships. The schedule es-* Schedule, time and cost are the three tablishes how it is planned by showing the
major elements to control in any program. time it takes to get done.These can be in conflict; therefore, trade-offs may have to be made. * A network identifies the critical path,
slack (time an activity or event can be ex-* All programs involve planning, tended and still be completed on time) and
scheduling and controlling. During the activities needing rescheduling. Activitiesplanning phase, objectives, organization on the critical path have zero slack andand resources are determined. During the must be completed on time to prevent slip-scheduling phase - the phase with which page of the overall program completionthis guide is concerned - personnel re- date.quirements have to be determined, andtime to complete the work and the cost * The CPM, a network-based schedul-have to be estimated. During the control ing method, uses a linear time-cost trade-phase, the program's progress in terms of off; i.e., it adds the concept of cost to the
9-1
PERT format. If necessary, each activity however, computer assistance is almost acan be completed in less than normal time necessity for large and complex networks.by crashing the activity for a given cost.
0 Network-theory assumptions that* The LOB technique of scheduling is activities are independent, discrete and
effective in manufacturing where a final predictable are not always appropriate inassembly line is fed by many component actual applications. The departure fromlines and delivery of end-units is required reality; however, does not normally affectat predetermined specified intervals. Ef- planning and coordinating efforts in criti-fectiveness of LOB is based on the design of cal-path scheduling.the assembly plan.
This guide has presented a brief descrip-* Computer programs are available tion of thebasic elements of program sched-
for network-based scheduling. Manual uling. These elements constitute one com-calculations are feasible for small prob- ponent of the overall management systemslems like those set forth in this guide; in use today.
9-2
APPENDIX AINTEGRATED MASTER SCHEDULE
The master schedule for a program should schedules should not be released outsidebe a time reference baseline for the pro- the PMO.gram.' To do this, it must be kept up-to-date with an approved program for cost, These are simple rules, but they are notschedule and performance. An approved practiced by many PMs. Consequently,program is one incorporating an officially programs suffer from unauthorized re-approved schedule to achieve approved lease of schedule information that has notperformance levels within approved cost been integrated into the master scheduleallocations. Maintenance of the master and has not been approved by the PM.baseline is a task akin to that inherent inconfiguration control. Program Reviews
Program changes, whatever the source, The master schedule can be a frameworkstart as proposals and, if approved, grow for periodic program reviews within theinto a firm plan. Eventually, they are incor- PMO. If constructed properly, the scheduleporated into the program as changes. The will illustrate the top-most levels of thequestion of when to plot these changes is a program and will be compatible with thematter of judgement and should reflect the program cost/schedule control systemPM's policy. Each change should be plot- reports.ted as a proposed or tentative change untilapproved. Program reviews can be an excellent forum
for resolution of schedule conflicts and theA permanent record of each change genesis for controlled changes to the sched-should be maintained. If the program ule from within the PMO. Most key mem-schedule slips, it should be documented bers of the PMO team are present at theseuntil documentation no longer serves a reviews; therefore, proposed scheduleuseful purpose. changes or slips can receive wide dissemi-
nation within the organization.Schedule Discipline
"What If" ExercisesThe degree of schedule discipline imposedwithin the program management office The master schedule can serve as the frame-(PMO) can be a major factor in the use of work for "what if' exercises imposed onthe master schedule. Whenever copies of programs from outside the PMO. Sched-the master schedule are made, they should ule changes can be plotted manually bybe dated and authenticated by the signa- using overlays. Using the same grid coor-ture of the PM or the appointed schedule dinates on an overlay allows the PMOmanager. Undated and unauthenticated team to see, clearly and graphically, the
A-1
effect of the compressions or extensions of * Have an integrated schedule pre-sub-milestones on the program. It may be pared in the PMO and maintain control.even easier (and more productive) for thePMO team to run "what if' exercises on a * Not overestimate the job. A fewcomputerized schedule. smart people on the program team can do
Without a master schedule as a baseline, amazing things in 7-10 days.
these exercises can take longer to accom- * Not try to get too fancy too fast.plish and they may overlook important Keep the schedule simple until the PMOvariances from the program's established team has mastered the program and thebaseline schedule or plan. basics of the process.
Program Briefings 9 Use the schedule as a basic manage-
The master schedule can serve as a baseline ment tool and make it compatible with thefor program reviews at higher headquar- WBS and contract structure.ters and other reviews or briefings outsidethe PMO. Most programs have key mile- P Instill discipline in the team. Thestones taken from the master schedule and PM should not allow program schedulepresented in summary form on viewgraphs changes to leave the PMO until he/she hasor slides. If these do not show the detail reviewed and approved them. He/sherequired to make a point, the time span should be sure every team member worksshown can be reduced to the point where to the same schedule.the details become visible.
* Plan for the unknown. The PMThe master schedule can be transported should not approach complex events,with the team accomplishing the briefing, like source selection or DAB reviews, withbut this is not recommended. Extensive only a viewgraph-level plan.handling of the schedule chart can causeunnecessary wear and may result in a need * Not accept an incomplete sched-to redraw it. This can be a significant task ule when assigning the effort to a memberbecause the master schedule may be 7' x 10' of the PMO team. An incomplete scheduleor as large as 10' x 15'. could lead to program problems or a can-
celled program.Conclusion
The PM should remember the followingguidelines:
A-2
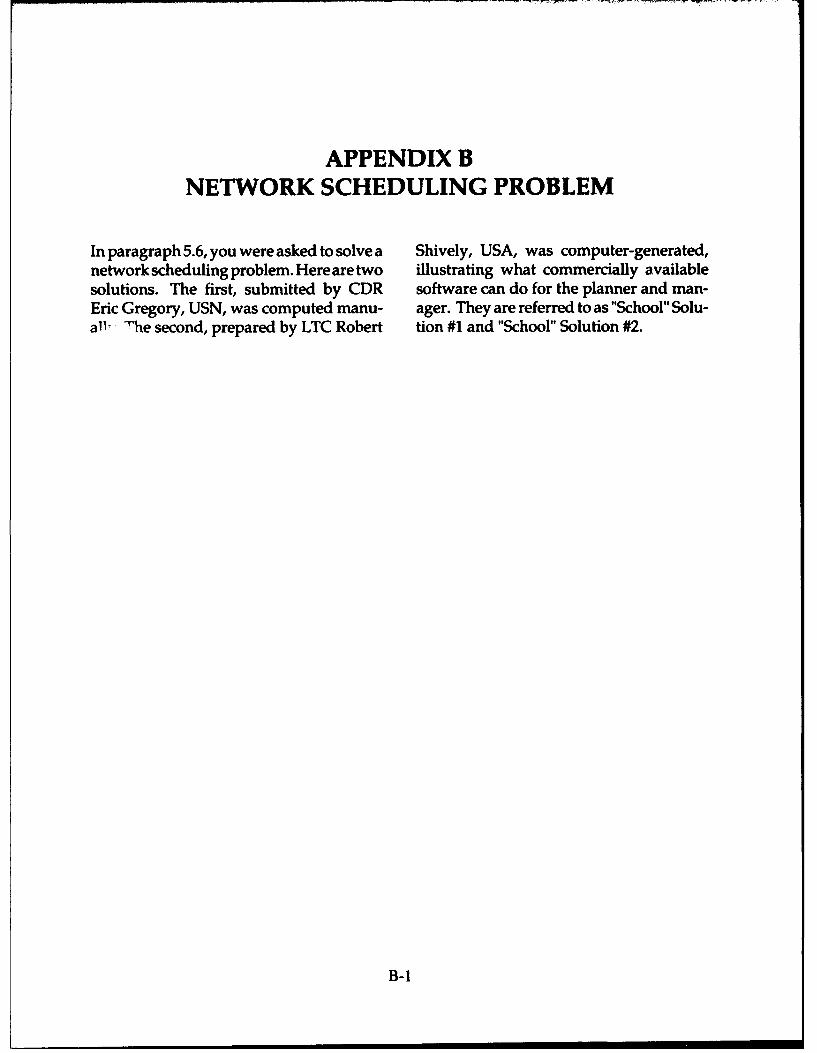
APPENDIX BNETWORK SCHEDULING PROBLEM
In paragraph 5.6, you were asked to solve a Shively, USA, was computer-generated,network scheduling problem. Here are two illustrating what commercially availablesolutions. The first, submitted by CDR software can do for the planner and man-Eric Gregory, USN, was computed manu- ager. They are referred to as "School" Solu-all- 'he second, prepared by LTC Robert tion #1 and "School" Solution #2.
B-1
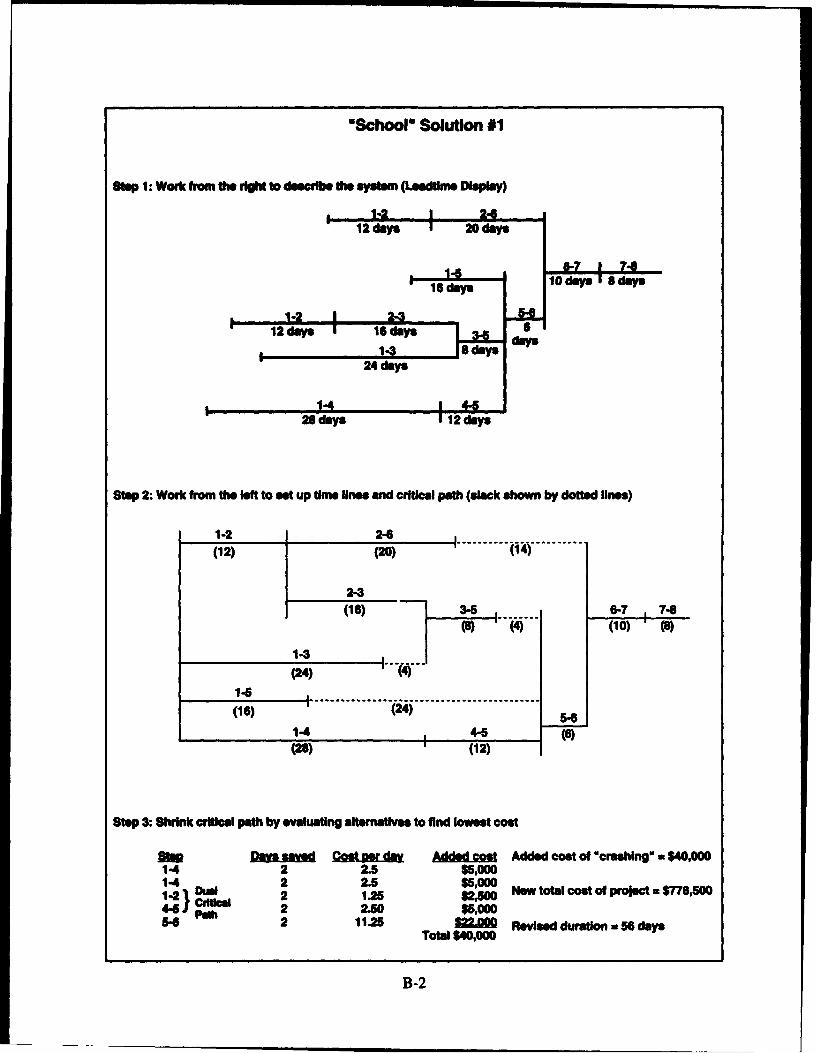
"School" Solution #1
Step 1: Work from the right to desoribe the system (Leedme Drsply)
12 days I 24
S1-5 87 17120 day s
14
12 days I- 16dim i_•x1-3• I ~ai d
24 days
26days 1 12days
Stop 2: Work from the left to set up time lines and critical path (slack shown by dotted lines)
1-2 2-6(12) (20) (14)
2-3(16) 3-5 6-7 748
(a) (4) (10) (a)
1-3(24)
1-5
(16) (24) 5-.
1-4 4-5 (6)(28) (12)
Step 3: Shrink critical path by evaluating alltatives to find lowest cost
SI Wsnand CM tugdmx Addedst Added cost of "crashing" a $40,0001-4 2 2.5 $5,0001-4 2 2.5 $5,000
2 1.25 $2,M New total cost of project a $776•504- Ctm 2 2.50 $5,000
54 2 11.25 22M Reviad duration 56 daysTotal $40,000
B-2
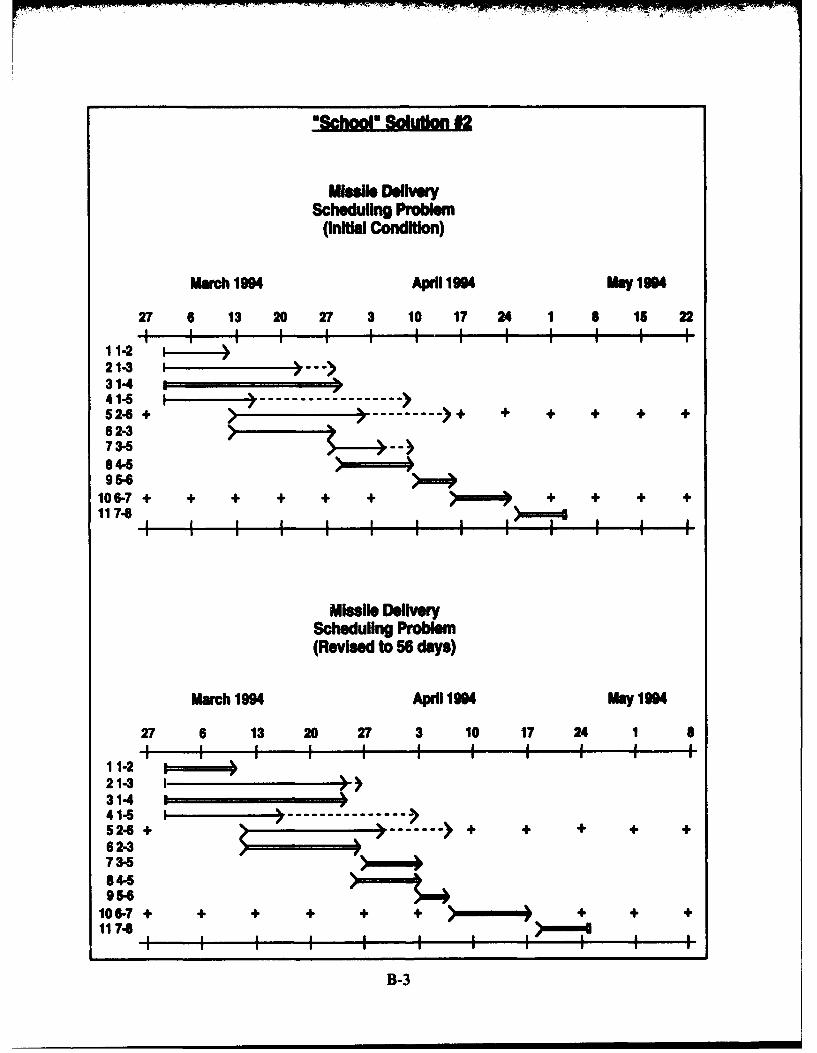
"School" Solution #2
Miselle DeliveryScheduling Problem
(Initial Condition)
March 1994 April 1994 may 1994
27 6 13 20 27 3 10 17 24 1 1 15 2211 I I I I2 I I I I
1 1-2 '
21-3 I >-->31441-5 I --------- --------52+ -- ) + + + + + +62-373-684-59 5-6
106-7 + + + + + + + + + +117-8 I I I I I I I I I
Missile DelivrScheduling Problem(Revised to 56 days)
March 1994 April 1994 may 1994
27 6 13 20 27 3 10 17 24 1 8IIII I I IiI I
11-221-3 I314 141-5 I ---------- --52-6 + - ------- > + + + + +62-3
O
73-564-6954
106-7+ + + + + + + + +117-6 ,-
SI I I I I I
B-3
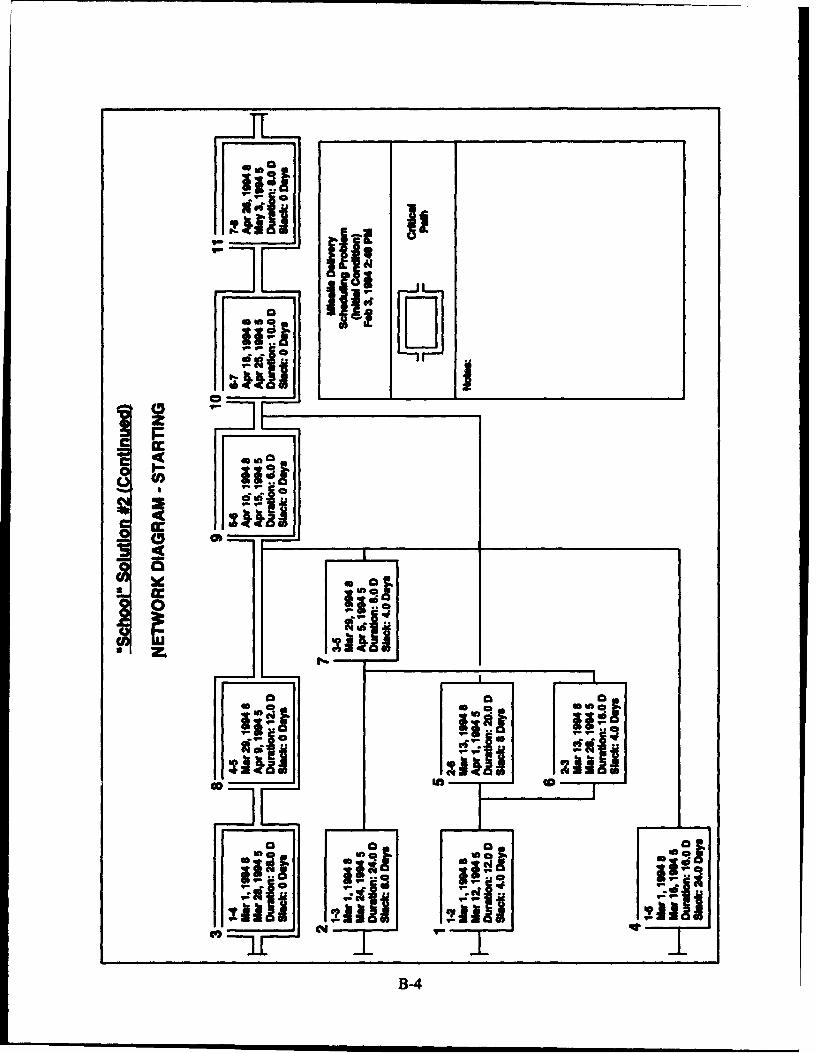
rili
B-
_ _ ]I ' '
- - ' a
BA
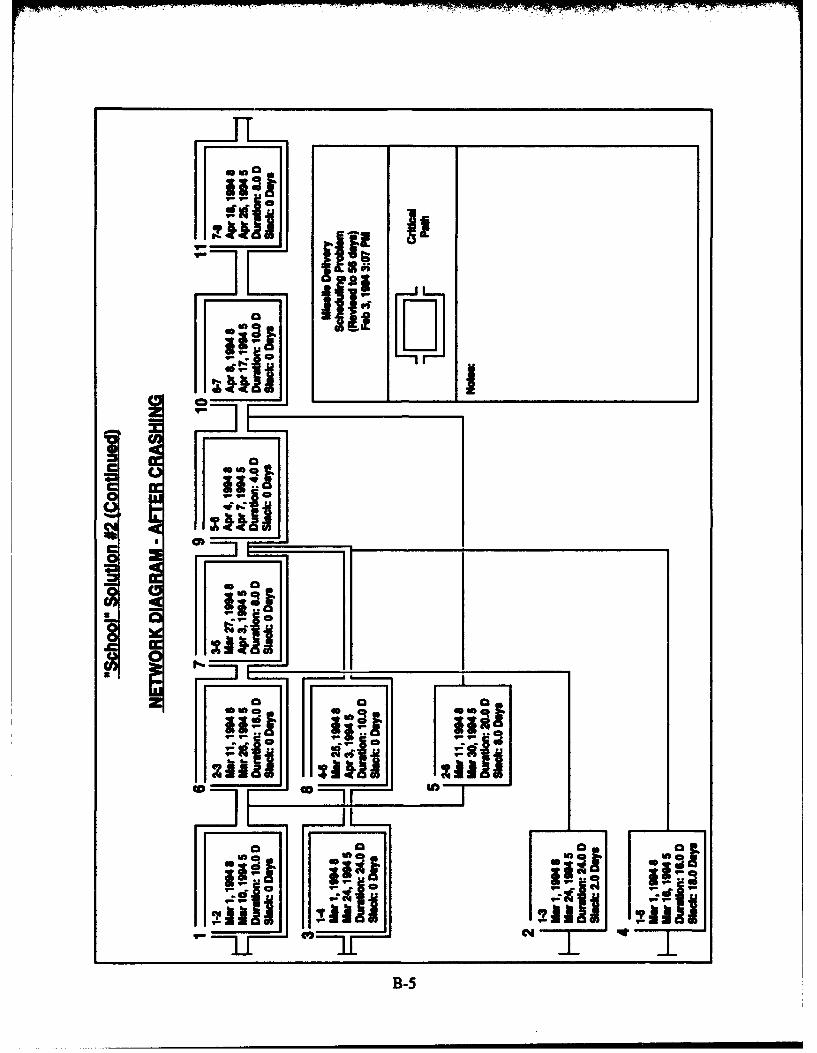
F-jll4111 for
'liI A111cAll
B-5
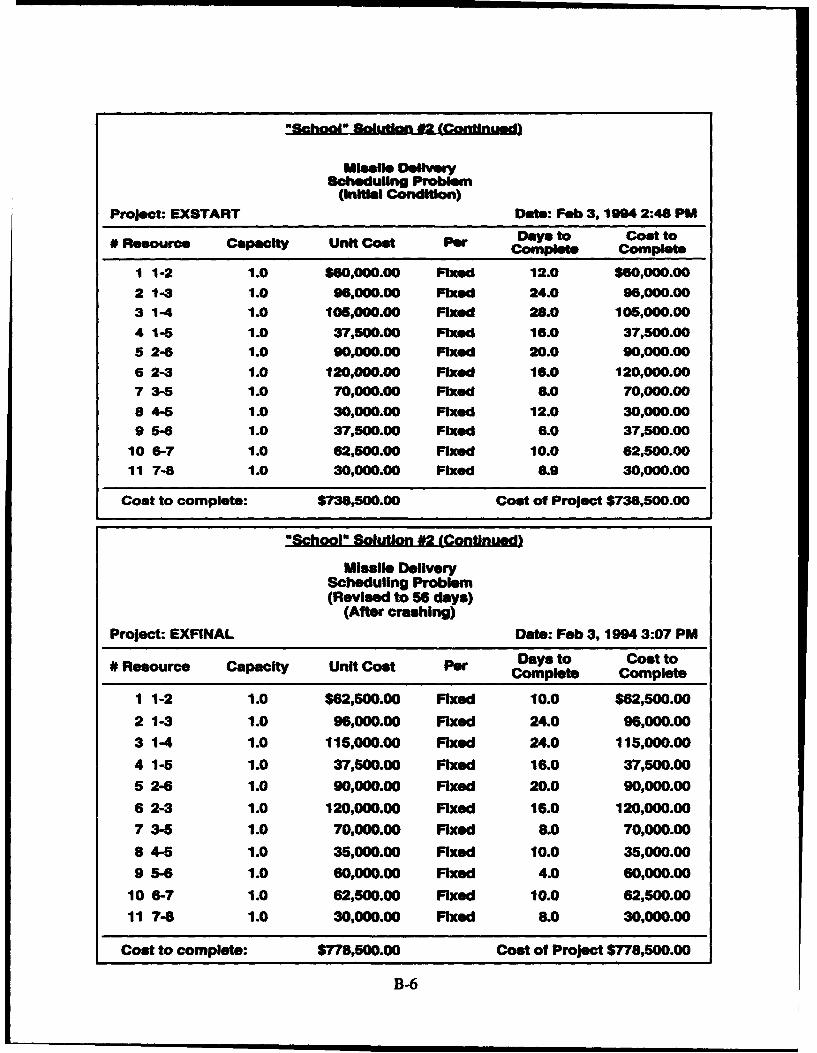
*School Solution 4 12ontnuad)
Missile DeliveryScheduling Problem
(Inial Condition)
Project: EXSTART Date: Feb 3,1994 2:48 PM
# Resource Capacity Unit Cost Per Days to Cost tocomplete Complete
1 1-2 1.0 $60,000.00 Fixed 12.0 $60,000.00
2 1-3 1.0 96,000.00 Fixed 24.0 96,000.00
3 1-4 1.0 105,000.00 Fixed 28.0 105,000.00
4 1-5 1.0 37,500.00 Fixed 16.0 37,500.00
5 2-4 1.0 90,000.00 Fixed 20.0 90,000.00
6 2-3 1.0 120,000.00 Fixed 16.0 120,000.00
7 3-5 1.0 70,000.00 Fixed 6.0 70,000.00
8 4-5 1.0 30,000.00 Fixed 12.0 30,000.00
9 5-6 1.0 37,500.00 Fixed 6.0 37,500.00
10 6-7 1.0 62,500.00 Fixed 10.0 62,500.00
11 7-8 1.0 30,000.00 Fixed 6.9 30,000.00
Cost to complete: $738,500.00 Cost of Project $738,500.00
"School" Solution #2 (Continued)
Missile DeliveryScheduling Problem(Revised to 56 days)
(After crashing)
Project: EXFINAL Date: Feb 3, 1994 3:07 PM
# Resource Capacity Unit Cost Per Days to Cost to
Complete Complete
1 1-2 1.0 $62,500.00 Fixed 10.0 $62,500.00
2 1-3 1.0 96,000.00 Fixed 24.0 96,000.00
3 1-4 1.0 115,000.00 Fixed 24.0 115,000.00
4 1-5 1.0 37,500.00 Fixed 16.0 37,500.00
5 2-6 1.0 90,000.00 Fixed 20.0 90,000.00
6 2-3 1.0 120,000.00 Fixed 16.0 120,000.00
7 3-5 1.0 70,000.00 Fixed 8.0 70,000.00
8 4-5 1.0 35,000.00 Fixed 10.0 35,000.00
9 5-6 1.0 60,000.00 Fixed 4.0 60,000.00
10 6-7 1.0 62,500.00 Fixed 10.0 62,500.00
11 7-8 1.0 30,000.00 Fixed 8.0 30,000.00
Cost to complete: $778,500.00 Cost of Project $778,500.00
B-6
APPENDIX CGLOSSARY
The following is a glossary of basic project management terms.
ACTIVITY - A task or measurable amount of work to complete a job or part of a project.
BASELINE - A defined quantity or quality of performance used as a starting point forsubsequent progress measurement. The most common baseline is cost, schedule andperformance. Control of cost and schedule would be assisted by project managementpackages, while each is traded off with performance.
CRITICAL PATH METHOD (CPM) - A technique that assists with determination ofearly and late start times for activities based upon dependency of other activities and thetime required to complete them. Activities which, when delayed, have an impact on thetotal project schedule, are critical and are said to be on the critical path.
FLOAT/SLACK - The period of time that an activity may be delayed without becominga critical activity.
GANTT CHART - A graphic portrayal of a project which shows the activities to becompleted and the time to complete them as represented by horizontal lines drawn inproportion to the duration of the activity. Some Gantt charts will be able to show the floatfor the activity.
MILESTONE - An event in the project which marks a control point, major accomplish-ment or significant decision point.
PERT CHART - A graphic portrayal of milestones, activities and their dependencyupon other activities for completion of a project; also depicts the project's critical path,which is the longest path of activities for a project.
RESOURCE - Any person, tool, equipment or material used to complete an activity ortask.
RESOURCE LEVELING - A process whereby resources are sorted out among tasks andactivities to identify and avoid conflicts between scheduling and availability.
WORK BREAKDOWN STRUCTURE (WBS) - An organized method used to breakdown a project into logical subdivisions or subprojects at lower and lower levels of detail.It is very useful in organizing a project.
C-1
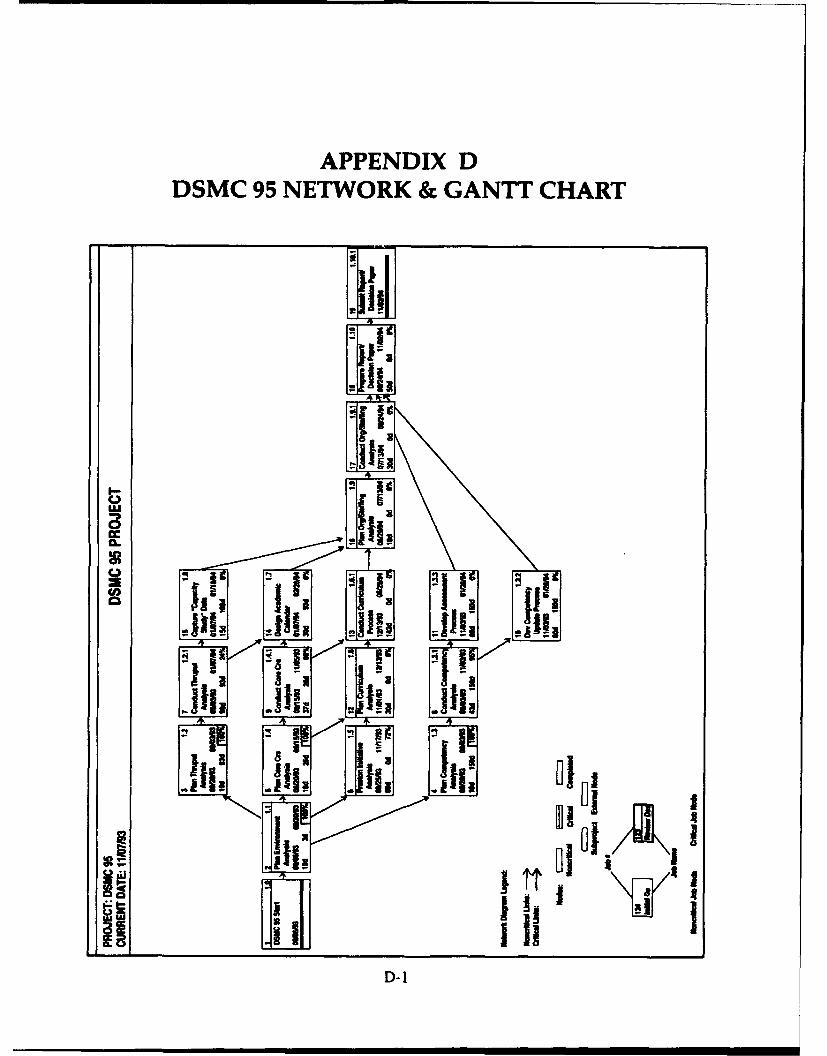
APPENDIX DDSMC 95 NETWORK & GANTT CHART
I III
I--
U
a--
; -
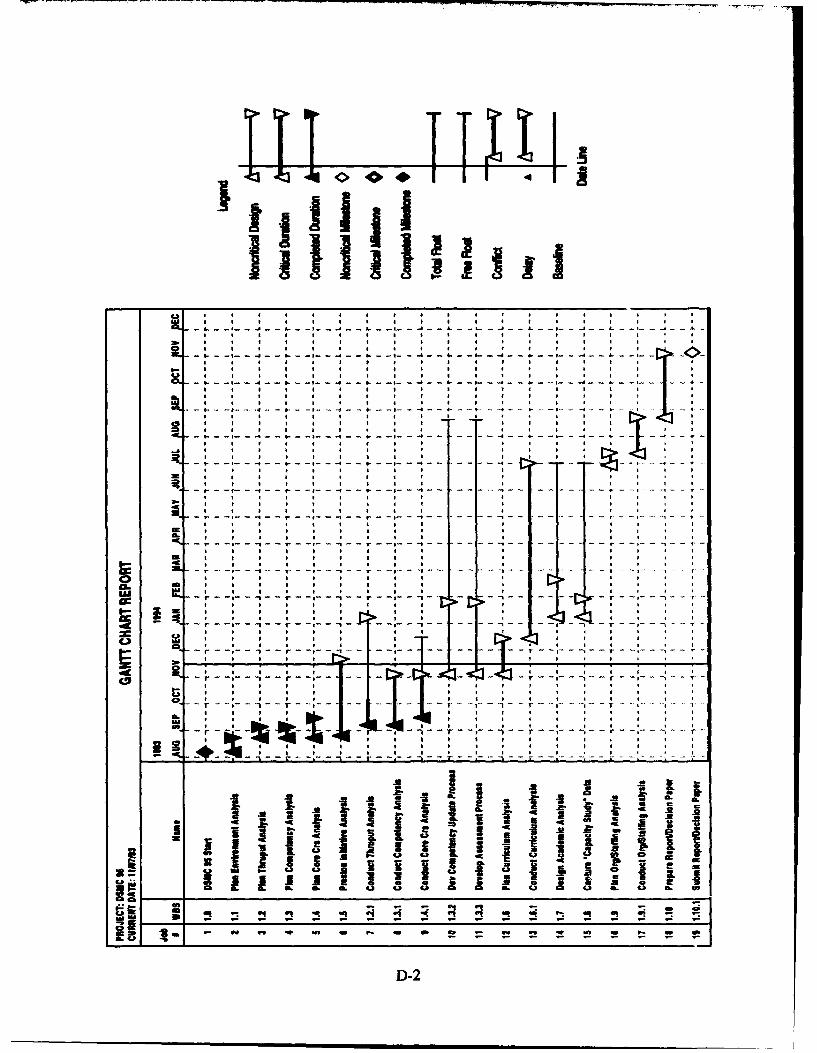
T-t ----- I -I -
cc a a a a a aaML a a a a I a a a a
a S S 4 a a i a
us a a a a a a a
a a a a a I - . . . . . .
Is, a a a a a a
*~~~~4 I 4 a a a
0. 0. aj a a a aaw CA a6 aL a. 9L aopa
r4;----------------
a a a a a aD a2
APPENDIX EENDNOTES
Chapter 5
1. James L. Riggs and A. James Kalbaugh, The Art of Management, McGraw-Hill, New York,N.Y., 1974.
2. Techniques for determining task duration are shown in references such as Kezsbom,Schilling and Edward, Dynamic Project Management, John Wiley & Sons, Inc., New York,N.Y., 1989; and Horowitz, Critical Path Scheduling, The Ronald Press Company, 1985.
3. Charles J. Teplitz, PMP, ard Jean-Pierre Amor, University of San Diego, "ImprovingCPM's Accuracy Using Learning Curves," Project Management Journal, December 1993.
4. J. H. Mize, "A Heuristic Scheduling Model for Multi-Project Organizations," unpub-lished Ph.D. thesis, Put,1.ae University, Lafayette, Ind., 1964.
5. L. G. Fendley, "Toward the Development of a Complete Multi-Project SchedulingSystem," Journal of Industrial Engineering, 1968.
6. J. Moshman, J. Johnson and M. Larsen, "Ramps - A Technique for Resource Allocationand Multi-Project Scheduling," Proceedings of the 1963 Spring Joint Computer Conference,Spartan Books, Baltimore, Md., 1963.
7. B. M. Woodworth and C. W. Dane, Multi-Project Network Analysis with Resource Leveling:State-of-the-Art and a Governmental Application, Oregon State University, Corvalis, Ore.,1974.
8. William E. Sauder, "Project Selection, Planning, and Control," Handbook of OperationsResearch: Models and Applications, J. J. Moder and S. E. Elmaghraby (eds), Van NostrandReinhid Company, New York, N.Y., 1978.
Chapter 6
1. James T. McCay, The Management of Time, Prentice-Hall, Inc., Englewood Cliffs, N.J.,1959.
2. Contract schedule should be interpreted broadly to include the schedule for in-houseand contracted production.
E-1
Chapter 7
1. John H. Richardso' , Time Defeats Technology, Hughes Aircraft Company, Culver City,Calif., date unknown.
2. Ibid.
3. Russell W. Peterson, former DuPont executive, Governor of Delaware and White Houseadvisor, "New Venture Management in a Large Company," Harvard Business Review, May-June 1967, P.72.
Chapter 8
1. Danek Bienkowski, Journal of Information Systems Management, Auerbach Publishers,Boston, Mass., 1988.
2. Figures 8-1 and 8-2, Project Workbench, Applied Business Technology Corporation, NewYork, N.Y., 1989.
Appendix A
1. Experts from a report by Major John Wade Douglass, Development of an Integrated MasterSchedule for Weapon System Acquisition, while a student at the Defense Systems ManagementCollege, May 1977.
E-2
SECURITY CLASSIFICATION OF THIS PAGE
Form Approved
REPORT DOCUMENTATION PAGE OMB No. 0704-01"
la. REPORT SECURITY CLASSIFICATION lb. RESTRICTIVE MARKINGS
UNCLASSIFIED NONE2a. SECURITY CLASSIFICATION AUTHORITY 3 DISTRIBUTION/AVAILABILITY OF REPORT
N/A2b. DECLASSIFICATION/DOWNGRADING SCHEDULE Approved for public release. Distribution
N/A unlimited.4. PERFORMING ORGANIZATION REPORT NUMBER(S) S. MONITORING ORGANIZATION REPORT NUMBER(S)
N/A N/A6a. NAME OF PERFORMING ORGANIZATION 6b. OFFICE SYMBOL 7a. NAME OF MONITORING ORGANIZATION
(If applicable)Defense Systems Mgmt College FD-PM Defense Systems Management Co llege
6c. ADDRESS (City, State, and ZIP Code) 7b. ADDRESS (City, State, and ZIP Code)
9820 Belvoir Road 9820 Belvoir RoadSuite G38 Suite G38Fort Belvoir, VA 22060-5565 Fort Belvoir, VA 22060-5565
Ba. NAME OF FUNDING/SPONSORING 8b. OFFICE SYMBOL 9. PROCUREMENT INSTRUMENT IDENTIFICATION NUMBERORGANIZATION (If applicable)
Defense Systems Mgmt College RcNr N/A8c. ADDRESS (City, State, and ZIP Code) 10. SOURCE OF FUNDING NUMBERS
PROGRAM PROJECT TASK WORK UNIT
Same as 6c. ELEMENT NO. NO. NO. ACCESSION NO.
11. TITLE (Include Security Classification)
Scheduling Guide for Program Managers12. PERSONAL AUTHOR(S)
Paul T. McMahon (DSMC); William W. Bahnmaier DSMC)13a. TYPE OF REPORT 13b. TIME COVERED 114. DATE OF REPORT (Year, Month, Day) 11. PAGE COUNT
Guide FROM TO 94/07/01I 6416. SUPPLEMENTARY NOTATION
17. COSATI CODES 18. SUBJECT TERMS (Continue on reverse if necessary and identify by block number)FIELD GROUP SUB-GROUP Program Manager, Program Evaluation and Review Techniques,
Critical Path Method, Line of Balance, Critical Path,Milestone Chart, Network
19. ABSTRACT (Continue on reverse if necessary and identify by block number)
This guide was designed to provide the program manager and program management personnelwith an understanding of, and a basic working familiarity with, the newest and mosteffective scheduling methods used in defense systems acquisition. It is particularlyuseful in the planning and controlling for all phases of a defense acquisition program.The guide includes a discussion of schedulirng considerations, methods of scheduling, timemanagement, line-of-balance, and resource leveling. The chapter on automated schedulingtools has been updated to reflect the latest computer software available.
20. DISTRIBUTION/AVAILABILITY OF ABSTRACT 21. ABSTRACT SECURITY CLASSIFICATIONlI UNCLASSIFIED/UNLIMITED 0 SAME AS RPT. 0 DTIC USERS UNCLASSIFIED
22a. NAME OF RESPONSIBLE INDIVIDUAL 22b TELEPHONE (Include Area Code) 22c. OFFICE SYMBOLWilliam W. Bahnmaier 703-805-3670 DSMC-FD-PM
DD Form 1473, JUN 86 Previous editions are obsolete. SECURITY CLASSIFICATION OF THIS PAGE