Embed Size (px)
Citation preview
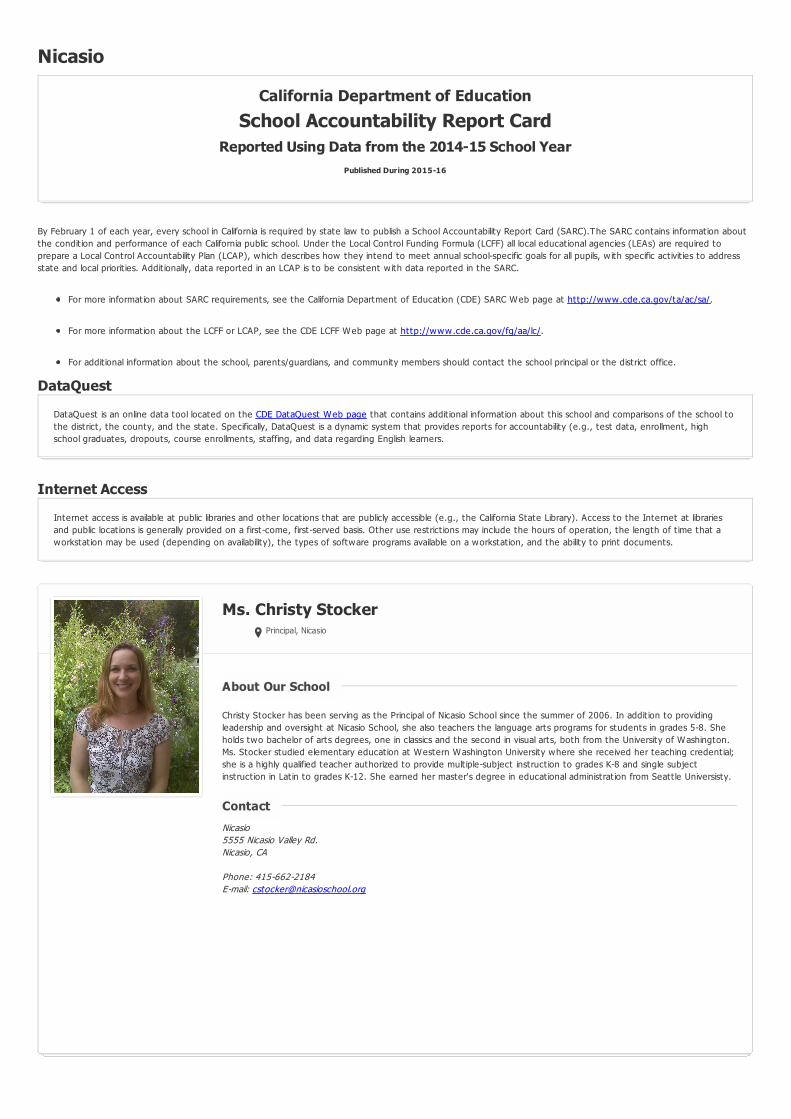
Nicasio
By February 1 of each year, every school in California is required by state law to publish a School Accountability Report Card (SARC).The SARC contains information aboutthe condit ion and performance of each California public school. Under the Local Control Funding Formula (LCFF) all local educat ional agencies (LEAs) are required toprepare a Local Control Accountability Plan (LCAP), which describes how they intend to meet annual school-specific goals for all pupils, w ith specific act ivit ies to addressstate and local priorit ies. Addit ionally, data reported in an LCAP is to be consistent w ith data reported in the SARC.
For more information about SARC requirements, see the California Department of Educat ion (CDE) SARC Web page at http://www.cde.ca.gov/ta/ac/sa/.
For more information about the LCFF or LCAP, see the CDE LCFF Web page at http://www.cde.ca.gov/fg/aa/lc/.
For addit ional information about the school, parents/guardians, and community members should contact the school principal or the district office.
DataQuest
Internet Access
California Department of Education
School Accountability Report CardReported Using Data from the 2014-15 School Year
Published During 2015-16
DataQuest is an online data tool located on the CDE DataQuest Web page that contains addit ional information about this school and comparisons of the school tothe district , the county, and the state. Specifically, DataQuest is a dynamic system that provides reports for accountability (e.g., test data, enrollment, highschool graduates, dropouts, course enrollments, staffing, and data regarding English learners.
Internet access is available at public libraries and other locat ions that are publicly accessible (e.g., the California State Library). Access to the Internet at librariesand public locat ions is generally provided on a first-come, first-served basis. Other use restrict ions may include the hours of operat ion, the length of t ime that aworkstat ion may be used (depending on availability), the types of software programs available on a workstat ion, and the ability to print documents.
Ms. Christy StockerPrincipal, Nicasio
Christy Stocker has been serving as the Principal of Nicasio School since the summer of 2006. In addit ion to providingleadership and oversight at Nicasio School, she also teachers the language arts programs for students in grades 5-8. Sheholds two bachelor of arts degrees, one in classics and the second in visual arts, both from the University of Washington.Ms. Stocker studied elementary educat ion at Western Washington University where she received her teaching credent ial;she is a highly qualified teacher authorized to provide mult iple-subject instruct ion to grades K-8 and single subjectinstruct ion in Lat in to grades K-12. She earned her master's degree in educat ional administrat ion from Seatt le Universisty.
Nicasio5555 Nicasio Valley Rd.Nicasio, CA
Phone: 415-662-2184E-mail: [email protected]
About Our SchoolAbout Our School
ContactContact
Last updated: 1/30/2016
Last updated: 1/30/2016
About This School
Contact Information - Most Recent YearContact Information - Most Recent Year
District Contact Information - Most Recent Year
District Name Nicasio
Phone Number (415) 662-2184
Superintendent Thomas Lohwasser
E-mail Address superintendent@dixieschooldistrict .org
Web Site www.nicasioschool.org
School Contact Information - Most Recent Year
School Name Nicasio
Street 5555 Nicasio Valley Rd.
City, State, Zip Nicasio, Ca,
Phone Number 415-662-2184
Principal Ms. Christy Stocker
E-mail Address [email protected]
Web Site www.nicasioschool.org
County-District-School (CDS) Code
21654096024483
School Description and Mission Statement - Most Recent YearSchool Description and Mission Statement - Most Recent Year
OVERVIEW
Nicasio School serves approximately 50 students in grades TK-8. Students learn in mult i-grade classrooms w ith highly skilled teachers and support staff whoprepare them for transit ion to high school and life outside of Nicasio's rural community. While many graduat ing 8th graders attend Sir Francis Drake High School inSan Anselmo, many others attend private high schools in Marin County and San Francisco.
Nest led in the heart of Marin County, California, Nicasio School is one of the few remaining single-school public school districts in Marin. The district itself wasestablished in 1862 w ith the first Nicasio schoolhouse constructed in 1867.
Nicasio School has changed dramatically since the late 1800s. Thanks to voters support ing a $2.4 million school bond in 1999, today's campus is comprised ofmodern, state-of-the-art facilit ies. In addit ion to large classrooms, students at Nicasio School have access to the school's library, art room, up-to-date technology,and a mult i-purpose room equipped w ith a stage and full kitchen. Having the advantage of a rural environment, students also enjoy working in the school’sorganic garden w ith support from their teachers along w ith parent and community volunteers.
VISION STATEMENT
Nicasio School prepares students to excel in high school and in life by attract ing and maintaining outstanding teachers who deliver a st imulat ing curriculum throughinnovat ive instruct ional methods. Working w ith parents and the community, we support all students in reaching their full potent ial academically, physically, andemotionally by providing a safe and nurturing environment.
MISSION STATEMENT
Benefit ing from its unique rural sett ing, strong sense of community and dist inguished history, Nicasio School w ill educate children to value learning, act w ithintegrity, live a healthful life, and part icipate as responsible cit izens both globally and locally.
2014-15 SARC - Nicasio
Page 2 of 31
Last updated: 1/30/2016
Last updated: 1/30/2016
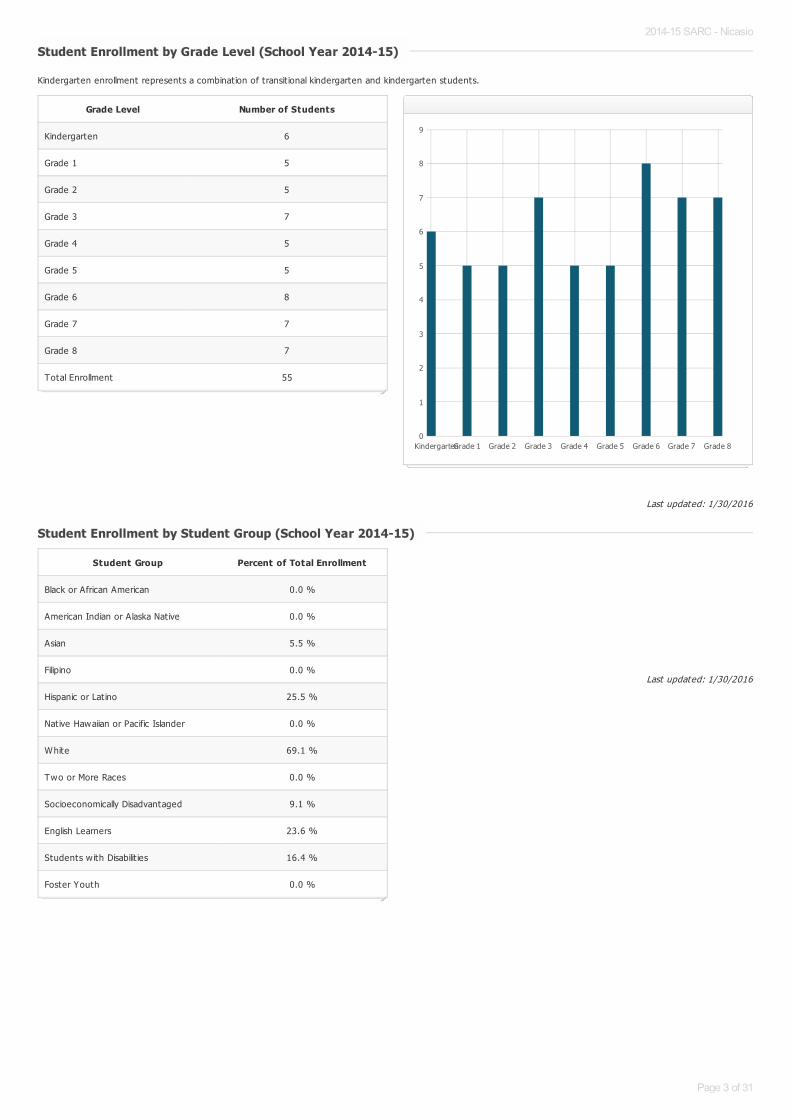
Kindergarten enrollment represents a combinat ion of transit ional kindergarten and kindergarten students.
Student Enrollment by Grade Level (School Year 2014-15)Student Enrollment by Grade Level (School Year 2014-15)
Grade Level Number of Students
Kindergarten 6
Grade 1 5
Grade 2 5
Grade 3 7
Grade 4 5
Grade 5 5
Grade 6 8
Grade 7 7
Grade 8 7
Total Enrollment 55
KindergartenGrade 1 Grade 2 Grade 3 Grade 4 Grade 5 Grade 6 Grade 7 Grade 80
1
2
3
4
5
6
7
8
9
Student Enrollment by Student Group (School Year 2014-15)Student Enrollment by Student Group (School Year 2014-15)
Student Group Percent of Total Enrollment
Black or African American 0.0 %
American Indian or Alaska Nat ive 0.0 %
Asian 5.5 %
Filipino 0.0 %
Hispanic or Lat ino 25.5 %
Native Hawaiian or Pacific Islander 0.0 %
White 69.1 %
Two or More Races 0.0 %
Socioeconomically Disadvantaged 9.1 %
English Learners 23.6 %
Students w ith Disabilit ies 16.4 %
Foster Youth 0.0 %
2014-15 SARC - Nicasio
Page 3 of 31
Last updated: 1/30/2016
A. Conditions of Learning
State Priority: Basic
The SARC provides the follow ing information relevant to the State priority: Basic (Priority 1):
Degree to which teachers are appropriately assigned and fully credent ialed in the subject area and for the pupils they are teaching;Pupils have access to standards-aligned instruct ional materials; andSchool facilit ies are maintained in good repair
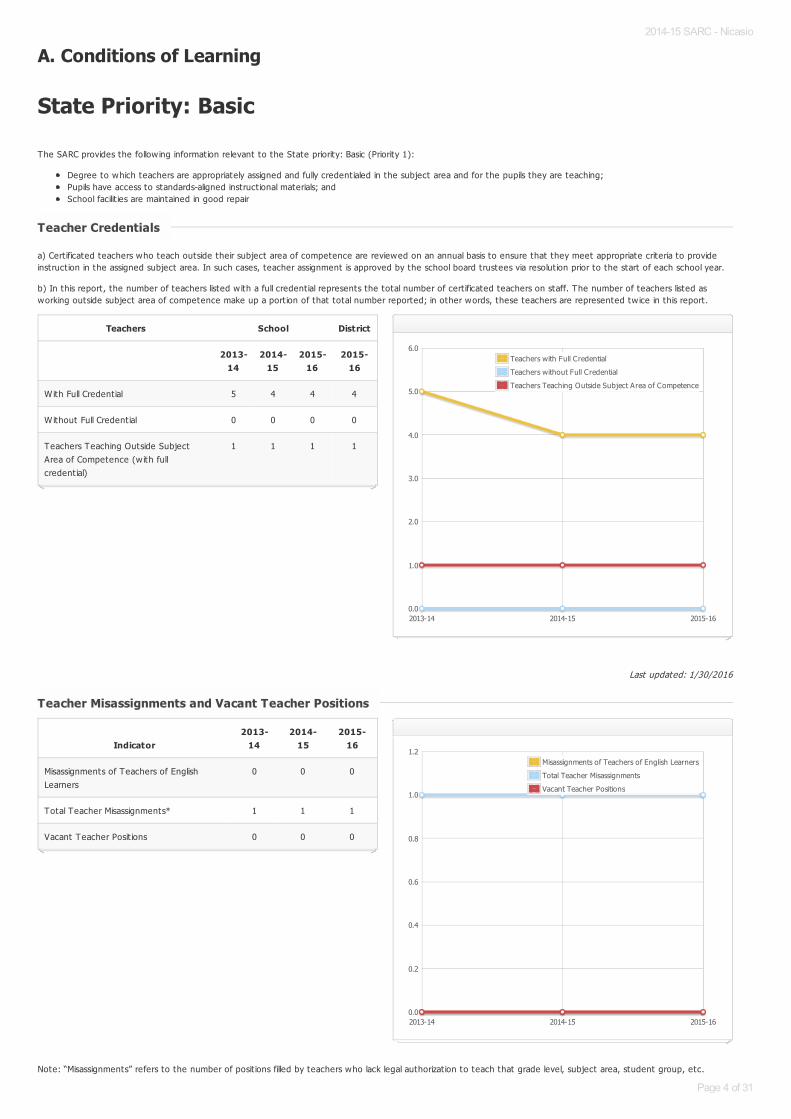
a) Cert ificated teachers who teach outside their subject area of competence are reviewed on an annual basis to ensure that they meet appropriate criteria to provideinstruct ion in the assigned subject area. In such cases, teacher assignment is approved by the school board trustees via resolut ion prior to the start of each school year.
b) In this report, the number of teachers listed w ith a full credent ial represents the total number of cert ificated teachers on staff. The number of teachers listed asworking outside subject area of competence make up a port ion of that total number reported; in other words, these teachers are represented tw ice in this report.
Note: “Misassignments” refers to the number of posit ions filled by teachers who lack legal authorizat ion to teach that grade level, subject area, student group, etc.
Teacher CredentialsTeacher Credentials
Teachers School District
2013-14
2014-15
2015-16
2015-16
With Full Credent ial 5 4 4 4
Without Full Credent ial 0 0 0 0
Teachers Teaching Outside SubjectArea of Competence (w ith fullcredent ial)
1 1 1 1
2013-14 2014-15 2015-160.0
1.0
2.0
3.0
4.0
5.0
6.0Teachers with Full Credential
Teachers without Full Credential
Teachers Teaching Outside Subject Area of Competence
Teacher Misassignments and Vacant Teacher PositionsTeacher Misassignments and Vacant Teacher Positions
Indicator2013-
142014-
152015-
16
Misassignments of Teachers of EnglishLearners
0 0 0
Total Teacher Misassignments* 1 1 1
Vacant Teacher Posit ions 0 0 0
2013-14 2014-15 2015-160.0
0.2
0.4
0.6
0.8
1.0
1.2Misassignments of Teachers of English Learners
Total Teacher Misassignments
Vacant Teacher Positions
2014-15 SARC - Nicasio
Page 4 of 31
Last updated: 1/30/2016
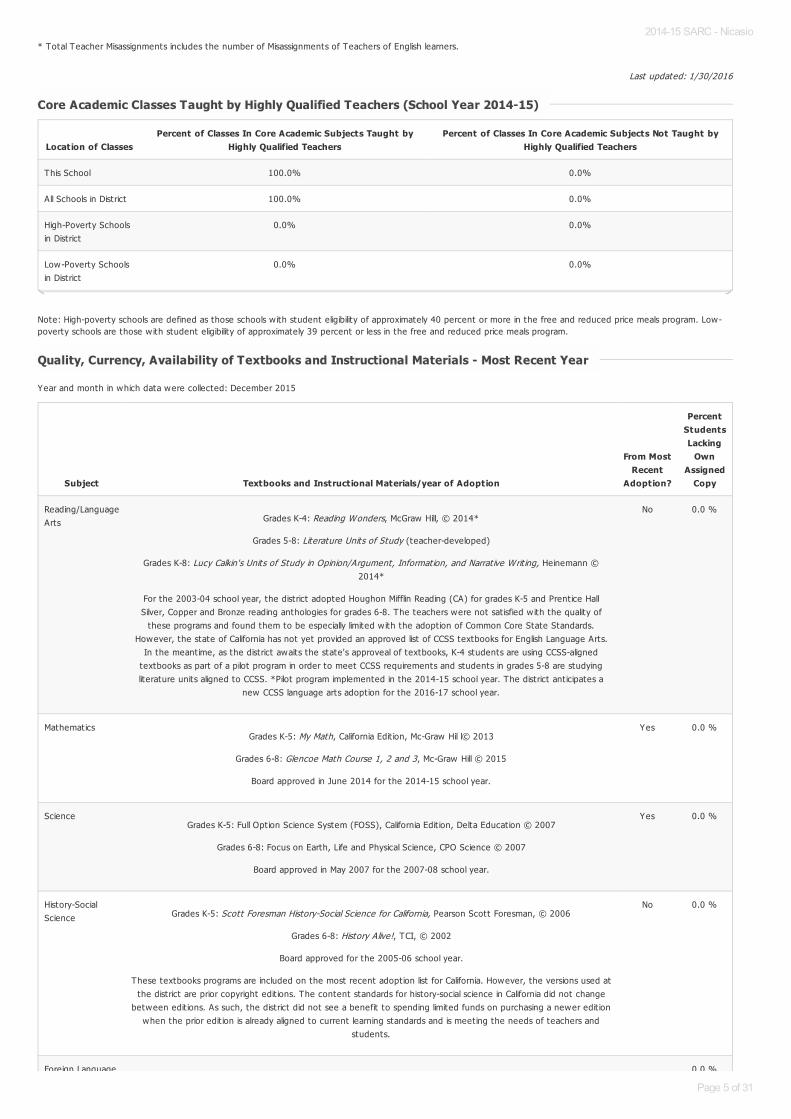
* Total Teacher Misassignments includes the number of Misassignments of Teachers of English learners.
Note: High-poverty schools are defined as those schools w ith student eligibility of approximately 40 percent or more in the free and reduced price meals program. Low-poverty schools are those w ith student eligibility of approximately 39 percent or less in the free and reduced price meals program.
Year and month in which data were collected: December 2015
Core Academic Classes Taught by Highly Qualified Teachers (School Year 2014-15)Core Academic Classes Taught by Highly Qualified Teachers (School Year 2014-15)
Location of ClassesPercent of Classes In Core Academic Subjects Taught by
Highly Qualified TeachersPercent of Classes In Core Academic Subjects Not Taught by
Highly Qualified Teachers
This School 100.0% 0.0%
All Schools in District 100.0% 0.0%
High-Poverty Schoolsin District
0.0% 0.0%
Low-Poverty Schoolsin District
0.0% 0.0%
Quality, Currency, Availability of Textbooks and Instructional Materials - Most Recent YearQuality, Currency, Availability of Textbooks and Instructional Materials - Most Recent Year
Subject Textbooks and Instructional Materials/year of Adoption
From MostRecent
Adoption?
PercentStudentsLacking
OwnAssigned
Copy
Reading/LanguageArts Grades K-4: Reading Wonders, McGraw Hill, © 2014*
Grades 5-8: Literature Units of Study (teacher-developed)
Grades K-8: Lucy Calkin's Units of Study in Opinion/Argument, Information, and Narrat ive Writ ing, Heinemann ©2014*
For the 2003-04 school year, the district adopted Houghon Mifflin Reading (CA) for grades K-5 and Prent ice HallSilver, Copper and Bronze reading anthologies for grades 6-8. The teachers were not sat isfied w ith the quality of
these programs and found them to be especially limited w ith the adopt ion of Common Core State Standards.However, the state of California has not yet provided an approved list of CCSS textbooks for English Language Arts.
In the meantime, as the district awaits the state's approveal of textbooks, K-4 students are using CCSS-alignedtextbooks as part of a pilot program in order to meet CCSS requirements and students in grades 5-8 are studyingliterature units aligned to CCSS. *Pilot program implemented in the 2014-15 school year. The district ant icipates a
new CCSS language arts adopt ion for the 2016-17 school year.
No 0.0 %
MathematicsGrades K-5: My Math, California Edit ion, Mc-Graw Hil l© 2013
Grades 6-8: Glencoe Math Course 1, 2 and 3, Mc-Graw Hill © 2015
Board approved in June 2014 for the 2014-15 school year.
Yes 0.0 %
ScienceGrades K-5: Full Opt ion Science System (FOSS), California Edit ion, Delta Educat ion © 2007
Grades 6-8: Focus on Earth, Life and Physical Science, CPO Science © 2007
Board approved in May 2007 for the 2007-08 school year.
Yes 0.0 %
History-SocialScience Grades K-5: Scott Foresman History-Social Science for California, Pearson Scott Foresman, © 2006
Grades 6-8: History Alive!, TCI, © 2002
Board approved for the 2005-06 school year.
These textbooks programs are included on the most recent adopt ion list for California. However, the versions used atthe district are prior copyright edit ions. The content standards for history-social science in California did not change
between edit ions. As such, the district did not see a benefit to spending limited funds on purchasing a newer edit ionwhen the prior edit ion is already aligned to current learning standards and is meeting the needs of teachers and
students.
No 0.0 %
Foreign Language 0.0 %
2014-15 SARC - Nicasio
Page 5 of 31
Last updated: 1/30/2016
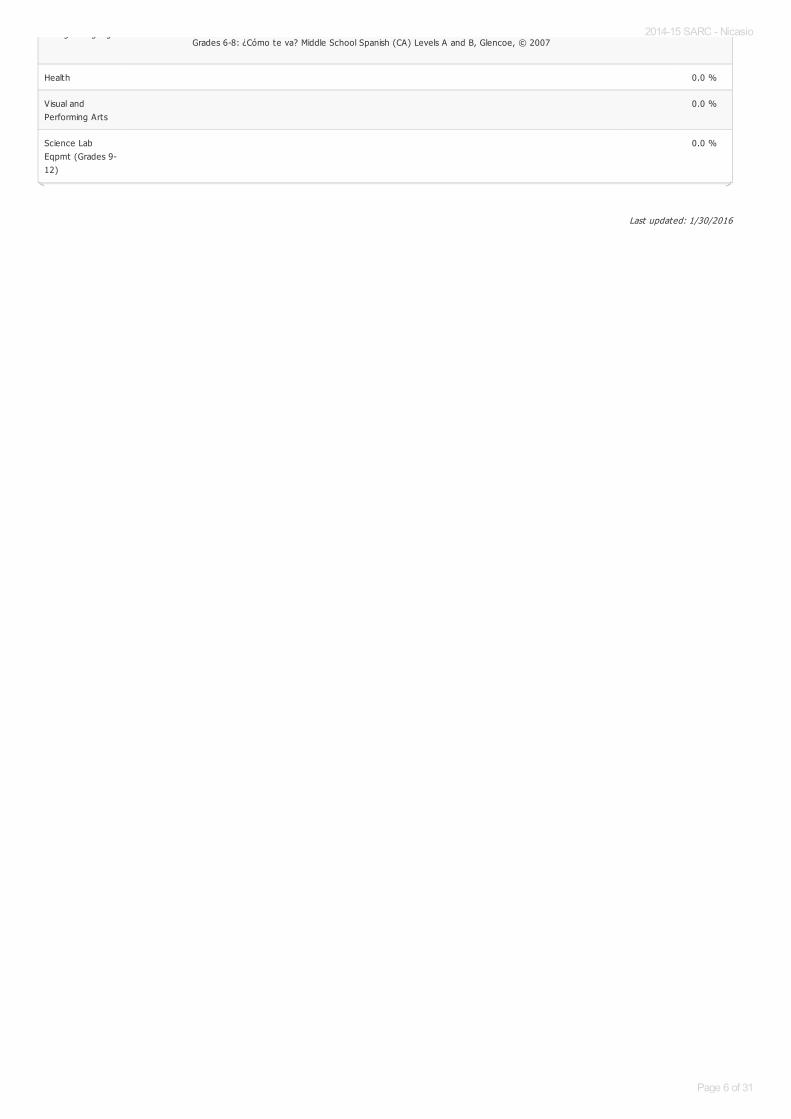
Foreign LanguageGrades 6-8: ¿Cómo te va? Middle School Spanish (CA) Levels A and B, Glencoe, © 2007
0.0 %
Health 0.0 %
Visual andPerforming Arts
0.0 %
Science LabEqpmt (Grades 9-12)
0.0 %
2014-15 SARC - Nicasio
Page 6 of 31
Last updated: 1/30/2016
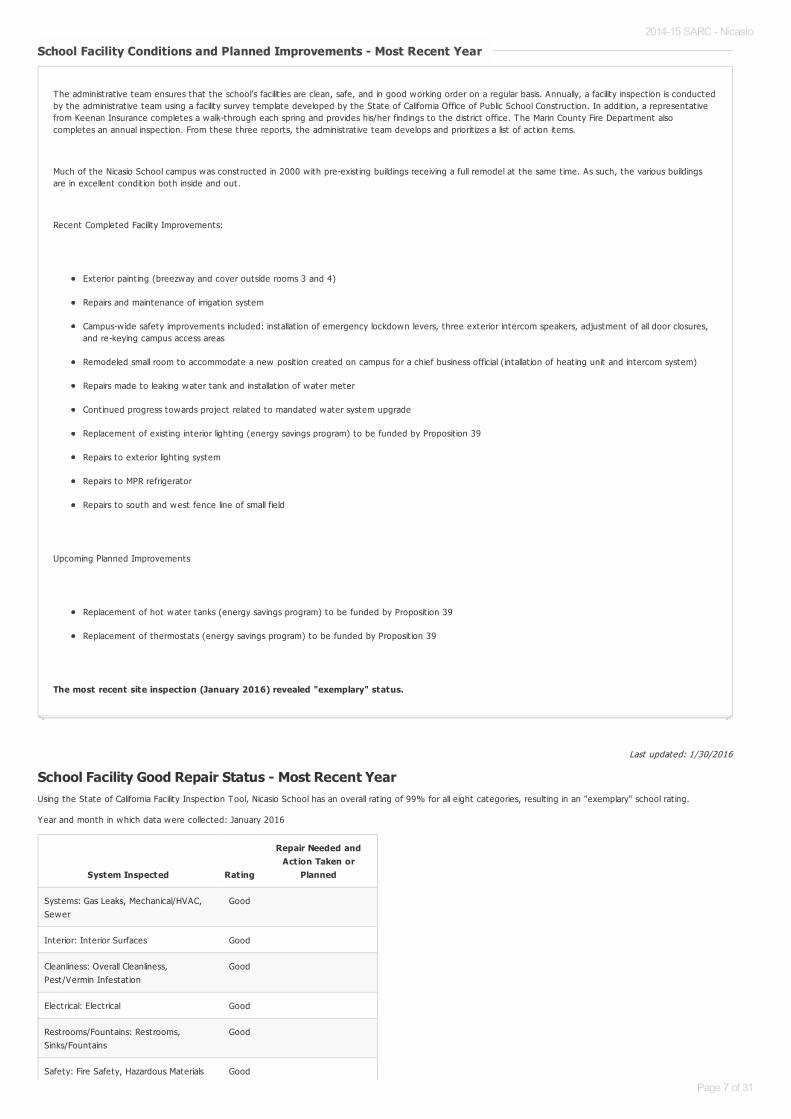
School Facility Good Repair Status - Most Recent YearUsing the State of California Facility Inspect ion Tool, Nicasio School has an overall rat ing of 99% for all eight categories, result ing in an "exemplary" school rat ing.
Year and month in which data were collected: January 2016
School Facility Conditions and Planned Improvements - Most Recent YearSchool Facility Conditions and Planned Improvements - Most Recent Year
The administrat ive team ensures that the school’s facilit ies are clean, safe, and in good working order on a regular basis. Annually, a facility inspect ion is conductedby the administrat ive team using a facility survey template developed by the State of California Office of Public School Construct ion. In addit ion, a representat ivefrom Keenan Insurance completes a walk-through each spring and provides his/her findings to the district office. The Marin County Fire Department alsocompletes an annual inspect ion. From these three reports, the administrat ive team develops and priorit izes a list of act ion items.
Much of the Nicasio School campus was constructed in 2000 w ith pre-exist ing buildings receiving a full remodel at the same t ime. As such, the various buildingsare in excellent condit ion both inside and out.
Recent Completed Facility Improvements:
Exterior paint ing (breezway and cover outside rooms 3 and 4)
Repairs and maintenance of irrigat ion system
Campus-w ide safety improvements included: installat ion of emergency lockdown levers, three exterior intercom speakers, adjustment of all door closures,and re-keying campus access areas
Remodeled small room to accommodate a new posit ion created on campus for a chief business official (intallat ion of heat ing unit and intercom system)
Repairs made to leaking water tank and installat ion of water meter
Continued progress towards project related to mandated water system upgrade
Replacement of exist ing interior light ing (energy savings program) to be funded by Proposit ion 39
Repairs to exterior light ing system
Repairs to MPR refrigerator
Repairs to south and west fence line of small field
Upcoming Planned Improvements
Replacement of hot water tanks (energy savings program) to be funded by Proposit ion 39
Replacement of thermostats (energy savings program) to be funded by Proposit ion 39
The most recent site inspection (January 2016) revealed "exemplary" status.
System Inspected Rating
Repair Needed andAction Taken or
Planned
Systems: Gas Leaks, Mechanical/HVAC,Sewer
Good
Interior: Interior Surfaces Good
Cleanliness: Overall Cleanliness,Pest/Vermin Infestat ion
Good
Electrical: Electrical Good
Restrooms/Fountains: Restrooms,Sinks/Fountains
Good
Safety: Fire Safety, Hazardous Materials Good
2014-15 SARC - Nicasio
Page 7 of 31
Last updated: 1/30/2016
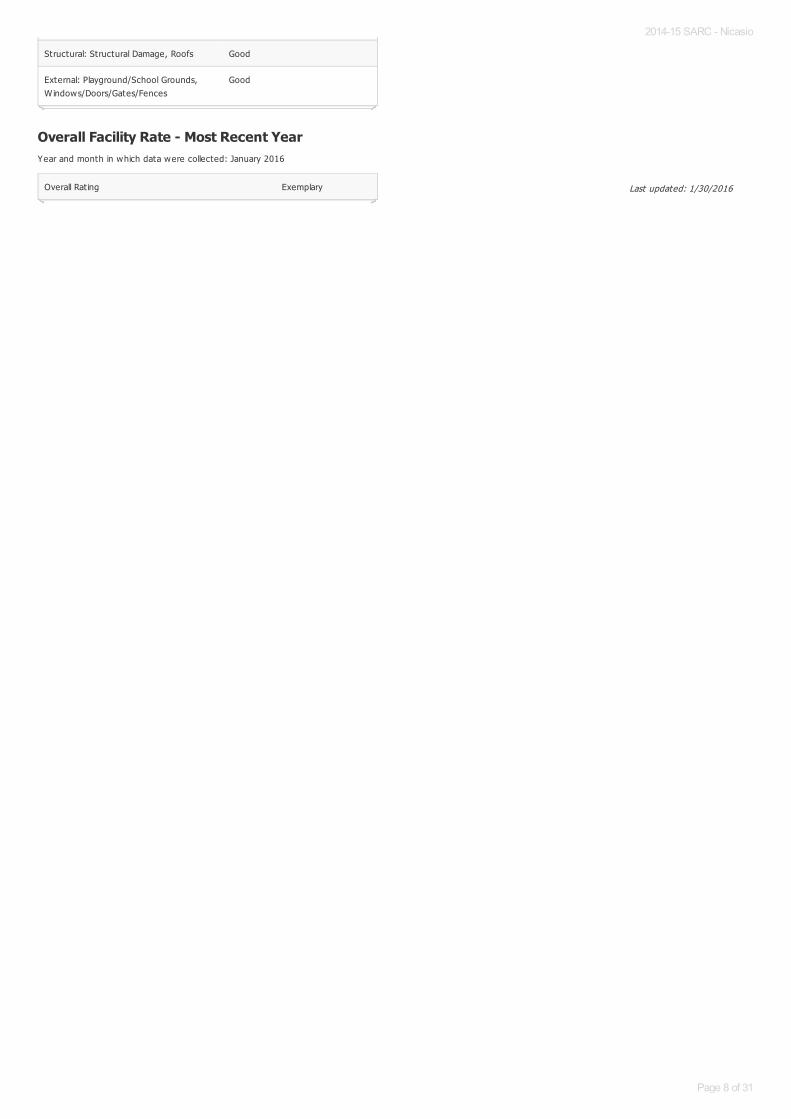
Overall Facility Rate - Most Recent YearYear and month in which data were collected: January 2016
Structural: Structural Damage, Roofs Good
External: Playground/School Grounds,W indows/Doors/Gates/Fences
Good
Overall Rat ing Exemplary
2014-15 SARC - Nicasio
Page 8 of 31
Last updated: 1/30/2016
B. Pupil Outcomes
State Priority: Pupil Achievement
The SARC provides the follow ing information relevant to the State priority: Pupil Achievement (Priority 4):
Statew ide assessments (i.e., California Assessment of Student Performance and Progress [CAASPP], Science California Standards Tests); andThe percentage of pupils who have successfully completed courses that sat isfy the requirements for entrance to the University of California and the CaliforniaState University, or career technical educat ion sequences or programs of study
Note: Percentages are not calculated when the number of students tested is ten or less, either because the number of students in this category is too small forstat ist ical accuracy or to protect student privacy. Double dashes (--) appear in the table when the number of students tested is ten or less.
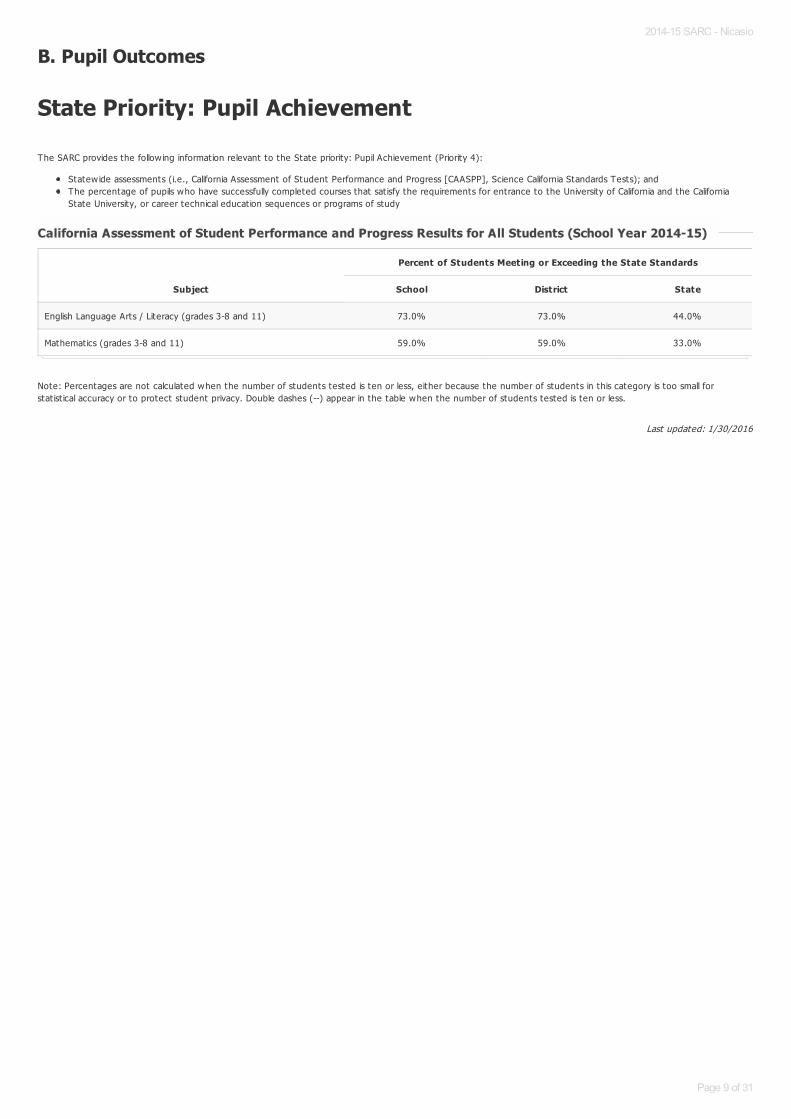
California Assessment of Student Performance and Progress Results for All Students (School Year 2014-15)California Assessment of Student Performance and Progress Results for All Students (School Year 2014-15)
Subject
Percent of Students Meeting or Exceeding the State Standards
School District State
English Language Arts / Literacy (grades 3-8 and 11) 73.0% 73.0% 44.0%
Mathematics (grades 3-8 and 11) 59.0% 59.0% 33.0%
2014-15 SARC - Nicasio
Page 9 of 31
Last updated: 1/30/2016
Double dashes (--) appear in the table when the number of students is ten or less, either because the number of students in this category is too small for stat ist icalaccuracy or to protect student privacy.
Note: The number of students tested includes students that did not receive a score; however the number of students tested is not the number that was used tocalculate the achievement level percentages. The achievement level percentages are calculated using students w ith scores.
* Level 1 = Standard not met Level 2 = Standard nearly met Level 3 = Standard met Level 4 = Standard exceeded
CAASPP Assessment Results - English Language Arts (ELA) CAASPP Assessment Results - English Language Arts (ELA)
Disaggregated by Student Groups, Grades Three through Eight and Eleven (School Year 2014-15)Disaggregated by Student Groups, Grades Three through Eight and Eleven (School Year 2014-15)
ELA - Grade 3ELA - Grade 3
Student GroupTotal
EnrollmentNumberTested
PercentTested
PercentAchievement
Level 1*
PercentAchievement
Level 2*
PercentAchievement
Level 3*
PercentAchievement
Level 4*
All Students 7 7 100.0% -- -- -- --
Male 7 3 42.9% -- -- -- --
Female 7 4 57.1% -- -- -- --
Black or African American 0 0 0.0% 0.0% 0.0% 0.0% 0.0%
American Indian or Alaska Nat ive 0 0 0.0% 0.0% 0.0% 0.0% 0.0%
Asian 0 0 0.0% 0.0% 0.0% 0.0% 0.0%
Filipino 0 0 0.0% 0.0% 0.0% 0.0% 0.0%
Hispanic or Lat ino 7 2 28.6% -- -- -- --
Nat ive Hawaiian or Pacific Islander 0 0 0.0% 0.0% 0.0% 0.0% 0.0%
White 7 5 71.4% -- -- -- --
Two or More Races 0 0 0.0% 0.0% 0.0% 0.0% 0.0%
Socioeconomically Disadvantaged 7 1 14.3% -- -- -- --
English Learners 7 2 28.6% -- -- -- --
Students w ith Disabilit ies 7 1 14.3% -- -- -- --
Students Receiving MigrantEducat ion Services
0 0 0.0% 0.0% 0.0% 0.0% 0.0%
Foster Youth -- -- -- -- -- -- --
2014-15 SARC - Nicasio
Page 10 of 31

Last updated: 1/30/2016
Double dashes (--) appear in the table when the number of students is ten or less, either because the number of students in this category is too small for stat ist icalaccuracy or to protect student privacy.
Note: The number of students tested includes students that did not receive a score; however the number of students tested is not the number that was used tocalculate the achievement level percentages. The achievement level percentages are calculated using students w ith scores.
* Level 1 = Standard not met Level 2 = Standard nearly met Level 3 = Standard met Level 4 = Standard exceeded
ELA - Grade 4ELA - Grade 4
Student GroupTotal
EnrollmentNumberTested
PercentTested
PercentAchievement
Level 1*
PercentAchievement
Level 2*
PercentAchievement
Level 3*
PercentAchievement
Level 4*
All Students 4 4 100.0% -- -- -- --
Male 4 3 75.0% -- -- -- --
Female 4 1 25.0% -- -- -- --
Black or African American 0 0 0.0% 0.0% 0.0% 0.0% 0.0%
American Indian or Alaska Nat ive 0 0 0.0% 0.0% 0.0% 0.0% 0.0%
Asian 0 0 0.0% 0.0% 0.0% 0.0% 0.0%
Filipino 0 0 0.0% 0.0% 0.0% 0.0% 0.0%
Hispanic or Lat ino 0 0 0.0% 0.0% 0.0% 0.0% 0.0%
Native Hawaiian or Pacific Islander 0 0 0.0% 0.0% 0.0% 0.0% 0.0%
White 4 4 100.0% -- -- -- --
Two or More Races 0 0 0.0% 0.0% 0.0% 0.0% 0.0%
Socioeconomically Disadvantaged 0 0 0.0% 0.0% 0.0% 0.0% 0.0%
English Learners 0 0 0.0% 0.0% 0.0% 0.0% 0.0%
Students w ith Disabilit ies 4 1 25.0% -- -- -- --
Students Receiving MigrantEducat ion Services
0 0 0.0% 0.0% 0.0% 0.0% 0.0%
Foster Youth -- -- -- -- -- -- --
2014-15 SARC - Nicasio
Page 11 of 31

Last updated: 1/30/2016
Double dashes (--) appear in the table when the number of students is ten or less, either because the number of students in this category is too small for stat ist icalaccuracy or to protect student privacy.
Note: The number of students tested includes students that did not receive a score; however the number of students tested is not the number that was used tocalculate the achievement level percentages. The achievement level percentages are calculated using students w ith scores.
* Level 1 = Standard not met Level 2 = Standard nearly met Level 3 = Standard met Level 4 = Standard exceeded
ELA - Grade 5ELA - Grade 5
Student GroupTotal
EnrollmentNumberTested
PercentTested
PercentAchievement
Level 1*
PercentAchievement
Level 2*
PercentAchievement
Level 3*
PercentAchievement
Level 4*
All Students 5 5 100.0% -- -- -- --
Male 5 3 60.0% -- -- -- --
Female 5 2 40.0% -- -- -- --
Black or African American 0 0 0.0% 0.0% 0.0% 0.0% 0.0%
American Indian or Alaska Nat ive 0 0 0.0% 0.0% 0.0% 0.0% 0.0%
Asian 5 1 20.0% -- -- -- --
Filipino 0 0 0.0% 0.0% 0.0% 0.0% 0.0%
Hispanic or Lat ino 0 0 0.0% 0.0% 0.0% 0.0% 0.0%
Native Hawaiian or Pacific Islander 0 0 0.0% 0.0% 0.0% 0.0% 0.0%
White 5 4 80.0% -- -- -- --
Two or More Races 0 0 0.0% 0.0% 0.0% 0.0% 0.0%
Socioeconomically Disadvantaged 0 0 0.0% 0.0% 0.0% 0.0% 0.0%
English Learners 5 1 20.0% -- -- -- --
Students w ith Disabilit ies 5 1 20.0% -- -- -- --
Students Receiving MigrantEducat ion Services
0 0 0.0% 0.0% 0.0% 0.0% 0.0%
Foster Youth -- -- -- -- -- -- --
2014-15 SARC - Nicasio
Page 12 of 31

Last updated: 1/30/2016
Double dashes (--) appear in the table when the number of students is ten or less, either because the number of students in this category is too small for stat ist icalaccuracy or to protect student privacy.
Note: The number of students tested includes students that did not receive a score; however the number of students tested is not the number that was used tocalculate the achievement level percentages. The achievement level percentages are calculated using students w ith scores.
* Level 1 = Standard not met Level 2 = Standard nearly met Level 3 = Standard met Level 4 = Standard exceeded
ELA- ELA- Grade 6Grade 6
Student GroupTotal
EnrollmentNumberTested
PercentTested
PercentAchievement
Level 1*
PercentAchievement
Level 2*
PercentAchievement
Level 3*
PercentAchievement
Level 4*
All Students 8 8 100.0% -- -- -- --
Male 8 4 50.0% -- -- -- --
Female 8 4 50.0% -- -- -- --
Black or African American 0 0 0.0% 0.0% 0.0% 0.0% 0.0%
American Indian or Alaska Nat ive 0 0 0.0% 0.0% 0.0% 0.0% 0.0%
Asian 0 0 0.0% 0.0% 0.0% 0.0% 0.0%
Filipino 0 0 0.0% 0.0% 0.0% 0.0% 0.0%
Hispanic or Lat ino 8 2 25.0% -- -- -- --
Nat ive Hawaiian or Pacific Islander 0 0 0.0% 0.0% 0.0% 0.0% 0.0%
White 8 6 75.0% -- -- -- --
Two or More Races 0 0 0.0% 0.0% 0.0% 0.0% 0.0%
Socioeconomically Disadvantaged 0 0 0.0% 0.0% 0.0% 0.0% 0.0%
English Learners 8 2 25.0% -- -- -- --
Students w ith Disabilit ies 0 0 0.0% 0.0% 0.0% 0.0% 0.0%
Students Receiving MigrantEducat ion Services
0 0 0.0% 0.0% 0.0% 0.0% 0.0%
Foster Youth -- -- -- -- -- -- --
2014-15 SARC - Nicasio
Page 13 of 31

Last updated: 1/30/2016
Double dashes (--) appear in the table when the number of students is ten or less, either because the number of students in this category is too small for stat ist icalaccuracy or to protect student privacy.
Note: The number of students tested includes students that did not receive a score; however the number of students tested is not the number that was used tocalculate the achievement level percentages. The achievement level percentages are calculated using students w ith scores.
* Level 1 = Standard not met Level 2 = Standard nearly met Level 3 = Standard met Level 4 = Standard exceeded
ELA - Grade 7ELA - Grade 7
Student GroupTotal
EnrollmentNumberTested
PercentTested
PercentAchievement
Level 1*
PercentAchievement
Level 2*
PercentAchievement
Level 3*
PercentAchievement
Level 4*
All Students 8 7 87.5% -- -- -- --
Male 8 4 50.0% -- -- -- --
Female 8 3 37.5% -- -- -- --
Black or African American 0 0 0.0% 0.0% 0.0% 0.0% 0.0%
American Indian or Alaska Nat ive 0 0 0.0% 0.0% 0.0% 0.0% 0.0%
Asian 8 1 12.5% -- -- -- --
Filipino 0 0 0.0% 0.0% 0.0% 0.0% 0.0%
Hispanic or Lat ino 8 2 25.0% -- -- -- --
Nat ive Hawaiian or Pacific Islander 0 0 0.0% 0.0% 0.0% 0.0% 0.0%
White 8 4 50.0% -- -- -- --
Two or More Races 0 0 0.0% 0.0% 0.0% 0.0% 0.0%
Socioeconomically Disadvantaged 8 1 12.5% -- -- -- --
English Learners 8 2 25.0% -- -- -- --
Students w ith Disabilit ies 8 2 25.0% -- -- -- --
Students Receiving MigrantEducat ion Services
0 0 0.0% 0.0% 0.0% 0.0% 0.0%
Foster Youth -- -- -- -- -- -- --
2014-15 SARC - Nicasio
Page 14 of 31

Last updated: 1/30/2016
Double dashes (--) appear in the table when the number of students is ten or less, either because the number of students in this category is too small for stat ist icalaccuracy or to protect student privacy.
Note: The number of students tested includes students that did not receive a score; however the number of students tested is not the number that was used tocalculate the achievement level percentages. The achievement level percentages are calculated using students w ith scores.
* Level 1 = Standard not met Level 2 = Standard nearly met Level 3 = Standard met Level 4 = Standard exceeded
ELA - Grade 8ELA - Grade 8
Student GroupTotal
EnrollmentNumberTested
PercentTested
PercentAchievement
Level 1*
PercentAchievement
Level 2*
PercentAchievement
Level 3*
PercentAchievement
Level 4*
All Students 6 6 100.0% -- -- -- --
Male 6 1 16.7% -- -- -- --
Female 6 5 83.3% -- -- -- --
Black or African American 0 0 0.0% 0.0% 0.0% 0.0% 0.0%
American Indian or Alaska Nat ive 0 0 0.0% 0.0% 0.0% 0.0% 0.0%
Asian 0 0 0.0% 0.0% 0.0% 0.0% 0.0%
Filipino 0 0 0.0% 0.0% 0.0% 0.0% 0.0%
Hispanic or Lat ino 0 0 0.0% 0.0% 0.0% 0.0% 0.0%
Native Hawaiian or Pacific Islander 0 0 0.0% 0.0% 0.0% 0.0% 0.0%
White 6 6 100.0% -- -- -- --
Two or More Races 0 0 0.0% 0.0% 0.0% 0.0% 0.0%
Socioeconomically Disadvantaged 0 0 0.0% 0.0% 0.0% 0.0% 0.0%
English Learners 0 0 0.0% 0.0% 0.0% 0.0% 0.0%
Students w ith Disabilit ies 6 1 16.7% -- -- -- --
Students Receiving MigrantEducat ion Services
0 0 0.0% 0.0% 0.0% 0.0% 0.0%
Foster Youth -- -- -- -- -- -- --
2014-15 SARC - Nicasio
Page 15 of 31
Last updated: 1/30/2016
Double dashes (--) appear in the table when the number of students is ten or less, either because the number of students in this category is too small for stat ist icalaccuracy or to protect student privacy.
Note: The number of students tested includes students that did not receive a score; however the number of students tested is not the number that was used tocalculate the achievement level percentages. The achievement level percentages are calculated using students w ith scores.
* Level 1 = Standard not met Level 2 = Standard nearly met Level 3 = Standard met Level 4 = Standard exceeded
CAASPP Assessment Results - Mathematics CAASPP Assessment Results - Mathematics
Disaggregated by Student Groups, Grades Three through Eight and Eleven (School Year 2014-15)Disaggregated by Student Groups, Grades Three through Eight and Eleven (School Year 2014-15)
Mathematics - Grade 3Mathematics - Grade 3
Student GroupTotal
EnrollmentNumberTested
PercentTested
PercentAchievement
Level 1*
PercentAchievement
Level 2*
PercentAchievement
Level 3*
PercentAchievement
Level 4*
All Students 7 7 100.0% -- -- -- --
Male 7 3 42.9% -- -- -- --
Female 7 4 57.1% -- -- -- --
Black or African American 0 0 0.0% 0.0% 0.0% 0.0% 0.0%
American Indian or Alaska Nat ive 0 0 0.0% 0.0% 0.0% 0.0% 0.0%
Asian 0 0 0.0% 0.0% 0.0% 0.0% 0.0%
Filipino 0 0 0.0% 0.0% 0.0% 0.0% 0.0%
Hispanic or Lat ino 7 2 28.6% -- -- -- --
Nat ive Hawaiian or Pacific Islander 0 0 0.0% 0.0% 0.0% 0.0% 0.0%
White 7 5 71.4% -- -- -- --
Two or More Races 0 0 0.0% 0.0% 0.0% 0.0% 0.0%
Socioeconomically Disadvantaged 7 1 14.3% -- -- -- --
English Learners 7 2 28.6% -- -- -- --
Students w ith Disabilit ies 7 1 14.3% -- -- -- --
Students Receiving MigrantEducat ion Services
0 0 0.0% 0.0% 0.0% 0.0% 0.0%
Foster Youth -- -- -- -- -- -- --
2014-15 SARC - Nicasio
Page 16 of 31
Last updated: 1/30/2016
Double dashes (--) appear in the table when the number of students is ten or less, either because the number of students in this category is too small for stat ist icalaccuracy or to protect student privacy.
Note: The number of students tested includes students that did not receive a score; however the number of students tested is not the number that was used tocalculate the achievement level percentages. The achievement level percentages are calculated using students w ith scores.
* Level 1 = Standard not met Level 2 = Standard nearly met Level 3 = Standard met Level 4 = Standard exceeded
Mathematics - Grade 4Mathematics - Grade 4
Student GroupTotal
EnrollmentNumberTested
PercentTested
PercentAchievement
Level 1*
PercentAchievement
Level 2*
PercentAchievement
Level 3*
PercentAchievement
Level 4*
All Students 4 4 100.0% -- -- -- --
Male 4 3 75.0% -- -- -- --
Female 4 1 25.0% -- -- -- --
Black or African American 0 0 0.0% 0.0% 0.0% 0.0% 0.0%
American Indian or Alaska Nat ive 0 0 0.0% 0.0% 0.0% 0.0% 0.0%
Asian 0 0 0.0% 0.0% 0.0% 0.0% 0.0%
Filipino 0 0 0.0% 0.0% 0.0% 0.0% 0.0%
Hispanic or Lat ino 0 0 0.0% 0.0% 0.0% 0.0% 0.0%
Native Hawaiian or Pacific Islander 0 0 0.0% 0.0% 0.0% 0.0% 0.0%
White 4 4 100.0% -- -- -- --
Two or More Races 0 0 0.0% 0.0% 0.0% 0.0% 0.0%
Socioeconomically Disadvantaged 0 0 0.0% 0.0% 0.0% 0.0% 0.0%
English Learners 0 0 0.0% 0.0% 0.0% 0.0% 0.0%
Students w ith Disabilit ies 4 1 25.0% -- -- -- --
Students Receiving MigrantEducat ion Services
0 0 0.0% 0.0% 0.0% 0.0% 0.0%
Foster Youth -- -- -- -- -- -- --
2014-15 SARC - Nicasio
Page 17 of 31
Last updated: 1/30/2016
Double dashes (--) appear in the table when the number of students is ten or less, either because the number of students in this category is too small for stat ist icalaccuracy or to protect student privacy.
Note: The number of students tested includes students that did not receive a score; however the number of students tested is not the number that was used tocalculate the achievement level percentages. The achievement level percentages are calculated using students w ith scores.
* Level 1 = Standard not met Level 2 = Standard nearly met Level 3 = Standard met Level 4 = Standard exceeded
Mathematics - Grade 5Mathematics - Grade 5
Student GroupTotal
EnrollmentNumberTested
PercentTested
PercentAchievement
Level 1*
PercentAchievement
Level 2*
PercentAchievement
Level 3*
PercentAchievement
Level 4*
All Students 5 5 100.0% -- -- -- --
Male 5 3 60.0% -- -- -- --
Female 5 2 40.0% -- -- -- --
Black or African American 0 0 0.0% 0.0% 0.0% 0.0% 0.0%
American Indian or Alaska Nat ive 0 0 0.0% 0.0% 0.0% 0.0% 0.0%
Asian 5 1 20.0% -- -- -- --
Filipino 0 0 0.0% 0.0% 0.0% 0.0% 0.0%
Hispanic or Lat ino 0 0 0.0% 0.0% 0.0% 0.0% 0.0%
Native Hawaiian or Pacific Islander 0 0 0.0% 0.0% 0.0% 0.0% 0.0%
White 5 4 80.0% -- -- -- --
Two or More Races 0 0 0.0% 0.0% 0.0% 0.0% 0.0%
Socioeconomically Disadvantaged 0 0 0.0% 0.0% 0.0% 0.0% 0.0%
English Learners 5 1 20.0% -- -- -- --
Students w ith Disabilit ies 5 1 20.0% -- -- -- --
Students Receiving MigrantEducat ion Services
0 0 0.0% 0.0% 0.0% 0.0% 0.0%
Foster Youth -- -- -- -- -- -- --
2014-15 SARC - Nicasio
Page 18 of 31
Last updated: 1/30/2016
Double dashes (--) appear in the table when the number of students is ten or less, either because the number of students in this category is too small for stat ist icalaccuracy or to protect student privacy.
Note: The number of students tested includes students that did not receive a score; however the number of students tested is not the number that was used tocalculate the achievement level percentages. The achievement level percentages are calculated using students w ith scores.
* Level 1 = Standard not met Level 2 = Standard nearly met Level 3 = Standard met Level 4 = Standard exceeded
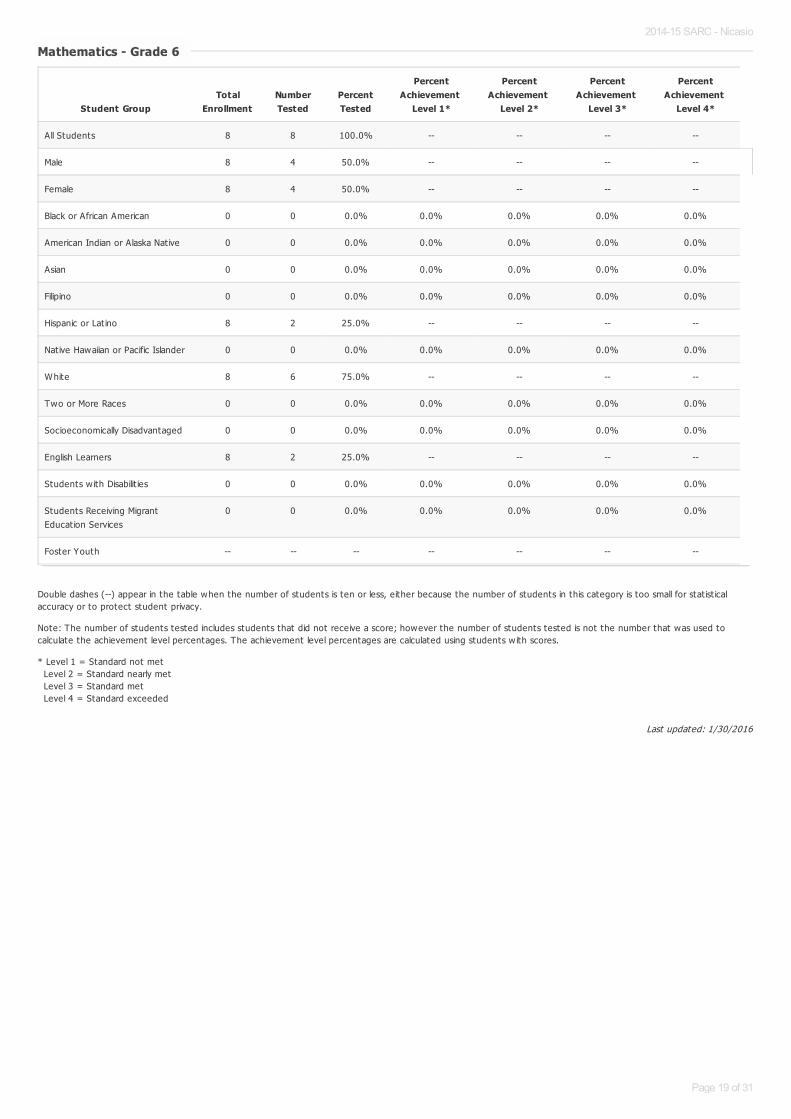
Mathematics - Grade 6Mathematics - Grade 6
Student GroupTotal
EnrollmentNumberTested
PercentTested
PercentAchievement
Level 1*
PercentAchievement
Level 2*
PercentAchievement
Level 3*
PercentAchievement
Level 4*
All Students 8 8 100.0% -- -- -- --
Male 8 4 50.0% -- -- -- --
Female 8 4 50.0% -- -- -- --
Black or African American 0 0 0.0% 0.0% 0.0% 0.0% 0.0%
American Indian or Alaska Nat ive 0 0 0.0% 0.0% 0.0% 0.0% 0.0%
Asian 0 0 0.0% 0.0% 0.0% 0.0% 0.0%
Filipino 0 0 0.0% 0.0% 0.0% 0.0% 0.0%
Hispanic or Lat ino 8 2 25.0% -- -- -- --
Nat ive Hawaiian or Pacific Islander 0 0 0.0% 0.0% 0.0% 0.0% 0.0%
White 8 6 75.0% -- -- -- --
Two or More Races 0 0 0.0% 0.0% 0.0% 0.0% 0.0%
Socioeconomically Disadvantaged 0 0 0.0% 0.0% 0.0% 0.0% 0.0%
English Learners 8 2 25.0% -- -- -- --
Students w ith Disabilit ies 0 0 0.0% 0.0% 0.0% 0.0% 0.0%
Students Receiving MigrantEducat ion Services
0 0 0.0% 0.0% 0.0% 0.0% 0.0%
Foster Youth -- -- -- -- -- -- --
2014-15 SARC - Nicasio
Page 19 of 31

Last updated: 1/30/2016
Double dashes (--) appear in the table when the number of students is ten or less, either because the number of students in this category is too small for stat ist icalaccuracy or to protect student privacy.
Note: The number of students tested includes students that did not receive a score; however the number of students tested is not the number that was used tocalculate the achievement level percentages. The achievement level percentages are calculated using students w ith scores.
* Level 1 = Standard not met Level 2 = Standard nearly met Level 3 = Standard met Level 4 = Standard exceeded
Mathematics - Grade 7Mathematics - Grade 7
Student GroupTotal
EnrollmentNumberTested
PercentTested
PercentAchievement
Level 1*
PercentAchievement
Level 2*
PercentAchievement
Level 3*
PercentAchievement
Level 4*
All Students 8 7 87.5% -- -- -- --
Male 8 4 50.0% -- -- -- --
Female 8 3 37.5% -- -- -- --
Black or African American 0 0 0.0% 0.0% 0.0% 0.0% 0.0%
American Indian or Alaska Nat ive 0 0 0.0% 0.0% 0.0% 0.0% 0.0%
Asian 8 1 12.5% -- -- -- --
Filipino 0 0 0.0% 0.0% 0.0% 0.0% 0.0%
Hispanic or Lat ino 8 2 25.0% -- -- -- --
Nat ive Hawaiian or Pacific Islander 0 0 0.0% 0.0% 0.0% 0.0% 0.0%
White 8 4 50.0% -- -- -- --
Two or More Races 0 0 0.0% 0.0% 0.0% 0.0% 0.0%
Socioeconomically Disadvantaged 8 1 12.5% -- -- -- --
English Learners 8 2 25.0% -- -- -- --
Students w ith Disabilit ies 8 2 25.0% -- -- -- --
Students Receiving MigrantEducat ion Services
0 0 0.0% 0.0% 0.0% 0.0% 0.0%
Foster Youth -- -- -- -- -- -- --
2014-15 SARC - Nicasio
Page 20 of 31
Last updated: 1/30/2016
Double dashes (--) appear in the table when the number of students is ten or less, either because the number of students in this category is too small for stat ist icalaccuracy or to protect student privacy.
Note: The number of students tested includes students that did not receive a score; however the number of students tested is not the number that was used tocalculate the achievement level percentages. The achievement level percentages are calculated using students w ith scores.
* Level 1 = Standard not met Level 2 = Standard nearly met Level 3 = Standard met Level 4 = Standard exceeded
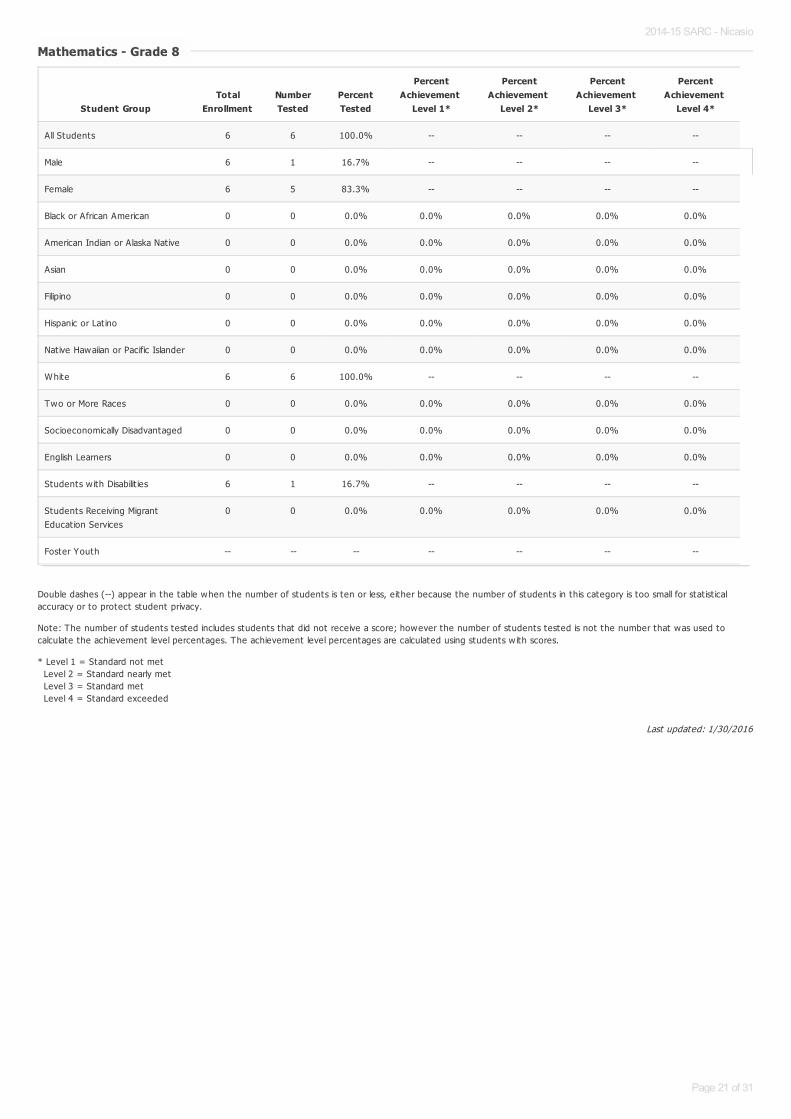
Mathematics - Grade 8Mathematics - Grade 8
Student GroupTotal
EnrollmentNumberTested
PercentTested
PercentAchievement
Level 1*
PercentAchievement
Level 2*
PercentAchievement
Level 3*
PercentAchievement
Level 4*
All Students 6 6 100.0% -- -- -- --
Male 6 1 16.7% -- -- -- --
Female 6 5 83.3% -- -- -- --
Black or African American 0 0 0.0% 0.0% 0.0% 0.0% 0.0%
American Indian or Alaska Nat ive 0 0 0.0% 0.0% 0.0% 0.0% 0.0%
Asian 0 0 0.0% 0.0% 0.0% 0.0% 0.0%
Filipino 0 0 0.0% 0.0% 0.0% 0.0% 0.0%
Hispanic or Lat ino 0 0 0.0% 0.0% 0.0% 0.0% 0.0%
Native Hawaiian or Pacific Islander 0 0 0.0% 0.0% 0.0% 0.0% 0.0%
White 6 6 100.0% -- -- -- --
Two or More Races 0 0 0.0% 0.0% 0.0% 0.0% 0.0%
Socioeconomically Disadvantaged 0 0 0.0% 0.0% 0.0% 0.0% 0.0%
English Learners 0 0 0.0% 0.0% 0.0% 0.0% 0.0%
Students w ith Disabilit ies 6 1 16.7% -- -- -- --
Students Receiving MigrantEducat ion Services
0 0 0.0% 0.0% 0.0% 0.0% 0.0%
Foster Youth -- -- -- -- -- -- --
2014-15 SARC - Nicasio
Page 21 of 31
Last updated: 1/30/2016
Last updated: 2/7/2016
Note: Scores are not shown when the number of students tested is ten or less, either because the number of students in this category is too small for stat ist icalaccuracy or to protect student privacy. Double dashes (--) appear in the table when the number of students tested is ten or less.
California Standards Tests Results by Student Group in Science (School Year 2014-15)
Note: Scores are not shown when the number of students tested is ten or less, either because the number of students in this category is too small for stat ist icalaccuracy or to protect student privacy. Double dashes (--) appear in the table when the number of students tested is ten or less.
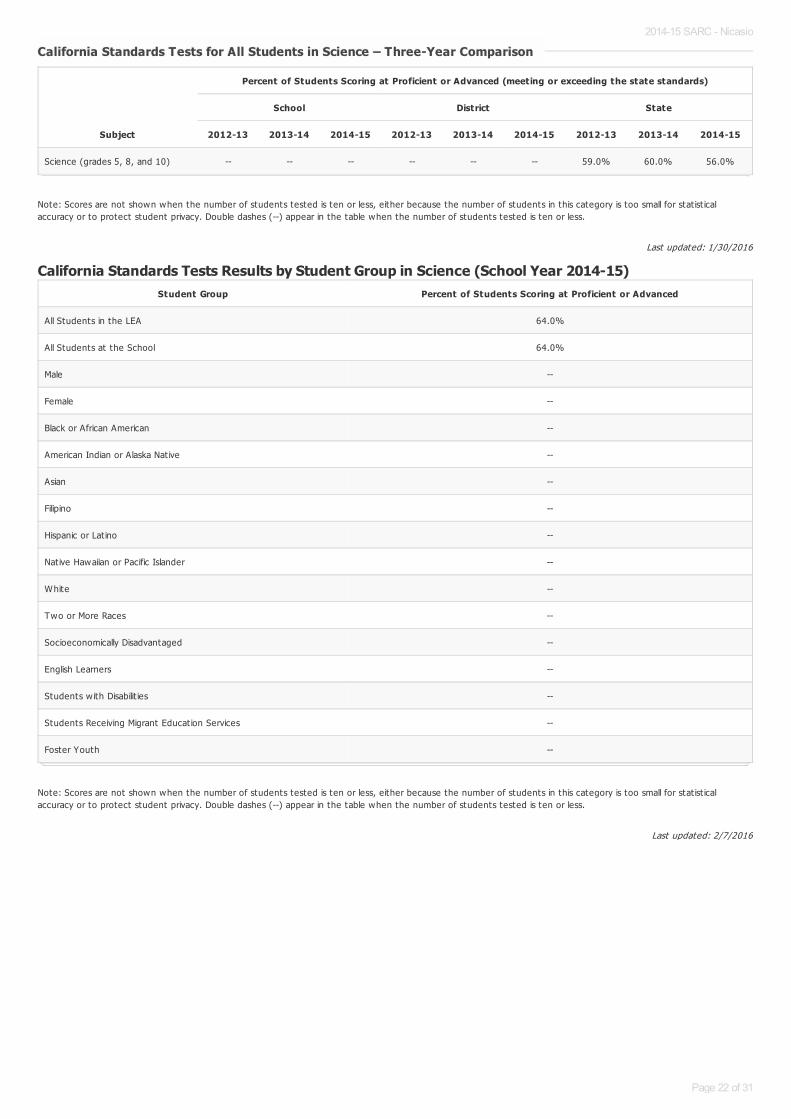
California Standards Tests for All Students in Science – Three-Year ComparisonCalifornia Standards Tests for All Students in Science – Three-Year Comparison
Subject
Percent of Students Scoring at Proficient or Advanced (meeting or exceeding the state standards)
School District State
2012-13 2013-14 2014-15 2012-13 2013-14 2014-15 2012-13 2013-14 2014-15
Science (grades 5, 8, and 10) -- -- -- -- -- -- 59.0% 60.0% 56.0%
Student Group Percent of Students Scoring at Proficient or Advanced
All Students in the LEA 64.0%
All Students at the School 64.0%
Male --
Female --
Black or African American --
American Indian or Alaska Nat ive --
Asian --
Filipino --
Hispanic or Lat ino --
Nat ive Hawaiian or Pacific Islander --
White --
Two or More Races --
Socioeconomically Disadvantaged --
English Learners --
Students w ith Disabilit ies --
Students Receiving Migrant Educat ion Services --
Foster Youth --
2014-15 SARC - Nicasio
Page 22 of 31
Last updated: 1/30/2016
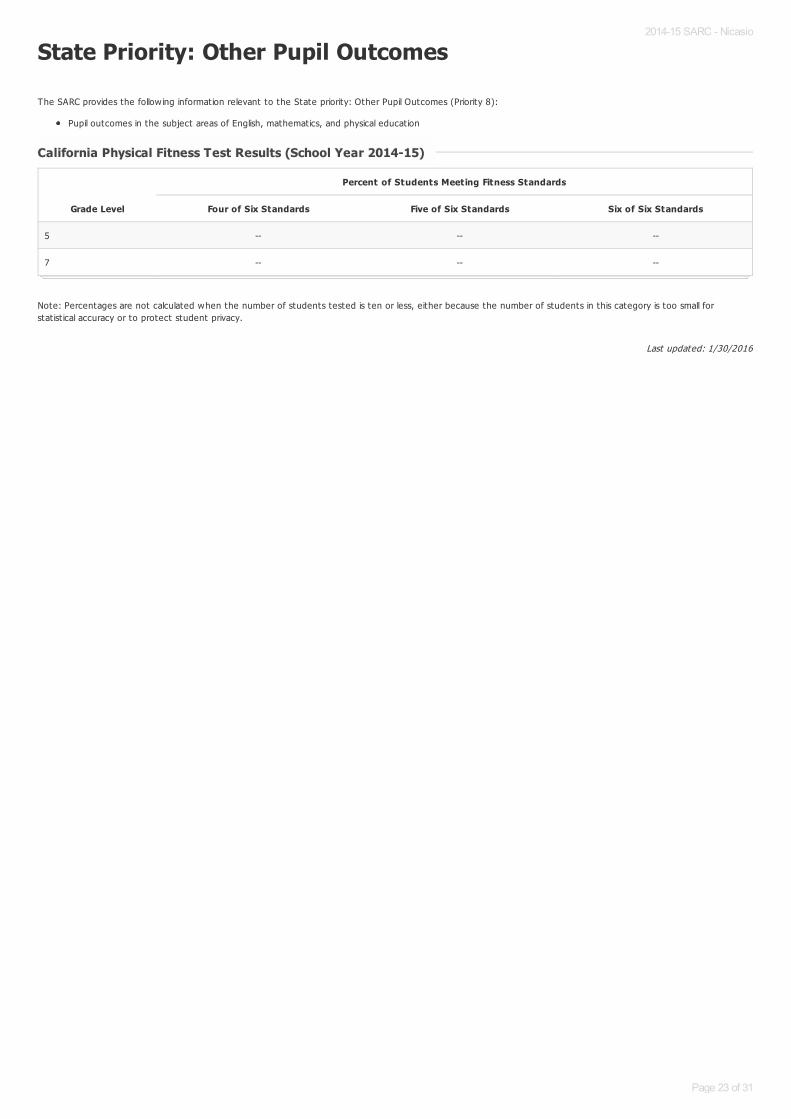
State Priority: Other Pupil Outcomes
The SARC provides the follow ing information relevant to the State priority: Other Pupil Outcomes (Priority 8):
Pupil outcomes in the subject areas of English, mathematics, and physical educat ion
Note: Percentages are not calculated when the number of students tested is ten or less, either because the number of students in this category is too small forstat ist ical accuracy or to protect student privacy.
California Physical Fitness Test Results (School Year 2014-15)California Physical Fitness Test Results (School Year 2014-15)
Grade Level
Percent of Students Meeting Fitness Standards
Four of Six Standards Five of Six Standards Six of Six Standards
5 -- -- --
7 -- -- --
2014-15 SARC - Nicasio
Page 23 of 31
Last updated: 1/30/2016
C. Engagement
State Priority: Parental Involvement
The SARC provides the follow ing information relevant to the State priority: Parental Involvement (Priority 3):
Efforts the school district makes to seek parent input in making decisions for the school district and each schoolsite
State Priority: Pupil Engagement
The SARC provides the follow ing information relevant to the State priority: Pupil Engagement (Priority 5):
High school dropout rates; andHigh school graduat ion rates
Opportunities for Parental Involvement - Most Recent YearOpportunities for Parental Involvement - Most Recent Year
Parents regularly volunteer both inside and outside the classrooms. Parents are provided w ith opportunit ies to sign up for various volunteer jobs at the start ofeach school year, which include assist ing in classrooms, the office, campus grounds, and on field trips. Parents also volunteer through Parent Club and NicasioSchool Foundat ion (www.nicasioschoolfoundat ion.org), which sponsors several fundraising act ivit ies throughout the year. Funds raised help provide a number ofenrichment programs school-w ide including art, performing arts and Spanish in addit ion to support ing required curriculum, such as physical educat ion.Supplemental supplies and materials as well as campus maintenance are also generously donated by parents in the community.
Parents are invited and encouraged to part icipate in a school survey on an annual basis. In addit ion, a parent volunteer committee is formed annually to providefeedbak for the development of the Local Control Accountability Plan (LCA). Their input provides the administrat ive team and school board w ith valuableinformation that helps drive decisions related to curriculum, enrichment programs, student support programs, issues related to school climate, school grounds, etc.
2014-15 SARC - Nicasio
Page 24 of 31
Last updated: 1/30/2016
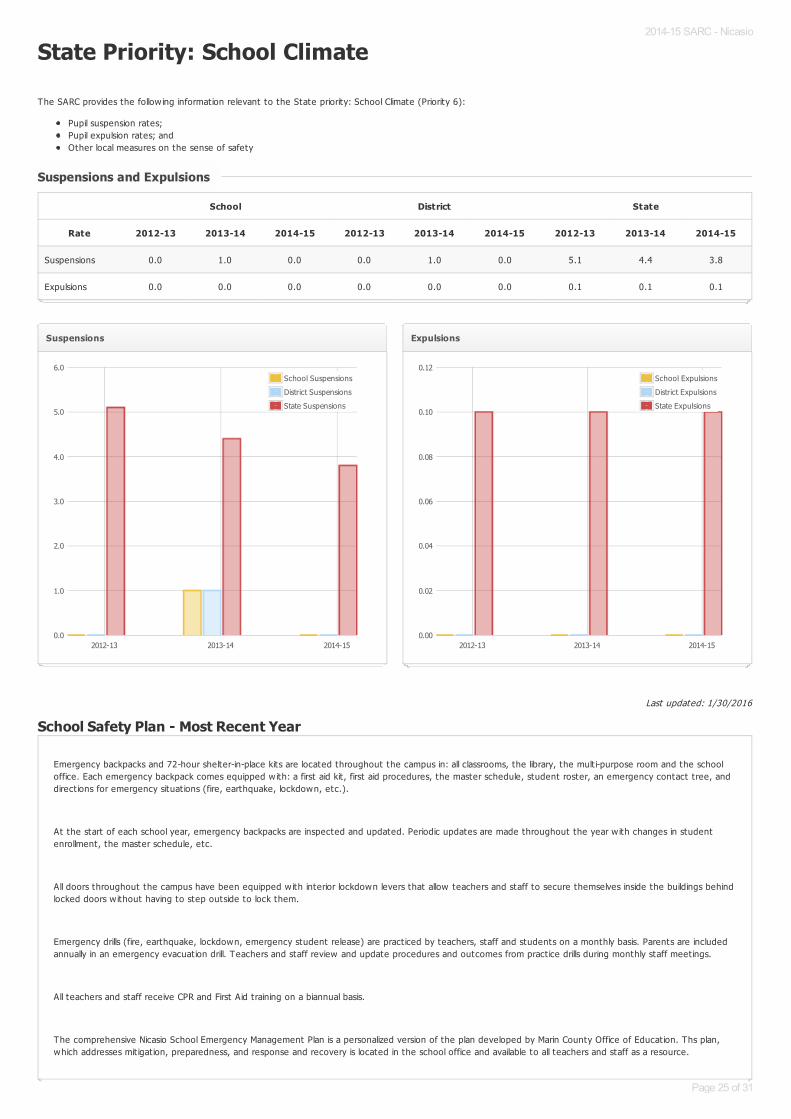
State Priority: School Climate
The SARC provides the follow ing information relevant to the State priority: School Climate (Priority 6):
Pupil suspension rates;Pupil expulsion rates; andOther local measures on the sense of safety
School Safety Plan - Most Recent Year
Suspensions and ExpulsionsSuspensions and Expulsions
School District State
Rate 2012-13 2013-14 2014-15 2012-13 2013-14 2014-15 2012-13 2013-14 2014-15
Suspensions 0.0 1.0 0.0 0.0 1.0 0.0 5.1 4.4 3.8
Expulsions 0.0 0.0 0.0 0.0 0.0 0.0 0.1 0.1 0.1
Suspensions
2012-13 2013-14 2014-150.0
1.0
2.0
3.0
4.0
5.0
6.0School Suspensions
District Suspensions
State Suspensions
Expulsions
2012-13 2013-14 2014-150.00
0.02
0.04
0.06
0.08
0.10
0.12School Expulsions
District Expulsions
State Expulsions
Emergency backpacks and 72-hour shelter-in-place kits are located throughout the campus in: all classrooms, the library, the mult i-purpose room and the schooloffice. Each emergency backpack comes equipped w ith: a first aid kit , first aid procedures, the master schedule, student roster, an emergency contact tree, anddirect ions for emergency situat ions (fire, earthquake, lockdown, etc.).
At the start of each school year, emergency backpacks are inspected and updated. Periodic updates are made throughout the year w ith changes in studentenrollment, the master schedule, etc.
All doors throughout the campus have been equipped w ith interior lockdown levers that allow teachers and staff to secure themselves inside the buildings behindlocked doors w ithout having to step outside to lock them.
Emergency drills (fire, earthquake, lockdown, emergency student release) are pract iced by teachers, staff and students on a monthly basis. Parents are includedannually in an emergency evacuat ion drill. Teachers and staff review and update procedures and outcomes from pract ice drills during monthly staff meetings.
All teachers and staff receive CPR and First Aid training on a biannual basis.
The comprehensive Nicasio School Emergency Management Plan is a personalized version of the plan developed by Marin County Office of Educat ion. Ths plan,which addresses mit igat ion, preparedness, and response and recovery is located in the school office and available to all teachers and staff as a resource.
2014-15 SARC - Nicasio
Page 25 of 31

Last updated: 1/30/2016
2014-15 SARC - Nicasio
Page 26 of 31
Last updated: 1/30/2016
Last updated: 1/30/2016
Last updated: 1/30/2016
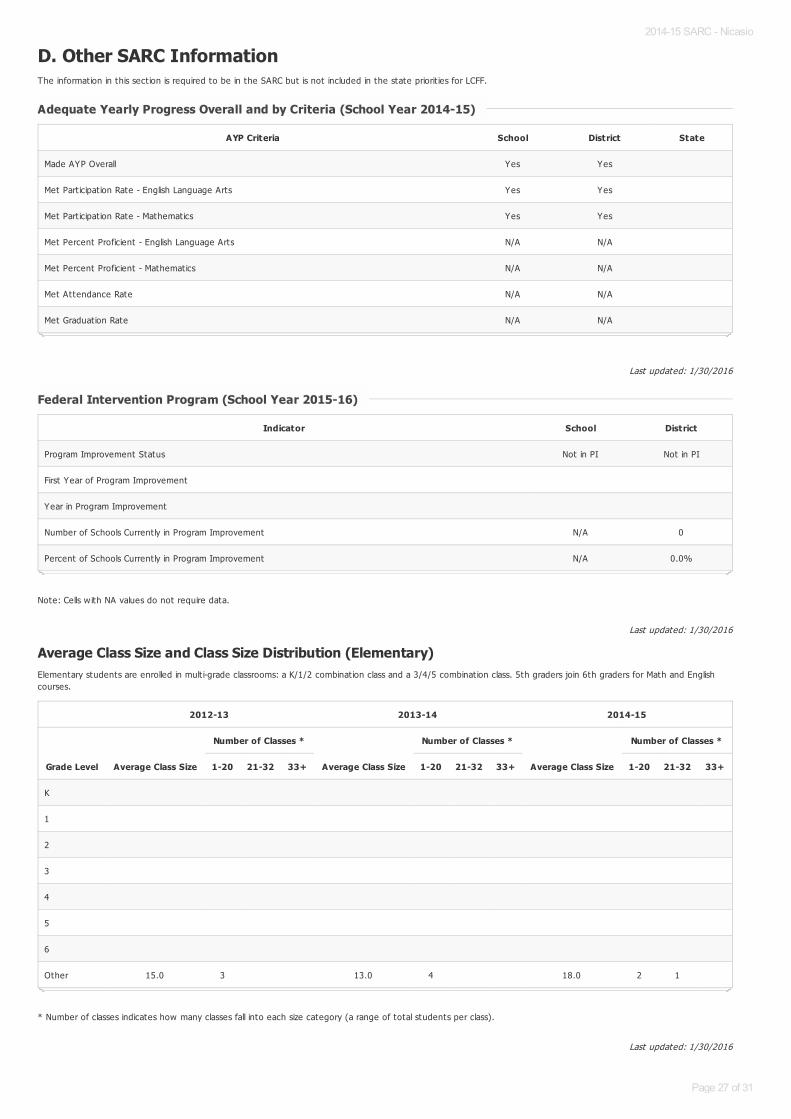
D. Other SARC InformationThe information in this sect ion is required to be in the SARC but is not included in the state priorit ies for LCFF.
Note: Cells w ith NA values do not require data.
Average Class Size and Class Size Distribution (Elementary)Elementary students are enrolled in mult i-grade classrooms: a K/1/2 combinat ion class and a 3/4/5 combinat ion class. 5th graders join 6th graders for Math and Englishcourses.
* Number of classes indicates how many classes fall into each size category (a range of total students per class).
Adequate Yearly Progress Overall and by Criteria (School Year 2014-15)Adequate Yearly Progress Overall and by Criteria (School Year 2014-15)
AYP Criteria School District State
Made AYP Overall Yes Yes
Met Part icipat ion Rate - English Language Arts Yes Yes
Met Part icipat ion Rate - Mathematics Yes Yes
Met Percent Proficient - English Language Arts N/A N/A
Met Percent Proficient - Mathematics N/A N/A
Met Attendance Rate N/A N/A
Met Graduat ion Rate N/A N/A
Federal Intervention Program (School Year 2015-16)Federal Intervention Program (School Year 2015-16)
Indicator School District
Program Improvement Status Not in PI Not in PI
First Year of Program Improvement
Year in Program Improvement
Number of Schools Current ly in Program Improvement N/A 0
Percent of Schools Current ly in Program Improvement N/A 0.0%
2012-13 2013-14 2014-15
Grade Level Average Class Size
Number of Classes *
Average Class Size
Number of Classes *
Average Class Size
Number of Classes *
1-20 21-32 33+ 1-20 21-32 33+ 1-20 21-32 33+
K
1
2
3
4
5
6
Other 15.0 3 13.0 4 18.0 2 1
2014-15 SARC - Nicasio
Page 27 of 31
Last updated: 1/30/2016
Last updated: 1/30/2016
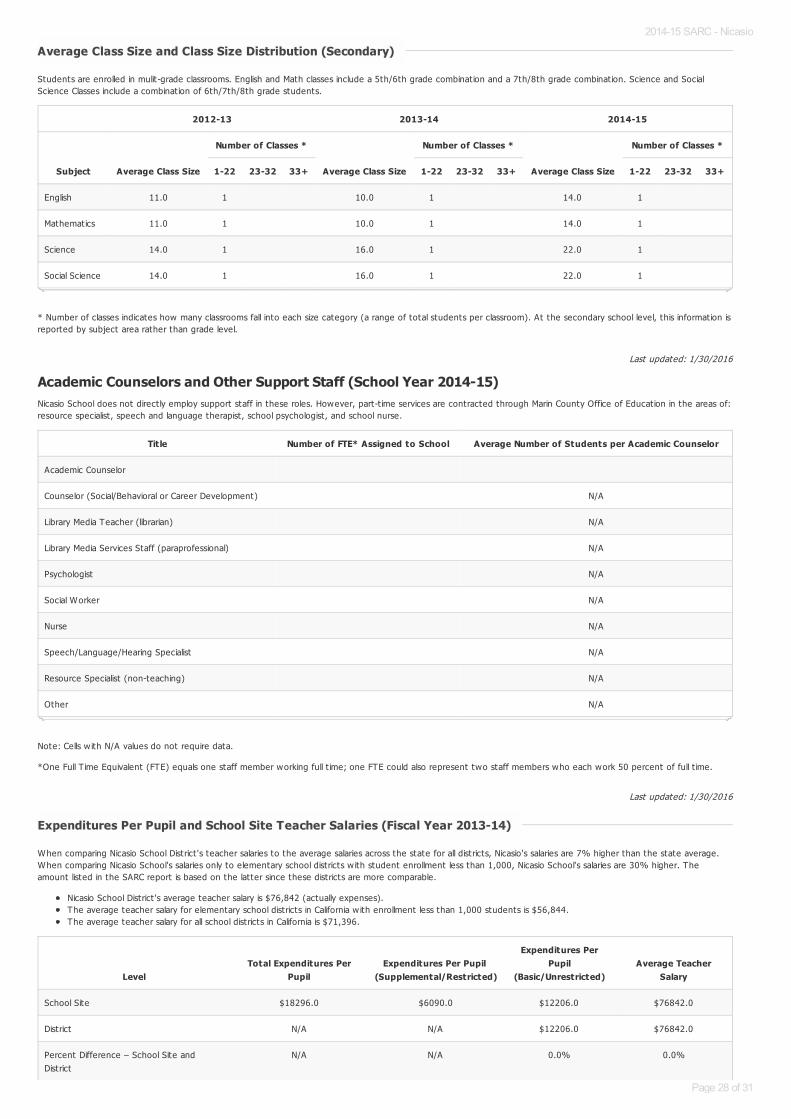
Students are enrolled in mulit-grade classrooms. English and Math classes include a 5th/6th grade combinat ion and a 7th/8th grade combinat ion. Science and SocialScience Classes include a combinat ion of 6th/7th/8th grade students.
* Number of classes indicates how many classrooms fall into each size category (a range of total students per classroom). At the secondary school level, this information isreported by subject area rather than grade level.
Academic Counselors and Other Support Staff (School Year 2014-15)Nicasio School does not direct ly employ support staff in these roles. However, part-t ime services are contracted through Marin County Office of Educat ion in the areas of:resource specialist , speech and language therapist, school psychologist, and school nurse.
Note: Cells w ith N/A values do not require data.
*One Full T ime Equivalent (FTE) equals one staff member working full t ime; one FTE could also represent two staff members who each work 50 percent of full t ime.
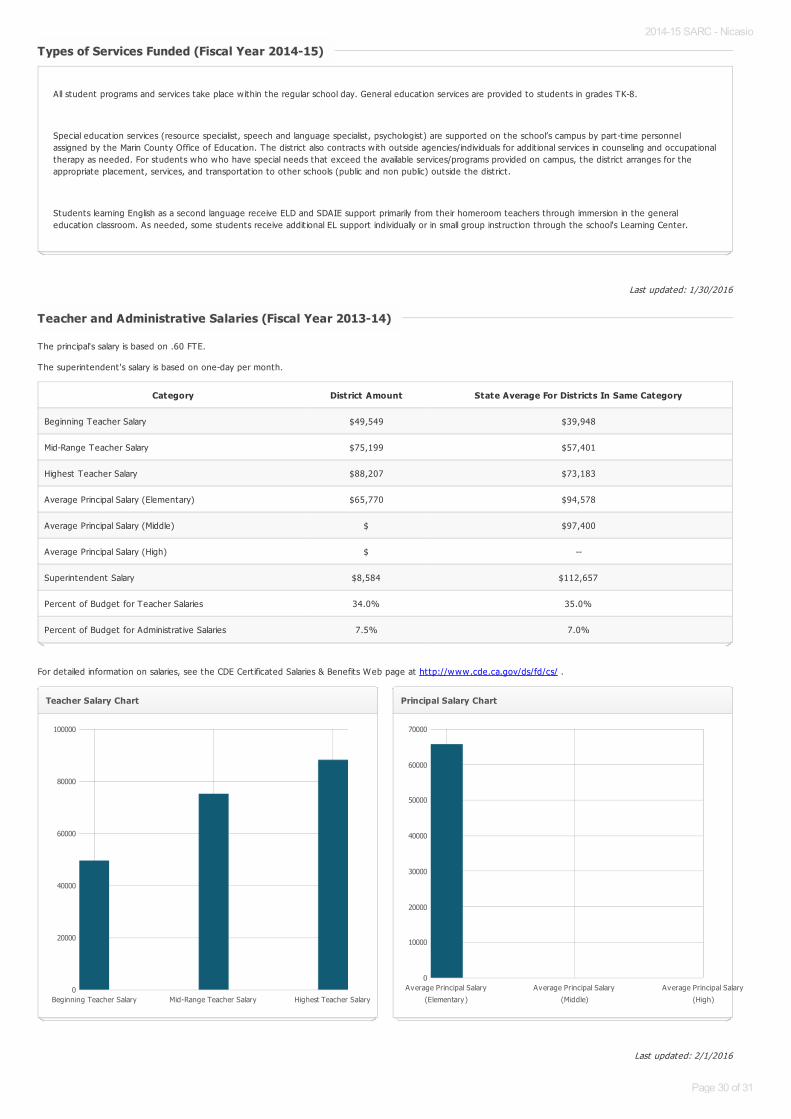
When comparing Nicasio School District 's teacher salaries to the average salaries across the state for all districts, Nicasio's salaries are 7% higher than the state average.When comparing Nicasio School's salaries only to elementary school districts w ith student enrollment less than 1,000, Nicasio School's salaries are 30% higher. Theamount listed in the SARC report is based on the latter since these districts are more comparable.
Nicasio School District 's average teacher salary is $76,842 (actually expenses).The average teacher salary for elementary school districts in California w ith enrollment less than 1,000 students is $56,844.The average teacher salary for all school districts in California is $71,396.
Average Class Size and Class Size Distribution (Secondary)Average Class Size and Class Size Distribution (Secondary)
2012-13 2013-14 2014-15
Subject Average Class Size
Number of Classes *
Average Class Size
Number of Classes *
Average Class Size
Number of Classes *
1-22 23-32 33+ 1-22 23-32 33+ 1-22 23-32 33+
English 11.0 1 10.0 1 14.0 1
Mathematics 11.0 1 10.0 1 14.0 1
Science 14.0 1 16.0 1 22.0 1
Social Science 14.0 1 16.0 1 22.0 1
Title Number of FTE* Assigned to School Average Number of Students per Academic Counselor
Academic Counselor
Counselor (Social/Behavioral or Career Development) N/A
Library Media Teacher (librarian) N/A
Library Media Services Staff (paraprofessional) N/A
Psychologist N/A
Social Worker N/A
Nurse N/A
Speech/Language/Hearing Specialist N/A
Resource Specialist (non-teaching) N/A
Other N/A
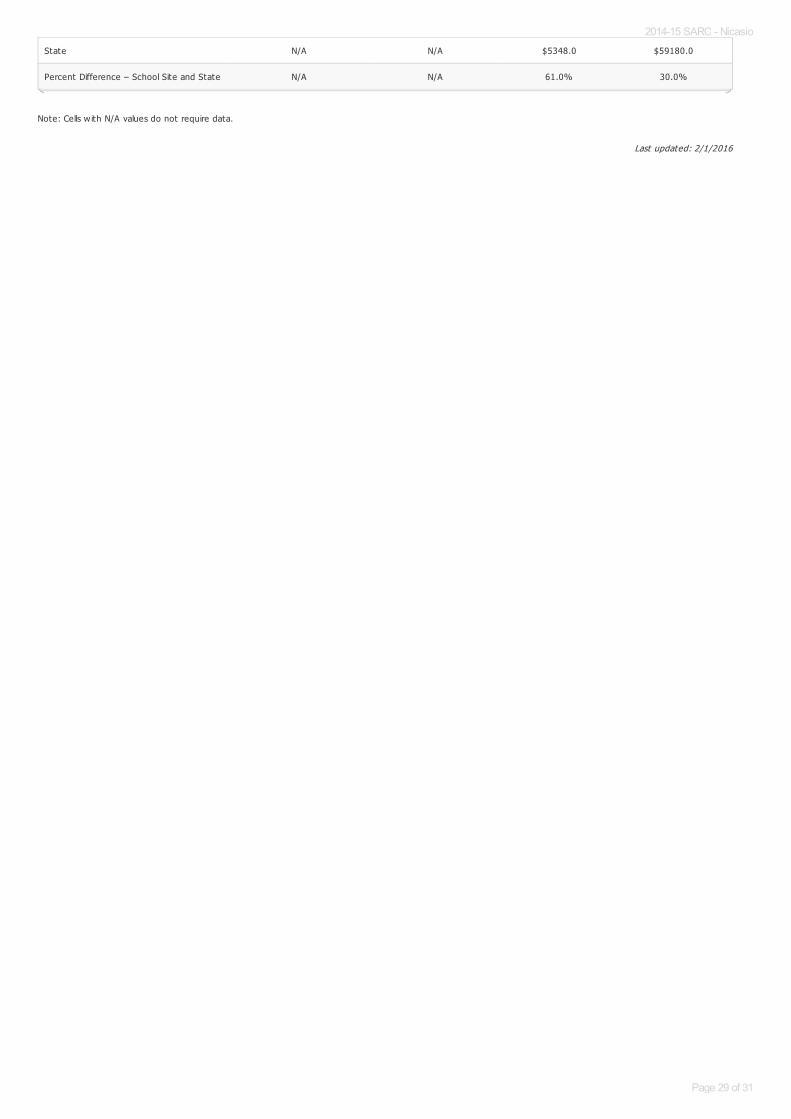
Expenditures Per Pupil and School Site Teacher Salaries (Fiscal Year 2013-14)Expenditures Per Pupil and School Site Teacher Salaries (Fiscal Year 2013-14)
LevelTotal Expenditures Per
PupilExpenditures Per Pupil
(Supplemental/Restricted)
Expenditures PerPupil
(Basic/Unrestricted)Average Teacher
Salary
School Site $18296.0 $6090.0 $12206.0 $76842.0
District N/A N/A $12206.0 $76842.0
Percent Difference – School Site andDistrict
N/A N/A 0.0% 0.0%
2014-15 SARC - Nicasio
Page 28 of 31
Last updated: 2/1/2016
Note: Cells w ith N/A values do not require data.
State N/A N/A $5348.0 $59180.0
Percent Difference – School Site and State N/A N/A 61.0% 30.0%
2014-15 SARC - Nicasio
Page 29 of 31
Last updated: 1/30/2016
Last updated: 2/1/2016
The principal's salary is based on .60 FTE.
The superintendent 's salary is based on one-day per month.
For detailed information on salaries, see the CDE Cert ificated Salaries & Benefits Web page at http://www.cde.ca.gov/ds/fd/cs/ .
Types of Services Funded (Fiscal Year 2014-15)Types of Services Funded (Fiscal Year 2014-15)
All student programs and services take place w ithin the regular school day. General educat ion services are provided to students in grades TK-8.
Special educat ion services (resource specialist , speech and language specialist , psychologist) are supported on the school’s campus by part-t ime personnelassigned by the Marin County Office of Educat ion. The district also contracts w ith outside agencies/individuals for addit ional services in counseling and occupat ionaltherapy as needed. For students who who have special needs that exceed the available services/programs provided on campus, the district arranges for theappropriate placement, services, and transportat ion to other schools (public and non public) outside the district .
Students learning English as a second language receive ELD and SDAIE support primarily from their homeroom teachers through immersion in the generaleducat ion classroom. As needed, some students receive addit ional EL support individually or in small group instruct ion through the school's Learning Center.
Teacher and Administrative Salaries (Fiscal Year 2013-14)Teacher and Administrative Salaries (Fiscal Year 2013-14)
Category District Amount State Average For Districts In Same Category
Beginning Teacher Salary $49,549 $39,948
Mid-Range Teacher Salary $75,199 $57,401
Highest Teacher Salary $88,207 $73,183
Average Principal Salary (Elementary) $65,770 $94,578
Average Principal Salary (Middle) $ $97,400
Average Principal Salary (High) $ --
Superintendent Salary $8,584 $112,657
Percent of Budget for Teacher Salaries 34.0% 35.0%
Percent of Budget for Administrat ive Salaries 7.5% 7.0%
Teacher Salary Chart
Beginning Teacher Salary Mid-Range Teacher Salary Highest Teacher Salary0
20000
40000
60000
80000
100000
Principal Salary Chart
Average Principal Salary
(Elementary)
Average Principal Salary
(Middle)
Average Principal Salary
(High)
0
10000
20000
30000
40000
50000
60000
70000
2014-15 SARC - Nicasio
Page 30 of 31
Last updated: 1/30/2016
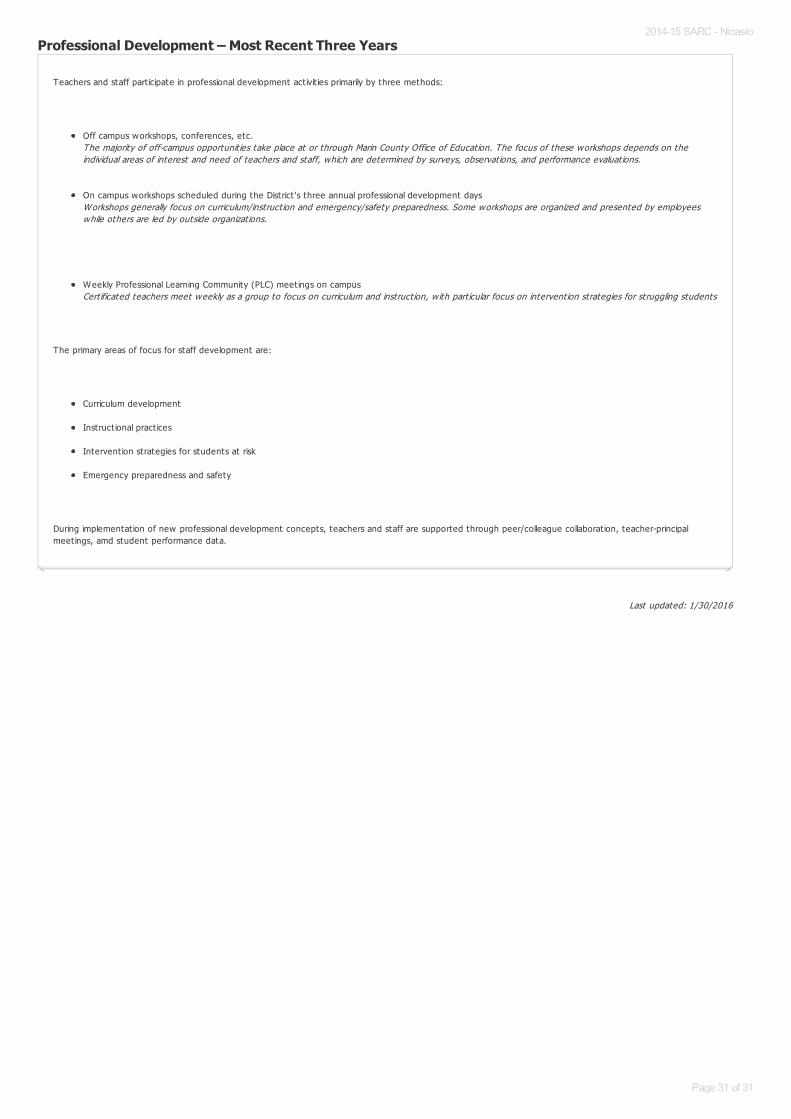
Professional Development – Most Recent Three Years
Teachers and staff part icipate in professional development act ivit ies primarily by three methods:
Off campus workshops, conferences, etc.The majority of off-campus opportunit ies take place at or through Marin County Office of Educat ion. The focus of these workshops depends on theindividual areas of interest and need of teachers and staff, which are determined by surveys, observat ions, and performance evaluat ions.
On campus workshops scheduled during the District 's three annual professional development daysWorkshops generally focus on curriculum/instruct ion and emergency/safety preparedness. Some workshops are organized and presented by employeeswhile others are led by outside organizat ions.
Weekly Professional Learning Community (PLC) meetings on campusCert ificated teachers meet weekly as a group to focus on curriculum and instruct ion, w ith part icular focus on intervent ion strategies for struggling students
The primary areas of focus for staff development are:
Curriculum development
Instruct ional pract ices
Intervent ion strategies for students at risk
Emergency preparedness and safety
During implementat ion of new professional development concepts, teachers and staff are supported through peer/colleague collaborat ion, teacher-principalmeetings, amd student performance data.
2014-15 SARC - Nicasio
Page 31 of 31