Embed Size (px)
Citation preview
School District
School Name Santa Monica High District Name Santa Monica-Malibu Unified
Street 601 Pico Blvd. Phone Number 310 450-8338
City, State, Zip Santa Monica, CA 90405-1224 Web Site www.smmusd.org
Phone Number 310 395-3204 ext. 301 Superintendent Tim Cuneo
Principal Hugo Pedroza E-mail Address [email protected]
E-mail Address [email protected] CDS Code 19-64980-1938000
The School Accountability Report Card (SARC), which is required by law to be published annually, contains information about the condition and performance of each California public school. More information about SARC requirements is available on the SARC Web page at http://www.cde.ca.gov/ta/ac/sa/. For additional information about the school, parents and community members should contact the school principal or the district office.
II. About This SchoolContact Information (School Year 2009-10)This section provides the school’s contact information.
Santa Monica High
I. Data and AccessDataQuest
DataQuest is an online data tool located at http://dq.cde.ca.gov/dataquest/ that contains additional information about this school and comparisons of the school to the district, the county, and the state. Specifically, DataQuest is a dynamic system that provides reports for accountability (e.g. Academic Performance Index [API], Adequate Yearly Progress [AYP], test data, enrollment, graduates, dropouts, course enrollments, staffing, and data regarding English learners.
Internet AccessInternet access is available at public libraries and other locations that are publicly accessible (e.g., the California State Library). Access to the Internet at libraries and public locations is generally provided on a first-come, first-served basis. Other use restrictions include the hours of operation, the length of time that a workstation may be used (depending on availability), the types of software programs available on a workstation, and the ability to print documents.
District Vision
As a community of learners, the Santa Monica-Malibu Unified School District works together in a nurturing environment to help students be visionary, versatile thinkers; resourceful, life-long learners; effective, multilingual communicators and global citizens. We are a richly varied community that values the contributions of all its members.
School Description and Mission Statement (School Year 2008-09)This section provides information about the school, its programs and its goals.
Generated by School Innovations & Advocacy on 1/25/2010 2:11:52 PM Page 1 of 23
Santa Monica High
School Accountability Report CardPublished During 2009-10Reported for School Year 2008-09
We exist to prepare all students in their pursuit of academic achievement and personal health, and to support and encourage them in their development of intellectual, artistic, technological, physical and social expression.
School Vision
Santa Monica High School provides all students with academic and co-curricular opportunities to be successful in college and the world of work. We provide academic and social support systems so that every student succeeds through rigorous academic challenges, and graduates with a high-quality education.
About Us
Santa Monica High School has been in existence for 118 years. The school began as the Sixth Street School, and in 1891 added an upper level curriculum to complete a four-year high school program. The first class, called The Immortal Five, graduated in 1894. From Sixth Street and Santa Monica Boulevard, the high school was moved to Eleventh Street and Arizona Avenue. The building, called Lincoln High School, was finished in 1898 and dedicated at the graduation exercise of that year. In its present day form, Santa Monica High School is a school of 3000 students who represent a diverse ethnic and socio-economic community. The school is located on a 33-acre campus with the Pacific Ocean in view. The staff is comprised of 155 certificated faculty and 75 classified staff members. Fondly referred to as Samohi, the school is supported by a 4,000 member Alumni Association, as well as the citizens of Santa Monica and Malibu. Santa Monica High School received a six-year accreditation from the Western Association of Schools and Colleges (WASC) in the spring of 2005. As part of the accreditation process, goals were set for the next six years of work. In addition, a Smaller Learning Communities Grant, received in 2003 from the Federal Government to redesign Santa Monica High School into smaller, more personalized "houses", has a yearly external evaluation with set goals for our work. Along with these two external evaluations and goal setting processes, the school sets goals through the Single Plan for Student Achievement, incorporating steps to close the achievement gap while simultaneously improving the achievement of all of our students.
Message From Principal Dr. Hugo A. Pedroza
Live as if you were to die tomorrow. Learn as if you were to live forever. Mahatma Gandhi
The entire Samohi school community expects this year to be abundant with student accomplishments thriving in a positive, nurturing environment.
Many parents already know that we are committed to providing the support necessary for all students to succeed. In particular, I would like parents of incoming 9th graders to be confident in our high quality staff who will work with your son/daughter to help them do well at Samohi. We have a House System designed to provide direct, personal attention to each and every student.
In order to understand the purpose of our efforts, I would like to share the two tenets that will guide our work:
1. Provide all students with academic and co-curricular opportunities to be successful in college and the world of work.
2. Provide academic and social support systems so that every student is successful in rigorous, academic challenges and graduates with a high-quality education.
This translates into increased support for teachers and students based on clearly analyzed achievement data. I want every one of our students to continue to have opportunities to maximize their potential. This year, however, I want this effort to be much more deliberate and informed. For example, I want to refine our efforts to continue to decrease the number of students who have less than a 2.0 GPA. To this end, we will work diligently to augment and systematize parental support, carefully monitor student progress and modify programs to yield higher success rates.
There is no question that parents play a crucial role in their children’s education. At Santa Monica High School, the partnership between parents and school has been a key ingredient in the school’s success. I want to continue to build this relationship so that Samohi continues to be a public institution where excellence permeates our accomplishments and attitudes. I look forward to working with you this year.
Generated by School Innovations & Advocacy on 1/25/2010 2:11:52 PM Page 2 of 23
Santa Monica High
School Accountability Report CardPublished During 2009-10Reported for School Year 2008-09
Grade Level Number of Students
Kindergarten 0
Grade 1 0
Grade 2 0
Grade 3 0
Grade 4 0
Grade 5 0
Grade 6 0
Grade 7 0
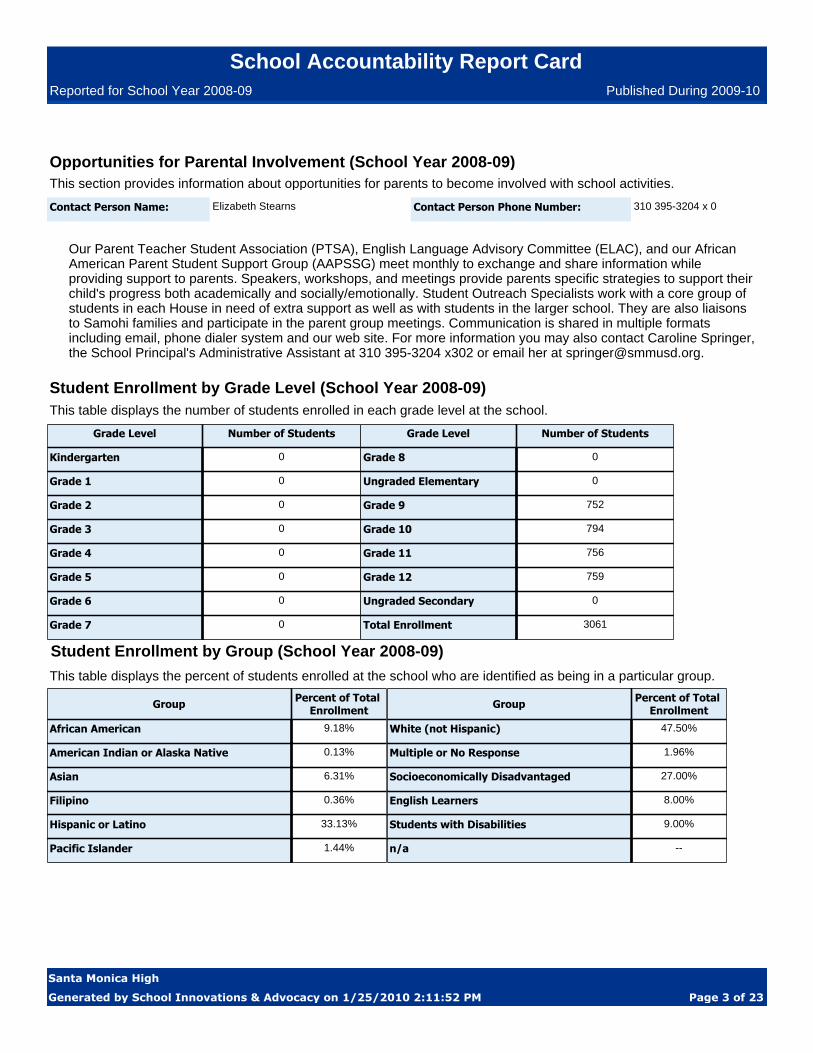
Student Enrollment by Grade Level (School Year 2008-09)This table displays the number of students enrolled in each grade level at the school.
Grade Level Number of Students
Grade 8 0
Ungraded Elementary 0
Grade 9 752
Grade 10 794
Grade 11 756
Grade 12 759
Ungraded Secondary 0
Total Enrollment 3061
Opportunities for Parental Involvement (School Year 2008-09)
Our Parent Teacher Student Association (PTSA), English Language Advisory Committee (ELAC), and our African American Parent Student Support Group (AAPSSG) meet monthly to exchange and share information while providing support to parents. Speakers, workshops, and meetings provide parents specific strategies to support their child's progress both academically and socially/emotionally. Student Outreach Specialists work with a core group of students in each House in need of extra support as well as with students in the larger school. They are also liaisons to Samohi families and participate in the parent group meetings. Communication is shared in multiple formats including email, phone dialer system and our web site. For more information you may also contact Caroline Springer, the School Principal's Administrative Assistant at 310 395-3204 x302 or email her at [email protected].
This section provides information about opportunities for parents to become involved with school activities.
Contact Person Name: Contact Person Phone Number:Elizabeth Stearns 310 395-3204 x 0
Student Enrollment by Group (School Year 2008-09)
This table displays the percent of students enrolled at the school who are identified as being in a particular group.
Group Percent of Total Enrollment
African American 9.18%
American Indian or Alaska Native 0.13%
Asian 6.31%
Filipino 0.36%
Hispanic or Latino 33.13%
Pacific Islander 1.44%
Group Percent of Total Enrollment
White (not Hispanic) 47.50%
Multiple or No Response 1.96%
Socioeconomically Disadvantaged 27.00%
English Learners 8.00%
Students with Disabilities 9.00%
n/a --
Generated by School Innovations & Advocacy on 1/25/2010 2:11:52 PM Page 3 of 23
Santa Monica High
School Accountability Report CardPublished During 2009-10Reported for School Year 2008-09
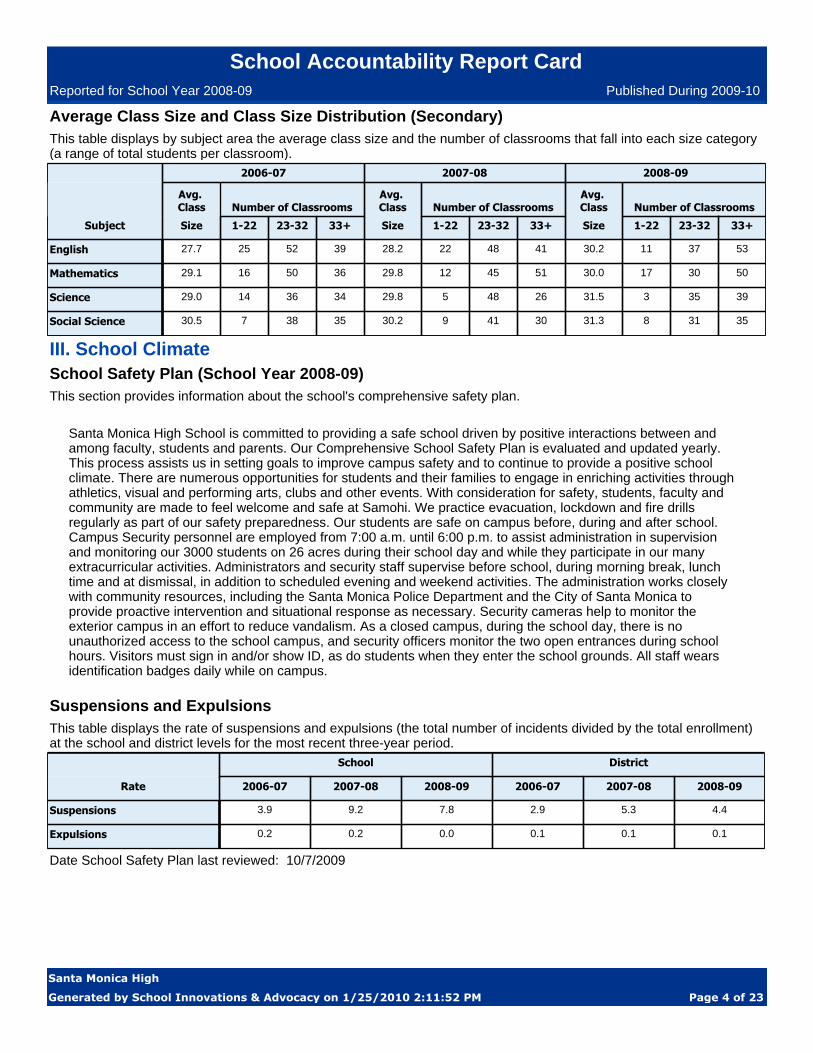
This table displays by subject area the average class size and the number of classrooms that fall into each size category (a range of total students per classroom).
Average Class Size and Class Size Distribution (Secondary)
2006-07 2007-08 2008-09
Avg. Class Number of Classrooms
Avg. Class Number of Classrooms
Avg. Class Number of Classrooms
Subject Size 1-22 23-32 33+ Size 1-22 23-32 33+ Size 1-22 23-32 33+
English 27.7 25 52 39 28.2 22 48 41 30.2 11 37 53
Mathematics 29.1 16 50 36 29.8 12 45 51 30.0 17 30 50
Science 29.0 14 36 34 29.8 5 48 26 31.5 3 35 39
Social Science 30.5 7 38 35 30.2 9 41 30 31.3 8 31 35
School Safety Plan (School Year 2008-09)
Santa Monica High School is committed to providing a safe school driven by positive interactions between and among faculty, students and parents. Our Comprehensive School Safety Plan is evaluated and updated yearly. This process assists us in setting goals to improve campus safety and to continue to provide a positive school climate. There are numerous opportunities for students and their families to engage in enriching activities through athletics, visual and performing arts, clubs and other events. With consideration for safety, students, faculty and community are made to feel welcome and safe at Samohi. We practice evacuation, lockdown and fire drills regularly as part of our safety preparedness. Our students are safe on campus before, during and after school. Campus Security personnel are employed from 7:00 a.m. until 6:00 p.m. to assist administration in supervision and monitoring our 3000 students on 26 acres during their school day and while they participate in our many extracurricular activities. Administrators and security staff supervise before school, during morning break, lunch time and at dismissal, in addition to scheduled evening and weekend activities. The administration works closely with community resources, including the Santa Monica Police Department and the City of Santa Monica to provide proactive intervention and situational response as necessary. Security cameras help to monitor the exterior campus in an effort to reduce vandalism. As a closed campus, during the school day, there is no unauthorized access to the school campus, and security officers monitor the two open entrances during school hours. Visitors must sign in and/or show ID, as do students when they enter the school grounds. All staff wears identification badges daily while on campus.
III. School Climate
This section provides information about the school's comprehensive safety plan.
This table displays the rate of suspensions and expulsions (the total number of incidents divided by the total enrollment) at the school and district levels for the most recent three-year period.
Suspensions and Expulsions
School District
Rate 2006-07 2007-08 2008-09 2006-07 2007-08 2008-09
Suspensions 3.9 9.2 7.8 2.9 5.3 4.4
Expulsions 0.2 0.2 0.0 0.1 0.1 0.1
Date School Safety Plan last reviewed: 10/7/2009
Generated by School Innovations & Advocacy on 1/25/2010 2:11:52 PM Page 4 of 23
Santa Monica High
School Accountability Report CardPublished During 2009-10Reported for School Year 2008-09
School Facility ConditionsThis section provides information about the condition of the school’s grounds, buildings, and restrooms, and a description of any planned or recently completed facility improvements.
IV. School Facilities
In its 118-year history, Samohi has benefited from a number of bond measures that have upgraded facilities, added new classrooms and buildings, and renovated the historic Barnum Hall. Our facilities include general education classrooms, music rooms for both choral and instrumental programs, science labs, art rooms, a photography setting with a dark room, five computer labs and a media center/library. Our outdoor and physical education facilities include a swimming pool, tennis courts, a baseball field, a softball field, gymnasiums and our outdoor Greek Theatre. Samohi's facility is maintained and in well-functioning condition.
The Santa Monica High School facility provides dedicated classroom space for all sections of classes from 7:10 a.m. through evening hours. Classrooms meet specific square footage guidelines and are equipped with whiteboards, classroom materials, audiovisual equipment, computers, and laboratory equipment as needed. Classroom settings are arranged by teachers to meet particular program needs. Restrooms and other high need areas are cleaned daily while classrooms are cleaned every other day on a rotational basis. Physical education areas, including gyms, the pool and fields provide areas for class, practice and competitions and other instructional activities. There is a well-stocked library/ media center with technology and print resources, staffed by two certificated library-media teachers and a classified staff member. In addition, there are three computer labs utilized on a regular basis supported by two full-time technicians. House offices are strategically located across the campus in order to support student advisement, personalization, and academic intervention.
The district participates in the State School Deferred Maintenance Program, which provides state matching funds on a dollar-for-dollar basis, to assist school districts with expenditures for major repair or replacement of existing school building components. Typically, this includes roofing, plumbing, heating, air conditioning, electrical systems, interior or exterior painting, and floor systems. During the summer of 2009, Samohi's exterior was completely painted, enhacing the look and feel of the campus. Needed maintenance includes routine roof maintenance to keep warranties current; deferred maintenance projects include flooring replacement, interior painting, and some light asphalt repairs. We are proud that our school district takes great efforts to ensure that our school is clean, safe, and functional. There are no emergency needs as defined by the Office of Public School Construction.
Planned Improvements (School Year 2009-2010)
On November 4, 2006, Measure BB passed with 67% of the vote providing 268 million dollars for the district dedicated to facilities, repairs, and improvements, in addition, Prop 1D passed allowing the district to receive matching funds from the state. Samohi is currently working with architects and other resources to begin implementing the first phase of a construction plan for the school - the edification of a new Science and Technology building. Construction is slated to begin in early 2010.
Generated by School Innovations & Advocacy on 1/25/2010 2:11:52 PM Page 5 of 23
Santa Monica High
School Accountability Report CardPublished During 2009-10Reported for School Year 2008-09
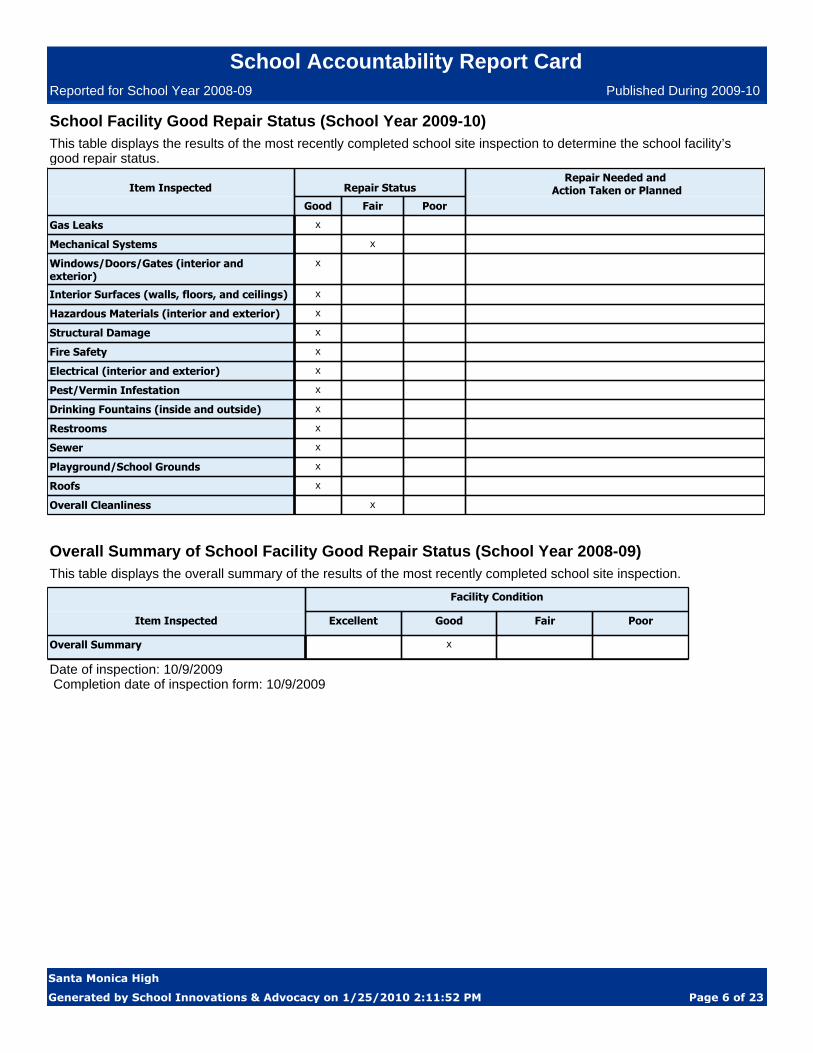
School Facility Good Repair Status (School Year 2009-10)This table displays the results of the most recently completed school site inspection to determine the school facility’s good repair status.
Item Inspected Repair StatusRepair Needed and
Action Taken or PlannedGood Fair Poor
Gas Leaks x
Mechanical Systems x
Windows/Doors/Gates (interior and exterior)
x
Interior Surfaces (walls, floors, and ceilings) x
Hazardous Materials (interior and exterior) x
Structural Damage x
Fire Safety x
Electrical (interior and exterior) x
Pest/Vermin Infestation x
Drinking Fountains (inside and outside) x
Restrooms x
Sewer x
Playground/School Grounds x
Roofs x
Overall Cleanliness x
Facility Condition
Item Inspected Excellent Good Fair Poor
Overall Summary x
This table displays the overall summary of the results of the most recently completed school site inspection.
Overall Summary of School Facility Good Repair Status (School Year 2008-09)
Date of inspection: 10/9/2009 Completion date of inspection form: 10/9/2009
Generated by School Innovations & Advocacy on 1/25/2010 2:11:52 PM Page 6 of 23
Santa Monica High
School Accountability Report CardPublished During 2009-10Reported for School Year 2008-09
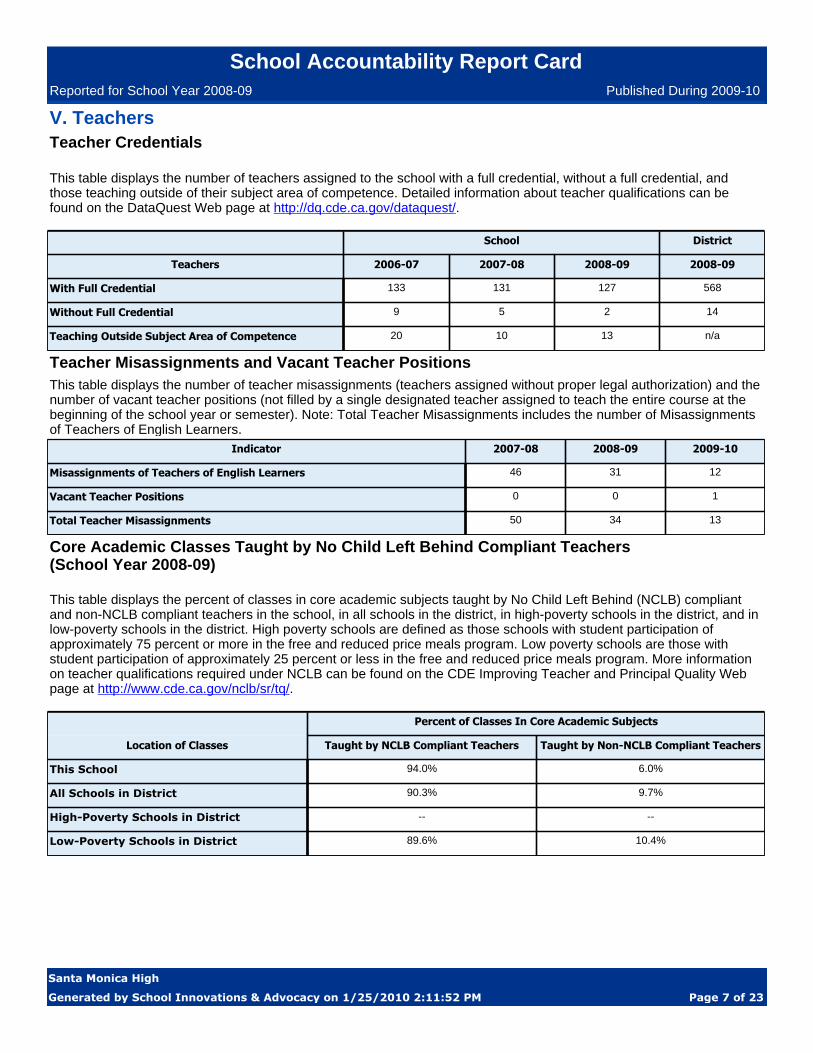
This table displays the percent of classes in core academic subjects taught by No Child Left Behind (NCLB) compliant and non-NCLB compliant teachers in the school, in all schools in the district, in high-poverty schools in the district, and in low-poverty schools in the district. High poverty schools are defined as those schools with student participation of approximately 75 percent or more in the free and reduced price meals program. Low poverty schools are those with student participation of approximately 25 percent or less in the free and reduced price meals program. More information on teacher qualifications required under NCLB can be found on the CDE Improving Teacher and Principal Quality Web page at http://www.cde.ca.gov/nclb/sr/tq/.
Core Academic Classes Taught by No Child Left Behind Compliant Teachers(School Year 2008-09)
Percent of Classes In Core Academic Subjects
Location of Classes Taught by NCLB Compliant Teachers Taught by Non-NCLB Compliant Teachers
This School 94.0% 6.0%
All Schools in District 90.3% 9.7%
High-Poverty Schools in District -- --
Low-Poverty Schools in District 89.6% 10.4%
This table displays the number of teachers assigned to the school with a full credential, without a full credential, and those teaching outside of their subject area of competence. Detailed information about teacher qualifications can be found on the DataQuest Web page at http://dq.cde.ca.gov/dataquest/.
Teacher CredentialsV. Teachers
School District
Teachers 2006-07 2007-08 2008-09 2008-09
With Full Credential 133 131 127 568
Without Full Credential 9 5 2 14
Teaching Outside Subject Area of Competence 20 10 13 n/a
This table displays the number of teacher misassignments (teachers assigned without proper legal authorization) and the number of vacant teacher positions (not filled by a single designated teacher assigned to teach the entire course at the beginning of the school year or semester). Note: Total Teacher Misassignments includes the number of Misassignments of Teachers of English Learners.
Teacher Misassignments and Vacant Teacher Positions
Indicator 2007-08 2008-09 2009-10
Misassignments of Teachers of English Learners 46 31 12
Vacant Teacher Positions 0 0 1
Total Teacher Misassignments 50 34 13
Generated by School Innovations & Advocacy on 1/25/2010 2:11:52 PM Page 7 of 23
Santa Monica High
School Accountability Report CardPublished During 2009-10Reported for School Year 2008-09
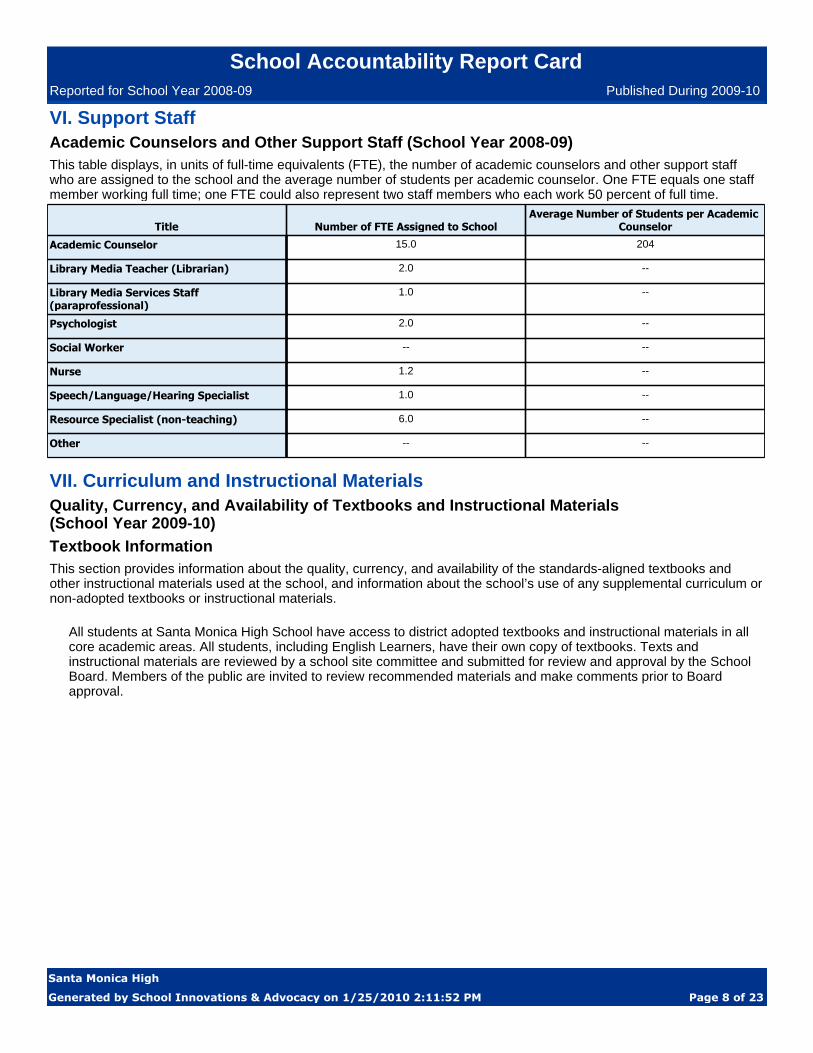
This table displays, in units of full-time equivalents (FTE), the number of academic counselors and other support staff who are assigned to the school and the average number of students per academic counselor. One FTE equals one staff member working full time; one FTE could also represent two staff members who each work 50 percent of full time.
Academic Counselors and Other Support Staff (School Year 2008-09)
Title Number of FTE Assigned to SchoolAverage Number of Students per Academic
Counselor
Academic Counselor 15.0 204
Library Media Teacher (Librarian) 2.0 --
Library Media Services Staff (paraprofessional)
1.0 --
Psychologist 2.0 --
Social Worker -- --
Nurse 1.2 --
Speech/Language/Hearing Specialist 1.0 --
Resource Specialist (non-teaching) 6.0 --
Other -- --
VI. Support Staff
VII. Curriculum and Instructional MaterialsQuality, Currency, and Availability of Textbooks and Instructional Materials(School Year 2009-10)
All students at Santa Monica High School have access to district adopted textbooks and instructional materials in all core academic areas. All students, including English Learners, have their own copy of textbooks. Texts and instructional materials are reviewed by a school site committee and submitted for review and approval by the School Board. Members of the public are invited to review recommended materials and make comments prior to Board approval.
This section provides information about the quality, currency, and availability of the standards-aligned textbooks and other instructional materials used at the school, and information about the school’s use of any supplemental curriculum or non-adopted textbooks or instructional materials.
Textbook Information
Generated by School Innovations & Advocacy on 1/25/2010 2:11:52 PM Page 8 of 23
Santa Monica High
School Accountability Report CardPublished During 2009-10Reported for School Year 2008-09
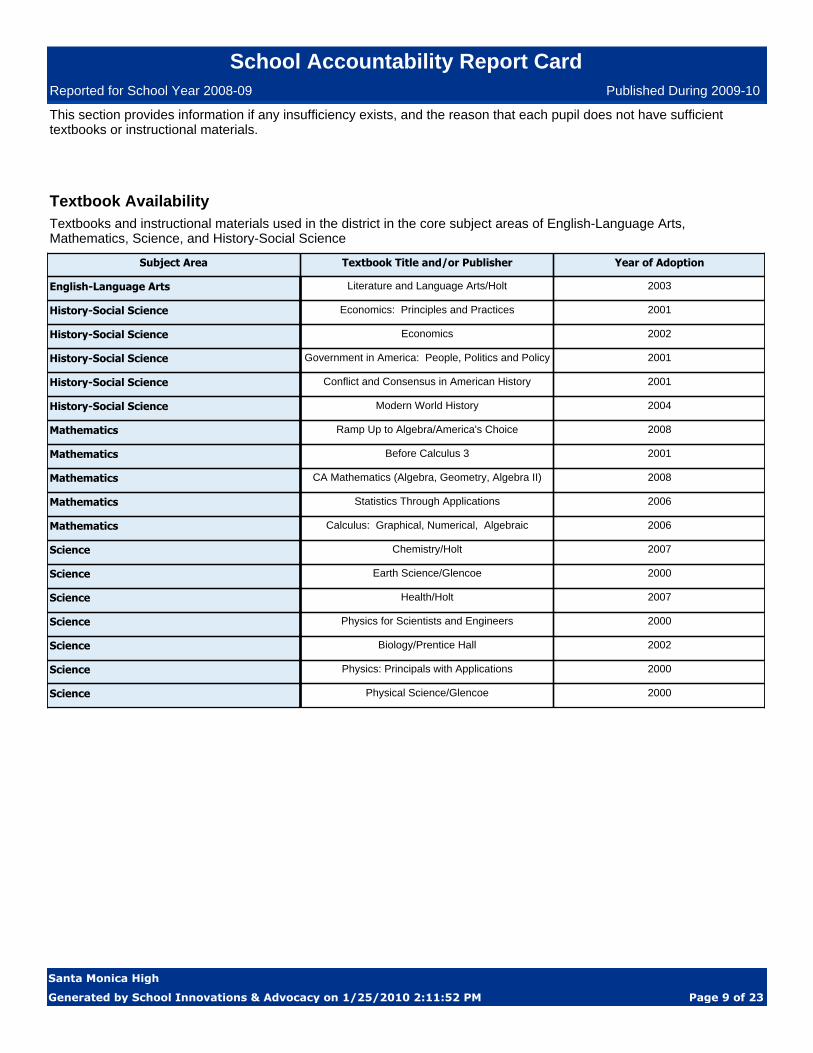
This section provides information if any insufficiency exists, and the reason that each pupil does not have sufficienttextbooks or instructional materials.
Textbooks and instructional materials used in the district in the core subject areas of English-Language Arts,Mathematics, Science, and History-Social Science
Textbook Availability
Subject Area Textbook Title and/or Publisher Year of Adoption
English-Language Arts Literature and Language Arts/Holt 2003
History-Social Science Economics: Principles and Practices 2001
History-Social Science Economics 2002
History-Social Science Government in America: People, Politics and Policy 2001
History-Social Science Conflict and Consensus in American History 2001
History-Social Science Modern World History 2004
Mathematics Ramp Up to Algebra/America's Choice 2008
Mathematics Before Calculus 3 2001
Mathematics CA Mathematics (Algebra, Geometry, Algebra II) 2008
Mathematics Statistics Through Applications 2006
Mathematics Calculus: Graphical, Numerical, Algebraic 2006
Science Chemistry/Holt 2007
Science Earth Science/Glencoe 2000
Science Health/Holt 2007
Science Physics for Scientists and Engineers 2000
Science Biology/Prentice Hall 2002
Science Physics: Principals with Applications 2000
Science Physical Science/Glencoe 2000
Generated by School Innovations & Advocacy on 1/25/2010 2:11:52 PM Page 9 of 23
Santa Monica High
School Accountability Report CardPublished During 2009-10Reported for School Year 2008-09
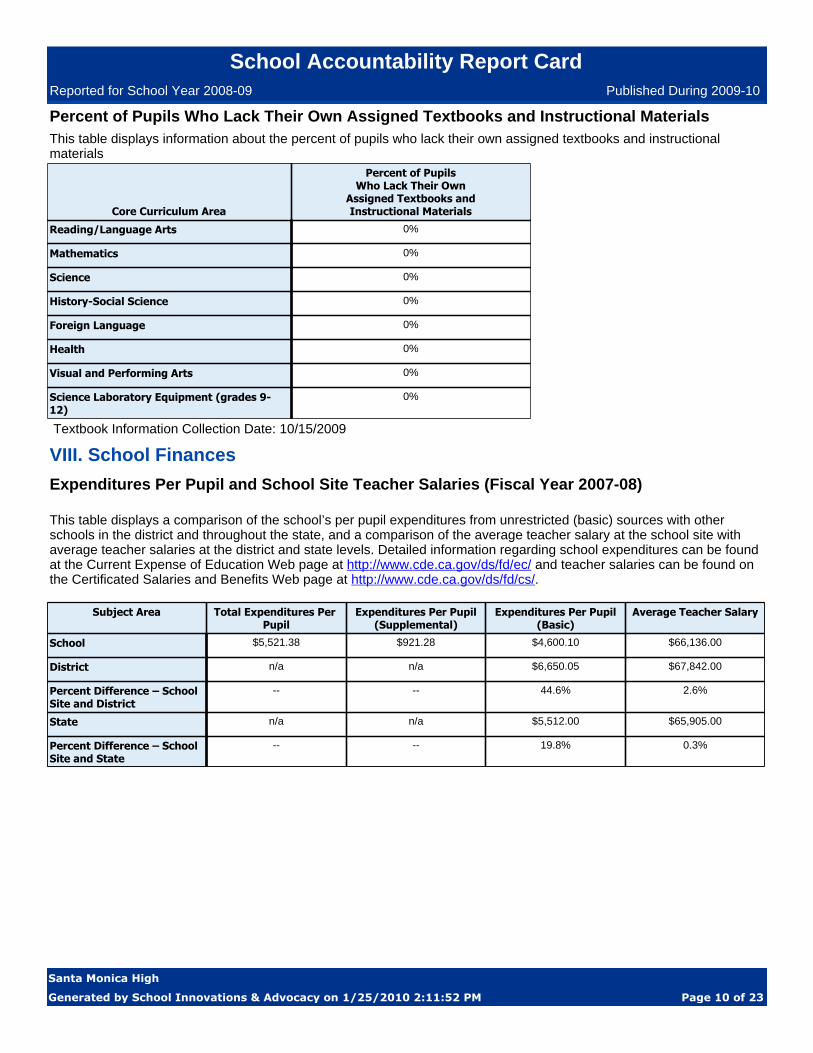
This table displays a comparison of the school’s per pupil expenditures from unrestricted (basic) sources with other schools in the district and throughout the state, and a comparison of the average teacher salary at the school site with average teacher salaries at the district and state levels. Detailed information regarding school expenditures can be found at the Current Expense of Education Web page at http://www.cde.ca.gov/ds/fd/ec/ and teacher salaries can be found on the Certificated Salaries and Benefits Web page at http://www.cde.ca.gov/ds/fd/cs/.
Expenditures Per Pupil and School Site Teacher Salaries (Fiscal Year 2007-08)
VIII. School Finances
Subject Area Total Expenditures Per Pupil
Expenditures Per Pupil(Supplemental)
Expenditures Per Pupil(Basic)
Average Teacher Salary
School $5,521.38 $921.28 $4,600.10 $66,136.00
District n/a n/a $6,650.05 $67,842.00
Percent Difference – School Site and District
-- -- 44.6% 2.6%
State n/a n/a $5,512.00 $65,905.00
Percent Difference – School Site and State
-- -- 19.8% 0.3%
Core Curriculum Area
Percent of PupilsWho Lack Their Own
Assigned Textbooks andInstructional Materials
Reading/Language Arts 0%
Mathematics 0%
Science 0%
History-Social Science 0%
Foreign Language 0%
Health 0%
Visual and Performing Arts 0%
Science Laboratory Equipment (grades 9-12)
0%
Percent of Pupils Who Lack Their Own Assigned Textbooks and Instructional MaterialsThis table displays information about the percent of pupils who lack their own assigned textbooks and instructionalmaterials
Textbook Information Collection Date: 10/15/2009
Generated by School Innovations & Advocacy on 1/25/2010 2:11:52 PM Page 10 of 23
Santa Monica High
School Accountability Report CardPublished During 2009-10Reported for School Year 2008-09
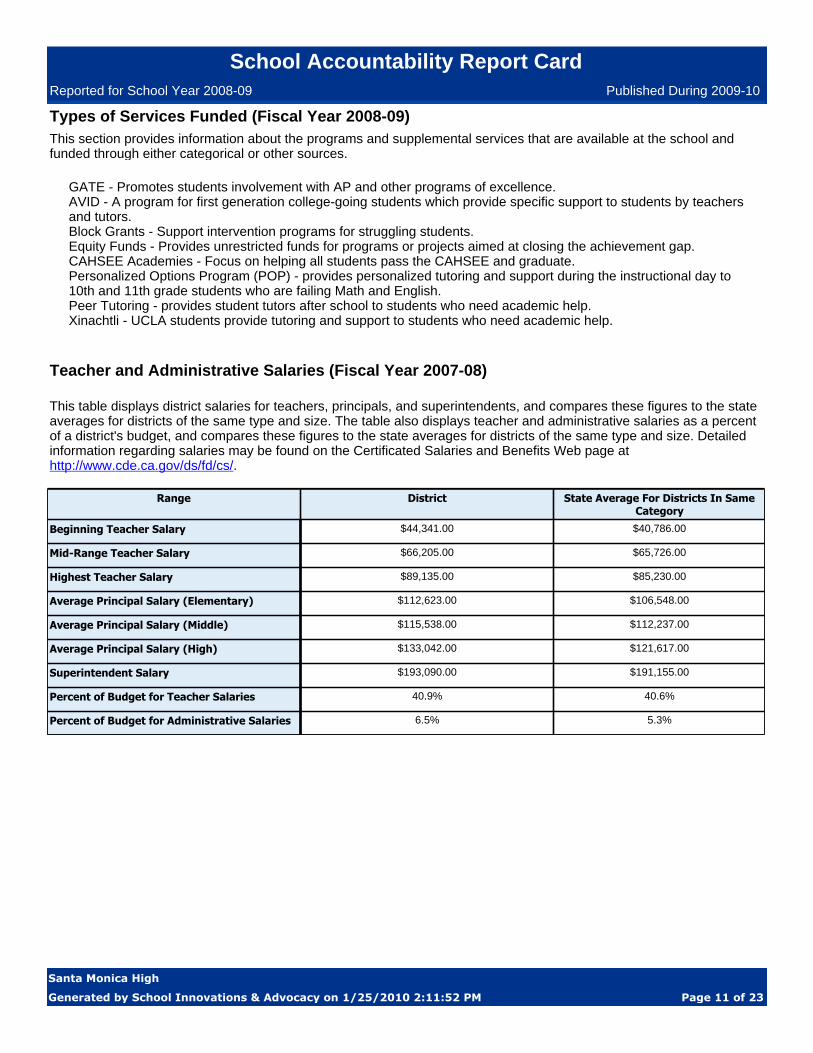
This table displays district salaries for teachers, principals, and superintendents, and compares these figures to the state averages for districts of the same type and size. The table also displays teacher and administrative salaries as a percent of a district's budget, and compares these figures to the state averages for districts of the same type and size. Detailed information regarding salaries may be found on the Certificated Salaries and Benefits Web page at http://www.cde.ca.gov/ds/fd/cs/.
Teacher and Administrative Salaries (Fiscal Year 2007-08)
Range District State Average For Districts In SameCategory
Beginning Teacher Salary $44,341.00 $40,786.00
Mid-Range Teacher Salary $66,205.00 $65,726.00
Highest Teacher Salary $89,135.00 $85,230.00
Average Principal Salary (Elementary) $112,623.00 $106,548.00
Average Principal Salary (Middle) $115,538.00 $112,237.00
Average Principal Salary (High) $133,042.00 $121,617.00
Superintendent Salary $193,090.00 $191,155.00
Percent of Budget for Teacher Salaries 40.9% 40.6%
Percent of Budget for Administrative Salaries 6.5% 5.3%
GATE - Promotes students involvement with AP and other programs of excellence.AVID - A program for first generation college-going students which provide specific support to students by teachers and tutors.Block Grants - Support intervention programs for struggling students.Equity Funds - Provides unrestricted funds for programs or projects aimed at closing the achievement gap.CAHSEE Academies - Focus on helping all students pass the CAHSEE and graduate.Personalized Options Program (POP) - provides personalized tutoring and support during the instructional day to 10th and 11th grade students who are failing Math and English.Peer Tutoring - provides student tutors after school to students who need academic help.Xinachtli - UCLA students provide tutoring and support to students who need academic help.
Types of Services Funded (Fiscal Year 2008-09)This section provides information about the programs and supplemental services that are available at the school and funded through either categorical or other sources.
Generated by School Innovations & Advocacy on 1/25/2010 2:11:52 PM Page 11 of 23
Santa Monica High
School Accountability Report CardPublished During 2009-10Reported for School Year 2008-09
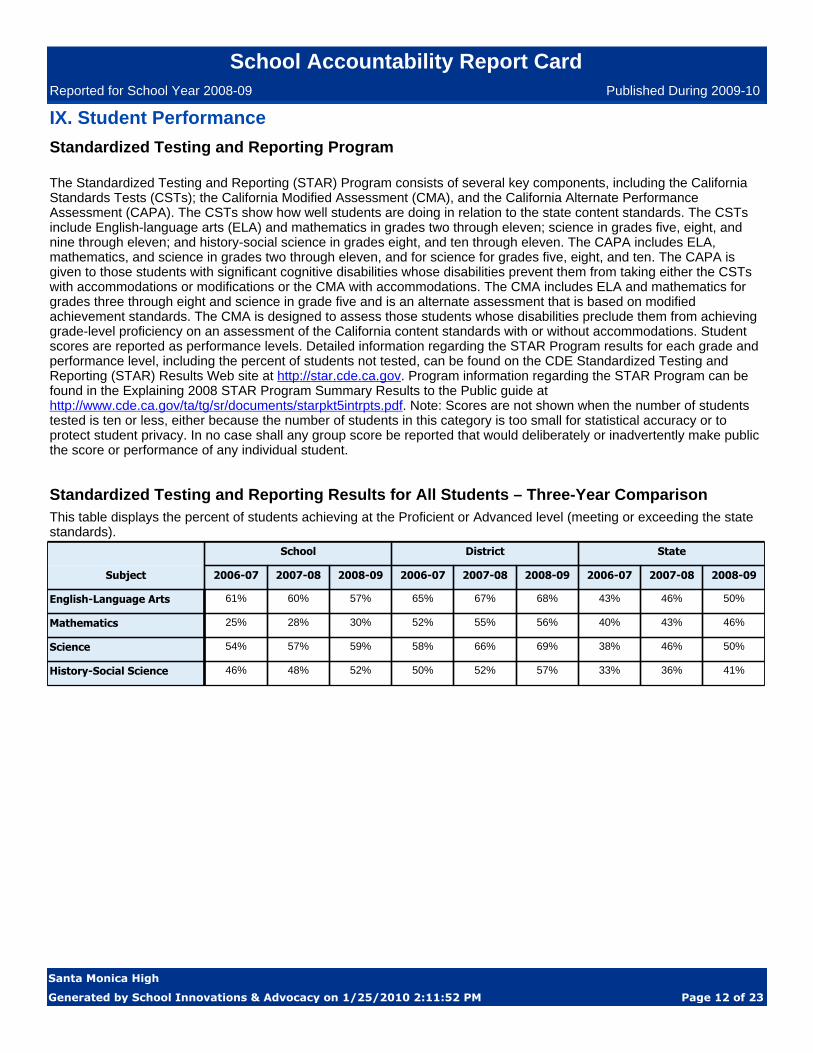
Standardized Testing and Reporting Program
The Standardized Testing and Reporting (STAR) Program consists of several key components, including the California Standards Tests (CSTs); the California Modified Assessment (CMA), and the California Alternate Performance Assessment (CAPA). The CSTs show how well students are doing in relation to the state content standards. The CSTs include English-language arts (ELA) and mathematics in grades two through eleven; science in grades five, eight, and nine through eleven; and history-social science in grades eight, and ten through eleven. The CAPA includes ELA, mathematics, and science in grades two through eleven, and for science for grades five, eight, and ten. The CAPA is given to those students with significant cognitive disabilities whose disabilities prevent them from taking either the CSTs with accommodations or modifications or the CMA with accommodations. The CMA includes ELA and mathematics for grades three through eight and science in grade five and is an alternate assessment that is based on modified achievement standards. The CMA is designed to assess those students whose disabilities preclude them from achieving grade-level proficiency on an assessment of the California content standards with or without accommodations. Student scores are reported as performance levels. Detailed information regarding the STAR Program results for each grade and performance level, including the percent of students not tested, can be found on the CDE Standardized Testing and Reporting (STAR) Results Web site at http://star.cde.ca.gov. Program information regarding the STAR Program can be found in the Explaining 2008 STAR Program Summary Results to the Public guide at http://www.cde.ca.gov/ta/tg/sr/documents/starpkt5intrpts.pdf. Note: Scores are not shown when the number of students tested is ten or less, either because the number of students in this category is too small for statistical accuracy or to protect student privacy. In no case shall any group score be reported that would deliberately or inadvertently make public the score or performance of any individual student.
This table displays the percent of students achieving at the Proficient or Advanced level (meeting or exceeding the state standards).
Standardized Testing and Reporting Results for All Students – Three-Year Comparison
IX. Student Performance
School District State
Subject 2006-07 2007-08 2008-09 2006-07 2007-08 2008-09 2006-07 2007-08 2008-09
English-Language Arts 61% 60% 57% 65% 67% 68% 43% 46% 50%
Mathematics 25% 28% 30% 52% 55% 56% 40% 43% 46%
Science 54% 57% 59% 58% 66% 69% 38% 46% 50%
History-Social Science 46% 48% 52% 50% 52% 57% 33% 36% 41%
Generated by School Innovations & Advocacy on 1/25/2010 2:11:52 PM Page 12 of 23
Santa Monica High
School Accountability Report CardPublished During 2009-10Reported for School Year 2008-09
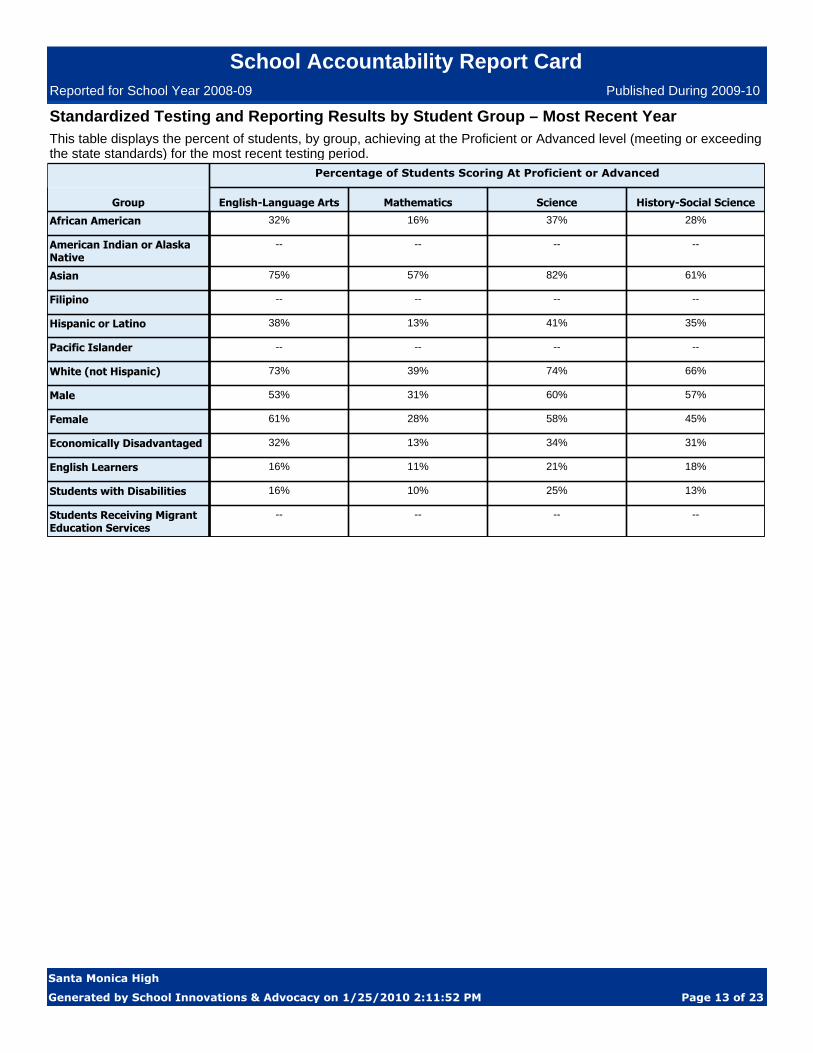
Standardized Testing and Reporting Results by Student Group – Most Recent YearThis table displays the percent of students, by group, achieving at the Proficient or Advanced level (meeting or exceeding the state standards) for the most recent testing period.
Percentage of Students Scoring At Proficient or Advanced
Group English-Language Arts Mathematics Science History-Social Science
African American 32% 16% 37% 28%
American Indian or Alaska Native
-- -- -- --
Asian 75% 57% 82% 61%
Filipino -- -- -- --
Hispanic or Latino 38% 13% 41% 35%
Pacific Islander -- -- -- --
White (not Hispanic) 73% 39% 74% 66%
Male 53% 31% 60% 57%
Female 61% 28% 58% 45%
Economically Disadvantaged 32% 13% 34% 31%
English Learners 16% 11% 21% 18%
Students with Disabilities 16% 10% 25% 13%
Students Receiving Migrant Education Services
-- -- -- --
Generated by School Innovations & Advocacy on 1/25/2010 2:11:52 PM Page 13 of 23
Santa Monica High
School Accountability Report CardPublished During 2009-10Reported for School Year 2008-09
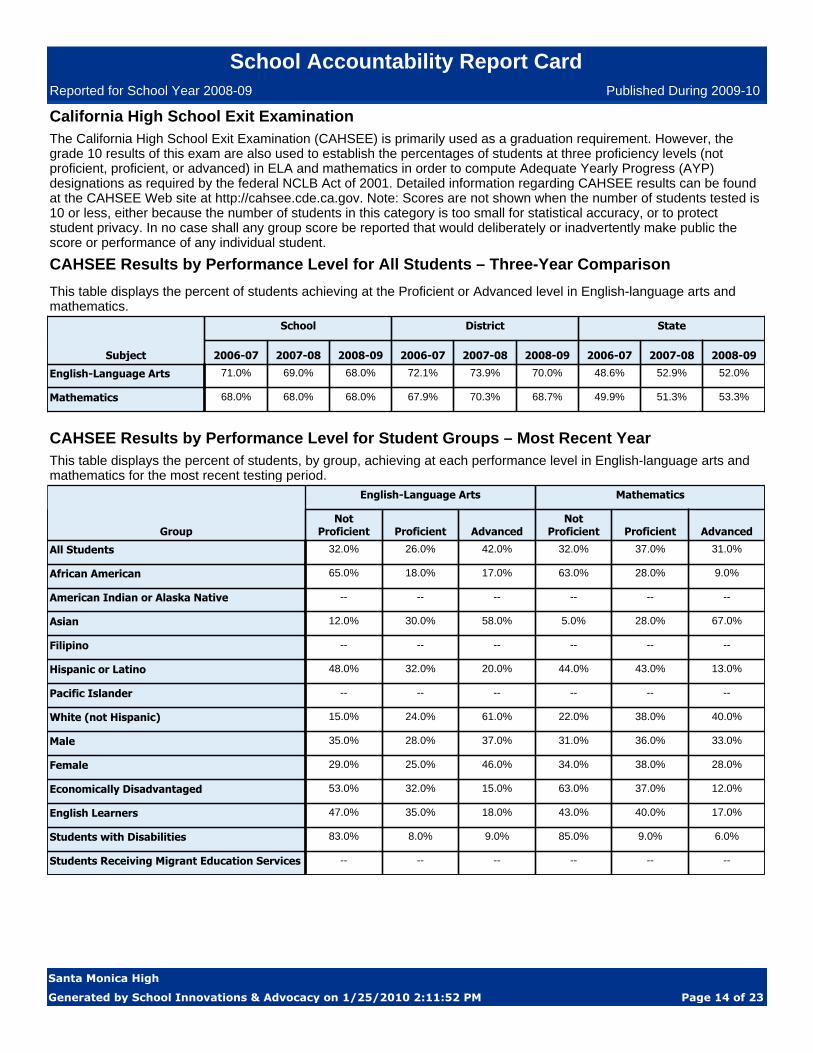
California High School Exit ExaminationThe California High School Exit Examination (CAHSEE) is primarily used as a graduation requirement. However, the grade 10 results of this exam are also used to establish the percentages of students at three proficiency levels (not proficient, proficient, or advanced) in ELA and mathematics in order to compute Adequate Yearly Progress (AYP) designations as required by the federal NCLB Act of 2001. Detailed information regarding CAHSEE results can be found at the CAHSEE Web site at http://cahsee.cde.ca.gov. Note: Scores are not shown when the number of students tested is 10 or less, either because the number of students in this category is too small for statistical accuracy, or to protect student privacy. In no case shall any group score be reported that would deliberately or inadvertently make public the score or performance of any individual student.
This table displays the percent of students achieving at the Proficient or Advanced level in English-language arts andmathematics.
CAHSEE Results by Performance Level for All Students – Three-Year Comparison
CAHSEE Results by Performance Level for Student Groups – Most Recent YearThis table displays the percent of students, by group, achieving at each performance level in English-language arts and mathematics for the most recent testing period.
School District State
Subject 2006-07 2007-08 2008-09 2006-07 2007-08 2008-09 2006-07 2007-08 2008-09
English-Language Arts 71.0% 69.0% 68.0% 72.1% 73.9% 70.0% 48.6% 52.9% 52.0%
Mathematics 68.0% 68.0% 68.0% 67.9% 70.3% 68.7% 49.9% 51.3% 53.3%
English-Language Arts Mathematics
GroupNot
Proficient Proficient AdvancedNot
Proficient Proficient Advanced
All Students 32.0% 26.0% 42.0% 32.0% 37.0% 31.0%
African American 65.0% 18.0% 17.0% 63.0% 28.0% 9.0%
American Indian or Alaska Native -- -- -- -- -- --
Asian 12.0% 30.0% 58.0% 5.0% 28.0% 67.0%
Filipino -- -- -- -- -- --
Hispanic or Latino 48.0% 32.0% 20.0% 44.0% 43.0% 13.0%
Pacific Islander -- -- -- -- -- --
White (not Hispanic) 15.0% 24.0% 61.0% 22.0% 38.0% 40.0%
Male 35.0% 28.0% 37.0% 31.0% 36.0% 33.0%
Female 29.0% 25.0% 46.0% 34.0% 38.0% 28.0%
Economically Disadvantaged 53.0% 32.0% 15.0% 63.0% 37.0% 12.0%
English Learners 47.0% 35.0% 18.0% 43.0% 40.0% 17.0%
Students with Disabilities 83.0% 8.0% 9.0% 85.0% 9.0% 6.0%
Students Receiving Migrant Education Services -- -- -- -- -- --
Generated by School Innovations & Advocacy on 1/25/2010 2:11:52 PM Page 14 of 23
Santa Monica High
School Accountability Report CardPublished During 2009-10Reported for School Year 2008-09
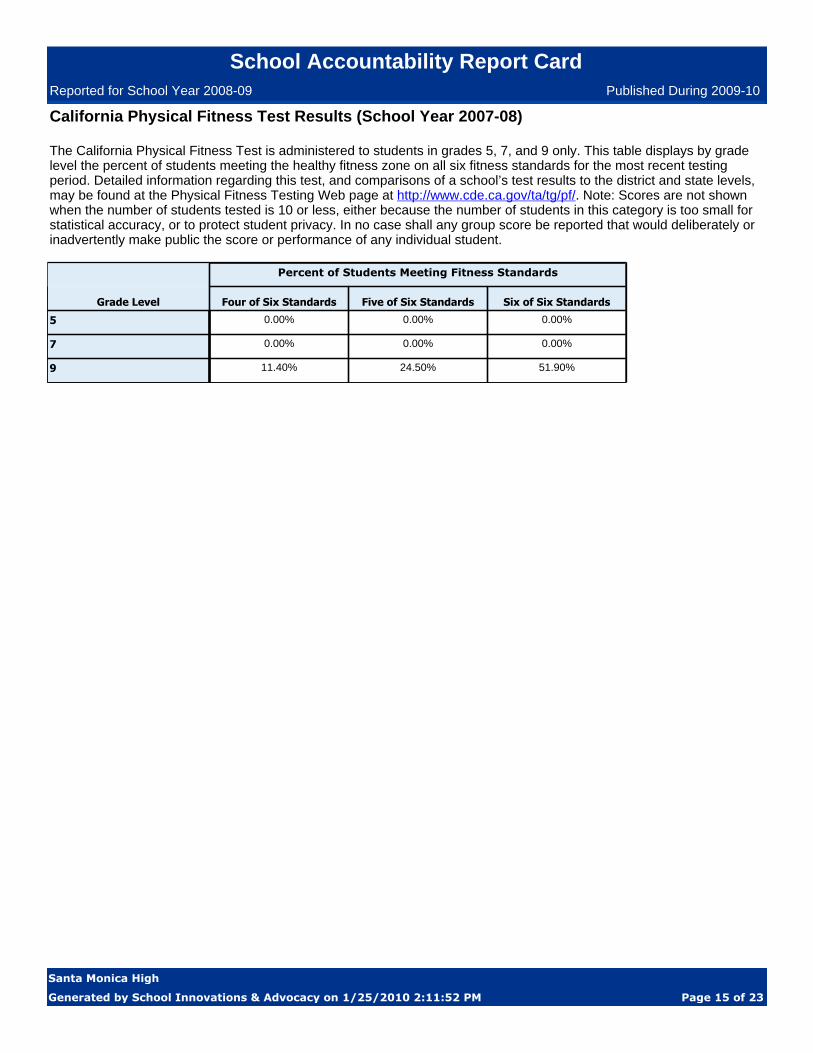
The California Physical Fitness Test is administered to students in grades 5, 7, and 9 only. This table displays by grade level the percent of students meeting the healthy fitness zone on all six fitness standards for the most recent testing period. Detailed information regarding this test, and comparisons of a school’s test results to the district and state levels, may be found at the Physical Fitness Testing Web page at http://www.cde.ca.gov/ta/tg/pf/. Note: Scores are not shown when the number of students tested is 10 or less, either because the number of students in this category is too small for statistical accuracy, or to protect student privacy. In no case shall any group score be reported that would deliberately or inadvertently make public the score or performance of any individual student.
California Physical Fitness Test Results (School Year 2007-08)
Percent of Students Meeting Fitness Standards
Grade Level Four of Six Standards Five of Six Standards Six of Six Standards
5 0.00% 0.00% 0.00%
7 0.00% 0.00% 0.00%
9 11.40% 24.50% 51.90%
Generated by School Innovations & Advocacy on 1/25/2010 2:11:52 PM Page 15 of 23
Santa Monica High
School Accountability Report CardPublished During 2009-10Reported for School Year 2008-09
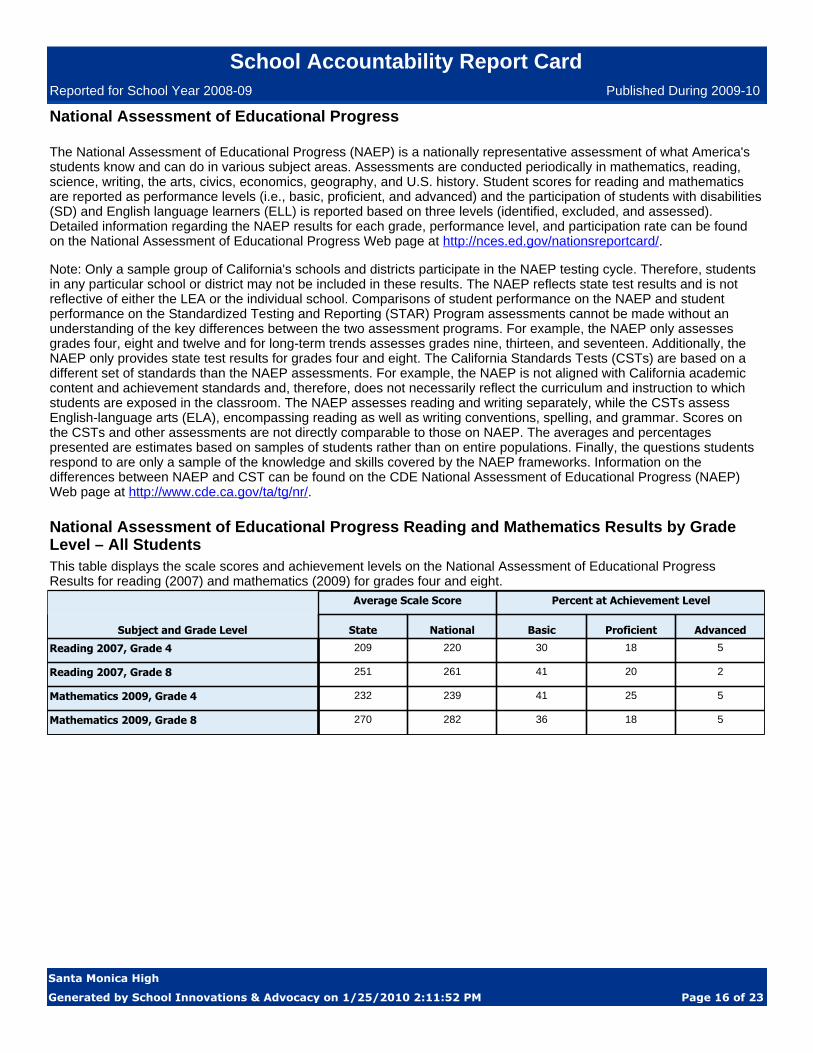
The National Assessment of Educational Progress (NAEP) is a nationally representative assessment of what America's students know and can do in various subject areas. Assessments are conducted periodically in mathematics, reading, science, writing, the arts, civics, economics, geography, and U.S. history. Student scores for reading and mathematics are reported as performance levels (i.e., basic, proficient, and advanced) and the participation of students with disabilities (SD) and English language learners (ELL) is reported based on three levels (identified, excluded, and assessed). Detailed information regarding the NAEP results for each grade, performance level, and participation rate can be found on the National Assessment of Educational Progress Web page at http://nces.ed.gov/nationsreportcard/.
Note: Only a sample group of California's schools and districts participate in the NAEP testing cycle. Therefore, students in any particular school or district may not be included in these results. The NAEP reflects state test results and is not reflective of either the LEA or the individual school. Comparisons of student performance on the NAEP and student performance on the Standardized Testing and Reporting (STAR) Program assessments cannot be made without an understanding of the key differences between the two assessment programs. For example, the NAEP only assesses grades four, eight and twelve and for long-term trends assesses grades nine, thirteen, and seventeen. Additionally, the NAEP only provides state test results for grades four and eight. The California Standards Tests (CSTs) are based on a different set of standards than the NAEP assessments. For example, the NAEP is not aligned with California academic content and achievement standards and, therefore, does not necessarily reflect the curriculum and instruction to which students are exposed in the classroom. The NAEP assesses reading and writing separately, while the CSTs assess English-language arts (ELA), encompassing reading as well as writing conventions, spelling, and grammar. Scores on the CSTs and other assessments are not directly comparable to those on NAEP. The averages and percentages presented are estimates based on samples of students rather than on entire populations. Finally, the questions students respond to are only a sample of the knowledge and skills covered by the NAEP frameworks. Information on the differences between NAEP and CST can be found on the CDE National Assessment of Educational Progress (NAEP) Web page at http://www.cde.ca.gov/ta/tg/nr/.
National Assessment of Educational Progress
National Assessment of Educational Progress Reading and Mathematics Results by Grade Level – All StudentsThis table displays the scale scores and achievement levels on the National Assessment of Educational Progress Results for reading (2007) and mathematics (2009) for grades four and eight.
Average Scale Score Percent at Achievement Level
Subject and Grade Level State National Basic Proficient Advanced
Reading 2007, Grade 4 209 220 30 18 5
Reading 2007, Grade 8 251 261 41 20 2
Mathematics 2009, Grade 4 232 239 41 25 5
Mathematics 2009, Grade 8 270 282 36 18 5
Generated by School Innovations & Advocacy on 1/25/2010 2:11:52 PM Page 16 of 23
Santa Monica High
School Accountability Report CardPublished During 2009-10Reported for School Year 2008-09
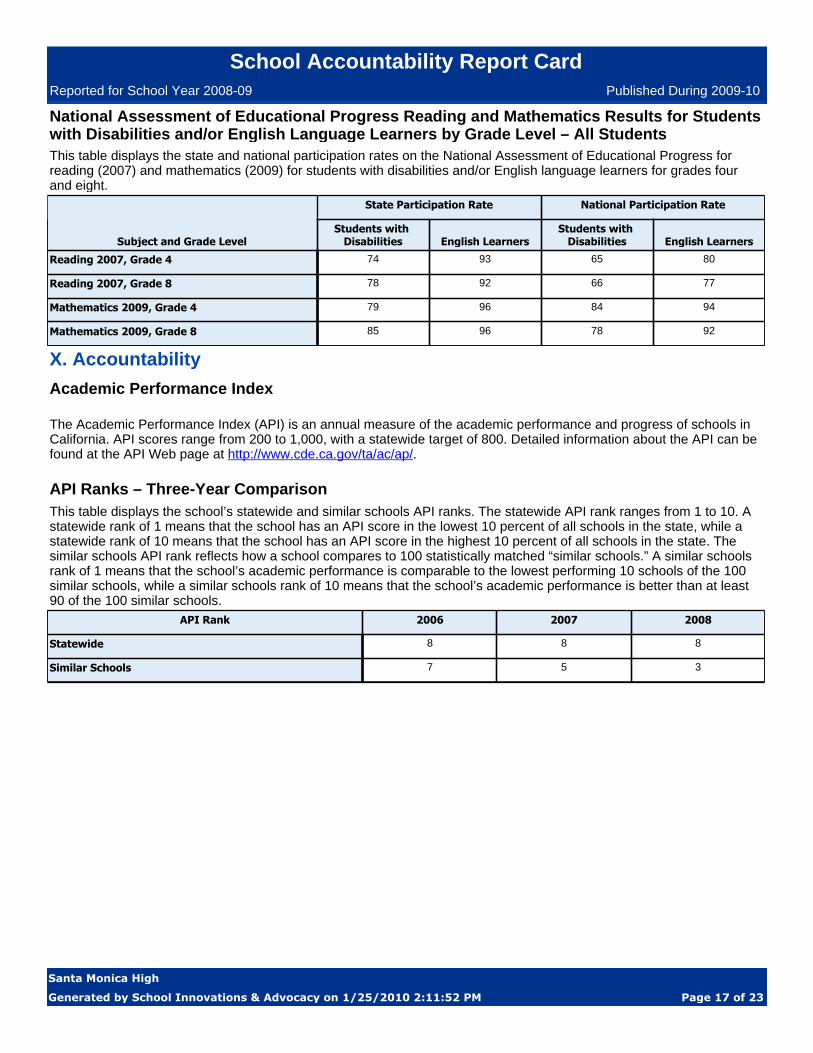
Academic Performance Index
The Academic Performance Index (API) is an annual measure of the academic performance and progress of schools in California. API scores range from 200 to 1,000, with a statewide target of 800. Detailed information about the API can be found at the API Web page at http://www.cde.ca.gov/ta/ac/ap/.
X. Accountability
API Ranks – Three-Year ComparisonThis table displays the school’s statewide and similar schools API ranks. The statewide API rank ranges from 1 to 10. A statewide rank of 1 means that the school has an API score in the lowest 10 percent of all schools in the state, while a statewide rank of 10 means that the school has an API score in the highest 10 percent of all schools in the state. The similar schools API rank reflects how a school compares to 100 statistically matched “similar schools.” A similar schools rank of 1 means that the school’s academic performance is comparable to the lowest performing 10 schools of the 100 similar schools, while a similar schools rank of 10 means that the school’s academic performance is better than at least 90 of the 100 similar schools.
API Rank 2006 2007 2008
Statewide 8 8 8
Similar Schools 7 5 3
This table displays the state and national participation rates on the National Assessment of Educational Progress for reading (2007) and mathematics (2009) for students with disabilities and/or English language learners for grades four and eight.
National Assessment of Educational Progress Reading and Mathematics Results for Students with Disabilities and/or English Language Learners by Grade Level – All Students
State Participation Rate National Participation Rate
Subject and Grade LevelStudents with
Disabilities English LearnersStudents with
Disabilities English Learners
Reading 2007, Grade 4 74 93 65 80
Reading 2007, Grade 8 78 92 66 77
Mathematics 2009, Grade 4 79 96 84 94
Mathematics 2009, Grade 8 85 96 78 92
Generated by School Innovations & Advocacy on 1/25/2010 2:11:52 PM Page 17 of 23
Santa Monica High
School Accountability Report CardPublished During 2009-10Reported for School Year 2008-09
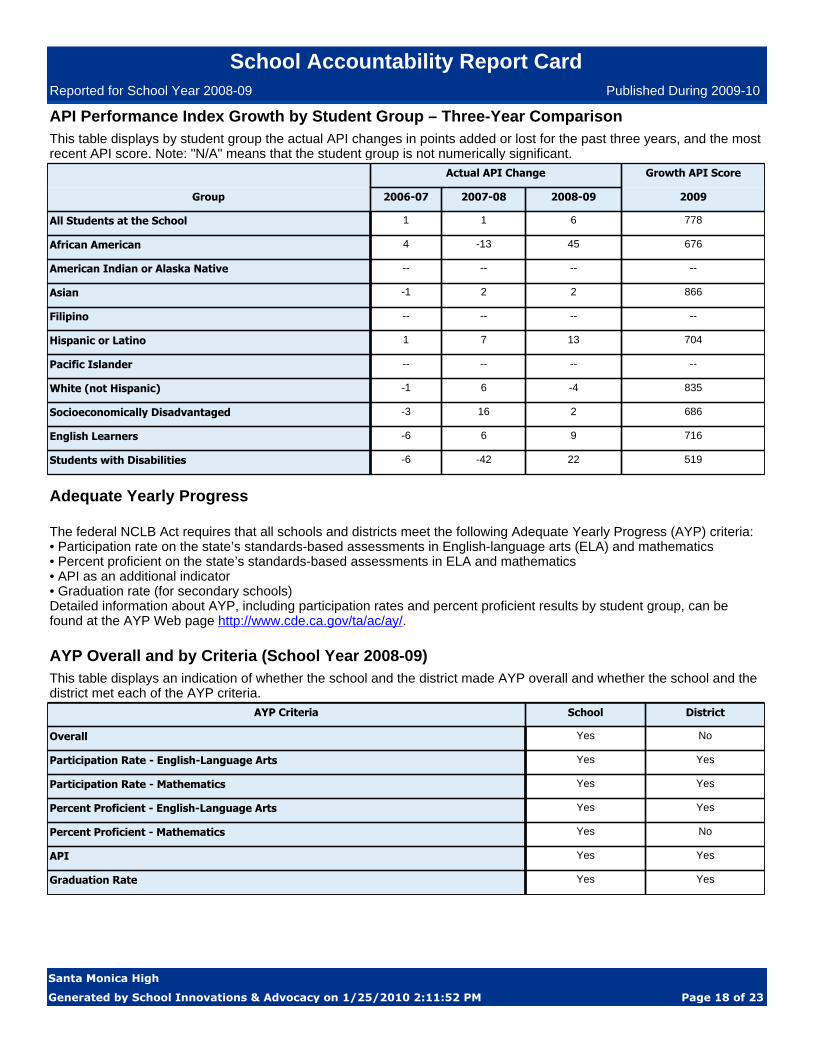
API Performance Index Growth by Student Group – Three-Year ComparisonThis table displays by student group the actual API changes in points added or lost for the past three years, and the most recent API score. Note: "N/A" means that the student group is not numerically significant.
Actual API Change Growth API Score
Group 2006-07 2007-08 2008-09 2009
All Students at the School 1 1 6 778
African American 4 -13 45 676
American Indian or Alaska Native -- -- -- --
Asian -1 2 2 866
Filipino -- -- -- --
Hispanic or Latino 1 7 13 704
Pacific Islander -- -- -- --
White (not Hispanic) -1 6 -4 835
Socioeconomically Disadvantaged -3 16 2 686
English Learners -6 6 9 716
Students with Disabilities -6 -42 22 519
The federal NCLB Act requires that all schools and districts meet the following Adequate Yearly Progress (AYP) criteria:• Participation rate on the state’s standards-based assessments in English-language arts (ELA) and mathematics• Percent proficient on the state’s standards-based assessments in ELA and mathematics• API as an additional indicator• Graduation rate (for secondary schools)Detailed information about AYP, including participation rates and percent proficient results by student group, can be found at the AYP Web page http://www.cde.ca.gov/ta/ac/ay/.
Adequate Yearly Progress
This table displays an indication of whether the school and the district made AYP overall and whether the school and the district met each of the AYP criteria.
AYP Overall and by Criteria (School Year 2008-09)
AYP Criteria School District
Overall Yes No
Participation Rate - English-Language Arts Yes Yes
Participation Rate - Mathematics Yes Yes
Percent Proficient - English-Language Arts Yes Yes
Percent Proficient - Mathematics Yes No
API Yes Yes
Graduation Rate Yes Yes
Generated by School Innovations & Advocacy on 1/25/2010 2:11:52 PM Page 18 of 23
Santa Monica High
School Accountability Report CardPublished During 2009-10Reported for School Year 2008-09
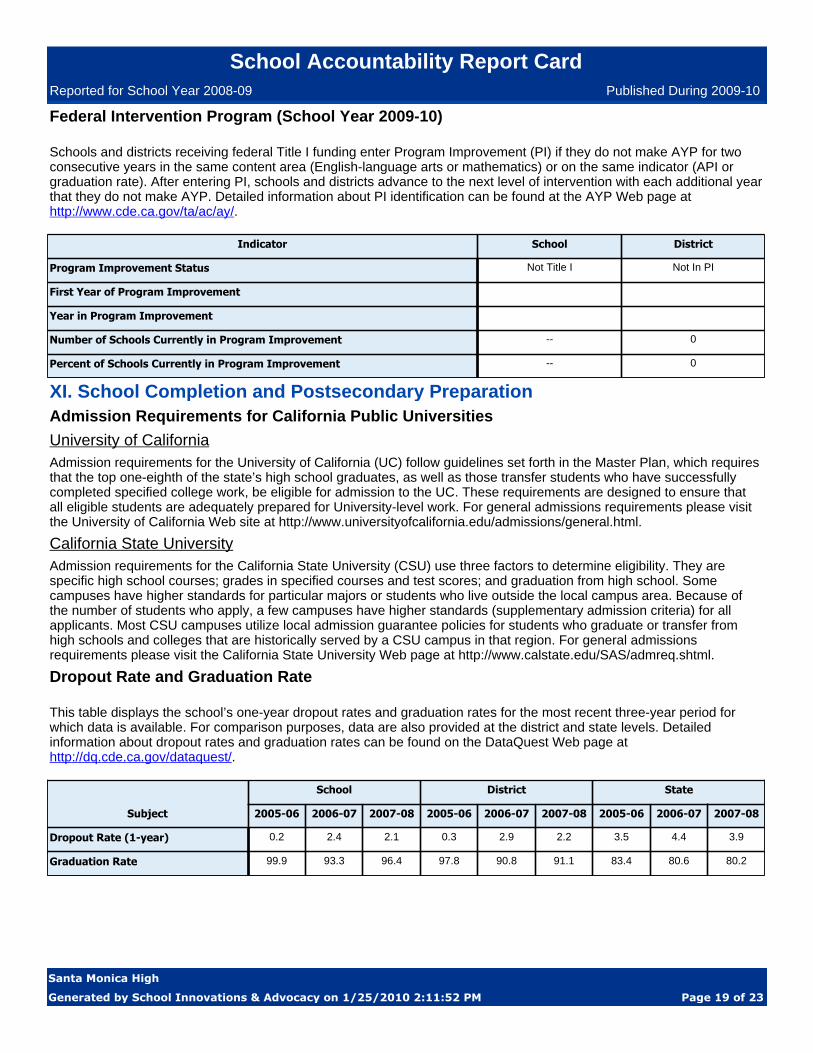
This table displays the school’s one-year dropout rates and graduation rates for the most recent three-year period for which data is available. For comparison purposes, data are also provided at the district and state levels. Detailed information about dropout rates and graduation rates can be found on the DataQuest Web page at http://dq.cde.ca.gov/dataquest/.
Dropout Rate and Graduation Rate
School District State
Subject 2005-06 2006-07 2007-08 2005-06 2006-07 2007-08 2005-06 2006-07 2007-08
Dropout Rate (1-year) 0.2 2.4 2.1 0.3 2.9 2.2 3.5 4.4 3.9
Graduation Rate 99.9 93.3 96.4 97.8 90.8 91.1 83.4 80.6 80.2
Admission Requirements for California Public Universities
University of CaliforniaAdmission requirements for the University of California (UC) follow guidelines set forth in the Master Plan, which requires that the top one-eighth of the state’s high school graduates, as well as those transfer students who have successfully completed specified college work, be eligible for admission to the UC. These requirements are designed to ensure that all eligible students are adequately prepared for University-level work. For general admissions requirements please visit the University of California Web site at http://www.universityofcalifornia.edu/admissions/general.html.
California State UniversityAdmission requirements for the California State University (CSU) use three factors to determine eligibility. They are specific high school courses; grades in specified courses and test scores; and graduation from high school. Some campuses have higher standards for particular majors or students who live outside the local campus area. Because of the number of students who apply, a few campuses have higher standards (supplementary admission criteria) for all applicants. Most CSU campuses utilize local admission guarantee policies for students who graduate or transfer from high schools and colleges that are historically served by a CSU campus in that region. For general admissions requirements please visit the California State University Web page at http://www.calstate.edu/SAS/admreq.shtml.
XI. School Completion and Postsecondary Preparation
Schools and districts receiving federal Title I funding enter Program Improvement (PI) if they do not make AYP for two consecutive years in the same content area (English-language arts or mathematics) or on the same indicator (API or graduation rate). After entering PI, schools and districts advance to the next level of intervention with each additional year that they do not make AYP. Detailed information about PI identification can be found at the AYP Web page at http://www.cde.ca.gov/ta/ac/ay/.
Federal Intervention Program (School Year 2009-10)
Indicator School District
Program Improvement Status Not Title I Not In PI
First Year of Program Improvement
Year in Program Improvement
Number of Schools Currently in Program Improvement -- 0
Percent of Schools Currently in Program Improvement -- 0
Generated by School Innovations & Advocacy on 1/25/2010 2:11:52 PM Page 19 of 23
Santa Monica High
School Accountability Report CardPublished During 2009-10Reported for School Year 2008-09
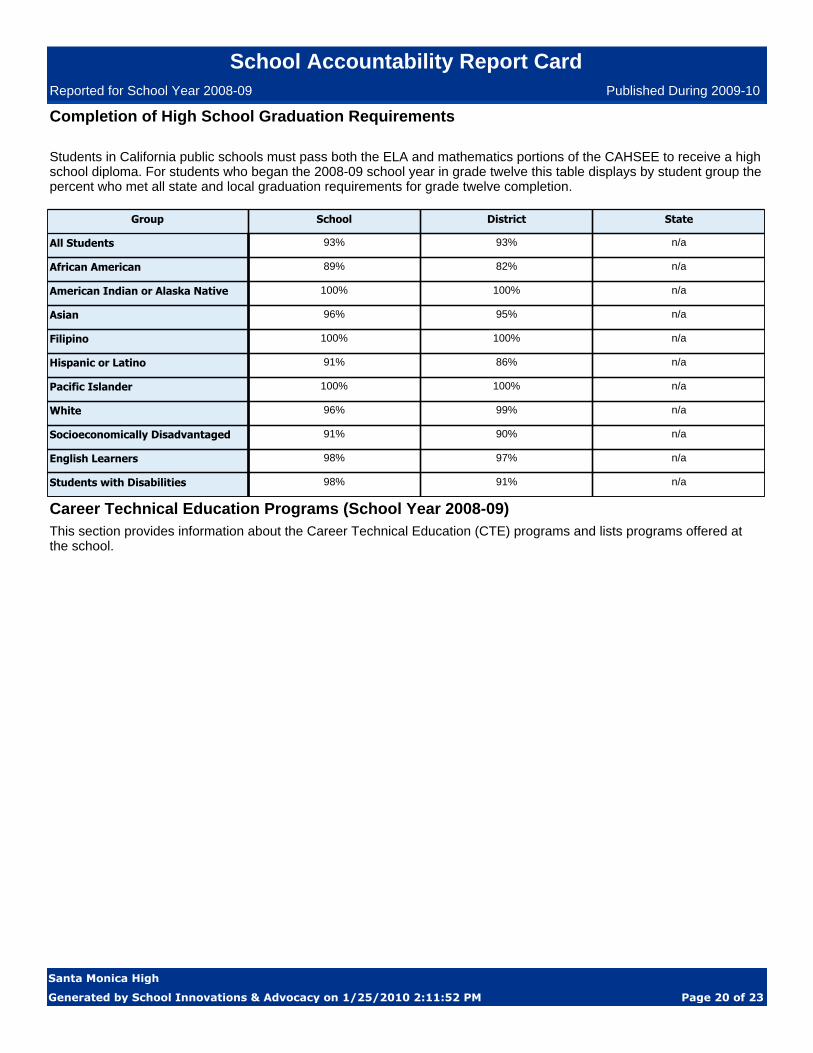
Students in California public schools must pass both the ELA and mathematics portions of the CAHSEE to receive a high school diploma. For students who began the 2008-09 school year in grade twelve this table displays by student group the percent who met all state and local graduation requirements for grade twelve completion.
Completion of High School Graduation Requirements
Group School District State
All Students 93% 93% n/a
African American 89% 82% n/a
American Indian or Alaska Native 100% 100% n/a
Asian 96% 95% n/a
Filipino 100% 100% n/a
Hispanic or Latino 91% 86% n/a
Pacific Islander 100% 100% n/a
White 96% 99% n/a
Socioeconomically Disadvantaged 91% 90% n/a
English Learners 98% 97% n/a
Students with Disabilities 98% 91% n/a
Career Technical Education Programs (School Year 2008-09)This section provides information about the Career Technical Education (CTE) programs and lists programs offered atthe school.
Generated by School Innovations & Advocacy on 1/25/2010 2:11:52 PM Page 20 of 23
Santa Monica High
School Accountability Report CardPublished During 2009-10Reported for School Year 2008-09
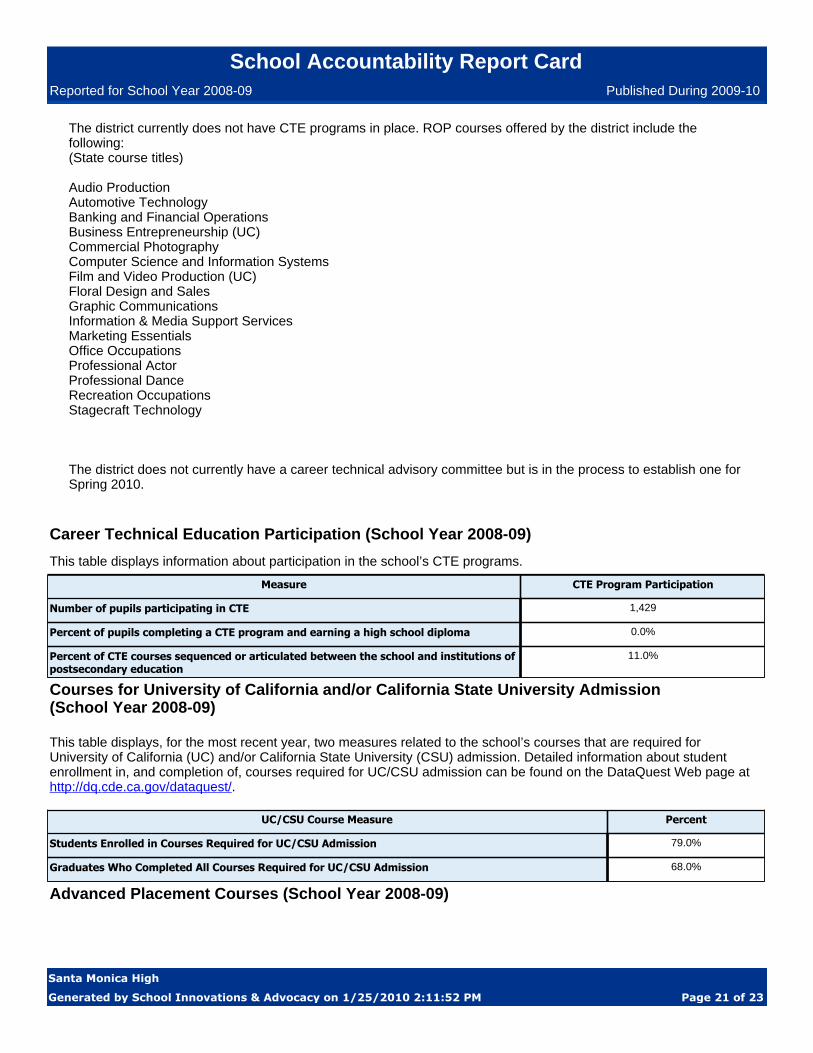
This table displays, for the most recent year, two measures related to the school’s courses that are required for University of California (UC) and/or California State University (CSU) admission. Detailed information about student enrollment in, and completion of, courses required for UC/CSU admission can be found on the DataQuest Web page at http://dq.cde.ca.gov/dataquest/.
Courses for University of California and/or California State University Admission(School Year 2008-09)
UC/CSU Course Measure Percent
Students Enrolled in Courses Required for UC/CSU Admission 79.0%
Graduates Who Completed All Courses Required for UC/CSU Admission 68.0%
This table displays information about participation in the school’s CTE programs.
Career Technical Education Participation (School Year 2008-09)
Measure CTE Program Participation
Number of pupils participating in CTE 1,429
Percent of pupils completing a CTE program and earning a high school diploma 0.0%
Percent of CTE courses sequenced or articulated between the school and institutions of postsecondary education
11.0%
Advanced Placement Courses (School Year 2008-09)
The district currently does not have CTE programs in place. ROP courses offered by the district include the following:(State course titles)
Audio ProductionAutomotive TechnologyBanking and Financial OperationsBusiness Entrepreneurship (UC)Commercial PhotographyComputer Science and Information SystemsFilm and Video Production (UC)Floral Design and SalesGraphic CommunicationsInformation & Media Support ServicesMarketing EssentialsOffice OccupationsProfessional ActorProfessional DanceRecreation OccupationsStagecraft Technology
The district does not currently have a career technical advisory committee but is in the process to establish one for Spring 2010.
Generated by School Innovations & Advocacy on 1/25/2010 2:11:52 PM Page 21 of 23
Santa Monica High
School Accountability Report CardPublished During 2009-10Reported for School Year 2008-09
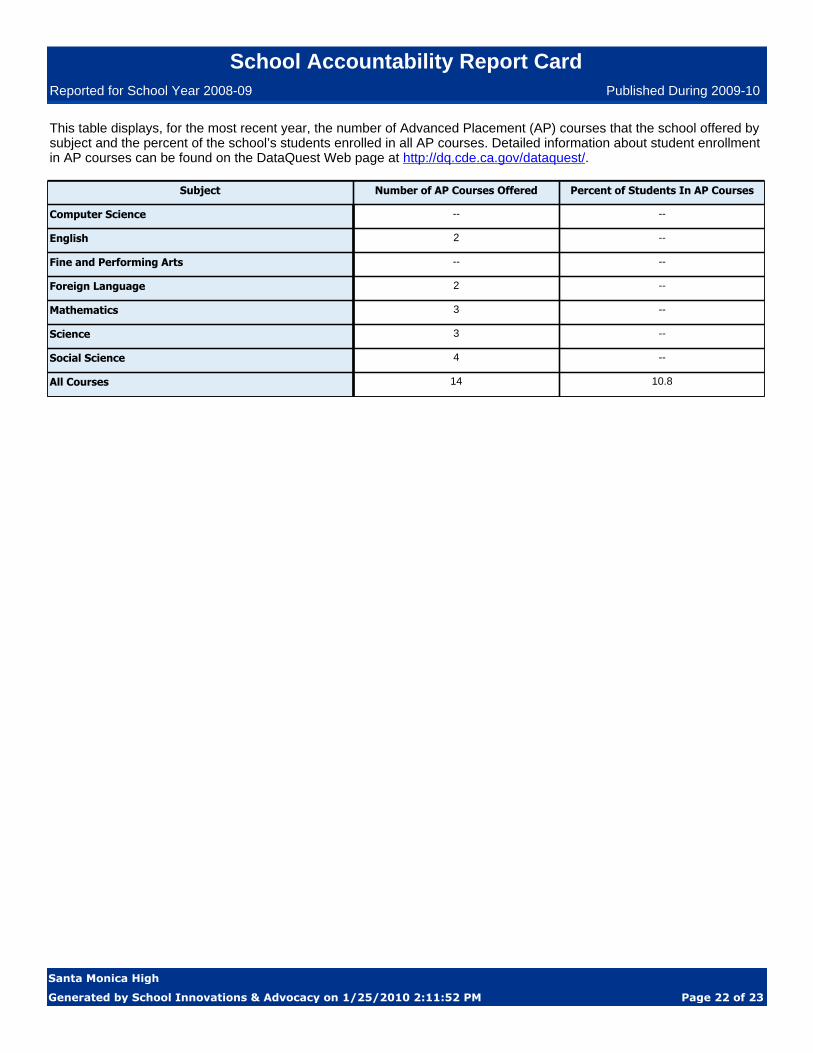
This table displays, for the most recent year, the number of Advanced Placement (AP) courses that the school offered by subject and the percent of the school’s students enrolled in all AP courses. Detailed information about student enrollment in AP courses can be found on the DataQuest Web page at http://dq.cde.ca.gov/dataquest/.
Subject Number of AP Courses Offered Percent of Students In AP Courses
Computer Science -- --
English 2 --
Fine and Performing Arts -- --
Foreign Language 2 --
Mathematics 3 --
Science 3 --
Social Science 4 --
All Courses 14 10.8
Generated by School Innovations & Advocacy on 1/25/2010 2:11:52 PM Page 22 of 23
Santa Monica High
School Accountability Report CardPublished During 2009-10Reported for School Year 2008-09
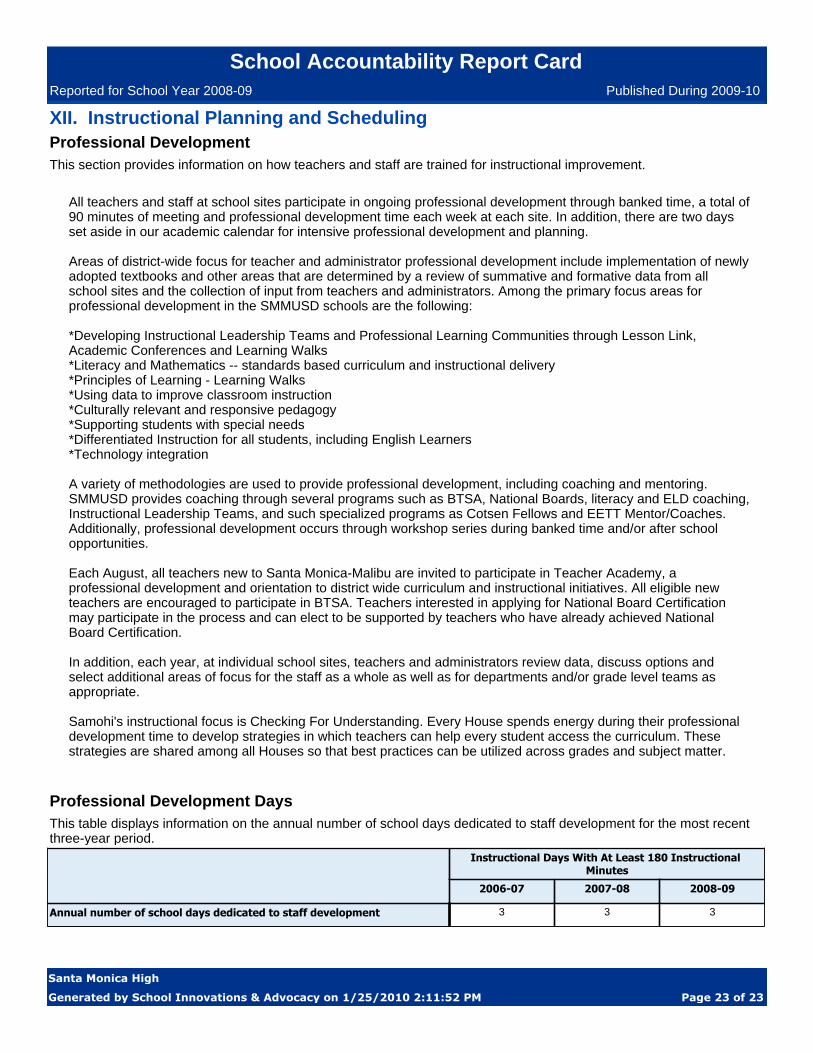
All teachers and staff at school sites participate in ongoing professional development through banked time, a total of 90 minutes of meeting and professional development time each week at each site. In addition, there are two days set aside in our academic calendar for intensive professional development and planning.
Areas of district-wide focus for teacher and administrator professional development include implementation of newly adopted textbooks and other areas that are determined by a review of summative and formative data from allschool sites and the collection of input from teachers and administrators. Among the primary focus areas for professional development in the SMMUSD schools are the following:
*Developing Instructional Leadership Teams and Professional Learning Communities through Lesson Link, Academic Conferences and Learning Walks*Literacy and Mathematics -- standards based curriculum and instructional delivery*Principles of Learning - Learning Walks*Using data to improve classroom instruction*Culturally relevant and responsive pedagogy*Supporting students with special needs*Differentiated Instruction for all students, including English Learners*Technology integration
A variety of methodologies are used to provide professional development, including coaching and mentoring. SMMUSD provides coaching through several programs such as BTSA, National Boards, literacy and ELD coaching, Instructional Leadership Teams, and such specialized programs as Cotsen Fellows and EETT Mentor/Coaches. Additionally, professional development occurs through workshop series during banked time and/or after school opportunities.
Each August, all teachers new to Santa Monica-Malibu are invited to participate in Teacher Academy, a professional development and orientation to district wide curriculum and instructional initiatives. All eligible new teachers are encouraged to participate in BTSA. Teachers interested in applying for National Board Certification may participate in the process and can elect to be supported by teachers who have already achieved National Board Certification.
In addition, each year, at individual school sites, teachers and administrators review data, discuss options and select additional areas of focus for the staff as a whole as well as for departments and/or grade level teams as appropriate.
Samohi's instructional focus is Checking For Understanding. Every House spends energy during their professional development time to develop strategies in which teachers can help every student access the curriculum. These strategies are shared among all Houses so that best practices can be utilized across grades and subject matter.
Professional DevelopmentThis section provides information on how teachers and staff are trained for instructional improvement.
XII. Instructional Planning and Scheduling
This table displays information on the annual number of school days dedicated to staff development for the most recent three-year period.
Professional Development Days
Instructional Days With At Least 180 Instructional Minutes
2006-07 2007-08 2008-09
Annual number of school days dedicated to staff development 3 3 3
Generated by School Innovations & Advocacy on 1/25/2010 2:11:52 PM Page 23 of 23
Santa Monica High
School Accountability Report CardPublished During 2009-10Reported for School Year 2008-09