Embed Size (px)
Citation preview
Contact: Email: [email protected] Press office: 020 7783 8300 Public enquiries: 0370 000 2288
Schools, pupils and their characteristics:
January 2016
SFR 20/2016, 28 June 2016
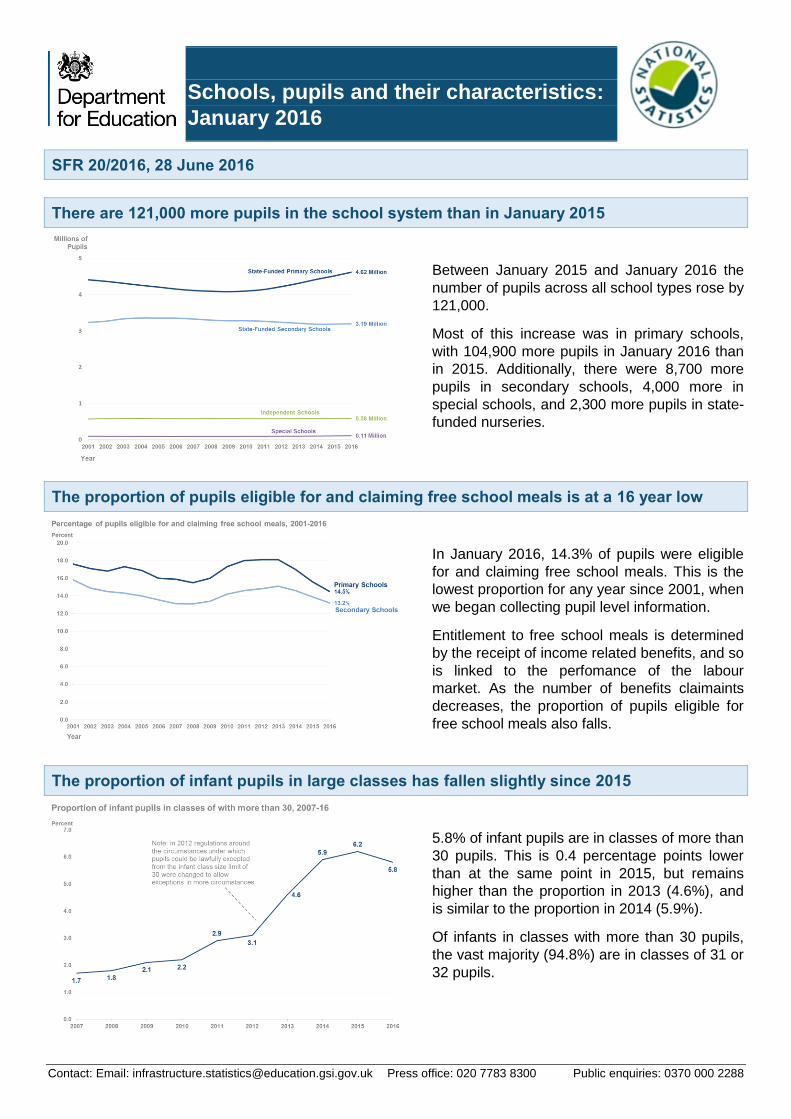
There are 121,000 more pupils in the school system than in January 2015
Between January 2015 and January 2016 the
number of pupils across all school types rose by
121,000.
Most of this increase was in primary schools,
with 104,900 more pupils in January 2016 than
in 2015. Additionally, there were 8,700 more
pupils in secondary schools, 4,000 more in
special schools, and 2,300 more pupils in state-
funded nurseries.
The proportion of pupils eligible for and claiming free school meals is at a 16 year low
In January 2016, 14.3% of pupils were eligible
for and claiming free school meals. This is the
lowest proportion for any year since 2001, when
we began collecting pupil level information.
Entitlement to free school meals is determined
by the receipt of income related benefits, and so
is linked to the perfomance of the labour
market. As the number of benefits claimaints
decreases, the proportion of pupils eligible for
free school meals also falls.
The proportion of infant pupils in large classes has fallen slightly since 2015
5.8% of infant pupils are in classes of more than
30 pupils. This is 0.4 percentage points lower
than at the same point in 2015, but remains
higher than the proportion in 2013 (4.6%), and
is similar to the proportion in 2014 (5.9%).
Of infants in classes with more than 30 pupils,
the vast majority (94.8%) are in classes of 31 or
32 pupils.
Contact: Email: [email protected] Press office: 020 7783 8300 Public enquiries: 0370 000 2288
Contents
Pupil Numbers (Tables 1a-e) ......................................................................... 3 1.
School Numbers (Tables 2a-2f) ..................................................................... 3 2.
Free School Meals Eligibility (Table 3) ........................................................... 6 3.
Ethnic Group (Table 4) .................................................................................. 8 4.
First Language (Table 5).............................................................................. 10 5.
Class Sizes (Table 6) ................................................................................... 11 6.
Special Educational Needs (SEN) (table S1-S4) .......................................... 13 7.
Accompanying tables ................................................................................... 15 8.
Further information is available .................................................................... 17 9.
National Statistics ........................................................................................ 19 10.
Technical information ................................................................................... 19 11.
Using this data ............................................................................................. 19 12.
Get in touch ................................................................................................. 19 13.
Media enquiries ............................................................................................................... 19
Other enquiries/feedback ................................................................................................ 19
About this release
This statistical first release (SFR) provides the number of schools and pupils in schools in England, using data from the January 2016 School Census.
Breakdowns are given for school types as well as for pupil characteristics including free school meal eligibility, English as an additional language, ethnicity and special educational need (SEN).
This release also contains information about average class sizes.
In this publication
The following tables are included in the SFR:
National tables (Excel .xls)
Local authority tables (Excel .xls)
Cross border movement tables
Underlying data (open format .csv and metadata .txt)
The accompanying quality and methodology information document, provides information on the data sources, their coverage and quality and explains the methodology used in producing the data.
Feedback
We are changing how our releases look and welcome feedback on any aspect of this document at [email protected].
3
Pupil Numbers (Tables 1a-e) 1.
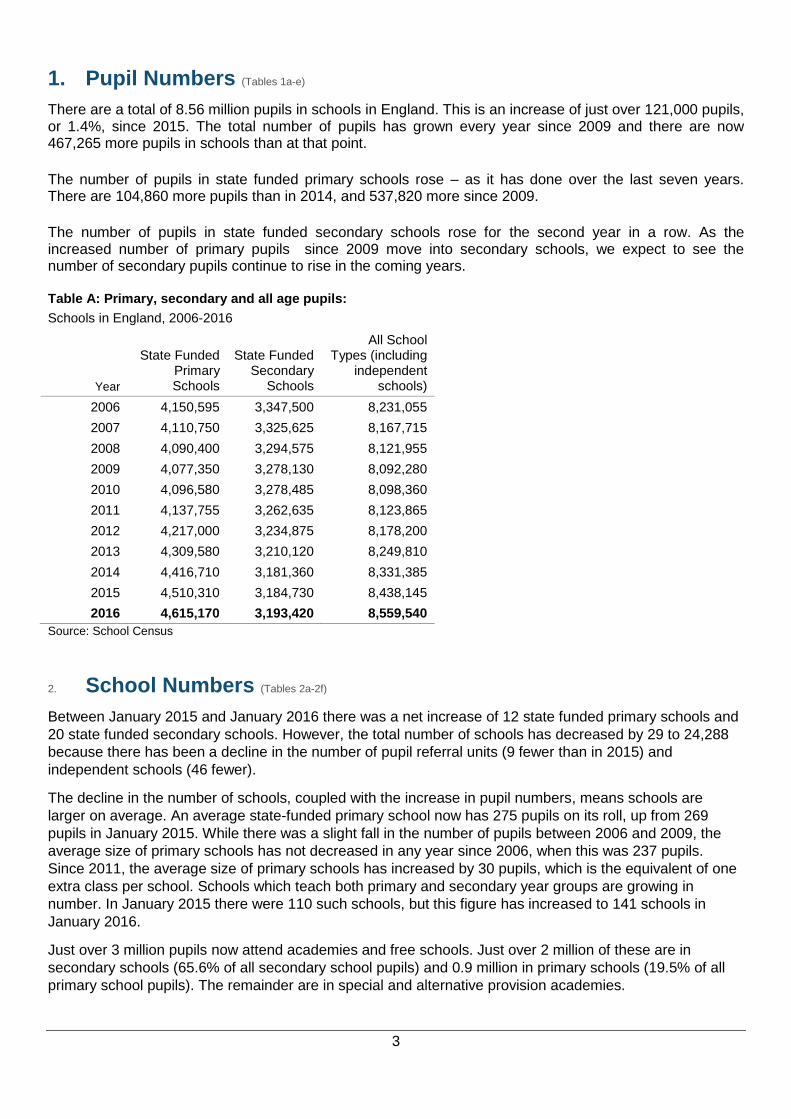
There are a total of 8.56 million pupils in schools in England. This is an increase of just over 121,000 pupils, or 1.4%, since 2015. The total number of pupils has grown every year since 2009 and there are now 467,265 more pupils in schools than at that point.
The number of pupils in state funded primary schools rose – as it has done over the last seven years. There are 104,860 more pupils than in 2014, and 537,820 more since 2009.
The number of pupils in state funded secondary schools rose for the second year in a row. As the increased number of primary pupils since 2009 move into secondary schools, we expect to see the number of secondary pupils continue to rise in the coming years. Table A: Primary, secondary and all age pupils:
Schools in England, 2006-2016
Year
State Funded Primary Schools
State Funded Secondary
Schools
All School Types (including
independent schools)
2006 4,150,595 3,347,500 8,231,055
2007 4,110,750 3,325,625 8,167,715
2008 4,090,400 3,294,575 8,121,955
2009 4,077,350 3,278,130 8,092,280
2010 4,096,580 3,278,485 8,098,360
2011 4,137,755 3,262,635 8,123,865
2012 4,217,000 3,234,875 8,178,200
2013 4,309,580 3,210,120 8,249,810
2014 4,416,710 3,181,360 8,331,385
2015 4,510,310 3,184,730 8,438,145
2016 4,615,170 3,193,420 8,559,540
Source: School Census
School Numbers (Tables 2a-2f) 2.
Between January 2015 and January 2016 there was a net increase of 12 state funded primary schools and
20 state funded secondary schools. However, the total number of schools has decreased by 29 to 24,288
because there has been a decline in the number of pupil referral units (9 fewer than in 2015) and
independent schools (46 fewer).
The decline in the number of schools, coupled with the increase in pupil numbers, means schools are
larger on average. An average state-funded primary school now has 275 pupils on its roll, up from 269
pupils in January 2015. While there was a slight fall in the number of pupils between 2006 and 2009, the
average size of primary schools has not decreased in any year since 2006, when this was 237 pupils.
Since 2011, the average size of primary schools has increased by 30 pupils, which is the equivalent of one
extra class per school. Schools which teach both primary and secondary year groups are growing in
number. In January 2015 there were 110 such schools, but this figure has increased to 141 schools in
January 2016.
Just over 3 million pupils now attend academies and free schools. Just over 2 million of these are in
secondary schools (65.6% of all secondary school pupils) and 0.9 million in primary schools (19.5% of all
primary school pupils). The remainder are in special and alternative provision academies.
4
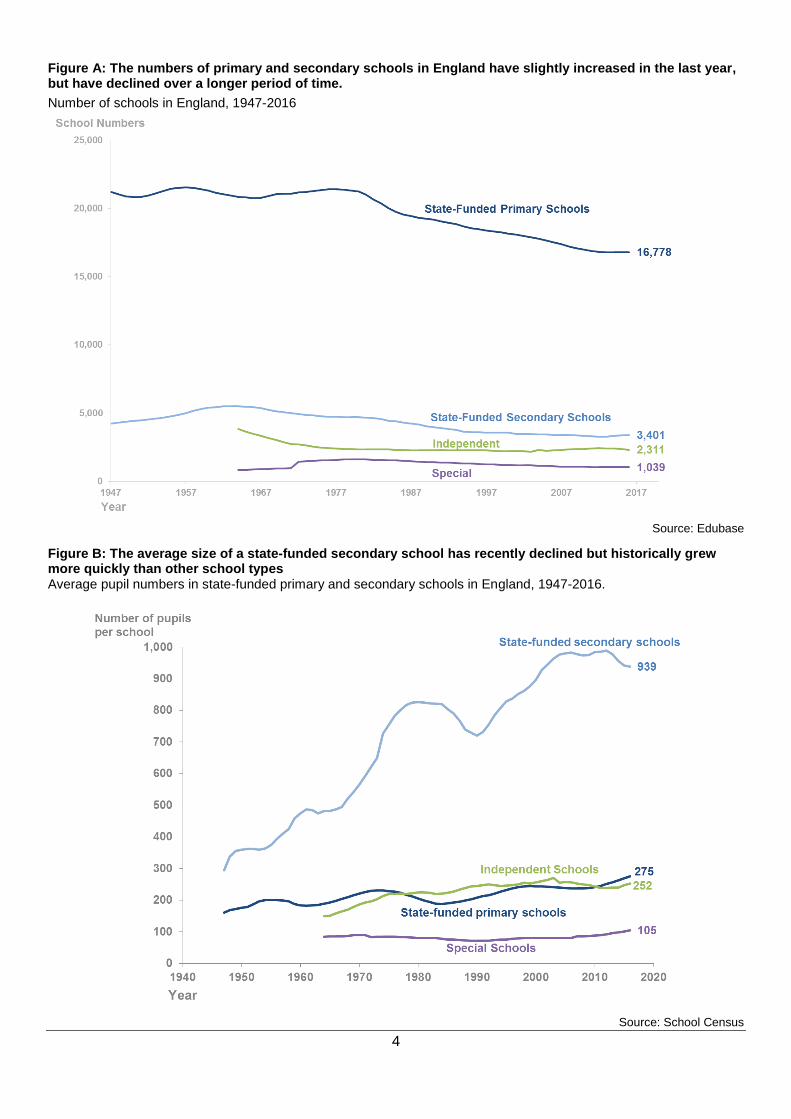
Figure A: The numbers of primary and secondary schools in England have slightly increased in the last year, but have declined over a longer period of time.
Number of schools in England, 1947-2016
Source: Edubase
Figure B: The average size of a state-funded secondary school has recently declined but historically grew more quickly than other school types Average pupil numbers in state-funded primary and secondary schools in England, 1947-2016.
Source: School Census
5
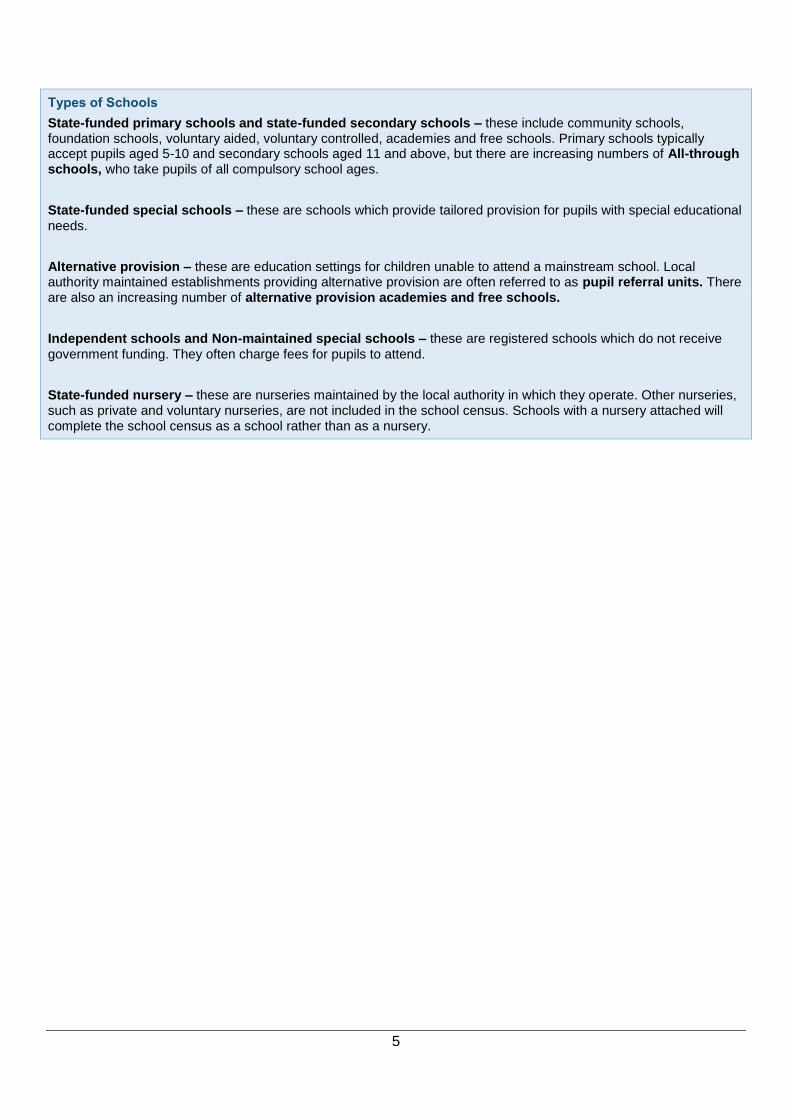
Types of Schools
State-funded primary schools and state-funded secondary schools – these include community schools, foundation schools, voluntary aided, voluntary controlled, academies and free schools. Primary schools typically accept pupils aged 5-10 and secondary schools aged 11 and above, but there are increasing numbers of All-through schools, who take pupils of all compulsory school ages.
State-funded special schools – these are schools which provide tailored provision for pupils with special educational
needs.
Alternative provision – these are education settings for children unable to attend a mainstream school. Local authority maintained establishments providing alternative provision are often referred to as pupil referral units. There are also an increasing number of alternative provision academies and free schools.
Independent schools and Non-maintained special schools – these are registered schools which do not receive
government funding. They often charge fees for pupils to attend.
State-funded nursery – these are nurseries maintained by the local authority in which they operate. Other nurseries, such as private and voluntary nurseries, are not included in the school census. Schools with a nursery attached will complete the school census as a school rather than as a nursery.
6
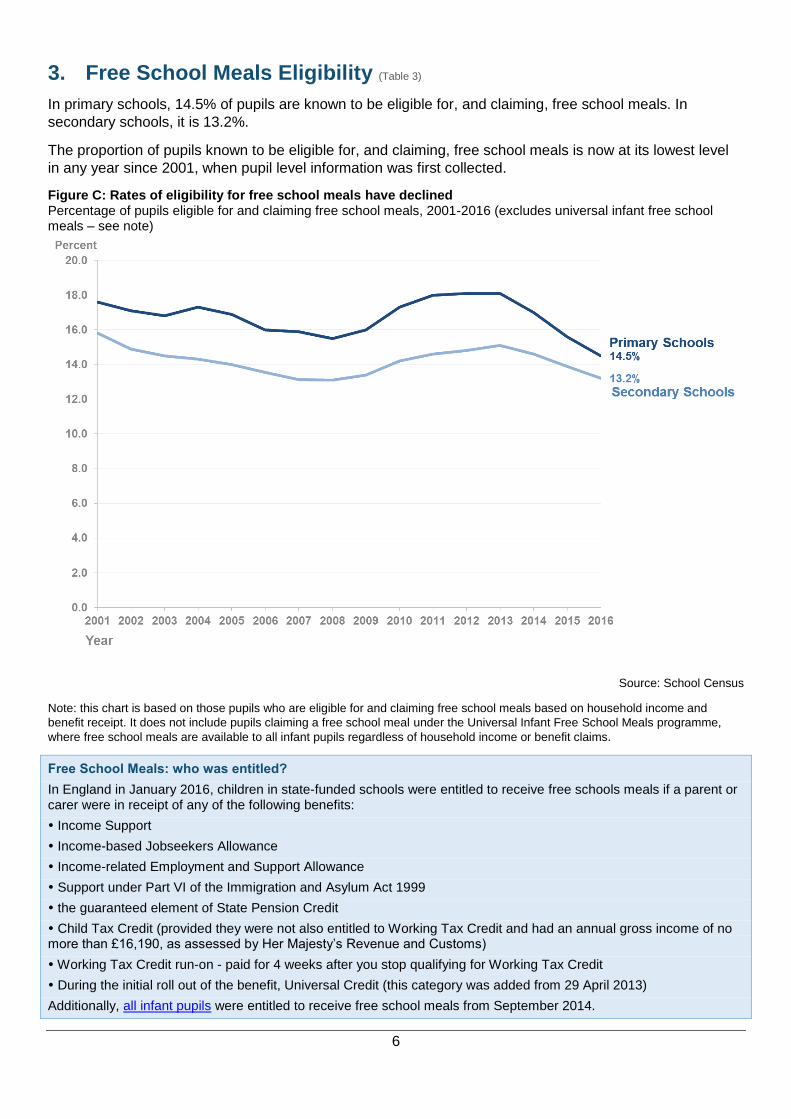
Free School Meals Eligibility (Table 3) 3.
In primary schools, 14.5% of pupils are known to be eligible for, and claiming, free school meals. In
secondary schools, it is 13.2%.
The proportion of pupils known to be eligible for, and claiming, free school meals is now at its lowest level
in any year since 2001, when pupil level information was first collected.
Figure C: Rates of eligibility for free school meals have declined Percentage of pupils eligible for and claiming free school meals, 2001-2016 (excludes universal infant free school meals – see note)
Source: School Census
Note: this chart is based on those pupils who are eligible for and claiming free school meals based on household income and
benefit receipt. It does not include pupils claiming a free school meal under the Universal Infant Free School Meals programme,
where free school meals are available to all infant pupils regardless of household income or benefit claims.
Free School Meals: who was entitled?
In England in January 2016, children in state-funded schools were entitled to receive free schools meals if a parent or carer were in receipt of any of the following benefits:
Income Support
Income-based Jobseekers Allowance
Income-related Employment and Support Allowance
Support under Part VI of the Immigration and Asylum Act 1999
the guaranteed element of State Pension Credit
Child Tax Credit (provided they were not also entitled to Working Tax Credit and had an annual gross income of no more than £16,190, as assessed by Her Majesty’s Revenue and Customs)
Working Tax Credit run-on - paid for 4 weeks after you stop qualifying for Working Tax Credit
During the initial roll out of the benefit, Universal Credit (this category was added from 29 April 2013)
Additionally, all infant pupils were entitled to receive free school meals from September 2014.
7
Fewer pupils are eligible for, and claiming, free school meals (FSM) than in January 2015, in both primary
and secondary schools. The decline is occurring in a large number of areas across the country (table 8a/b)
and is related to there being fewer parents than previously claiming the benefits which would make their
children eligible for free school meals.
Primary academies have a higher than average rate of eligibility, with 16.3% of pupils eligible for FSM,
compared with 14.5% across all schools. Conversely, secondary academies have a lower than average
rate, with 12.5% of pupils eligible compared with 13.2% across all schools.
The reverse is the case in free schools – primary free schools have an FSM eligibility rate below the
national average, with secondary schools above the average. In primary free schools, 13.5% of pupils are
eligible for FSM and in secondary free schools 14.6% of pupils are eligible.
8
Ethnic Group (Table 4) 4.
Minority Ethnic Origin
Those pupils of compulsory school age and above who have been classified according to their ethnic group and are of any origin other than White British are defined as being of minority ethnic origin.
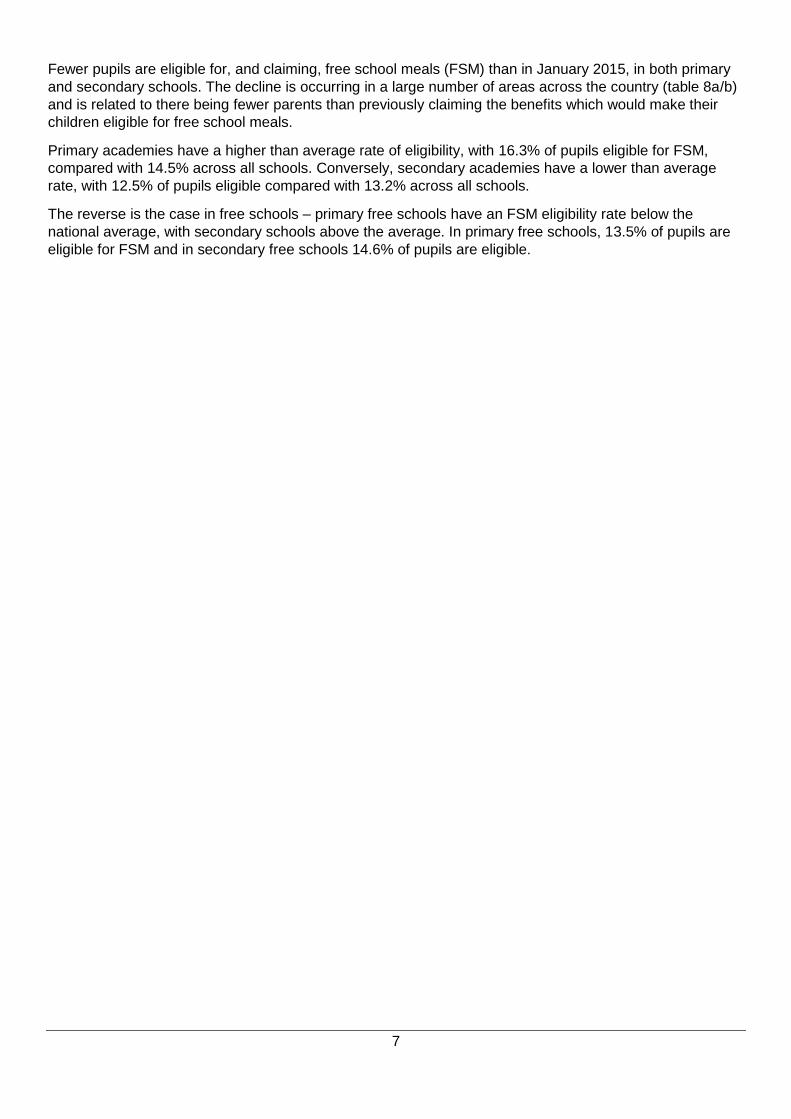
The proportion of pupils from minority ethnic origins has been rising steadily since 2006.
In primary schools, 31.4% of pupils are of minority ethnic origins, an increase from 30.4% in January 2015.
Minority ethnic pupils made up 71% of the increase in pupil numbers in primary schools between 2015 and
2016.
In secondary schools, 27.9% of pupils are of minority ethnic origins, an increase from 26.6% in 2015.
Figure D: The percentage of pupils from minority ethnic origins has increased
2006-2016, primary and secondary schools in England
Source: School Census
9
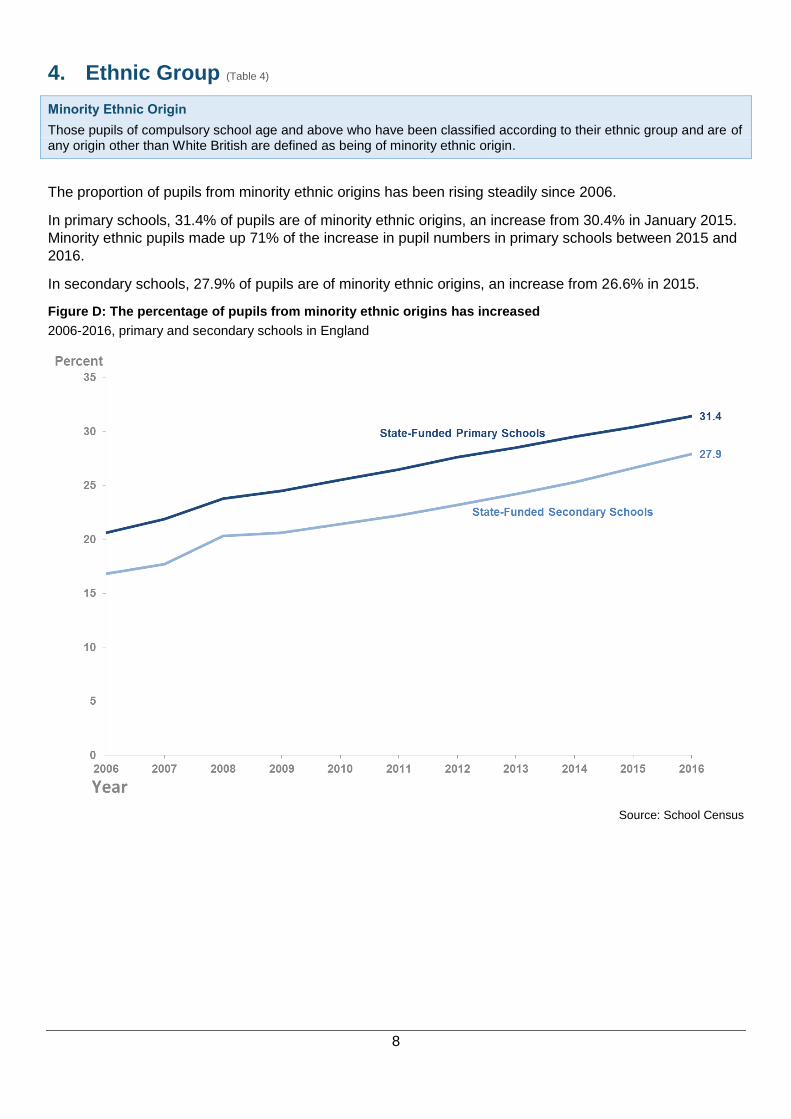
Figure E: Percentage of pupils by ethnic origin
State funded schools in England, 2016
Source: School Census
White non-British pupils now make up 7.1% of the population in primary schools. This is the third year that
this ethnic group is the second largest ethnic minority, after pupils from Asian origins, who continue to be
the largest minority. Pupils from Asian and Black origins are the two largest minorities in secondary
schools. In pupil referral units, there are a greater proportion of black pupils and pupils from mixed ethnic
origins than in mainstream schools, and a smaller proportion of Asian pupils.
State-funded primary schools State-funded special schools
White British 67.9 White British 71.6
White Non-British 7.1 White Non-British 4.0
Asian 10.6 Asian 9.5
Black 5.7 Black 6.7
Mixed 5.7 Mixed 5.2
Chinese 0.4 Chinese 0.3
Any other 1.8 Any other 1.5
Unclassified 0.7 Unclassified 1.3
State-funded secondary schools Pupil Referral Units
White British 70.9 White British 70.9
White Non-British 5.4 White Non-British 6.3
Asian 10.3 Asian 4.2
Black 5.5 Black 7.1
Mixed 4.7 Mixed 7.7
Chinese 0.4 Chinese 0.1
Any other 1.6 Any other 1.5
Unclassified 1.2 Unclassified 2.1
10
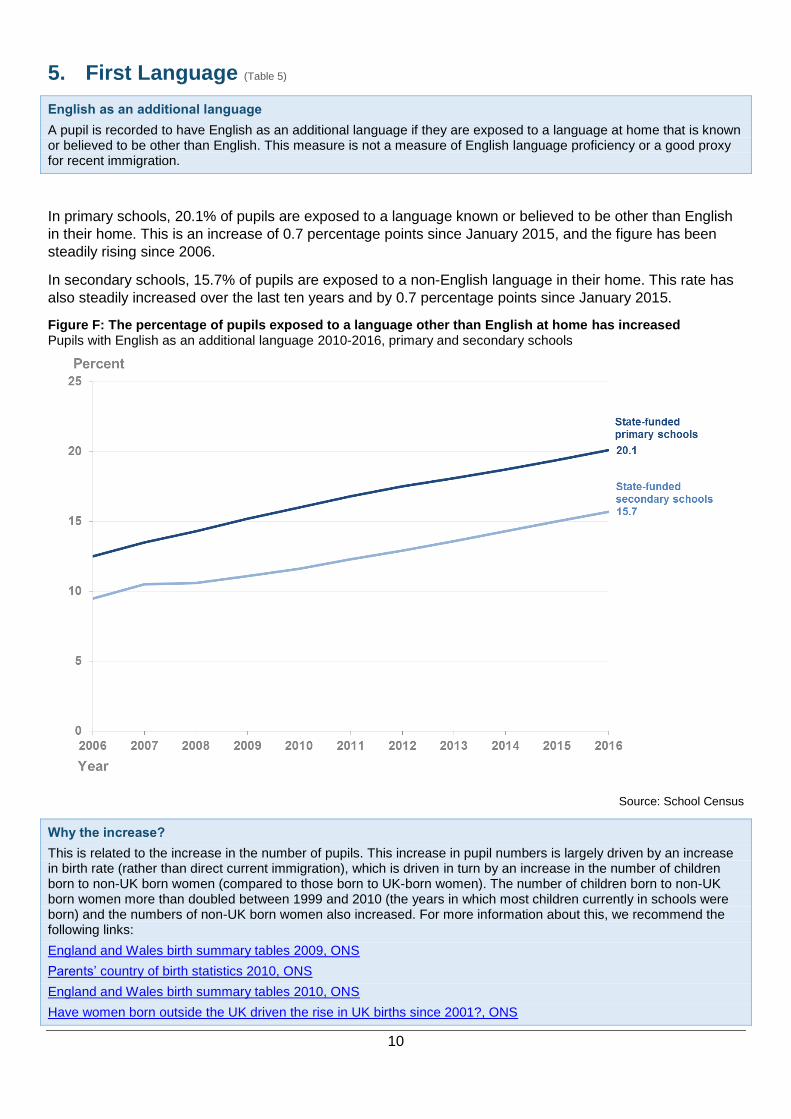
First Language (Table 5) 5.
English as an additional language
A pupil is recorded to have English as an additional language if they are exposed to a language at home that is known or believed to be other than English. This measure is not a measure of English language proficiency or a good proxy for recent immigration.
In primary schools, 20.1% of pupils are exposed to a language known or believed to be other than English
in their home. This is an increase of 0.7 percentage points since January 2015, and the figure has been
steadily rising since 2006.
In secondary schools, 15.7% of pupils are exposed to a non-English language in their home. This rate has
also steadily increased over the last ten years and by 0.7 percentage points since January 2015.
Figure F: The percentage of pupils exposed to a language other than English at home has increased Pupils with English as an additional language 2010-2016, primary and secondary schools
Source: School Census
Why the increase?
This is related to the increase in the number of pupils. This increase in pupil numbers is largely driven by an increase in birth rate (rather than direct current immigration), which is driven in turn by an increase in the number of children born to non-UK born women (compared to those born to UK-born women). The number of children born to non-UK born women more than doubled between 1999 and 2010 (the years in which most children currently in schools were born) and the numbers of non-UK born women also increased. For more information about this, we recommend the following links:
England and Wales birth summary tables 2009, ONS
Parents’ country of birth statistics 2010, ONS
England and Wales birth summary tables 2010, ONS
Have women born outside the UK driven the rise in UK births since 2001?, ONS
11
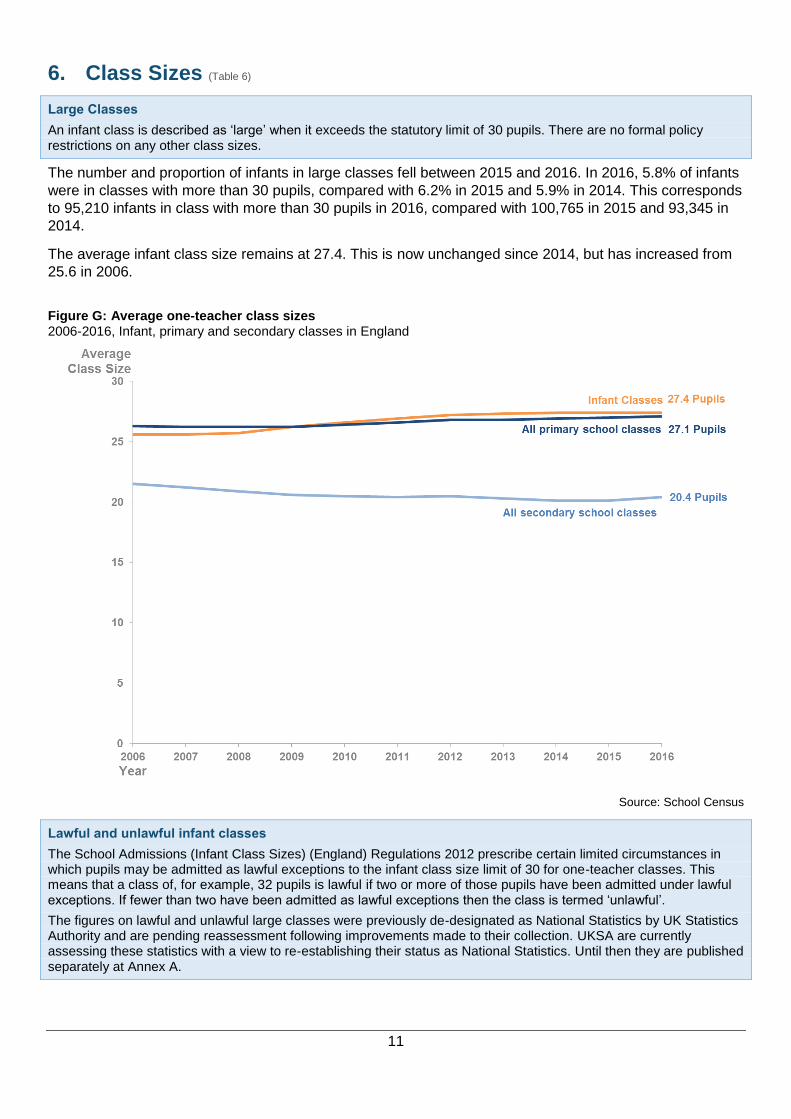
Class Sizes (Table 6) 6.
Large Classes
An infant class is described as ‘large’ when it exceeds the statutory limit of 30 pupils. There are no formal policy restrictions on any other class sizes.
The number and proportion of infants in large classes fell between 2015 and 2016. In 2016, 5.8% of infants
were in classes with more than 30 pupils, compared with 6.2% in 2015 and 5.9% in 2014. This corresponds
to 95,210 infants in class with more than 30 pupils in 2016, compared with 100,765 in 2015 and 93,345 in
2014.
The average infant class size remains at 27.4. This is now unchanged since 2014, but has increased from
25.6 in 2006.
Figure G: Average one-teacher class sizes 2006-2016, Infant, primary and secondary classes in England
Source: School Census
Lawful and unlawful infant classes
The School Admissions (Infant Class Sizes) (England) Regulations 2012 prescribe certain limited circumstances in which pupils may be admitted as lawful exceptions to the infant class size limit of 30 for one-teacher classes. This means that a class of, for example, 32 pupils is lawful if two or more of those pupils have been admitted under lawful exceptions. If fewer than two have been admitted as lawful exceptions then the class is termed ‘unlawful’.
The figures on lawful and unlawful large classes were previously de-designated as National Statistics by UK Statistics Authority and are pending reassessment following improvements made to their collection. UKSA are currently assessing these statistics with a view to re-establishing their status as National Statistics. Until then they are published separately at Annex A.
12
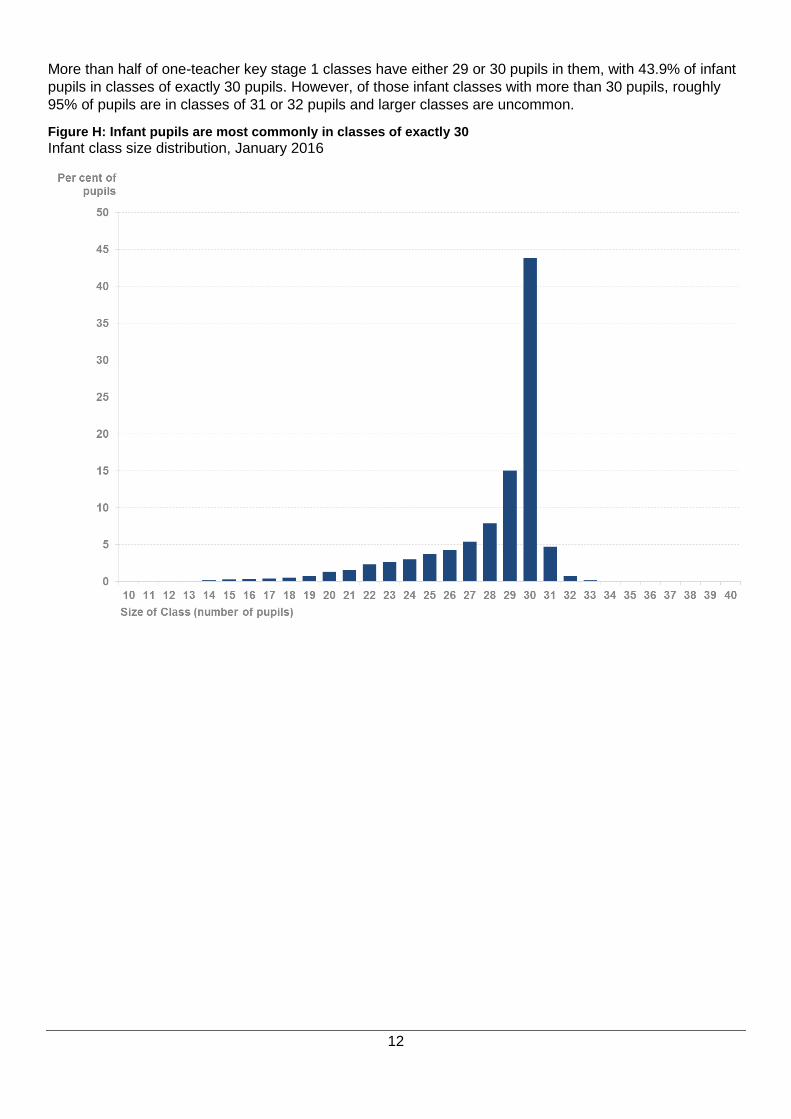
More than half of one-teacher key stage 1 classes have either 29 or 30 pupils in them, with 43.9% of infant
pupils in classes of exactly 30 pupils. However, of those infant classes with more than 30 pupils, roughly
95% of pupils are in classes of 31 or 32 pupils and larger classes are uncommon.
Figure H: Infant pupils are most commonly in classes of exactly 30
Infant class size distribution, January 2016
13
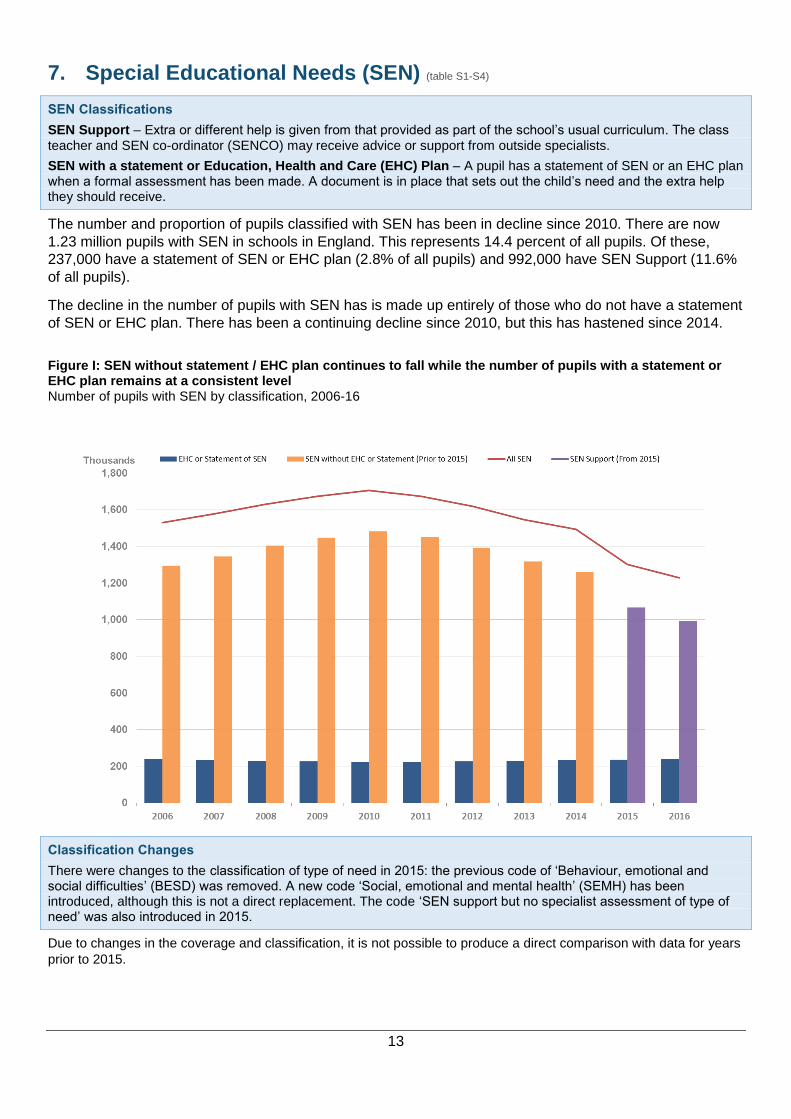
Special Educational Needs (SEN) (table S1-S4) 7.
SEN Classifications
SEN Support – Extra or different help is given from that provided as part of the school’s usual curriculum. The class
teacher and SEN co-ordinator (SENCO) may receive advice or support from outside specialists.
SEN with a statement or Education, Health and Care (EHC) Plan – A pupil has a statement of SEN or an EHC plan when a formal assessment has been made. A document is in place that sets out the child’s need and the extra help they should receive.
The number and proportion of pupils classified with SEN has been in decline since 2010. There are now
1.23 million pupils with SEN in schools in England. This represents 14.4 percent of all pupils. Of these,
237,000 have a statement of SEN or EHC plan (2.8% of all pupils) and 992,000 have SEN Support (11.6%
of all pupils).
The decline in the number of pupils with SEN has is made up entirely of those who do not have a statement
of SEN or EHC plan. There has been a continuing decline since 2010, but this has hastened since 2014.
Figure I: SEN without statement / EHC plan continues to fall while the number of pupils with a statement or EHC plan remains at a consistent level Number of pupils with SEN by classification, 2006-16
Classification Changes
There were changes to the classification of type of need in 2015: the previous code of ‘Behaviour, emotional and social difficulties’ (BESD) was removed. A new code ‘Social, emotional and mental health’ (SEMH) has been introduced, although this is not a direct replacement. The code ‘SEN support but no specialist assessment of type of need’ was also introduced in 2015.
Due to changes in the coverage and classification, it is not possible to produce a direct comparison with data for years
prior to 2015.
14
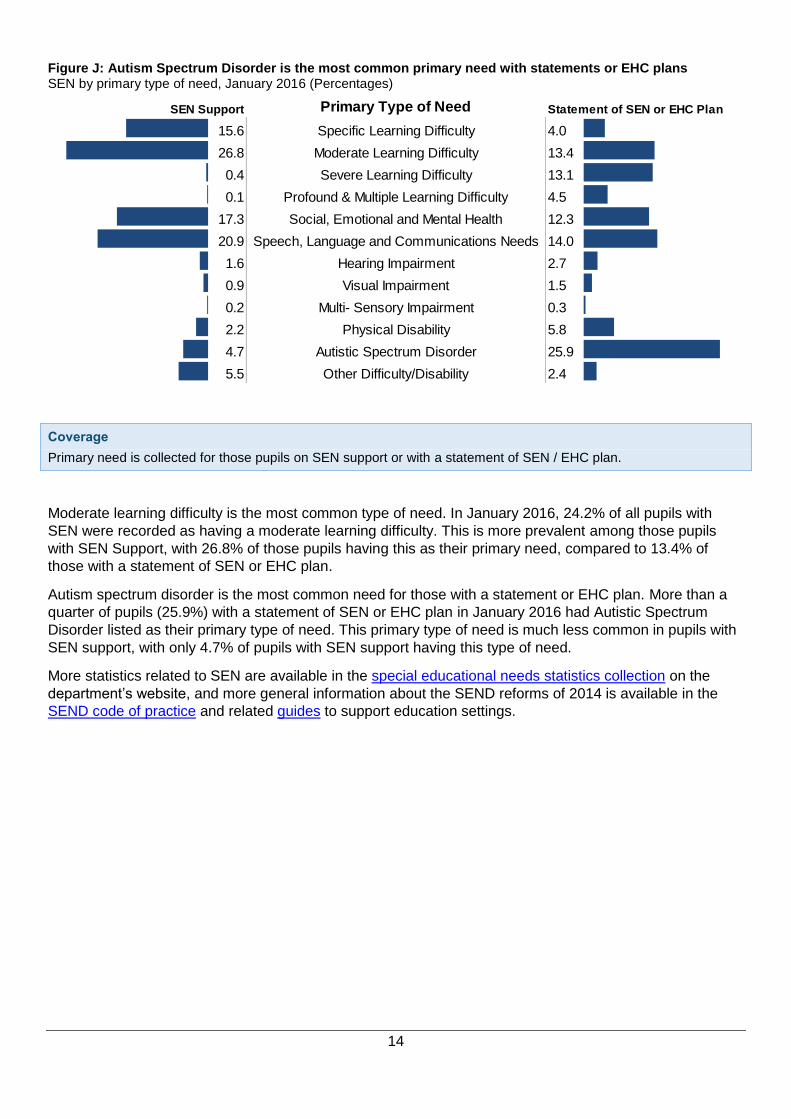
Figure J: Autism Spectrum Disorder is the most common primary need with statements or EHC plans SEN by primary type of need, January 2016 (Percentages)
Coverage
Primary need is collected for those pupils on SEN support or with a statement of SEN / EHC plan.
Moderate learning difficulty is the most common type of need. In January 2016, 24.2% of all pupils with
SEN were recorded as having a moderate learning difficulty. This is more prevalent among those pupils
with SEN Support, with 26.8% of those pupils having this as their primary need, compared to 13.4% of
those with a statement of SEN or EHC plan.
Autism spectrum disorder is the most common need for those with a statement or EHC plan. More than a
quarter of pupils (25.9%) with a statement of SEN or EHC plan in January 2016 had Autistic Spectrum
Disorder listed as their primary type of need. This primary type of need is much less common in pupils with
SEN support, with only 4.7% of pupils with SEN support having this type of need.
More statistics related to SEN are available in the special educational needs statistics collection on the
department’s website, and more general information about the SEND reforms of 2014 is available in the
SEND code of practice and related guides to support education settings.
SEN Support Primary Type of Need Statement of SEN or EHC Plan
15.6 Specific Learning Difficulty 4.0
26.8 Moderate Learning Difficulty 13.4
0.4 Severe Learning Difficulty 13.1
0.1 Profound & Multiple Learning Difficulty 4.5
17.3 Social, Emotional and Mental Health 12.3
20.9 Speech, Language and Communications Needs 14.0
1.6 Hearing Impairment 2.7
0.9 Visual Impairment 1.5
0.2 Multi- Sensory Impairment 0.3
2.2 Physical Disability 5.8
4.7 Autistic Spectrum Disorder 25.9
5.5 Other Difficulty/Disability 2.4
15
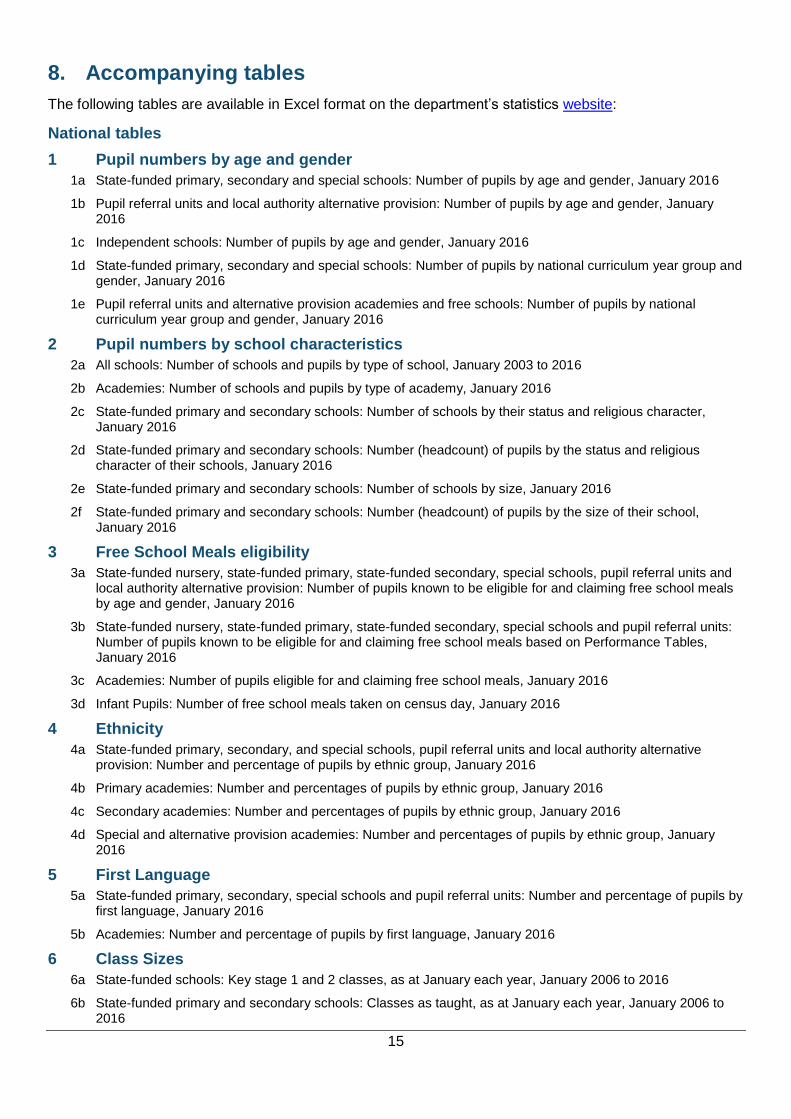
Accompanying tables 8.
The following tables are available in Excel format on the department’s statistics website:
National tables
1 Pupil numbers by age and gender
1a State-funded primary, secondary and special schools: Number of pupils by age and gender, January 2016
1b Pupil referral units and local authority alternative provision: Number of pupils by age and gender, January 2016
1c Independent schools: Number of pupils by age and gender, January 2016
1d State-funded primary, secondary and special schools: Number of pupils by national curriculum year group and gender, January 2016
1e Pupil referral units and alternative provision academies and free schools: Number of pupils by national curriculum year group and gender, January 2016
2 Pupil numbers by school characteristics
2a All schools: Number of schools and pupils by type of school, January 2003 to 2016
2b Academies: Number of schools and pupils by type of academy, January 2016
2c State-funded primary and secondary schools: Number of schools by their status and religious character, January 2016
2d State-funded primary and secondary schools: Number (headcount) of pupils by the status and religious character of their schools, January 2016
2e State-funded primary and secondary schools: Number of schools by size, January 2016
2f State-funded primary and secondary schools: Number (headcount) of pupils by the size of their school, January 2016
3 Free School Meals eligibility
3a State-funded nursery, state-funded primary, state-funded secondary, special schools, pupil referral units and local authority alternative provision: Number of pupils known to be eligible for and claiming free school meals by age and gender, January 2016
3b State-funded nursery, state-funded primary, state-funded secondary, special schools and pupil referral units: Number of pupils known to be eligible for and claiming free school meals based on Performance Tables, January 2016
3c Academies: Number of pupils eligible for and claiming free school meals, January 2016
3d Infant Pupils: Number of free school meals taken on census day, January 2016
4 Ethnicity
4a State-funded primary, secondary, and special schools, pupil referral units and local authority alternative provision: Number and percentage of pupils by ethnic group, January 2016
4b Primary academies: Number and percentages of pupils by ethnic group, January 2016
4c Secondary academies: Number and percentages of pupils by ethnic group, January 2016
4d Special and alternative provision academies: Number and percentages of pupils by ethnic group, January 2016
5 First Language
5a State-funded primary, secondary, special schools and pupil referral units: Number and percentage of pupils by first language, January 2016
5b Academies: Number and percentage of pupils by first language, January 2016
6 Class Sizes
6a State-funded schools: Key stage 1 and 2 classes, as at January each year, January 2006 to 2016
6b State-funded primary and secondary schools: Classes as taught, as at January each year, January 2006 to 2016
16
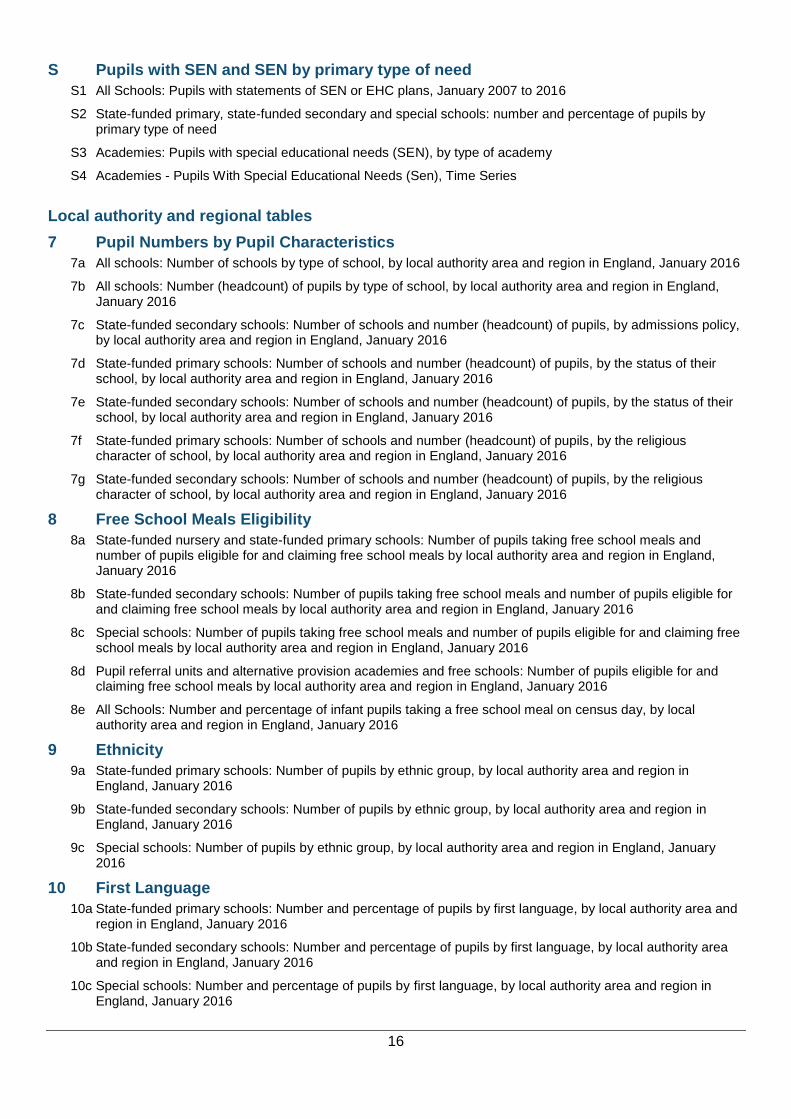
S Pupils with SEN and SEN by primary type of need
S1 All Schools: Pupils with statements of SEN or EHC plans, January 2007 to 2016
S2 State-funded primary, state-funded secondary and special schools: number and percentage of pupils by primary type of need
S3 Academies: Pupils with special educational needs (SEN), by type of academy
S4 Academies - Pupils With Special Educational Needs (Sen), Time Series
Local authority and regional tables
7 Pupil Numbers by Pupil Characteristics
7a All schools: Number of schools by type of school, by local authority area and region in England, January 2016
7b All schools: Number (headcount) of pupils by type of school, by local authority area and region in England, January 2016
7c State-funded secondary schools: Number of schools and number (headcount) of pupils, by admissions policy, by local authority area and region in England, January 2016
7d State-funded primary schools: Number of schools and number (headcount) of pupils, by the status of their school, by local authority area and region in England, January 2016
7e State-funded secondary schools: Number of schools and number (headcount) of pupils, by the status of their school, by local authority area and region in England, January 2016
7f State-funded primary schools: Number of schools and number (headcount) of pupils, by the religious character of school, by local authority area and region in England, January 2016
7g State-funded secondary schools: Number of schools and number (headcount) of pupils, by the religious character of school, by local authority area and region in England, January 2016
8 Free School Meals Eligibility
8a State-funded nursery and state-funded primary schools: Number of pupils taking free school meals and number of pupils eligible for and claiming free school meals by local authority area and region in England, January 2016
8b State-funded secondary schools: Number of pupils taking free school meals and number of pupils eligible for and claiming free school meals by local authority area and region in England, January 2016
8c Special schools: Number of pupils taking free school meals and number of pupils eligible for and claiming free school meals by local authority area and region in England, January 2016
8d Pupil referral units and alternative provision academies and free schools: Number of pupils eligible for and claiming free school meals by local authority area and region in England, January 2016
8e All Schools: Number and percentage of infant pupils taking a free school meal on census day, by local authority area and region in England, January 2016
9 Ethnicity
9a State-funded primary schools: Number of pupils by ethnic group, by local authority area and region in England, January 2016
9b State-funded secondary schools: Number of pupils by ethnic group, by local authority area and region in England, January 2016
9c Special schools: Number of pupils by ethnic group, by local authority area and region in England, January 2016
10 First Language
10a State-funded primary schools: Number and percentage of pupils by first language, by local authority area and region in England, January 2016
10b State-funded secondary schools: Number and percentage of pupils by first language, by local authority area and region in England, January 2016
10c Special schools: Number and percentage of pupils by first language, by local authority area and region in England, January 2016
17
10d State-funded primary schools: Classes as taught by key stage of pupils, by local authority area, by region, January 2016
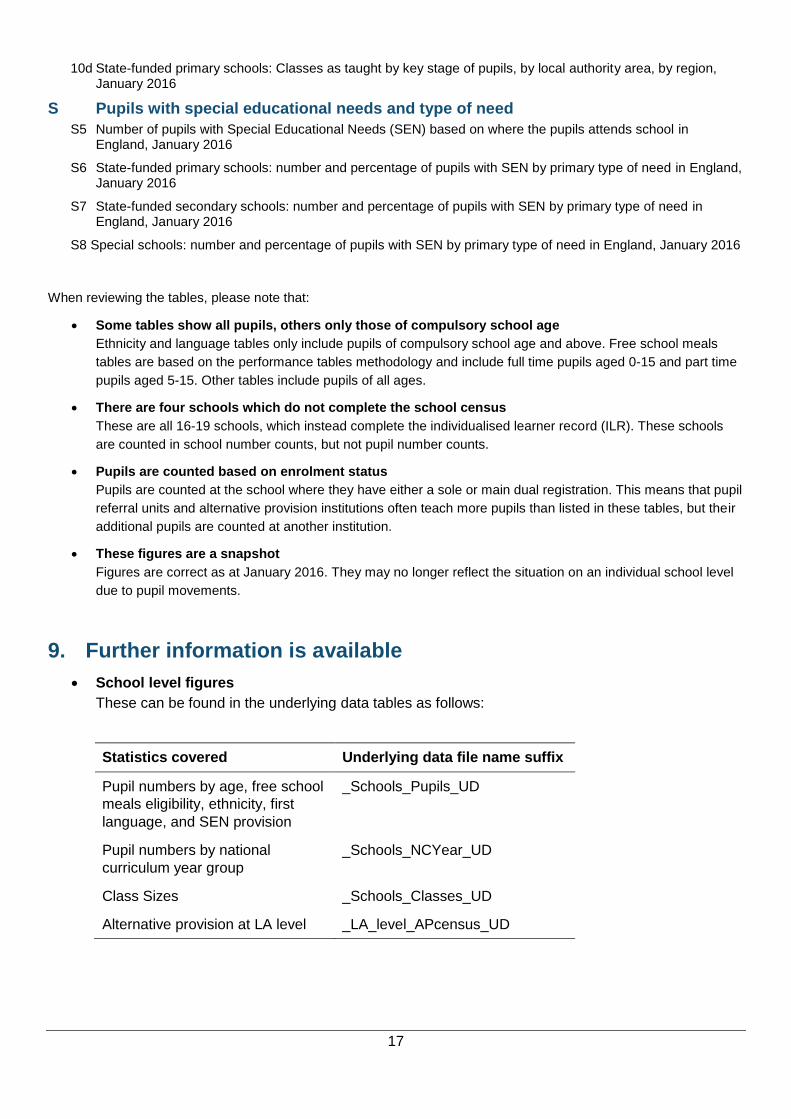
S Pupils with special educational needs and type of need
S5 Number of pupils with Special Educational Needs (SEN) based on where the pupils attends school in England, January 2016
S6 State-funded primary schools: number and percentage of pupils with SEN by primary type of need in England, January 2016
S7 State-funded secondary schools: number and percentage of pupils with SEN by primary type of need in England, January 2016
S8 Special schools: number and percentage of pupils with SEN by primary type of need in England, January 2016
When reviewing the tables, please note that:
Some tables show all pupils, others only those of compulsory school age
Ethnicity and language tables only include pupils of compulsory school age and above. Free school meals
tables are based on the performance tables methodology and include full time pupils aged 0-15 and part time
pupils aged 5-15. Other tables include pupils of all ages.
There are four schools which do not complete the school census
These are all 16-19 schools, which instead complete the individualised learner record (ILR). These schools
are counted in school number counts, but not pupil number counts.
Pupils are counted based on enrolment status
Pupils are counted at the school where they have either a sole or main dual registration. This means that pupil
referral units and alternative provision institutions often teach more pupils than listed in these tables, but their
additional pupils are counted at another institution.
These figures are a snapshot
Figures are correct as at January 2016. They may no longer reflect the situation on an individual school level
due to pupil movements.
Further information is available 9.
School level figures
These can be found in the underlying data tables as follows:
Statistics covered Underlying data file name suffix
Pupil numbers by age, free school
meals eligibility, ethnicity, first
language, and SEN provision
_Schools_Pupils_UD
Pupil numbers by national
curriculum year group
_Schools_NCYear_UD
Class Sizes _Schools_Classes_UD
Alternative provision at LA level _LA_level_APcensus_UD
18
Cross border movement tables
These figures show the number of pupils residing in one local authority, but attending school in
another. Figures are available both at national level and a local authority matrix level.
Figures from previous years
You can find analogous figures from previous years within the statistical collection ‘Statistics: school
and pupil numbers’.
More SEN data
More statistics related to SEN are available in the special educational needs statistics collection on
the department’s website.
’Special Educational Needs: England 2016’ will be published 21st July 2016. In addition to the SEN
tables included in this publication, the July publication will include other SEN statistics that have not
been included in this publication, such as:
o Additional SEN characteristics: age, gender, ethnicity, English as an additional language and
free school meal eligibility
o School characteristics: Type of special school provision, Number of special schools by size,
number of schools with SEN units and resourced provisions.
o Further Local authority breakdown: Time series, type of need, number of children placed in
SEN units or resourced provision
o Additional Primary type of need analysis: age, gender, ethnicity, year group, breakdown,
first language and secondary type of need.
The publication will include a main text document, National Tables, Local authority tables, additional
tables and the underlying data file. This will be accessible at the SEN collection page link shown
above.
Figures for other UK countries
The School Census only collects information from schools in England. For information for Wales,
Scotland and Northern Ireland, contact the departments below or access their statistics at the
following links:
Wales: email [email protected] or visit StatsWales
This includes comparable information about pupil numbers, classes, free school meals eligibility, and ethnicity, language and special educational needs.
Scotland: email [email protected] or visit Scottish Government - School Education Statistics
This includes comparable information on pupil numbers, class sizes, ethnicity and English as an additional language and free school meal eligibility
Northern Ireland: email [email protected] or visit Department of Education - Education Statistics
This includes comparable information about pupil numbers, free school meals eligibility, and ethnicity.
Note that any data from these locations may refer to different time periods, and each administration
may have its own way of defining key statistics. However, ‘Education and training statistics for the
19
United Kingdom’ brings together information from each administration, which is directly comparable.
Chapter 1 covers schools and includes breakdowns of pupil numbers.
Data from the January 2017 School Census
This is an annual publication, usually released in June each year. Information from the January
2017 school census is likely to be available in June 2017. When a release date is known, it will be
given in the department’s Forthcoming Publications list.
National Statistics 10.
The United Kingdom Statistics Authority has designated these statistics as National Statistics, in
accordance with the Statistics and Registration Service Act 2007 and signifying compliance with the Code
of Practice for Official Statistics.
Designation can be broadly interpreted to mean that the statistics:
meet identified user needs;
are well explained and readily accessible;
are produced according to sound methods, and
are managed impartially and objectively in the public interest.
Once statistics have been designated as National Statistics it is a statutory requirement that the Code of
Practice shall continue to be observed.
The Department has a set of statistical policies in line with the Code of Practice for Official Statistics.
Technical information 11.
A quality and methodology information document accompanies this SFR. This provides further information
on the data sources, their coverage and quality and explains the methodology used in producing the data,
including how it is validated and processed.
Using this data 12.
We know that there are a wide range of users of the data from this publication, including Local Authorities,
academic researchers, journalists, museums, businesses, schools and other Government departments.
Please see the methodology document for a list of uses and limitations of the statistics in this publication.
Get in touch 13.
Media enquiries
Press Office News Desk, Department for Education, Sanctuary Buildings, Great Smith Street, London
SW1P 3BT.
Tel: 020 7783 8300
Other enquiries/feedback
Rob Drake, IFD Analysis, Department for Education, Sanctuary Buildings, Great Smith Street, London,
SW1P 3BT.
Tel: 0370 000 2288
Email: [email protected] – please note that from 1 October 2016, this email
address will no longer contain ‘.gsi’. From this date please email: [email protected]
instead.
© Crown copyright 2016
This publication (not including logos) is licensed under the terms of the
Open Government Licence v3.0 except where otherwise stated. Where
we have identified any third party copyright information you will need to
obtain permission from the copyright holders concerned.
To view this licence:
visit www.nationalarchives.gov.uk/doc/open-government-licence/version/3
email [email protected]
write to Information Policy Team, The National Archives, Kew, London, TW9 4DU
About this publication:
enquiries Rob Drake, IFD Analysis, Department for Education, Great Smith Street, London,
SW1P 3BT. Tel: 0370 000 2288 Email: [email protected]
download hyperlink to web address
Reference: [SFR 20/2016]
Follow us on Twitter: @educationgovuk
Like us on Facebook: facebook.com/educationgovuk